Article

Integrating Thermal Indices and Phenotypic Traits for Assessing Tree Health: A Comprehensive Framework for Conservation and Monitoring of Urban, Agricultural, and Forest Ecosystems

by
Yiannis G. Zevgolis
*,
Triantaphyllos Akriotis
,
Panayiotis G. Dimitrakopoulos
and
Andreas Y. Troumbis
Biodiversity Conservation Laboratory, Department of Environment, University of the Aegean, 81132 Mytilene, Greece
*
Author to whom correspondence should be addressed.
Appl. Sci. 2023, 13(17), 9493; https://doi.org/10.3390/app13179493
Submission received: 21 July 2023 / Revised: 4 August 2023 / Accepted: 20 August 2023 / Published: 22 August 2023
(This article belongs to the Special Issue Recent Progress in Infrared Thermography)

Abstract

:

Featured Application

The universal applicability of thermal and phenotypic indices enables the assessment of tree health across diverse ecosystems.

Abstract

Successful conservation through monitoring of ecosystems and species, which entails the quantification of disturbances at the ecosystem, species, and population levels, presents significant challenges. Given the pivotal role of this information in formulating effective strategies for tree conservation, we establish an integrated methodological framework that characterizes the overall health state of trees in urban, agricultural, and forest ecosystems, at species and individual levels, by connecting various non-invasive techniques and field metrics. To accomplish this, we collected thermal and phenotypic information from 543 trees representing five prevalent tree species, distributed across urban, agricultural, and forest settings, within a typical Mediterranean environment, and we developed trunk thermal indicators to describe species’ responses to various disturbances. We (a) examined thermal pattern variations within and among the tree species, (b) explored the relationships between phenotypic traits and trunk thermal indices, (c) quantified the influence of these indices on leaf area index, and (d) classified trees that exhibit defects and fungal pathogens based on these indices. Results showed clear differentiation of thermal and LAI patterns both among tree species and based on the presence or absence of defects. The trunk thermal indices played a significant role in characterizing tree health and predicting LAI, exhibiting strong relationships with phenotypic traits, thereby demonstrating their potential as universal indicators of tree health. Additionally, the inclusion of cavities and fungal presence in the assessment of tree health provided valuable insights into the impact of structural abnormalities on the overall tree condition. Combining trees’ phenotypic traits, vitality indices, and trunk thermal indices allowed the successful classification of defects, cavities, and fungal infestation in 91.4%, 88%, and 88% of trees, respectively. By considering the inter-relationships among thermal indices and phenotypic traits, we can confidently identify and quantify tree health, contributing to the conservation of tree species in diverse ecosystems.

1. Introduction

In the present era, a plethora of disturbances [1] comprising both natural and anthropogenic factors [2], such as fires, floods, introductions of pests, biological invasions, habitat fragmentation, and more, significantly impact ecosystems and species [3] across a wide spectrum of spatial and temporal scales [4,5,6]. These disturbances serve as a differentiating factor, separating an ecosystem and the species that inhabit it from their desired state, a state aptly described by the concept of “ecosystem health” [7,8]. This concept encapsulates a multitude of fundamental attributes as it encompasses (a) the notions of vitality, resilience, and resistance [7], (b) the absence of disease across varying scales [8], and (c) the system’s capability to provide ecosystem services [9]. These defining characteristics of ecosystem health determine the system’s ability to remain unchanged in the face of external pressures, recover from disturbances, and effectively cope with stressful events [10,11,12].
In urban, agricultural, and forest ecosystems, anthropogenic pressures tend to contribute to their degradation, which is further exacerbated by disturbances arising from both biotic and abiotic factors, thereby negatively impacting both the ecosystems and the species within them [13]. Among the affected entities, tree species play a crucial role as essential and integral components of these ecosystems [14,15]; however, they face a multitude of pressures that threaten their health and long-term survival.
In urban ecosystems, a multitude of anthropogenic pressures exert significant influence on woody vegetation, particularly urban trees. These pressures encompass various sources of environmental stressors, including gaseous pollutants and particulate matter [16], increased road traffic density [17], and the presence of pollutants commonly associated with urban areas [18]. Additionally, various limitations, such as unfavorable tree site conditions [19,20], soil nutrient deficiencies [21], restricted canopy and root space [22], and water stress [23], directly or indirectly impact woody vegetation, impeding its growth and inducing phenotypic alterations, such as the development of cracks and cavities. Concurrently, the escalating frequency and heightened severity of extreme weather events [24] have significantly compounded the growth and survival of trees in urban environments, as they become more susceptible to fungal infections and other plant pathogens [13], ultimately compromising their vitality and lifespan [25].
Within agricultural ecosystems, a combination of factors contributes to their degradation, posing challenges to the health and longevity of trees within these systems. The intensification of agriculture [26], coupled with the homogenization of crop cultivation [27], the increase in monocultures [28], the abandonment of agricultural land, and the escalating use of pesticides and herbicides [26], collaboratively exacerbates the situation. These anthropogenic factors interact with abiotic stressors including hydrogeological instability, water stress, loss of soil organic matter, and erosion [29], further impacting tree health. Concurrently, biotic factors, including fungi, bacteria, and viruses, add complexity to the pressures exerted on agricultural ecosystems [30]. Negative impacts also arise from land abandonment, as gradual re-naturalization processes become contributing factors that directly affect the tree dynamics within these ecosystems, leading to an increased occurrence of air-borne fungi. The cumulative impact of these factors collectively undermines ecosystem dynamics, reduces their productivity, and affects the overall health of trees and, consequently, the longevity of these systems [31].
Forest ecosystems, including their tree components, encounter a distinct array of challenges. Similar to their counterparts in urban and agricultural settings, they exhibit heightened vulnerability to various recurring biotic stressors, such as fungi, bacteria, insects, and parasitic plants, as well as abiotic stressors, including pesticides/herbicides, soil degradation, and water availability [32]. Moreover, the intricate interplay between these abiotic and biotic stress factors [33], coupled with the escalating frequency and severity of adverse weather phenomena [34], possesses the potential to engender significant shifts in terms of the availability of natural resources [35], the diversification of forest areas [36], and reductions in both productivity and regeneration [37,38].
The amalgamation of these factors within these ecosystems has the potential to augment the susceptibility of trees [39] by engendering mechanical frailty, particularly through the manifestation of structural abnormalities such as cavities, decayed wood, cracks, cankers, burls, and decomposed tissue [40]. Furthermore, such vulnerabilities may facilitate the gradual colonization of internal functional or non-functional tissues by fungal communities, commonly referred to as compartmentalized infection [41,42], resulting in de-growth and productivity reduction as trees strive to achieve an optimal equilibrium between their vegetative and reproductive activities [42,43]. After all, the presence of any form of injury is the key determinant of trees’ vulnerability to wood-decaying fungi [44]. Typically, trees rely on their bark as the primary defense mechanism, providing a physical and chemical barrier against both abiotic and biotic stresses [45]. In response to an injury, the cambium responds by creating regenerative tissue, which occurs in the outer wound area [41], and its formation depends on the size of the wound and the vitality of the specific tree. However, if the wound remains open for an extended period, particularly under favorable temperature and humidity conditions, sequential colonization of both bacteria and wood-decaying fungi takes place within the exposed wood [46].
In this light, the successful monitoring and evaluation of ecosystem and species health, entailing the timely identification of fungal pathogen presence through early warning signals and rapid diagnostic procedures, alongside the quantification of disturbances at the ecosystem, species, and population levels, present significant challenges. Given the pivotal role of this information in formulating effective strategies for the protection and conservation of trees, various plant phenotypic methods [47], directly or indirectly related to the eco-physiology of tree species, have been developed and implemented. In fact, significant progress has been made in the development of efficient monitoring techniques, encompassing both destructive and non-destructive approaches that utilize diverse tools, categorized based on their measurement speed, resolution, and accuracy, for the purposes of (a) screening, (b) evaluation, and (c) diagnostic assessments [48,49].
When considering non-invasive techniques while simultaneously accounting for factors such as sensitivity, accuracy, cost, time requirements, and operational simplicity [50], infrared thermography (IRT) emerges as a prominent technique among the plethora of available options such as static bending and transverse vibration techniques [51], ground-penetrating radar methods [52], sonic/ultrasonic tomography [53], and electrical resistivity tomography [54]. In the field of ecology, IRT has found widespread application [55,56,57], demonstrating its effectiveness in diverse fields such as detecting pests in forested areas [58,59], monitoring crop vegetation [60,61], identifying water stress [62,63,64], and diagnosing fungal infestations [65,66]. Regarding tree health, while the application of IRT is relatively recent, its use is rapidly expanding [67,68,69,70,71,72,73].
By integrating non-invasive monitoring techniques, such as IRT, with established forestry practices and metrics for assessing plant structural and functional traits, it appears that disturbances at multiple levels can be rapidly detected [73]. However, despite the individual utilization of IRT in assessing tree health in different systems, there has been a lack of a unified framework that incorporates these distinct systems. Therefore, our study aims to bridge this gap and provide a comprehensive approach that integrates IRT with species-specific biophysical traits to effectively evaluate tree health and identify potential disturbances across various environments. By incorporating fundamental biophysical traits of trees, such as height, diameter, crown area, and leaf area, into this non-invasive technique, we anticipate that our approach will yield valuable insights. This integration will enable us to derive a set of indices that accurately depict the overall condition of trees. Through the application of such a unified framework, we aim to enhance our understanding of tree health and contribute to the development of effective management and conservation strategies for trees in different ecological settings. To accomplish this, we collected thermal and phenotypic information, with particular emphasis on productivity, from five prevalent tree species distributed across urban, agricultural, and forest settings, within a typical Mediterranean environment. Our objectives were to (a) examine thermal pattern variations within and among the five tree species as well as among trees classified into different categories based on the presence or absence of defects, (b) investigate the relationships between the phenotypic traits of trees and their trunk thermal indices, (c) quantify the influence of the trunk thermal indices and phenotypic traits on leaf area index (LAI) (as an indicator of tree productivity), and (d) elucidate the presence of tree defects and fungal pathogens through these indices.

2. Materials and Methods
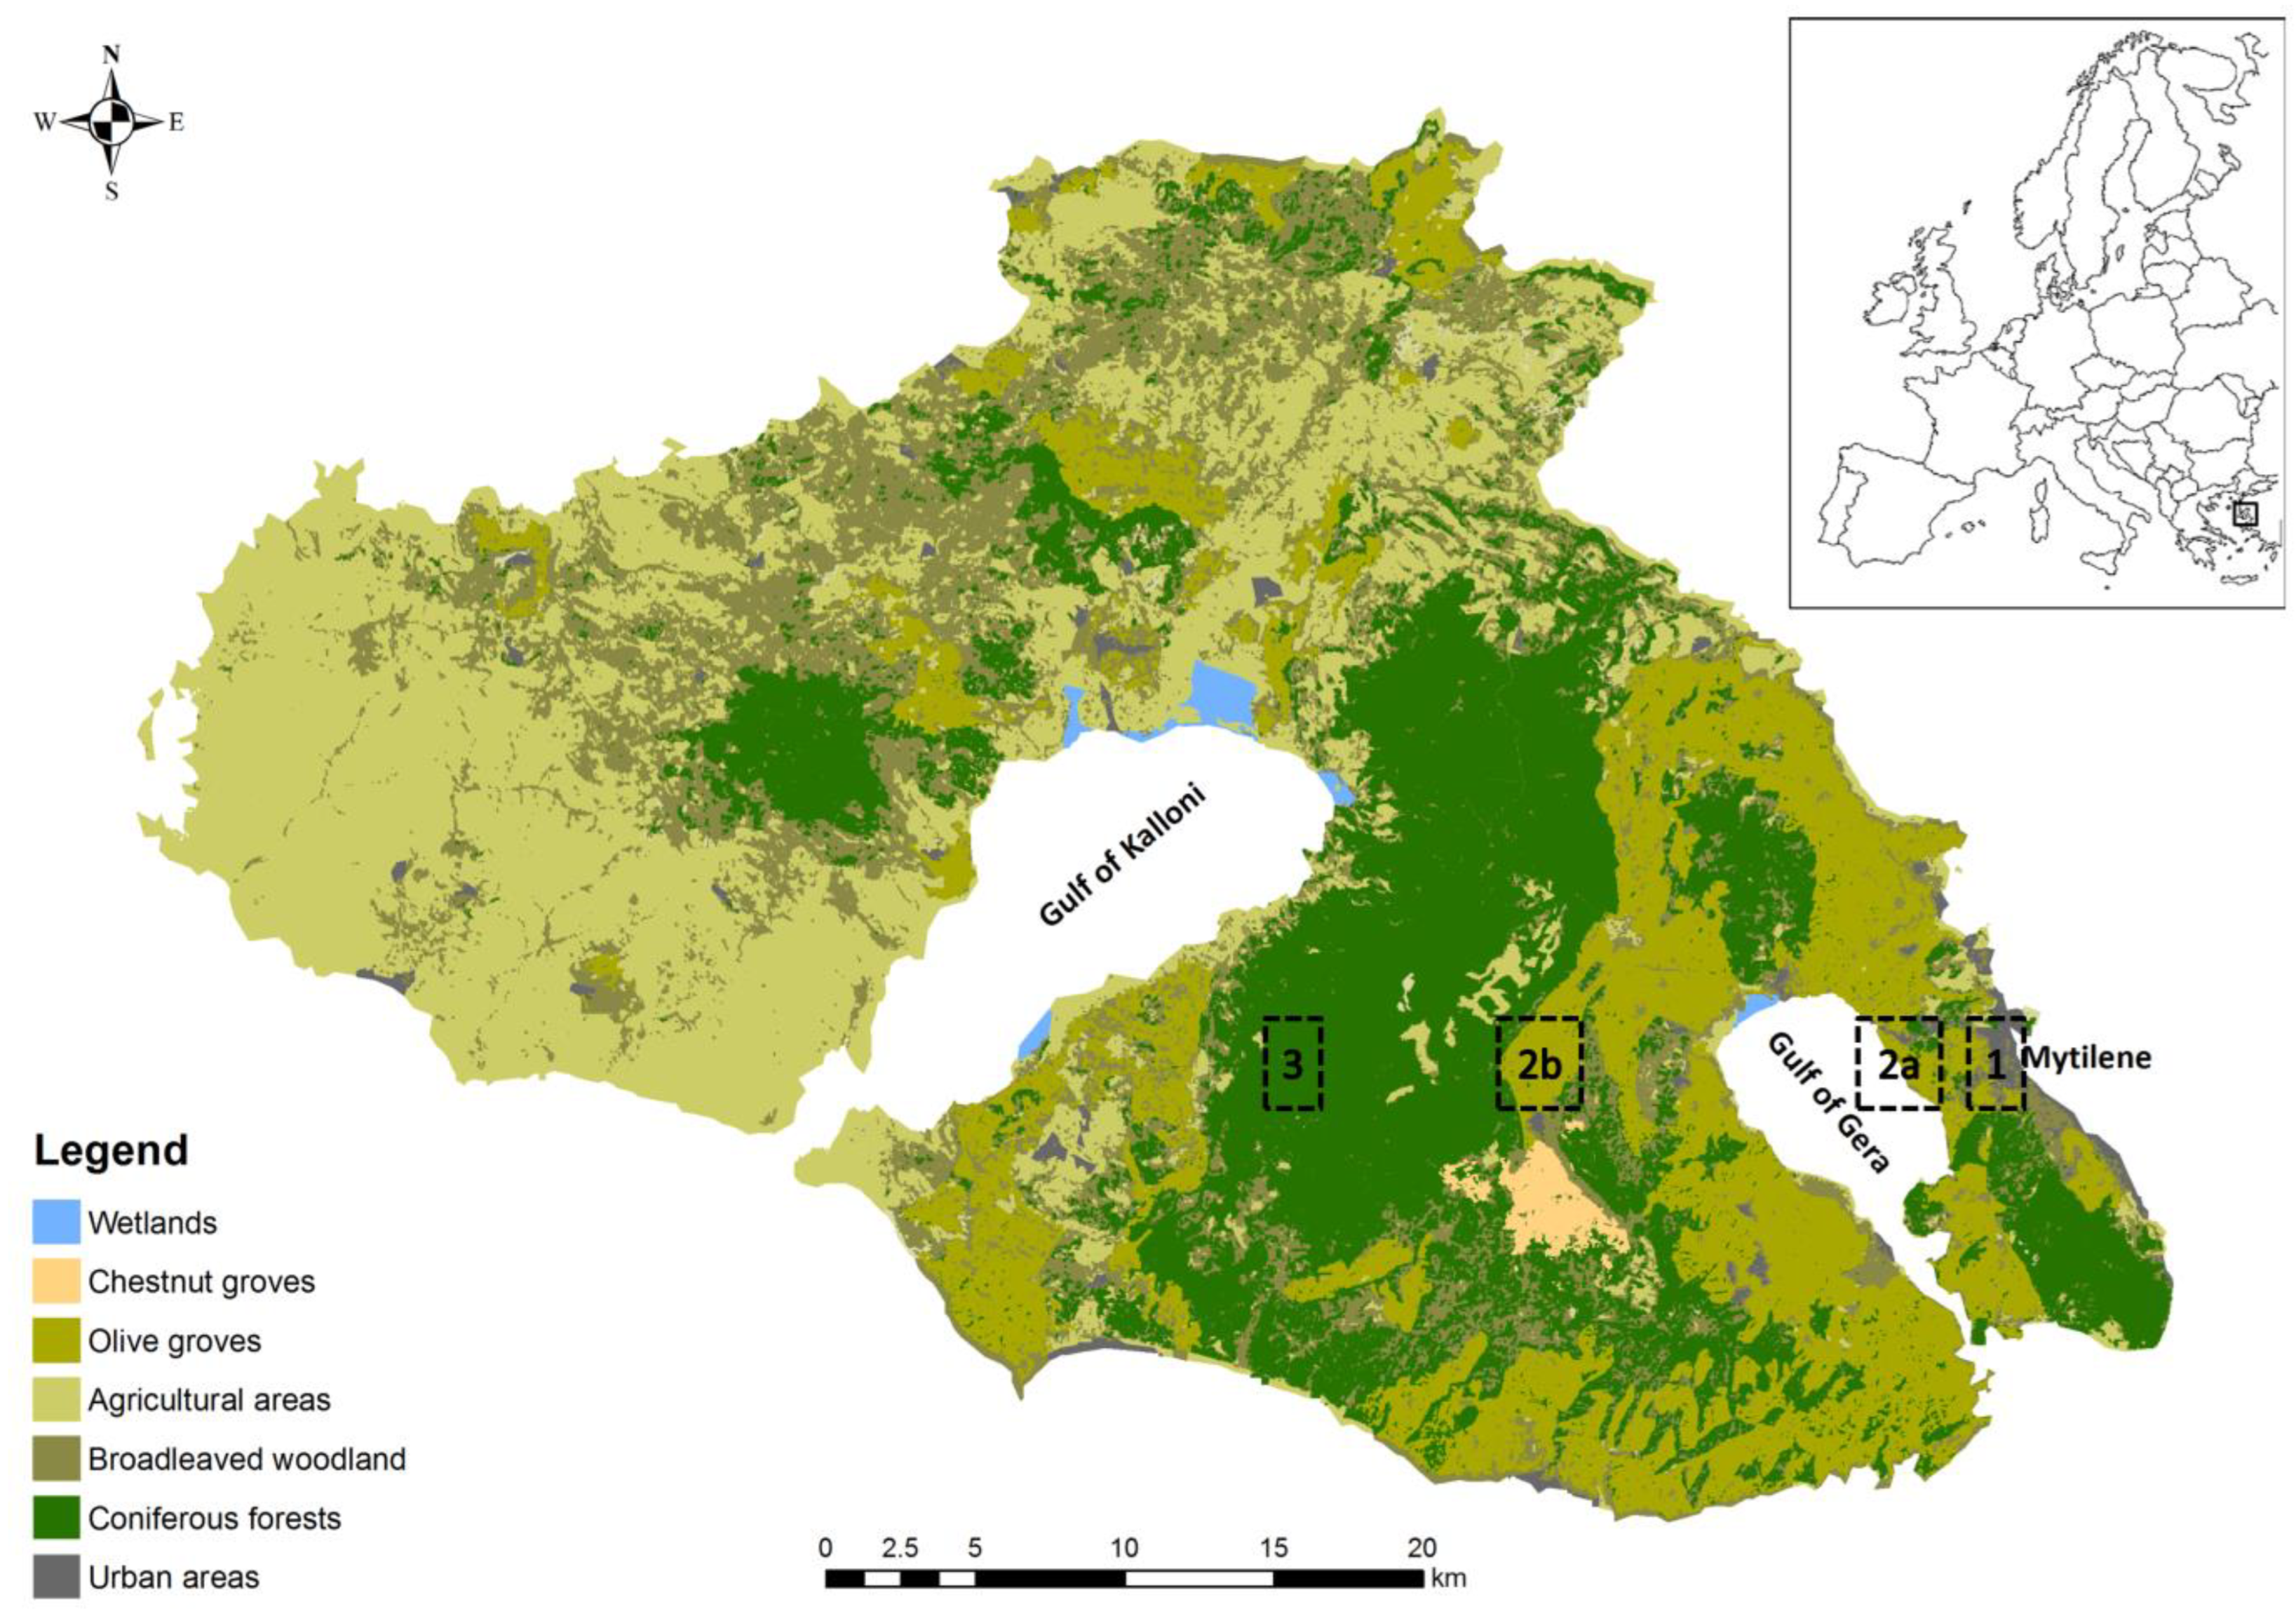
2.1. Study Area

Lesvos, the third-largest island in Greece and the eighth-largest in the Mediterranean basin, spans an area of 1632.8 km2 and is situated in the north-eastern Aegean Sea. This semi-mountainous island features diverse landscapes, including traditional olive groves (Olea europaea) in the eastern and southern parts [71,74], dense and continuous pine forests (Pinus brutia) in the central region [75], and shrubby vegetation along with scattered broadleaved forests in the northern and western areas. The olive trees encompass approximately a quarter of Lesvos’ total area, covering 400 km2, highlighting the importance of this cultivation in the region, while the traditional olive groves cover an area of 130 km2 [71]. Similarly, the pine trees extend over an estimated 300 km2, accounting for approximately 20% of the island’s total area. The capital city of Lesvos, Mytilene, located in the north-eastern part of the island, is home to four main urban parks covering a total area of approximately 27,000 m2. These parks host various tree species, with the black locust (Robinia pseudoacacia), white mulberry (Morus alba), and chinaberry tree (Melia azedarach) being the predominant ones [72]. Lesvos experiences a typical Mediterranean climate, with cool and moist winters, averaging 9.6 °C in January, and warm and dry summers, averaging 27.0 °C in July [76].

2.2. Site Selection and Metrics of Trees’ Phenotypic Traits

From 2017 to 2020, we conducted a comprehensive recording and monitoring of 543 deciduous and evergreen trees which included five species (Robinia pseudoacacia, Morus alba, Melia azedarach, Olea europaea, Pinus brutia), of two functional forms (broadleaved and coniferous), across four different locations of the island (Figure 1). The selection of study sites was carefully considered to cover diverse ecosystems on the island of Lesvos.
From 2017 to 2018, we recorded and monitored all urban trees (N = 287) belonging to three predominant species (R. pseudoacacia, M. alba, M. azedarach) within the four main urban parks of Mytilene. These parks were selected as representative sites to study trees within the urban ecosystem and understand the dynamics of tree health and productivity in an urban setting. In 2018, we extended our recording and monitoring to olive trees (O. europaea) from two randomly selected traditional olive groves in the Pyrgi and Agiasos regions, both situated within the officially designated “High Nature Value farmland areas” of the island. To ensure a representative sample, we randomly selected 80 trees for monitoring, with 40 trees chosen from each of the two groves. Subsequently, in 2019, we shifted our focus to pine trees (P. brutia) (N = 176), which were recorded and monitored on twenty randomly selected forest plots, each covering an area of 900 m2, situated within a continuous and homogeneous section of the P. brutia forest of the island (Figure 1).
For each tree, we conducted measurements using conventional forestry tools and methods, including a clinometer, measuring tapes, and the vertical sighting method [77]. These measurements allowed us to capture a set of typical phenotypic traits that are directly associated with the tree’s architecture and vitality. Specifically, concerning architectural traits, we considered characteristics related to the crown, trunk, and the tree as a whole. These traits included (a) height (H—m), (b) diameter at breast height (DBH—cm), (c) height at the crown base (HC—m), and (d) major and minor axes of the crown [78]. Utilizing these metrics, we calculated additional tree characteristics such as the crown area (CA—m2) and the crown ratio index (CR), which represents the ratio of crown length to H. This index, reflecting the relationship between crown length and tree height, not only provides insights into tree stability and vitality [79] but also indicates the historical competition conditions experienced by each individual tree [80].
In assessing the vitality traits of trees, we initially estimated the presence and type of external indications, including cavities, burls, and rotten bark. We categorized trees with a presence or absence of defects into three groups: (a) trees with cavities (N = 320), (b) trees with other defects (N = 90), which comprised a combination of various defects such as cavities, burls, and rotten bark, and (c) trees with no defects (N = 133), indicating the absence of any structural abnormalities. To account for the potential bias introduced by the influence of tree diameter on cavity occurrence, we utilized the ratio of the number of cavities to tree diameter. Specifically for trees with cavities, we measured the cavities’ vertical diameter (VD—cm), horizontal diameter (HD—cm), and internal diameter (ID—cm). This information allowed us to estimate each tree’s functional perimeter (FP) [73] along with a calculation of a strength loss index (SL) [81]. The FP and the SL were calculated using the following equations:
FP = (((π × DBH) − VD) − (π × DBH)) × (π × DBH)−1) × 100
SL = HD3 + (HD × (π × DBH)−1 × (DBH3 − HD3) × (100 × ((DBH3)−1)).
Subsequently, we proceeded to estimate the LAI, an indirect measure of each tree’s productivity [82,83]. To assess LAI, we employed two different methods based on the recorded tree type: (a) the SunScan plant canopy analyzer (Delta-T Devices, Cambridge, UK) for broadleaves and (b) the hemispherical imaging method, using a Canon EOS 60D camera with a specialized wide-angle lens (Delta-T Devices, Cambridge, UK), for conifers. This distinction was necessary due to the practical challenges of implementing hemispherical photography in dense and low-height trees, such as those included in our study. At a standardized height of 1.3 m from the ground, we obtained two LAI metrics for each tree: one of the crown area located above the defected area (LAIcav) and another above a separate non-defected part of the trunk (LAInon-cav). Additionally, we calculated the LAI range (LAIrange) for each tree, which serves as an additional indirect indicator of tree health [71,73]. LAI measurements were conducted during the period of shoot growth pause for all the investigated species.

2.3. Estimation of Wood-Decay Fungi Presence

In each tree, we conducted a thorough visual examination for signs of wood-decay fungi. We initially inspected the trunk, branches, leaves, and exposed roots for the occurrence of externally visible indications of decay, such as fungal fruiting bodies, conks, or discoloration [84]. In any case, we identified the predominant fungus on the trees’ trunks, using an expert’s judgment opinion, while we categorized this information into one binary variable (fungal presence = 1, fungal absence = 0). In R. pseudoacacia trees, we observed the presence of a wood-decay fungus commonly associated with white pocket rot in the heartwood, resulting in the deterioration and degradation of the affected wood. It often manifests as large, shelf-like fruiting bodies (conks) on the trunk or branches of infected black locust trees. For M. alba trees, we identified the presence of a fungus that causes powdery mildew disease, characterized by a white or grayish powdery growth on the leaves and stems leading to leaf distortion and reduced vigor. In M. azedarach trees, we found the presence of Diplodia spp. as the predominant fungus. This fungal pathogen causes leaf blight and dieback, resulting in a decline in the health and vitality of the tree [85]. Regarding olive trees, we observed the occurrence of olive leaf spot or Cycloconium leaf spot, caused by the fungus Spilocaea oleagina (Castagne) Hughes. This disease manifests as small round to irregularly shaped spots on the leaves. Initially, these spots appear yellow or light green and progressively turn brown or dark brown, leading to defoliation and reduced vigor [86]. Finally, in the case of pine trees, we detected the presence of Porodaedalea pini Brot., commonly known as red ring rot or red heart rot. This fungal pathogen primarily infects the heartwood of pine trees, resulting in decay and weakening of the wood. We visually identified its presence based on the formation of red or reddish-brown decay pockets or zones within the heartwood of the infected pine trees.

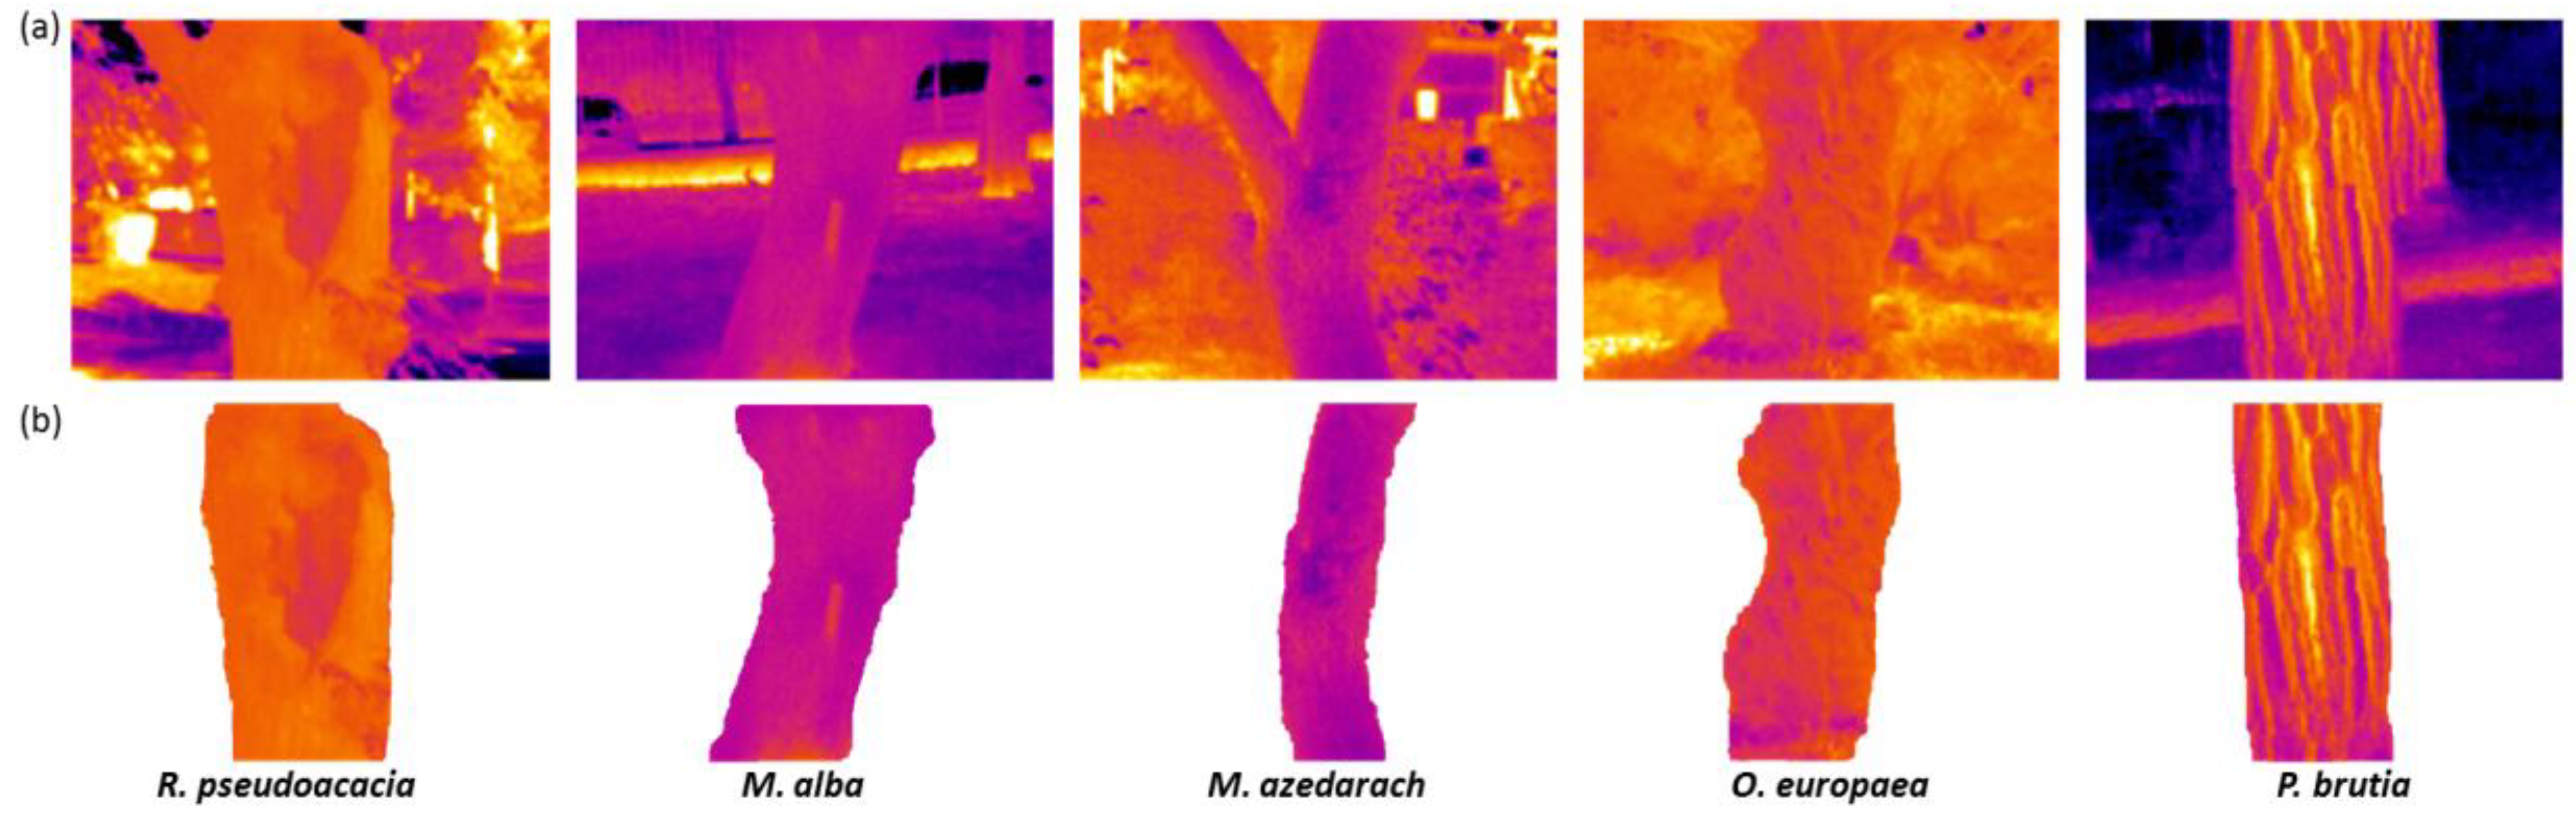
2.4. Creation of Trees’ Thermal Profile and Indices Using IRT

We utilized IRT to capture infrared images of all the tree trunks. For this purpose, we employed a handheld thermal camera (Testo 875-1i, Testo SE & Co. KGaA, Lenzkirch, Germany) mounted on a stable tripod to ensure precise positioning and stability. In the field, we calibrated the camera using ambient temperature, relative humidity, solar irradiance, and emissivity values (e = 0.95), which were individually determined beneath their crowns. To obtain accurate measurements, we relied on a portable weather station and a solar radiation meter (Amprobe SOLAR-100) to acquire the necessary environmental data. The infrared images were captured from a standardized distance of 3.0 m and a height of 1.3 m to encompass the entire tree trunk, specifically targeting the part where the presence of defects was either known or suspected (e.g., presence of wood-decay fungi), to ensure focused temperature measurements on regions of interest. In cases where no defects were present, we captured the infrared images from the side of the trunk, aligning with the mean orientation of defects observed in neighboring trees. To minimize errors resulting from atmospheric composition [87], global radiation effects [88], and temperature inaccuracies caused by solar radiation penetrating through the tree canopy, we conducted the image capture process during the early morning hours. This timing helped to mitigate potential distortions in the thermal data.
We processed the collected infrared images using the TESTO IRSoft® (v. 4.3) software package to extract temperature information. By applying a temperature palette, we generated a dataset of temperature values for the entire image (160 × 120 pixels), where each pixel represented a specific temperature corresponding to the adaptation of tree trunks to environmental conditions. To isolate the areas of interest, namely the tree trunks, from the background and other objects, we employed the ArcGIS Analysis toolbox (v. 10.2) (ESRI Inc., Redlands, NY, USA). First, we exported the calibrated infrared images from the TESTO software and imported them into the ArcGIS software in text file format. Subsequently, we converted each text file into a raster layer, enabling us to define the boundaries of the tree trunks manually. This was accomplished by creating unique polygons in shapefile format to enclose the tree trunk areas. Finally, we extracted the temperature values specifically within the defined tree trunk areas (Figure 2) and organized them into a structured database for subsequent statistical analysis.
To define the thermal profile of the trees and establish trunk thermal indices, we analyzed the trunk temperature histograms to extract a comprehensive set of thermal variables representing the response of the tree trunk to ambient temperature. We extracted the trunk temperature values from the histograms and thereafter we calculated typical measures of central tendency and variability. In order to evaluate the overall state of each tree, it was essential to mitigate the influence of outliers and skewed data. Therefore, we computed the interquartile trunk temperature range (TIQR) from each histogram. This range provided a reliable measure of the tree’s thermal profile while minimizing the impact of extreme temperature values. However, when assessing specific traits on the tree trunk that directly relate to the tree’s health, such as cavities, it was necessary to examine the extreme temperature values. To capture this information comprehensively, we employed the interpercentile ranges of each trunk histogram, collectively defining the outer percentile range (TOPR). The TOPR encompassed the temperature values associated with any external or internal abnormalities present on the trunk.

2.5. Statistical Analysis

Prior to conducting any statistical analyses, the primary data underwent a process of normalization and transformation to achieve optimal data distribution and fulfill the assumptions necessary for subsequent analyses. Initially, we employed the z-score normalization technique to standardize the measured traits and indices on a common scale. This approach was particularly valuable given the inherent variations in characteristics observed across different species and functional forms. Furthermore, although our measurements were conducted during the spring season when temperature and humidity levels on the island remained relatively consistent, we assessed whether there were any differences in microclimate conditions during infrared image collection across the four study sites. The results revealed no statistically significant differences among the study sites in terms of ambient temperature [F (3, 95.23) = 2.41, p = 0.07] and relative humidity [F (3, 95.90) = 1.36, p = 0.25)], and thus we concluded that treating the sites separately was unwarranted, and we pooled the data of all the trees for subsequent analyses.
The assessment of temperature distribution on tree trunks holds significance as an indicator of their health state [68,70,71,72]. Recognizing the influence of water supply conditions and individual-specific anatomical characteristics on the surface temperature fluctuations of tree trunks [89,90], it becomes crucial to estimate this distribution using the extracted trunk thermal indices (TIQR, TOPR). In light of this, we focused on examining thermal pattern variations among the five tree species and among trees classified into the three categories, which were based on the presence or absence of defects. To investigate this, we employed Welch ANOVA, followed by the Games–Howell test for multiple comparisons. Furthermore, we explored within-species thermal pattern disparities by conducting Welch’s t-test, comparing the trunk thermal indices in terms of the level of abnormalities’ occurrence. We used these statistical tests as they are appropriate when there are unequal variances or unequal sample sizes among the groups being compared, making them suitable for our analysis. In accordance with the examined thermal patterns, we further investigated differences in the LAI among trees categorized into the three distinct groups based on the presence or absence of defects.
For investigating the relationship between trees’ phenotypic traits and trunk thermal indices we used correlation statistics. Furthermore, in order to examine the effect of trees’ phenotypic traits and trunk thermal indices on LAI we used multiple linear regression analysis, with a backward elimination procedure; LAI was chosen as the dependent variable, representing tree productivity, while variables of the trees’ traits served as the independent ones. However, to account for potential heteroscedasticity and unequal variances in the data, we opted for a weighted least square regression approach instead of traditional linear regression. We performed this analysis separately for deciduous and evergreen species and for the entire dataset of recorded trees.
Finally, to explore the potential influence of phenotypic traits and trunk thermal indices on the presence or absence of (a) structural defects, (b) cavities, and (c) fungal infestation, we developed a series of binary logistic regression models. We assessed the performance of each model by generating a classification table, which compared the observed values with the predicted values. Additionally, we employed receiver operating characteristic (ROC) curve analysis to evaluate the overall predictive accuracy of the models. We assessed the overall significance of the models using the Hosmer–Lemeshow goodness-of-fit test, which examines the agreement between observed and predicted outcomes. Furthermore, we calculated Nagelkerke’s R2 as an explanatory index of the models’ variation, providing insights into the proportion of variance explained by the predictor variables.
SPSS software (v.25.0. Armonk, NY, USA: IBM Corp.) was used for all statistical analyses. All the assumptions required were met and statistical significance was assumed at the 5% level. Summary statistics are expressed as means ± standard deviation.

3. Results

3.1. Trees’ Architectural and Vitality Traits

In the four study areas, the 543 recorded deciduous and evergreen trees exhibited essential architectural traits with a mean H of 9.22 ± 4.59 m, a mean DBH of 43.49 ± 21.14 cm, a mean CR of 0.56 ± 0.19, and an average CA of 48.05 ± 31.03 m². Intriguingly, our comprehensive assessment revealed that 58.93% of the recorded trees exhibited cavities, while 24.49% displayed a combination of other defects, such as cavities, burls, and rotten bark, with 16.57% of the trees presenting no signs of such abnormalities. Regarding the vitality traits, among the trees affected by structural defects, the mean number of detected defects per tree was 1.51 ± 2.02. Trees with cavities exhibited a VD of 22.03 ± 28.51 cm, a HD of 22.95 ± 33.10 cm, and an ID of 9.63 ± 11.69 cm. In addition, these trees exhibited an average SL of 16.29 ± 29.19%, and an FP of −19.16 ± 28.36%. Moreover, our analysis encompassed measurements of the LAI for all recorded trees. The mean LAI value for the entire tree population was 1.76 ± 0.88. Specifically, the LAI above the defected area of the trunk exhibited a mean of 1.59 ± 0.93, while the LAI above the non-defected area of the trunk displayed a mean of 1.93 ± 0.99. The LAI range, representing the variation in leaf area across the tree, was recorded with a mean of 0.78 ± 0.92. Detailed trait measurements for all five tree species regarding tree architecture and vitality are presented in Table 1.

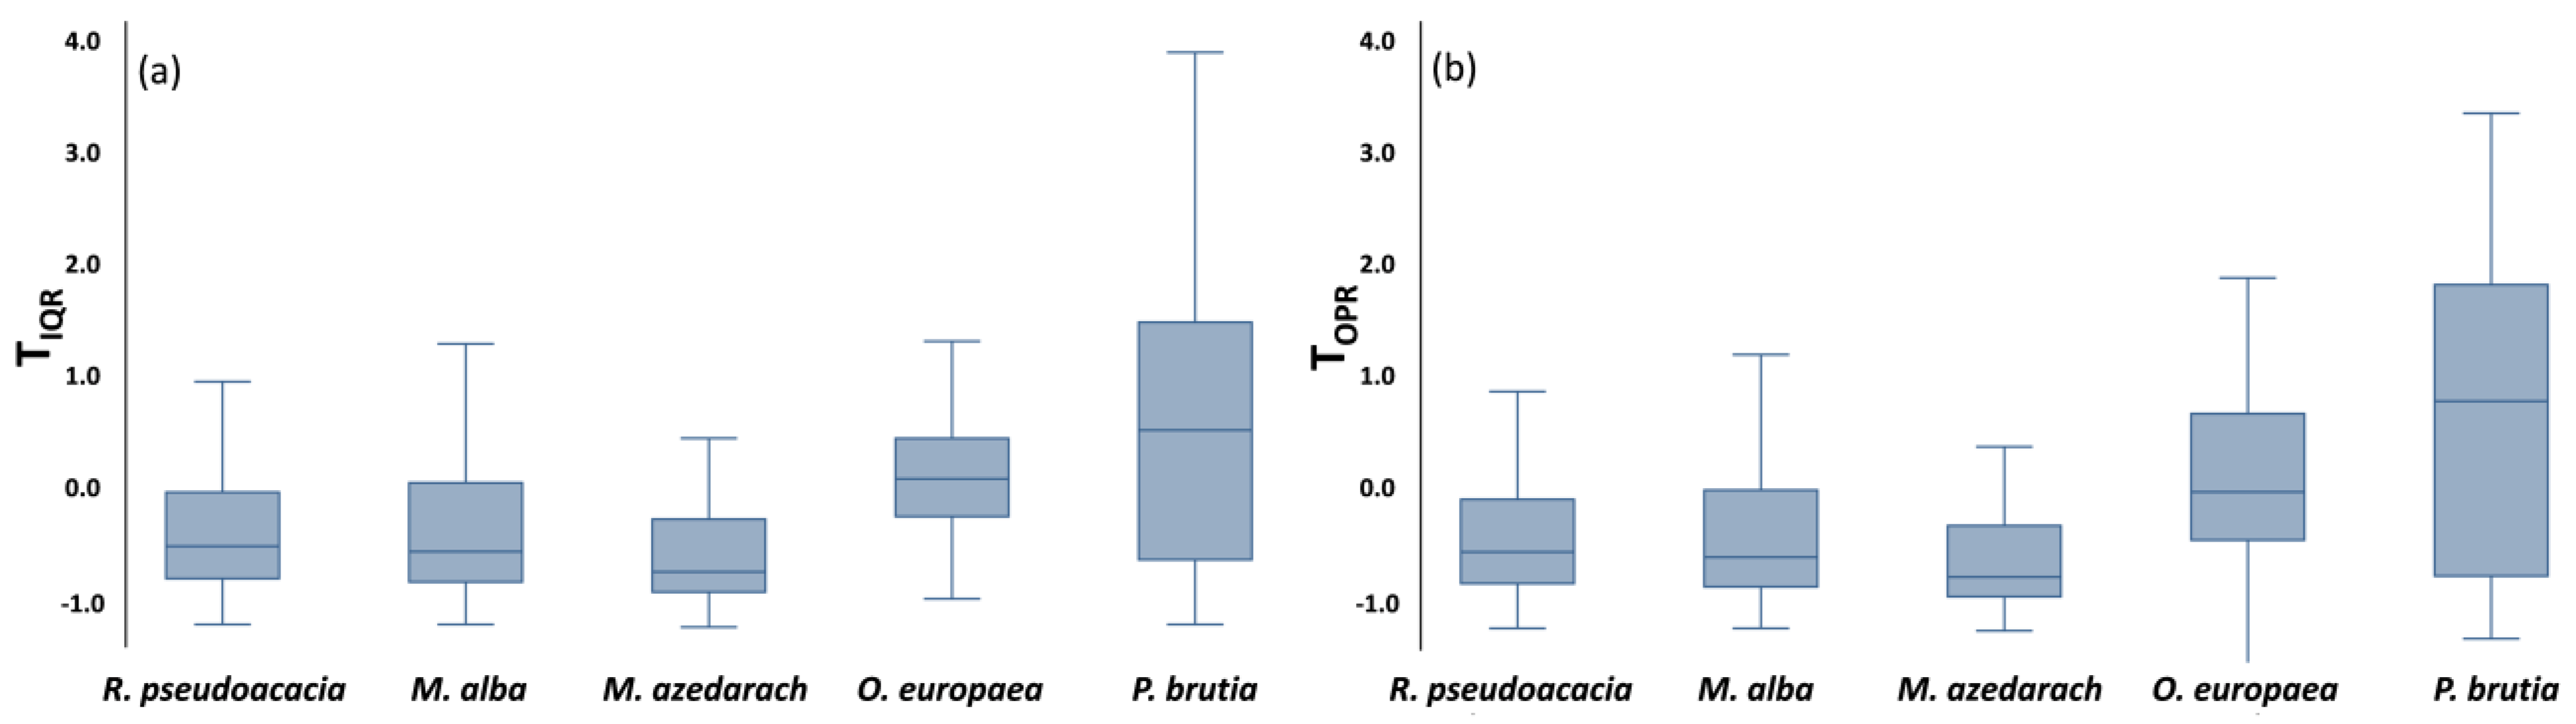
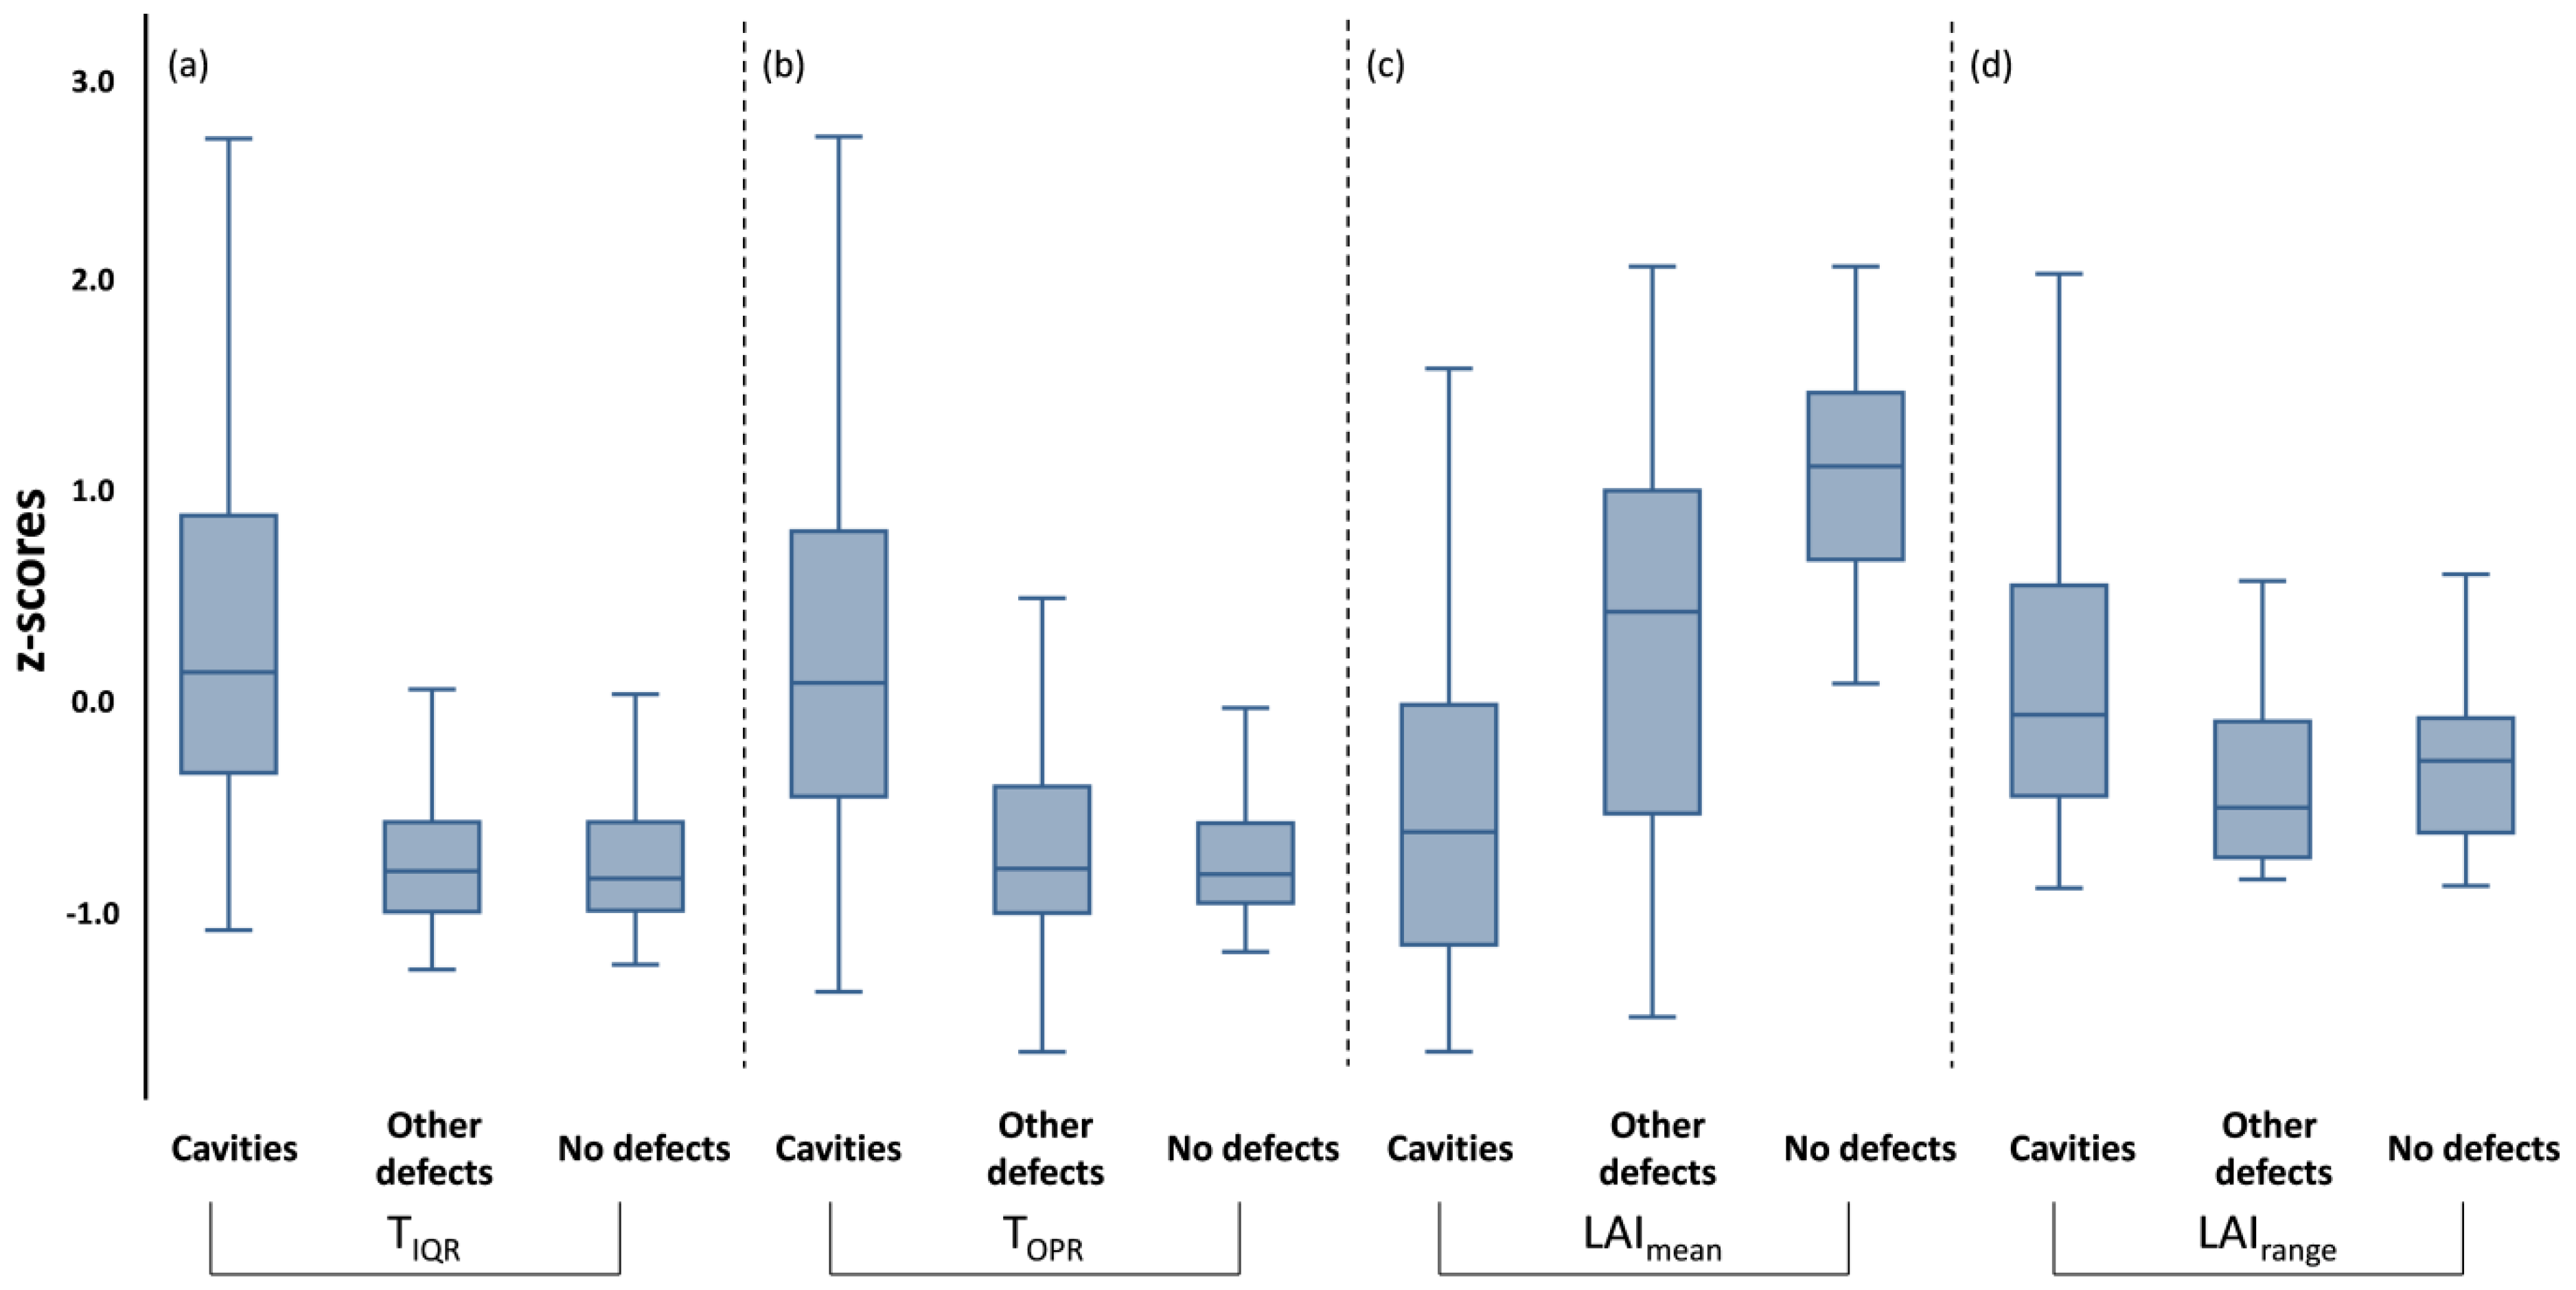
3.2. Trees’ Thermal and LAI Patterns

A total of 543 infrared images (representing one image per tree) were collected during the infrared thermography (IRT) procedure, alongside 1086 LAI values (two measurements per tree). The recorded trees exhibited a mean trunk temperature of 16.7 ± 5.2 °C, with a minimum temperature of 15.9 ± 3.5 °C and a maximum temperature of 19.2 ± 4.7 °C. Their thermal patterns, as described by the thermal interquartile range (TIQR) and the thermal outer percentile range (TOPR), exhibited mean values of 0.6 ± 0.4 °C and 0.9 ± 0.4 °C, respectively. The examination of thermal patterns using Welch ANOVA revealed statistically significant differences among the five tree species for both trunk thermal indices [TIQR: F (4, 180.86) = 28.49, p < 0.05; TOPR: F (4, 179.18) = 31.68, p < 0.05]. Further analysis using the Games–Howell test for multiple comparisons showed significant differences in the mean TIQR values between the following species: (a) R. pseudoacacia (TIQR = −0.37 ± 0.56) and O. europaea (TIQR = 0.23 ± 0.82) (p < 0.05, 95% C.I. = −0.89, −0.33), (b) R. pseudoacacia and P. brutia (TIQR = 0.54 ± 1.26) (p < 0.05, 95% C.I. = −1.21, −0.63), (c) M. alba (TIQR = −0.39 ± 0.64) and O. europaea (p < 0.05, 95% C.I. = −0.96, −0.29), (d) M. alba and P. brutia (p < 0.05, 95% C.I. = −1.29, −0.60), (e) M. azedarach (TIQR = −0.49 ± 0.67) and O. europaea (p < 0.05, 95% C.I. = −1.09, −0.35), and ( f) M. azedarach and P. brutia (p < 0.05, 95% C.I. = −1.41, −0.66) (Figure 3a). Similarly, the differences in TOPR values among the five species followed the same pattern as TIQR, with the additional observation of a difference between O. europaea and P. brutia (p < 0.05, 95% C.I. = −0.85, −0.06) (Figure 3b).
Regarding the trunk thermal indices of trees classified into the three categories based on the presence or absence of defects, the Welch ANOVA also revealed statistically significant differences [TIQR: F (2, 310.93) = 160.13, p < 0.05; TOPR: F (2, 289.86) = 130.87, p < 0.05]. Games–Howell post hoc analysis indicated significant disparities in both the TIQR and the TOPR among (a) trees with cavities (TIQR = 0.46 ± 1.01; TOPR = 0.35 ± 0.98) and trees with other defects (TIQR = −0.64 ± 0.52; TOPR = −0.39 ± 0.94) (TIQR: p < 0.05, 95% C.I. = 0.93, 1.27; TOPR: p < 0.05, 95% C.I. = 0.52, 0.99), and (b) trees with cavities and trees with no signs of defects (TIQR = −0.69 ± 0.35; TOPR = −0.68 ± 0.31) (TIQR: p < 0.05, 95% C.I. = 0.99, 1.31; TOPR: p < 0.05, 95% C.I. = 0.99, 1.19) (Figure 4a,b). However, no significant differences were observed regarding the TIQR between trees with other defects and trees with no signs of defects (p > 0.05, 95% C.I. = −0.08, 0.19). In contrast, significant differences were found concerning the TOPR between these two groups (p < 0.05, 95% C.I. = 0.07, 0.49) (Figure 4b). In alignment with the observed disparities in thermal patterns across the three categories, we noted corresponding patterns in LAImean and LAIrange. LAImean exhibited similar variability to TOPR (Figure 4c), while LAIrange exhibited similar variability to TIQR (Figure 4d).
Intraspecies thermal and LAI patterns exhibited significant variations when analyzing all recorded trees. Specifically, the mean z-scores of the thermal and LAI indices demonstrated significant differences [TIQR: t (456.41) = −12.58, p < 0.05; TOPR: t (241.70) = −5.73, p < 0.05; LAImean: t (239.20) = −4.52, p < 0.05; LAIrange: t (415.28) = −7.54, p < 0.05] between trees with structural defects (TIQR: 0.21 ± 1.02; TOPR: 0.13 ± 0.98; LAImean: −0.10 ± 0.99; LAIrange: 0.13 ± 1.06) and healthy trees (TIQR: −0.64 ± 0.52; TOPR: −0.40 ± 0.93; LAImean: 0.32 ± 0.95; LAIrange: −0.41 ± 0.60). At the species level, this distinction between trees with defects and healthy trees persisted across almost all the examined cases (Table 2).

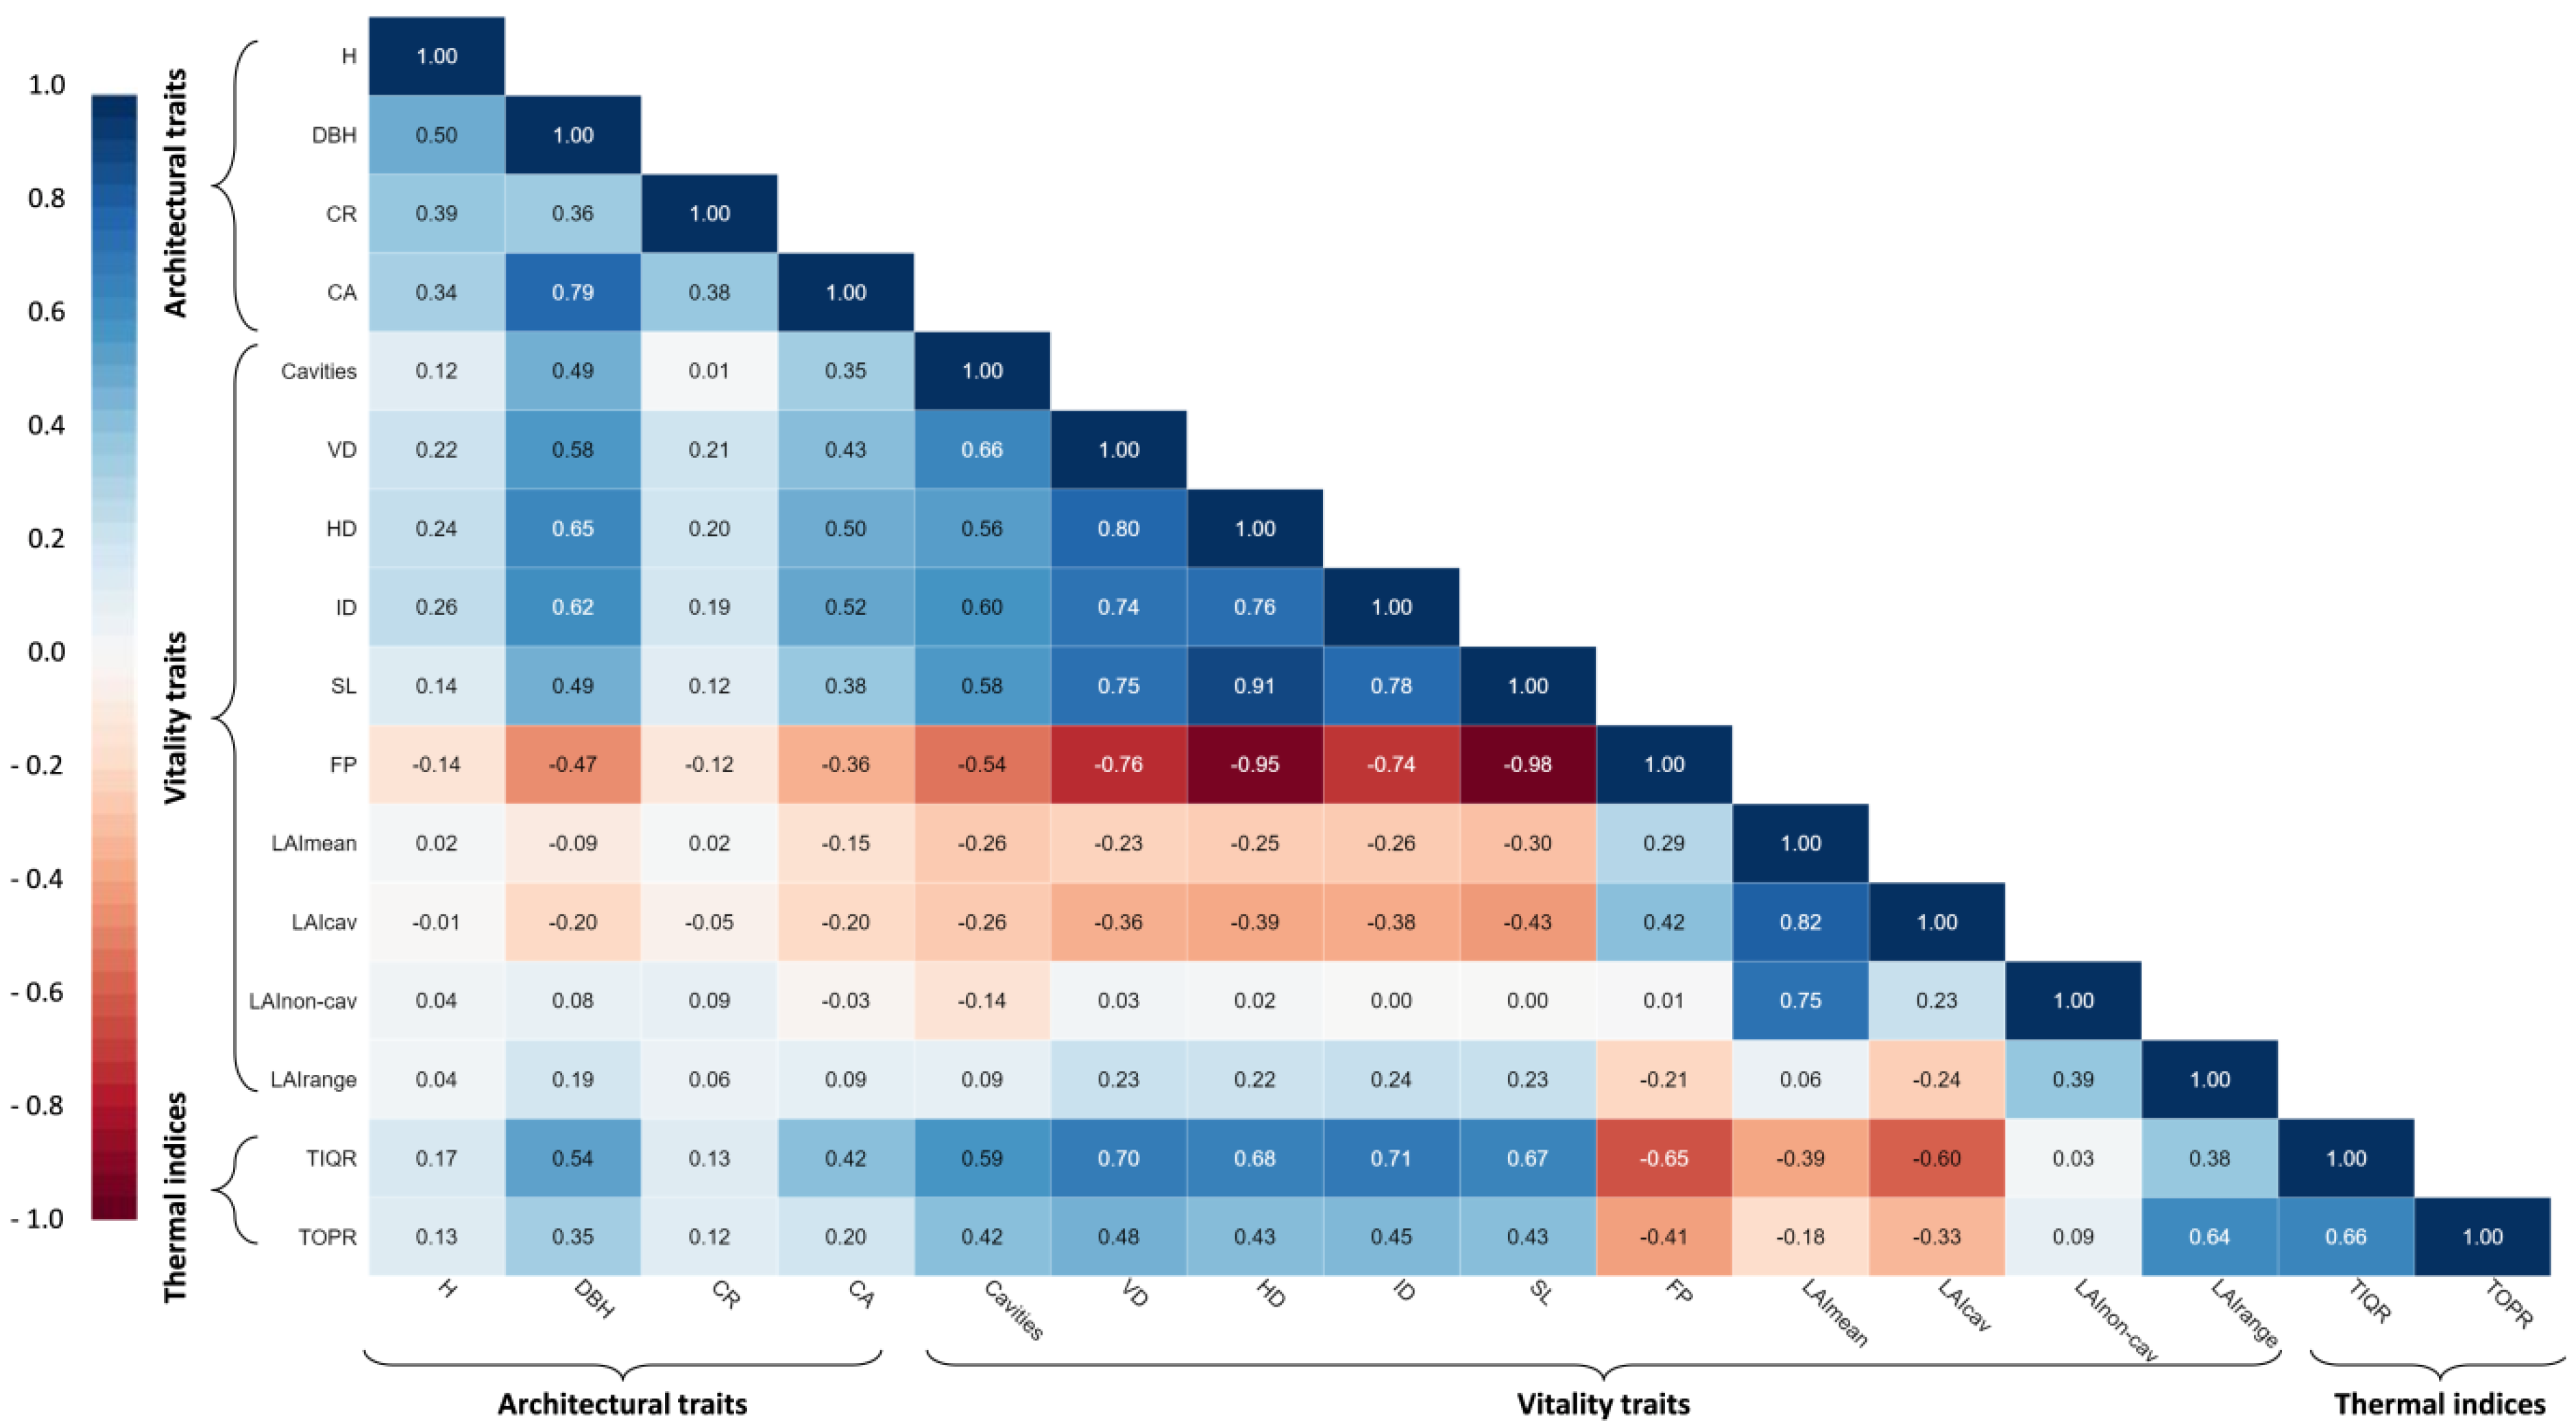
3.3. Relationships among Trees’ Phenotypic Traits and Trunk Thermal Indices and Their Effects on LAI

Correlation analysis revealed statistically significant associations between the trees’ phenotypic traits and the trunk thermal indices, both in direct and inverse relationships (Figure 5). Among the architectural traits (H, DBH, CR, CA), positive correlations were observed, indicating interrelations among these traits. However, the examination of the architectural traits in relation to the vitality indices, specifically the leaf area indices (LAImean, LAIcav, LAInon-cav, LAIrange), did not show any significant correlations. In contrast, certain architectural traits (DBH, CA) exhibited positive correlations with various cavity-related indices (cavities, VD, HD, ID, SL), ranging from 0.35 to 0.65 (p < 0.05), while negative correlations were observed with the functional perimeter (−0.36 to −0.47; p < 0.05).
Regarding the relationships among the vitality indices, negative associations were found between the LAI indices and variables related to cavity number and dimensions. LAImean and LAIcav were major contributors to these negative relationships, with correlations ranging from −0.23 to −0.43 (p < 0.05). Additionally, these indices exhibited significant positive correlations with FP (LAImean: r = 0.29, p < 0.05; LAIcav: r = −0.42; p < 0.05). Furthermore, the relationships between the cavities ratio, the dimensions of the defects and trees’ strength loss, and the functional perimeter were moderate to strongly positive, and negative in the case of FP, and all statistically significant. Specifically, (a) the cavities ratio displayed significant positive relations with VD (r = 0.66; p < 0.05), HD (r = 0.56; p < 0.05), ID (r = 0.60; p < 0.05), and SL (r = 0.58; p < 0.05), and negative correlation with FP (r = −0.54; p < 0.05); (b) the VD, HD, and ID exhibited consistent and significant relationships between them, with the correlation coefficients ranging from 0.74 to 0.80 (p < 0.05); (c) SL exhibited significant positive relations with the cavities dimensions (0.78 < r < 0.58; p < 0.05) and negative with FP (r = −0.98; p < 0.05); and (d) the FP demonstrated significant negative correlations with the cavities dimensions (−0.54 to −0.95; p < 0.05), respectively.
The examination of the trees’ trunk thermal indices (TIQR, TOPR) showed significant positive and negative relations with the vitality traits. Regarding the defect-related indices these correlations ranged from 0.59 to 0.71 (p < 0.05), while for the FP and the LAI indices, the values ranged between −0.65 and −0.33 (p < 0.05).
The preceding analysis of traits provides a broad overview of their associations. However, to gain comprehensive insights into the productivity of trees, it is crucial to establish a network of variables that can offer valuable information regarding their resilience and overall health state. In order to elucidate these relationships, we employed weighted least squares regression analysis, aiming to assess the extent to which phenotypic traits and trunk thermal indices contribute to the explanation of LAI. We excluded the DBH and cavity-related traits (VD, HD, ID) as independent variables, as these traits serve as key components in the estimation of strength loss and functional perimeter.
The models employed to explain the LAI as a proxy of tree productivity demonstrated statistical significance across all examined cases. Specifically, for the combined dataset of the five tree species, the model yielded a significant F-value [F (3, 459) = 128.24, p < 0.05], indicating a strong overall fit. The adjusted coefficient of determination (R2adj) for this model was 0.45, suggesting that approximately 45% of the variance in LAI could be explained by the predictor variables. Similar patterns were observed for the deciduous species [F (3, 284) = 115.441, p < 0.05, R2adj = 0.54] and the evergreen species [F (1, 174) = 97.15, p < 0.05, R2adj = 0.35], indicating significant associations between the predictor variables and LAI within these respective groups. It is noteworthy that the predictor variables exhibited comparable levels of explanatory power, collectively accounting for a substantial proportion of the total variance in LAI (Table 3).

3.4. Modelling the Incidence of Defects, Cavities, and Fungal Infestation

Among the 407 trees that exhibited defects, 78.62% were found to have cavities, while 40.15% showed signs of fungal infestation. To explore the relationship between thermal patterns, phenotypic traits, and the presence or absence of defects, cavities, and fungal infestation, we utilized three binary logistic regression (BLR) models.
Regarding trees that presented defects, the BLR model identified a thermal index (TIQR), a vitality index (LAIcav), and an architectural trait (CA) as the most significant among the nine variables entered initially in the model (χ2 (3, N = 543) = 190.50, p < 0.05; Table 4a). These variables collectively explained 74.6% of the total variance in the data, as indicated by the Nagelkerke R2. The goodness of fit of the model was supported by the Hosmer–Lemeshow test, which demonstrated non-significance, and thus it can be accepted (Hosmer–Lemeshow = 14.02; p > 0.05). Furthermore, the area under the receiver operating characteristic (ROC) curve (AUC = 0.96, S.E. = 0.01, 95% CI 0.93–0.98, p < 0.05) indicated that the model accurately classified trees with and without defects in 91.4% of cases. The predicted classification accuracy was 92.1% for trees without defects and 91.1% for trees with defects.
Focusing on cavities, the model (χ2 (4, N = 543) = 357.49, p < 0.05; Table 4b) displayed an overall classification accuracy of 88%, with an AUC of 0.93 (S.E. = 0.01, 95% CI 0.90–0.95, p < 0.05). The Nagelkerke R2 value of 0.65 and the non-significant Hosmer–Lemeshow test (Hosmer–Lemeshow = 40.37, p > 0.05) indicated a satisfactory goodness of fit. The model correctly classified 90.6% of trees with cavities and 84.3% of those without, demonstrating its predictive ability.
Lastly, when examining the fungal infestation, the BLR model classified 88.8% of trees correctly: 92.2% of the infected and 86.5% of the non-infected (χ2 (3, N = 543) = 422.66; p < 0.05; Nagelkerke R2 = 0.73; Hosmer–Lemeshow = 19.54, p > 0.05; AUC = 0.95, S.E. = 0.009, 95% CI 0.93–0.97, p < 0.05; Table 4c).

4. Discussion

In this study, we embraced a holistic and multidimensional approach to investigate and evaluate the complicated concept of tree health within urban, agricultural, and forest ecosystems. Our research encompassed the integration of a non-invasive technique and field metrics, facilitating an exploration into the complex concept of tree health at both the species and individual levels. By amalgamating these diverse approaches, our objective was to establish a comprehensive and all-encompassing framework that not only enhances our comprehension of tree health but also provides a robust platform for the implementation of effective monitoring and conservation practices. After all, the amalgamation of three distinct yet intricately interconnected cases of trees in urban, agricultural, and forest settings may form a cohesive and interdisciplinary network for an all-encompassing framework that not only augments our understanding of tree health but also empowers us to effectively monitor, evaluate, and conserve these vital components of ecosystems.
The central focus of our study revolves around the integration of diverse methodological approaches, specifically IRT, phenotypic trait measurements, and the development of health state indicators derived from thermal data. This is the reason why our investigation encompassed the analysis of 543 trees, representing five distinct species, from three diverse ecosystems, facilitating comparisons at multiple levels of community organization (individual) as well as classification (species). The selection of these species was based on their significant representation of different anthropogenic and natural settings, which impose distinct challenges and influences on their health. Beyond this classification, we chose to focus our approach on two main categories, deciduous and evergreen tree species, because of their contrasting characteristics and ecological significance in various ecosystems [91].
The innovative aspect of our research lies in the utilization of IRT as a rapid diagnostic tool to illustrate tree thermal patterns to explain the presence of defects in deciduous and evergreen standing trees, while simultaneously establishing correlations between the resultant trunk thermal indices and established indicators of tree health and productivity. Moreover, the utilization of IRT as a diagnostic tool for assessing the health of standing trees represents a significant advancement in the field of tree ecology and conservation [50,68,71,72,73], enabling us to detect and monitor subtle changes in thermal behavior associated with underlying health conditions.
The observed variations in tree thermal patterns, assessed through the utilization of the derived trunk thermal indices, both within and among the five tree species, as well as across different categories based on the presence or absence of defects, provide compelling evidence that reaffirms the fundamental concept of tree health [67,68,92]. According to this, a healthy tree is characterized by a homogeneously distributed trunk temperature, reflecting a well-functioning thermoregulatory system. In contrast, an unhealthy tree exhibits temperature abnormalities, suggesting underlying physiological or structural issues [68]. Furthermore, our findings highlight the pivotal role of the selected indicators, namely TIQR and TOPR, in comprehensively evaluating a tree’s thermal profile. These indicators ensured the robustness of our analysis, as by avoiding the use of range metrics, as they would be highly influenced by outliers, and focusing on percentile-based measures, we provided a more accurate representation of the thermal characteristics and abnormalities observed on the tree trunks. Therefore, our results highlight the importance of adopting a “thermal perspective”, among other approaches, when evaluating tree health and validating the effectiveness of TIQR and TOPR as essential indices for assessing overall tree vitality [71].
Based on the results obtained from the thermal profiles of the examined trees, it becomes evident that trees of similar or different species exhibited subtle variations in their thermal patterns, as discussed previously by Vidal and Pitarna [70]. Consequently, individual species must be examined separately to capture these differentiations effectively, aligning with the approach proposed by Catena and Catena [68] (Figure 3). Notably, the differences observed were primarily between urban and agricultural trees, as well as between urban and forest, and agricultural and forest trees. Interestingly, no significant differences were found between urban tree species, implying that IRT can be effectively applied to a broad range of urban trees for estimating their health state, irrespective of their taxonomic classification. Among the trees examined, those exhibiting cavities in their trunks demonstrated the most pronounced deviation from the established criterion for a healthy tree in both trunk thermal indices (Figure 4). Following this, trees displaying a combination of defects exhibited a noticeable but limited deviation, specifically in relation to the outer percentile range index. This occurrence can be attributed to the fact that this index incorporates specific trunk traits directly associated with tree health, such as the presence of cavities, necessitating an examination of extreme temperature values. Consequently, these findings facilitate the categorization of the examined trees into distinct groups, as previously elucidated by Zevgolis et al. [72], despite certain contrasting outcomes reported by other studies [93]. These categories encompass trees with cavities, those with a combination of defects, and, finally, the category of healthy trees.
Furthermore, in addition to the notable thermal pattern disparities observed among the different tree categories, there is a similar trend in the indices related to LAI, which serves as an indicator of productivity. Specifically, both LAImean and LAIrange show similar patterns across the tree species. Healthy trees exhibit higher LAI values, indicating a greater overall leaf area, while trees with defects display lower LAI values. Moreover, a higher LAIrange signifies a greater variability in leaf area distribution throughout the tree crown, implying potential variations in tree productivity and health [71,94]. After all, LAI plays a pivotal role as a crucial biophysical index in characterizing ecosystem structure and vegetation growth. It operates as a regulator of the microclimate within and below the canopy, facilitating essential processes such as water and carbon exchange while influencing canopy water interception [82,95,96]. By quantifying the extent of leaf area per unit ground area, LAI provides valuable information about a tree’s ability to capture sunlight for photosynthesis and its overall productivity [97,98]. The inclusion of these two LAI metrics in our study was driven by the presence of cavities, which can inflict damage on the xylem and phloem tissues across the tree. Such damage has direct consequences on the tree’s crown shape and structural integrity. As a result, disruptions in water and nutrient transport occur due to impaired vascular systems [99], directly impacting the availability and distribution of resources within the tree, ultimately influencing LAI measurements. Reduced water and nutrient transport can lead to alterations in leaf distribution patterns as the tree attempts to optimize resource allocation to sustain growth and vitality in challenging conditions [89,100,101]. Consequently, the observed variations in LAI in trees with cavities or defects serve as valuable indicators of the tree’s health status and its ability to cope with structural damage.
In addition to thermal and LAI indices, the assessment of tree health also involves the consideration of indicators specifically related to structural defects, with a focus on characteristics associated with cavities. The cavities ratio, a vital bridge connecting tree vitality metrics with IRT, describes trunk growth patterns that may exhibit various types of defects. The FP represents the potential reduction in functional tissue due to the presence of cavities [73], while the SL evaluates the tree’s mechanical integrity by considering the dimensions of these cavities [81]. These indices serve as valuable proxies for assessing tree health and contribute to our understanding of the impact of defects on overall tree condition, as they can lead to an increased structural instability and reduced resilience of trees [39], ultimately raising the risk of tree mortality [102,103]. This is also in response to the statistically significant relationships, whether positive or negative, identified between these indicators, the LAI indices, and the trunk thermal indices (Figure 5). By considering the inter-relationships among the examined indices and taking into account the notable differences observed in TIQR, TOPR, LAImean, and LAIrange between trees with and without defects, we can confidently conclude that these indices effectively enable the identification and quantification of tree health conditions.
Building upon the comprehensive assessment of tree health, we sought to explore the relationship between LAI and the combined influence of phenotypic and trunk thermal indices. By employing weighted linear regression analysis, we aimed to elucidate the extent to which these indices contribute to LAI variation. The results of the linear models demonstrated a strong dependency of LAI on three key indices that can effectively explain tree productivity: TIQR, LAIrange, and SL. Remarkably, the consistent inclusion of these three indices in all three models, whether combined or considered individually, indicated their significant contribution in predicting LAI, which in our case serves as an indirect metric of tree productivity. Moreover, TIQR emerged as a common feature in all models, suggesting its crucial role in describing the surface temperature of the tree trunk and its potential as a reliable predictor of tree productivity. The explanatory power of the models varied across the different tree species, ranging from 0.35 for evergreen species to 0.54 for deciduous species. These findings imply that the utilization of TIQR allows for a relatively accurate prediction of LAI. Notably, the negative coefficient associated with the thermal index reinforces the inverse relationship between temperature distribution uniformity on the tree trunk and productivity. This finding aligns with the prevailing understanding that a uniform surface temperature distribution reflects a healthy tree state [68] and is positively correlated with higher productivity [71]. Furthermore, the somewhat similar explanatory power observed across all five tree species suggests the potential universal applicability of this thermal index.
Despite the relatively low sensitivity of the five studied tree species to most abiotic stressors due to various factors [104,105], understanding the potential implications of these structural anomalies on their health and resilience remains crucial. In this regard, our logistic regression models have demonstrated noteworthy classification accuracy and explanatory power in predicting the presence of defects, cavities, and fungal infestation, offering valuable insights into the factors influencing tree health. The predictors, including TIQR, TOPR, LAIcav, LAIrange, and CA, significantly contributed to explaining the probability of defects, cavities, and fungal presence. Specifically, the models demonstrated exceptional discriminatory performance in distinguishing between trees with and without defects (91.4%), while slightly lower accuracy was observed for the subcategory of cavities (88%). Notably, the logistic regression models exhibited higher classification accuracy (88.8%) in predicting fungal presence, underscoring the significance of these non-invasive indices in assessing and predicting tree health.
In conclusion, our study employed a comprehensive approach to assess tree health in urban, agricultural, and forest ecosystems. By integrating thermal and phenotypic indices, we gained valuable insights into the overall state of tree health at both the species and individual levels. The examination of thermal patterns, LAI indices, and indicators of structural defects allowed us to better understand the dynamics of tree health and their implications for tree vitality and resilience. Our findings highlighted the importance of trunk thermal indices, such as TIQR and TOPR, in characterizing tree health and predicting LAI. These indices, derived from infrared thermography, exhibited strong relationships with phenotypic traits and demonstrated their potential as universal indicators of tree health. By considering the inter-relationships among trunk thermal indices and phenotypic traits, we can confidently identify and quantify tree health, contributing to the conservation of tree species in diverse ecosystems.

Author Contributions

Conceptualization, Y.G.Z.; methodology, Y.G.Z., T.A., P.G.D. and A.Y.T.; formal analysis, Y.G.Z.; investigation, Y.G.Z.; resources, Y.G.Z., T.A., P.G.D. and A.Y.T.; writing—original draft preparation, Y.G.Z.; writing—review and editing, Y.G.Z., T.A., P.G.D. and A.Y.T.; visualization, Y.G.Z.; supervision, A.Y.T. All authors have read and agreed to the published version of the manuscript.

Funding

This research received no external funding.

Institutional Review Board Statement

Not applicable.

Informed Consent Statement

Not applicable.

Data Availability Statement

The data that support the findings of this study are available from the corresponding author (Y.G.Z.) upon reasonable request.

Acknowledgments

We are also grateful to the three anonymous reviewers for their valuable feedback and insightful comments, which greatly contributed to the improvement of our manuscript. Furthermore, we would also like to express our sincere appreciation to all the members of the Biodiversity Conservation Laboratory for their invaluable assistance during fieldwork. This work could not have been performed without the Biodiversity Conservation Laboratory’s technical equipment.

Conflicts of Interest

The authors declare no conflict of interest.

References

  1. Folke, C.; Polasky, S.; Rockström, J.; Galaz, V.; Westley, F.; Lamont, M.; Scheffer, M.; Österblom, H.; Carpenter, S.R.; Chapin, F.S.; et al. Our future in the Anthropocene biosphere. Ambio 2021, 50, 834–869. [Google Scholar] [CrossRef]
  2. Tortell, P.D. Earth 2020: Science, society, and sustainability in the Anthropocene. Proc. Natl. Acad. Sci. USA 2020, 117, 8683–8691. [Google Scholar] [CrossRef] [PubMed]
  3. Lucash, M.S.; Scheller, R.M.; Sturtevant, B.R.; Gustafson, E.J.; Kretchun, A.M.; Foster, J.R. More than the sum of its parts: How disturbance interactions shape forest dynamics under climate change. Ecosphere 2018, 9, e02293. [Google Scholar] [CrossRef]
  4. Trumbore, S.; Brando, P.; Hartmann, H. Forest health and global change. Science 2015, 349, 814–818. [Google Scholar] [CrossRef] [PubMed]
  5. Cobb, R.; Metz, M. Tree Diseases as a Cause and Consequence of Interacting Forest Disturbances. Forests 2017, 8, 147. [Google Scholar] [CrossRef]
  6. Hong, P.; Schmid, B.; De Laender, F.; Eisenhauer, N.; Zhang, X.; Chen, H.; Craven, D.; De Boeck, H.J.; Hautier, Y.; Petchey, O.L.; et al. Biodiversity promotes ecosystem functioning despite environmental change. Ecol. Lett. 2022, 25, 555–569. [Google Scholar] [CrossRef]
  7. Rapport, D.J. What constitutes ecosystem health? Perspect. Biol. Med. 1989, 33, 120–132. [Google Scholar] [CrossRef]
  8. Rapport, D. Assessing ecosystem health. Trends Ecol. Evol. 1998, 13, 397–402. [Google Scholar] [CrossRef]
  9. Su, M.; Fath, B.D.; Yang, Z. Urban ecosystem health assessment: A review. Sci. Total Environ. 2010, 408, 2425–2434. [Google Scholar] [CrossRef]
  10. Walker, B.; Carpenter, S.R.; Kinzing, A. Resilience, Adaptability and Transformability in Social–ecological Systems. Ecol. Soc. 2004, 9, 5. [Google Scholar] [CrossRef]
  11. Cumming, G.S.; Collier, J. Change and Identity in Complex Systems. Ecol. Soc. 1967, 10, 29. [Google Scholar] [CrossRef]
  12. Lu, Y.; Wang, R.; Zhang, Y.; Su, H.; Wang, P.; Jenkins, A.; Ferrier, R.C.; Bailey, M.; Squire, G. Ecosystem health towards sustainability. Ecosyst. Health Sustain. 2015, 1, 1–15. [Google Scholar] [CrossRef]
  13. Boa, E. An Illustrated Guide to the State of Health of Trees Recognition and Interpretation; FAO, Ed.; CABI Bioscience: London, UK, 2003; ISBN 9251050201. [Google Scholar]
  14. Cavender, N.; Donnelly, G. Intersecting urban forestry and botanical gardens to address big challenges for healthier trees, people, and cities. Plants People Planet 2019, 1, 315–322. [Google Scholar] [CrossRef]
  15. Brockerhoff, E.G.; Barbaro, L.; Castagneyrol, B.; Forrester, D.I.; Gardiner, B.; González-Olabarria, J.R.; Lyver, P.O.B.; Meurisse, N.; Oxbrough, A.; Taki, H.; et al. Forest biodiversity, ecosystem functioning and the provision of ecosystem services. Biodivers. Conserv. 2017, 26, 3005–3035. [Google Scholar] [CrossRef]
  16. Rashidi, F.; Jalili, A.; Kafaki, S.B.; Sagheb-Talebi, K.; Hodgson, J. Anatomical responses of leaves of Black Locust (Robinia pseudoacacia L.) to urban pollutant gases and climatic factors. Trees Struct. Funct. 2012, 26, 363–375. [Google Scholar] [CrossRef]
  17. Samecka-Cymerman, A.; Kolon, K.; Kempers, A.J. Short shoots of Betula pendula Roth. as bioindicators of urban environmental pollution in Wrocław (Poland). Trees Struct. Funct. 2009, 23, 923–929. [Google Scholar] [CrossRef]
  18. Chen, Z.; He, X.; Cui, M.; Davi, N.; Zhang, X.; Chen, W.; Sun, Y. The effect of anthropogenic activities on the reduction of urban tree sensitivity to climatic change: Dendrochronological evidence from Chinese pine in Shenyang city. Trees Struct. Funct. 2011, 25, 393–405. [Google Scholar] [CrossRef]
  19. Scharenbroch, B.C.; Carter, D.; Bialecki, M.; Fahey, R.; Scheberl, L.; Catania, M.; Roman, L.A.; Bassuk, N.; Harper, R.W.; Werner, L.; et al. A rapid urban site index for assessing the quality of street tree planting sites. Urban For. Urban Green. 2017, 27, 279–286. [Google Scholar] [CrossRef]
  20. Mullaney, J. Using Permeable Pavements to Promote Street Tree Growth; University of the Sunshine Coast: Sippy Downs, Austria, 2015; ISBN 1312698837. [Google Scholar]
  21. Ghosh, S.; Scharenbroch, B.C.; Burcham, D.; Ow, L.F.; Shenbagavalli, S.; Mahimairaja, S. Influence of soil properties on street tree attributes in Singapore. Urban Ecosyst. 2016, 19, 949–967. [Google Scholar] [CrossRef]
  22. Dahlhausen, J.; Biber, P.; Rötzer, T.; Uhl, E.; Pretzsch, H. Tree species and their space requirements in six urban environments worldwide. Forests 2016, 7, 111. [Google Scholar] [CrossRef]
  23. Savi, T.; Bertuzzi, S.; Branca, S.; Tretiach, M.; Nardini, A. Drought-induced xylem cavitation and hydraulic deterioration: Risk factors for urban trees under climate change? New Phytol. 2015, 205, 1106–1116. [Google Scholar] [CrossRef] [PubMed]
  24. Hilbert, D.R.; Roman, L.A.; Koeser, A.K.; Vogt, J.; van Doorn, N.S. Urban tree mortality: A literature review. Arboric. Urban For. 2019, 45, 167–200. [Google Scholar] [CrossRef]
  25. Zhang, B.; Brack, C.L. Urban forest responses to climate change: A case study in Canberra. Urban For. Urban Green. 2021, 57, 126910. [Google Scholar] [CrossRef]
  26. Ruiz-Martinez, I.; Marraccini, E.; Debolini, M.; Bonari, E. Indicators of agricultural intensity and intensification: A review of the literature. Ital. J. Agron. 2015, 10, 74–84. [Google Scholar] [CrossRef]
  27. Martin, A.R.; Cadotte, M.W.; Isaac, M.E.; Milla, R.; Vile, D.; Violle, C. Regional and global shifts in crop diversity through the Anthropocene. PLoS ONE 2019, 14, e0209788. [Google Scholar] [CrossRef]
  28. Florence, A.M.; McGuire, A.M. Do diverse cover crop mixtures perform better than monocultures? A systematic review. Agron. J. 2020, 112, 3513–3534. [Google Scholar] [CrossRef]
  29. Salvati, L.; Ferrara, C. The local-scale impact of soil salinization on the socioeconomic context: An exploratory analysis in Italy. Catena 2015, 127, 312–322. [Google Scholar] [CrossRef]
  30. Iwu, C.D.; Korsten, L.; Okoh, A.I. The incidence of antibiotic resistance within and beyond the agricultural ecosystem: A concern for public health. Microbiologyopen 2020, 9, e1035. [Google Scholar] [CrossRef]
  31. Bennett, E.M.; Baird, J.; Baulch, H.; Chaplin-Kramer, R.; Fraser, E.; Loring, P.; Morrison, P.; Parrott, L.; Sherren, K.; Winkler, K.J.; et al. Ecosystem services and the resilience of agricultural landscapes. In Advances in Ecological Research; Academic Press: Cambridge, MA, USA, 2021; Volume 64, pp. 1–43. ISBN 9780128229798. [Google Scholar]
  32. Teshome, D.T.; Zharare, G.E.; Naidoo, S. The Threat of the Combined Effect of Biotic and Abiotic Stress Factors in Forestry under a Changing Climate. Front. Plant Sci. 2020, 11, 1874. [Google Scholar] [CrossRef]
  33. Anderegg, W.R.L.; Hicke, J.A.; Fisher, R.A.; Allen, C.D.; Aukema, J.; Bentz, B.; Hood, S.; Lichstein, J.W.; Macalady, A.K.; Mcdowell, N.; et al. Tree mortality from drought, insects, and their interactions in a changing climate. New Phytol. 2015, 208, 674–683. [Google Scholar] [CrossRef]
  34. IPCC. IPCC Special Report on the Impacts of Global Warming of 1.5 °C; Intergovernmental Panel on Climate Change (IPCC): Geneva, Switzerland, 2018; Volume 2. [Google Scholar]
  35. Siry, J.P.; Cubbage, F.W.; Potter, K.M.; McGinley, K. Current Perspectives on Sustainable Forest Management: North America. Curr. For. Rep. 2018, 4, 138–149. [Google Scholar] [CrossRef]
  36. Nerfa, L.; Rhemtulla, J.M.; Zerriffi, H. Forest dependence is more than forest income: Development of a new index of forest product collection and livelihood resources. World Dev. 2020, 125, 104689. [Google Scholar] [CrossRef]
  37. Pretzsch, H.; Biber, P.; Uhl, E.; Dauber, E. Long-term stand dynamics of managed spruce-fir-beech mountain forests in Central Europe: Structure, productivity and regeneration success. Forestry 2015, 88, 407–428. [Google Scholar] [CrossRef]
  38. Gardner, C.J.; Bicknell, J.E.; Baldwin-Cantello, W.; Struebig, M.J.; Davies, Z.G. Quantifying the impacts of defaunation on natural forest regeneration in a global meta-analysis. Nat. Commun. 2019, 10, 4590. [Google Scholar] [CrossRef] [PubMed]
  39. Escobedo, F.J.; Palmas-Perez, S.; Dobbs, C.; Gezan, S.; Hernandez, J. Spatio-temporal changes in structure for a mediterranean urban forest: Santiago, Chile 2002 to 2014. Forests 2016, 7, 121. [Google Scholar] [CrossRef]
  40. Miesbauer, J.W.; Gilman, E.F.; Masters, F.J.; Nitesh, S. Impact of branch reorientation on breaking stress in Liriodendron tulipifera L. Urban For. Urban Green. 2014, 13, 526–533. [Google Scholar] [CrossRef]
  41. Shigo, A.L.; Marx, H.G. Compartmentalization of Decay in Trees, Department of Agriculture, Forest Service: Washington, DC, USA, 1977; Volume 252.
  42. Boddy, L. Fungal Community Ecology and Wood Decomposition Processes in Angiosperms: From Standing Tree to Complete Decay of Coarse Woody Debris. Ecol. Bull. 2001, 49, 43–56. [Google Scholar]
  43. Paoletti, A.; Rosati, A.; Famiani, F. Effects of cultivar, fruit presence and tree age on whole-plant dry matter partitioning in young olive trees. Heliyon 2021, 7, e06949. [Google Scholar] [CrossRef]
  44. Suvanto, S.; Henttonen, H.M.; Nöjd, P.; Mäkinen, H. Forest susceptibility to storm damage is affected by similar factors regardless of storm type: Comparison of thunder storms and autumn extra-tropical cyclones in Finland. For. Ecol. Manag. 2016, 381, 17–28. [Google Scholar] [CrossRef]
  45. Morel, M.; Meux, E.; Mathieu, Y.; Thuillier, A.; Chibani, K.; Harvengt, L.; Jacquot, J.-P.; Gelhaye, E. Xenomic networks variability and adaptation traits in wood decaying fungi. Microb. Biotechnol. 2013, 6, 248–263. [Google Scholar] [CrossRef]
  46. Fay, N.; de Berker, N. A review of the theory and practice of tree coring on live ancient and veteran trees. Scott. Nat. Herit. 2018, 789, 843. [Google Scholar]
  47. Huang, Y.; Ren, Z.; Li, D.; Liu, X. Phenotypic techniques and applications in fruit trees: A review. Plant Methods 2020, 16, 107. [Google Scholar] [CrossRef] [PubMed]
  48. Leong, E.C.; Burcham, D.C.; Fong, Y.K. A purposeful classification of tree decay detection tools. Arboric. J. 2012, 34, 91–115. [Google Scholar] [CrossRef]
  49. Goh, C.L.; Abdul Rahim, R.; Fazalul Rahiman, M.H.; Mohamad Talib, M.T.; Tee, Z.C. Sensing wood decay in standing trees: A review. Sens. Actuators A Phys. 2018, 269, 276–282. [Google Scholar] [CrossRef]
  50. Pitarma, R.; Crisóstomo, J.; Ferreira, M.E. Contribution to trees health assessment using infrared thermography. Agriculture 2019, 9, 171. [Google Scholar] [CrossRef]
  51. Allison, R.B.; Wang, X. Chapter 7 Nondestructive Testing in the Urban Forest. USDA For. Serv. 2015, 238, 77–86. [Google Scholar]
  52. Giannakis, I.; Tosti, F.; Lantini, L.; Alani, A.M. Diagnosing Emerging Infectious Diseases of Trees Using Ground Penetrating Radar. IEEE Trans. Geosci. Remote Sens. 2020, 58, 1146–1155. [Google Scholar] [CrossRef]
  53. Espinosa, L.; Prieto, F.; Brancheriau, L.; Lasaygues, P. Ultrasonic imaging of standing trees: Factors influencing the decay detection. In Proceedings of the XXII Symposium on Image, Signal Processing and Artificial Vision (STSIVA), Bucaramanga, Colombia, 24–26 April 2019; pp. 1–5. [Google Scholar] [CrossRef]
  54. Soge, A.O.; Popoola, O.I.; Adetoyinbo, A.A. A four-point electrical resistivity method for detecting wood decay and hollows in living trees. Eur. J. Wood Wood Prod. 2019, 77, 465–474. [Google Scholar] [CrossRef]
  55. Ishimwe, R.; Abutaleb, K.; Ahmed, F. Applications of Thermal Imaging in Agriculture—A Review. Adv. Remote Sens. 2014, 3, 128–140. [Google Scholar] [CrossRef]
  56. Dragavtsev, V.; Nartov, V.P. Application of Thermal Imaging in Agriculture and Forestry. Eur. Agrophys. J. 2015, 2, 15. [Google Scholar] [CrossRef]
  57. Still, C.; Powell, R.; Aubrecht, D.; Kim, Y.; Helliker, B.; Roberts, D.; Richardson, A.D.; Goulden, M. Thermal imaging in plant and ecosystem ecology: Applications and challenges. Ecosphere 2019, 10, e02768. [Google Scholar] [CrossRef]
  58. Al-doski, J.; Shattri, B.M.; Helmi-Zulhai, B.M.-S. Thermal Imaging for Pests Detecting—A Review. Int. J. Agric. For. Plant. 2016, 2, 10–30. [Google Scholar]
  59. Asner, G.P.; Martin, R.E.; Keith, L.M.; Heller, W.P.; Hughes, M.A.; Vaughn, N.R.; Hughes, R.F.; Balzotti, C. A spectral mapping signature for the Rapid Ohia Death (ROD) pathogen in Hawaiian forests. Remote Sens. 2018, 10, 404. [Google Scholar] [CrossRef]
  60. Lenthe, J.H.; Oerke, E.C.; Dehne, H.W. Digital infrared thermography for monitoring canopy health of wheat. Precis. Agric. 2007, 8, 15–26. [Google Scholar] [CrossRef]
  61. Chaerle, L.; De Boever, F.; Van Montagu, M.; Van der Straeten, D. Thermographic visualization of cell death in tobacco and Arabidopsis. Plant Cell Environ. 2001, 24, 15–25. [Google Scholar] [CrossRef]
  62. Agam, N.; Cohen, Y.; Berni, J.A.J.; Alchanatis, V.; Kool, D.; Dag, A.; Yermiyahu, U.; Ben-Gal, A. An insight to the performance of crop water stress index for olive trees. Agric. Water Manag. 2013, 118, 79–86. [Google Scholar] [CrossRef]
  63. Struthers, R.; Ivanova, A.; Tits, L.; Swennen, R.; Coppin, P. Thermal infrared imaging of the temporal variability in stomatal conductance for fruit trees. Int. J. Appl. Earth Obs. Geoinf. 2015, 39, 9–17. [Google Scholar] [CrossRef]
  64. Egea, G.; Padilla-Díaz, C.M.; Martinez-Guanter, J.; Fernández, J.E.; Pérez-Ruiz, M. Assessing a crop water stress index derived from aerial thermal imaging and infrared thermometry in super-high density olive orchards. Agric. Water Manag. 2017, 187, 210–221. [Google Scholar] [CrossRef]
  65. Ouledali, S.; Ennajeh, M.; Zrig, A.; Gianinazzi, S.; Khemira, H. Estimating the contribution of arbuscular mycorrhizal fungi to drought tolerance of potted olive trees (Olea europaea). Acta Physiol. Plant. 2018, 40, 81. [Google Scholar] [CrossRef]
  66. Oerke, E.C.; Fröhling, P.; Steiner, U. Thermographic assessment of scab disease on apple leaves. Precis. Agric. 2011, 12, 699–715. [Google Scholar] [CrossRef]
  67. Catena, A.; Catena, G.; Lugaresi, D.; Gasperoni, R.L. Termografia rivela la presenza di danni anche nell’apparato radicale degli alberi. Agric. Ric. 2002, 81–100. [Google Scholar]
  68. Catena, A.; Catena, G. Overview of thermal imaging for tree assessment. Arboric. J. 2008, 30, 259–270. [Google Scholar] [CrossRef]
  69. Bellett-Travers, M.; Morris, S. The relationship between surface temperature and radial wood thickness of twelve trees harvested in nottinghamshire. Arboric. J. 2010, 33, 15–26. [Google Scholar] [CrossRef]
  70. Vidal, D.; Pitarma, R. Infrared thermography applied to tree health assessment: A review. Agriculture 2019, 9, 156. [Google Scholar] [CrossRef]
  71. Zevgolis, Y.G.; Kamatsos, E.; Akriotis, T.; Dimitrakopoulos, P.G.; Troumbis, A.Y. Estimating Productivity, Detecting Biotic Disturbances, and Assessing the Health State of Traditional Olive Groves, Using Nondestructive Phenotypic Techniques. Sustainability 2021, 14, 391. [Google Scholar] [CrossRef]
  72. Zevgolis, Y.G.; Alsamail, M.Z.; Akriotis, T.; Dimitrakopoulos, P.G.; Troumbis, A.Y. Detecting, quantifying, and mapping urban trees’ structural defects using infrared thermography: Implications for tree risk assessment and management. Urban For. Urban Green. 2022, 75, 127691. [Google Scholar] [CrossRef]
  73. Zevgolis, Y.G.; Sazeides, C.I.; Zannetos, S.P.; Grammenou, V.; Fyllas, N.M.; Akriotis, T.; Dimitrakopoulos, P.G.; Troumbis, A.Y. Investigating the effect of resin collection and detecting fungal infection in resin-tapped and non-tapped pine trees, using minimally invasive and non-invasive diagnostics. For. Ecol. Manag. 2022, 524, 120498. [Google Scholar] [CrossRef]
  74. Loumou, A.; Giourga, C. Olive groves: “The life and identity of the Mediterranean”. Agric. Hum. Values 2003, 20, 87–95. [Google Scholar] [CrossRef]
  75. Palaiologou, P.; Kalabokidis, K.; Ager, A.A.; Day, M.A. Development of comprehensive fuel management strategies for reducing wildfire risk in Greece. Forests 2020, 11, 789. [Google Scholar] [CrossRef]
  76. Kosmas, C.; Danalatos, N.G.; Poesen, J.; Van Wesemael, B. The effect of water vapour adsorption on soil moisture content under Mediterranean climatic conditions. Agric. Water Manag. 1998, 36, 157–168. [Google Scholar] [CrossRef]
  77. Blozan, W. Tree measuring guidelines of the eastern native tree society. Featur. Artic. Bull. East. Nativ. Tree Soc. 2006, 1, 1–10. [Google Scholar]
  78. Assmann, E. The Principles of Forest Yield Study: Studies in the Organic Production, Structure, Increment and Yield of Forest Stands; Pergamon: Oxford, UK, 1970; ISBN 9781483150932. [Google Scholar]
  79. Kontogianni, A.; Tsitsoni, T.; Goudelis, G. An index based on silvicultural knowledge for tree stability assessment and improved ecological function in urban ecosystems. Ecol. Eng. 2011, 37, 914–919. [Google Scholar] [CrossRef]
  80. Soares, P.; Tomé, M. GLOBTREE, an individual tree growth model for Eucalyptus globulus in Portugal. In Modelling Forest Systems; Amaro, A., Reed, D., Soares, P., Eds.; CAB International: Wallingford, UK, 2003; pp. 97–110. ISBN 0851996930. [Google Scholar]
  81. Smiley, E.T.; Fraedrich, B.R. Determining strength loss from decay. J. Arboric. 1992, 18, 201–204. [Google Scholar] [CrossRef]
  82. Bréda, N.J.J. Ground-based measurements of leaf area index: A review of methods, instruments and current controversies. J. Exp. Bot. 2003, 54, 2403–2417. [Google Scholar] [CrossRef]
  83. Mezghani, M.A.; Gouta, H.; Laaribi, I.; Labidi, F. Leaf area index and light distribution in olive tree canopies (Olea europaea L.). Int. J. Agron. Agric. Res. 2016, 8, 60–65. [Google Scholar] [CrossRef]
  84. Nicolotti, G.; Gonthier, P.; Guglielmo, F. Advances in Detection and Identification of Wood Rotting Fungi in Timber and Standing Trees. In Molecular Identification of Fungi; Springer: Berlin/Heidelberg, Germany, 2010; pp. 251–276. ISBN 9783642050411. [Google Scholar]
  85. Slippers, B.; Wingfield, M.J. Botryosphaeriaceae as endophytes and latent pathogens of woody plants: Diversity, ecology and impact. Fungal Biol. Rev. 2007, 21, 90–106. [Google Scholar] [CrossRef]
  86. Salman, M. Biological control of Spilocaea oleagina, the causal agent of olive leaf spot disease, using antagonistic bacteria. J. Plant Pathol. 2017, 99, 741–744. [Google Scholar] [CrossRef]
  87. Minkina, W.; Dudzik, S. Algorithm of Infrared Camera Measurement Processing Path. In Infrared Thermography; John Wiley & Sons, Ltd.: Chichester, UK, 2009; pp. 41–60. ISBN 9780470747186. [Google Scholar]
  88. Faye, E.; Dangles, O.; Pincebourde, S. Distance makes the difference in thermography for ecological studies. J. Therm. Biol. 2016, 56, 1–9. [Google Scholar] [CrossRef]
  89. López-Bernal, Á.; Alcántara, E.; Testi, L.; Villalobos, F.J. Spatial sap flow and xylem anatomical characteristics in olive trees under different irrigation regimes. Tree Physiol. 2010, 30, 1536–1544. [Google Scholar] [CrossRef] [PubMed]
  90. Burcham, D.C.; Leong, E.C.; Fong, Y.K.; Tan, P.Y. An evaluation of internal defects and their effect on trunk surface temperature in Casuarina equisetifolia L. (Casuarinaceae). Arboric. Urban For. 2012, 38, 277–286. [Google Scholar] [CrossRef]
  91. Schönauer, M.; Hietz, P.; Schuldt, B.; Rewald, B. Root and branch hydraulic functioning and trait coordination across organs in drought-deciduous and evergreen tree species of a subtropical highland forest. Front. Plant Sci. 2023, 14, 1127292. [Google Scholar] [CrossRef] [PubMed]
  92. Catena, G. A new application of thermography. Atti Fond. Giorgio Ronchi 1990, 45, 947–952. [Google Scholar]
  93. Wong, M.; Tang, H.; Lam, L. Introduction to the Applications of Remote Sensing Techniques on the Tree Health Monitoring; HKIS: Hong Kong, China, 2020. [Google Scholar]
  94. Leverenz, J.W.; Hinckley, T.M. Shoot structure, leaf area index and productivity of evergreen conifer stands. Tree Physiol. 1990, 6, 135–149. [Google Scholar] [CrossRef]
  95. Zarate-valdez, J.L.; Whiting, M.L.; Lampinen, B.D.; Metcalf, S.; Ustin, S.L.; Brown, P.H. Prediction of leaf area index in almonds by vegetation indexes. Comput. Electron. Agric. 2012, 85, 24–32. [Google Scholar] [CrossRef]
  96. Musau, J.; Patil, S.; Sheffield, J.; Marshall, M. Spatio-temporal vegetation dynamics and relationship with climate over East Africa. Hydrol. Earth Syst. Sci. Discuss. 2016, 1–30. [Google Scholar] [CrossRef]
  97. Jonckheere, I.; Fleck, S.; Nackaerts, K.; Muys, B.; Coppin, P.; Weiss, M.; Baret, F. Review of methods for in situ leaf area index determination. Agric. For. Meteorol. 2004, 121, 19–35. [Google Scholar] [CrossRef]
  98. Parker, G.G. Tamm review: Leaf Area Index (LAI) is both a determinant and a consequence of important processes in vegetation canopies. For. Ecol. Manag. 2020, 477, 118496. [Google Scholar] [CrossRef]
  99. Liu, Y.; Ji, D.; Turgeon, R.; Chen, J.; Lin, T.; Huang, J.; Luo, J.; Zhu, Y.; Zhang, C.; Lv, Z. Physiological and proteomic responses of mulberry trees (Morus alba. L.) to combined salt and drought stress. Int. J. Mol. Sci. 2019, 20, 2486. [Google Scholar] [CrossRef] [PubMed]
  100. Van Hees, A.F.M. Growth and morphology of pedunculate oak (Quercus robur L.) and beech (Fagus sylvatica L.) seedlings in relation to shading and drought. Ann. Des Sci. For. 1997, 54, 9–18. [Google Scholar] [CrossRef]
  101. Johnson, D.M.; Wortemann, R.; McCulloh, K.A.; Jordan-Meille, L.; Ward, E.; Warren, J.M.; Palmroth, S.; Domec, J.C. A test of the hydraulic vulnerability segmentation hypothesis in angiosperm and conifer tree species. Tree Physiol. 2016, 36, 983–993. [Google Scholar] [CrossRef]
  102. Kim, Y.; Rahardjo, H.; Tsen-Tieng, D.L. Stability analysis of laterally loaded trees based on tree-root-soil interaction. Urban For. Urban Green. 2020, 49, 126639. [Google Scholar] [CrossRef]
  103. Kim, Y.; Rahardjo, H.; Tsen-Tieng, D.L. Mechanical behavior of trees with structural defects under lateral load: A numerical modeling approach. Urban For. Urban Green. 2021, 59, 126987. [Google Scholar] [CrossRef]
  104. Kopaczyk, J.M.; Warguła, J.; Jelonek, T. The variability of terpenes in conifers under developmental and environmental stimuli. Environ. Exp. Bot. 2020, 180, 104197. [Google Scholar] [CrossRef]
  105. Dias, M.C.; Azevedo, C.; Costa, M.; Pinto, G.; Santos, C. Melia azedarach plants show tolerance properties to water shortage treatment: An ecophysiological study. Plant Physiol. Biochem. 2014, 75, 123–127. [Google Scholar] [CrossRef] [PubMed]
Figure 1. Study sites on the island of Lesvos (dotted rectangles in the main map): (1) the area encompassing the four urban parks, (2a) the olive grove in the Pyrgi region, (2b) the olive grove in the Agiasos region, and (3) the area including the twenty forest plots within the central pine forests of the island.
Applsci 13 09493 g001
Figure 2. Sample infrared images depicting the tree trunks of the five tree species and the main methodological procedure for extracting their temperatures using the ArcGIS Analysis toolbox: (a) refers to the calibrated images after being imported in the TESTO IRSoft® (v. 4.3) software with the temperature palette applied; (b) refers to the trees’ trunk after polygon creation using shapefile format. These images showcase various types of defects and/or wood-decay fungi present in the trunks, including cavities in R. pseudoacacia and O. europaea, wounds in M. alba and P. brutia, and the presence of rotten bark in M. azedarach.
Applsci 13 09493 g002
Figure 3. Box plots showing the (a) TIQR and (b) TOPR z-score values regarding the five tree species. Horizontal lines: medians; boxes: interquartile ranges (25–75%); whiskers: data ranges.
Applsci 13 09493 g003
Figure 4. Box plots showing the (a) TIQR, (b) TOPR, (c) LAImean, and (d) LAIrange z-score values regarding trees with cavities, other defects, and with no signs of defects. Horizontal lines: medians; boxes: interquartile ranges (25–75%); whiskers: data ranges.
Applsci 13 09493 g004
Figure 5. Correlation matrix showing the relationships between the trees’ architectural and vitality traits with the trunk thermal indices. Red and blue colors indicate negative and positive correlations, respectively, while intensity of color indicates the strength of the relationship. All correlation coefficients above 0.20 or below −0.20 are statistically significant (p < 0.05).
Applsci 13 09493 g005
Table 1. Architectural and vitality traits of the five tree species (N = 543).
Phenotypic TraitsR. pseudoacacia
(N =174)
M. alba
(N = 65)
M. azedarach
(N = 48)
O. europaea
(N =80)
P. brutia
(N = 176)
MeanSDMeanSDMeanSDMeanSDMeanSD
H (m)6.151.657.573.068.223.127.252.7414.044.18
DBH (cm)41.019.7040.2311.3328.6810.6774.4115.4537.159.94
CR0.660.120.740.080.710.120.650.090.350.10
CA (m2)33.4713.7625.4511.3723.7214.5551.7824.6946.3633.8
Cavities (ratio)0.020.030.030.030.030.060.050.040.030.04
VD (cm)15.1413.3813.4111.156.828.5012.8811.2336.0739.56
HD (cm)37.9144.5621.8422.5921.1230.4818.5613.319.068.64
ID (cm)14.2513.8913.0013.826.879.7714.159.334.564.61
SL (%)18.9927.6529.8342.9524.4847.1018.929.516.375.582
FP (%)−30.4937.39−17.9316.24−24.6634.53−37.1218.23−6.966.42
LAImean2.210.761.850.832.010.722.141.011.050.43
LAIcav2.060.91.710.951.850.771.80.860.920.59
LAInon-cav2.360.721.980.822.180.752.451.471.180.51
LAIrange0.460.470.490.470.360.462.441.120.550.48
Table 2. Statistical comparisons between trees with defects and healthy trees at the species level for various indices. The table shows t-values and p-values for each index, indicating significant differences between the two groups. TIQR: interquartile temperature range, TOPR: temperature outer percentile range, LAImean: leaf area index mean, LAIrange: leaf area index range. Significant differences are denoted by p < 0.05.
Tree SpeciesIndicest-Valuedfp-Value
R. pseudoacaciaTIQR−4.9863.79<0.05
TOPR−4.9963.87<0.05
LAImean7.6573.64<0.05
LAIrange−3.3946.22<0.05
M. albaTIQR−6.1360.50<0.05
TOPR−6.1460.46<0.05
LAImean5.8329.27<0.05
LAIrange−1.8816.65<0.05
M. azedarachTIQR−3.3843.06<0.05
TOPR−3.3743.06<0.05
LAImean3.7045.10<0.05
LAIrange−2.3345.98<0.05
O. europaeaTIQR−3.778.48<0.05
TOPR−2.796.08<0.05
LAImean3.736.27<0.05
LAIrange−1.637.01>0.05
P. brutiaTIQR−13.99172.24<0.05
TOPR−6.48137.41<0.05
LAImean5.83132.05<0.05
LAIrange−3.52152.92<0.05
Table 3. Final models obtained from weighted least squares regression analyses for estimating LAI. All regression models were statistically significant (p < 0.05). The table shows the slope of the predictor variable for the response variable (B), the standard error for the slope (SE B), the standardized beta (β), the t-test statistic (t), the probability value (p), the regression-adjusted coefficient for the regression model (R2), and the predictive capability of the models (F).
Trees ClassificationResponse VariablePredictor VariablesBSE Bβtp-ValueR2 adj.F
All five speciesLAImean(constant)−0.130.04 −3.260.0010.45128.24
TIQR−0.50.03−0.52−14.160.001
LAIrange−0.230.07−0.12−3.370.001
SL−0.230.03−0.23−6.650.001
DeciduousLAImean(constant)0.220.06 3.570.0010.54115.44
TIQR−0.250.09−0.15−2.650.008
LAIrange−0.410.07−0.21−5.360.001
SL−0.440.04−0.55−9.660.001
EvergreenLAImean(constant)−0.550.04 −13.210.0010.3597.15
TIQR−0.290.03−0.59−9.850.001
Table 4. Logistic regression models for the prediction of the presence of defects, cavities, and fungal infestation in the total trees of the five species under study (N = 543). Β = logistic coefficient; S.E. = standard error of estimate; Wald = Wald chi-square; df = degree of freedom; p-value = significance.
(a) Defects
PredictorΒS.E.Wald’s χ2dfp-Value
TIQR3.030.4740.7510.001
LAIcav−1.290.3215.6510.001
CA2.670.5225.5210.001
Constant2.090.3632.3510.001
(b) Cavities
TIQR2.090.3143.7010.001
TOPR−0.570.216.8710.001
LAIcav−1.000.1540.3410.001
LAIrange1.490.2147.3210.001
Constant1.130.1743.1310.001
(c) Fungal infestation
TIQR2.090.2758.6210.001
LAIcav−1.350.2138.2110.001
LAIrange0.880.2019.3710.001
Constant−0.640.1615.3410.001
Disclaimer/Publisher’s Note: The statements, opinions and data contained in all publications are solely those of the individual author(s) and contributor(s) and not of MDPI and/or the editor(s). MDPI and/or the editor(s) disclaim responsibility for any injury to people or property resulting from any ideas, methods, instructions or products referred to in the content.

