1. Introduction
The practice of telemedicine, which provides healthcare to people all over the world, has been simplified by developments in computing and communication technologies [
1,
2]. One of the key advances that is making this possible is the development of the Digital Imaging and Communications in Medicine (DICOM) standard. Medical images—the foundation of diagnosis—are stored and transmitted via the DICOM format [
3]. The current version of the standard is 2022d, but changes are backward-compatible as the standard is normally updated five times per year. DICOM allows the exchange of images without internal image formats using metadata and defines imaging workflow information objects for images, patients’ studies, reports, etc. Once an image object is defined by the standard, DICOM-compliant devices can interact with information systems to schedule diverse workflows.
Although DICOM has been widely used in radiology, pathology was added later to its scope [
4]. Despite the fact that DICOM promises imaging standards-based pathology, its clinical application is limited. No FDA-approved digital pathology system generates DICOM natively; only one high-performance WSI diagnostic device has been approved for use in Asia and Europe. Furthermore, there is no IHE profile defined for microscopy, as is the case in radiology [
5,
6], and the size of the WSI produced by digitizing microscope slides is much larger than images from radiology. Thus, a Picture Archiving and Communication System (PACS) will find it challenging to save and handle WSI images. To work with WSI samples, the DICOM WG26 (DICOM Pathology Working Group 26) defined two supplements, Supplement 122 and Supplement 145. Supplement 122 outlines how pathology specimen attributes are used in the pathology department imaging workflow to identify samples, and Supplement 145 describes how to use DICOM-standard messaging to store WSI attributes and images in PACSs. In this regard, a scalable and effective DICOM-WSI online viewer was proposed in [
7] and demonstrated in several Digital Pathology Connectathons [
8,
9]. Among other data management components, it consists of a PACS to store the WSI pictures and a DICOM-based web viewer. Recent research has proposed an automated DICOMization pipeline that can efficiently convert distinct proprietary microscope images from WSI scanners into standard DICOM with their biological information preserved in their metadata [
10,
11], as well DICOM WSI visualization [
12,
13] and other efficient architectures for telemedicine [
14]. However, none of these works have demonstrated integration with both PACS and AI models yet.
In addition to telemedicine, computer-aided diagnosis (CAD) systems are used to analyze and evaluate medical images [
15]. CADs are used to highlight suspicious areas and measure anatomic structures to support professionals’ decisions while analyzing an image. These systems combine AI, computer vision and image processing techniques. The use of AI in CAD systems has been validated in several studies [
16,
17] in radiology, whereas the situation contrasts that of WSI. Although some CAD systems have been proposed in the literature for WSI images, including recent open-source software libraries providing custom [
18,
19,
20], and generic end-to-end APIs for pathology image analysis, such as QuPath [
21], PathML [
19], HEAL [
22], HistoCartography [
23], CLAM [
24] and TIAToolbox [
25], to the best of our knowledge, none of them has been integrated in a DICOM environment. Only one development, EMPAIA, has tried to integrate all parts of the pathology ecosystem [
26]. However, as the authors state, tests were carried out executing a very simple AI app and platform development is still ongoing. Other projects, such as Cytomine [
27] or ASAP [
28], lack PACS integration or state-of-the-art AI methods and other proposals have not been developed yet [
29].
In this work, the integration of AI deep learning methods within a WSI web viewer that can be used in telemedicine and access stored WSI in DICOM format has been carried out. The use of AI methods leverages the application’s capability to be used as a CAD. To achieve this, the architecture of the viewer presented by the authors in [
7] has been modified to include an inference module able to access the DICOM WSI images and obtain the results applying the available deep learning methods, while maintaining the original features that allow navigation through the different scanned images and magnification levels. We have demonstrated its interoperability with different PACS vendors in Digital Pathology Connectathons [
8,
9]. This new module, denominated as
DPL, allows us to run the developed models on a CPU or GPU, simplifying the requirements to integrate it into any server but also allowing us to improve the inference speed in case an NVIDIA GPU is available. This module has been demonstrated to be capable of running state-of-the-art CNN models over WSI patches extracted from a dicomized WSI stored in a PACS.
Furthermore, the viewer has been modified to access both the WSI images and inference results to visualize them. We also demonstrate the capabilities of the proposed approach to add different types of convolutional neural networks and topologies trained using different frameworks, in this case Caffe and Pytorch, to solve a variety of pathology problems and to provide different types of outputs. To the best of our knowledge, this is the first time that deep learning AI capabilities in a WSI visualization system have been demonstrated.
Although there is an increasing trend to specify how to access medical data to train AI methods [
30,
31,
32], the proposed approaches have not been implemented for WSI yet. Thus, to train and test our CNNs, we have extracted patches from the WSI vendor format, i.e., before converting them to DICOM and storing them in the PACS. Although this can be seen initially as a drawback, it validates the results obtained by the proposed application by ensuring that the process of converting WSIs to DICOM and accessing them through the viewer does not affect the inference process.
The following section defines the original viewer and the datasets used to train the models integrated into the proposed implementation. Next, the viewer’s architecture, the models trained to test it and the integration process are shown. Finally, the main conclusions are summarized.
2. Materials and Methods
2.1. Architecture of the Proposed System
Visilab Viewer [
7] is a web platform developed and integrated alongside a proposed web architecture that adheres to the DICOM definition. A specific module was defined to prepare the information for the pyramid structure proposed in DICOM [
33]. A second module uses the same structure to aggregate the adjacent tiles or frames of the current user’s viewport into the cache browser in order to achieve fast and fluent navigation over the tissue slide. The individual tiles of a single WSI pyramid level are stored as individual frames in a DICOM multi-frame image object, which is the primary mechanism for the storage of DICOM WSI. A tile with a unique reference number indicating its distinct level and x and y coordinates inside the pyramid can be retrieved.
Figure 1 shows the WSI organization and structure developed. From the end user’s perspective, all that is required is to retrieve the web application and begin querying data consisting of DICOM slides. Queries are not sent directly to the PACS using the DICOM messaging protocol, but rather through an intermediary web server interface between the PACS and Visilab Viewer. This strategy provides scalability in terms of connectivity with other architectures or PACS systems.
Before reaching the PACS system, client viewer queries will pass through two layers. The first layer manages the main services that connect Visilab Viewer to the remaining system, which stores raw data. If the proposed PACS system architecture is used, a second layer with its own API management is provided. This layer includes the capability of converting proprietary format slides into DICOM objects. The user can upload new slides from the web viewer. The results of their DICOM conversions are also saved in the PACS at the back-end layer.
Each frame number within an instance corresponds to a specific tile within the pyramid structure. Because this information is not stored outside of the PACS, it is not directly accessible. The web client must first understand the internal structure of the slide within a frameset structure. The pyramid structure defined in DICOM Supplement 145 is followed by the proposed visualization method. The Structure Constructor module retrieves slide frame information directly from the PACS and creates a new object structure containing the location coordinates of all frames organized within the pyramid by level, row and column. This first module stores the object in the client storage when it is finally created. Second, the Tiling Cache Aggregator module is responsible for the real-time querying of this information object in order to prepare and load the next promising areas that the user may explore into the browser cache.
Table 1 shows the Supplement 145 supported parts.
Figure 2 shows the complete architecture of the system. In particular, the integration of the DPL deep learning module implemented in Docker allows the viewer to provide the functionality to include the different types of CNNs for execution from the viewer using the DICOM format images generated by the other modules. This module can run the inference both on a normal CPU and on an NVIDIA GPU if available.
The API architecture uses Flask as the REST API, Waitress as the WSGI server and PyTorch as the library for inference using deep learning techniques, due to the fact that it is widely used both in research and commercially, and because of the possibility of importing models from other frameworks. In order for the CNNs to be able to infer, it is necessary to obtain the tiles that conform to the image at a certain magnification and split them into patches of the size required by the CNN, and, finally, the inference will be performed by applying a diagnostic rule.
It was decided to develop the server that manages the DPL module using Python 3 and Flask as it natively allows us to respond to multiple requests at the same time. This allows the system to be able to have several users simultaneously or to receive different requests from the same user. This server consists of the following endpoints:
getAvailableModels: Retrieves a list of all available inference models.
inferUsingModel: Receives a list of URLs to tiles and a model to perform inference.
getClassificationResults: Accesses inference results with an ID provided by the same server.
getHeatmap: Returns a heatmap of the WSI and overlays the inference results on the WSI by setting the channel.
getModelParameters: Retrieves the model parameters.
getAvailableViews: Retrieves the types of outputs of each model.
As can be observed, the inferUsingModel endpoint does not return the results of the inference. It was decided to follow this approach since, in some cases, this process could take up to several minutes, reaching the point where the connection would time out. To solve this problem, the inferUsingModel endpoint returns a JSON object containing a Universally Unique Identifier (UUID), such as uuid: “bd4181cc-780e-4963-b35c-df476b58ee03”, which identifies the inference process to subsequently be able to access the results using the getClassificationResults or getHeatmap endpoints, also retrieving a JSON object with the UID and the structure containing the final results; in the case of getClassificationResults, an example would be (result: null, status: “Classifying”, uuid: “bd4181cc-780e-4963-b35c-df476b58ee03”).
Regarding the models, the framework used is Pytorch stored in the path specified in the models_folder variable of the constants.py file contained in the application. Inside this folder, the following files will be present.
*.pth—File storing the architecture and weights of the CNN.
mean.npy—File storing the media to be subtracted.
labels.txt—List of all classes that can be assigned by the CNN.
params.json—JSON file containing the following attributes: {patch_width, patch_height, nclasses (number of classes), X_class index for each class, starting with for the background}.
diagnosis.py—Python 3 code file containing the code that performs the diagnostic once the results of the inference of the patches are obtained; it contains the diagnosis function with the following parameters: (i) results—list of lists that contain the class assigned to each patch and the probability that it is the correct class; (ii) nclasses—number of possible classes; and (iii) labels—labels assigned by CNN.
diagnosis_rule—Internal function that performs the diagnosis.
The DPL inference server can be configured to use either the CPU or an NVIDIA GPU. This configuration is set in the Viewer/envs/dpl.env file, in which the following two parameters are found: (i) USE_GPU, a boolean value where 1 indicates GPU usage and 0 indicates CPU usage; (ii) GPU_DEVICE, to identify the GPU to be used. By default, the value of this parameter is cuda:0, corresponding to the first NVIDIA GPU detected by the system. In order to use the GPU, nvidiadocker version 2 must be installed. On the other hand, version 20.10 of docker and 1.29 for docker-compose are required as a minimum, which allows the system to run the NVIDIA runtime as configured in the docker-compose.yaml file.
2.2. Datasets
Images from various hospitals and diagnostic tissues must be used to demonstrate the system’s compatibility. To accomplish this, a dataset composed of 153 cases of invasive and in situ ductal breast cancer carcinomas was used. There were 54 incisional biopsies and 99 excisional biopsies. The biopsies and WSIs were prepared and acquired by four centers, Nottingham University Hospital (NHS Trust), Vilniaus Universiteto Ligonine Santaros Klinikos (VULSK), Servicio de Salud de Castilla La Mancha (SESCAM) and Servicio Andaluz de Salud (SAS), as part of the AIDPATH project [
35]. All specimens were stained with hematoxylin and eosin (H&E), human epidermal growth factor receptor 2 (HER2) and Ki-67 antigen-specific monoclonal antibody (Ki67) using standard procedures.
Breast cancer was chosen as a use case due to its high prevalence. It was also reasonable to include samples of the three stains chosen for this study due to their importance in histopathological diagnosis and prognosis. One of the most common tissue stains used in histology is the H&E stain. It is the most commonly used stain in medical diagnosis and is frequently used as the gold standard. Pathologists usually stain histological sections of suspected cancer biopsies with H&E. H&E is an abbreviation for hematoxylin and eosin, two histological stains. Cell nuclei are stained a purplish blue by hematoxylin, and the extracellular matrix and cytoplasm are stained pink by eosin, with other structures taking on different hues and color intensities. Thus, a pathologist can easily differentiate between a cell’s nuclear and cytoplasmic components, and the overall color of the stain reveals the tissue sample’s cell arrangement and distribution.
In addition, immunohistochemical (IHC) staining is commonly used in the diagnosis of abnormal cells, such as those found in cancerous tumors. Specific molecular markers are associated with specific cellular events, such as proliferation or apoptosis. The HER2 and Ki67 IHC markers, in particular, are extremely important in cancer prognosis. HER2 oncogene overexpression has been linked to the development and progression of certain aggressive types of breast cancer. In recent years, HER2 has emerged as a critical biomarker and therapeutic target for approximately 30% of breast cancer patients. Patients with HER2 amplification in breast cancer have a more aggressive form of the disease, as well as greater resistance to conventional treatments. Ki67, on the other hand, is a cellular marker for proliferation. Thus, Ki67 is an excellent marker for determining the growth fraction of a cell population. Ki67 identifies a high proliferative subset of patients with estrogen receptor-positive breast cancer who can benefit more from adjuvant chemotherapy. The percentage of Ki67-positive tumor cells (the Ki67 labeling index) is frequently linked to cancer progression.
All the WSIs were acquired at 20× and 40× magnification. The digital scanning was performed using a Hamamatsu NanoZoomer C9600 (TIF format) for the NHS Trust and a Leica DM-4000 (SVS format) for SESCAM and SAS. During standard and quality-measured routines, pathologists from the NHS Trust, VULSK, SESCAM and SAS provided the ground truth. At least two specialists reviewed and labeled each case. All the images had an average resolution of 90,000 × 50,000 pixels and 1GB file size in a proprietary format.
From the HER2 IHC test, a score of 0 to 3+ was assigned to each sample depending on the amount of HER2 protein stained. A score of 0 to 1+ is considered as HER2-negative. A score of 2+ is regarded as being on the borderline. A 3+ score is defined as HER2-positive. In addition, hotspot localization and quantification of IHC Ki67-positive staining are crucial. The aggressiveness of a breast tumor is indicated by a high proportion of Ki67-positive staining in a biopsy, which also suggests a higher proliferation rate of the tumor. Pathologists typically use a hotspot area with 500 to 2000 tumor cells in randomly selected high-magnification fields to visually determine the proliferation rate [
36,
37]. As a result, locating and quantifying hotspot sites and determining the proliferation rate are difficult and time-consuming tasks.
Figure 3 shows the visualization of various WSI samples from various biopsies stained with H&E, Ki67 and HER2, as well as the selection of regions of interest (ROI) on the WSIs using the editing tools of the viewer.
3. Results
3.1. DICOM Inference WSI Web Viewer
A viewer in which it is possible to perform inference on the image stored in the PACS has been implemented. The workflow to apply the models is as follows.
The user selects the model that he/she wants to run from the available models and the type of result to be obtained or view types, i.e., the possible outputs for displaying the results, which is a heatmap or bounding boxes when appropriate (
Figure 4).
The user clicks on the Run button and the viewer zooms in to the magnification required by the model to make the inference. The default value is 20×, which displays the message “Please move to the desired area” in the text box and in a pop-up window, as shown in
Figure 5.
Once the message has been displayed, all forms of zoom in the viewer are disabled so that the user can move to the desired area.
Once the user is in the desired zone, he/she presses the Run button again and the viewer sends the tile paths to the inference server.
The message “Waiting for a server response” will be displayed while the viewer waits for the inference server to complete the process.
Once the process is completed, the corresponding result will be displayed.
3.2. Models
Three different models were integrated in the viewer to test their behavior under different types of problems: HER2 grading, Ki67 index proliferation and tumor area detection in H&E WSIs.
3.2.1. HER2 Model
The model selected in this work was proposed by the Visilab group of the University of Castilla-La Mancha and was the winner of the HER2 contest [
38]. It performed the patch-wise grading of HER2 whole slide images (WSI) with four scores, i.e., 0, 1, 2+ and 3+. Thus, four different tissue classes and one background class can be identified.
The dataset used to train the grading model consisted of extracted patches from the original slides. Each patch was 64 × 64 pixels in size and was taken from the left to right and top to bottom of the image, with 64 pixels for striding in the height and width directions, so that the patches did not overlap.
Table 2 displays the exact number of samples for each dataset, as well as the number of samples in each fold (training, test and validation) and grading class.
Regarding the models trained, five convolutional neural network (CNN) architectures were tested: AlexNet (AN), GoogLeNet (GN), VGG-16 (VGG), ResNet-101 (RN) and DenseNet-201 (DN). Data augmentation was used to help model generalization. In this case, we employed spatial transformations and color standardization. In the case of spatial transformations, vertical and horizontal flips and rotations of 90º, 180º and 270º were applied. A color standardization analysis was performed following previous research [
39] and Macenko’s method (MM) [
40] was used with six different reference color images to generate variations on the remaining images. “Standardizing” and increasing the number of color variations helps to cover a wider range of cases present in different staining and digitalization processes.
Augmentation based on rotation and flips improves the results, but color variation also improves the results significantly, most notably in complex models such as DenseNet and ResNet. An average sensitivity of 0.86 was obtained using color standardization, data augmentation and the ResNet-101 architecture (see
Table 3).
3.2.2. H&E Model
The H&E data were divided into three classes: tumor, non-tumor and background areas.The WSIs were split into patches of size 299 by 299 pixels and divided between the training, validation and test subsets, preserving all patches from the same WSI in the same set, as shown in
Table 4.
Four well-known CNN architectures were trained with the patches: MnasNetV1, GoogLeNet, InceptionV3 and ResNeXt. The best results were obtained by GoogLeNet, with almost a 10% accuracy (ACC) difference with regard to the worst results obtained by MnasNet.
Table 5 shows the results obtained.
3.2.3. Ki67 Model
The Ki67 model was trained to classify samples into six classes. One of the classes represented patches from the background of the image, whereas the rest of them defined an interval corresponding to the percentage of Ki67-positive tumor cells. Similarly to the other datasets, all WSIs were annotated by pathologists, giving each region a Ki67 labeling index (percentage score). The training patch size was also 299 by 299 pixels and the dataset was divided into training, validation and test subsets, preserving all patches from the same WSI in the same set (see
Table 6).
In this case, five CNN architectures were trained: ResNet18, GoogLeNet, InceptionV3, DenseNet121 and VGG11. The best results were obtained by InceptionV3, with average accuracy of 87%.
Table 7 shows the results obtained. Models that use joint information from the H&E image, as we described in [
37], can improve these results by up to 95%. Nevertheless, we have not integrated this method because both samples (Ki67 and H&E) are not always available.
3.3. Deep Learning Model Integration
As previously mentioned, the framework integrated within the DICOM Inference WSI Web Viewer to execute the inference processes is Pytorch. Because of this, it was necessary to have the models trained in .pth format using this framework, or to transform them to it.
In the case of the models trained for the H&E and Ki67 datasets, Pytorch was used; therefore, they were integrated directly into the viewer, while the HER2 model was developed using Caffe, a previous step being necessary using the MMdnn to transform them into the required format. This procedure was performed by first transforming the original model into an intermediate representation, and then converting it into the required framework.
In addition, each model can generate different types of outputs, requiring the implementation of different types of views that enable us to handle them in a particular manner. Specifically, the views implemented for each of the models are contained in the following JSON file, pacsvolume/views/views.json, which includes an entry for each of the possible views. The contained key is the view identifier, which must be added to the view parameter listing of the params.json file. The value of each view includes another key–value dictionary in which the only mandatory key is the description, whose value is the word that appears in the list of available views when a model is selected.
The description and identifier of the views cannot be modified a priori, since they are the identifiers used to guide the execution of the inference server. The views currently available in the viewer are the following.
Text: It displays the outcome in the result text box. The processing is limited to the zoomed-in region selected by the user, performing a single inference and classifying it as appropriate. This view is available for the HER2 model. Some examples are illustrated in
Figure 6.
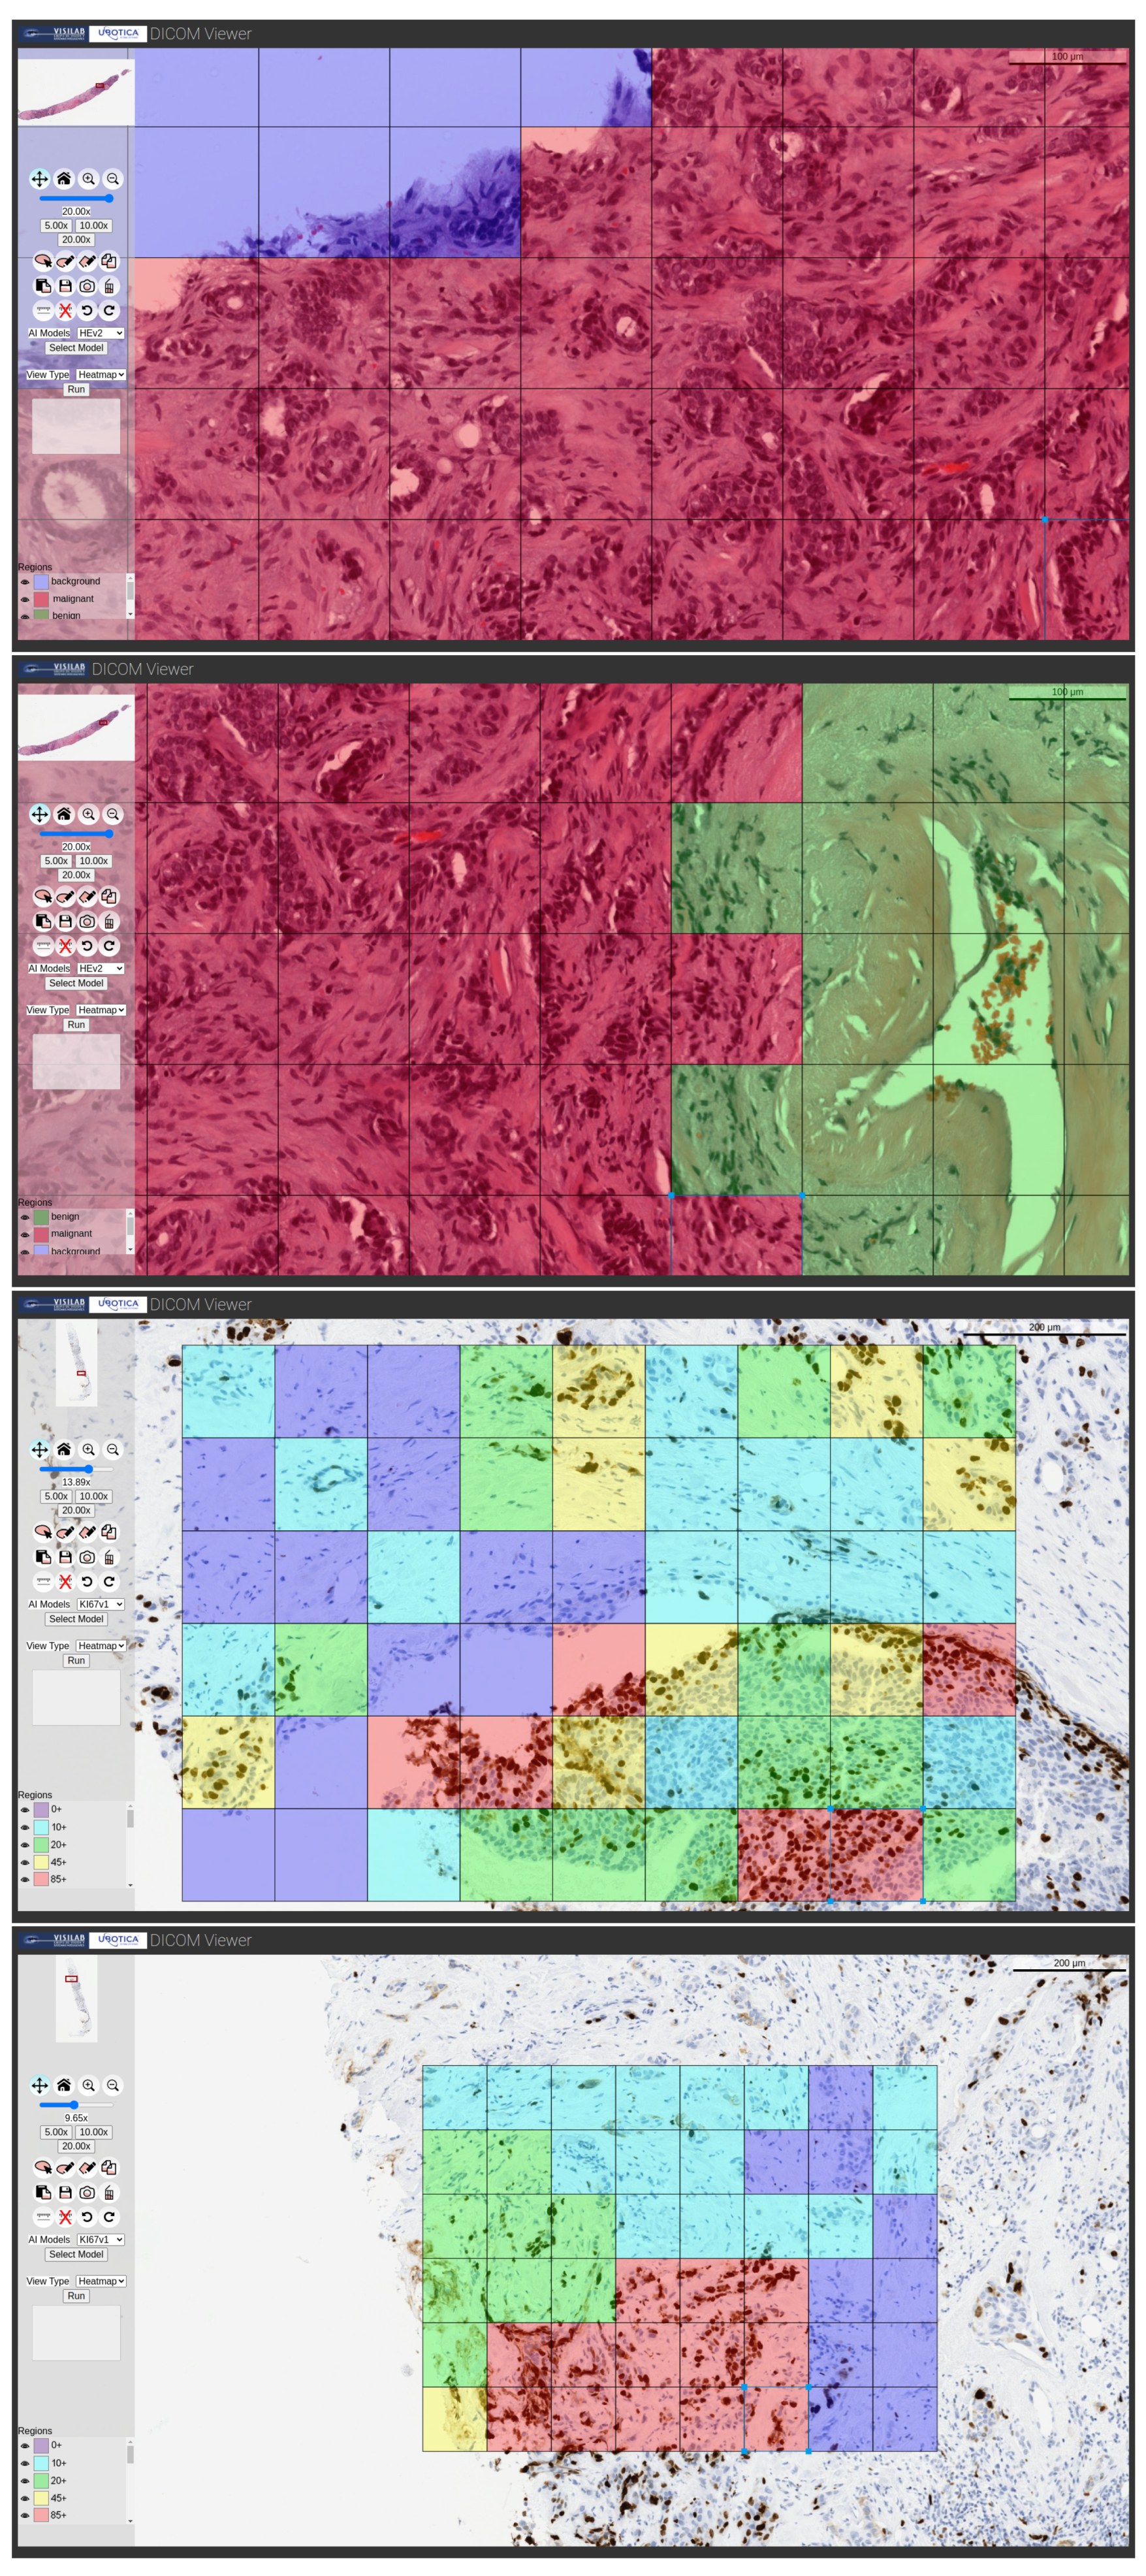
Heatmap: The classification of each of the analyzed patches is depicted on a heatmap. The processing is localized to the user-marked augmented region, but, in this case, a tiling process is carried out in which each patch has the input size of the neural network. Each of the individually obtained patches is subjected to the inference procedure, resulting in the generation of a map that shows the classification of each patch. This view is offered for the H&E and Ki67 models. Some examples are illustrated in
Figure 7.
Figure 6.
Examples of HER2 model processing showing different outcomes with text type outputs.
Figure 6.
Examples of HER2 model processing showing different outcomes with text type outputs.
Figure 7.
Examples of H&E and Ki67 model processing showing the outcomes with heatmap type output.
Figure 7.
Examples of H&E and Ki67 model processing showing the outcomes with heatmap type output.
In
Figure 8, we can finally observe the results that would be obtained by applying the system to an entire WSI, and how the results would compare with the original labeling performed by a specialized pathologist.
3.4. Inference Stress Test
A study was performed to determine the maximum number of concurrent inferences that can be executed simultaneously using the proposed approach. For this purpose, and to demonstrate that the architecture of the system permits us to work in a constrained scenario, this experiment was conducted using only a standard personal computer with the characteristics shown in
Table 8, always attempting to test its performance in the worst-case scenario.
To determine the maximum number of concurrent users, CPU and RAM usage was recorded every 0.5 s. Then, the usage baseline was recorded with only the deployed but idle servers. Afterwards, a script that simulated a typical workflow of a user using Selenium as the browser driver was executed. This value was computed by comparing the median and maximum values with the baseline while running the same script.
The inference experiment involved using the HE model to infer four different areas of several images at the same time. Inference was performed on the CPU to achieve the worst possible performance. This could be improved using the GPU.
Table 9 shows the baseline metrics and the metrics during the execution. Comparing the baseline and the execution data, it can be concluded that the system could have up to 10 concurrent inference processes in this particular setup [
41].
Finally,
Figure 9 shows the CNN inference times of MnasNet, GoogLeNet, InceptionV3 and ResNeXt in ms per patch for both the GPU and CPU.
4. Conclusions
The main contribution of this article is the definition of a novel DICOM web viewer for digital pathology, which allows for the integration of all different types of deep learning techniques running on the DICOM WSI. The primary goal of the DICOM viewer with the integration of AI models is providing pathologists with a decision support tool. Additionally, this viewer is the first of its class to perform image inference, accessing DICOM images stored in a PACS system. Furthermore, an architecture that is capable of adjusting to the evolving needs of WSI processing has been defined. This architecture makes it possible to scale the system from a personal computer to high-performance GPU servers.
In order to demonstrate the adaptability of the system, different topologies of convolutional neural networks have been trained with WSI datasets stained with HER2, H&E and Ki67. These networks have then been integrated into the viewer, and their performance at an operational level has been demonstrated.
Thus, the DICOM image processing and visualization system in histopathology presented here can be used as a tool to integrate any deep learning model applied to digital pathology; the examples presented here are related to one of the most prevalent diseases, breast cancer. However, other AI models applied to other diseases can be incorporated. In future work, we will train and integrate new topologies in order to improve the assisted diagnosis functionalities provided by the viewer.
Since the definition of the IHE profile for pathology is still ongoing, some work will need to be carried out in the future to adapt the proposed application to the new requirements. In addition, explainable artificial intelligence (xAI) is becoming more important nowadays in health systems [
42,
43]. Thus, it would be convenient to integrate into the application the ability to produce saliency maps in addition to the AI model output.


 ,
, 


