Late Quaternary Activity Studies on the Lintong–Chang’an Fault Zone in the Weihe Graben, Central China, Using Combined Techniques

 ,
,
Abstract
:1. Introduction
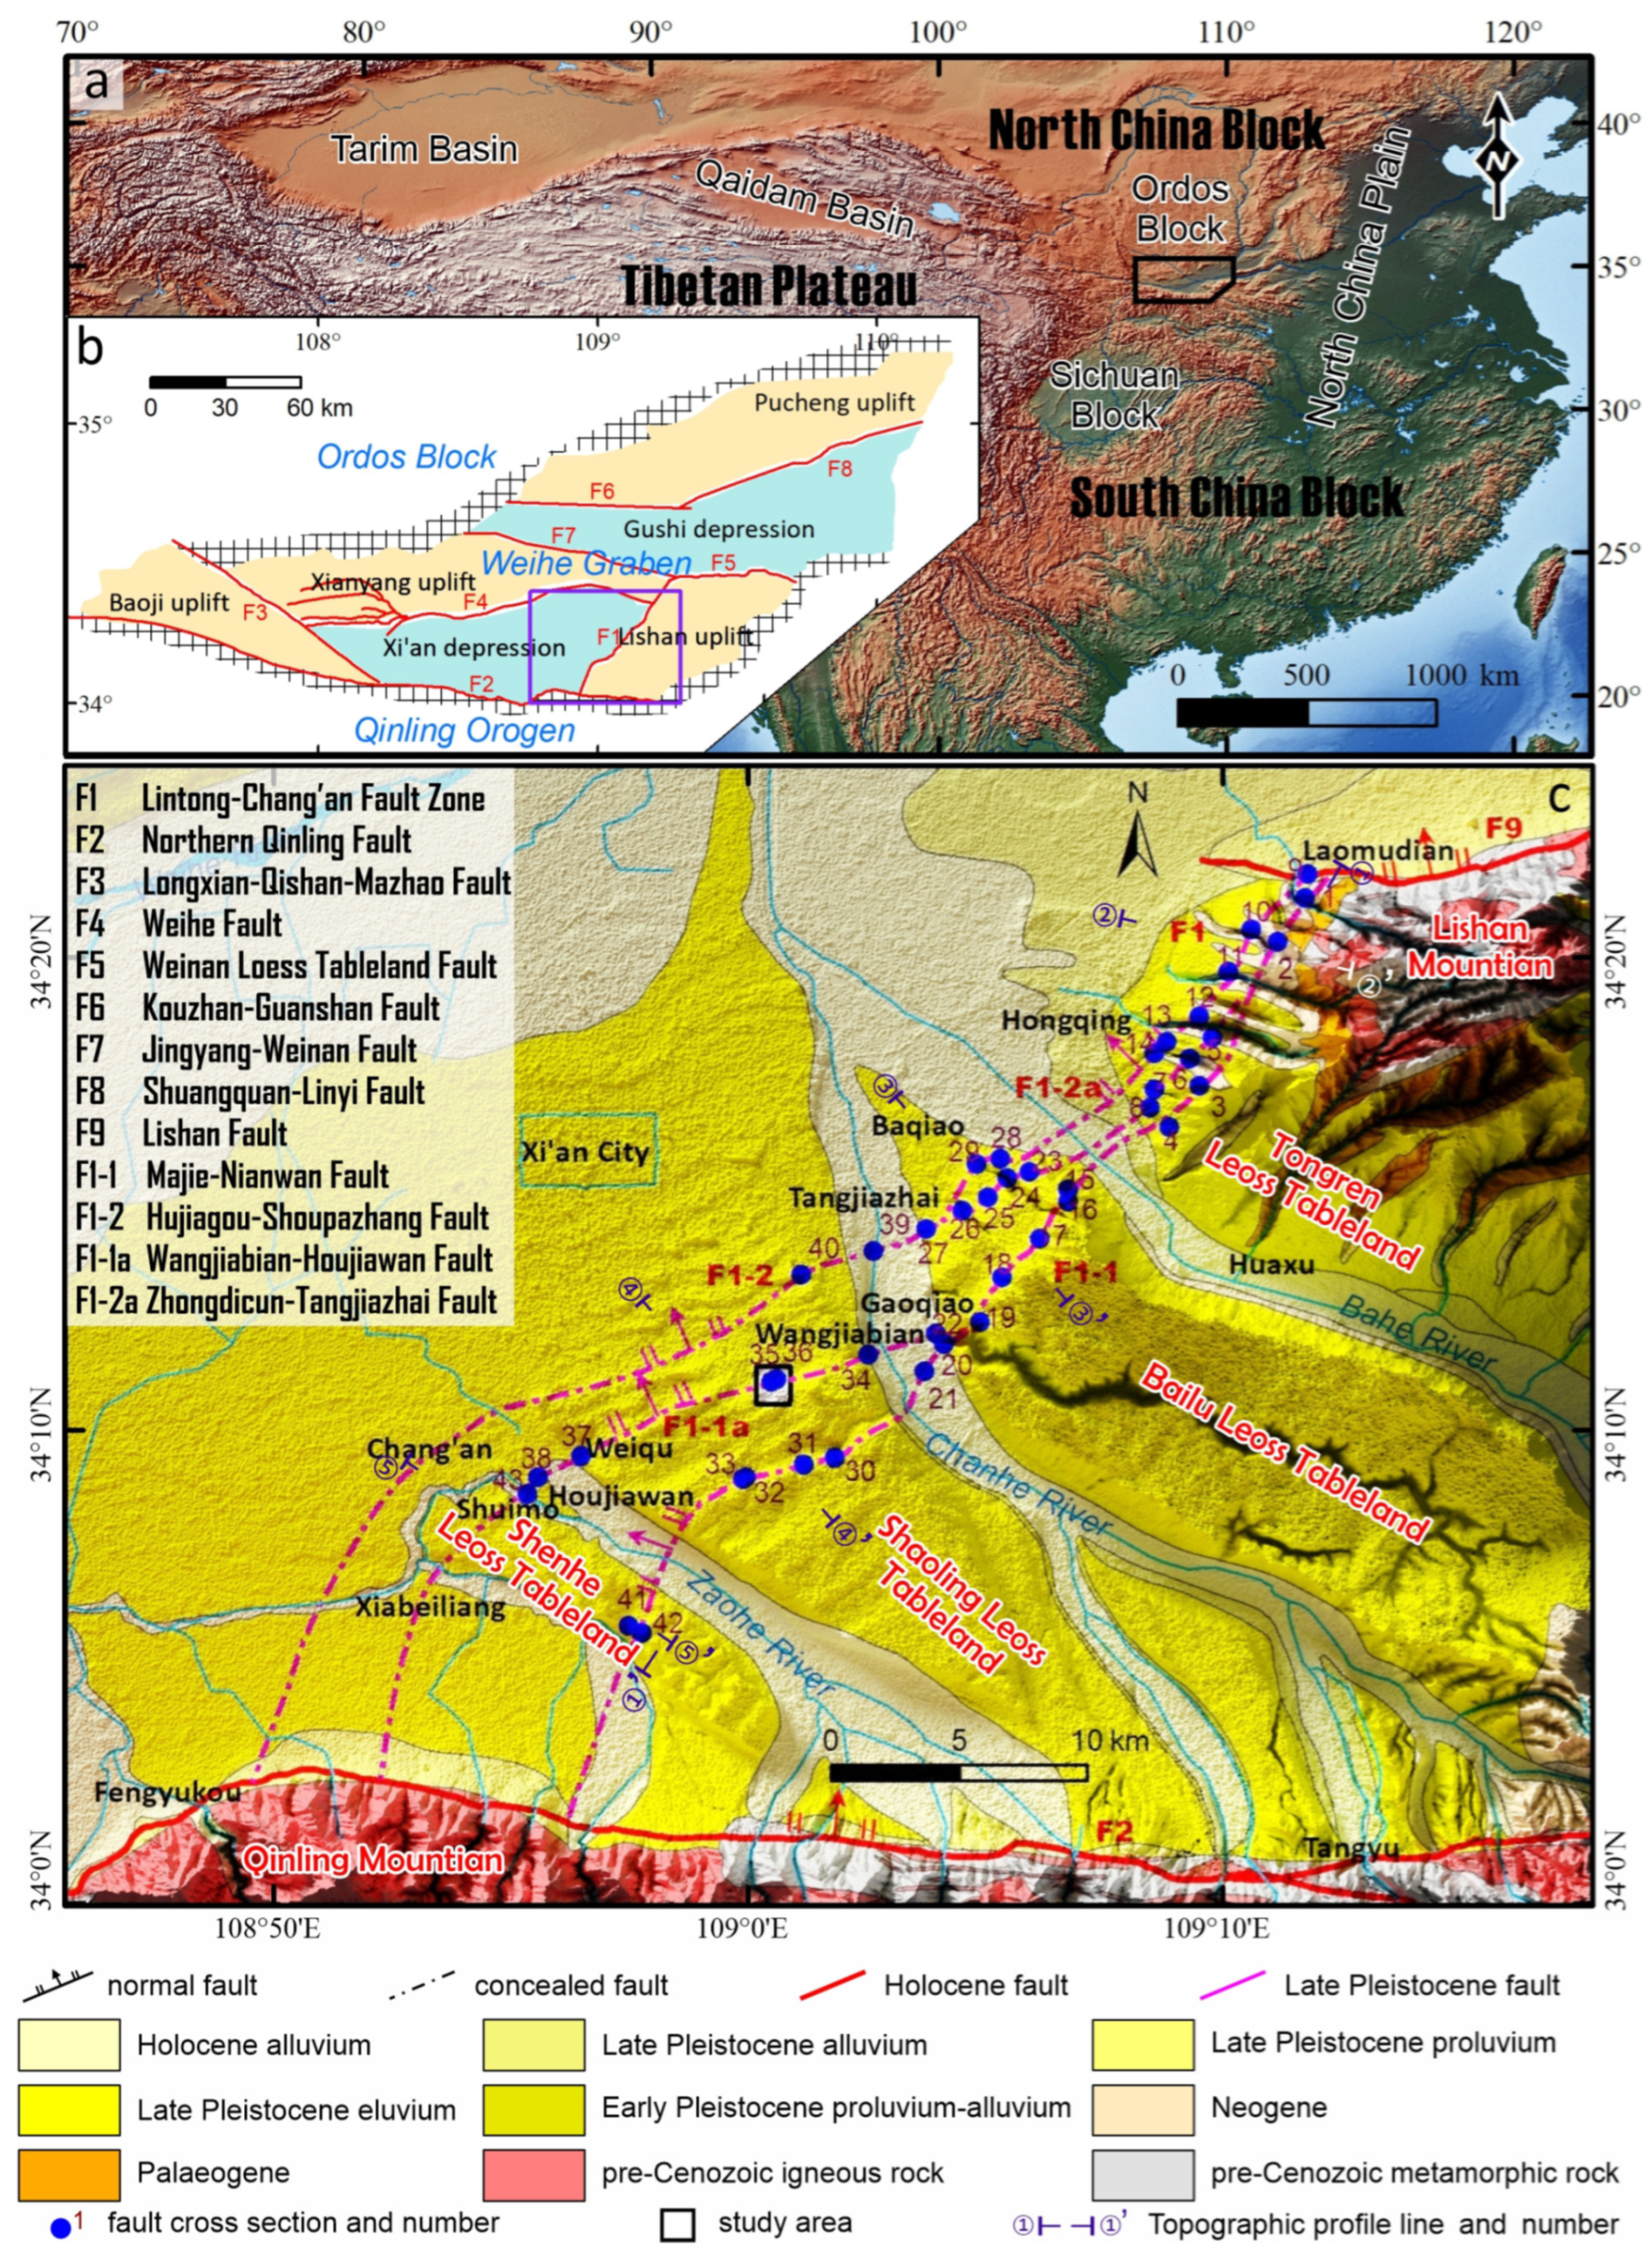
2. Tectonic Settings
3. Methods
3.1. Remotely Sensed Imagery
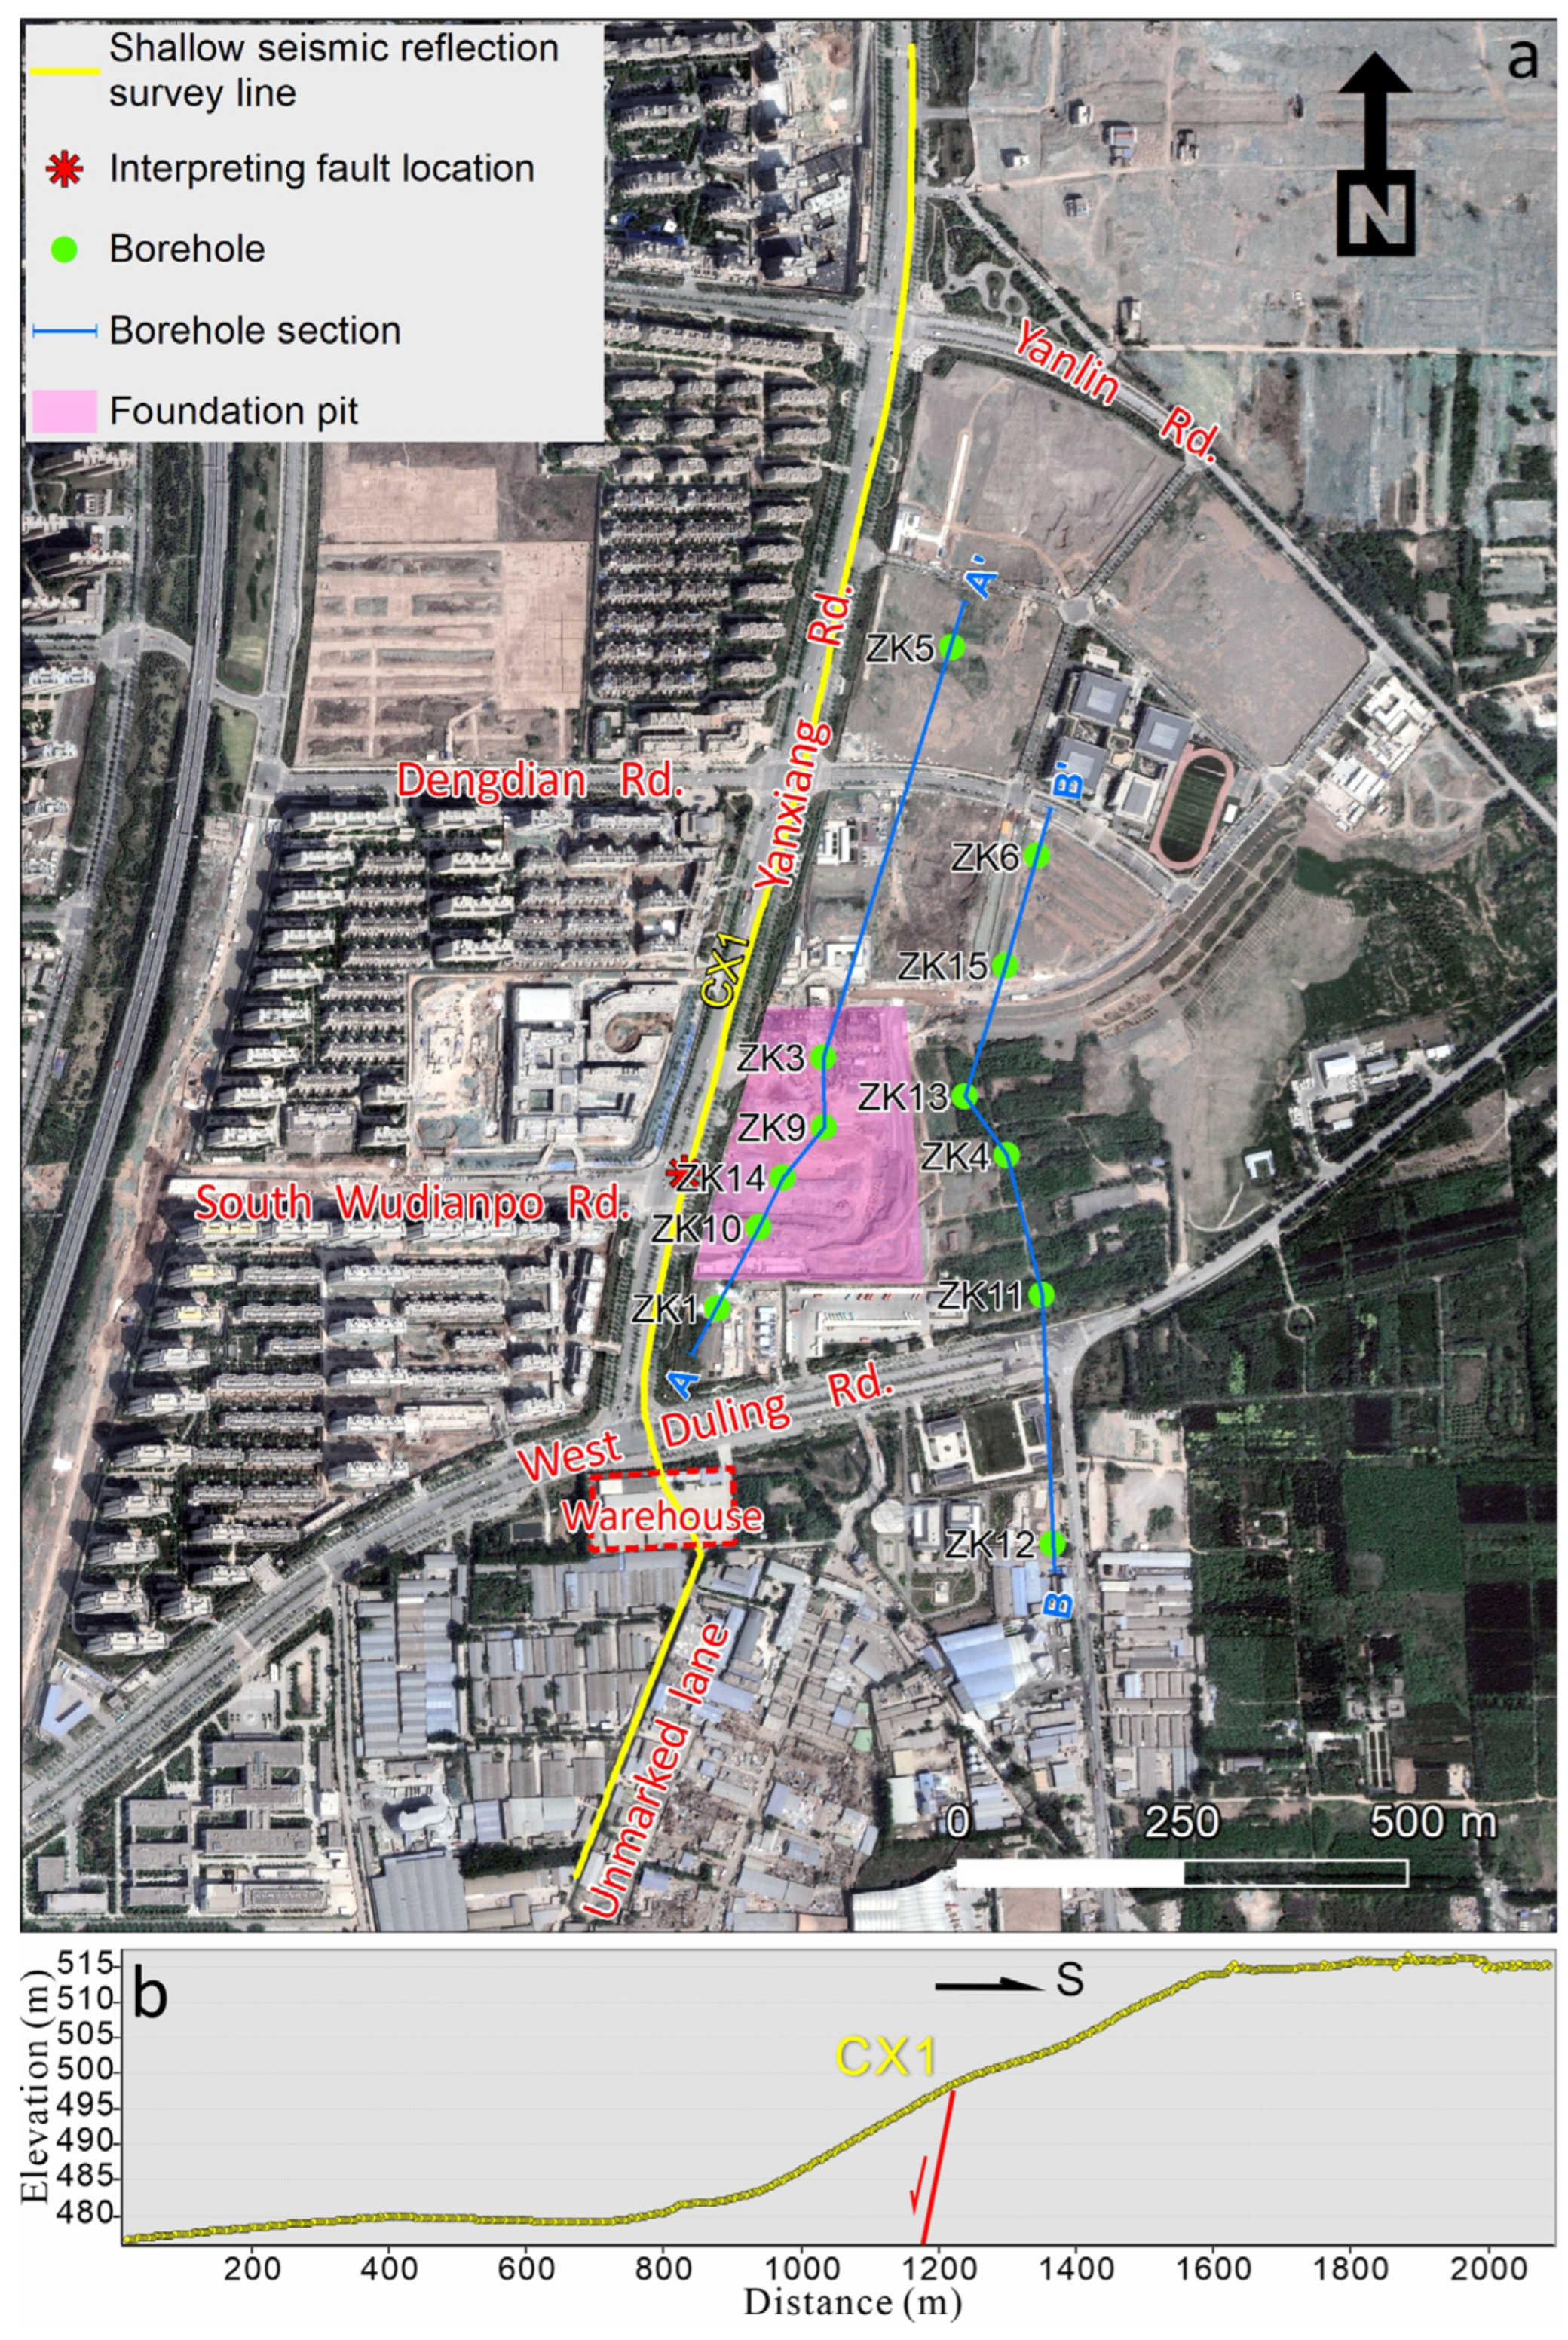
3.2. Shallow Seismic Reflection Survey
3.3. Drilling
3.4. Excavation Profiles of a Foundation Pit
4. Results
4.1. Shallow Seismic Reflection Profile
4.2. Drilling Profiles
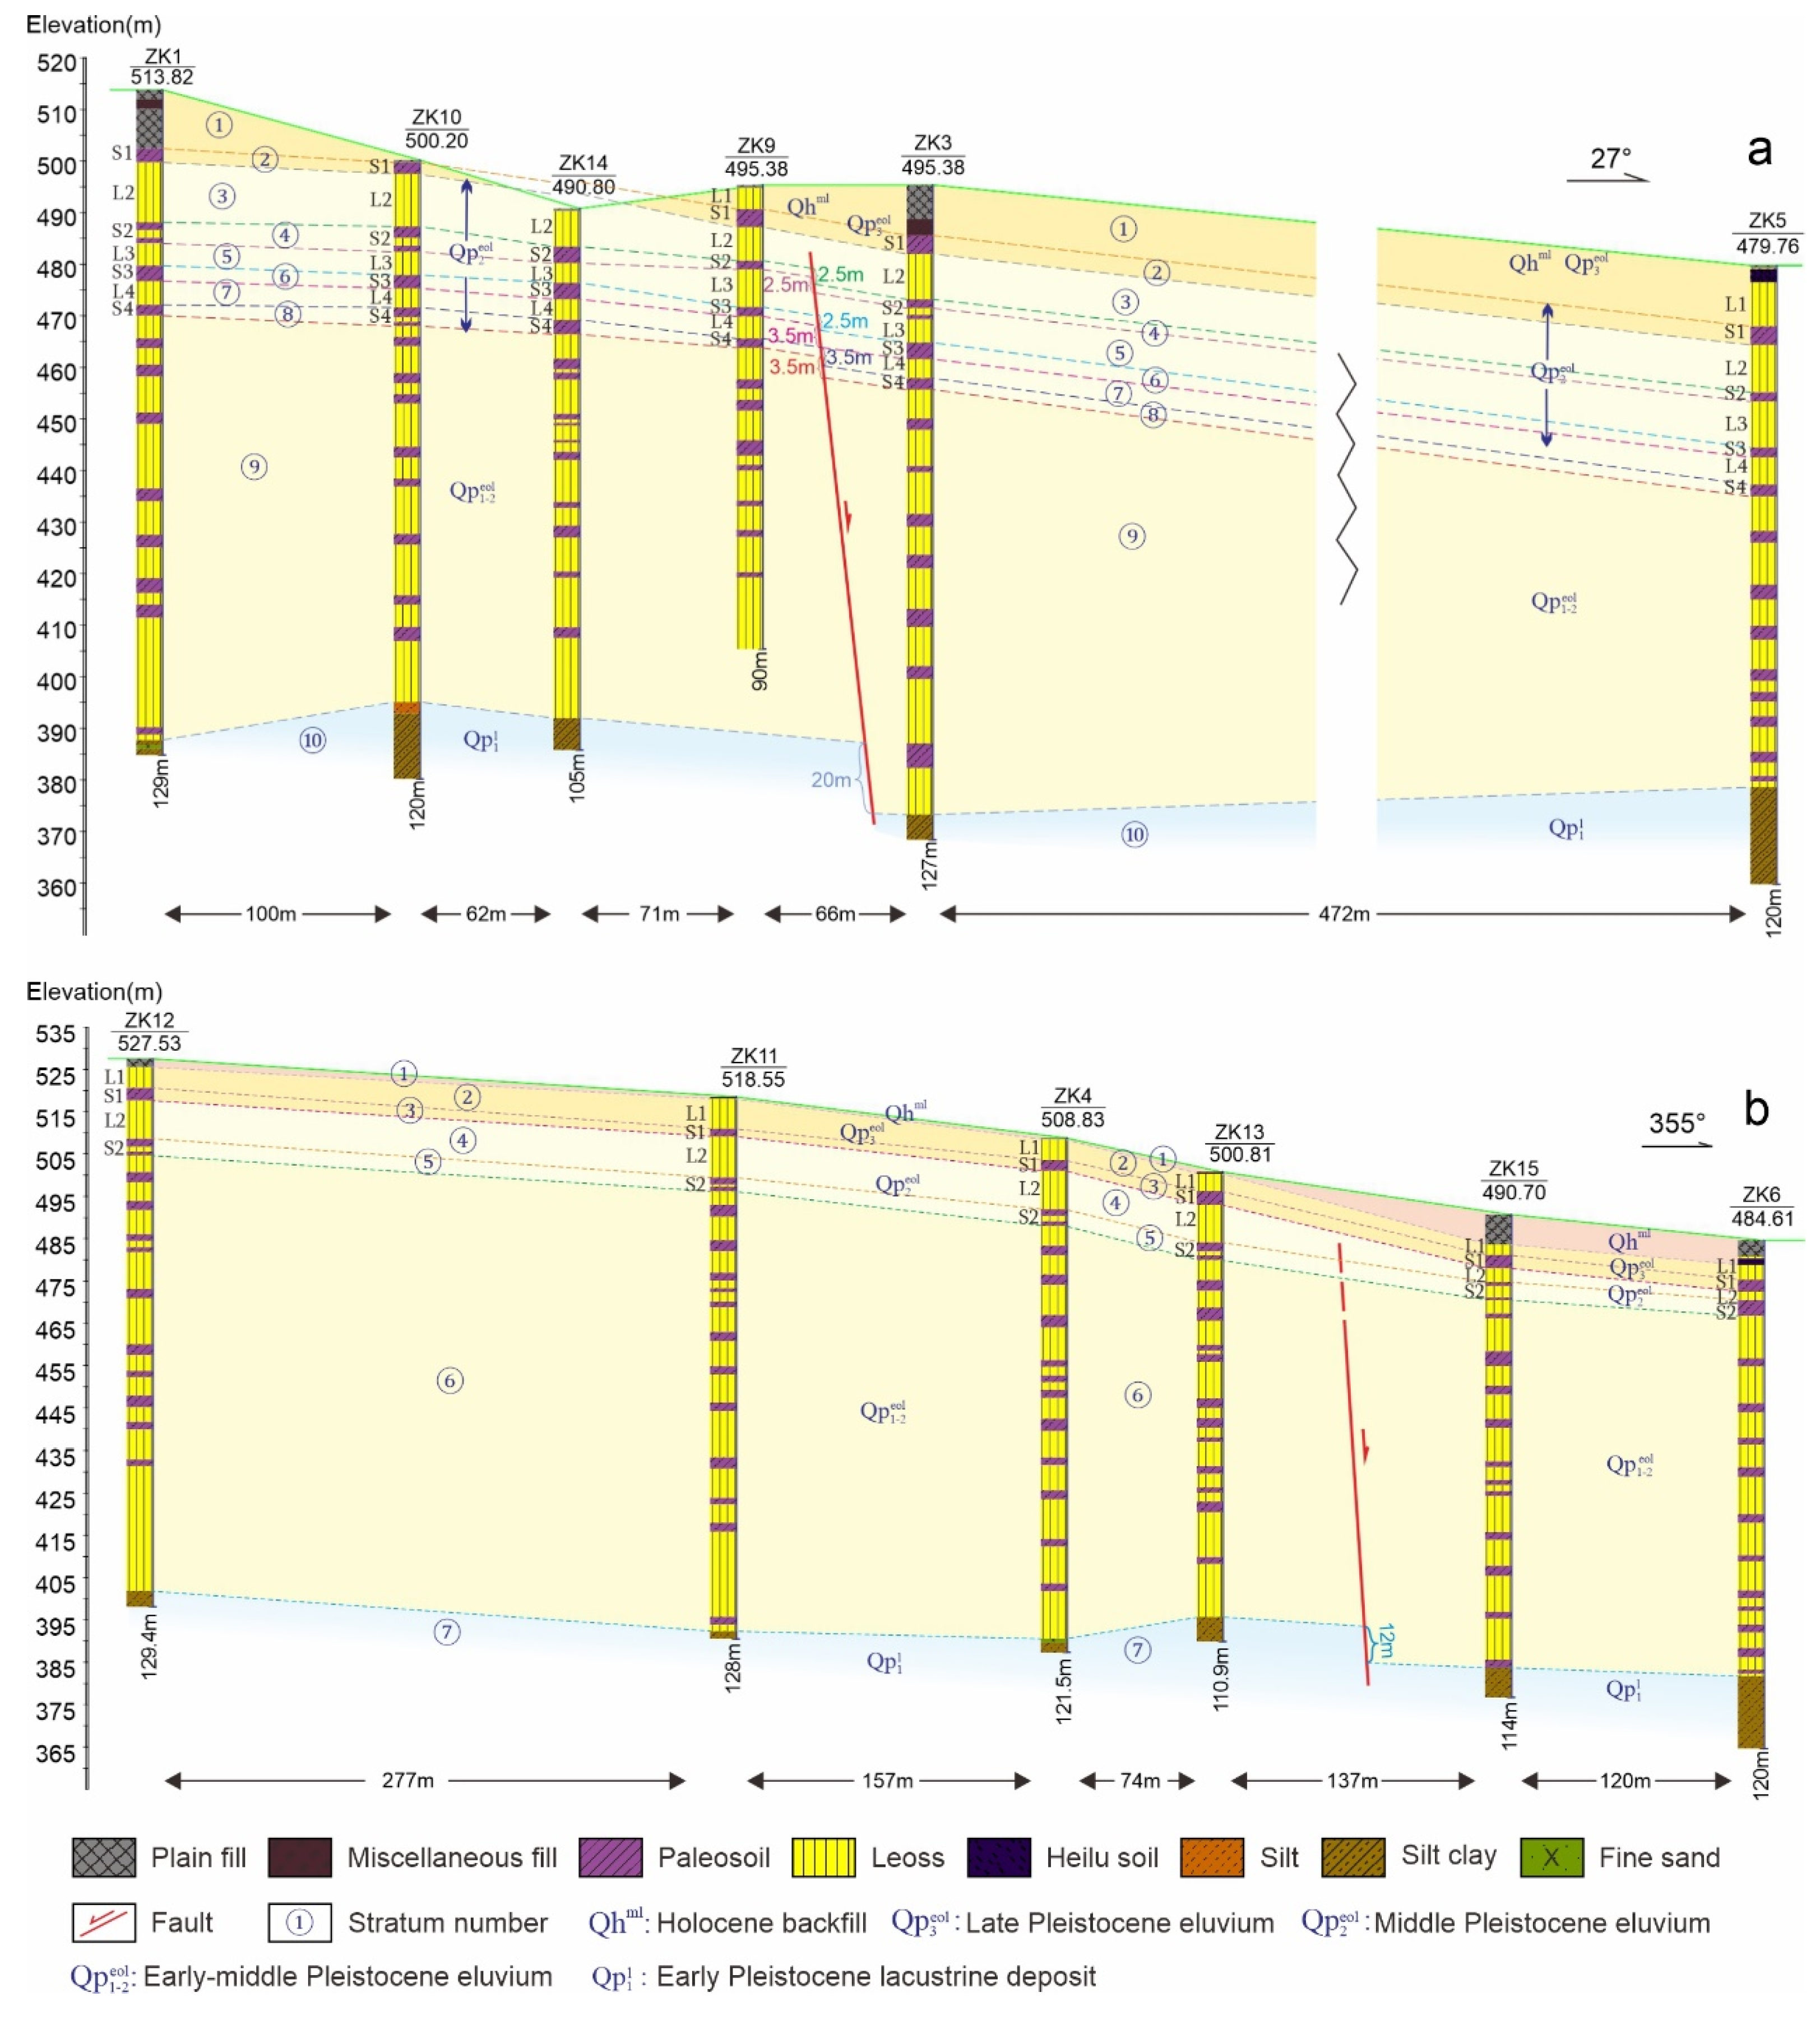
4.2.1. Profile A–A′
4.2.2. Profile B–B′
4.2.3. Marker Layers and Fault Analysis
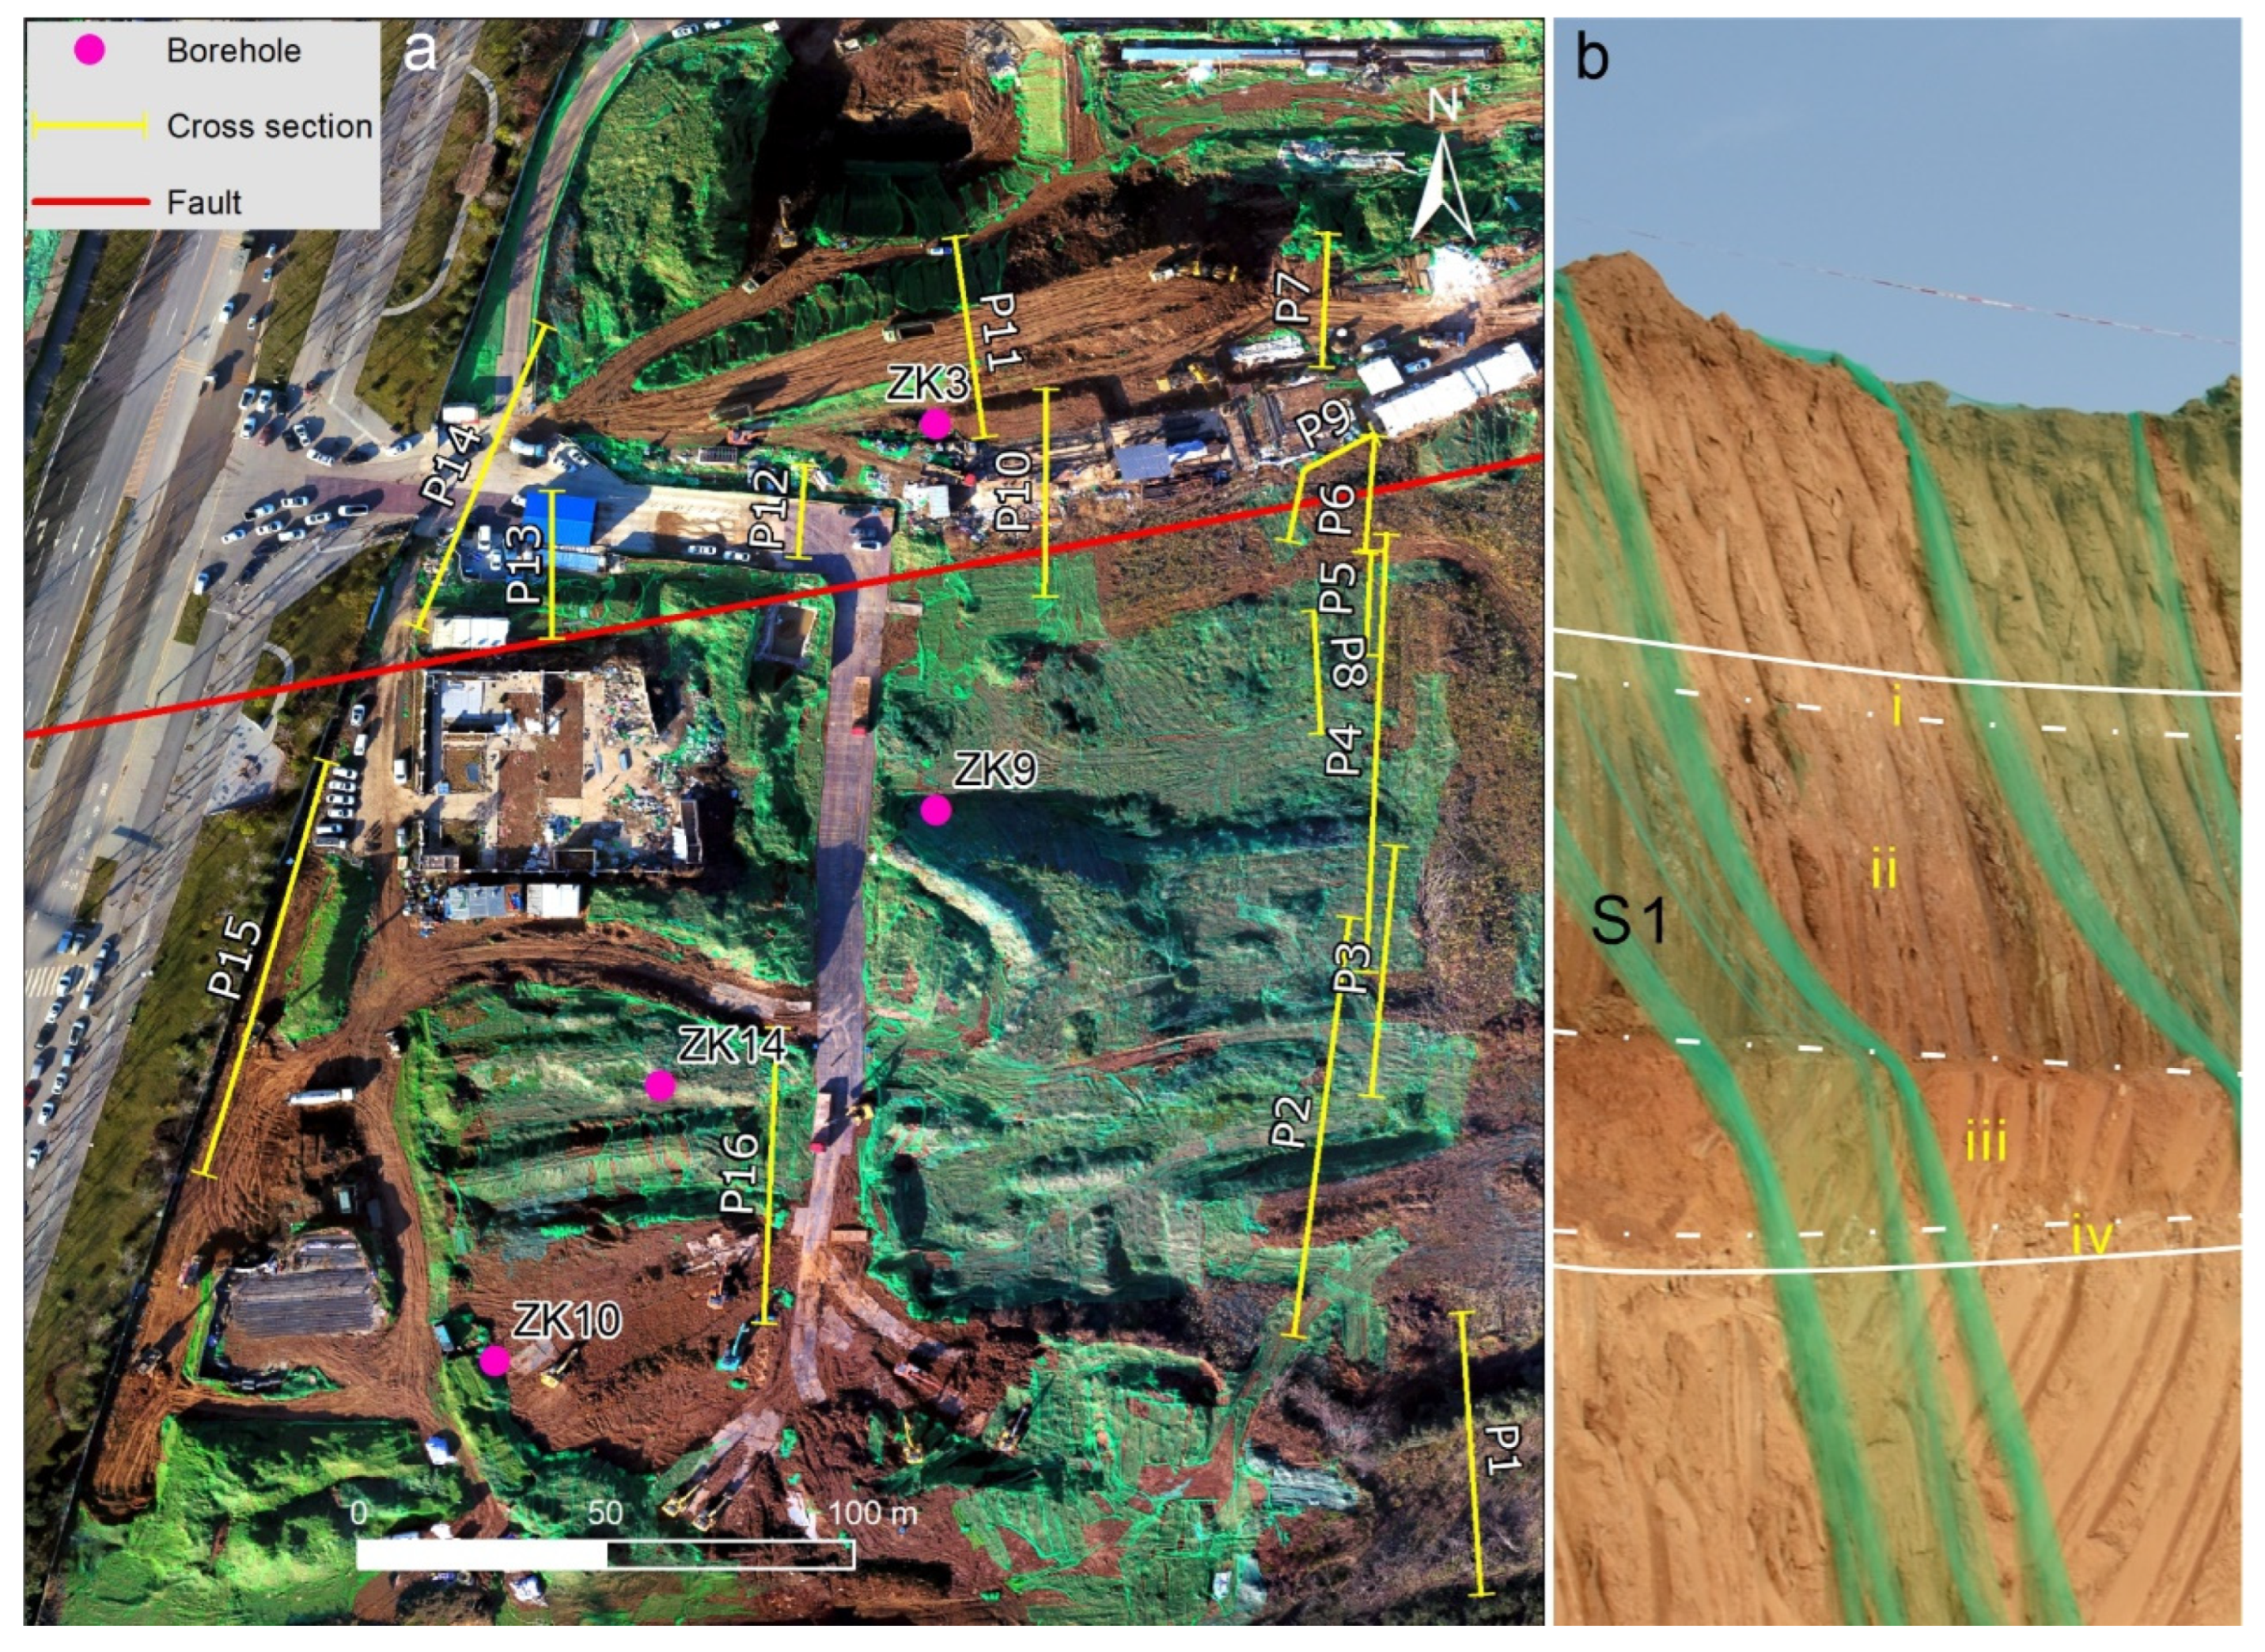
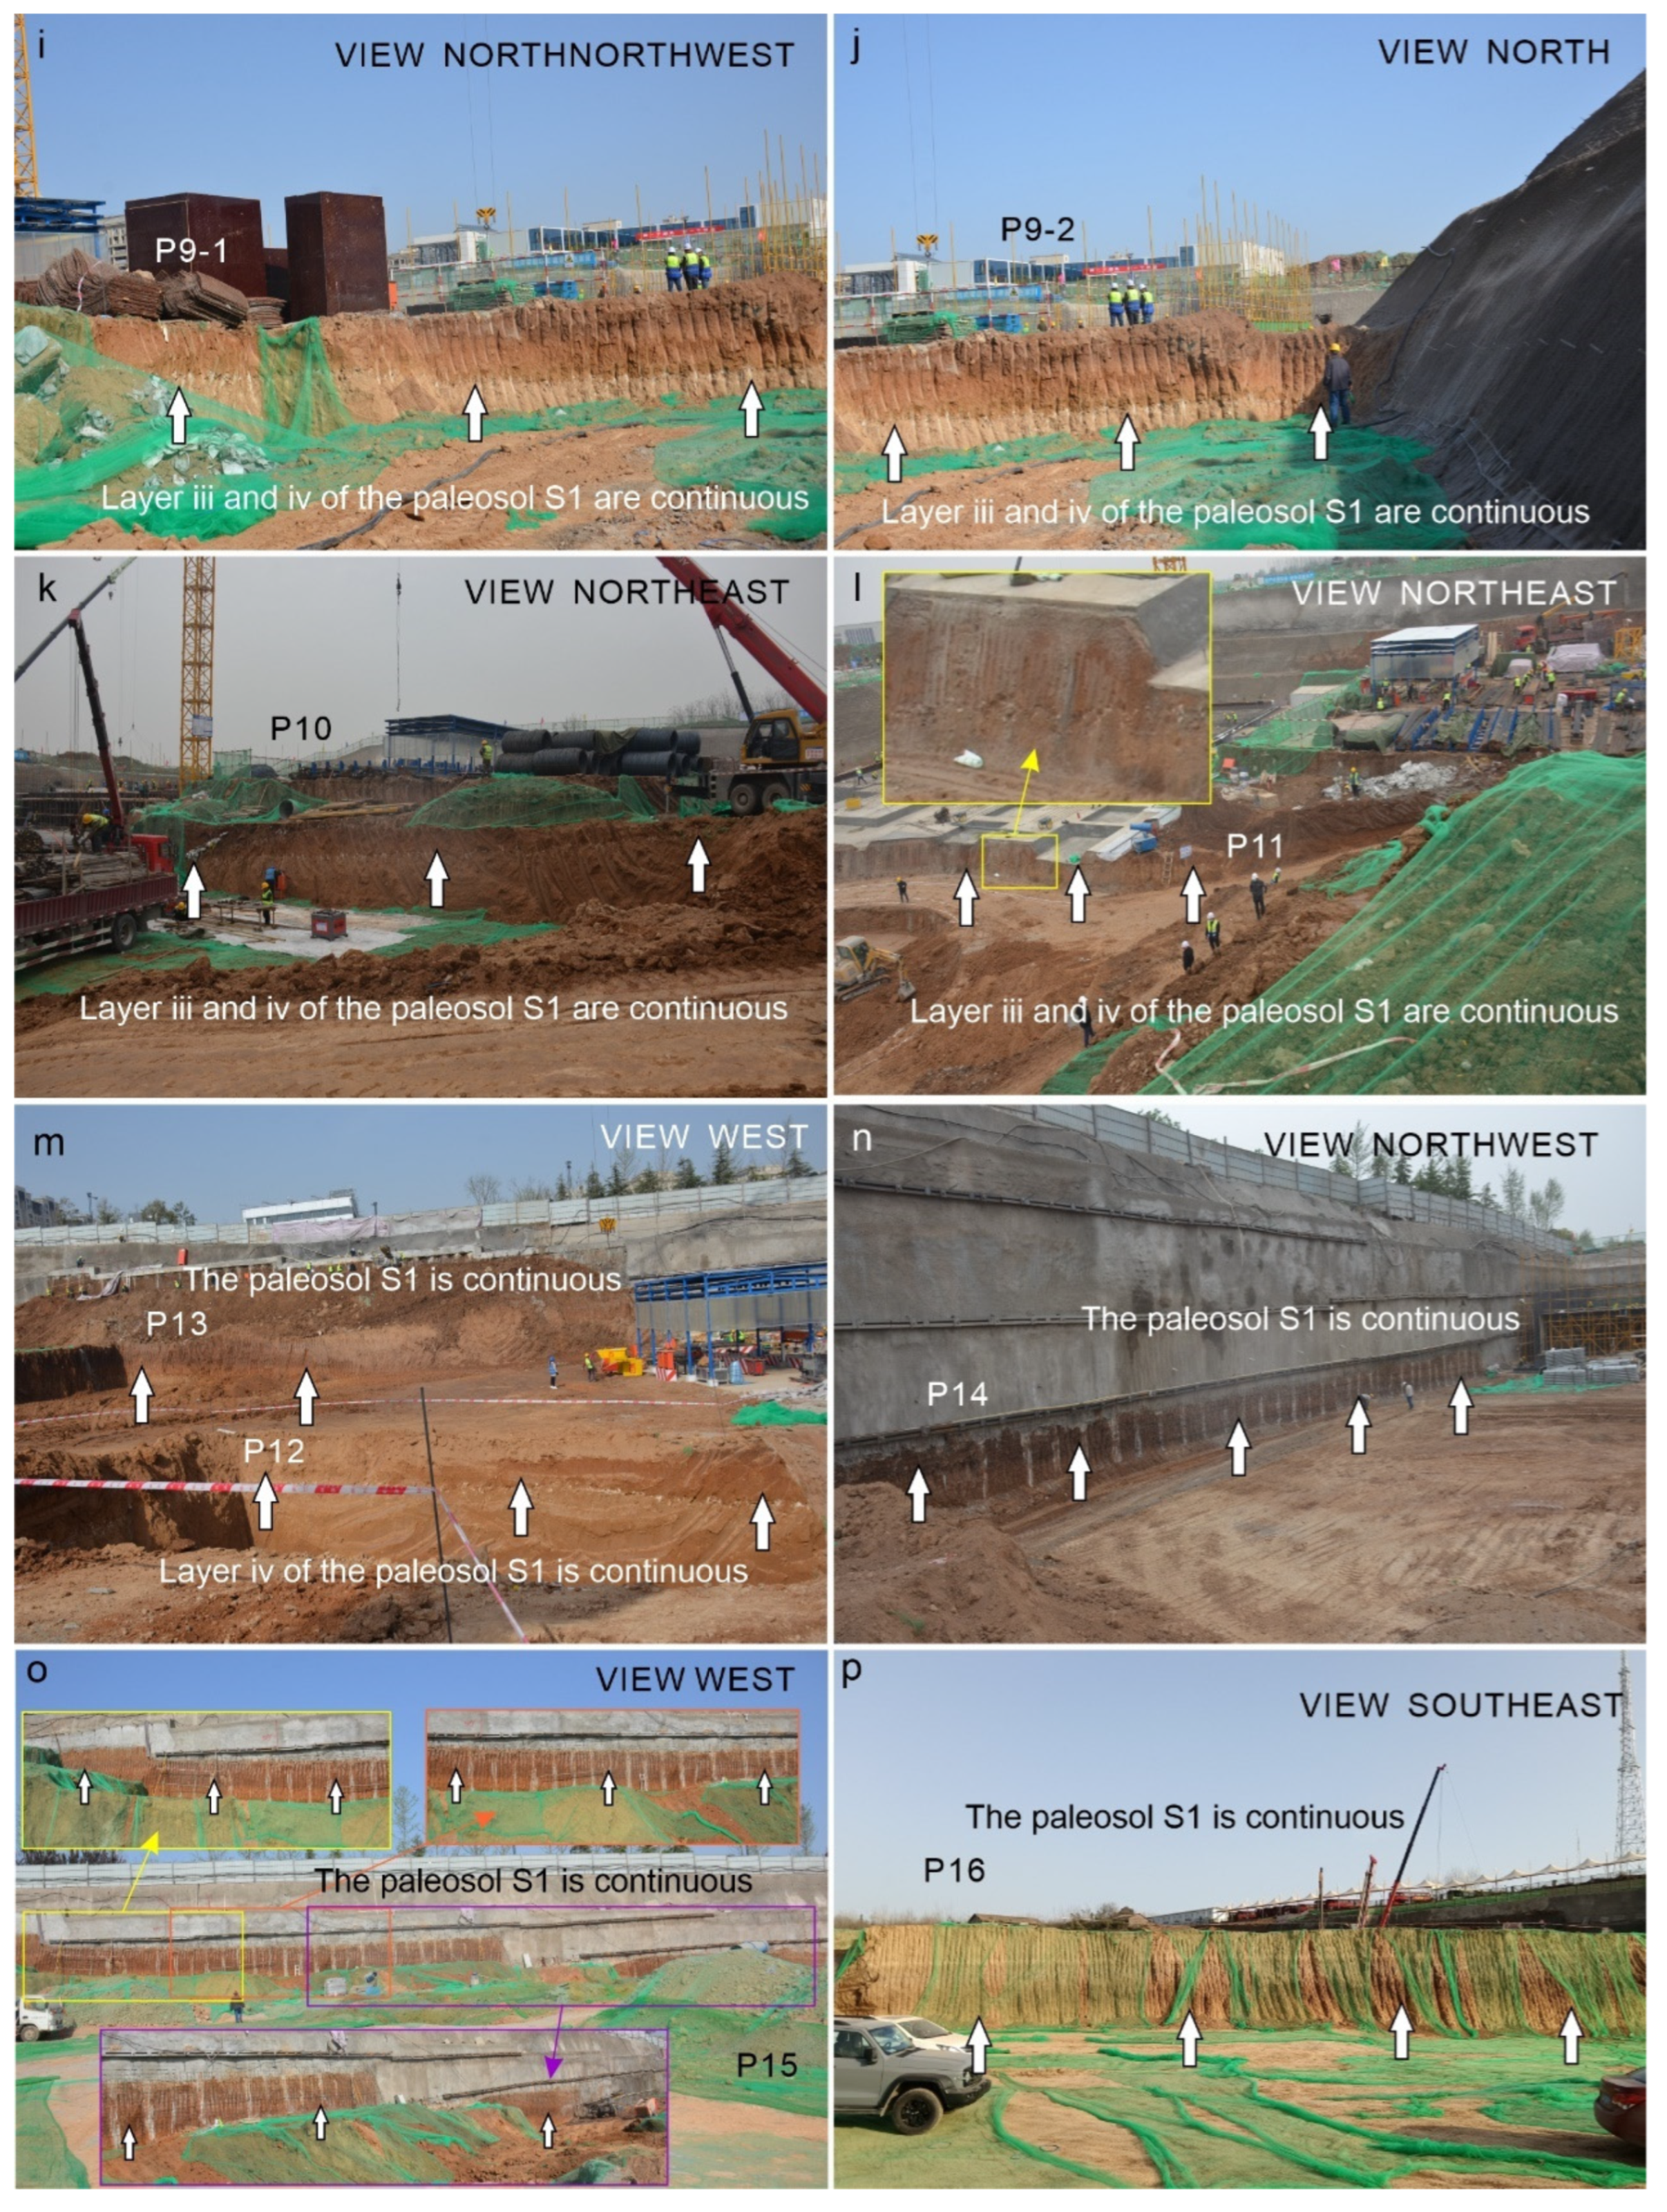
4.3. Excavation Profiles of Foundation Pit
5. Discussion
5.1. Activity and Distribution of the Wangjiabian–Houjiawan Fault
5.2. Late Quaternary Activity Characteristics and Geological Significance of the Lintong–Chang’an Fault Zone
6. Conclusions
Author Contributions
Funding
Institutional Review Board Statement
Informed Consent Statement
Data Availability Statement
Acknowledgments
Conflicts of Interest
References
- The Reseach Group on “Active Fault System around Ordos Massif”, State Seismological Bureau. Active Fault System around Ordos Massif; Seismological Press: Beijing, China, 1988. (In Chinese) [Google Scholar]
- Feng, X.; Dai, W.; Shi, Y.; Li, J.; Ren, J.; Han, H. Dislocation and Distribution Characteristics of the Lintong-Chang’an Fault. Seismol. Geol. 2006, 28, 579–588. [Google Scholar]
- Shi, Y.; Feng, X.; Dai, W.; Ren, J.; Li, X.; Chong, J. Cause Analysis of the Scarps on Lintong-Chang’an Fault Zone. Quat. Sci. 2008, 28, 721–732. [Google Scholar]
- Shi, Y.; Feng, X.; Dai, W.; Li, X.; Ren, J.; Chong, J. Geometric Structure and Formation Mechanism of Lintong-Chang’an Fault Zone. Acta Seismol. Sin. 2008, 21, 156–169. [Google Scholar] [CrossRef]
- Shi, Y.; Feng, X.; Li, J.; Dai, W.; Ren, J.; Li, X. Characteristics of the Activity of the Lintong-Chang’an Fault in the Late Pleistocene. Earthq. Res. China 2007, 23, 286–294. [Google Scholar]
- Ren, J.; Peng, J.; Wang, F.; Liu, C.; Feng, X.; Dai, W. The Research of Deep Structural Features of Weihe Basin and Adjacent Areas. Chin. J. Geophys. 2012, 55, 2939–2947. [Google Scholar]
- Shaanxi Earthquake Agency. Engineering Technical Report of Xi’an Active Fault Detection and Seismic Risk Assessment; Shaanxi Earthquake Agency: Xi’an, China, 2007. (In Chinese) [Google Scholar]
- Official Website of Qujiang New District Management Council. Available online: Http://Qjxq.Xa.Gov.Cn/Zwgk/Ndzdxxgk/Ggzypz/Zfcg/6131d55af8fd1c0bdc4f7ba4.Html (accessed on 4 July 2023).
- Zhang, Y.Q.; Mercier, J.L.; Vergély, P. Extension in the Graben Systems around the Ordos (China), and Its Contribution to the Extrusion Tectonics of South China with Respect to Gobi-Mongolia. Tectonophysics 1998, 285, 41–75. [Google Scholar] [CrossRef]
- He, C.; Yang, C.-J.; Rao, G.; Yuan, X.-P.; Roda-Boluda, D.C.; Cheng, Y.; Yang, R.; Zhang, L.; Yao, Q. Seismic Assessment of the Weihe Graben, Central China: Insights from Geomorphological Analyses and 10Be-Derived Catchment Denudation Rates. Geomorphology 2020, 359, 107151. [Google Scholar] [CrossRef]
- Sun, J. Long-Term Fluvial Archives in the Fen Wei Graben, Central China, and Their Bearing on the Tectonic History of the India-Asia Collision System during the Quaternary. Quat. Sci. Rev. 2005, 24, 1279–1286. [Google Scholar] [CrossRef]
- Han, H.; Zhang, Y.; Yuan, Z. The Evolution of Weihe Down-Faulted Basin and the Movement of the Fault Blocks. J. Seismol. Res. 2002, 25, 362–368. [Google Scholar]
- Li, Z.; Li, W.; Li, Y.; Li, Y.; Han, W.; Wen, J.; Chen, M.; Qin, Z. Sedimentary Facies of the Cenozoic in Weihe Basin. J. Palaeogeogr. 2015, 17, 529–540. [Google Scholar] [CrossRef]
- The Earthquake Disaster Prevention Department of the State Seismological Bureau. Catalogue of Chinese Historical Strong Earthquakes (23rd Century B.C. to 1911 A.D.); Seismological Press: Beijing, China, 1995. (In Chinese) [Google Scholar]
- Feng, X.; Ma, J.; Zhou, Y.; England, P.; Parsons, B.; Rizza, M.A.; Walker, R.T. Geomorphology and Paleoseismology of the Weinan Fault, Shaanxi, Central China, and the Source of the 1556 Huaxian Earthquake. JGR Solid Earth 2020, 125, e2019JB017848. [Google Scholar] [CrossRef]
- Wang, T.; Zeng, Z.; Yang, T.; Jian, K.; Gu, K. Time Limit of Lishan Uplift and Its Geological Significance. Geol. Shaanxi 2019, 37, 42–48. [Google Scholar]
- EarthExplorer of USGS. Available online: https://Earthexplorer.Usgs.Gov/ (accessed on 4 July 2023).
- ASF Data Search of NASA EARTHDATA. Available online: Https://Search.Asf.Alaska.Edu/#/ (accessed on 4 July 2023).
- Lei, Q.; Chai, C.; Meng, G.; Du, P.; Wang, Y.; Xie, X. Method of Locating Buried Active Fault by Composite Drilling Section Doubling Exploration. Seismol. Geol. 2011, 33, 45–55. [Google Scholar] [CrossRef]
- Liu, C.; Lei, Q.; Du, P.; Wu, Z.; Li, Z.; Yu, S.; Yang, S.; Wang, Y. Activity Characteristic of the Two Buried Faults in Zhongwei Basin along the Northeastern Margins of Tibetan Plateau, China, by Means of Shallow Seismic and Composite Drilling Section Exploration. Appl. Sci. 2022, 12, 12074. [Google Scholar] [CrossRef]
- Ding, Z.; Yu, Z.; Liu, T. Progress in Loess Research (Part 3): Time Scale. Quat. Sci. 1991, 4, 336–348. [Google Scholar]
- Li, D.; Du, J.; Ma, Y.; Xiao, A. The Activity of the Lintong-Chang’an Fracture Zone, Xi’an City since the Late Pleistocene. Earth Sci. Front. 2013, 20, 46–57. [Google Scholar]
- Shaanxi Earthquake Agency. Northern Qinling Mountains Active Fault Zone; Seismological Press: Beijing, China, 1996. (In Chinese) [Google Scholar]
- Zhang, Y.; Liao, C.; Shi, W.; Hu, B. Neotectonic Evolution of the Peripheral Zones of the Ordos Basin and Geodynamic Setting. Geol. J. China Univ. 2006, 12, 285–297. [Google Scholar]
- Mercier, J.L.; Vergely, P.; Zhang, Y.Q.; Hou, M.J.; Bellier, O.; Wang, Y.M. Structural Records of the Late Cretaceous–Cenozoic Extension in Eastern China and the Kinematics of the Southern Tan-Lu and Qinling Fault Zone (Anhui and Shaanxi Provinces, PR China). Tectonophysics 2013, 582, 50–75. [Google Scholar] [CrossRef]
- Cui, D.; Hao, M.; Li, Y.; Wang, W.; Qin, S.; Li, Z. Present-Day Crustal Movement and Strain of the Surrounding Area of Ordos Block Derived from Repeated GPS Observations. Chin. J. Geophys. 2016, 59, 3646–3661. [Google Scholar] [CrossRef]
- Yang, C.; Ji, L.; Yang, Y.; Su, L.; Wang, Y.; Shi, H. Present-Day Activity and Seismic Potential of the North Qinling Fault, Southern Ordos Block, Central China, as Revealed from GPS Data and Seismicity. Front. Earth Sci. 2023, 10, 1058243. [Google Scholar] [CrossRef]
- Tian, Q.; Zhou, B.; Li, X.; Shi, J.; Wei, Q.; Bian, J. Distribution of Yangjia Village-Yaodian Section of Weihe Fault and the Characteristics of Its Late Quaternary Activity. Seismol. Geol. 2016, 38, 141–151. [Google Scholar]
- Kim, Y.-S.; Sanderson, D.J. Structural Similarity and Variety at the Tips in a Wide Range of Strike–Slip Faults: A Review. Terra Nova 2006, 18, 330–344. [Google Scholar] [CrossRef]
- Shaanxi Earthquake Agency. Engineering Technical Report of Xingping Active Fault Detection and Seismic Risk Assessment; Shaanxi Earthquake Agency: Xi’an, China, 2022. (In Chinese) [Google Scholar]
- Wang, S.; Shi, Y.; Feng, X.; Tian, Z. Late Quaternary sinistral strike-slipping of the Liupanshan-Baoji fault zone: Implications for the growth of the northeastern Tibetan Plateau. Geomorphology 2021, 380, 107628. [Google Scholar] [CrossRef]
- Lin, A.; Rao, G.; Yan, B. Flexural Fold Structures and Active Faults in the Northern–Western Weihe Graben, Central China. J. Asian Earth Sci. 2015, 114, 226–241. [Google Scholar] [CrossRef]
- Yang, C.; Li, X.; Feng, X.; Zhu, L.; Li, M.; Zhang, E. The Late Quaternary and Present-Day Activities of the Kouzhen-Guanshan Fault on the Northern Boundary of Weihe Graben Basin, China. Seismol. Geol. 2021, 43, 504–520. [Google Scholar] [CrossRef]
- Mi, F.; Han, H.; Jin, J.; Lio, H. Nowadays Active Features of the Kouzhen-Guanshan Faults. J. Chang. Univ. Earth Sci. Ed. 1993, 15, 40–47. [Google Scholar]
- Li, X.; Ran, Y. The Northern Huashan and Weinan Loess Tableland active faults. North China Earthq. Sci. 1983, 1, 10–18. [Google Scholar]
- Li, G.; Li, C.; Li, X.; Ma, J. Late Quaternary Paleoearthquake Research of Weinan Plateau Front Fault. South China J. Seismol. 2019, 39, 65–70. [Google Scholar] [CrossRef]
- Ma, J. Surface Rupture and Its Seismogenic Faults of 1556 Huaxian M 8¼ Earthquake. Ph.D. Thesis, Institute of Geology, China Earthquake Administration, Beijing, China, 2019. (In Chinese). [Google Scholar]
- Ren, J.; Feng, X.; Wang, F.; Peng, J.; Liu, C.; Dai, W.; Li, G.; Zhang, Y.; Ma, J. Fine Crust Structures of Xi’an Sag in the Weihe Basin Revealed by a Deep Seismic Reflection Profile. Chin. J. Geophys. 2013, 56, 513–521. [Google Scholar]
- Li, Z.; Song, Y.; Gao, H.; Yuan, H.; Cheng, Y.; Cong, L. Study on the Strike of Western Lintong-Chang’an Fault (F_N). Earthq. Res. China 2014, 30, 272–279. [Google Scholar]


| Layer | Age (Ma B.P.) | Layer | Age (Ma B.P.) | Layer | Age (Ma B.P.) |
|---|---|---|---|---|---|
| S0 Top | 0 | S2-II Top | 0.225 | S5-I Top | 0.468 |
| S0 Bottom | 0.01 | S2-II Bottom | 0.242 | S5-I Bottom | 0.505 |
| S1 Top | 0.092 | S3 Top | 0.272 | S5-II Top | 0.512 |
| S1 Bottom | 0.127 | S3 Bottom | 0.33 | S5-II Bottom | 0.526 |
| S2-I Top | 0.185 | S4 Top | 0.375 | S5-III Top | 0.538 |
| S2-I Bottom | 0.22 | S4 Bottom | 0.422 | S5-III Bottom | 0.6 |
| Marker Layer | Layer | Elevation of the Footwall/m | Elevation of the Hanging Wall/m | Displacement/m |
|---|---|---|---|---|
| Profile A–A′: layer ④ top | Paleosol S2 | 480.68–488.12 | 455.16–473.18 | 2.5 |
| Profile B–B′: layer ⑤ top | 484.11–508.63 | 470.51–474.70 | - | |
| Profile A–A′: layer ④ bottom | Paleosol S2 | 478.98–484.02 | 453.36–469.28 | 2.5 |
| Profile B–B′: layer ⑤ bottom | 479.91–504.63 | 466.71–470.50 | - | |
| Profile A–A′: layer ⑥ top | Paleosol S3 | 471.68–479.72 | 444.46–464.78 | 2.5 |
| Profile A–A′: layer ⑥ bottom | Paleosol S3 | 469.88–476.72 | 442.56–461.58 | 3.5 |
| Profile A–A′: layer ⑧ top | Paleosol S4 | 465.58–472.12 | 437.26–457.88 | 3.5 |
| Profile A–A′: layer ⑧ bottom | Paleosol S4 | 463.76–470.02 | 434.96–455.68 | 3.5 |
| Profile A–A′: layer ⑩ top | Silty clay | 387.72–392.00 | 373.28–378.56 | 20 |
| Profile B–B′: layer ⑩ top | 390.53–401.83 | 381.71–383.70 | 12 |
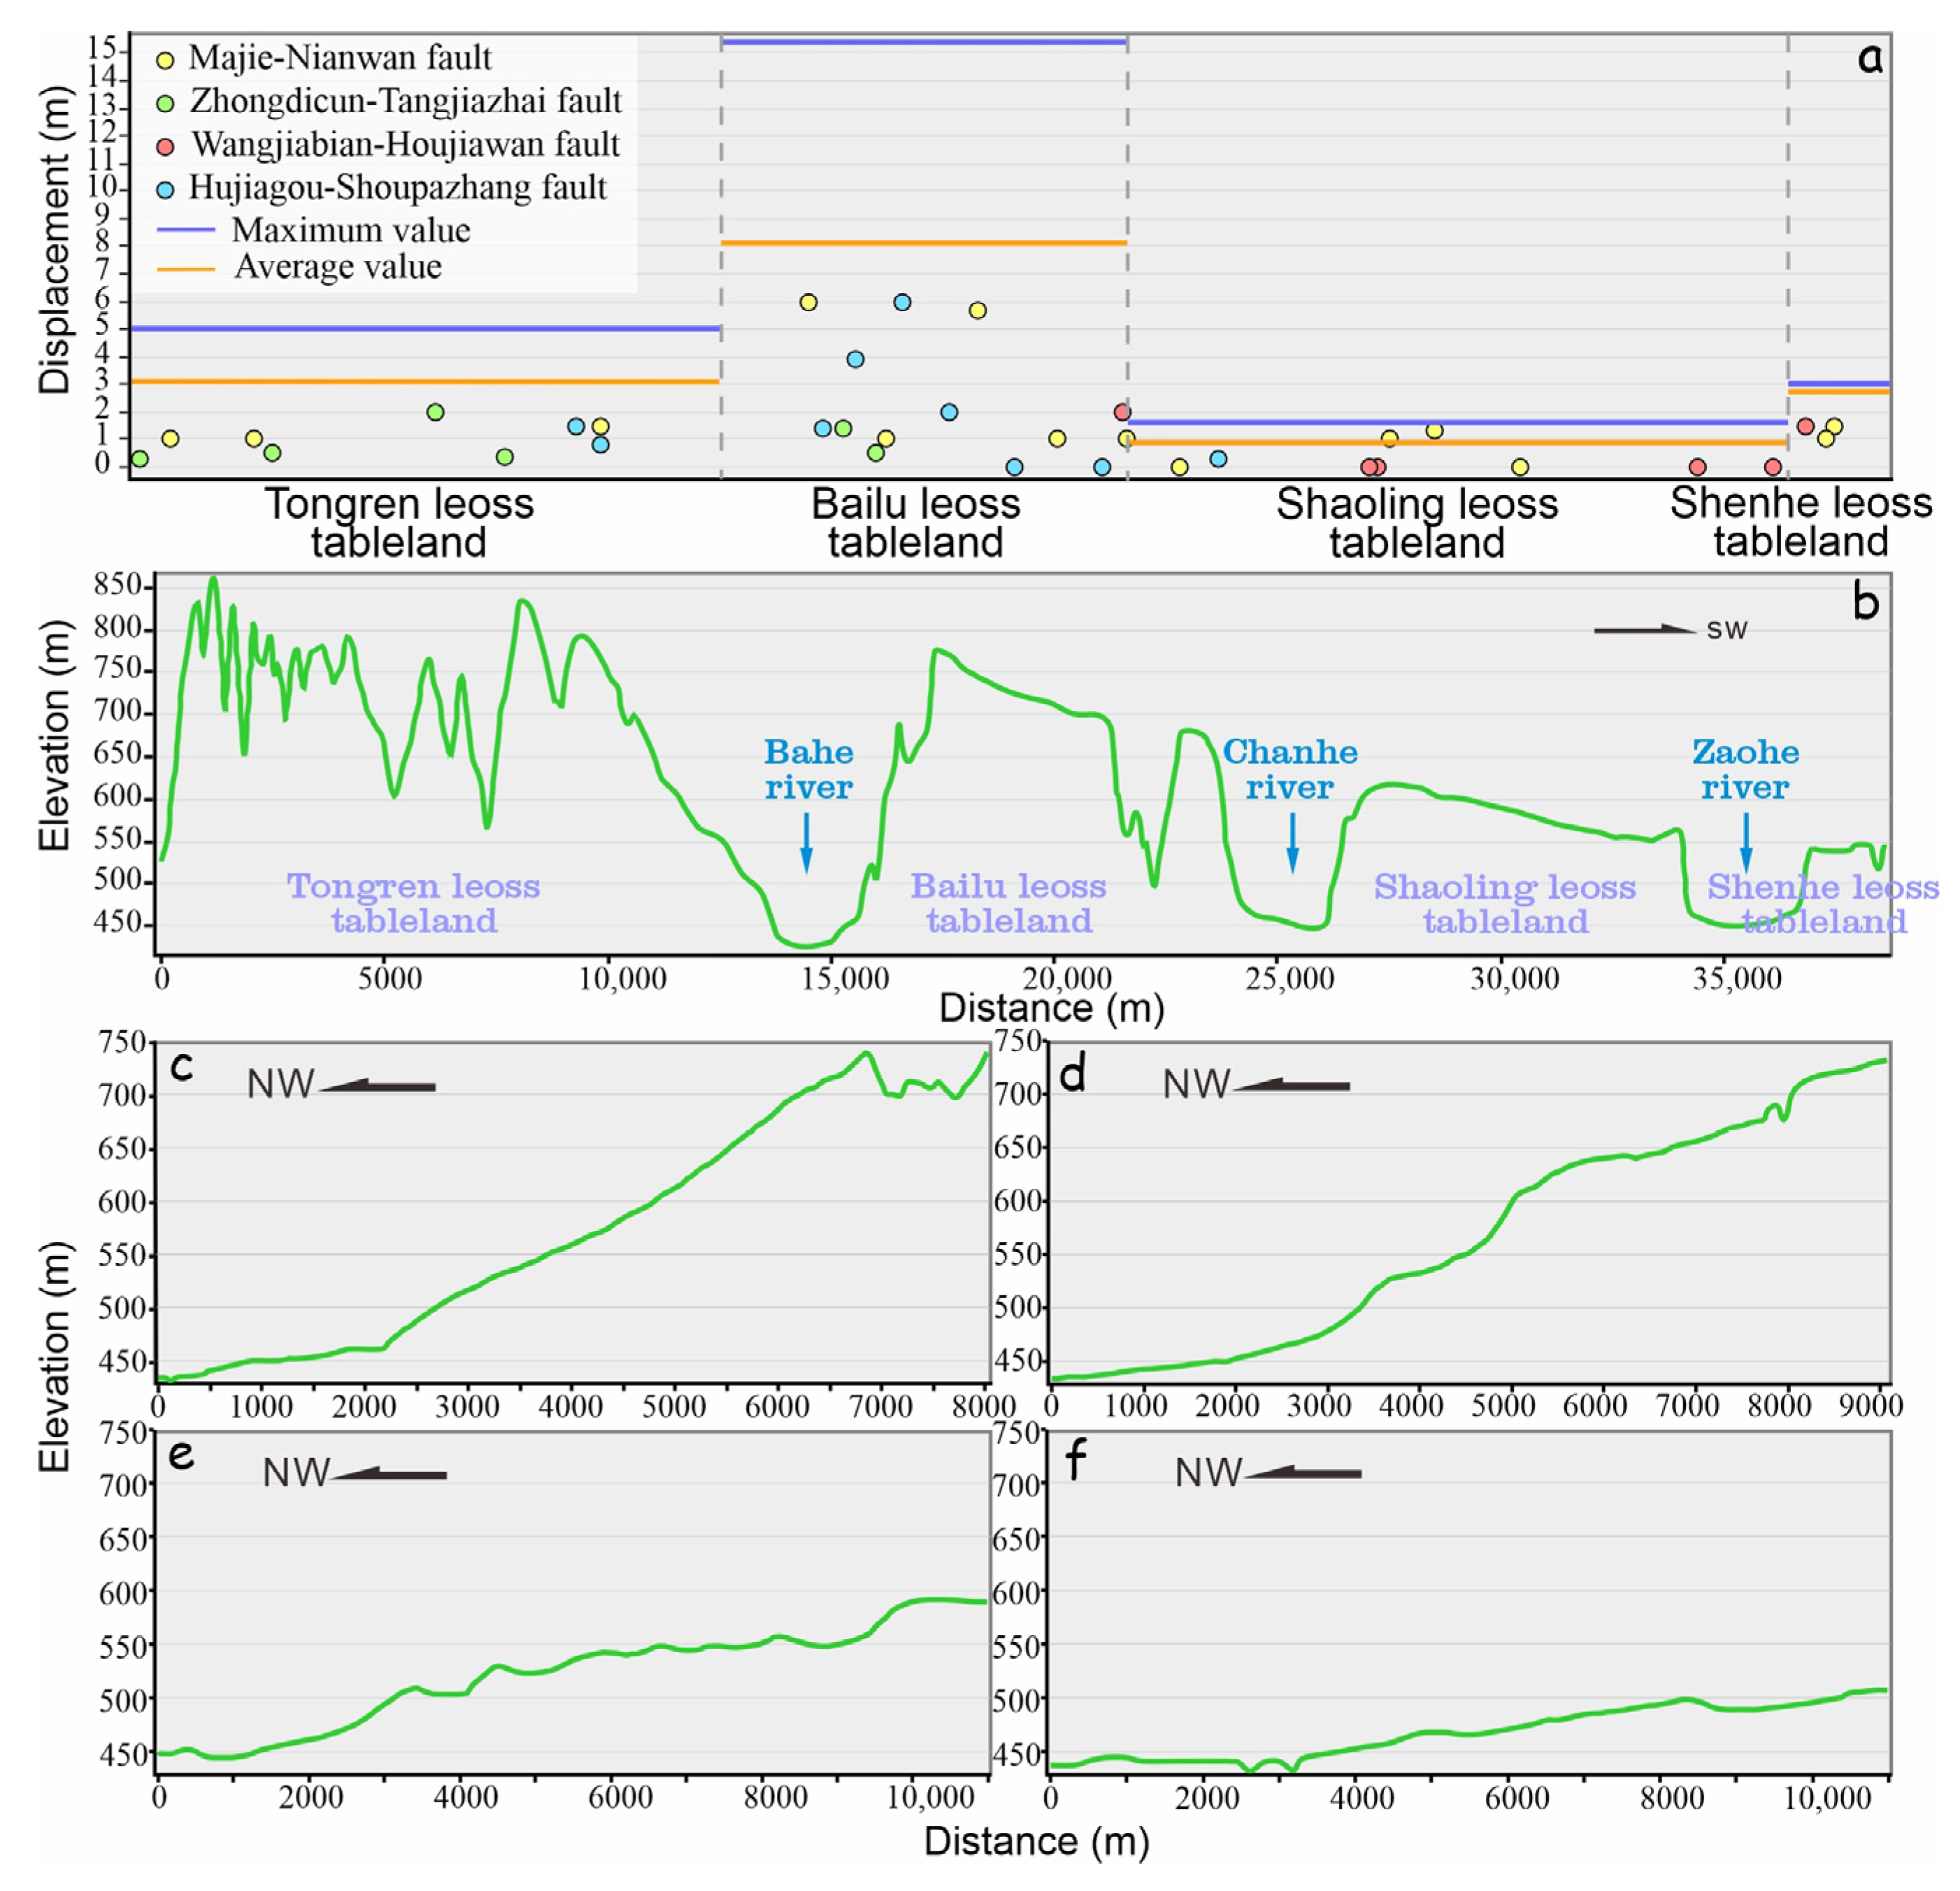
| Geomorphic Unit | Fault Name | Location | Number | Displacement since the Late Pleistocene (m) and References | Maximum Value (m) | Average Value (m) |
|---|---|---|---|---|---|---|
| Tongren Leoss Tableland | Majie–Nianwan Fault (F1-1) | Majie | 1 | 1 [7] | 5.00 | 3.12 |
| Yangpo | 2 | 1 [2] | ||||
| Xiaoya | 3 | / [7] | ||||
| Chezhanggou | 4 | 1.5 [4] | ||||
| Hujiagou–Shoupazhang Fault (F1-2) | Yuejiagou | 5 | ? [7] | |||
| Xiaogou | 6 | / [7] | ||||
| Hujiagou | 7 | 1.5 [7] | ||||
| Wangkezhai | 8 | 0.8 [7] | ||||
| Zhongdicun–Tangjiazhai Fault (F1-2a) | Lijiagou | 9 | 0.3 [4] | |||
| Yangjiazhai | 10 | 0.5 [7] | ||||
| Fanjiacun | 11 | / [7] | ||||
| Zhongdicun | 12 | 2 [7] | ||||
| Renjiacun | 13 | / [7] | ||||
| Xiangyang Company | 14 | 0.4 [7] | ||||
| Bailu leoss tableland | Majie–Nianwan Fault (F1-1) | Laoshigou | 15 | / [7] | 15.40 | 9.01 |
| Jinpingtuo | 16 | 6 [7] | ||||
| Jiangjiagou | 17 | 1 [7] | ||||
| Niujiaojian | 18 | 5.7 [7] | ||||
| Southern Niujiaojian | 19 | 1 [7] | ||||
| Jingyugou | 20 | 1 # | ||||
| Gaoqiao borehole section | 21 | 0 [7] | ||||
| Wangjiabian–Houjiawan Fault (F1-1a) | Gaoqiao | 22 | 2 [7] | |||
| Hujiagou–Shoupazhang Fault (F1-2) | Qiaogou | 23 | 1.4 [7] | |||
| Xiaojiazhai | 24 | 3.9 [7] | ||||
| Northern Shenyusi | 25 | 6 [7] | ||||
| Southern Shenyusi | 26 | 2 [7] | ||||
| Zhongdiancun | 27 | 0 [7] | ||||
| Zhongdicun–Tangjiazhai Fault (F1-2a) | Northern Tangjiazhai | 28 | 1.4 [7] | |||
| Southern Tangjiazhai | 29 | 0.5 [7] | ||||
| Shaoling Leoss Tableland | Majie–Nianwan Fault (F1-1) | Dabaopo | 30 | 1 [7] | 1.60 | 0.92 |
| Xiaobaopo | 31 | 1.3 [7] | ||||
| Xikang Highway | 32 | 0 [7] | ||||
| Nanshashi | 33 | / [7] | ||||
| Wangjiabian–Houjiawan Fault (F1-1a) | Wangjiabian | 34 | / [7] | |||
| A–A′ drilling profile | 35 | 0 # | ||||
| B–B′ drilling profile | 36 | 0 # | ||||
| Weiqu | 37 | 0 [7] | ||||
| Changan No.2 Highschool | 38 | 0 [7] | ||||
| Hujiagou–Shoupazhang Fault (F1-2) | Yuedengge | 39 | 0 [7] | |||
| Huangqutou | 40 | 0.3 [7] | ||||
| Shenhe Leoss Tableland | Majie–Nianwan Fault (F1-1) | Longweigou | 41 | 1.5 [7] | 3.00 | 2.75 |
| Huangpu | 42 | 1 [7] | ||||
| Wangjiabian–Houjiawan Fault (F1-1a) | Shuimocun | 43 | 1.5 [7] |
| Fault Name | Dip Slip Rate (mm/a) | Strike Slip Rate (mm/a) | References |
|---|---|---|---|
| Northern Qinling Fault | 0.38–0.78 | 0.36–1.33 * | [23,26,27] |
| Longxian–Qishan–Mazhao Fault | 0.01–0.03 | 0.5–1.5 | [31,32] |
| Weihe Fault | 0.11–0.45 | [28] | |
| Kouzhen–Guanshen Fault | 0.13–0.40 | 0.49 | [33,34] |
| Weinan Leoss Tableland Fault | 0.14–0.29 | [35,36] |
Disclaimer/Publisher’s Note: The statements, opinions and data contained in all publications are solely those of the individual author(s) and contributor(s) and not of MDPI and/or the editor(s). MDPI and/or the editor(s) disclaim responsibility for any injury to people or property resulting from any ideas, methods, instructions or products referred to in the content. |
© 2023 by the authors. Licensee MDPI, Basel, Switzerland. This article is an open access article distributed under the terms and conditions of the Creative Commons Attribution (CC BY) license (https://creativecommons.org/licenses/by/4.0/).
Share and Cite
Wang, S.; Tian, Q.; Chong, J.; Duan, R.; Tian, Z.; Li, X.; Xu, W.; Yan, W.; Huang, Y. Late Quaternary Activity Studies on the Lintong–Chang’an Fault Zone in the Weihe Graben, Central China, Using Combined Techniques. Appl. Sci. 2023, 13, 9558. https://doi.org/10.3390/app13179558
Wang S, Tian Q, Chong J, Duan R, Tian Z, Li X, Xu W, Yan W, Huang Y. Late Quaternary Activity Studies on the Lintong–Chang’an Fault Zone in the Weihe Graben, Central China, Using Combined Techniques. Applied Sciences. 2023; 13(17):9558. https://doi.org/10.3390/app13179558
Chicago/Turabian StyleWang, Shidi, Qinhu Tian, Jin Chong, Rui Duan, Zhen Tian, Xiaoni Li, Wei Xu, Wenhua Yan, and Yindi Huang. 2023. "Late Quaternary Activity Studies on the Lintong–Chang’an Fault Zone in the Weihe Graben, Central China, Using Combined Techniques" Applied Sciences 13, no. 17: 9558. https://doi.org/10.3390/app13179558