Article

Metabolic Energy Consumption during Green Area Management

Dipartimento di Agraria, Università degli Studi Mediterranea di Reggio Calabria, Feo di Vito, 89122 Reggio Calabria, Italy
*
Author to whom correspondence should be addressed.
Appl. Sci. 2023, 13(17), 9671; https://doi.org/10.3390/app13179671
Submission received: 29 June 2023 / Revised: 22 August 2023 / Accepted: 25 August 2023 / Published: 27 August 2023

Abstract

:
The energy consumption measurement is important to carry out a correct risk evaluation of workers during green area management with the scope to achieve workstyle improvements. In contrast to sporting activities, few studies have been conducted on the assessment of physical fatigue by determining the functional parameters of the human body and oxygen consumption in this sector. This study aims to measure the energy cost of weed control using a wearable telemetry system Cosmed K4. For this purpose, twelve male workers, grouped into three groups of four workers each, were monitored during the work of weed control carried out with a brush cutter (by testing three different cutting heads). The monitoring period lasted 18 min including a 5-min rest period at the end of work. This study shows how the use of facilitating tools such as brush cutters contributes to getting low energy metabolism rate values, in tests performed equally on average to 119 Wm−2.

1. Introduction

Green infrastructure refers to a network of natural and near-natural areas within, around and between urban areas. It is a source of ecosystem goods and services [1]. The management of green area maintenance is a field where workers’ energy expenditure can lead to significant health and productivity decrements. Work cycles are characterised by phases that entail exposure to numerous health and safety risks; these include the accident risk associated with the use of machinery and work equipment as evidenced by the high incidence of occupational accidents resulting from their misuse [2]. The multiplicity of conditions and factors that can lead to a risk to the safety and/or health of workers requires a careful and thorough analysis of the work activity by assessing which exposures are involved in individual tasks [3]. Consider for instance movements requiring the application of force, vibrations transmitted to the hand-arm system (use of vibrating tools), vibrations [4,5], incongruous postures maintained for a long time [6,7], and repetitiveness with the high frequency of movements. With regard to weed control, workers are required to perform a number of repetitive physical activities on a cyclical basis. The aerobic metabolism generated by the performance of certain tasks and the associated stress are important factors in the health of the physical and mental performers. During aerobic metabolism, energy is produced through the combustion of carbohydrates, amino acids, and fats in the presence of oxygen. According to EN ISO 8996:2021 [8], the metabolic rate measures the energetic cost of muscular work and provides a quantitative estimate of activity. It is defined as an important determinant of comfort or strain resulting from exposure to a thermal environment. EN ISO 8996:2021 specifies various methods for determining metabolic rate in the context of thermal work environment ergonomics, from evaluating work practices and energy costs of specific tasks or sports to the total energy cost of an activity.
As reported by Sunkpal et al., 2018 [9] the metabolic rate depends on the worker’s activity level and fitness level. A normal adult with a surface area of 1.8 m2 at rest (seated and quiet) is typically evaluated at 60 Wm−2. Metabolic rate is often measured in met (1 met = 50 kcal/h/m2). In particular, high levels of metabolic heat can aggravate heat stress in hot environments or help compensate for excessive heat losses and reduce the cold strain in cold environments. The investigation of these aspects is of increasing interest in the field of safety, especially when the workers are at greater risk of contracting occupational diseases, due to the heterogeneity of existing practices, most of which are often most of which are often conducted outdoors and under several climate conditions [10]. Hence, also the legislation has evolved to include microclimate among the physical risk agents [11]. Microclimate requires the monitoring of various independent parameters, some environmental [12], and others related to the worker, such as the thermal insulation of clothing and metabolic activity: related to thermal comfort, EN ISO 8996:2021 specifies several methods for determining the latter. The methods are classified for increasing accuracy from level 1, screening, to level 4, expertise. The most used methods are the double-labelled water method and indirect calorimetry, which measures oxygen consumption and carbon dioxide production and provides an assessment of energy expenditure [13]. Nowadays, portable methods of measuring oxygen consumption (VO2) and carbon dioxide production (VCO2) to assess energy expenditure outside the laboratory and clinical environment are becoming more widely used [14,15], as technological developments have facilitated the transition from laboratory to field measurements. As reported by Mtaweh et al., 2018 [16], the major development in indirect measurements has been the development of portable systems, starting with the Tissot spirometer in 1904; since then, the development of indirect calorimetry has enabled its application in sports and medical fields. Nevertheless, fewer studies have been carried out on the metabolic rates of workers in the agricultural and natural resources sectors than in other sectors [17]. This secondary attention appears in a review by Poulianiti et al., 2019 [18] that provides a list of energy cost estimations, based on indirect calorimetry, in jobs/tasks included in agriculture, which count 14 studies from 1953 to 1989. To these may be added further studies [19,20,21,22]. In every case, all these studies are related more to agriculture than to the management of green areas. However, the maintenance of residential, urban green areas or those used for outdoor activities or sports requires a wide range of equipment, depending on the type of intervention to be carried out. Among the most used devices are brush cutters, which, while they have become very popular due to their affordable prices and ease of use, are often the cause of both direct and indirect accidents, such as physical stress [4,23]. It is fundamental to consider the necessary preventive measures, i.e., related to the correct transport and handling of the brush cutter, the adoption of a correct working posture, and the use of the necessary personal protective equipment, such as anti-vibration gloves.
The present study focuses on this issue and aims to evaluate the energy consumption during weed control using a brushcutter with multiple cutting heads, in line with all the previous considerations. The aim is to assess whether the work carried out meets the parameters set out in the EN ISO 8996:2021 standard.

2. Materials and Methods

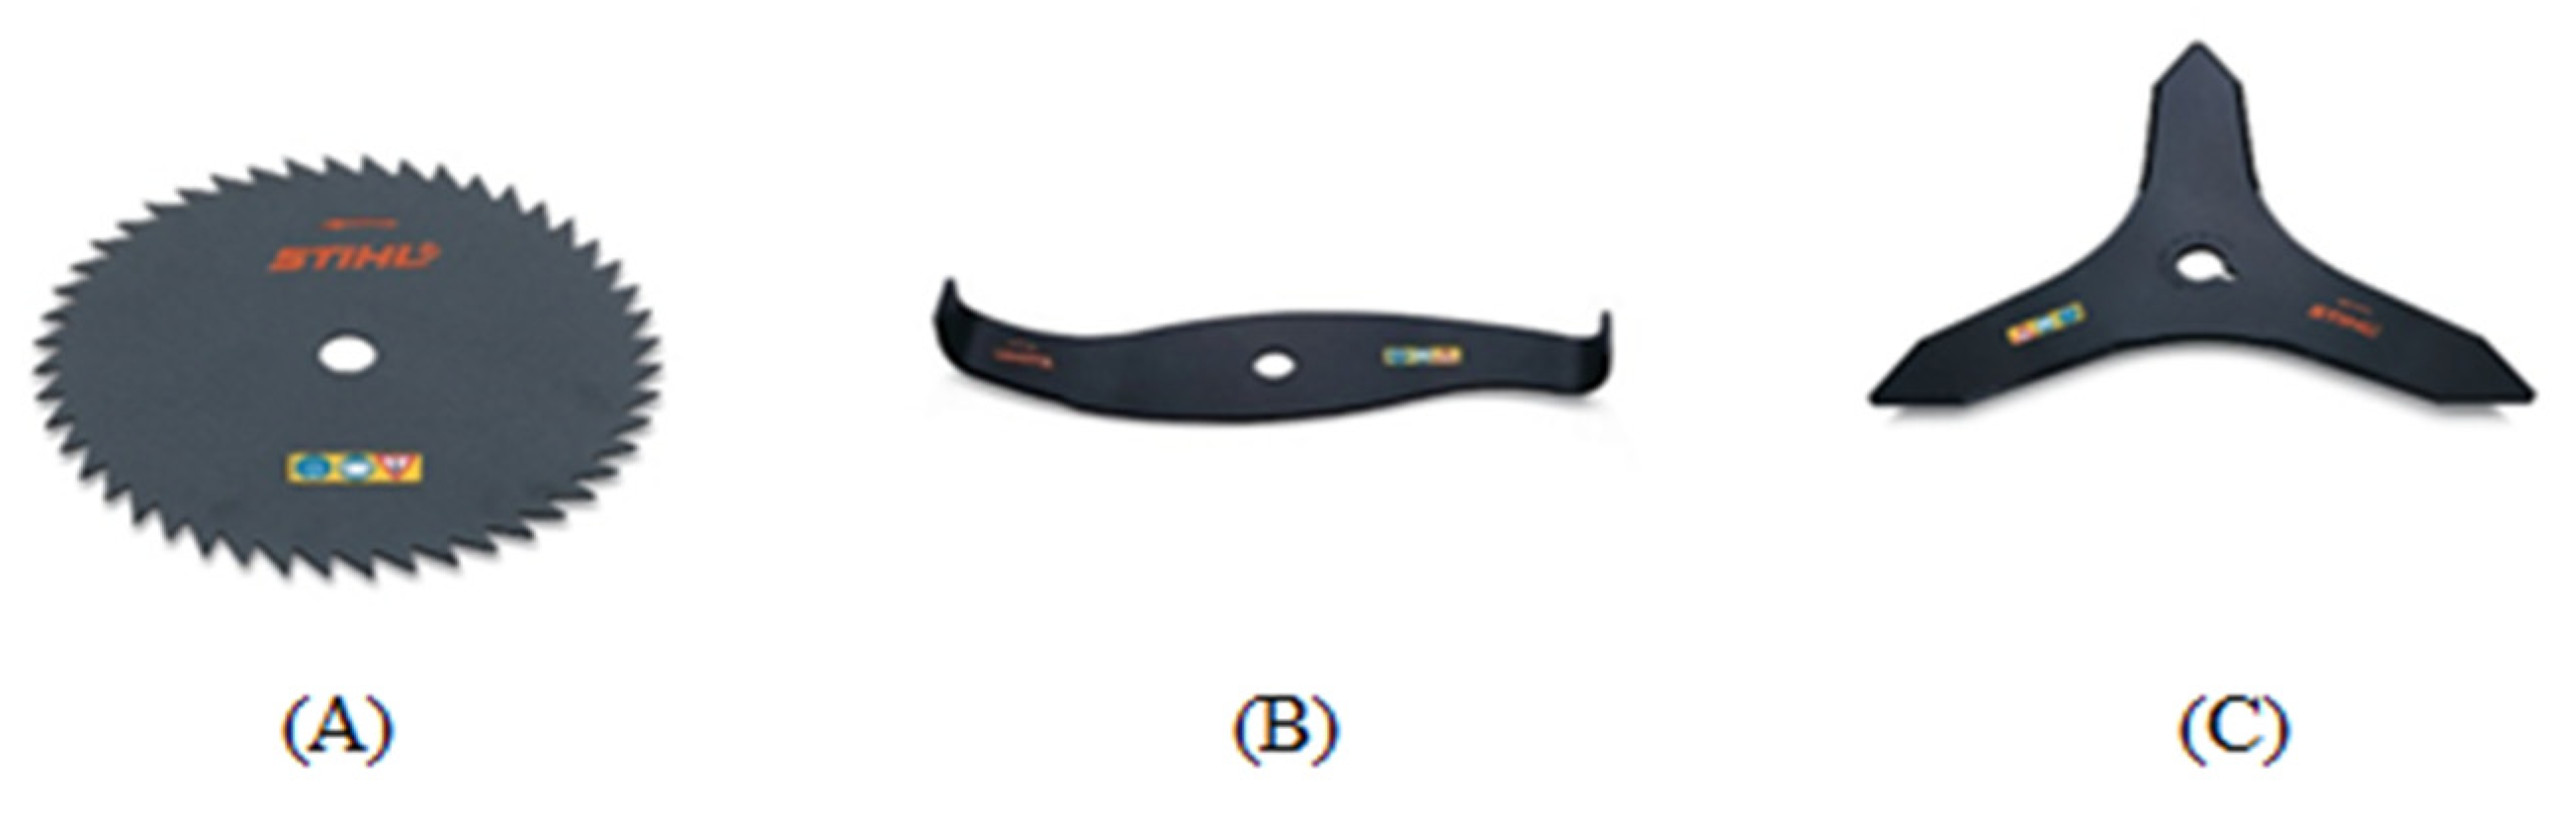
2.1. Field Sampling and Employed Equipment

The research area was located at an altitude of 150 m a.s.l, and the experimental trial was carried out during the springtime. The tests were carried out on a flat area characterised by perennial and small grasses when weather conditions presented an average temperature of 30 °C at an air velocity of 3 ms−1 as the benchmark and barometric pressure of 1013.25 hPa, common parameters detectable in the summer period at this latitude. The baseline relative humidity (RH) was set at 50 ± 10%. The reason for this choice lies in the fact that humans are sensitive to changes in temperature, even if they are not able to perceive differences in RH between 25 and 60% [24]. Out of these values, as reported by Sunkpal et al. [9], the moisture itself cannot evaporate from the skin and increases friction between skin and clothing (RH high) or leads to conditions of dryness on the skin and mucous (RH low). Twelve male workers, classed into three groups of four workers each, according to age (Table 1), were monitored.
The sampling scheme adopted (Figure 1) was carried out in accordance with the EN ISO 8996:2021 standard, level 4 for experts, to be adopted for light and moderate work. The steady state is reached after a period of 3 min (preliminary period) during which work is performed at low intensity, and the main period (full activity) lasts 10 min, with regular, continuous sampling. An additional 5-min non-work (rest phase) period, during which the operator suspended work and assumed a posture suitable for recovering the energy consumed during the work phase, was also monitored to evaluate the energy recovery process.
A STIHL brush cutter model FS87R, with a mass of 5.3 kg, motor power of 0.95 kW and a total length of 180 cm, was used during the tests. Three different cutting heads (Figure 2) were tested: (A) a grass-cutting blade for gnarled bushes, young trunks, and low cutting; (B) a shredding blade for tough undergrowth; (C) a brush-cutting blade for thinning and removal of tough grass, plant felt and brushwood. For each worker, an average of three replicates of the sampling scheme were performed for each blade type (totalling nine replicates per worker).

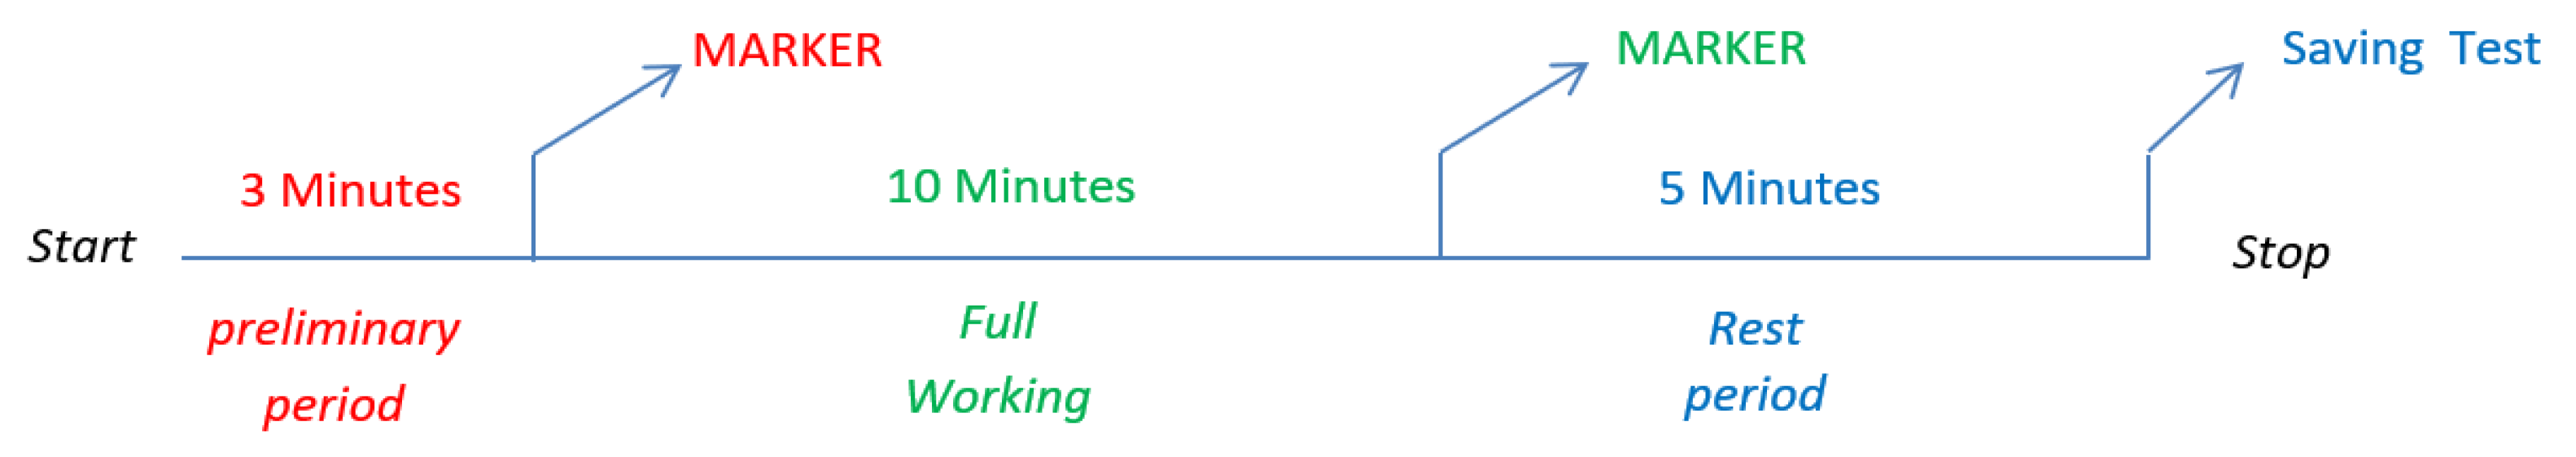
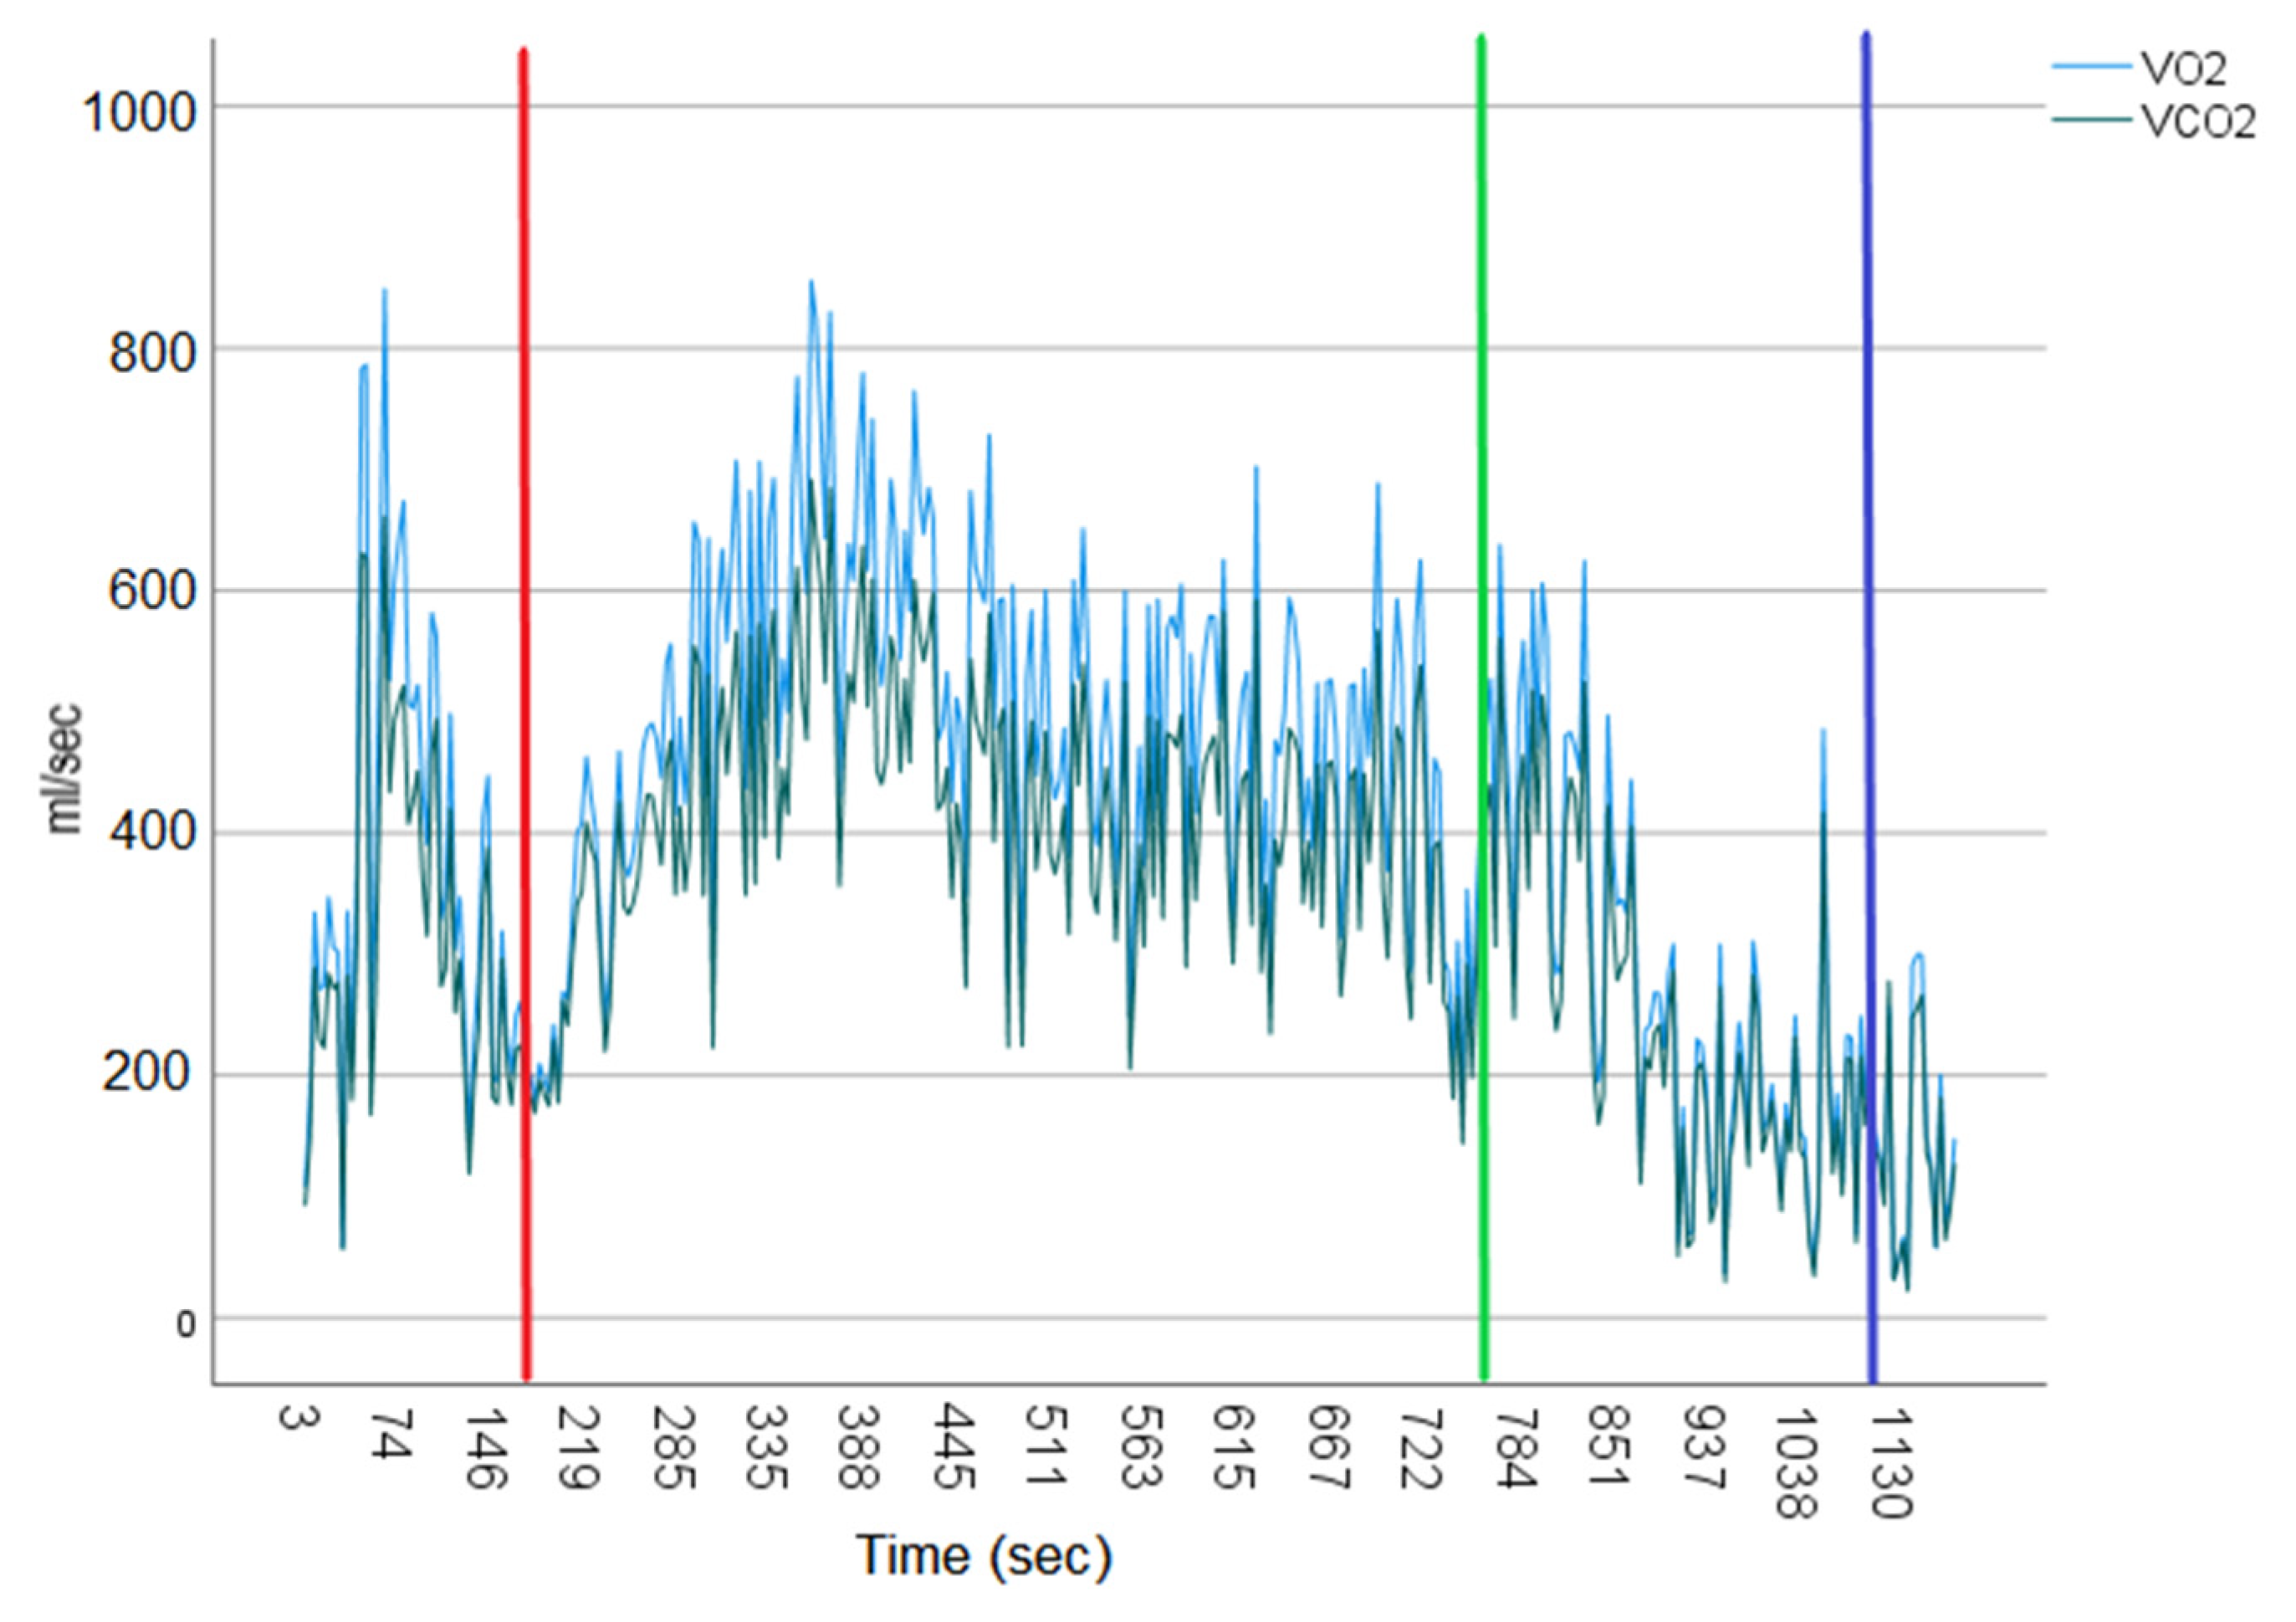
2.2. Determination of Metabolic Rate from Oxygen Consumption Rate

In accordance with EN ISO 8996:2021, the evaluation of the stress and physical fatigue of each operator was achieved by calculating the energy metabolism determined by the equations (Equations (1)–(3)):
R Q = V ˙ C O 2 V ˙ O 2
E E = ( 0.23 R Q + 0.77 ) 5.88
M = E E × V ˙ O 2 × 1 A D u
where:
R Q : respiratory quotient;
V ˙ O 2 : oxygen consumption rate (lO2 h−1);
V ˙ C O 2 : carbon dioxide production rate (lCO2 h−1);
E E : energetic equivalent, (Wh lO2−1);
M : is the metabolic rate, in Wm−2;
A D u : body surface area (m2), given by the Du Bois formula (Equation (4)):
A D u = 0.202 × W b 0.425 × H b 0.725
where:
W b : body weight (kg);
H b : the body height (m).
Measurements were carried out using the portable metabolimeter K4b2 (COSMED), fixed to the workers by an anatomic harness. Several parameters were recorded including minute ventilation (VE), oxygen uptake ( V ˙ O 2 ), carbon dioxide production ( V ˙ C O 2 ), respiratory quotient (RQ), temperature and air pressure. The K4b2 turbine flow meter was calibrated according to the manufacturer’s instructions. A 3-litre calibration syringe was used [25]. The O2 and CO2 sensors were calibrated using gases of known concentrations (15.06% O2, 5.97% CO2). As described in the K4b2 user manual, room air and delay calibrations were also performed. At the end of each test, the calibration gas was sampled by the K4b2 to assess analyser drift during the test. With a difference between the two methods of 0.06%, Parr et al., 2001 [26] demonstrated that the K4b2 is as accurate as the Douglas bag. In addition, heart rate was measured using a Polar Vantage NV heart rate sensor (Polar Electro, NY, USA). The data from this was synchronised with the K4b2 recordings.

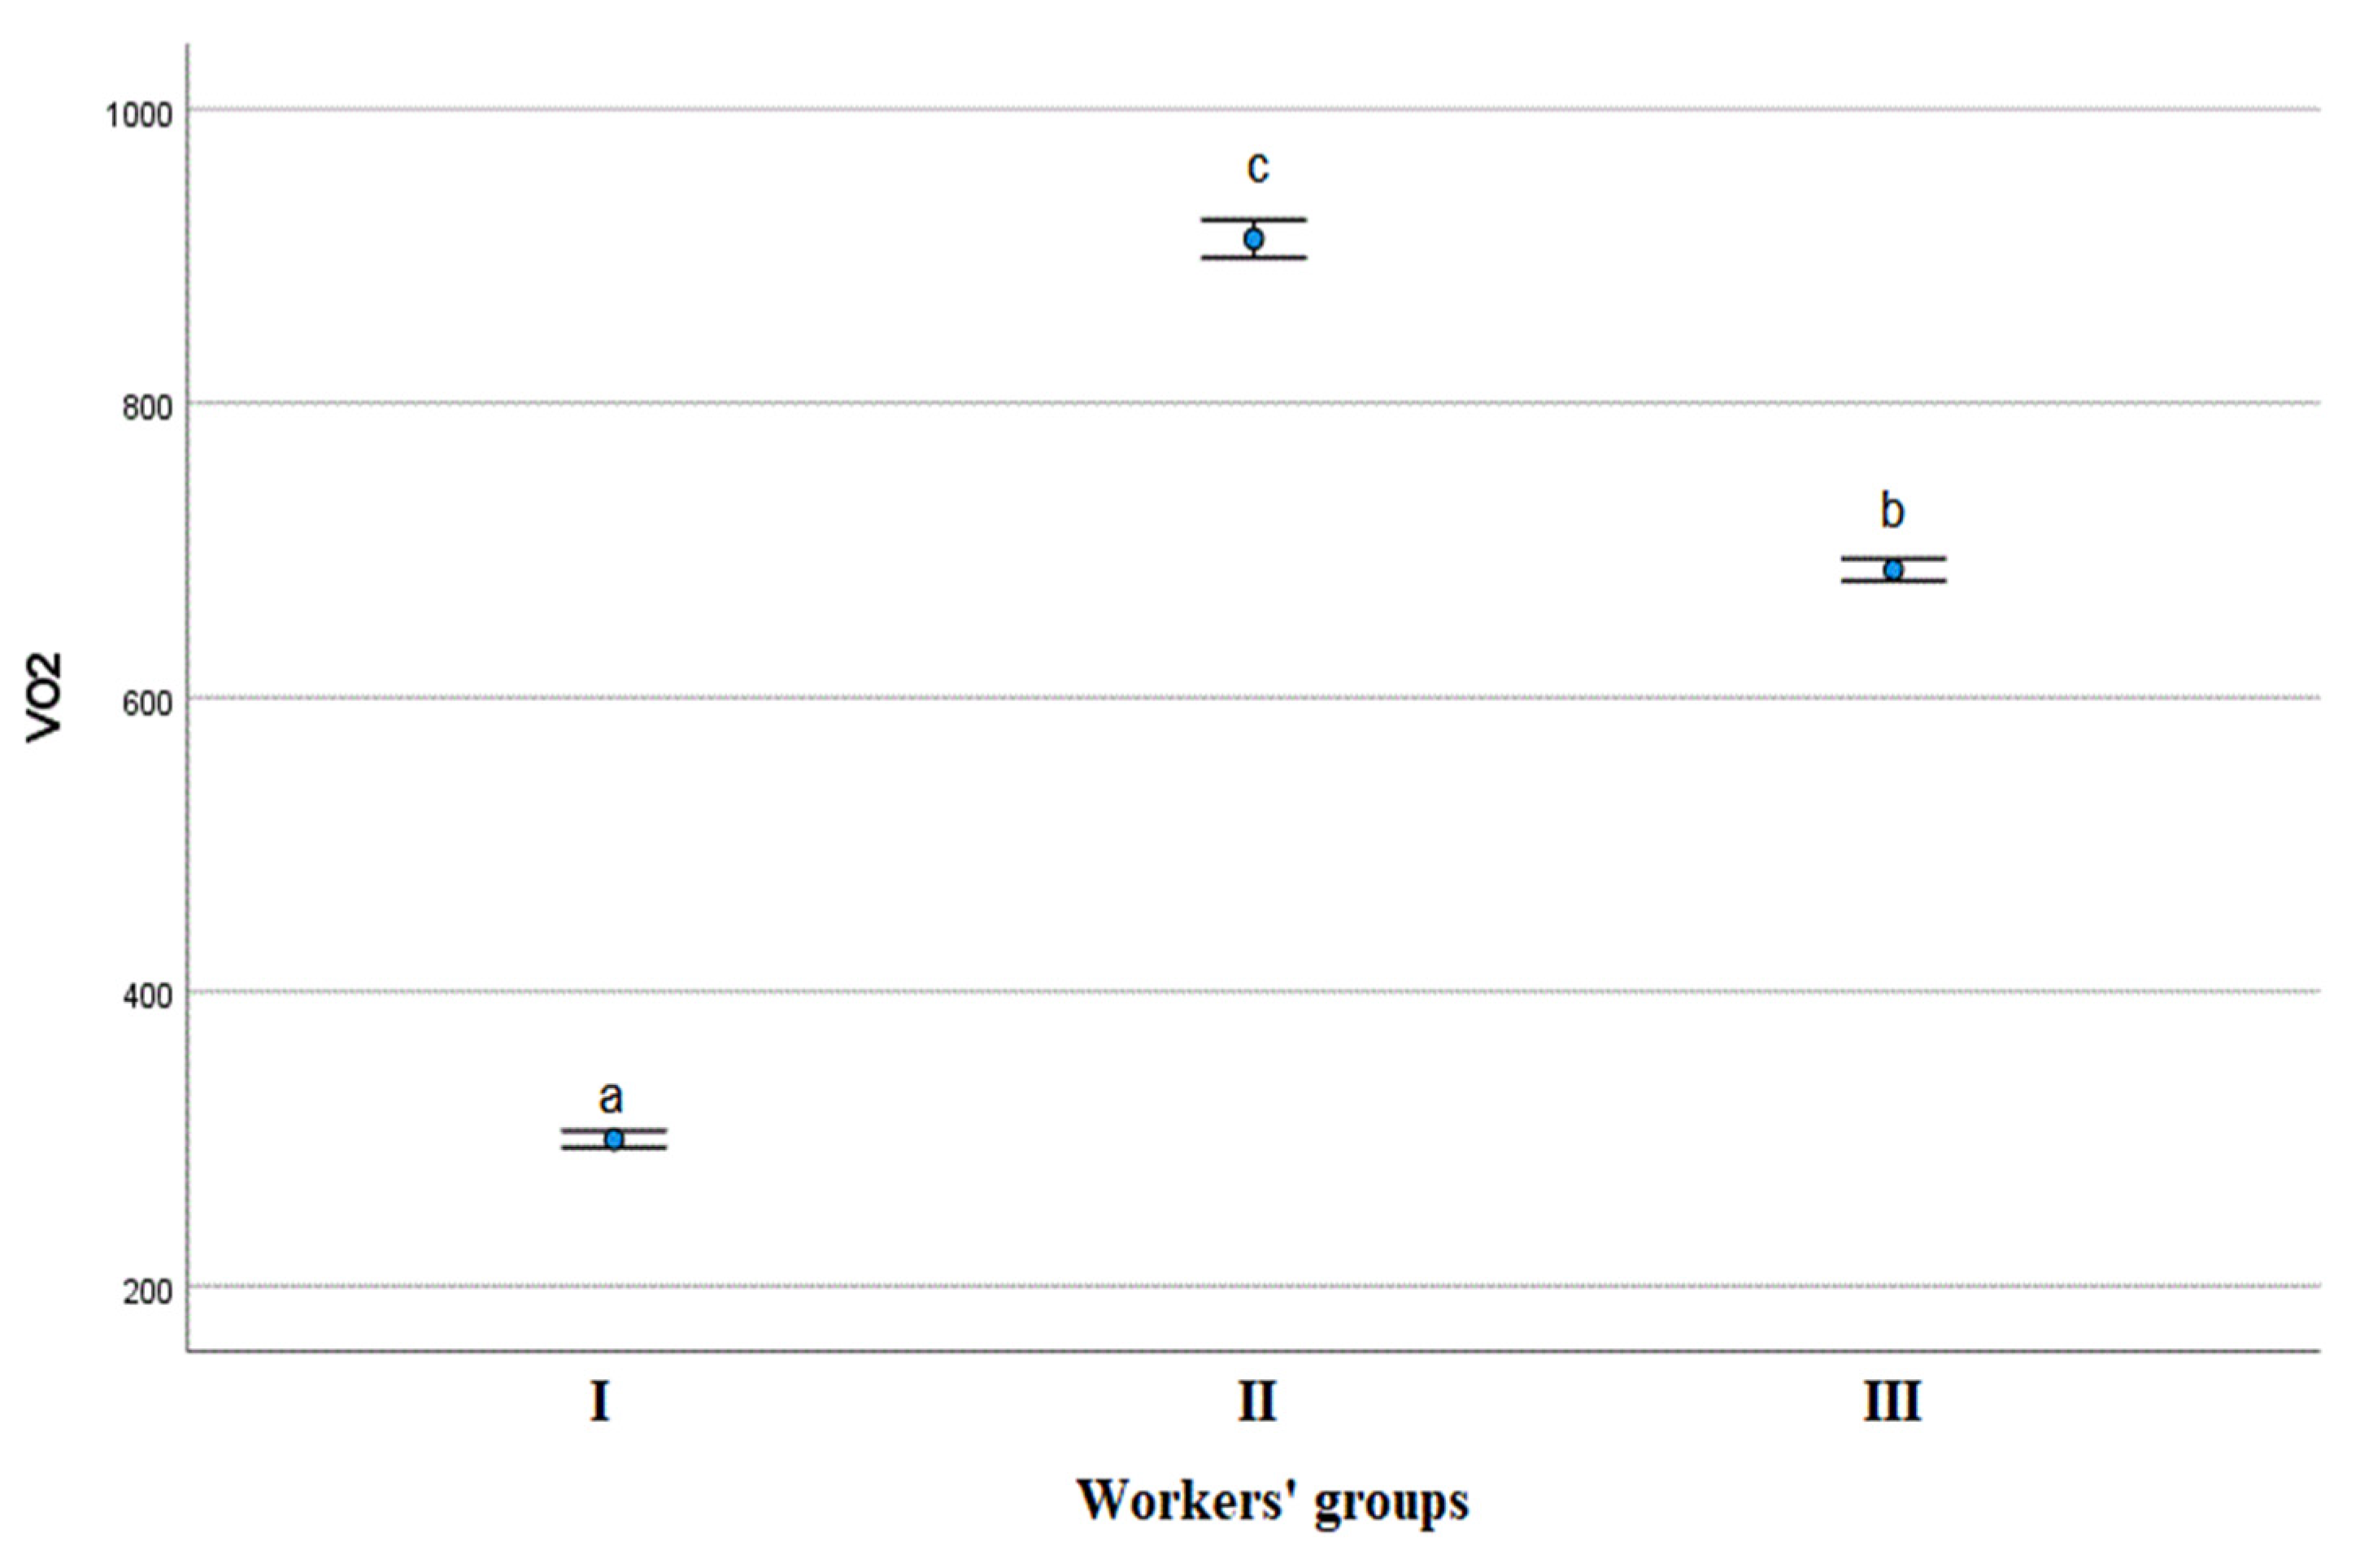
2.3. Statistical Analysis
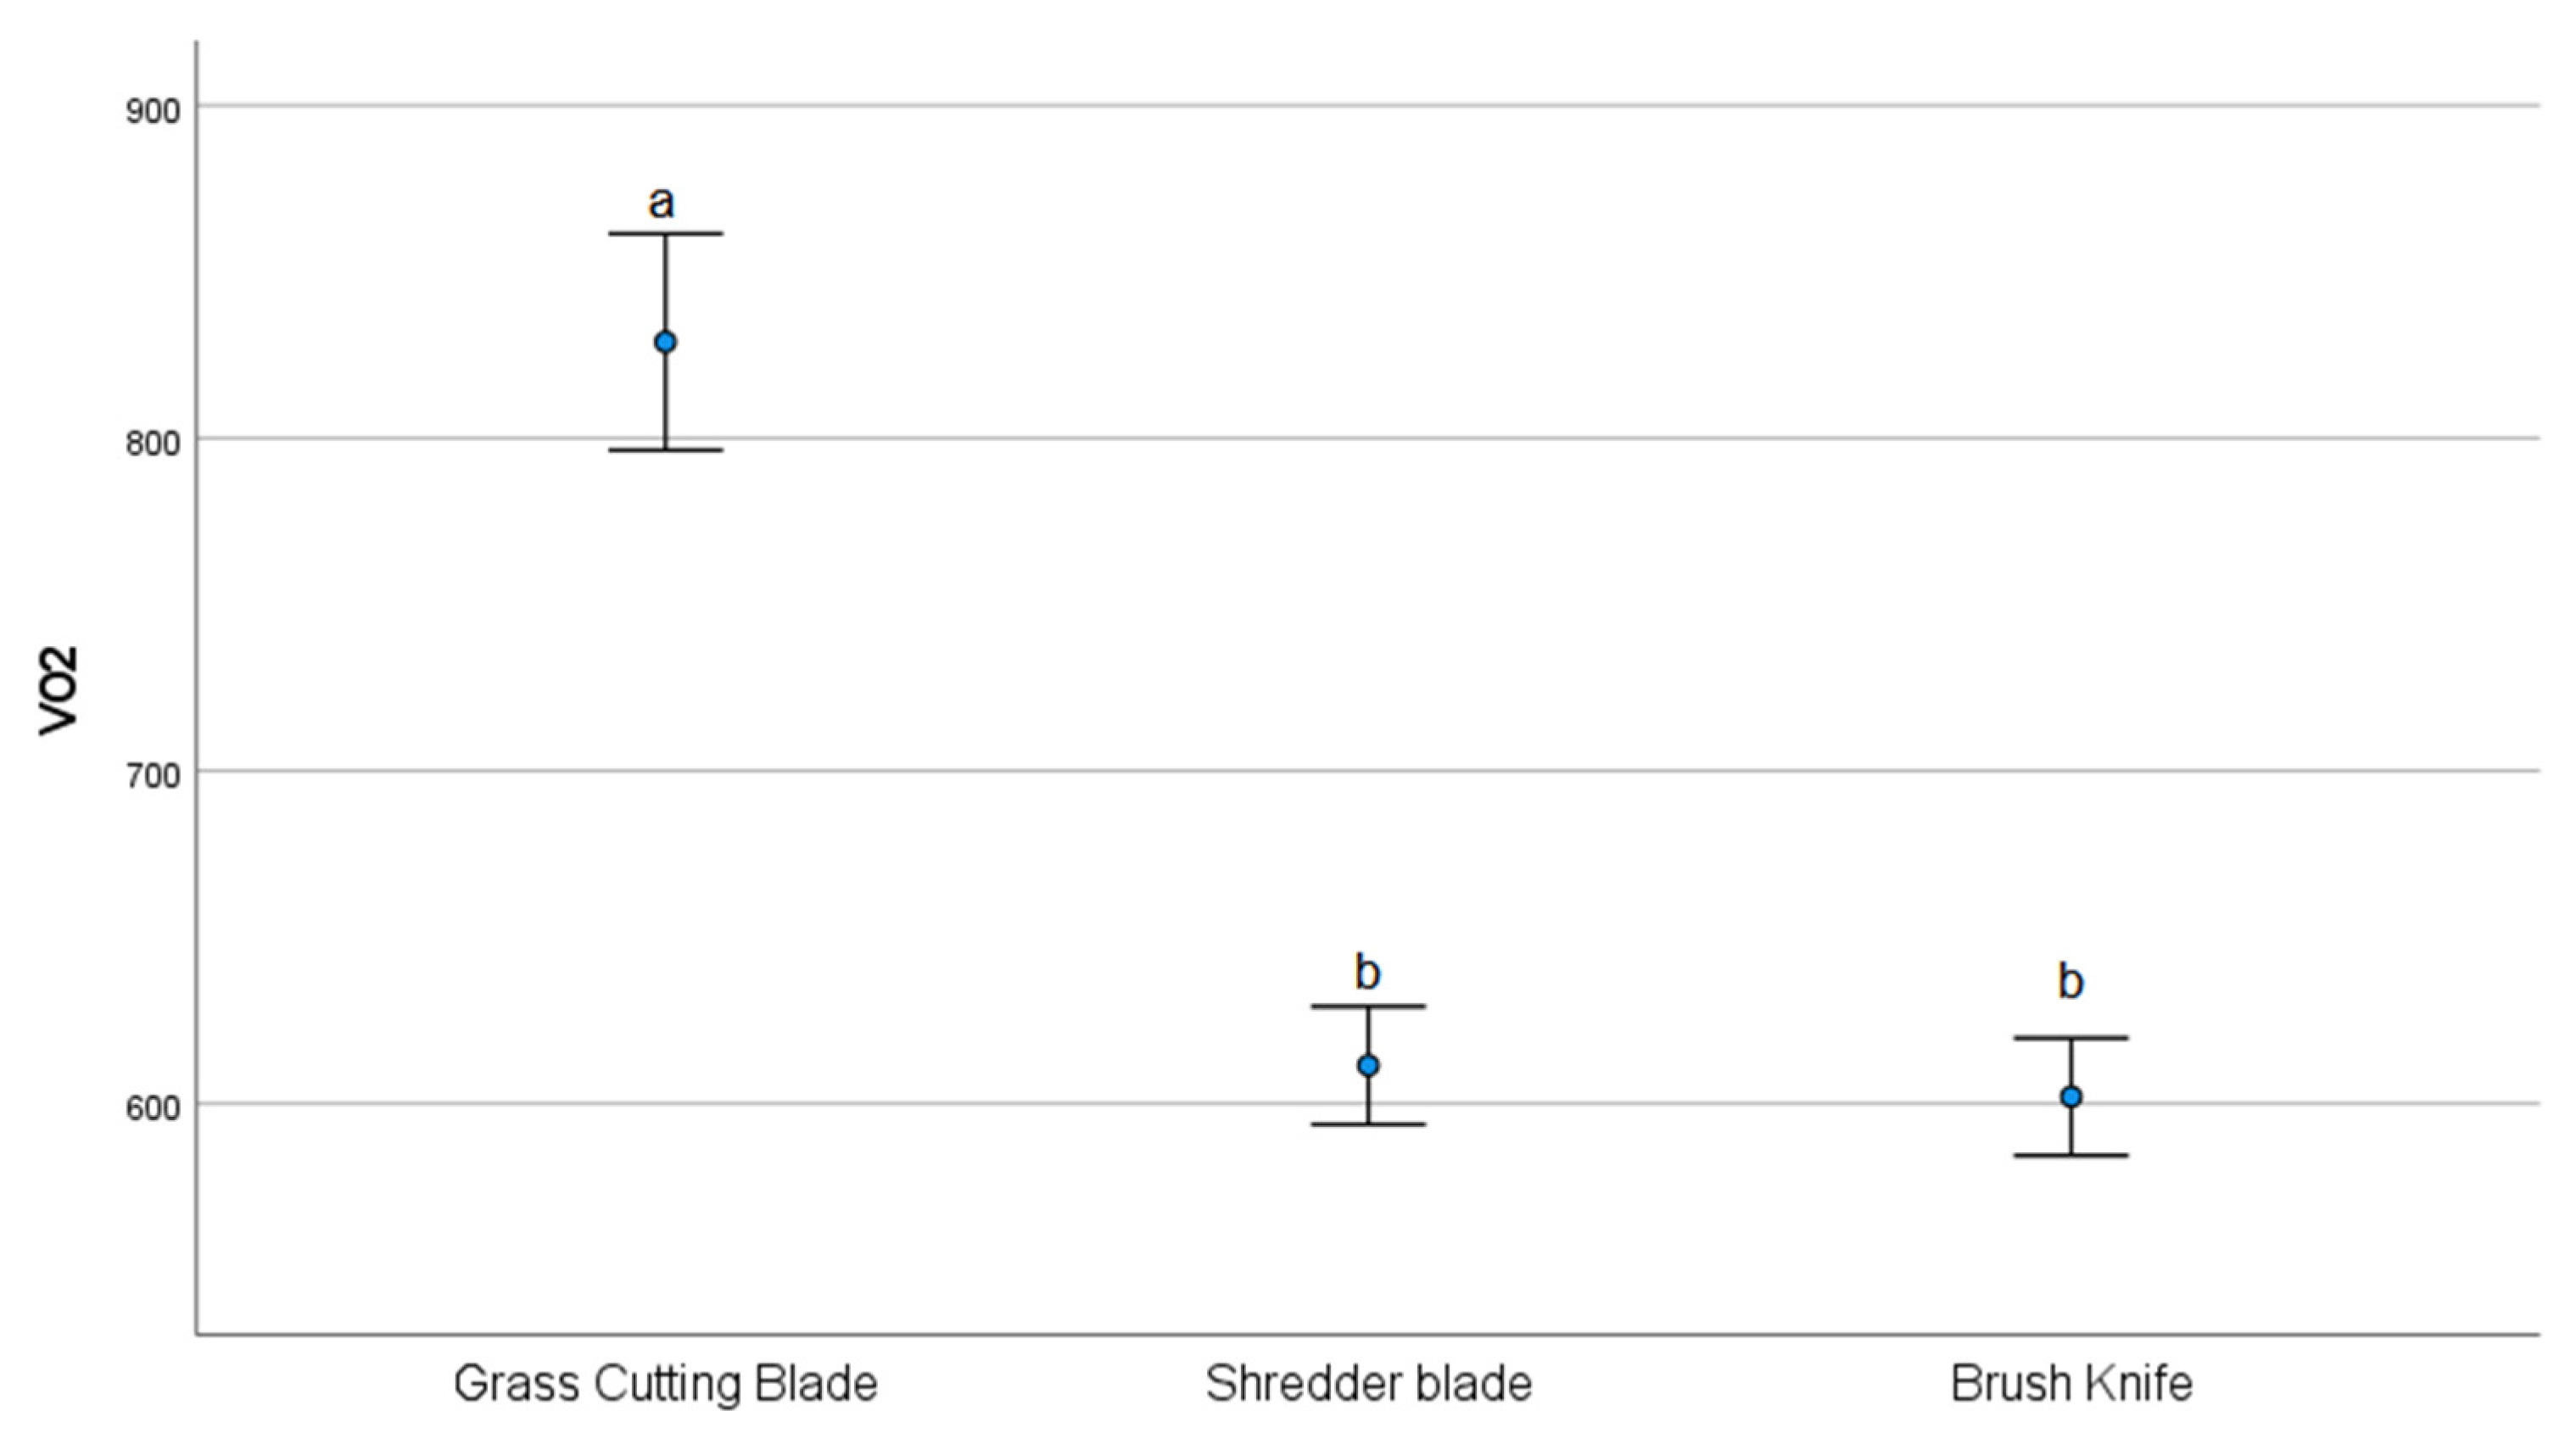
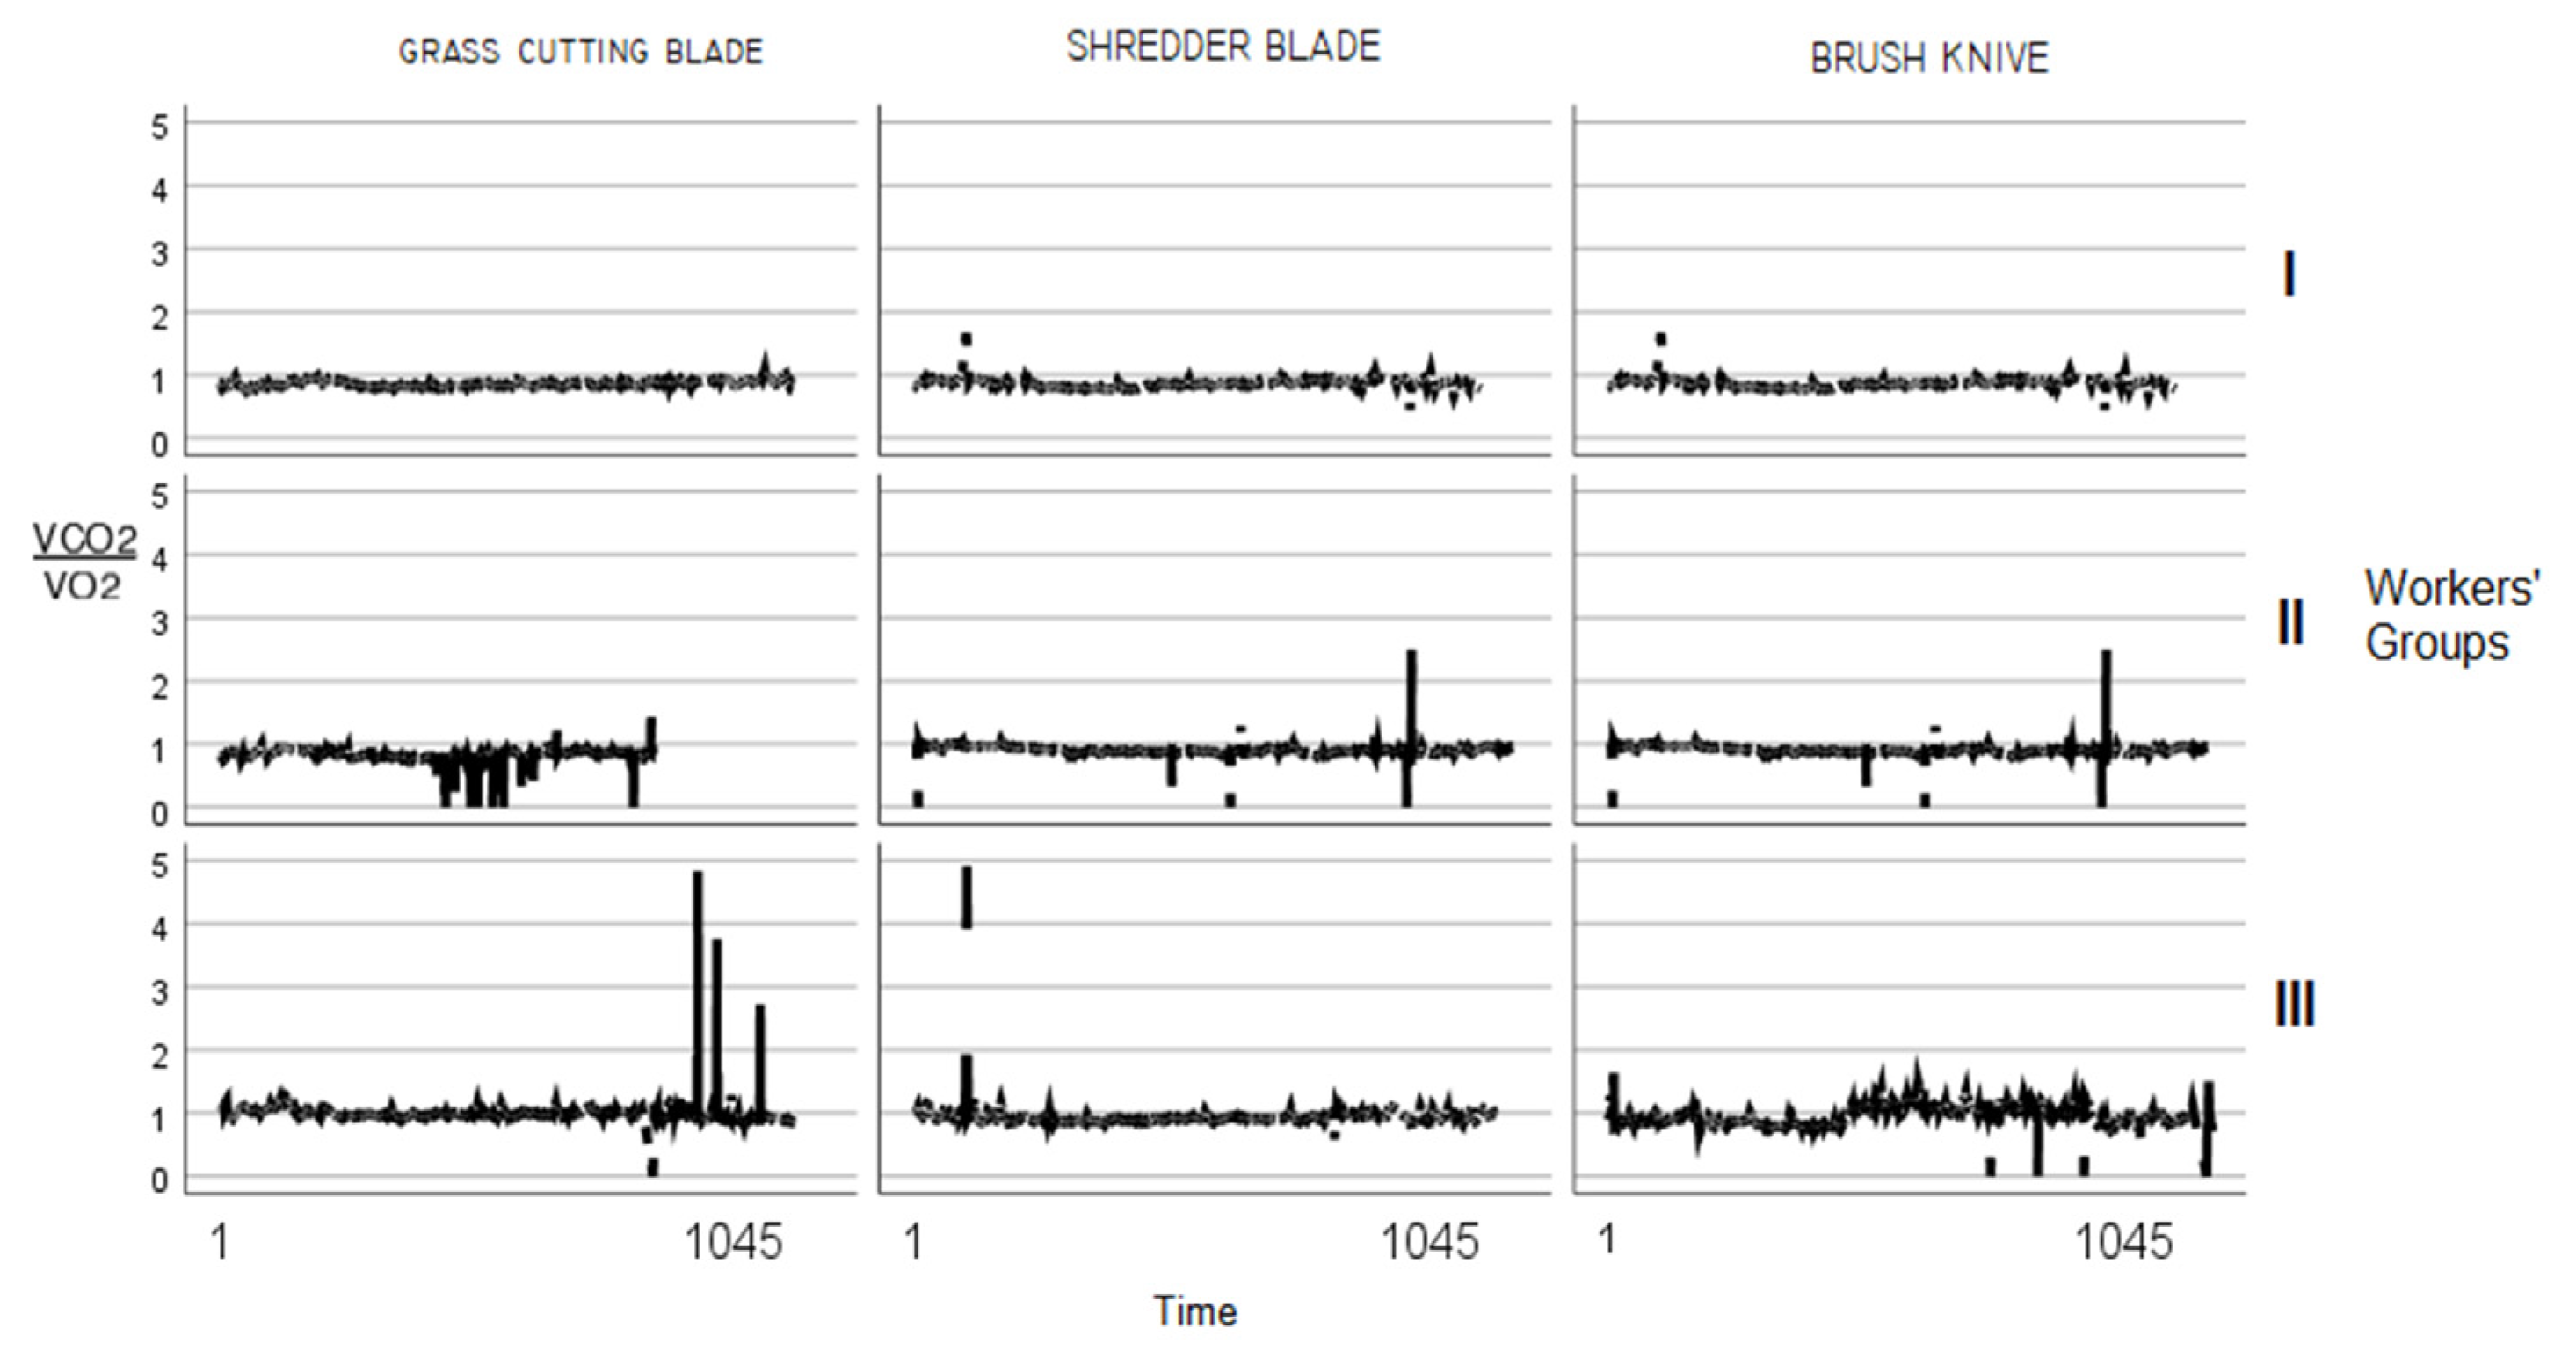
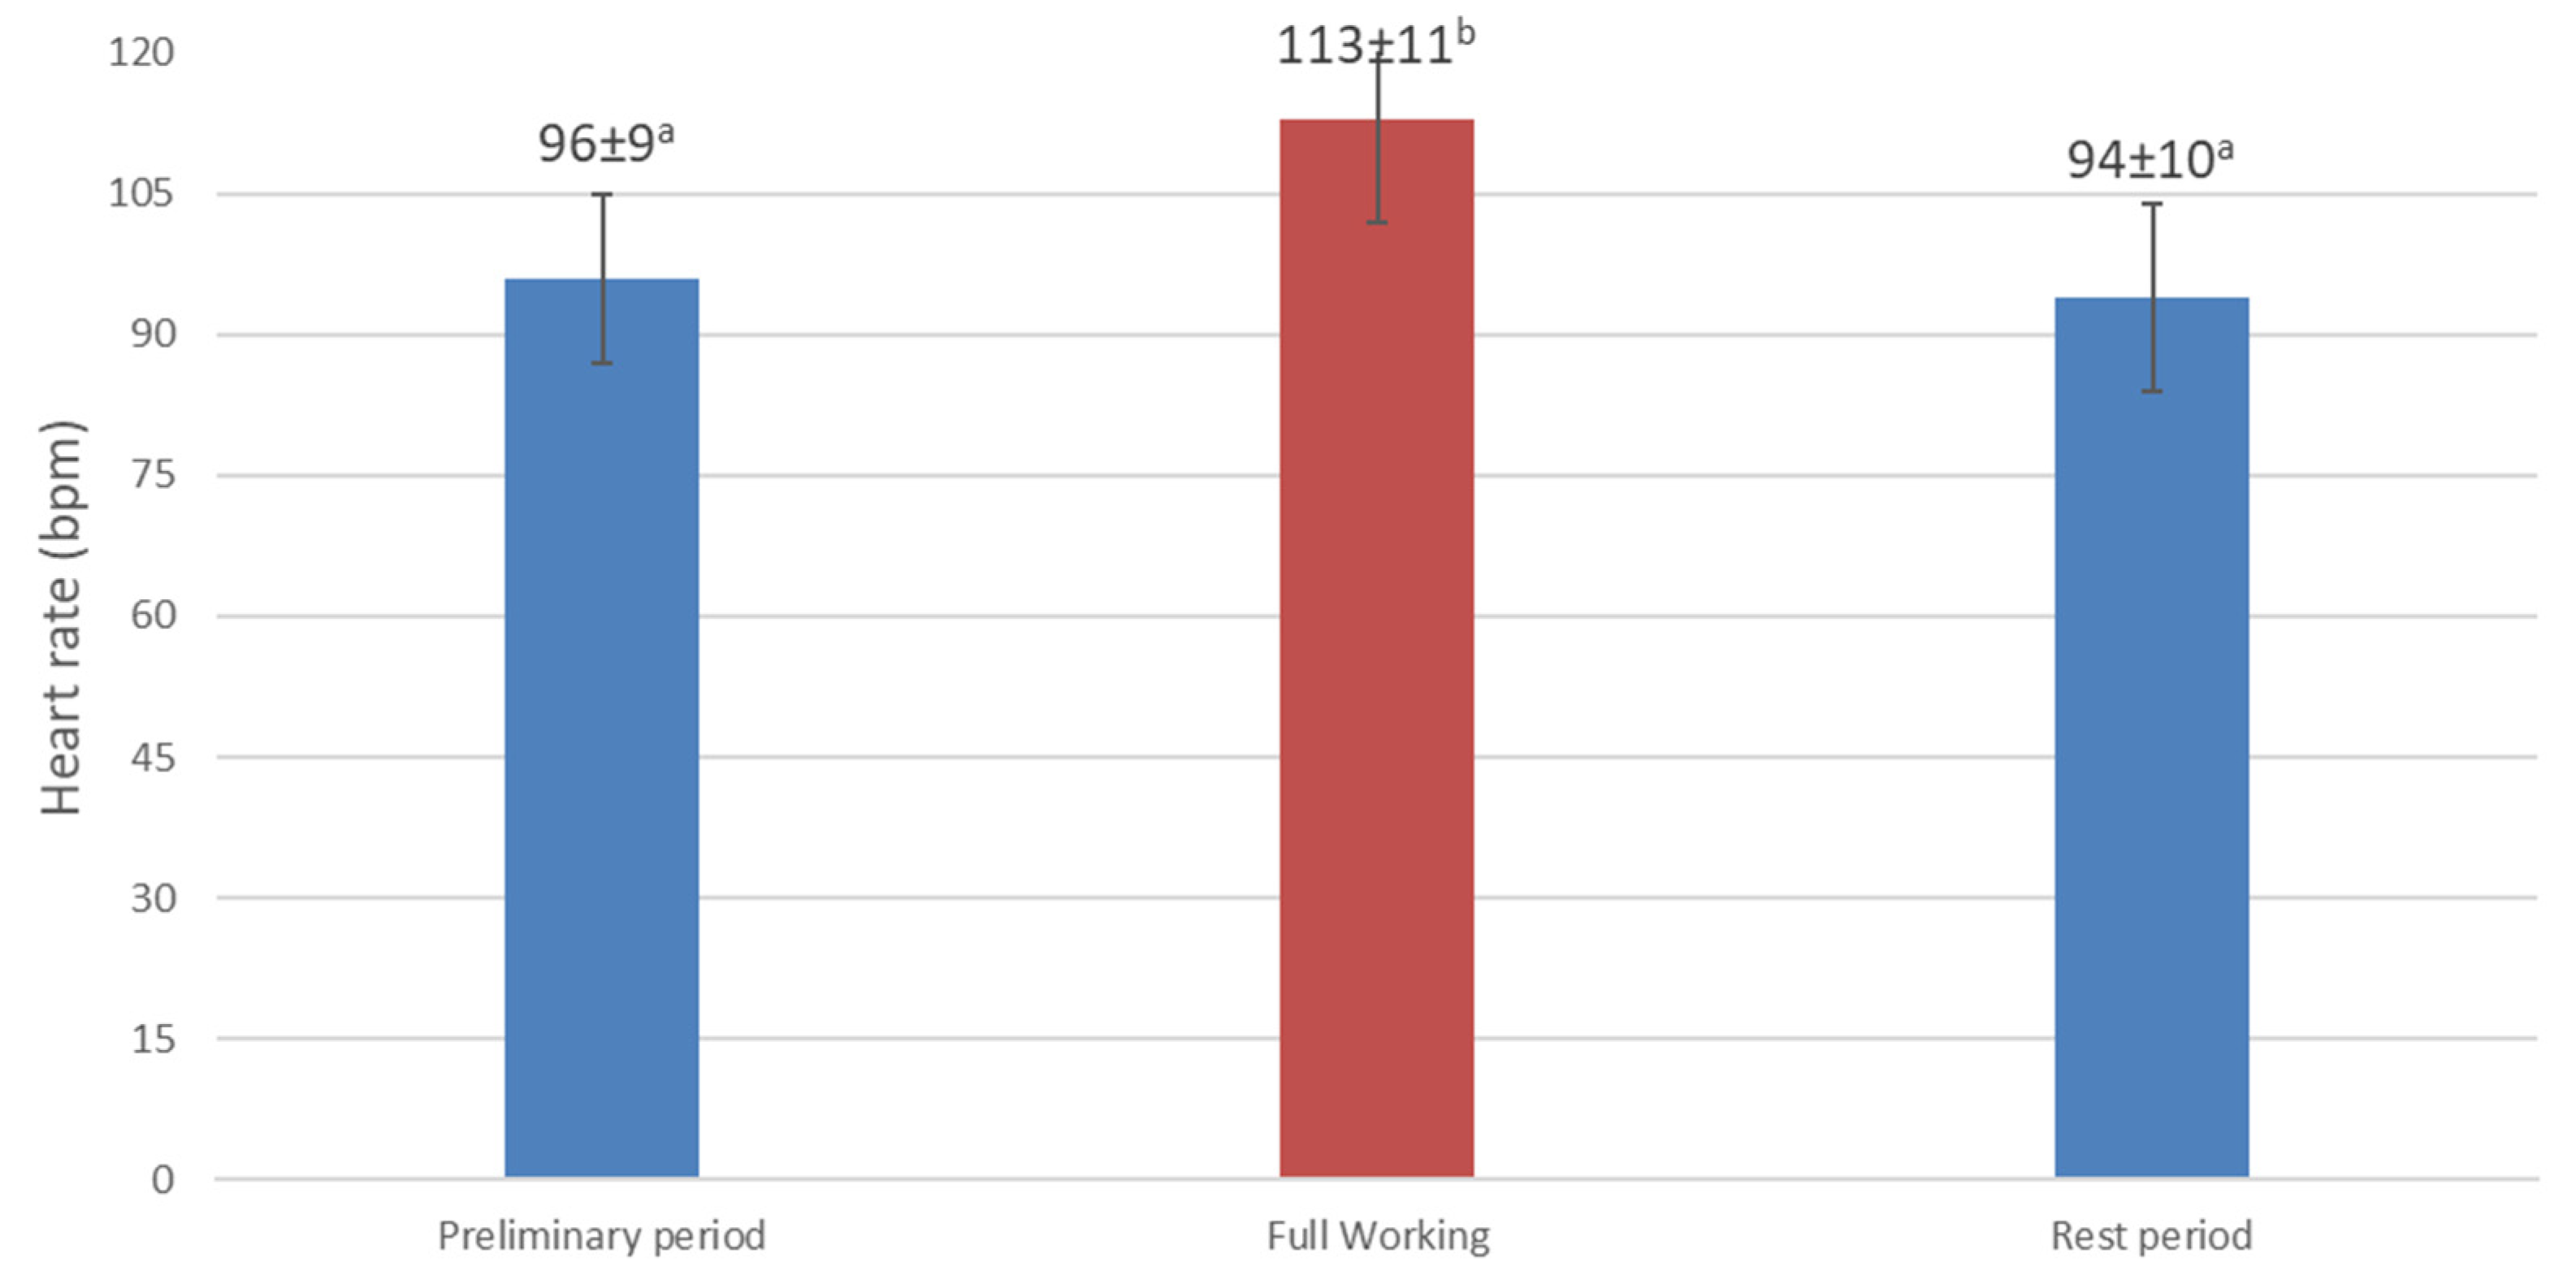
Analysis of variance was applied to the data to determine significant differences between the result means. It was conducted to check VO2 and VCO2 consumed by worker groups during the trial period using different cutting blades. Also, heart rate and energy metabolism were tested. To identify differences between the groups, when significant differences were observed, Duncan’s multiple range test was performed post-analysis, with a significance level of p < 0.05. Free R software Version 4.0.4 (R Foundation for Statistical Computing Platform) was used for data processing.

3. Results

Concerning the evolution of the volume of oxygen consumed (VO2), considering workers of group I during the use of grass cutting blade, it was on average 25.56 ± 0.57 lO2h−1. Dividing this consumption into the three monitoring phases, during the preliminary phase, i.e., the phase of low initial activity, this value averaged 22.25 ± 1.56 lO2h−1, reaching 29.64 ± 1.28 lO2h−1 during the full working phase. In the resting phase, the value was 15.42 ± 1.02 lO2h−1.
Carbon dioxide production rate (VCO2) was averaged at 18.62 lCO2h−1, with values, respectively, of 18.3 ± 0.52 lCO2h−1, 24.96 ± 1.45 lCO2h−1 and 13.5 ± 1.05 lCO2h−1 for the three different monitoring phases. The maximum consumption of O2 was 51.34 lO2h−1 while that of CO2 production was 39.66 lCO2h−1.
As shown in Figure 3, showing the average VO2 and VCO2 values of group I while using the cutting blade, there is a peak in oxygen consumption in the preliminary period (red line), which coincides with the start of work, and then tends to stabilise as work becomes fully operational. During the full work phase, consumption rises again, increasing the time during which the body is engaged in the operative phase. As the end of work approaches, consumption tends to stabilise downwards, indicating that the operator is preparing himself for the end of work.
Referring to VO2 consumption (mL/s), Figure 4 shows the difference between the groups, with II group recording the highest O2 consumption (912 ± 12) respect groups I (300 ± 5) and III (687 ± 7). With regard to the type of blade mounted on the brush cutter, the shredder blade (611 ± 8) and brush knife (601 ± 8) are more suitable for the work performed than the grass-cutting blade (828 ± 16), recording a significantly lower O2 consumption (Figure 5). This indicates that the first type of blade is not the most suitable for the type of turf present, thus increasing the number of actions required to remove weeds.
The maximum level of work (or O2 consumption) that can be achieved without metabolic lactic acid production is referred to as the respiratory quotient RQ, expressed as in Equation (1) when it takes a value equal to 1.
Figure 6 shows the trend of VO2 and VCO2 as a function of time for worker groups during the use of the blades. In all the cases analysed, this value is around 0.95. This indicates that the work is carried out without lactic acid production in the aerobic zone.
In the Y-axis the workers’ group is listed.
The average heart rate (HR) was 113 ± 12 beats per minute (bpm), with a maximum of 149 ± 7 bpm. The tests showed that heart rates were similar during the preliminary and rest periods of the trials but increased during the full work phase (Figure 7). The difference between the groups’ heart rates is an average difference of ±25 bpm. This is a rather low difference for field trials considering that, according to ISO 8996:200, the variation between recorded observations can be up to 20%.
Finally, regarding energy metabolism (M), calculated according to Equation (3), it averages 119 Wm−2. The three groups showed significant differences in their metabolisms according to blades used (group I is the lowest, while group II is the highest) (Figure 8). This is confirmed by the results of oxygen consumption, which is higher when grass cutting blade is used. Energy consumption is generally lower for group I, which is made up of operators with a younger age than those in groups II and III.

4. Discussion

We hypothesised that the use of facilitating tools such as brush cutters would contribute to achieving low energy metabolic rate values, taking into account the different ages of the workers. Considering the measured average consumption of equivalent to 119 Wm−2, and considering an average working day of 8 h, the final energy consumption will, therefore, be over 930 Wm−2. Table 2 shows the energy metabolism per class according to the type of activity, as defined by the UNI EN ISO 8996:2005 standard. Comparison of the analysed data with the data in the table, according to the further classification established by the same standard and subdivided by type of activity, there is low energy consumption for the type of tests carried out, which also falls entirely within the “agriculture” sector of “gardening”, confirming our hypothesis.
Unfortunately, very few studies in the literature can be compared with this research, due to the different conditions considered. The only similar research was conducted by Bernardi et al., 2020 [27] which found a very close metabolic rate equal to 159 Wm−2. Looking at the most related sector, agriculture, Callea et al., 2014 [19] found that energy expenditure for picking apples ranged from 200 to 260 Wm−2. Yadav et al., 2010 [28] highlighted that the average physiological cost for a male worker in weeding by sickle was 264 W, while it was 235 W for a female worker in manual weeding. Ocan et al., 2013 [29] found energy expenditure for digging and weeding to be 26 ± 5 W, 22 ± 5 W for men and 26 ± 5 W, 24 ± 5 W for women. Poulianiti [18] reported energy costs of 400 and 200 W for men and women in agriculture, forestry and fishing.
Given the anthropometric data, we would have expected older workers to have the highest consumption. Instead, the results obtained showed that group II had the highest O2 consumption. To explain why this result was obtained, it would have been necessary to carry out extensive laboratory analyses on the general health status of the workers, such as instrumental examinations, blood samples, etc. However, this was not the purpose of the study, which focused on the general health status of the workers during in field phase.
Moreover, major differences have been identified evaluating the performance deriving from the type of blade used type, with the shredder blade and brush knife proving to be the most efficient. This is attributable to the type of managed topsoil, as the grass-cutting blade is not very suitable for the present turf, being designed for gnarled bushes and young trunks.
Working speed had no significant effect on heart rate. This is due to the stationary nature of the work and the orographic conditions of the site. However, according to Toupin et al., 2007 [30], variations in heart rate could be recorded as the number of obstacles in the search area varied.
All subjects who participated in this study were specialised in their work, and therefore, not exposed to the risks of over and unusual physical activity. However, the condition of being subjected to a study with individual, albeit voluntary, measurement may have unintentionally influenced the workers’ performance by overestimating their efficiency. The instrumentation used, to which they were not accustomed, could represent another disturbing component. Furthermore, the climatic conditions recorded during the tests can be considered optimal, thus not burdening the workers negatively. According to Brun, 1992 [31], large intra- and inter-individual differences in energy costs occur in rural activities, and the results seem to be within acceptable limits when doing light work. Because the analysis was based on relatively small numbers, more evidence is needed.

5. Conclusions

This study aimed to measure the energy cost of weed control using a wearable telemetry system Cosmed K4 to assess whether the work carried out conforms to the parameters set out in standard EN ISO 8996:2021. Twelve male workers, grouped into three balanced classes were monitored during the work of weed control carried out with a brush cutter (by testing three different cutting heads). The monitoring period lasted 18 min including a 5-min rest period at the end of work. The research shows how the use of facilitating tools, such as brush cutters, contributes to getting low energy metabolism rate values, in tests performed equally on average to 119 Wm−2. Based on an average working day of 8 h, the hypothetical final energy consumed is over 930 Wm−2.
The present study highlights the advantages of the use of assistive devices, such as brush cutters, where workers are in a state of fatigue-free operation away from the anaerobic threshold. The current legal requirements concern the protection of workers’ well-being in a global context where, in addition to traditional risk factors, new attention is being paid to so-called “ergonomic” aspects that affect workers’ psychophysical well-being.

Author Contributions

B.B.: Conceptualisation, Data curation, Writing—original draft, Writing—review and editing, Project administration. G.F.: Data curation, Formal analysis, Writing—original draft. G.M.: Writing—original draft, Writing—review and editing. A.F.: Data curation, Formal analysis, Writing—original draft. S.B.: Writing—original draft, Writing—review and editing. G.Z.: Supervision, L.M.M.A.: Writing—original draft, Supervision. All authors have read and agreed to the published version of the manuscript.

Funding

This research received no external funding.

Data Availability Statement

Not acceptable.

Conflicts of Interest

The authors declare no conflict of interest.

References

  1. Campagnaro, T.; Sitzia, T.; Cambria, V.E.; Semenzato, P. Indicators for the Planning and Management of Urban Green Spaces: A Focus on Public Areas in Padua, Italy. Sustainability 2019, 11, 7071. [Google Scholar] [CrossRef]
  2. Fargnoli, M.; Lombardi, M.; Haber, N.; Puri, D. The Impact of Human Error in the Use of Agricultural Tractors: A Case Study Research in Vineyard Cultivation in Italy. Agriculture 2018, 8, 82. [Google Scholar] [CrossRef]
  3. Iofrida, N.; De Luca, A.I.; Silveri, F.; Falcone, G.; Stillitano, T.; Gulisano, G.; Strano, A. Psychosocial risk factors’ impact pathway for social life cycle assessment: An application to citrus life cycles in South Italy. Int. J. Life Cycle Ass. 2018, 24, 767–780. [Google Scholar] [CrossRef]
  4. Bernardi, B.; Quendler, E.; Benalia, S.; Mantella, A.; Zimbalatti, G. Occupational risks related to vibrations using a brush cutter for green area management. Ann. Agric. Environ. Med. 2018, 25, 255–258. [Google Scholar] [CrossRef]
  5. Aiello, G.; La Scalia, G.; Vallone, M.; Catania, P.; Venticinque, M. Real time assessment of hand-arm vibration system based on capacitive MEMS accelerometers. Comput. Electron. Agric. 2012, 85, 45–52. [Google Scholar] [CrossRef]
  6. Gómez-Galán, M.; Pérez-Alonso, J.; Callejón-Ferre, Á.-J.; López-Martínez, J. Musculoskeletal disorders: OWAS review. Ind. Health 2017, 55, 314–337. [Google Scholar]
  7. Gómez-Galán, M.; Pérez-Alonso, J.; Callejón-Ferre, Á.-J.; Sánchez-Hermosilla-López, J. Assessment of Postural Load during Melon Cultivation in Mediterranean Greenhouses. Sustainability 2018, 10, 2729. [Google Scholar] [CrossRef]
  8. EN ISO 8996:2021. Ergonomics of the Thermal Environment-Determination of Metabolic Rate. International Organization for Standardization: Geneva, Switzerland, 2021.
  9. Sunkpal, M.; Roghanchi, P.; Kocsis, K.C. A method to protect mine workers in hot and humid environments. Saf. Health Work 2018, 9, 149–158. [Google Scholar] [CrossRef]
  10. Ventura, F.; D’Auria, R. Prevenzione e Sicurezza Sul Lavoro in Agricoltura: Conoscenze e Costi Per le Aziende Agricole; Rete Rurale Nazionale—MiPAAF—DISRII: Rome, Italy, 2014. [Google Scholar]
  11. Del Ferraro, S.; Molinaro, V. Lo studio dell’attività metabolica per una corretta valutazione del rischio da esposizione ad ambienti termici. La Med. Del Lav. 2010, 101, 38–48. [Google Scholar]
  12. Marucci, A.; Monarca, D.; Cecchini, M.; Colantoni, A.; Di Giacinto, S.; Cappuccini, A. The heat stress for workers employed in a dairy farm. J. Agric. Eng. 2014, 44, 170. [Google Scholar] [CrossRef]
  13. Lucena, A.; Guedes, J.; Vaz, M.; Silva, L.; Bustos, D.; Souza, E. Modeling Energy Expenditure Estimation in Occupational Context by Actigraphy: A Multi Regression Mixed-Effects Model. Int. J. Environ. Res. Public Health 2021, 18, 10419. [Google Scholar] [CrossRef] [PubMed]
  14. Guidetti, L.; Meucci, M.; Bolletta, F.; Emerenziani, G.P.; Gallotta, M.C.; Baldari, C. Validity, reliability and minimum detectable change of COSMED K5 portable gas exchange system in breath-by-breath mode. PLoS ONE 2018, 13, e0209925. [Google Scholar] [CrossRef]
  15. DeBlois, J.P.; White, L.E.; Barreira, T.V. Reliability and validity of the COSMED K5 portable metabolic system during walking. Eur. J. Appl. Physiol. 2021, 121, 209–217. [Google Scholar] [CrossRef] [PubMed]
  16. Mtaweh, H.; Tuira, L.; Floh, A.A.; Parshuram, C.S. Indirect Calorimetry: History, Technology, and Application. Front. Pediatr. 2018, 6, 257. [Google Scholar] [CrossRef] [PubMed]
  17. Ainsworth, B.E.; Haskell, W.L.; Herrmann, S.D.; Meckes, N.; Bassett, D.R., Jr.; Tudor-Locke, C.; Greer, J.L.; Vezina, J.; Whitt-Glover, M.C.; Leon, A.S. Compendium of Physical Activities: A Second Update of Codes and MET Values. Med. Sci. Sports Exerc. 2011, 43, 1575–1581. [Google Scholar] [CrossRef]
  18. Poulianiti, K.P.; Havenith, G.; Flouris, A.D. Metabolic energy cost of workers in agriculture, construction, manufacturing, tourism, and transportation industries. Ind. Health 2019, 57, 283–305. [Google Scholar] [CrossRef]
  19. Callea, P.; Zimbalatti, G.; Quendler, E.; Nimmerichter, A.; Bachl, N.; Bernardi, B.; Smorto, D.; Benalia, S. Occupational illnesses related to physical strains in apple harvesting. Ann. Agric. Environ. Med. 2014, 21, 407–411. [Google Scholar] [CrossRef]
  20. Tamilselvi, P.; Anantha, K.D. Ergonomic evaluation of conventional agricultural sprayers with respect to human performance. Agric. Sci. Dig. 2016, 36, 179–184. [Google Scholar] [CrossRef]
  21. Chethan, C.R.; Krishnan, D.A. Dynamic push-pull strength data generation for agricultural workers to develop manual dryland weeders. Curr. Sci. 2017, 113, 1601–1605. [Google Scholar] [CrossRef]
  22. Araie, T.; Nishizawa, U.; Ikeda, T.; Kakimoto, A.; Toyama, S. Evaluation of Labor Burden Reduction Achieved through Wearing an Agricultural Power Assist Suit. Int. J. Model. Optim. 2017, 7, 202–206. [Google Scholar] [CrossRef]
  23. Okubo, N.; Nakagawa, H.; Furuya, K.; Toi, T. Vibration Reduction of Brush Cutter. In Topics in Modal Analysis, Proceedings of the 31st IMAC, A Conference on Structural Dynamics, Garden Grove, CA, USA, 11–14 February 2013; Allemang, R., De Clerck, J., Niezrecki, C., Wicks, A., Eds.; Conference Proceedings of the Society for Experimental Mechanics Series 45; Springer: New York, NY, USA, 2013; Volume 7, pp. 377–387. [Google Scholar]
  24. Lstiburek, J. Relative humidity. In Proceedings of the Healthy Indoor Environments, Austin, TX, USA; 2003. [Google Scholar]
  25. COSMED, Suite Software Manuale Utente, V Edizione, 272; COSMED: Rome, Italy, 2013.
  26. Parr, B.B.; Strath, S.J.; Bassett, D.R., Jr.; Howley, E.T. Validation of the Cosmed K4b2 portable metabolic measurement system. Med. Sci. Sport Exerc. 2001, 33, 300. [Google Scholar] [CrossRef]
  27. Bernardi, B.; Abenavoli, L.M.; Franco, G.; Fazari, A.; Zimbalatti, G.; Benalia, S. Worker’s metabolic rate assessment during weeding. Qual. Access Success 2020, 21, 139–141. [Google Scholar]
  28. Yadav, R.; Pund, S.; Gite, L.P. Ergonomic evaluation of male and female operators during weeding operation. Agric. Mech. Asia Afr. Lat. Am. 2010, 41, 26–29. [Google Scholar]
  29. Ocan, H.; Kinabo, J.; Mamiro, P.; Nyaruhucha, C. Basal metabolic rate and energy expenditure or rural farmers in Magubike village, Kilosa district, Tanzania. Afr. J. Food Agric. Nutr. Dev. 2013, 13, 8128–8138. [Google Scholar] [CrossRef]
  30. Toupin, D.; LeBel, L.; Dubeau, D.; Imbeau, D.; Bouthillier, L. Measuring the productivity and physical workload of brushcutters within the context of a production-based pay system. For. Policy Econ. 2007, 9, 1046–1055. [Google Scholar] [CrossRef]
  31. Brun, T. The assessment of total energy expenditure of female farmers under field conditions. J. Biosoc. Sci. 1992, 24, 325–333. [Google Scholar] [CrossRef]
Figure 1. Sampling test scheme adopted to monitor the energy consumed. Three periods can be distinguished: preliminary period of 3 min (in red on the left); the main period of full working of 10 min (in the centre in green); the rest period of non-work with a duration of 5 min (in blue on the right).
Applsci 13 09671 g001
Figure 2. Types of blades used: (A) Grass Cutting Blade; (B) Shredder blade; (C) Brush Knife.
Applsci 13 09671 g002
Figure 3. Average values of VO2 and VCO2 by group I with grass-cutting blade during the test. The red vertical line delimits the preliminary period, while the green and blue lines delimit the full-working and rest periods respectively.
Applsci 13 09671 g003
Figure 4. VO2 consumed by worker groups on average during the trial period (mean ± standard error). In the X-axis the workers’ group is listed. Data marked with different non-capital letters are significantly different by Duncan’s test (p < 0.05).
Applsci 13 09671 g004
Figure 5. VO2 consumed on average during the trial period using the different cutting blades (mean ± standard error). Data followed by different non-capital letters are significantly different according to Duncan’s test (p < 0.05).
Applsci 13 09671 g005
Figure 6. Ratio of VCO2 to VO2 (mL/min) recorded for operators during the use of blades.
Applsci 13 09671 g006
Figure 7. Average heart rate recorded in the three monitoring phases (mean ± standard error). Data marked with different non-capital letters are significantly different by Duncan’s test (p < 0.05).
Applsci 13 09671 g007
Figure 8. Energy metabolism per group and type of blade used (mean ± standard error). The performance of group I is shown in light blue, that of group II in dark green and that of group III in red.
Applsci 13 09671 g008
Table 1. Anthropometric data of workers (range).
Worker GroupsAge
(Years)
Mass
(kg)
Height
(cm)
I20–3070–75160–170
II31–4075–80160–175
III41–5070–75165–170
Table 2. Classifying metabolic rate into categories at level 1, screening (method 1B).
CLASSAverage Metabolic Rate
Wm−2
0 Resting65 (55 to 70)
1 Low metabolic rate100 (70 to 130)
2 Moderate metabolic rate165 (130 to 200)
3 High metabolic rate230 (200 to 260)
4 Very high metabolic rate290 (>260)
Disclaimer/Publisher’s Note: The statements, opinions and data contained in all publications are solely those of the individual author(s) and contributor(s) and not of MDPI and/or the editor(s). MDPI and/or the editor(s) disclaim responsibility for any injury to people or property resulting from any ideas, methods, instructions or products referred to in the content.

