Abstract
In the last decade, plastic waste has become one of the main threats to marine ecosystems and their biodiversity due to its abundance and increased persistence. Microplastics can be classified as either primary, i.e., fabricated for commercial use, or secondary, i.e., resulting from the fragmentation/weathering processes of larger plastic pieces in the environment. In general, microplastics are detected in a number of aquatic organisms (e.g., fish, bivalves, mollusks, etc.) with alarming effects on their health. Therefore, the present work focuses on the detection and identification of microplastics in fish species (Dicentrarchus labrax, Sparus aurata) and mussels (Mytilus galloprovincialis) from aquaculture systems since these aquatic organisms are largely commercially available for consumption. In addition, seawater was also screened for the types of polymers present as well as their aging. The experimental protocol for biota samples contains a digestion step using Fenton’s reagent (0.05 M FeSO4⋅7H2O with 30% H2O2 at a volume ratio of 1:1) to remove organic material followed by filtration and a density separation step where the sample material was mixed with a saturated ZnCl2 solution to separate microplastic particles from heavier material. For seawater samples (sampled by a microplastic net sampler), only sieving on stainless steel sieves followed by filtration on silica filters was applied. Detection of microplastics and identification of their polymeric composition was achieved through the combined use of micro-Raman analysis, Attenuated Total Reflectance–Fourier Transform Infrared spectroscopy, and Scanning Electron Microscopy in tandem with Energy Dispersive X-ray spectroscopy. Microplastic abundance was 16 ± 1.7 items/individual in mussels and 22 ± 2.1 items/individual in sea bass, and 40 ± 3.9 items/individual in sea bream, with polyethylene (74.4%) being the most detected polymer type, while polyethylene-co-vinyl acetate (65%), polyvinyl-butyral (36.8%), polyvinyl alcohol (20%), and polybutyl methacrylate (15.8%) were also detected to a lesser extent. The microplastics isolated from seawater samples were films (30%), fragments (30%), and fibers (20%), while some of them were derived from foams (20%). Also, in most of these seawater-recovered microplastics, a relatively high degree of oxidation (carbonyl index > 0.31) was observed, which was further confirmed by the results of Energy Dispersive X-ray spectroscopy. Finally, the Scanning Electron Microscopy images showed various morphological characteristics (cracks, cavities, and burrs) on the surfaces of the microplastics, which were attributed to environmental exposure.
1. Introduction
The rapid increase in plastics production over the past two centuries because of high market demand has led to an annual global production of 390 million metric tons in 2021 [1]. This quantity is expected to continue to grow as, according to the United Nations Environment Programme (UNEP), plastics production could potentially reach 1100 million tons by 2050 [2]. In Europe alone, a significant increase in annual polymer production has been observed from the 1950s (0.35 million metric tons) to 2020 (55 million metric tons) [3]. Therefore, one of the main problems arising from the ever-increasing use of plastics is the pollution of the marine environment, as it is estimated that about 4.8 to 12.7 million tons of plastic are introduced into it annually [4]. In general, plastic debris varies widely in size and shape and is classified (by size) as macroplastics, mesoplastics, microplastics (MPs), and nanoplastics [5]. MPs, which are defined as plastic particles smaller than 5 mm (1 µm–500 µm) [6], are present in the aquatic environment either as primary material that is commercially manufactured in micro-size (e.g., microbeads used in cosmetics, cleaning, etc.) [7,8] or as secondary material (fibers, fragments, and films) [9] formed during the degradation of plastics by environmental (UV irradiation, biological activity, mechanical abrasion) or anthropogenic factors [10,11].
According to several studies, MPs are detected in many different marine compartments, such as the sea surface [12], the coasts [13], and the seabed [14]. Furthermore, through oceanographic models, it has been predicted that approximately 5 trillion microparticles are floating in the oceans, while about 89 thousand plastic particles per square kilometer were estimated to exist on the surface of the Mediterranean Sea [15]. The introduction of MPs into the marine environment can occur through various sources, either directly (e.g., coastal tourism, fishing, maritime industries, maritime transportation, etc.) or indirectly (e.g., contaminated rivers and streams, wastewater effluents, stormwater runoff, etc.) [16,17]. Also, from the findings of studies conducted in different marine ecosystems around the world, it appears that the most frequently detected MPs are polyethylene (PE), polypropylene (PP), polystyrene (PS), and polyethylene terephthalate (PET) [18,19,20,21,22,23]. The presence of MPs in seawater poses many risks to aquatic organisms as they can induce various toxicological effects on them [24]. Additionally, MPs can adsorb heavy metals as well as a multitude of toxic organic compounds (e.g., pesticides, polycyclic aromatic hydrocarbons, polychlorinated biphenyls, etc.) due to the hydrophobic nature of their surface and consequently act as carriers of these pollutants, thus contaminating the marine life that comes into contact with them [25,26]. Therefore, since MPs can potentially be consumed by a variety of sea organisms, such as zooplankton [27], worms [28], shellfish [15], fish [29], seabirds, [30] and cetaceans [31], there are serious concerns regarding their potential adverse effects on marine life.
Over the past fifty years, global fish consumption per capita has increased dramatically, from 5.2 kg in 1960 to 19.4 kg in 2017, especially in developing countries due to the rapid population and urbanization. Despite the health benefits of fish consumption, including omega-3, minerals (iodine, selenium), and nutrients (vitamins A, D, and B12), many issues have arisen regarding the health risks related to marine pollutants contained in fish [32]. Despite the various marine contaminants that can be adsorbed on the surface of MPs, as previously mentioned, a multitude of chemical pollutants can also be incorporated into them during the production, recycling, and incineration of plastics [33]. Therefore, consumption of fish and shellfish is among the probable routes of human exposure to MPs and associated pollutants. According to the results of previous studies, micro-scale plastic fragments have been detected in the gut of mussels and fish, as well as in the liver, gills, and even in the edible tissue of some fish species, thus raising serious concerns about the risk of MP exposure through seafood [34,35].
Several studies have reported that ingestion of MPs may be associated with some common toxic effects on marine organisms, such as changes in the immune response and reduced growth rate, as well as blockage and severe damage to the gastrointestinal tract, reduced stomach capacity, or even death [36]. In some works, the polymer risk index (H) was employed to evaluate the potential ecological risks of MPs to marine organisms. Specifically, Wu et al. (2022) [37], based on the calculated H values, found that the risk of MPs in commercial fish species of Lake Chaohu was between risk levels I (<10) and II (10–100), while Fang et al. (2019) [38] reported higher H values in the range of risk level IV (1000–10,000) for both bivalve and fish species of Fujian Province in China. Also, according to the results of studies that focused on the ecotoxicity risk assessment of MPs, no risk is expected to occur for risk characterization ratio (RCR) values lower than 1 (current global average RCR~4 × 10⁻⁴) [39].
Today, the screening of MPs in marine organisms has primarily focused on mussel and fish species [40]. In particular, mussels tend to ingest MPs as they filter seawater by pumping it through their bodies to feed on small particles and organisms (filter feeders), while fish may either actively or mistakenly feed on MPs [41]. Many reports indicate that MPs are present in both fish species (e.g., Xiphias gladius, Dicentrarchus labrax, Diplodus vulgaris, Platichthys flesus, Alepes djedaba, Galeus melastomus) and mussel species (e.g., Mytilus edulis, Mytilus galloprovincialis) that are widely commercially available for human consumption [29,42,43]. A screening study for MPs in commercial fish from Malaysia identified many microparticles composed of common polymer types, including PE, PP, PS, and PET, while heavy metals (chromium and iron) were detected, adsorbed on the surface of some MPs [32]. Pittura et al. (2022) [44] reported that PE and PP were also the most prevalent polymers in both seawater and fish samples from the North Tyrrhenian Sea, with no particular differences observed between sampling sites during their two-year study.
Despite the various reports on the presence of MPs in the Mediterranean, the data regarding the consumption of MPs by marine organisms in the Ionian Sea region are scarce. In particular, a previous study conducted in the North Ionian Sea found the frequency of MP ingestion to be 46.25% for mussels and 47.20% for Sardina pilchardus, with PE being the most abundant polymer type [15], while another work was carried out in the deep waters of the Eastern Ionian Sea and reported ingestion of meso–macro debris (5–60 mm) in deep-sea fish species [45].
Based on the above, the present study focuses on a first attempt to screen MPs in mussels (Mytilus galloprovincialis) and fish (Dicentrarchus labrax, Sparus aurata) species of high commercial value from aquaculture systems in the Ionian Sea. Also, a screening study of MPs in seawater is conducted in order to record the types and weathering of MPs in the marine environment. The present study provides, for the first time (to our knowledge), significant data about the frequency of occurrence of microplastics in some of the most widely sold fish species (Dicentrarchus labrax, Sparus aurata) collected from aquaculture in the North Ionian Sea while enriching the existing data regarding the presence of microplastics in mussels (Mytilus galloprovincialis) from the same area. Chemical identification of selected MPs is performed using Attenuated Total Reflectance—Fourier Transform Infrared spectroscopy (ATR-FTIR) for the larger items, as well as micro-Raman spectroscopy, utilizing the Particle Finder software. Finally, the surface morphology and elemental composition of selected MPs are elucidated utilizing Scanning Electron Microscopy (SEM) in tandem with Energy Dispersive Spectroscopy (EDS). This study is among the rare studies that use SEM-EDS for the surface analysis of MPs in environmental and food samples.
2. Materials and Methods
2.1. Materials and Chemicals
Anhydrous ZnCl2 (>98%, 2.91 g/cm3) and 30% H2O2 were purchased from Chem-Lab, Germany. Ferrous sulfate heptahydrate (FeSO4 × 7H2O) and sulfuric acid H2SO4 (>95%) were obtained from Merck, Germany, and Fisher Scientific, UK, respectively. Ultrapure Milli-Q water was prepared by a purification system from Evoqua Water Technologies. Macroporous silicon membrane filters (pore length: 498 μm, pore diameter: 5 μm, pitch: 12 μm) were purchased from Horiba, France.
2.2. Study Area and Sampling
The North Ionian Sea is located in the transition zone that stretches between the Ionian and Adriatic Seas. The long and complex Ionian-Adriatic coastline leads to the creation of diverse sedimentary and hydrodynamic environments [15]. A multitude of anthropogenic activities can potentially introduce marine litter into the wider region of the North Ionian Sea, including poor waste management practices, fishing, aquaculture, shoreline tourism, recreational activities, and shipping [15,46]. Also, river outflows that end up in the Ionian Sea (e.g., from the Aoos and Kalamas rivers) could possibly contribute further to the contamination of the marine environment.
Mussels (Mytilus galloprovincialis) were hand-collected from a fish farm in Thesprotia (Epirus, Greece), while sea bream (Sparus aurata) and sea bass (Dicentrarchus labrax) samples were obtained from an aquaculture also located in the Northern Ionian Sea. A map of the sampling area was reported in a previously published study from our lab [47]. Before MP separation, mussel and fish samples were stored whole at −20 °C.
Seawater was sampled from an aquaculture facility near Igoumenitsa (Northwestern Ionian Sea) using a microplastic net sampler (Hydro-bios) from the surface layer. Afterwards, the net was rinsed with bi-distilled water into the final collection container and further sieved over 1 and 5 mm mesh-size metal sieves. Plastic particles (>1–5 mm) were collected from the sieve using metal tweezers, left to dry, and transferred into amber glass bottles, finally analyzed by ATR-FTIR. Water analysis was performed only indicatively to identify polymer types and their weathering state.
2.3. MP Extraction from Mussel and Fish Species
Prior to dissection, fish and mussel samples were thawed at room temperature. In the case of mussels, each specimen was placed in an enamel pan, and removal of the soft tissue was achieved using a razor blade. Before and after processing each sample, both the razor and the pan were thoroughly cleaned and rinsed with filtered, deionized water. The collected soft tissue was transferred to a 400-mL glass beaker in order to create composite samples (5 g). In the case of fish, every sample was cut open, and their gastrointestinal tracts were dissected. Also, the contents of both stomach and intestines were weighed (wet weight) prior to MP extraction.
In general, the most widely applied digestion protocols reported in the literature include acidic or basic treatment, oxidation, as well as enzymatic processing [3,48]. So far, according to recent studies, the use of Fenton’s reagent (Fe2+/H2O2) is the most common and effective technique for the oxidative digestion of organic matter, as it leads to no or little changes in the properties of MPs [49,50,51,52]. In the present study, samples were digested using wet peroxide oxidation (WEO)—Fenton’s reagent (0.05 M FeSO4⋅7H2O with 30% H2O2 at volume ratio of 1:1), while 1 mL of concentrated H2SO4 was added to adjust the pH of the solution (pH = 3), in order to avoid the formation of iron hydroxides that would lead to precipitation of iron cations. All digestion processes were performed at room temperature (25 °C) using clean glassware. Also, the tops of the 400-mL beakers were covered with aluminum foil to prevent airborne contamination. In the event that the organic matter was not completely digested after several hours of treatment, additional H2O2 was added to the suspension. Digestion was considered complete when a clear yellow color was observed in the solution, and no visible pieces of tissue floated (Figure S1). Afterward, a density separation step followed to separate the plastic particles using an aqueous solution of ZnCl2 (2M) with a density of 2.9 g mL−1. In general, this technique has been found to be particularly effective for the separation of most plastics of various densities, such as PE (0.91–0.97 g mL−1), PP (0.94 g mL−1), PS (1.05 g mL−1), PET (1.32–1.41 g mL−1), polyvinyl chloride (PVC) (1.14–1.56 g mL−1), and polytetrafluoroethylene (PTFE) (2.10–2.30 g mL−1) [48,53]. The separation process started by vigorously stirring the MP-containing ZnCl2 mixture for 30 min. Then, it was left undisturbed for another 30 min in order for the MPs to float on its surface. Afterward, its upper layer was vacuum-filtered with silicon filters, which were placed in a filter holder specially designed to hold them and dried at room temperature (25 °C). More details about the digestion protocol and the density separation step can be found in Supplementary Materials.
2.4. MP Identification and Quantification
MP abundance was expressed for each species as (a) average number of MPs items per sample in all samples examined and (b) average number of MP items per gram wet weight of mussel tissue or fish gastrointestinal content in samples containing MPs. This approach is intended to facilitate comparisons to the literature. Frequency of occurrence of ingested MPs for each species was calculated as the percentage of the individuals examined containing MPs. Chemical characterization by commonly used spectroscopic techniques (FTIR, Micro-Raman) was used for the identification of plastic materials. FTIR spectroscopy was the most common technique used to characterize MPs (58%), followed by Raman spectroscopy (22%) [41,54].
2.4.1. ATR-FTIR Analysis
ATR-FTIR was used to identify the synthetic polymer type of the MP items. ATR-FTIR analysis was carried out on a Shimadzu IR Spirit QATR-S (Kyoto, Japan) spectrometer using a spectra library of Willey. The level of certainty when comparing sample spectrum to that of the library database was set up to >70%. Spectra were compiled from 45 co-added scans recorded from 400 to 4000 cm−1 with a resolution of 2 cm−1.
2.4.2. SEM-EDS Analysis
The surface morphology of the MPs was determined by applying SEM. Each sample was coated with 5 nm of chromium prior to analysis utilizing a Quantum Design Q150T Plus sputter coater (Darmstadt, Germany). SEM images were acquired using a Thermo Fisher Pharos Phenom G2 Field Emission Scanning Electron Microscope (Waltham, MA, USA), which was operated under high vacuum (0.1 Pa) with the accelerating voltage set at 15 kV, while both backscattered and secondary electron detectors were employed at a ratio of 20:80. Also, the surface chemical composition of the MPs surface was studied through EDS analysis using the same instrumentation.
2.4.3. Micro-Raman Analysis
Micro-Raman microscopy was conducted using a fully integrated confocal Raman microscope instrument (Labram SoleilTM, Horiba Scientific, Lyon, France) equipped with two gratings by default, a multichannel detector and a computerization package. Raman spectra were obtained with a 532 nm wavelength laser and power at 1.9–3 mW at variable magnifications of 50× to 100×. The Raman spectra were collected in the 600–3800 cm−1 range. The integration time was 20–200 s (usually 200 s), and the cumulation number was 1–10 times (usually 5). To obtain the spectrum with low fluorescence and the highest possible quality, we used different Raman settings for the same spot or collected multiple spectra at different spots on the same sample. Collected spectra were baseline corrected to enhance the quality of spectra and matched between recorded spectra and reference from the KnowItAll library database with >70% identification. Finally, the Particle FinderTM software was applied to biota samples, an application that allows automated location of particles, analysis of key particle parameters, such as size and mass, and subsequent chemical characterization with Raman. It is especially beneficial in cases where the number of particles is large, like MPs, where manually locating and marking each particle would be time-consuming, outweighing the benefits that Raman can offer.
3. Results and Discussion
3.1. Identification and Quantification of MP Particles in Biota Samples Using Raman Spectroscopy
The polymers identified in the present study are found everywhere in our lives. For instance, PE is commonly used in a variety of industrial products and has a significant global production, which results in high occurrence in aquatic environments. PE tends to float in water instead of settling in the bed, which makes it more available for fish [15,55,56]. Polyvinyl alcohol is a synthetic water-soluble biopolymer (WPS) that is generally prepared by the saponification of polyvinyl acetate and can be found in a wide range of items, including food packaging (31.4% of the demand), construction, electronics, coatings, printing, textile, cosmetics, paper, and fishing lines. Most of these materials can reach the aquatic environment, resulting in their ingestion by marine organisms [57]. Furthermore, PBMA and PVB polymers act as toughening agents to the brittle phenolic resins applied as coatings for metals [58,59]. Recently, to overcome the lack of dissolved oxygen in high-density aquaculture water, a hydrogen peroxide acrylic resin inclusion complex with a sustained oxygen-releasing effect could be synthesized by emulsion polymerization of acrylic acid, methyl methacrylate, and butyl acrylate [60]. As a result, PVB and PBMA ingestion could also be attributed to such applications.
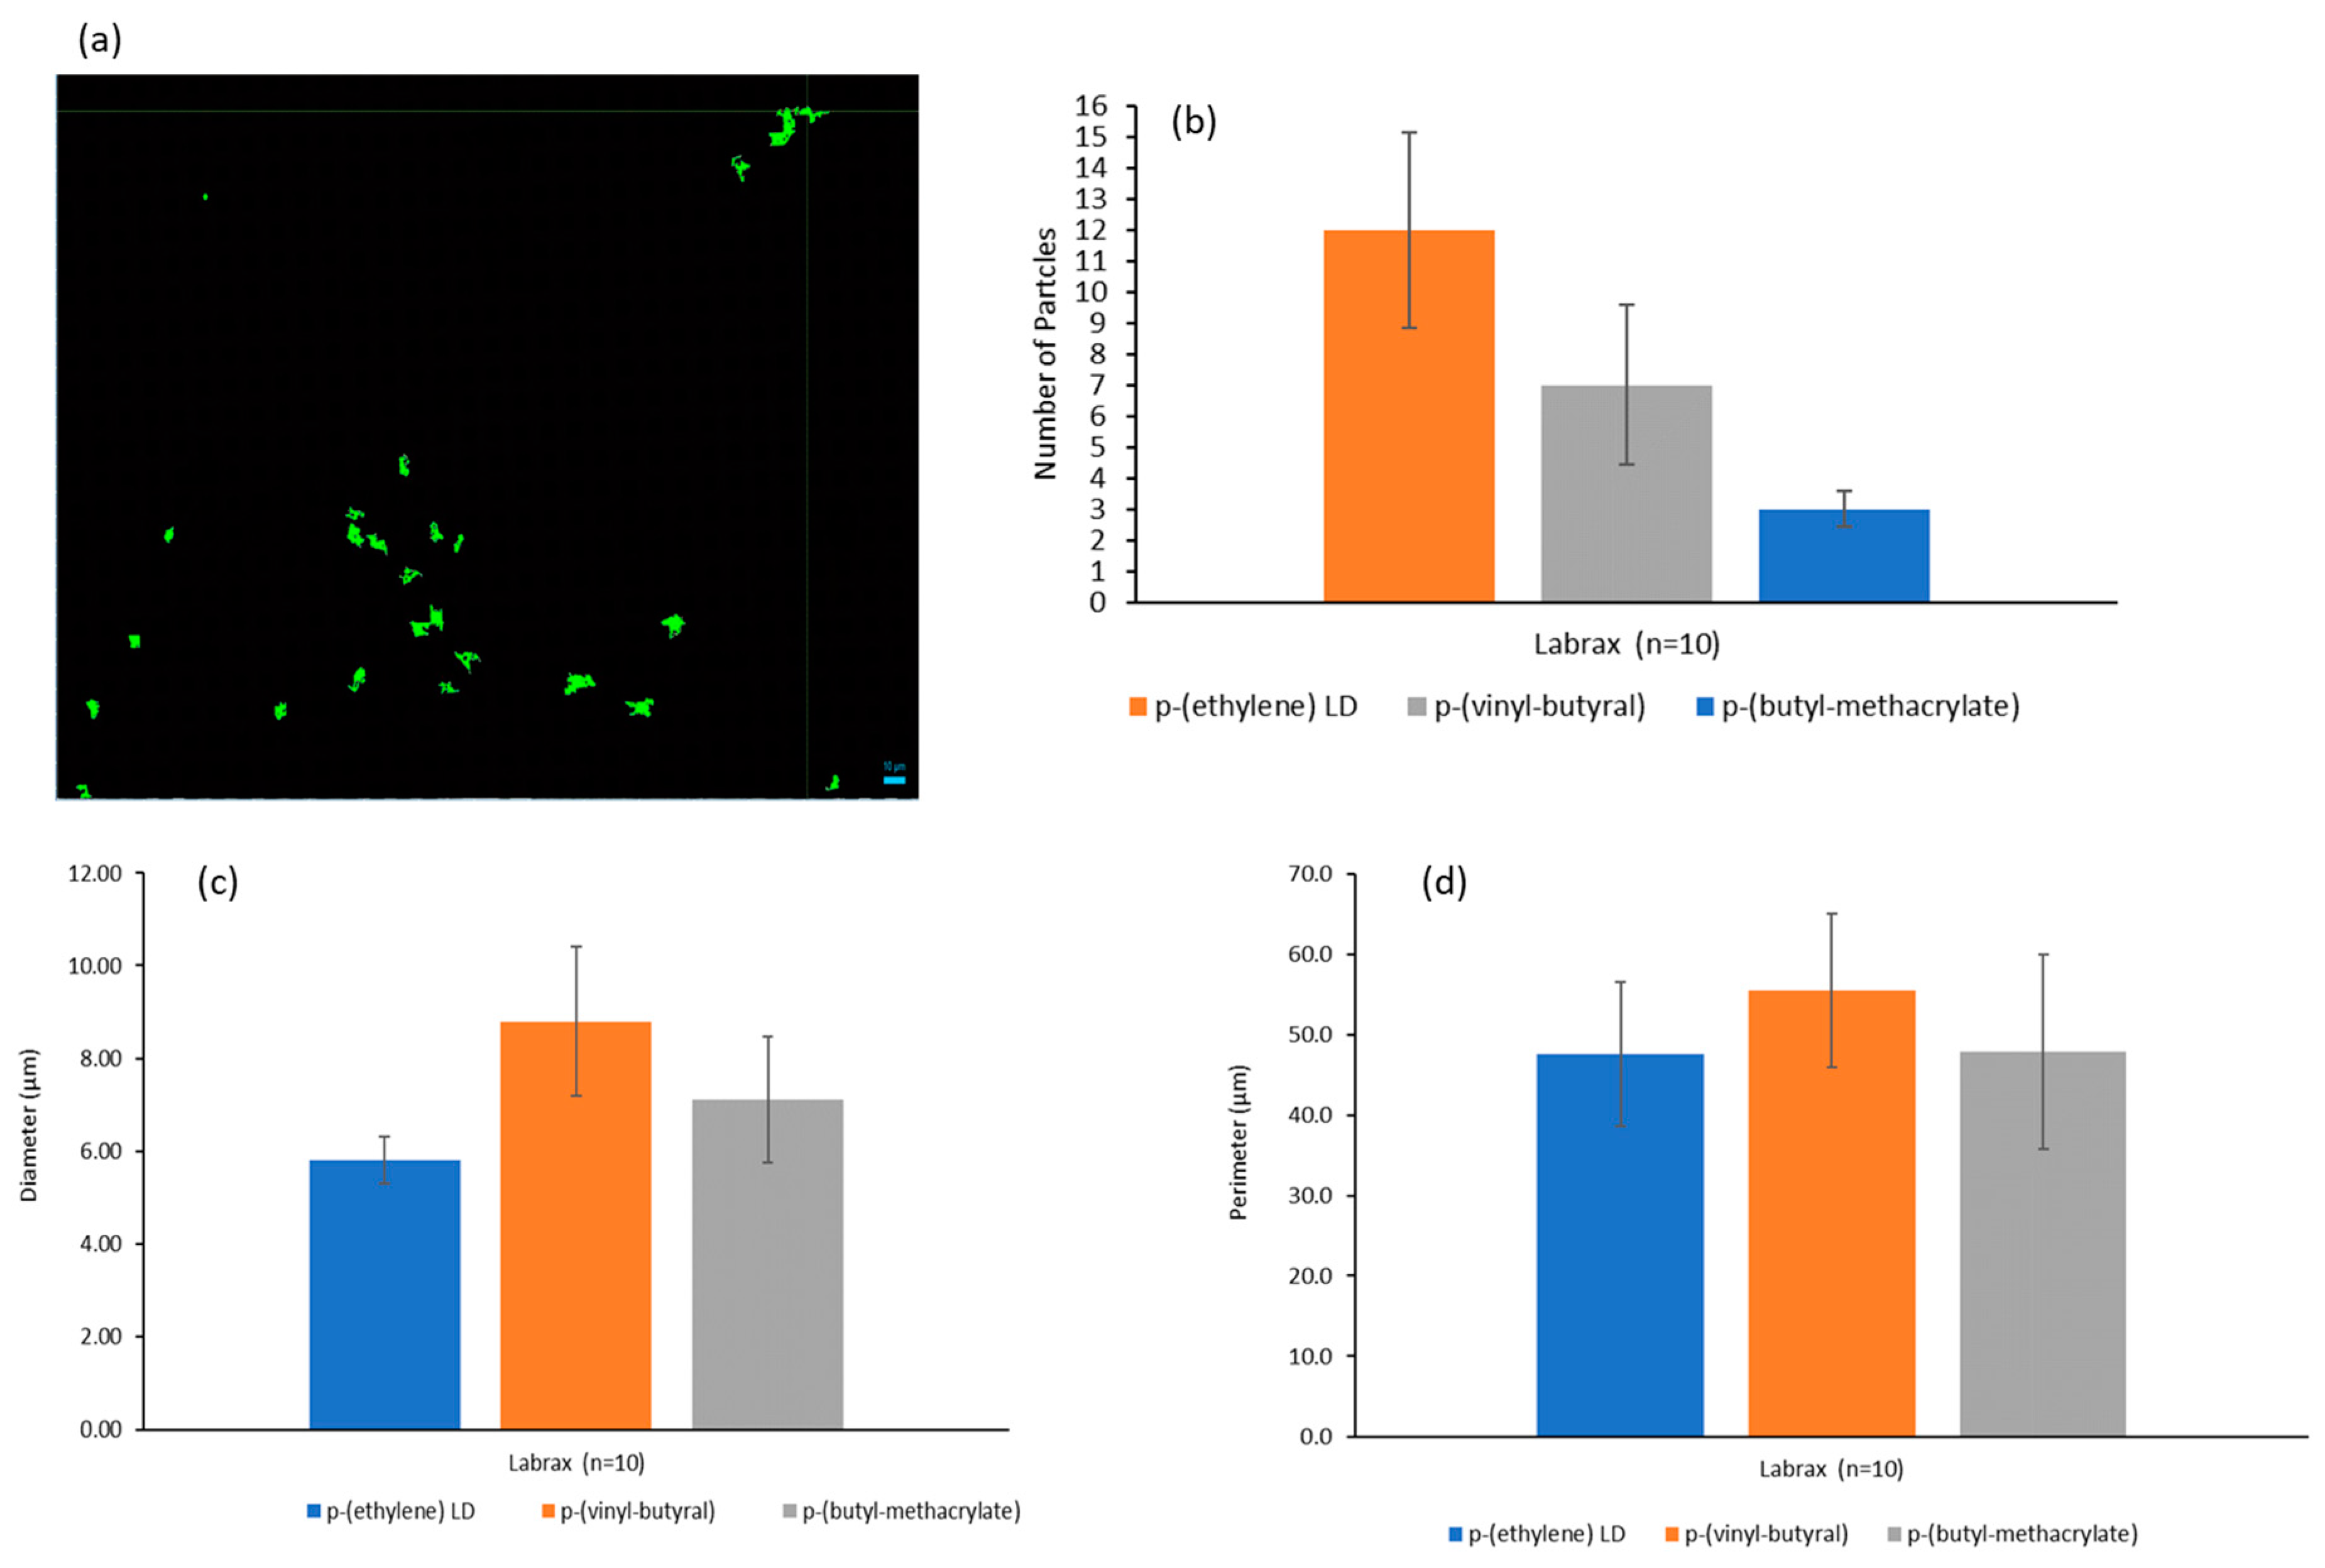
Figure 1 shows the mean relative contribution of each size class and polymer type to sea bass samples. The following polymer types were identified: low-density polyethylene (LDPE), polyvinyl-butyral (PVB), and polybutyl methacrylate (PBMA). The most frequent type of polymer was PE (47.4%), followed by PVB (36.8%) and PBMA (15.8%). The average number of MPs in sea bass was 22 ± 2.1 items per fish. MPs were also categorized according to their diameter and perimeter (Figure 1c,d), with an average size of 5.4 μm diameter and 37.3 μm perimeter. Finally, the results obtained from this study were expressed as an average number of MP items per gram wet weight of fish gastrointestinal content. More specifically, sea bass samples contained 0.81 ng of PE per gram wet weight, 1.2 ng g−1 PBMA, and 1.61 ng g−1 PVB. The Raman spectroscopic analysis showed representative distinct spectrum profiles belonging to the different polymers presented in Figure 2. PE polymers had four major peaks in the Raman fingerprint region, namely the peaks corresponding to the C=C backbone stretching at 1118–1200 cm−1, CH2 twisting at 1288 cm−1, CH2 bending mode at around 1432–1450 cm−1 and CH2 symmetric and antisymmetric stretching 2870–2950 cm−1 [61]. PVB exhibits stretching at 2850 to 3000 cm−1 (-CH, -CH2 stretching), 1720 cm−1 (C=O stretching), 1420 to 1500 cm−1 (CH2 bending), and 1250 to 1350 cm−1 (C–O–C stretching). Finally, PBMA polymer presents two characteristic peaks: the band at 1648 cm−1 is attributed to the combination band arising out of ν(C=C) and ν(C–COO) modes, and the band at 3100 cm−1 is attributed to the first overtone involving (C=O) of C–COO [62,63].
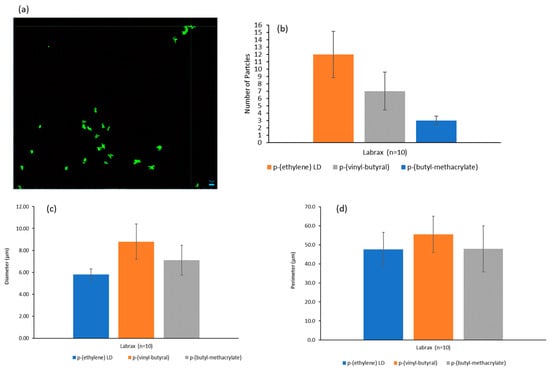
Figure 1.
(a) Identified particles of sea bass sample on silicon filters; (b) mean relative contribution of each polymer type; (c,d) size (diameter and perimeter, respectively) of MPs extracted from sea bass samples.
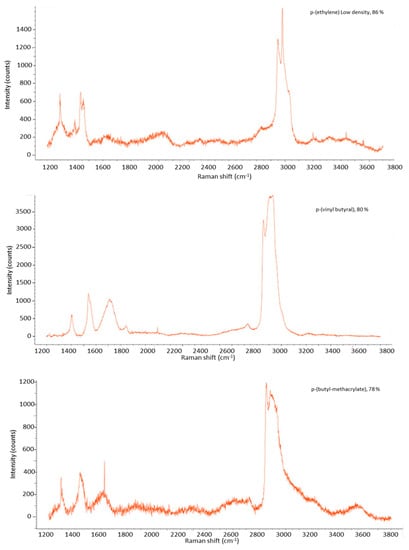
Figure 2.
Representative examples of microplastics Raman spectra detected in sea bass samples with micro-Raman spectroscopy.
In the case of bream, MP particles, including LDPE, PVB, PBMA, ethylene-co-vinyl acetate (EVA), and polyvinyl alcohol (PVA), were detected. The most abundant polymer types were PE and EVA, with frequency of detection of 70% and 65%, respectively. The second common polymer type was PBMA, with 25%, followed by PVB (20%) and PVA (20%). The average number of MPs in sea bream was 40 ± 3.9 items per fish. MPs were also classified according to their size (Figure 3c,d), with an average diameter of 5.5 μm and 41 μm perimeter. The average number of MPs items per gram weight in individuals containing MPs was higher in sea breams compared to sea bass. Specifically, sea breams contain 1.65 ng of PE per gram wet weight, 1.22 ng g−1 EVA, 1.50 ng g−1 PVB, 1.36 ng g−1 PBMA, and 1.64 ng g−1 PVA.
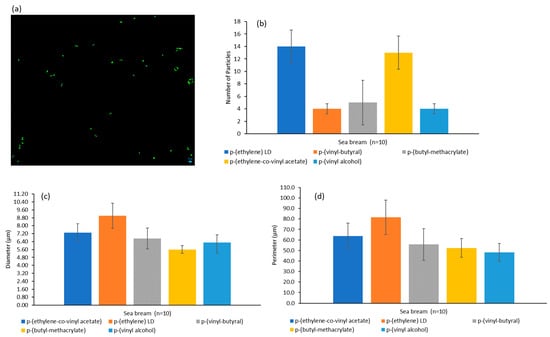
Figure 3.
(a) Identified particles of sea bream sample on silicon filters; (b) mean relative contribution of each polymer type; (c,d) size (diameter and perimeter, respectively) of MPs extracted from sea bream samples.
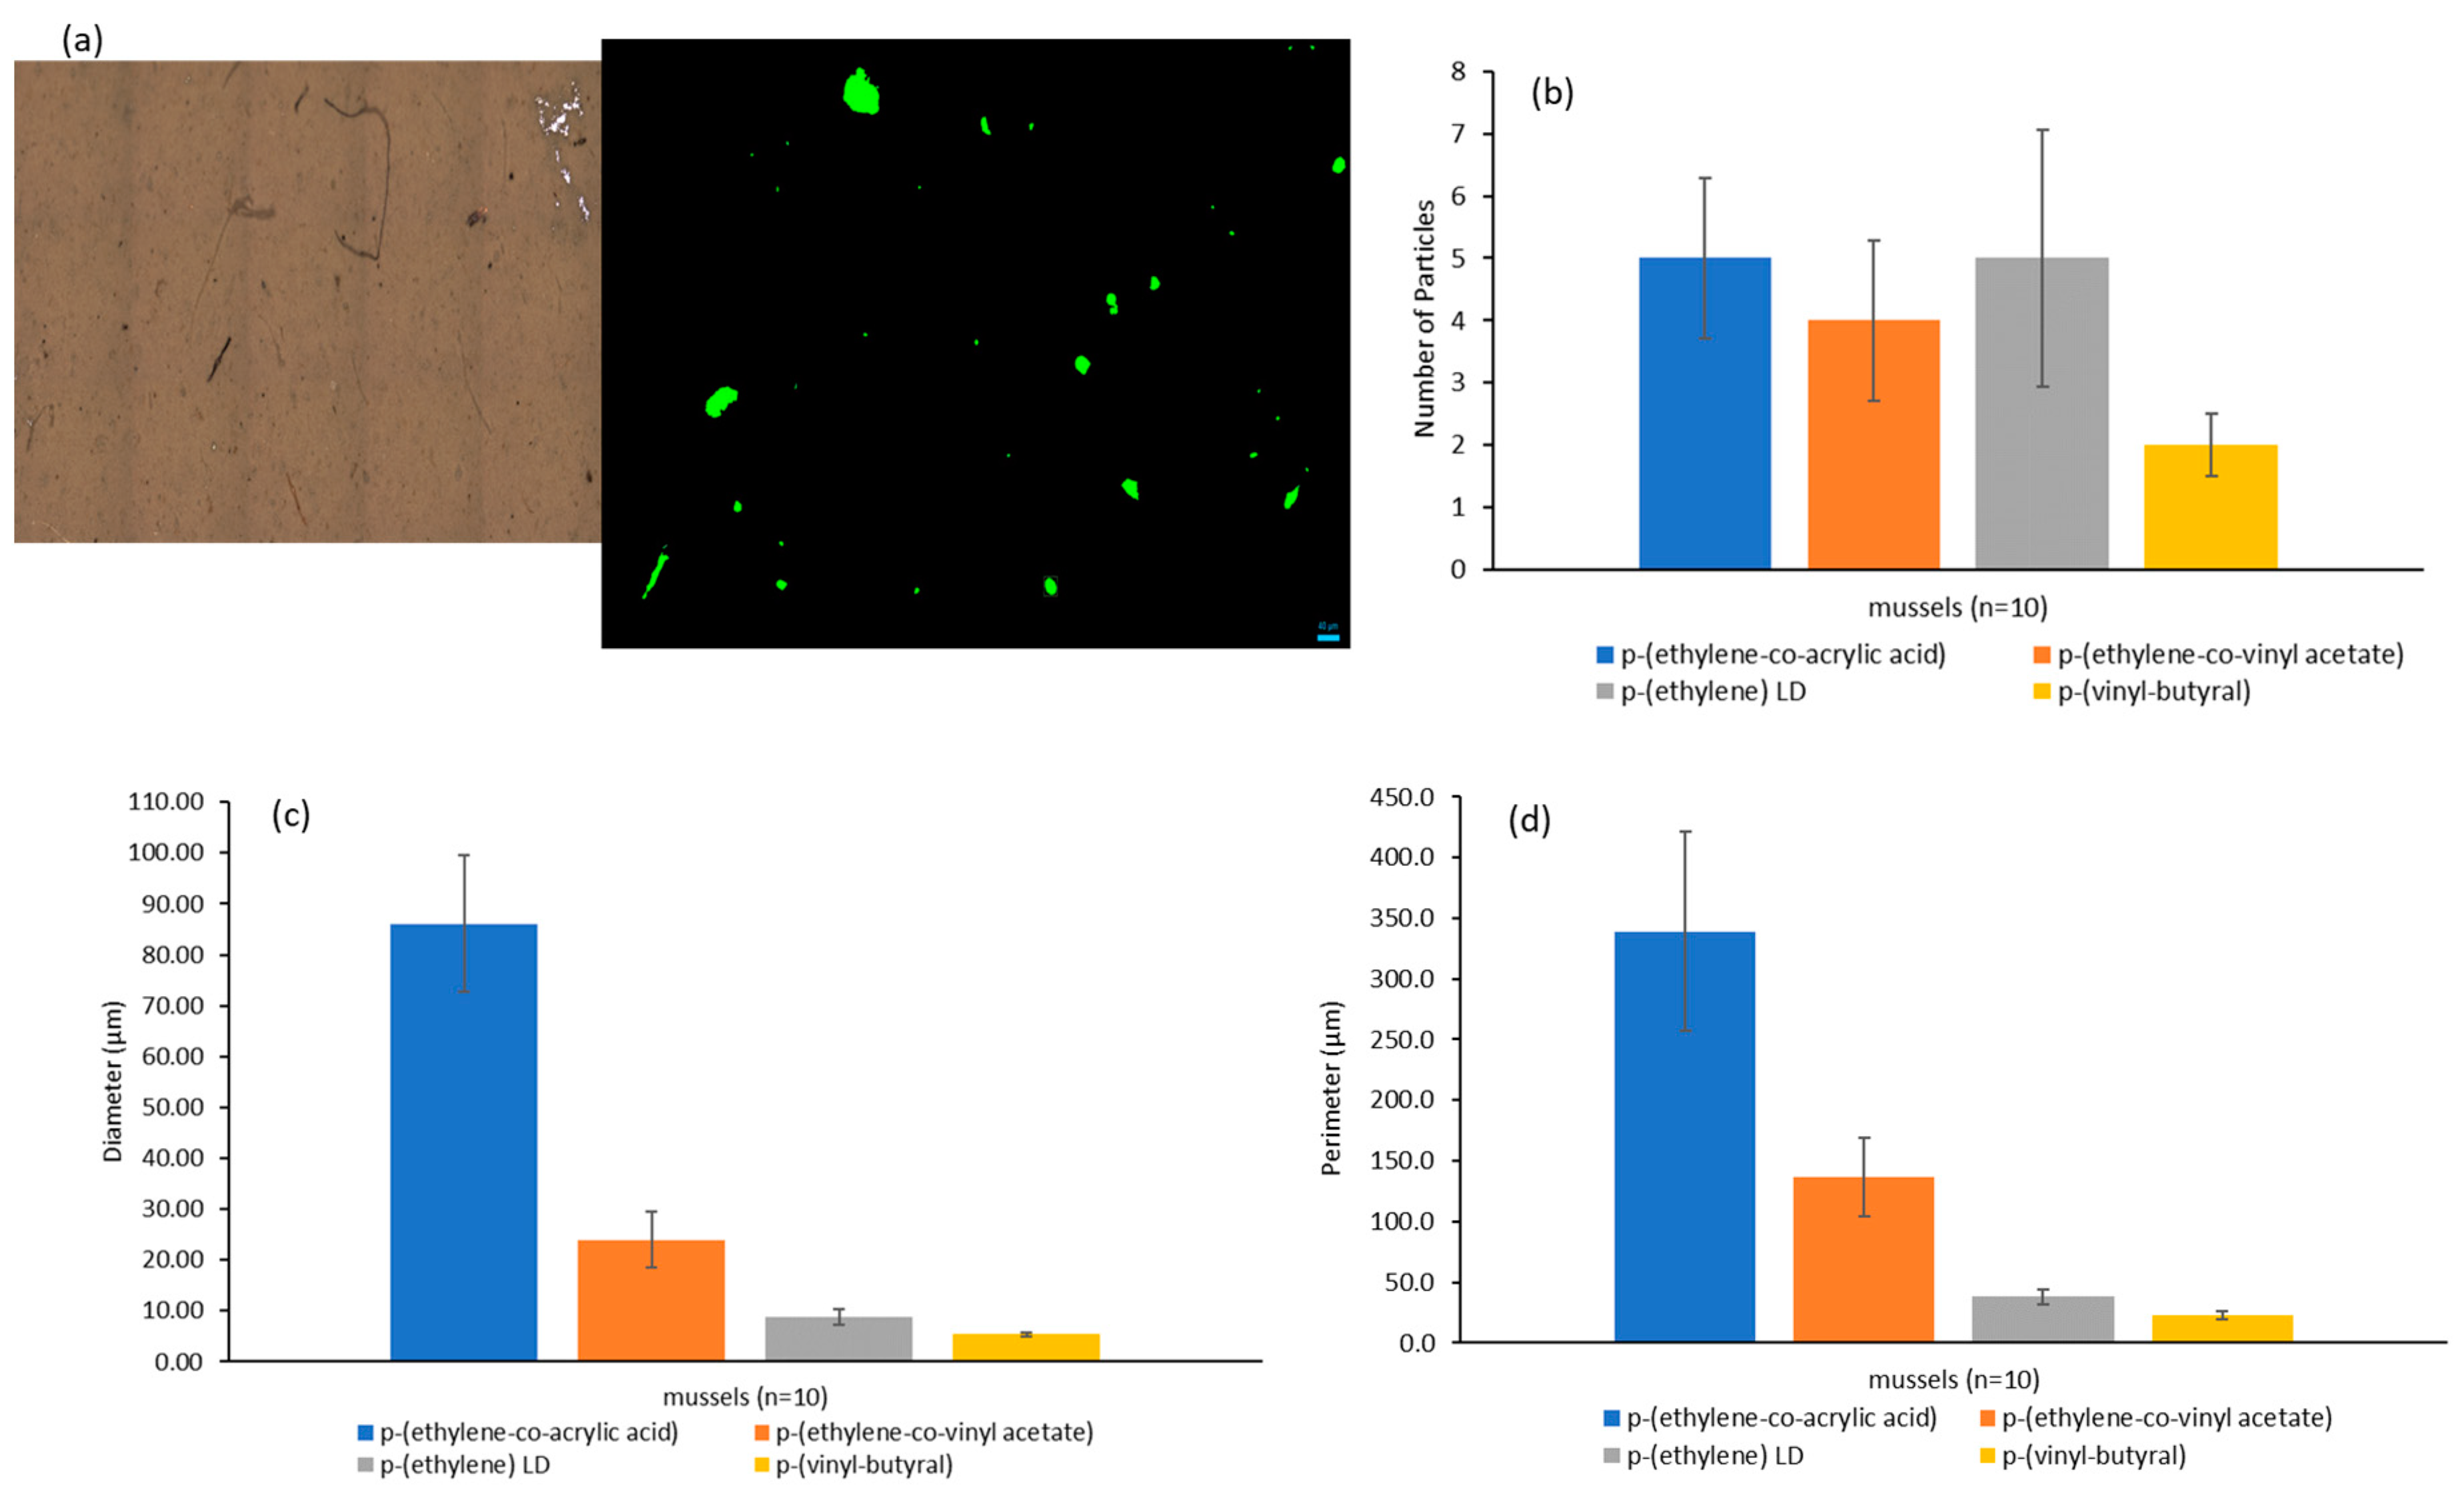
The present study also detected MP ingestion in mussels. According to Figure 4, PE was again the most frequent polymer type found (50%). Up next, ethylene-co-acrylic acid (EAA) was the second most commonly found polymer (45%), followed by EVA (40%) and PVB (25%). Additionally, Figure 4c,d represents the different sizes of the detected particles according to their diameter and perimeter. Ingested MPs have an average diameter of 15.1 μm and a perimeter of 70.3 μm. There was a much higher difference in the sizes of mussel samples than in fish species; specifically, four fibers were detected in mussels with sizes from 28.7 μm to 86.1 μm. The average number of MPs in mussels was 16 ± 1.7 particles per mussel. The average number of ingested MPs in mussels per gram weight of this study was 6.65 ng g−1 for EAA, 3.3 ng g−1 for EVA, 1.18 ng g−1 for PE, and 0.6 ng g−1 for PVB. In addition, one of the samples contained two fibers corresponding to EAA with 1.62 μg g−1 and 0.49 μg g−1, respectively. More examples of representative examples of Raman spectra for MPs detected in marine organisms can be found in the Supplementary Materials.

Figure 4.
(a) Identified particles of mussel sample on silicon filters; (b) mean relative contribution of each polymer type; (c,d) size (diameter and perimeter, respectively) of MPs extracted from mussels.
The composition pattern and number of the MPs found in sea basses clearly match with previous studies carried out in the Canary Islands region (Spain) regarding the determination of MPs in the marine environment. As an example, Reinold et al. (2021) [64] presented evidence of MP ingestion by cultured European sea bass (Dicentrarchus labrax), finding Cellulose (55%), Nylon (27%), fragments of PE (25%), and PP (25%) with an average of particles per fish (2.7 ± 1.85). Bessa et al. (2018) [42] estimated the mean MP abundance in the wild European sea beams as 0.3 ± 0.61 MPs fish−1 from Portugal. When results obtained in this study were compared with wild counterparts, higher MP abundance (31 ± 3.2 MPs fish−1, 22 ± 2.1 MPs sea bass−1, and 40 ± 3.9 MPs sea bream−1) were obtained, which may be related to exposure to the very homogeneous environmental conditions that occur in such fish farms. However, evidence from MPs contamination in commercial fish from the Mediterranean Coast of Egypt showed similar results to our findings, with PE (55%) and EVA (55%) as the dominant polymers in the fish digestive tracts of Sparus aurata (38.3 ± 28.4 items fish−1) with sizes ≤ 50 μm [65]. Furthermore, Bayo et al. (2021) [66] obtained nine different polymer types, including PE (45%) and polyvinyl esters (9%), with sizes ranging from 91 µm to 5 mm and high average numbers of MP (8.53 ± 2.19) in the intestine of Sparus aurata comparable to our values. To our knowledge, polyvinyl esters such as polyvinyl butyral and polybutyl methacrylate were detected for the first time in this study in the two fish species. Analogous findings of PBMA (2 MP fish−1, 22%) and (2%) have been reported on Norwegian coast in Atlantic cod (Gadus morhua) and in three planktivorous species (Clupea harengus, Sardina pilchardus and Engraulis encrasicolus) of three different zones including the English Channel, the Northwestern Mediterranean Sea and the Northeastern Atlantic (Bay of Biscay), respectively [67,68]. Additionally, MPs extracted from Sardina (epipelagic species) included polyvinyl-butyral ranging from 1 to 10 particles/fiber with a size range of 10–200 μm analyzed with micro-Raman spectroscopy [67]. The size of MP particles detected was >5 μm, and four fibers of <100 μm were found in samples of M. galloprovincialis, comparable to the findings of Ferrante et al. (2022) [69]. MPs (<3 μm) from the south coast of the Mediterranean Sea were detected through an innovative extraction method coupled to the SEM-EDS technology, and diameter ranges from 1 to 3 μm in Mytilus galloprovincialis and 1.8–2.6 μm in Sparus aurata. Finally, a comprehensive study in intertidal water of South Australia and mussel (Mytilus galloprovincialis) showed MP abundance within the range reported globally (mean = 3.58 ± 8.18 particles individual−1) and the identification of three polymer types, including polyamide (nylon, 32%), acrylic resin (6%) and PP (44%) [6]. It should also be noted that the MP number of PVA in Sparus aurata was not reported elsewhere but only in a few studies reporting the determination of synthetic polymers in Mediterranean surface waters (frequency of 2%) [70] and in canned tuna, salmon, and sardine fishes from Taif markets (Taif, Saudi Arabia) [71].
3.2. Identification of MP Particles in Seawater Samples Using ATR-FTIR and Raman Spectroscopy
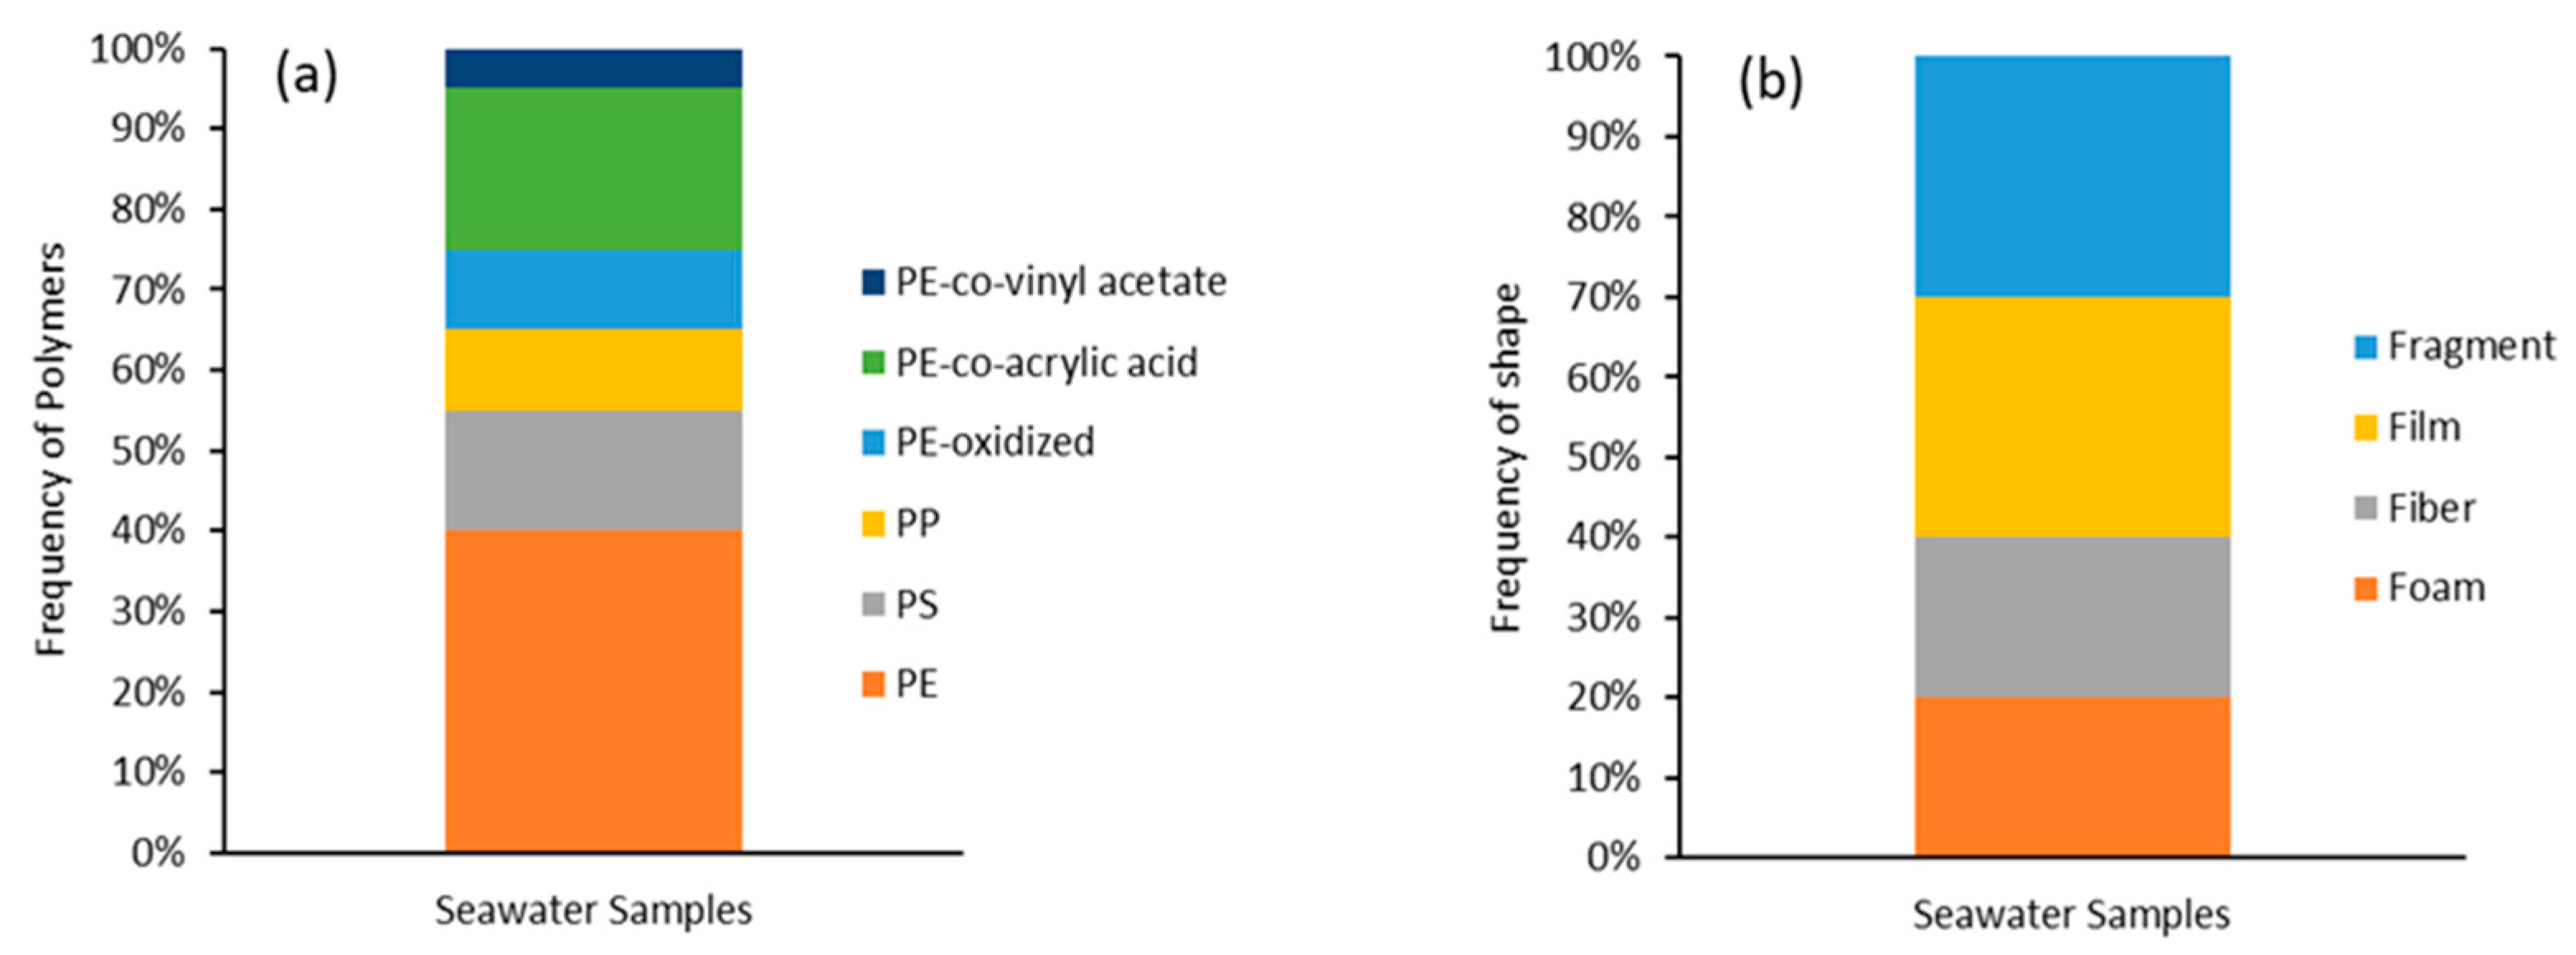
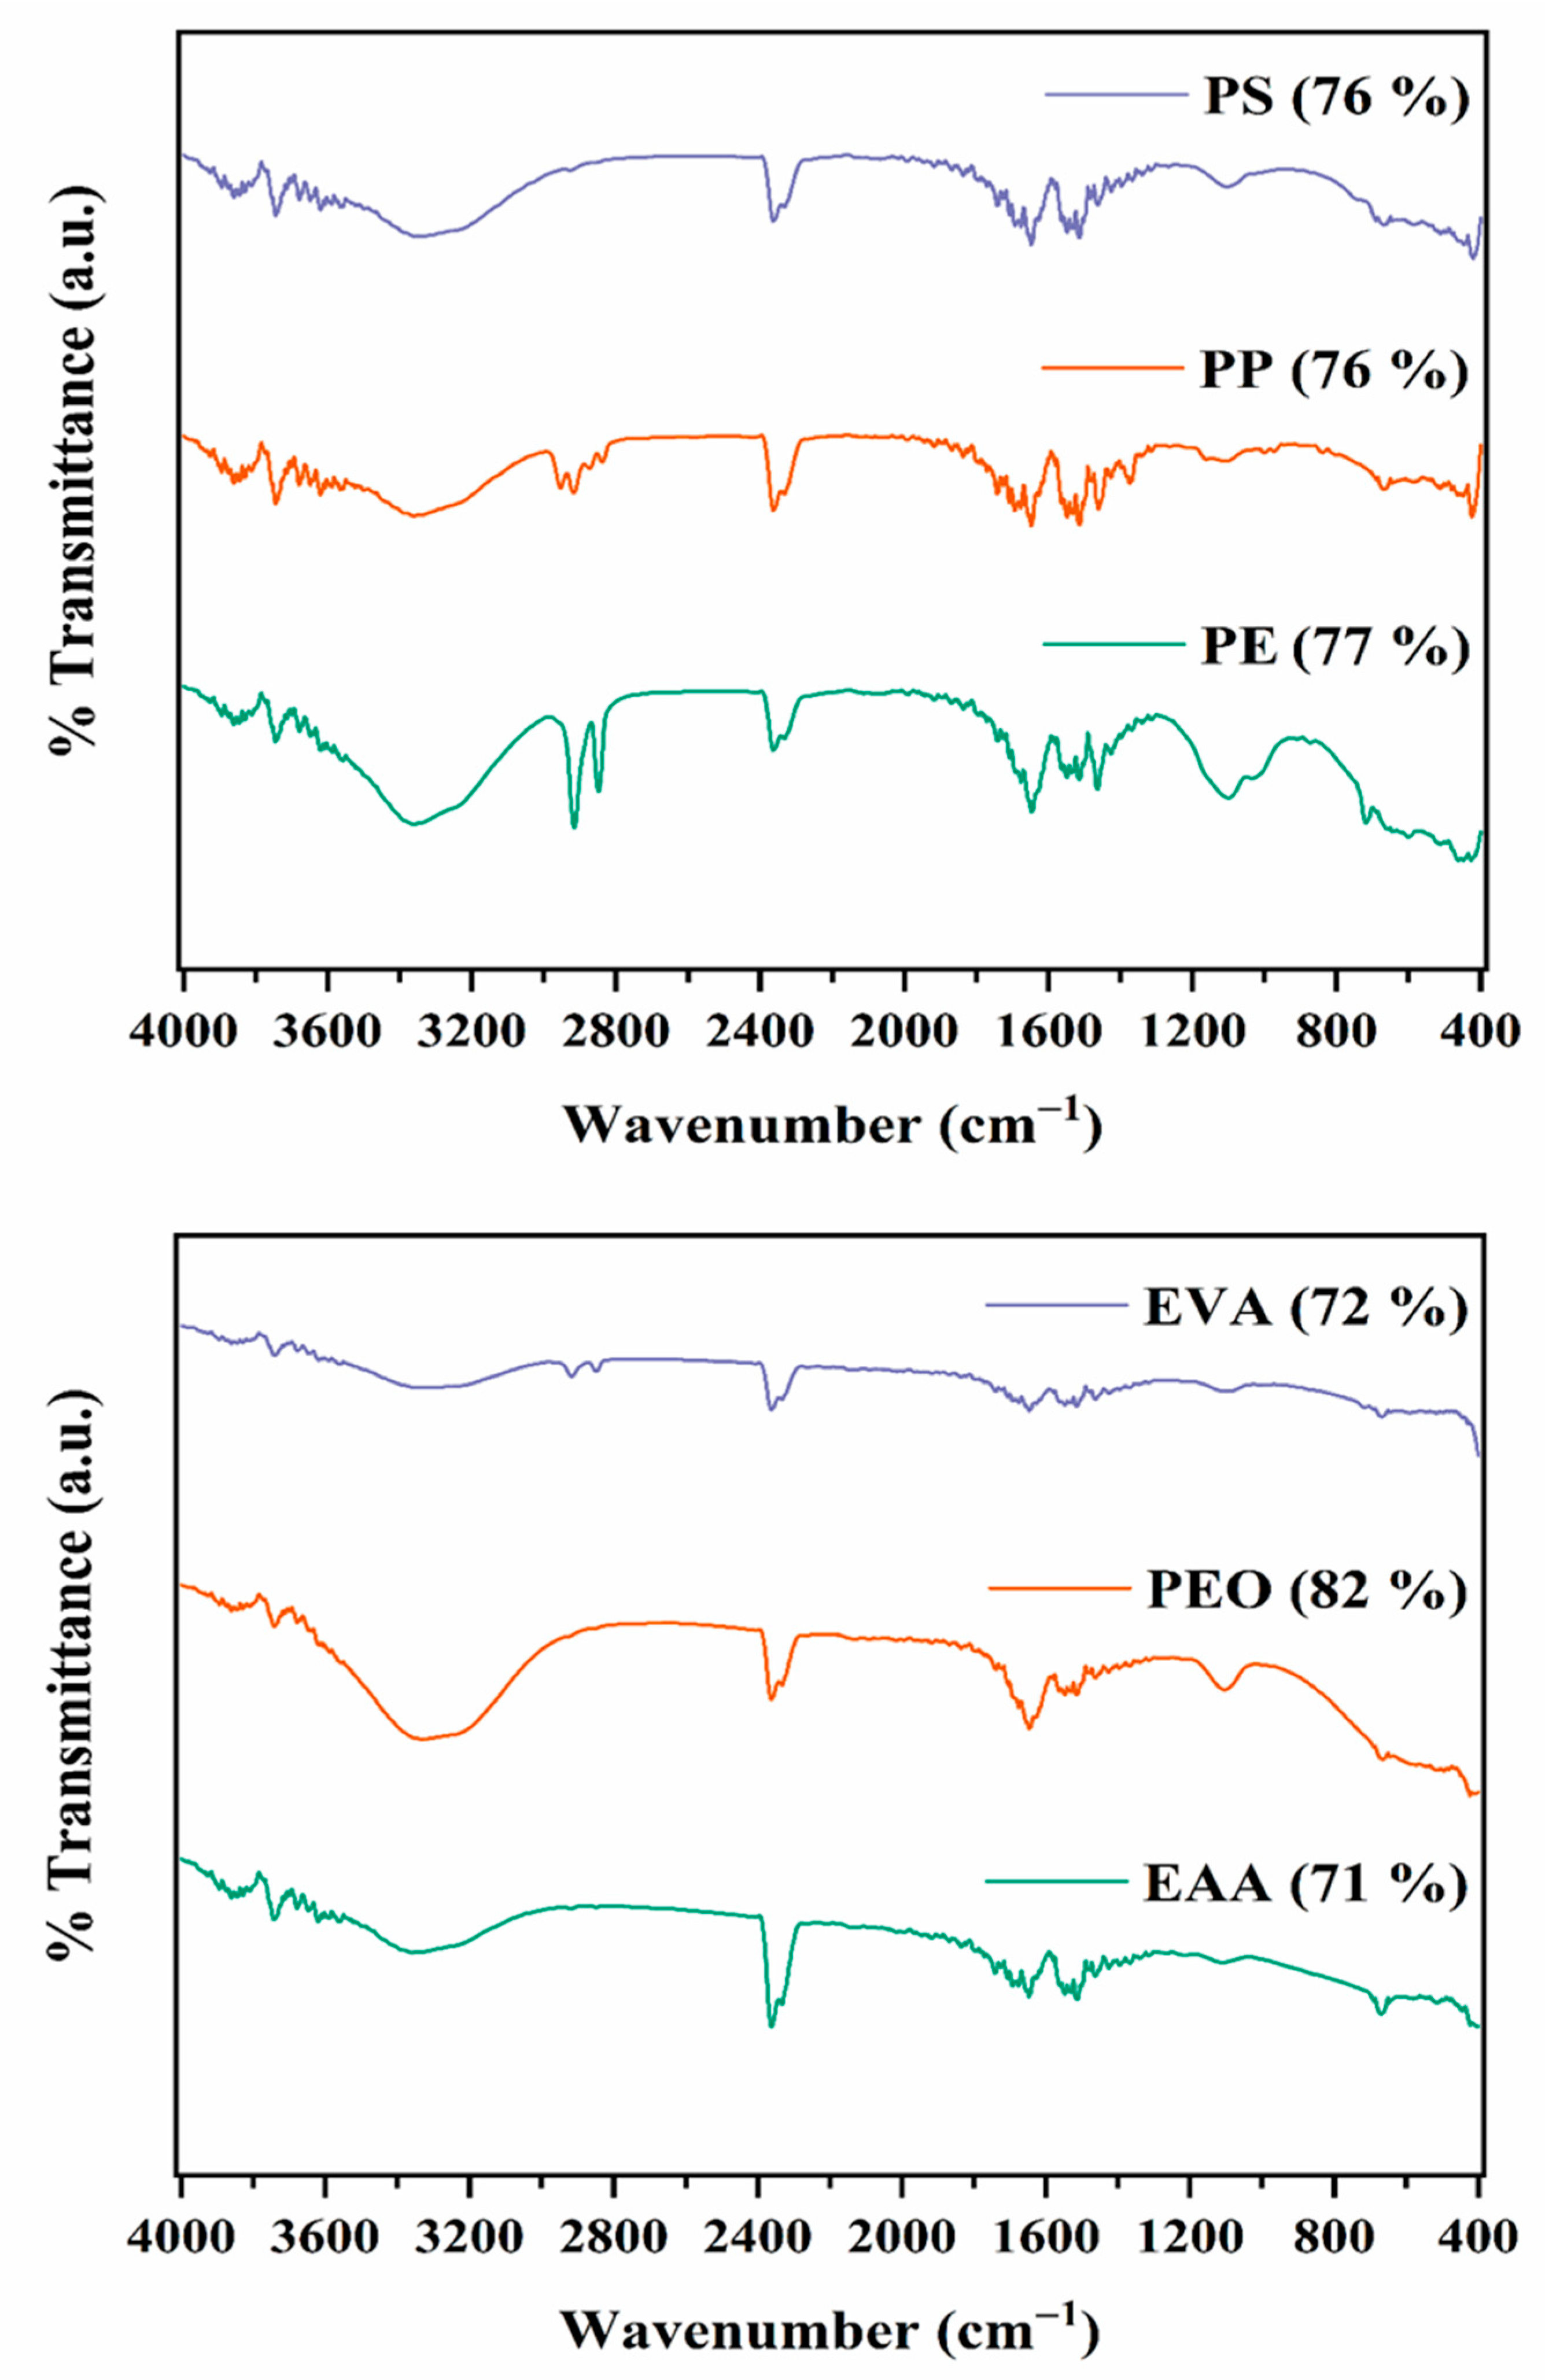
Figure 5 shows the relative % contribution of each shape and polymer typology for larger (>1 mm–5 mm) MPs. Most of the MPs were fragments (30%) and films (30%), followed by foams (20%) and fibers (20%). ATR-FTIR analysis, in combination with micro-Raman spectroscopy, revealed the presence of six polymer types in water samples (Figure 6 and Figure 7). More examples of representative examples of Raman spectra for MPs detected in seawater can be found in the Supplementary Materials. PE was the predominant polymer, with a frequency of 40% in all analyzed samples. PS was the second one together with EAA in terms of frequency with 15% and 25%, respectively, while EVA, ethylene oxide (PEO), and PP were detected sporadically in samples (5%, 5%, and 10%, respectively). In fact, despite the focus of this study was not a full evaluation of MPs in seawater, data on a number of polymer types and shapes of MPs in water samples obtained were comparable to those observed by other researchers [4,6,11,22,46] confirming the occurrence of the above MPs in the area of the Ionian Sea.
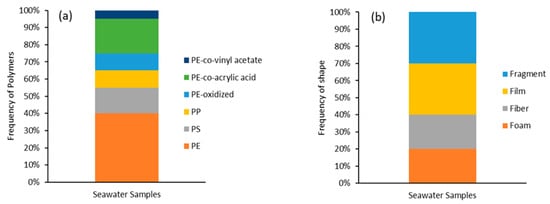
Figure 5.
Relative contribution (%) of each polymer (a) and shape (b) on total MPs extracted from seawater samples.
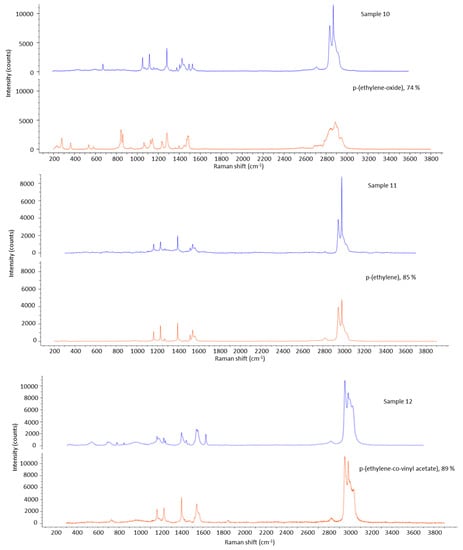
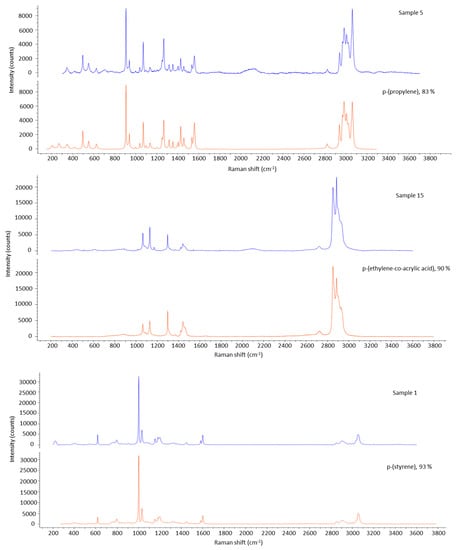
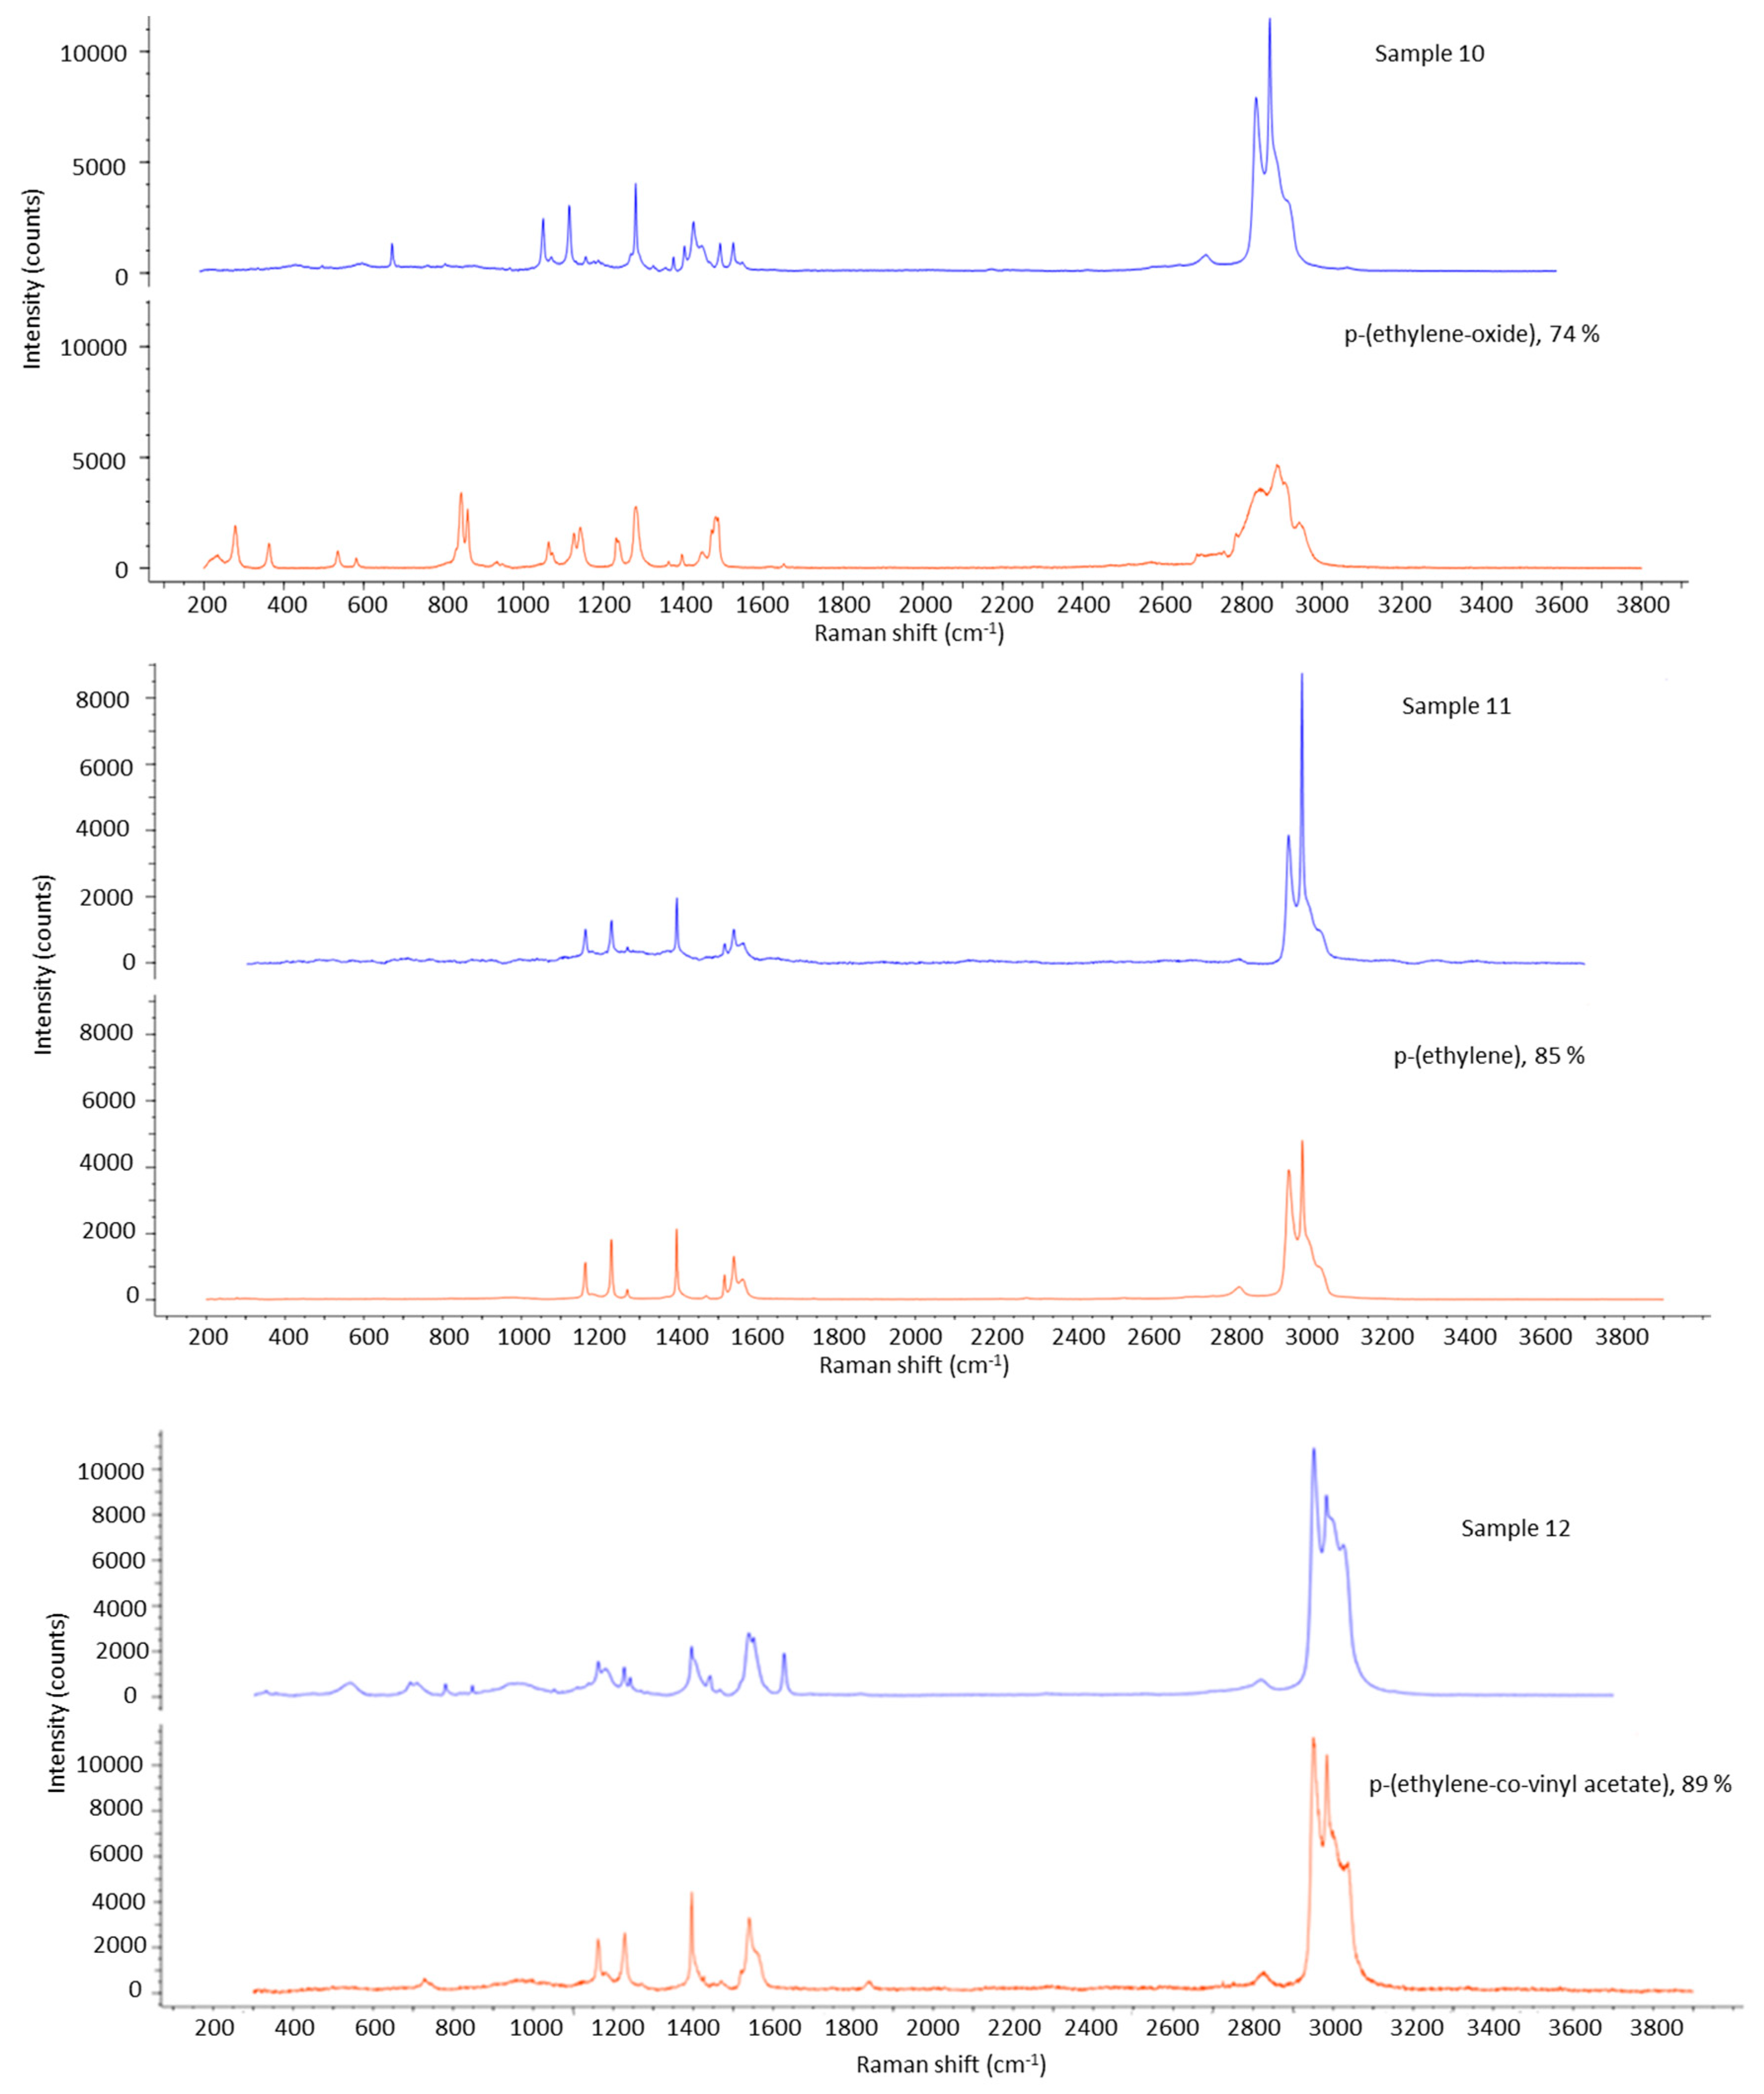
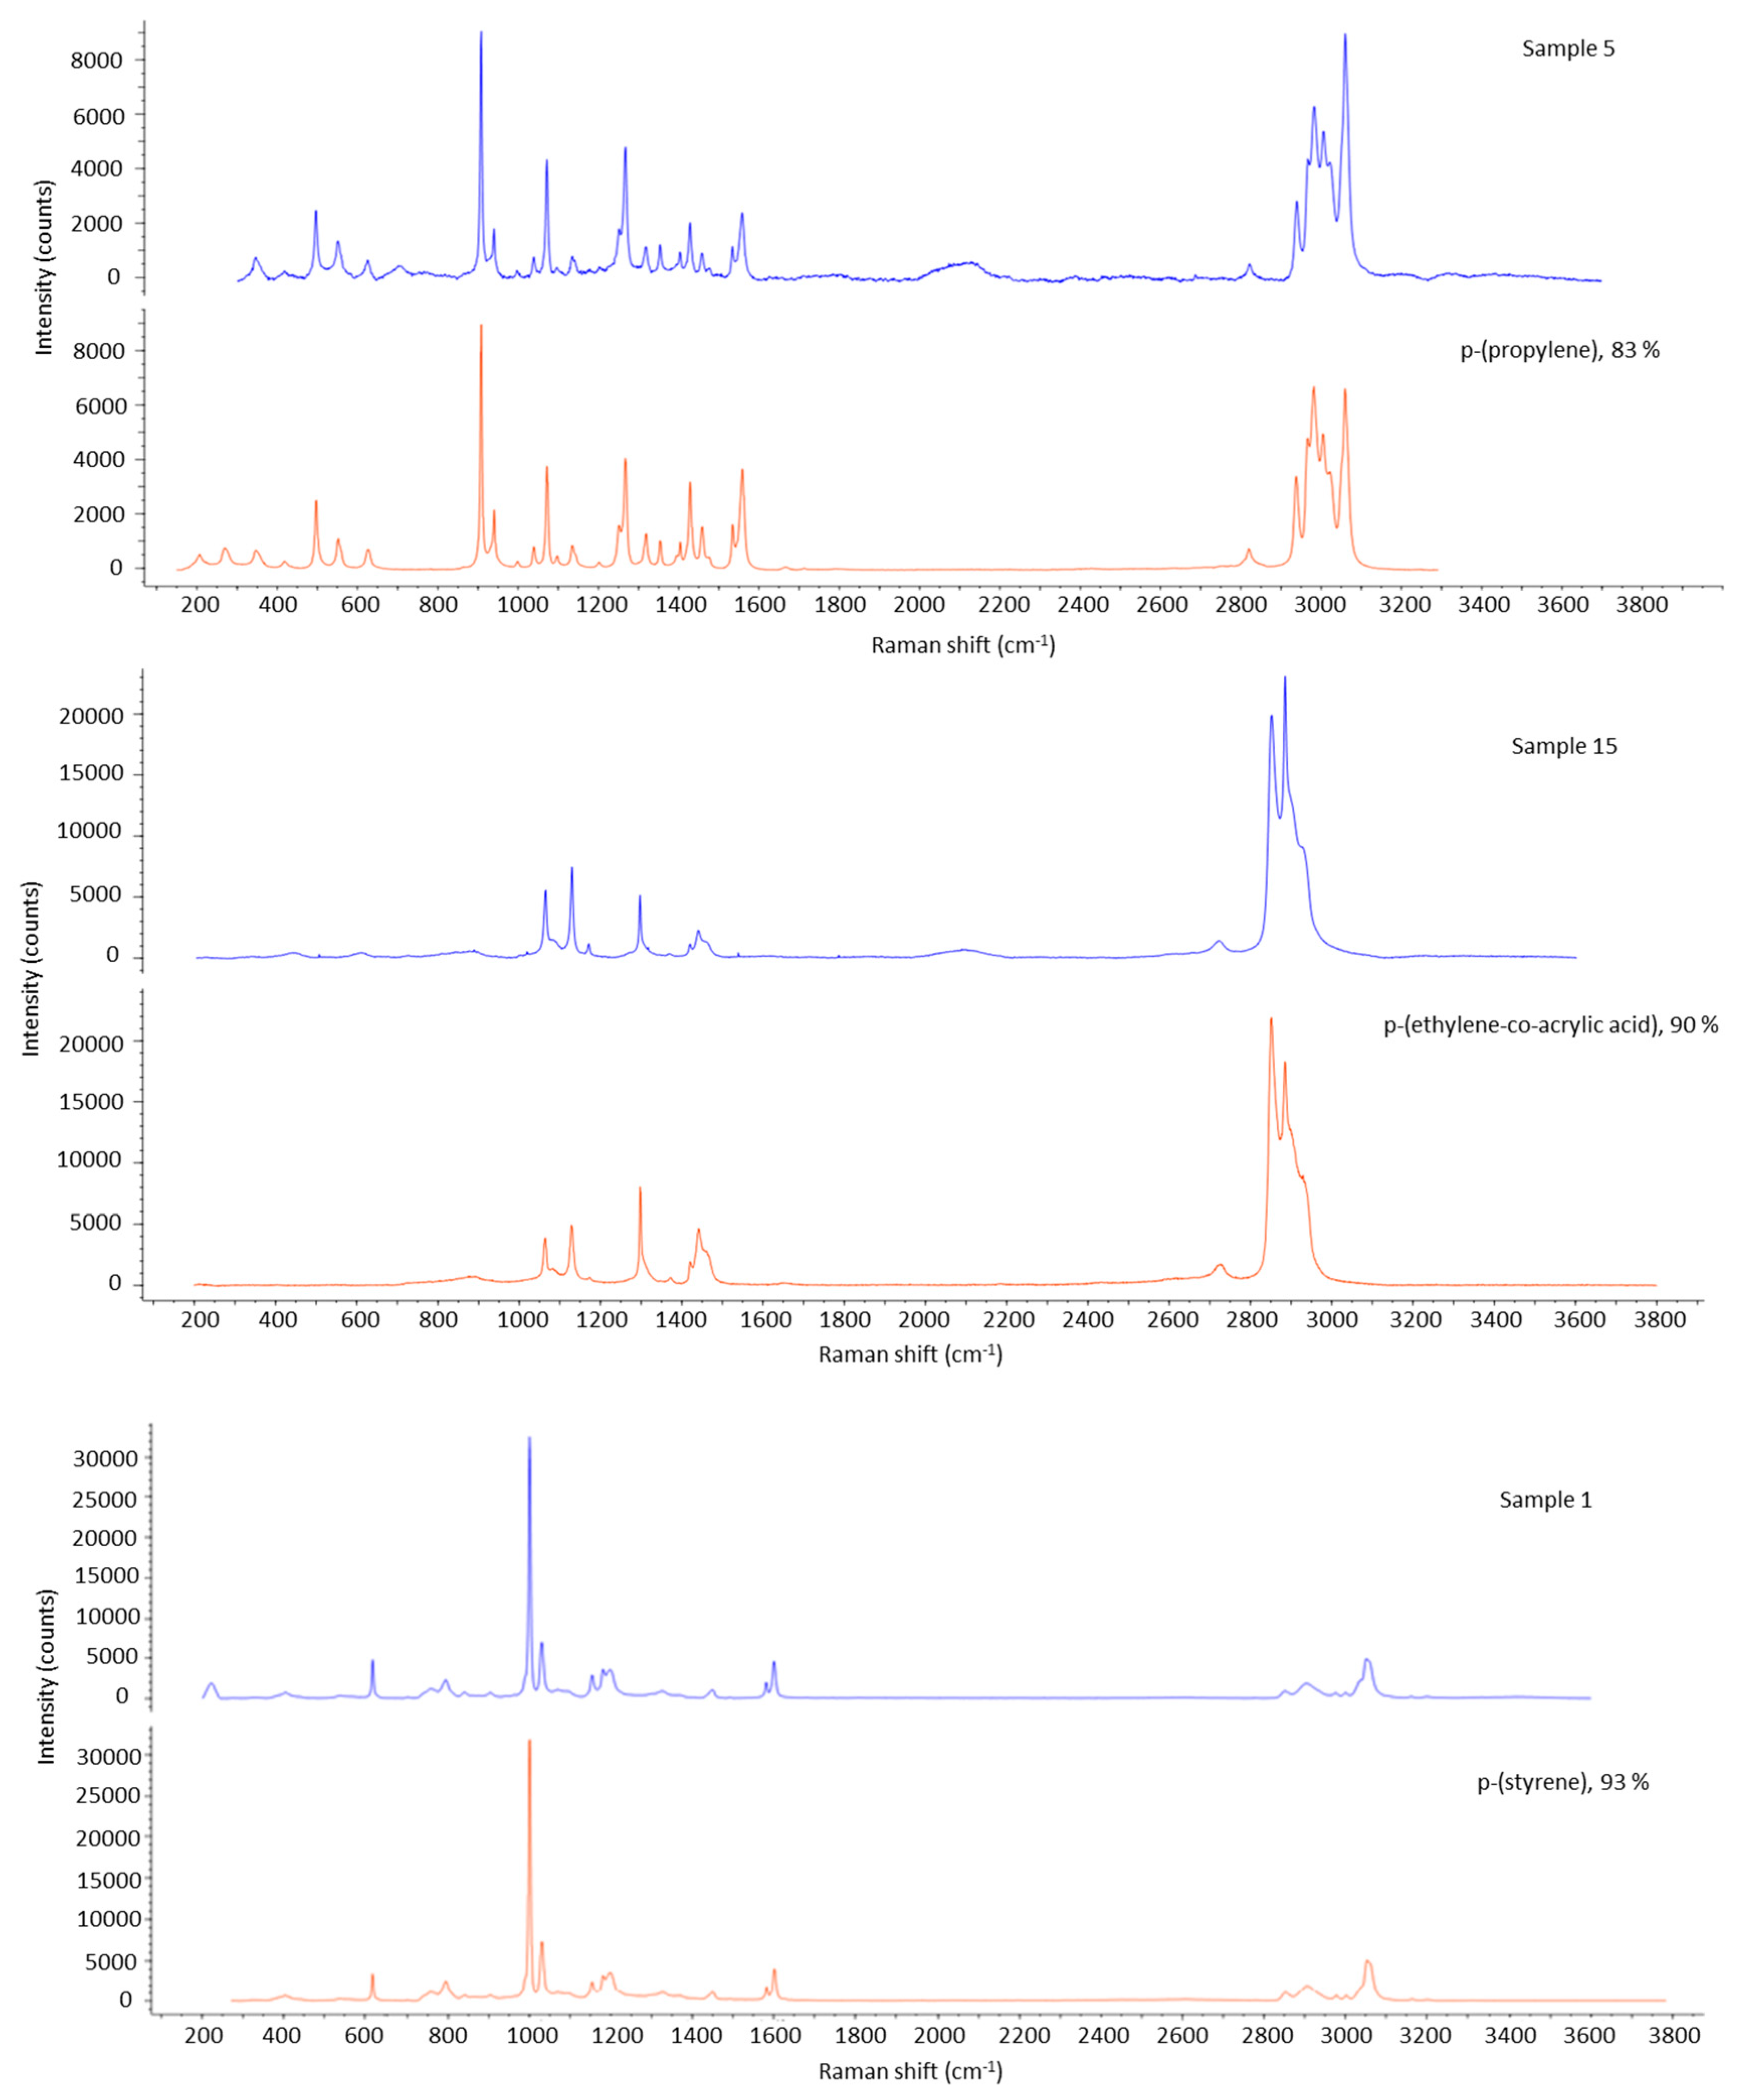
Figure 6.
Representative examples of Raman spectra for microplastics detected in seawater samples with micro-Raman spectroscopy.
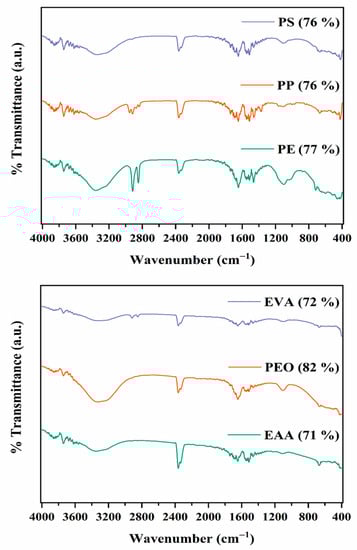
Figure 7.
Representative ATR-FTIR spectra of microplastics detected in seawater samples. From top to bottom: polystyrene (PS), polypropylene (PP), polyethylene (PE), ethylene-co-vinyl acetate (EVA), ethylene oxide (PEO), and ethylene-co-acrylic acid (EAA), each accompanied by the percent match to the corresponding library polymer spectrum.
Furthermore, results obtained from ATR-FTIR (Figure 7) revealed that the spectra of plastic fragments PP and PE often exhibit addition or increase the intensity of carbonyl absorption band (C=O) located around 1700 cm−1, at 1027 cm−1 (C=O) and 874 cm−1 and 911 cm−1 (C=C) which associated with weathering process of plastics. Absorption bands also present in polymers (EVA, EAA, and PEO) correspond to a functional group including hydroxyl or hydroperoxide, O-H (3400 cm−1), carbonyl, C-O (1595 cm−1), and ether, C-O-C (1045 cm−1). In addition to the identification of polymers, ATR-FTIR was also used to determine the carbonyl index (CI), a parameter to measure the degree of oxidation in commonly used polymers. In this study, the specified area under band (SAUB) technique was applied to the IR spectra. Accordingly, the CI of PE, PS, and PP MPs was calculated from the ratio of the integrated band absorbance of the carbonyl (C=O) peak from 1650 to 1850 cm−1 to that of the methylene (CH2) scissoring peak from 1420 to 1500 cm−1, as expressed with the following equation [72]:
The area under the band from 1420 to 1500 cm−1 that is used to calculate CI includes the reference peaks for the common polymers: PE at 1471 cm−1, PP at 1460 cm−1, and PS at 1452 cm−1 since all have C2H2 as the main composition. Thus, a change in absorption because of oxidation of the carbonyl group was evident [73]. The relative level of surface oxidation was expressed as a low surface oxidation rate (with CI between 0 and 0.15), medium (CI between 0.16 and 0.30), and high (with CI ≥ 0.31) [74]. In this study, the CI calculated for PS, PE, and PP polymers varied from 0.32–0.34, 0.28–0.31, and 0.34–0.40, respectively. High values of CI correspond to a higher content of the carbonyl group in MPs caused by an increasing duration of exposure to UV radiation and high temperature and generally throughout the progression of deterioration [72]. The results obtained in this study are consistent with the research of Chen et al. (2021) [75] about the seasonal variation of diversity, weathering, and inventory of MPs in coast and harbor sediments. The average ± standard deviation CI values of PP and PE MPs in seawater were 0.55 ± 0.17 and 0.75 ± 0.21, respectively, which appeared unrelated to spatiotemporal variations. In addition, Jeyasanta et al. (2023) [76] revealed high values of CI > 0.31 (0–1.5) in coastal waters of Tamil Nadu, India, indicating high MP oxidation, unrelated to spatiotemporal changes.
3.3. Surface Morphology and Elemental Analysis Using SEM-EDS
The surface morphology of selected MPs (seawater and fish gut), whose plastic nature and polymer type were previously identified by ATR-FTIR and micro-Raman spectroscopies, were investigated via SEM, as it is a technique through which high-resolution and magnification images can be obtained.
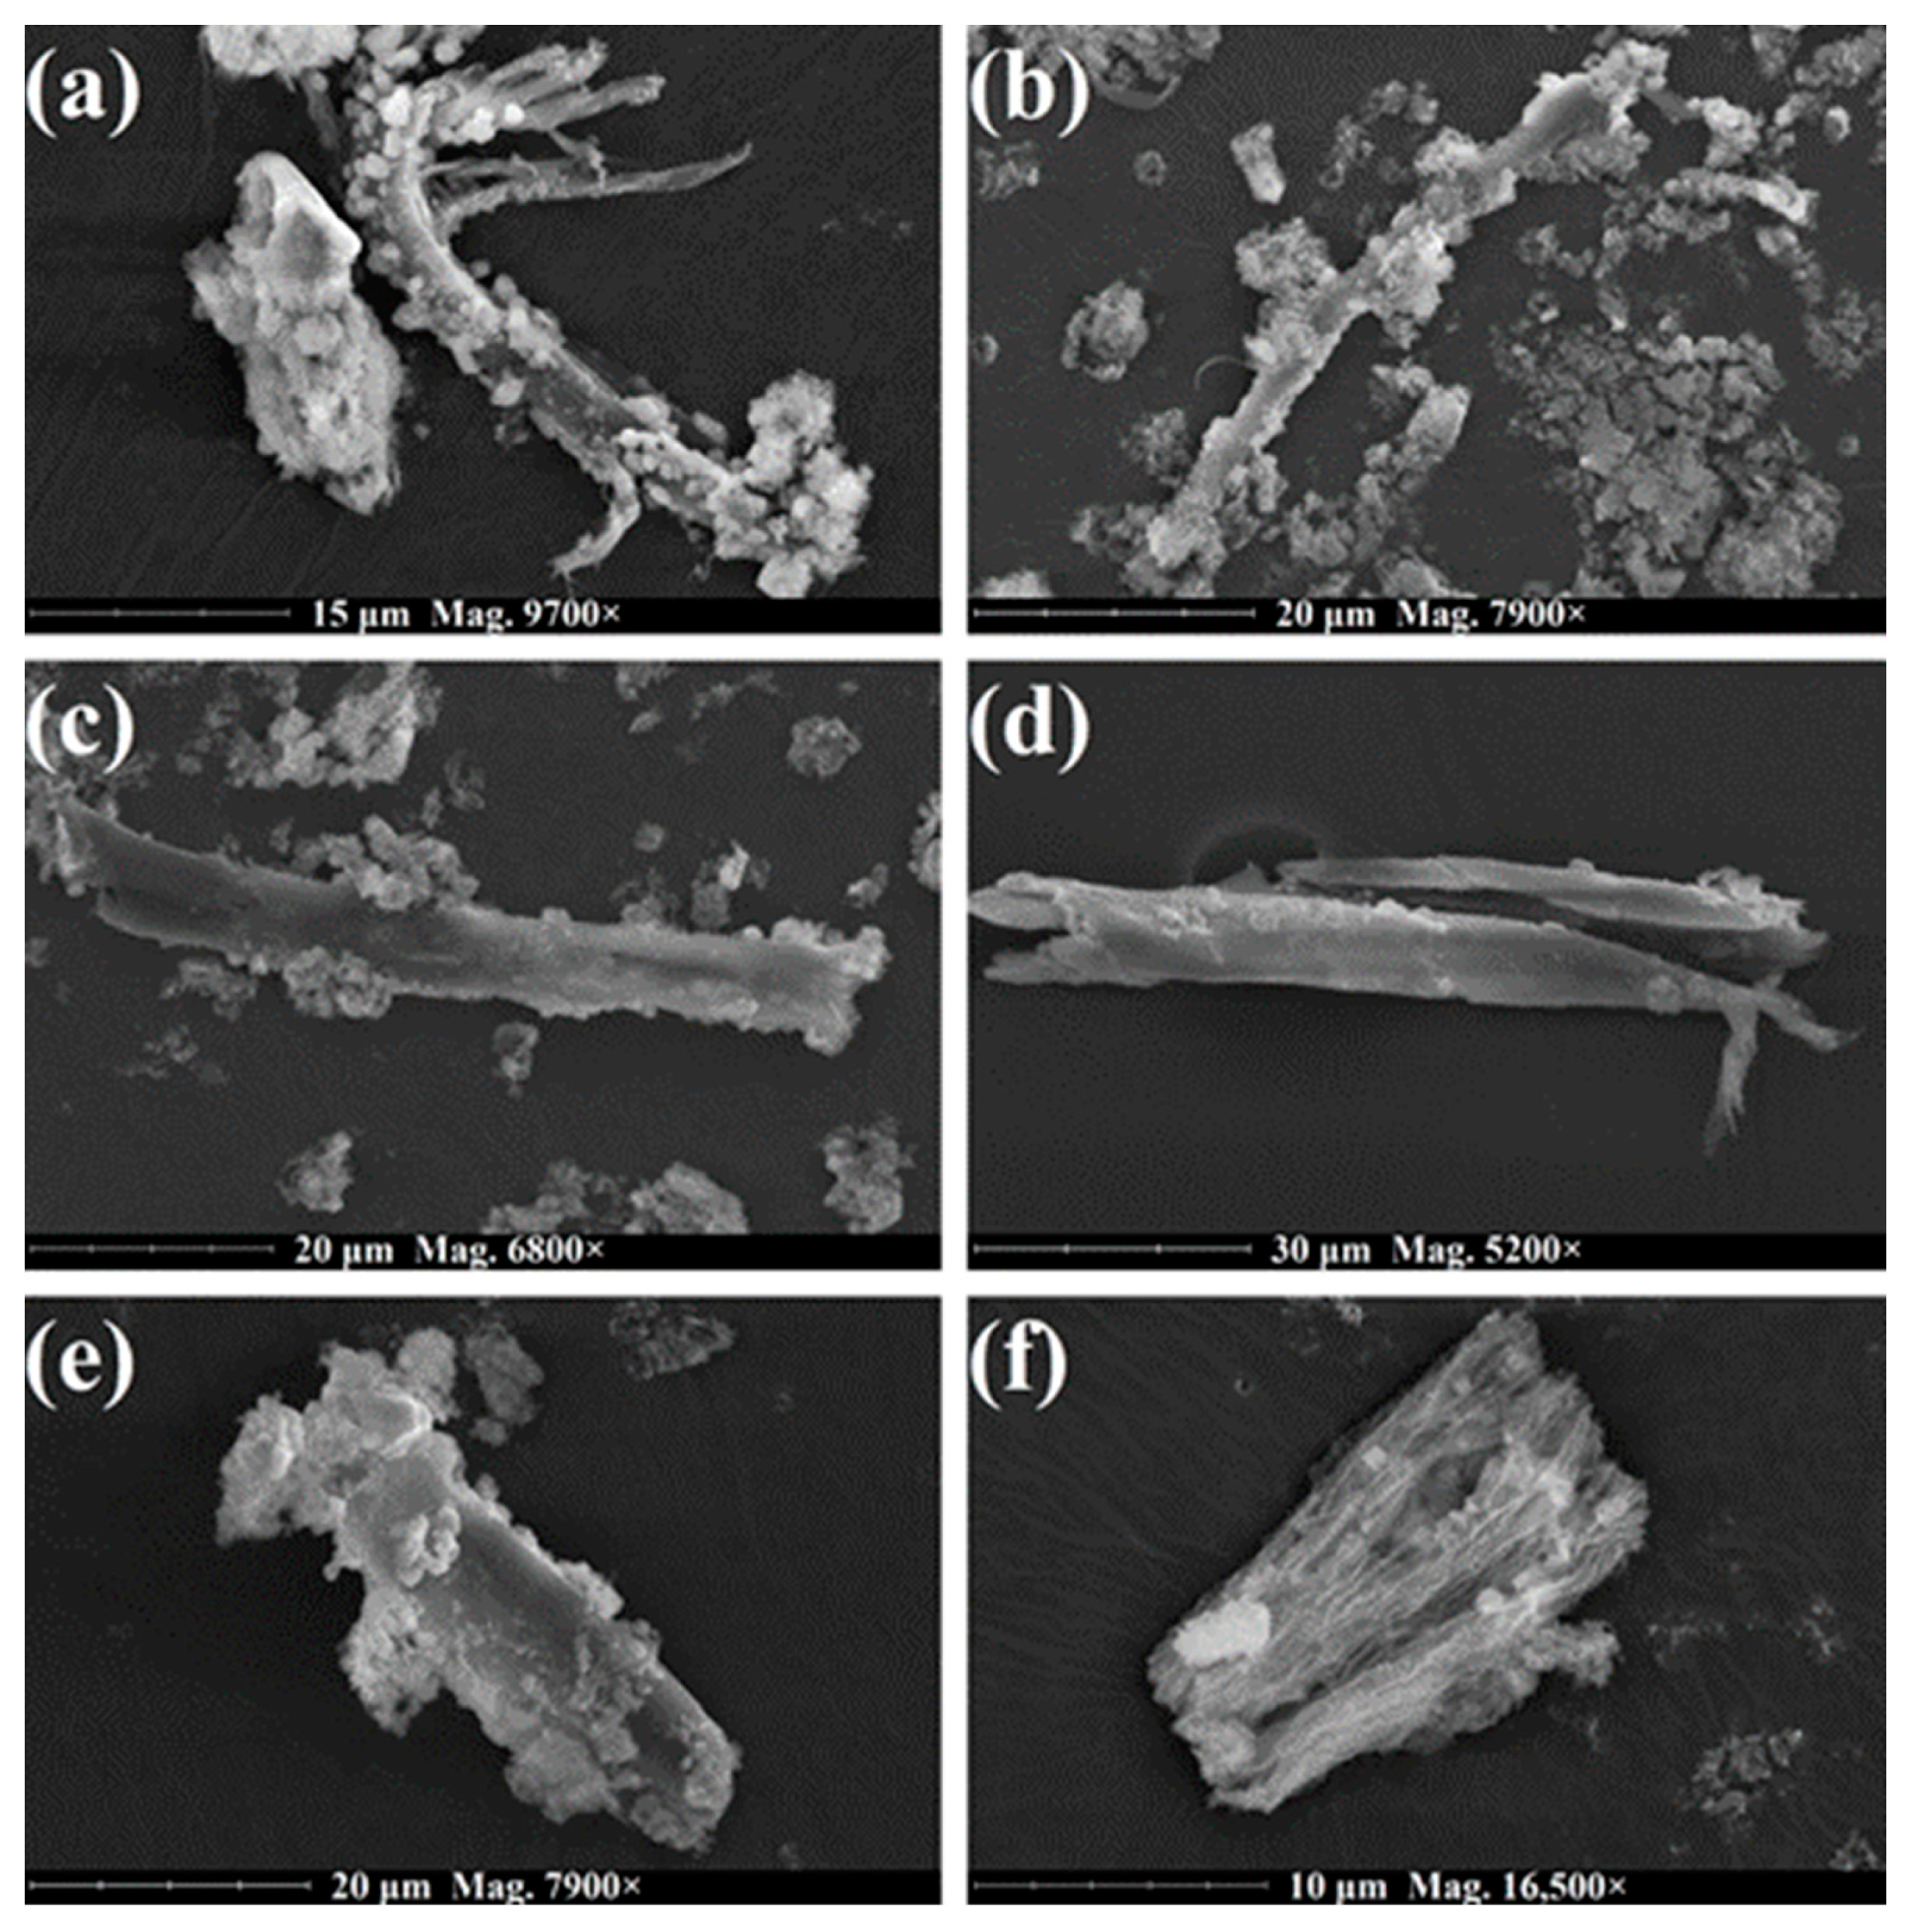
In Figure 8, the SEM images of six selected MPs recovered from seawater are presented, which are representative of the six different classes of plastic materials (PE, PP, PS, PEO, EAA, EVA) that were, as previously mentioned, determined through the combined use of ATR-FTIR and micro-Raman spectroscopies. As can be observed from the micrographs of these MPs, their surfaces appear to be rough with small cracks and burrs, while cavities are also present on some of them (Figure 8b–d). By comparing these images with micrographs of standard PE [77], PP [78], and PS [79], whose surfaces appear to be mostly smooth without any cracks or holes, it appears that all the aforementioned morphological characteristics could be the results of environmental exposure. The results of various studies conducted in different seawaters around the world are in agreement with these findings, as they detected MPs (PE, PP, PS, etc.) whose morphological features were quite similar to those reported in this work and attributed them to mechanical erosion as well as aging in the marine environment [80,81,82,83]. Therefore, this general surface roughness of MPs could act as an indicator of their level of exposure to marine environmental conditions where various abiotic (e.g., mechanical abrasion, photodegradation) and biotic (e.g., bacterial degradation) processes capable of degrading plastic particles take place [31,84]. Also, the aforementioned cracks, burrs, and cavities are of significant importance as they lead to an increase in the surface area of MPs, facilitating the adsorption of various contaminants on their surfaces [31]. As a consequence, the more weathered MPs could potentially pose a greater environmental risk.
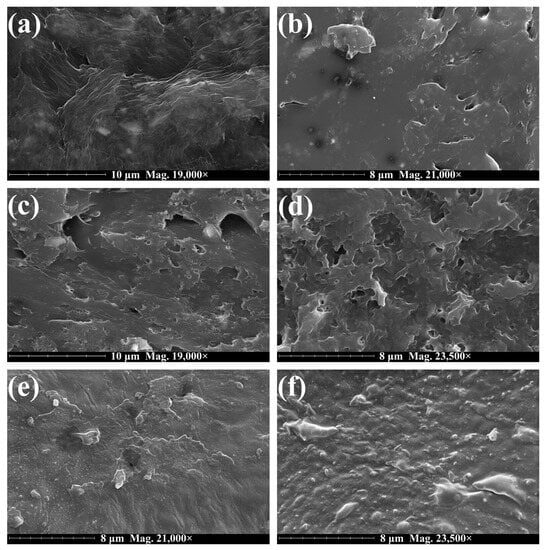
Figure 8.
SEM images of selected MPs recovered from seawater, which were previously identified as (a) PE, (b) PP, (c) PS, (d) EAA, (e) PEO, and (f) EVA. Images were acquired by applying an accelerating voltage of 15 kV under high vacuum (0.1 Pa), using both backscattered and secondary electron detectors (20:80).
From the representative SEM images of MPs (i.e., F1–F6) recovered from fish guts (Figure 9), their average diameter was estimated to be about 7.5 μm, which is consistent with the micro-Raman spectroscopy results that showed an average diameter of about 5.4 μm. The surface morphology of the selected MPs, as in other similar works [31,85,86], appears to be mostly rough, cracked, and uneven due to physical, chemical, and/or biological erosion of the materials in the marine environment [86]. Also, based on their structural characteristics, the fish-recovered MPs were distinguished into two categories, namely fibers and fragments [87], with the former being the largest. The abundance of fibers in the present work coincides with the findings of various studies that retrieved mostly fibrous MPs from the gastrointestinal tracts of other fish species and attributed this to the breakdown of plastic parts of fishing gear as well as recreational sailing equipment [88,89,90].
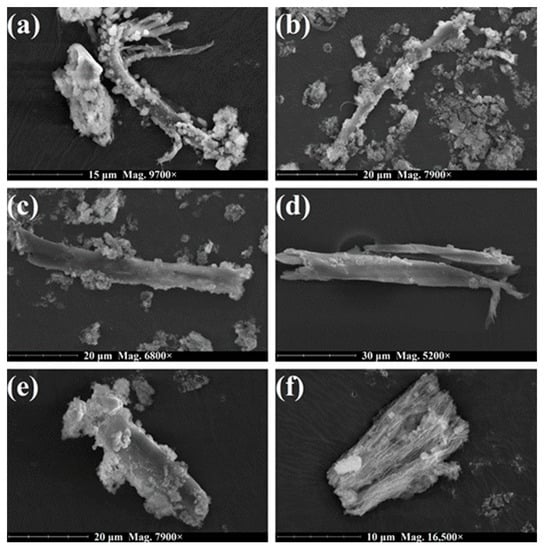
Figure 9.
SEM images of MPs recovered from sea bass guts after digestion that have either (a–d) fibrous (F1–F4) or (e,f) fragment (F5 and F6) structure. Images were acquired by applying an accelerating voltage of 15 kV under high vacuum (0.1 Pa), using both backscattered and secondary electron detectors (20:80).
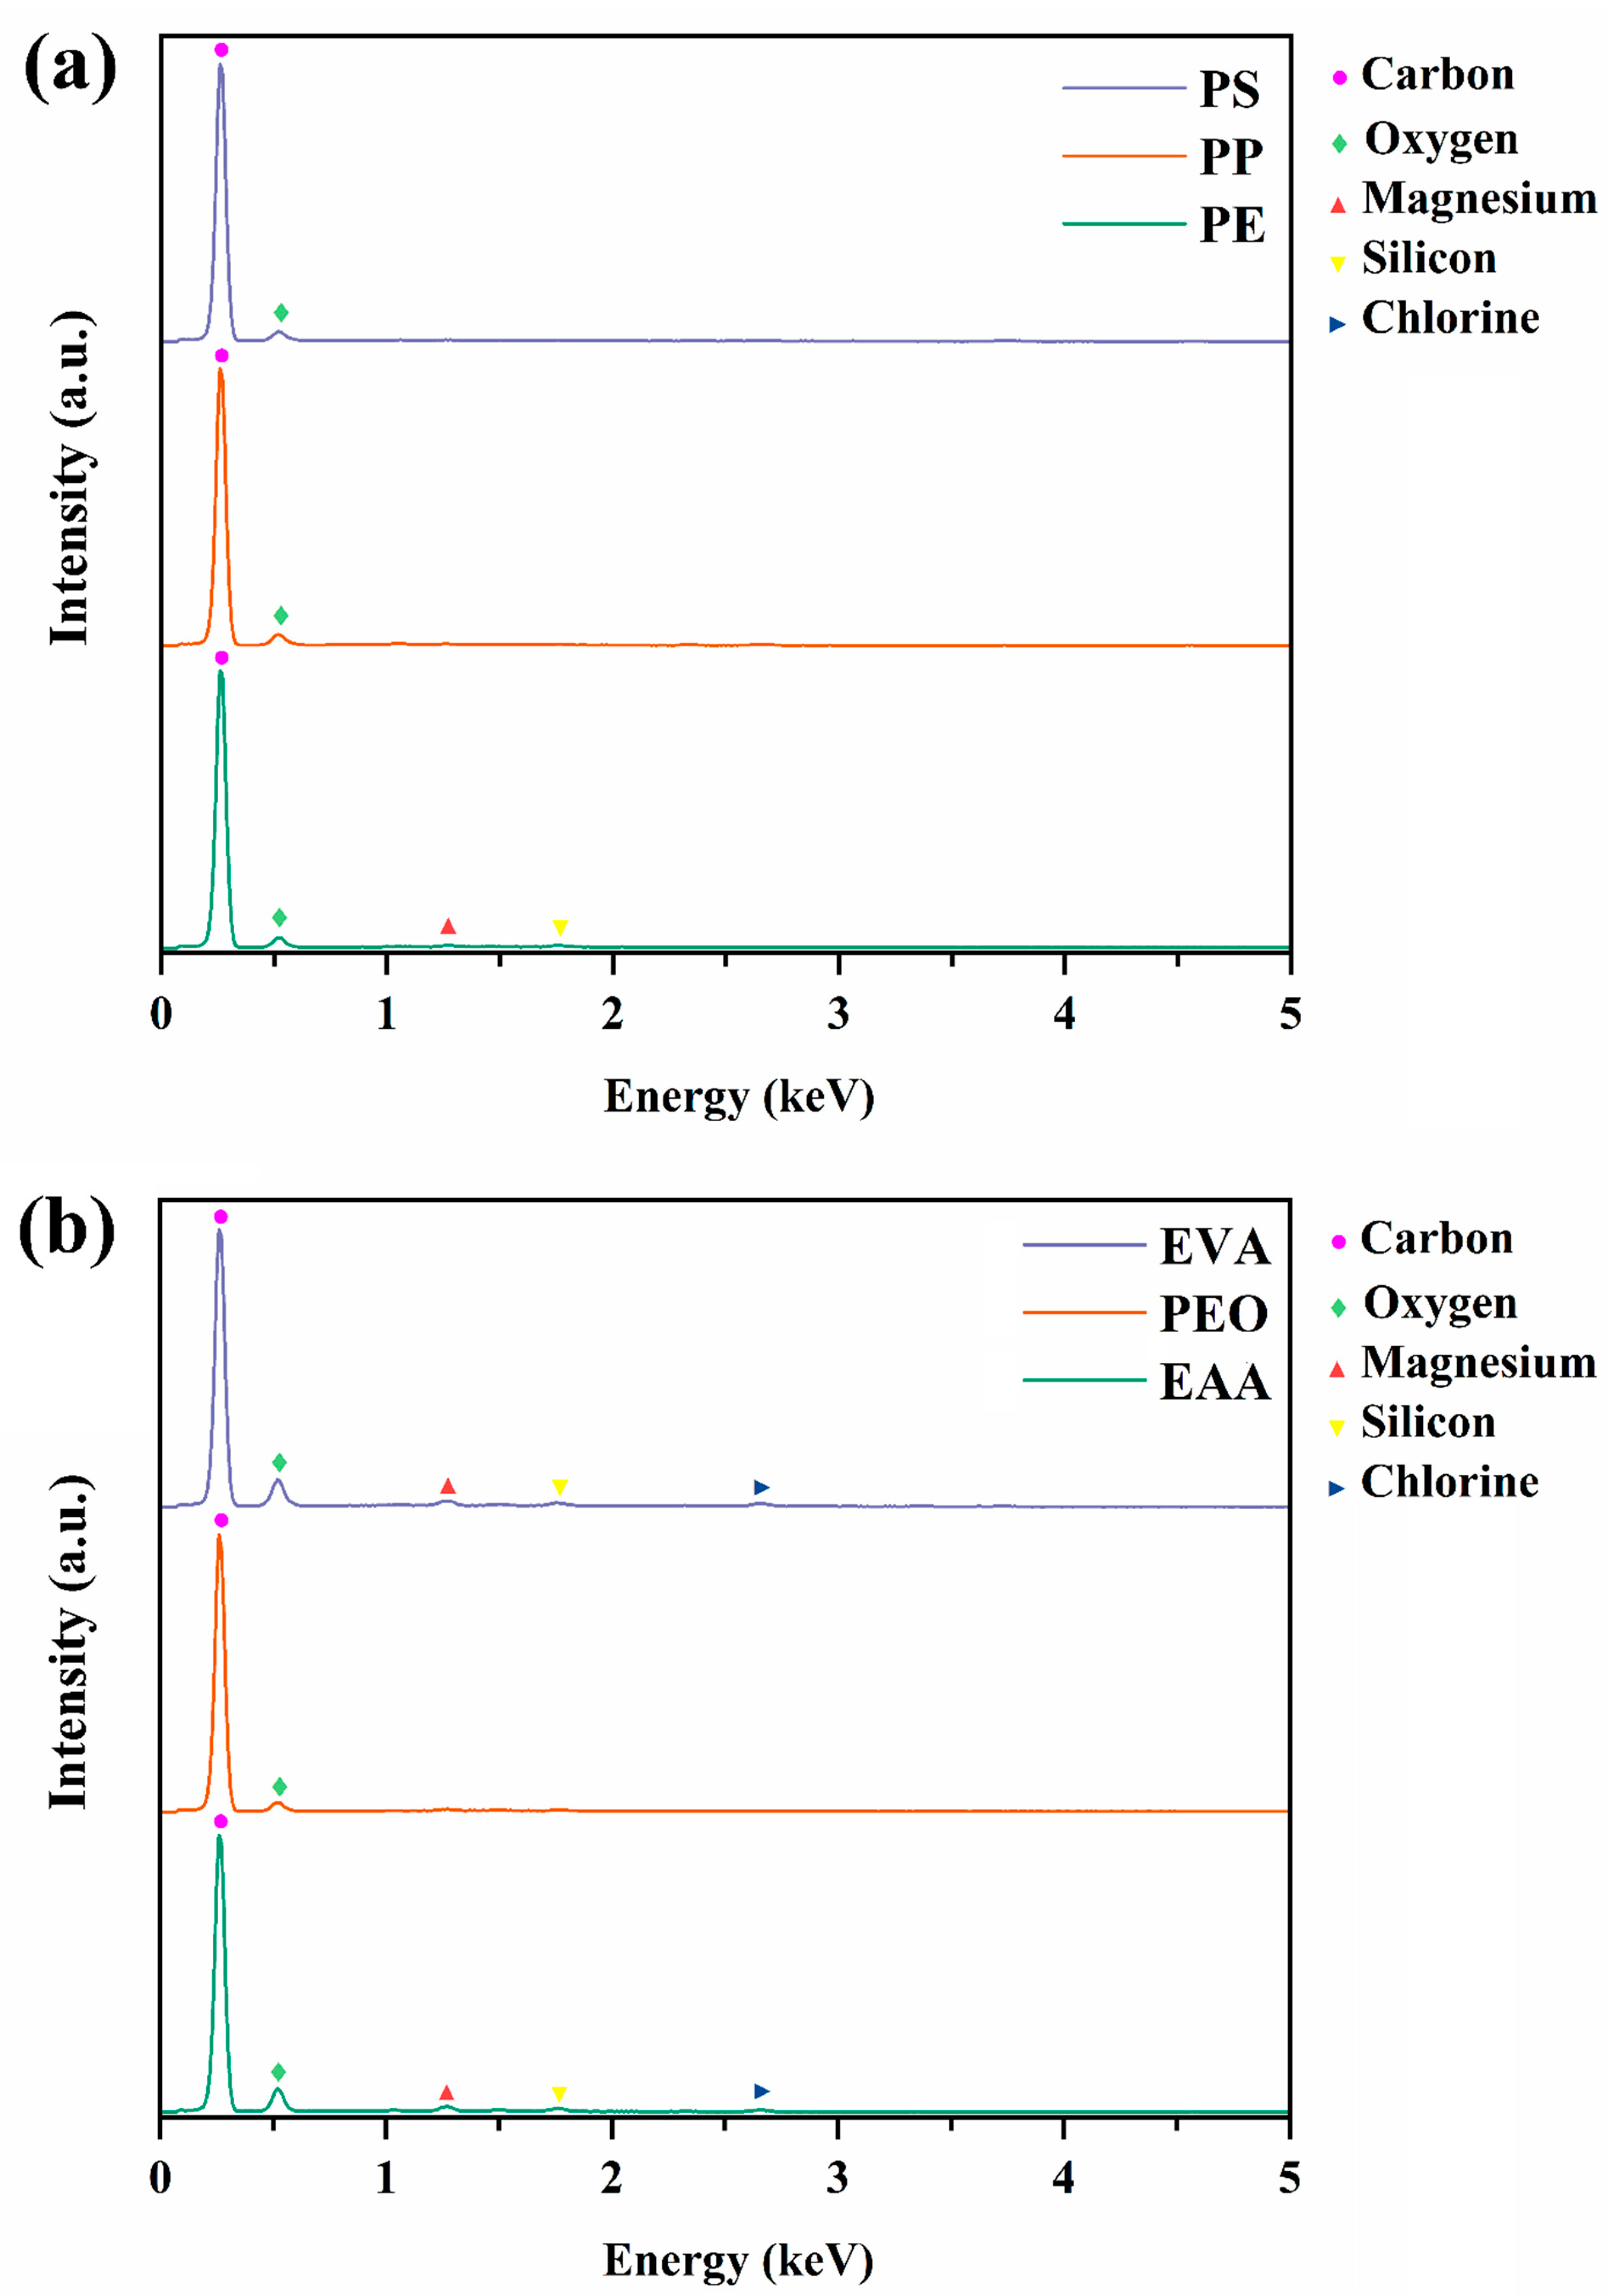
The surface chemical composition of MPs recovered from seawater and fish guts was determined by EDS analysis, which is a technique that provides critical information on the surface state of the materials when combined with SEM, allowing the distinction between MPs and inorganic structures or proxy organic matter [91]. From the EDS spectra of all the different samples recovered from seawater (Figure 10), it becomes apparent that the carbon peak (C Ka, 0.277 KeV), as expected, is the most intense, certifying that these are indeed carbonaceous MPs [73,83]. The second most intense peak, which was also present in the EDS spectra of all the six different types of MPs, was attributed to the presence of oxygen (O Ka. 0.525 KeV).
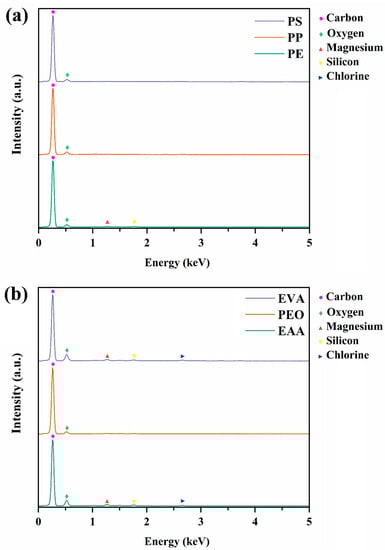
Figure 10.
EDS spectra of selected MPs recovered from seawater, which were identified as (a) polyethylene (PE), polypropylene (PP), and polystyrene (PS) and (b) ethylene-co-acrylic acid (EAA), ethylene oxide (PEO), and ethylene-co-vinyl acetate (EVA), respectively. Spectra were acquired using an accelerating voltage of 15 kV.
On average, the atomic concentration of oxygen on the surface of MPs ranged from 8.8% to 24.7% (Table 1), coinciding with the findings of similar studies [81,92]. Interestingly, oxygen was detected even on the surface of polymers that do not normally contain it in their structure (PE, PP, PS), suggesting that the MPs have possibly undergone photo-oxidation and/or biodegradation in the marine environment [73,81]. These findings are in agreement with the results of micro-Raman and FT-IR spectroscopies since both techniques verified the existence of carbonyl groups on the MPs. In some cases, other elements common to the marine environment (Cl, Mg, Si) [93] were also detected, albeit in very low atomic ratios (<1%), as in similar works on MPs recovered from seawater [73,83,94]. Therefore, it appears that MPs, possibly due to their large, rough surfaces, are able to adsorb and transfer various elements [81].

Table 1.
Average weight concentrations (W %) and atomic concentrations (A %) of the elements detected on the surface of the MPs recovered from seawater. The color of each element is the same as the color of the corresponding symbol in Figure 10.
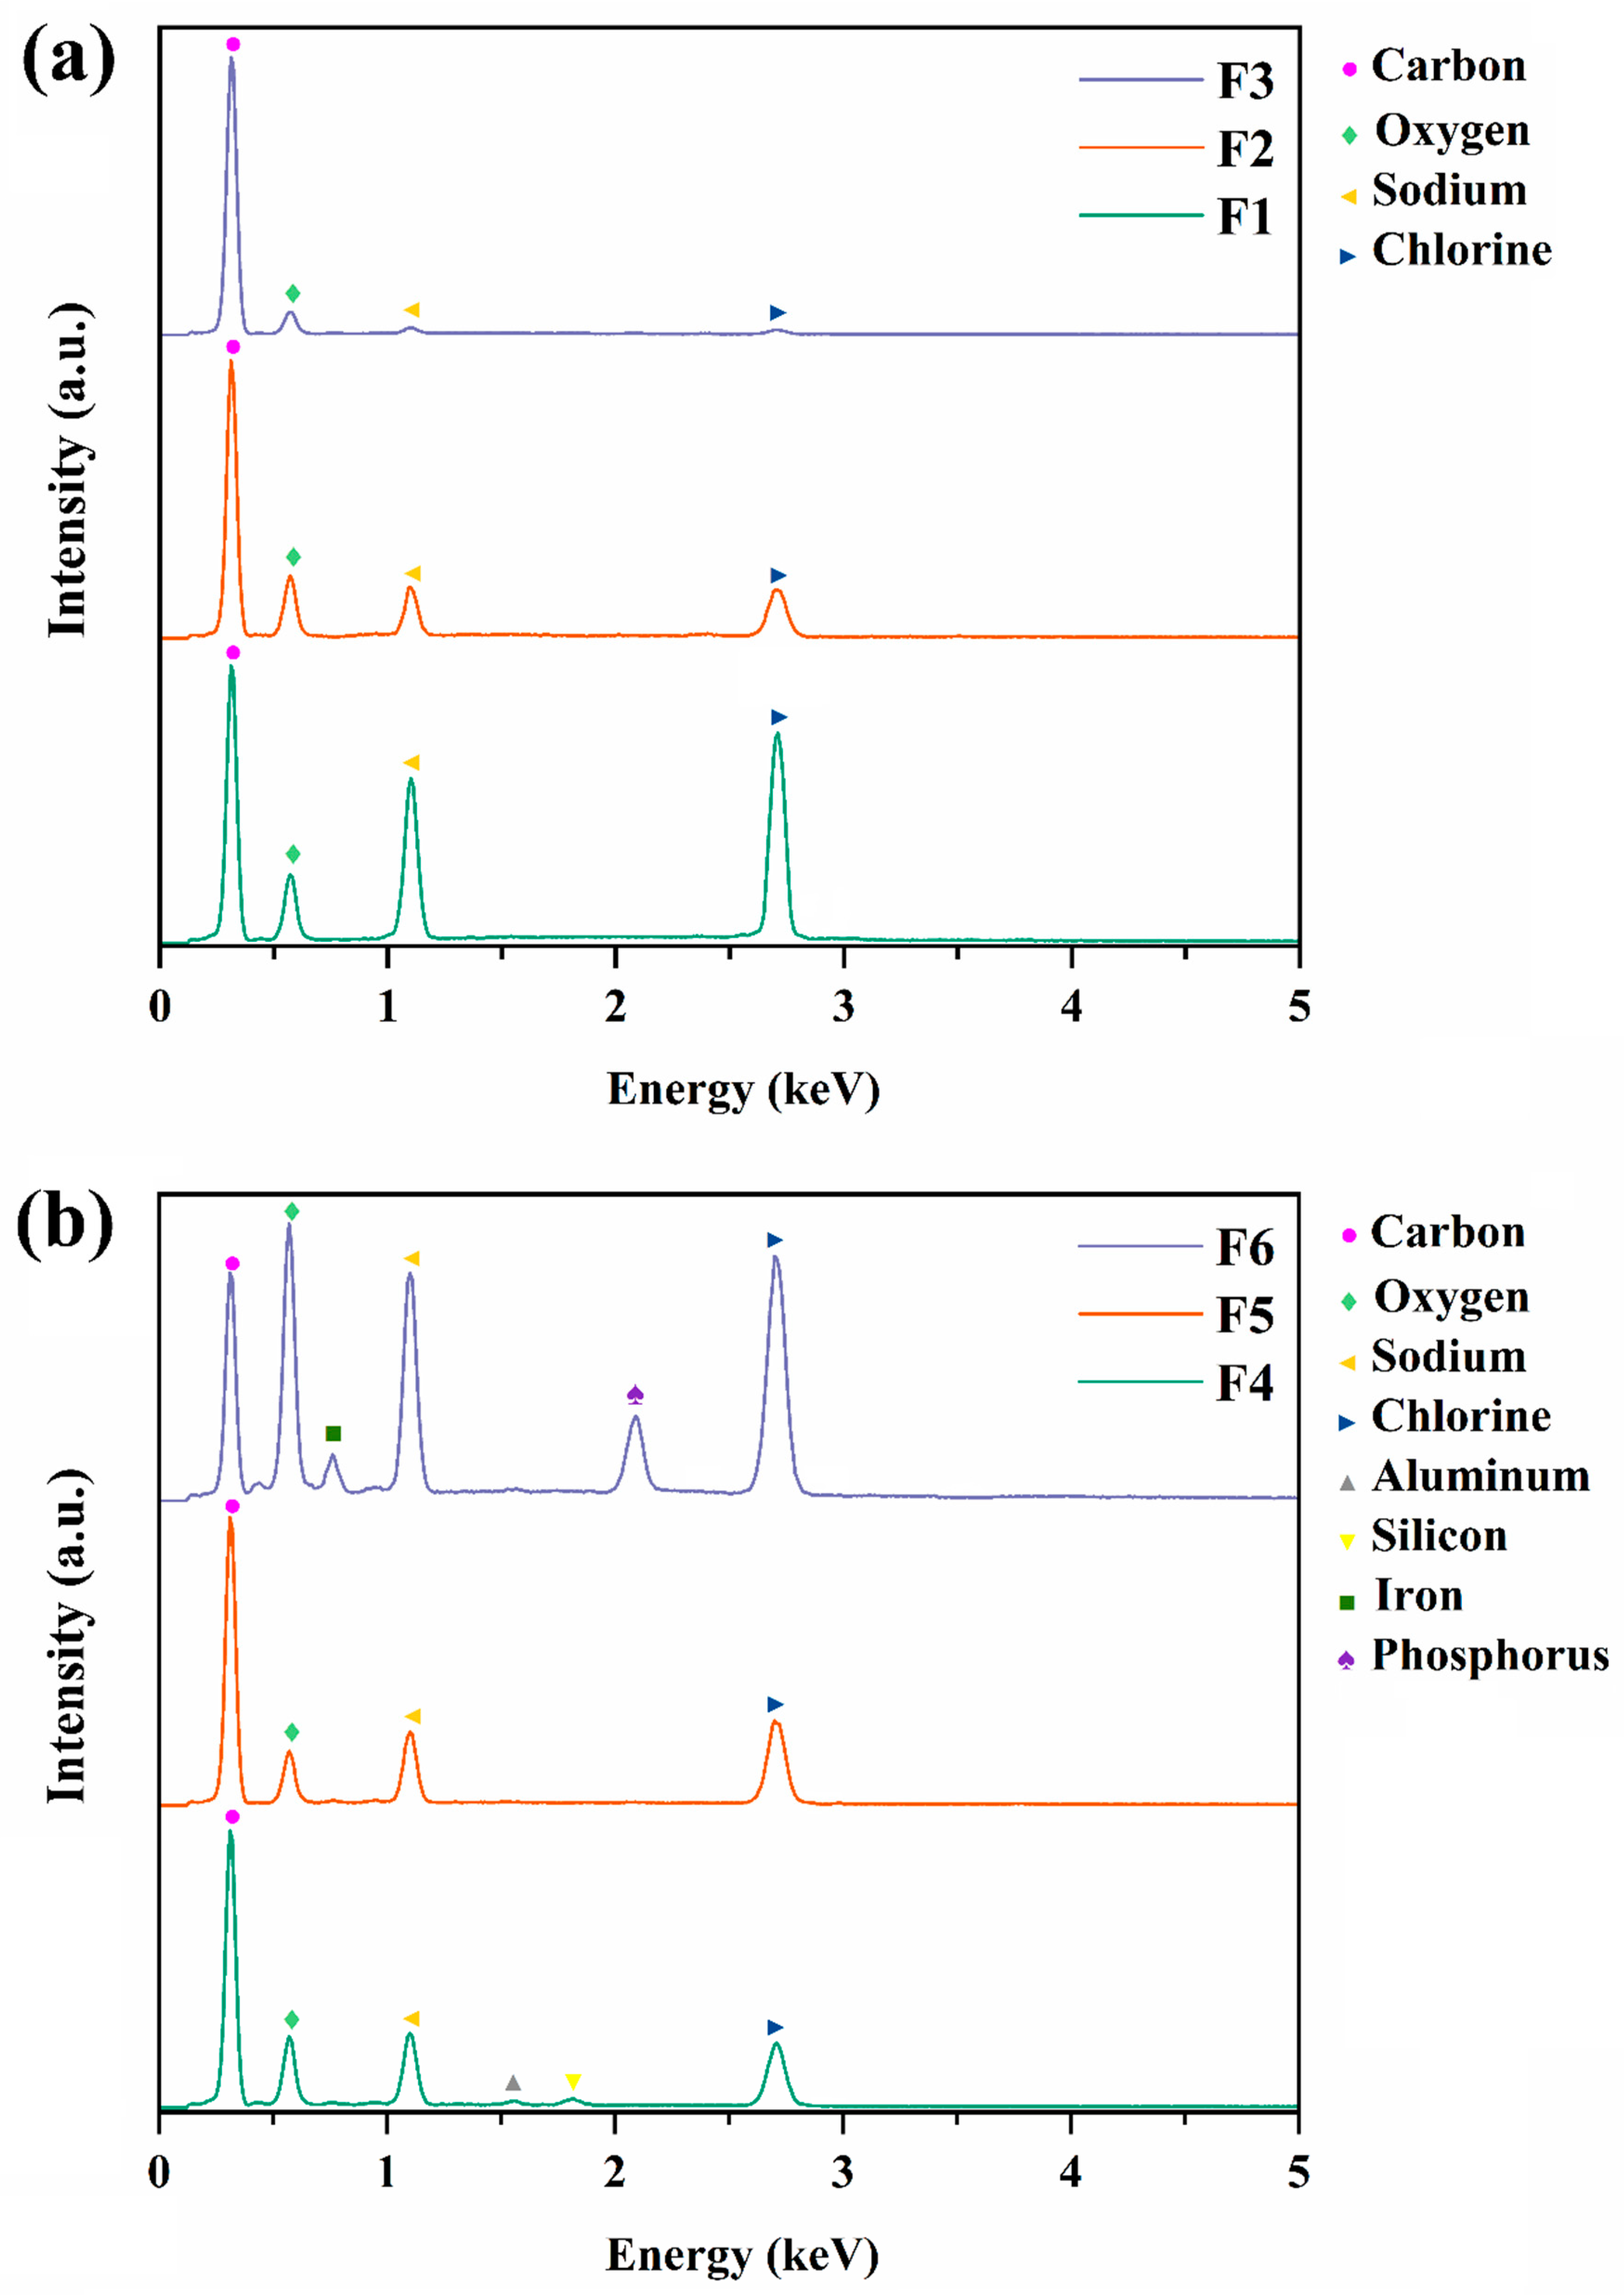
Through the combined use of SEM and EDS, the MPs were easily distinguished from other materials recovered from fish guts after the digestion process that had similar external morphology [54,91,95]. The analysis (Figure 11) revealed that all the selected MPs are mainly composed of carbon (55.7–84.5%) (Table 2), which verifies their plastic nature [31,73]. Interestingly, the surface oxygen content of these MPs, on average, was slightly higher than that of those recovered from seawater. This could be attributed to the fact that the gastrointestinal tract of both the sea bass and the sea bream maintains an acidic environment [96,97], which could facilitate the oxidation of MPs as well as the applied digestion process, which is also an oxidative technique. Apart from carbon and oxygen, other elements were also detected on the surface of MPs (Figure 11) but in lower atomic concentrations (Table 2). In particular, sodium and chlorine were present in all samples in a ratio of approximately 1:1, suggesting that sodium chloride had been deposited on the MPs [31]. Also, two of the six samples, namely F5 and F6, contained small amounts of iron on their surfaces, which coincides with the findings of similar studies on MPs recovered from fish and other marine organisms [87,94,98]. Although the most likely explanation is that iron is a residue of the digestion process, the possibility that it was previously adsorbed from the marine environment cannot be ruled out, as MPs tend to retain metals [31,83,86]. Interestingly, of all the selected MPs, only F4 contained aluminum as well as silicon. Furfaro et al. [98], who recovered MPs from sea slugs, which were also collected from the Ionian Sea, reported the presence of both aluminum and silicon in some of their samples. This fact is interesting since the simultaneous presence of these two elements at similar concentrations may indicate contamination of the MPs by aluminum silicate [73].
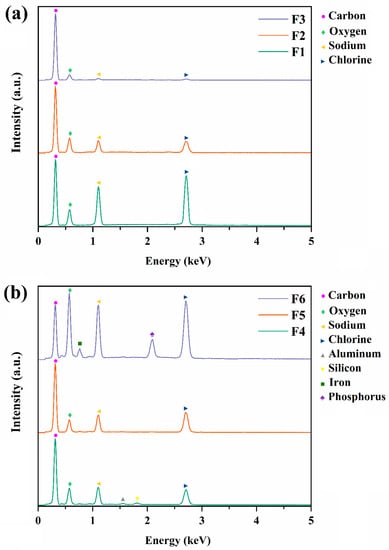
Figure 11.
EDS spectra of six selected MPs recovered from fish guts (a) F1, F2, F3 and (b) F4, F5, F6. Spectra were acquired using an accelerating voltage of 15 kV.
Table 2.
Average weight concentrations (W %) and atomic concentrations (A %) of the elements detected on the surface of the selected MPs recovered from fish guts. The color of each element is the same as the color of the corresponding symbol in Figure 11.
4. Conclusions
Overall, this study provides information on the quantities and types of MPs in sea basses (Dicentrarchus labrax) and sea breams (Sparus aurata), as well as mussels (Mytilus galloprovincialis), from the aquaculture environment of the Northwest Ionian Sea as well as in seawater. PE was the most frequent polymer type found in fish and mussels in consistency with MPs in seawater, reflecting the global production and use of this material. MP ingestion values are comparable to those reported for the same species in other Mediterranean areas. It also documents, for the first time, the detection of PVB (25%) and PBMA (25%) polymers in that kind of fish species. Most MPs sampled in seawater were in the shape of fibers and fragments. A carbonylation index > 0.31 in the analyzed polymers from seawater samples proves the chemical weathering resulting from photo-oxidation and/or bacterial degradation. Weathering and fragmentation processes were observed in the images obtained from SEM, while oxidation and sorption of metallic ions were further confirmed by EDS analysis. Finally, our results can contribute to the definition of baseline levels of MP ingestion in the studied species as well as to the MP pollution in the Mediterranean area.
Supplementary Materials
The following supporting information can be downloaded at https://www.mdpi.com/article/10.3390/app13179705/s1; Figure S1: The stepwise workflow employed in this study to extract efficiently microplastics from fish and mussels. Figure S2: Representative examples of Raman spectra for microplastics detected in sea bream samples with micro-Raman spectroscopy. Figure S3: Representative examples of Raman spectra for microplastics detected in mussel samples with micro-Raman spectroscopy. Figure S4: Representative examples of Raman spectra for microplastics detected in seawater samples with micro-Raman spectroscopy.
Author Contributions
Investigation, visualization, validation, formal analysis, writing—original draft preparation, K.M. and C.L.; methodology, formal analysis, A.G.K.; conceptualization, methodology, supervision, resources, writing—review and editing, funding acquisition, I.K. All authors have read and agreed to the published version of the manuscript.
Funding
The authors would like to acknowledge the financial support of the project “Development of research infrastructure for the design, production, development of quality characteristics and safety of agrofoods and functional foods (RI-Agrofoods)” (MIS 5047235), which is implemented under the Action “Reinforcement of the Research and Innovation Infrastructure”, funded by the Operational Programme “Competitiveness, Entrepreneurship and Innovation” (NSRF 2014–2020) and co-financed by Greece and the European Union (European Regional Development Fund).
Institutional Review Board Statement
Not applicable.
Informed Consent Statement
Not applicable.
Data Availability Statement
The data presented in this study are available in this article and in the associated Supplementary Materials.
Conflicts of Interest
The authors declare no conflict of interest. The funders had no role in the design of the study; in the collection, analyses, or interpretation of data; in the writing of the manuscript; or in the decision to publish the results.
References
- Plastics Europe. In Plastics—The Facts 2022. 2022. Available online: https://plasticseurope.org/knowledge-hub/plastics-the-facts-2022 (accessed on 1 October 2022).
- UNEP. Our Planet Is Choking on Plastic. Available online: https://www.unep.org/interactives/beat-plastic-pollution/ (accessed on 4 August 2023).
- Yang, J.; Monnot, M.; Sun, Y.; Asia, L.; Wong-Wah-Chung, P.; Doumenq, P.; Moulin, P. Microplastics in different water samples (seawater, freshwater, and wastewater): Methodology approach for characterization using micro-FTIR spectroscopy. Water Res. 2023, 232, 119711. [Google Scholar] [CrossRef] [PubMed]
- Pinto Da Costa, J.; Rocha Santos, T.; Duarte, A. The Environmental Impacts of Plastics and Micro-Plastics Use, Waste and Pollution: EU and National Measures; European Union: Brussels, Belgium, 2020; pp. 10–62. [Google Scholar]
- Ajith, N.; Arumugam, S.; Parthasarathy, S.; Manupoori, S.; Janakiraman, S. Global Distribution of Microplastics and Its Impact on Marine Environment—A Review. Environ. Sci. Pollut. Res. 2020, 27, 25970–25986. [Google Scholar] [CrossRef] [PubMed]
- Klein, J.R.; Beaman, J.; Kirkbride, K.P.; Patten, C.; da Silva, K.B. Microplastics in Intertidal Water of South Australia and the Mussel Mytilus spp.; the Contrasting Effect of Population on Concentration. Sci. Total. Environ. 2022, 831, 154875. [Google Scholar] [CrossRef] [PubMed]
- Fendall, L.S.; Sewell, M.A. Contributing to Marine Pollution by Washing Your Face: Microplastics in Facial Cleansers. Mar. Pollut. Bull. 2009, 58, 1225–1228. [Google Scholar] [CrossRef] [PubMed]
- Mason, S.A.; Garneau, D.; Sutton, R.; Chu, Y.; Ehmann, K.; Barnes, J.; Fink, P.; Papazissimos, D.; Rogers, D.L. Microplastic Pollution Is Widely Detected in US Municipal Wastewater Treatment Plant Effluent. Environ. Pollut. 2016, 218, 1045–1054. [Google Scholar] [CrossRef]
- Ling, S.; Sinclair, M.; Levi, C.; Reeves, S.; Edgar, G. Ubiquity of Microplastics in Coastal Seafloor Sediments. Mar. Pollut. Bull. 2017, 121, 104–110. [Google Scholar] [CrossRef]
- Zhao, S.; Ward, J.E.; Danley, M.; Mincer, T.J. Field-Based Evidence for Microplastic in Marine Aggregates and Mussels: Implications for Trophic Transfer. Environ. Sci. Technol. 2018, 52, 11038–11048. [Google Scholar] [CrossRef]
- Pan, Z.; Guo, H.; Chen, H.; Wang, S.; Sun, X.; Zou, Q.; Zhang, Y.; Lin, H.; Cai, S.; Huang, J. Microplastics in the Northwestern Pacific: Abundance, Distribution, and Characteristics. Sci. Total. Environ. 2019, 650, 1913–1922. [Google Scholar] [CrossRef]
- Zhu, L.; Bai, H.; Chen, B.; Sun, X.; Qu, K.; Xia, B. Microplastic Pollution in North Yellow Sea, China: Observations on Occurrence, Distribution and Identification. Sci. Total. Environ. 2018, 636, 20–29. [Google Scholar] [CrossRef]
- Browne, M.A.; Crump, P.; Niven, S.J.; Teuten, E.; Tonkin, A.; Galloway, T.; Thompson, R. Accumulation of Microplastic on Shorelines Woldwide: Sources and Sinks. Environ. Sci. Technol. 2011, 45, 9175–9179. [Google Scholar] [CrossRef]
- Alomar, C.; Deudero, S. Evidence of Microplastic Ingestion in the Shark Galeus melastomus Rafinesque, 1810 in the Continental Shelf off the Western Mediterranean Sea. Environ. Pollut. 2017, 223, 223–229. [Google Scholar] [CrossRef] [PubMed]
- Digka, N.; Tsangaris, C.; Torre, M.; Anastasopoulou, A.; Zeri, C. Microplastics in Mussels and Fish from the Northern Ionian Sea. Mar. Pollut. Bull. 2018, 135, 30–40. [Google Scholar] [CrossRef] [PubMed]
- Cole, M.; Lindeque, P.; Halsband, C.; Galloway, T.S. Microplastics as Contaminants in the Marine Environment: A Review. Mar. Pollut. Bull. 2011, 62, 2588–2597. [Google Scholar] [CrossRef] [PubMed]
- Mubin, A.-N.; Arefin, S.; Mia, S.; Islam, A.R.M.T.; Bari, A.M.; Islam, S.; Ali, M.M.; Siddique, A.B.; Rahman, M.S.; Senapathi, V.; et al. Managing the Invisible Threat of Microplastics in Marine Ecosystems: Lessons from Coast of the Bay of Bengal. Sci. Total. Environ. 2023, 889, 164224. [Google Scholar] [CrossRef]
- Dereszewska, A.; Krasowska, K.; Popek, M. Microplastics in Harbour Seawaters: A Case Study in the Port of Gdynia, Baltic Sea. Sustainability 2023, 15, 6678. [Google Scholar] [CrossRef]
- Saeed, T.; Al-Jandal, N.; Al-Mutairi, A.; Taqi, H. Microplastics in Kuwait Marine Environment: Results of First Survey. Mar. Pollut. Bull. 2020, 152, 110880. [Google Scholar] [CrossRef]
- Tang, L.; Feng, J.-C.; Li, C.; Liang, J.; Zhang, S.; Yang, Z. Global Occurrence, Drivers, and Environmental Risks of Microplastics in Marine Environments. J. Environ. Manag. 2023, 329, 116961. [Google Scholar] [CrossRef]
- Li, Q.; Sun, H.; Bai, Q.; Li, P.; Lai, Y.; Yu, S.; Liu, X.; Yao, Z.; Cai, Y.; Liu, J. Spatial Distribution of Polystyrene Nanoplastics and Small Microplastics in the Bohai Sea, China. Sci. Total. Environ. 2023, 881, 163222. [Google Scholar] [CrossRef]
- Suaria, G.; Cappa, P.; Perold, V.; Aliani, S.; Ryan, P.G. Abundance and Composition of Small Floating Plastics in the Eastern and Southern Sectors of the Atlantic Ocean. Mar. Pollut. Bull. 2023, 193, 115109. [Google Scholar] [CrossRef]
- Reisser, J.; Shaw, J.; Wilcox, C.; Hardesty, B.D.; Proietti, M.; Thums, M.; Pattiaratchi, C. Marine Plastic Pollution in Waters around Australia: Characteristics, Concentrations, and Pathways. PLoS ONE 2013, 8, e80466. [Google Scholar] [CrossRef]
- Pencik, O.; Durdakova, M.; Molnarova, K.; Kucsera, A.; Klofac, D.; Kolackova, M.; Adam, V.; Huska, D. Microplastics and Nanoplastics Toxicity Assays: A revision towards to Environmental-Relevance in Water Environment. J. Hazard. Mater. 2023, 454, 131476. [Google Scholar] [CrossRef] [PubMed]
- Wright, S.L.; Kelly, F.J. Plastic and Human Health: A Micro Issue? Environ. Sci. Technol. 2017, 51, 6634–6647. [Google Scholar] [CrossRef] [PubMed]
- Osman, A.I.; Hosny, M.; Eltaweil, A.S.; Omar, S.; Elgarahy, A.M.; Farghali, M.; Yap, P.-S.; Wu, Y.-S.; Nagandran, S.; Batumalaie, K.; et al. Microplastic Sources, Formation, Toxicity and Remediation: A Review. Environ. Chem. Lett. 2023, 21, 2129–2169. [Google Scholar] [CrossRef]
- Cole, M.; Webb, H.; Lindeque, P.K.; Fileman, E.S.; Halsband, C.; Galloway, T.S. Isolation of Microplastics in Biota-Rich Seawater Samples and Marine Organisms. Sci. Rep. 2015, 4, 4528. [Google Scholar] [CrossRef] [PubMed]
- Wright, S.L.; Rowe, D.; Thompson, R.C.; Galloway, T.S. Microplastic Ingestion Decreases Energy Reserves in Marine Worms. Curr. Biol. 2013, 23, R1031–R1033. [Google Scholar] [CrossRef] [PubMed]
- Compa, M.; Ventero, A.; Iglesias, M.; Deudero, S. Ingestion of Microplastics and Natural Fibres in Sardina pilchardus (Walbaum, 1792) and Engraulis encrasicolus (Linnaeus, 1758) along the Spanish Mediterranean Coast. Mar. Pollut. Bull. 2018, 128, 89–96. [Google Scholar] [CrossRef]
- Codina-García, M.; Militão, T.; Moreno, J.; González-Solís, J. Plastic Debris in Mediterranean Seabirds. Mar. Pollut. Bull. 2013, 77, 220–226. [Google Scholar] [CrossRef]
- Fossi, M.C.; Marsili, L.; Baini, M.; Giannetti, M.; Coppola, D.; Guerranti, C.; Caliani, I.; Minutoli, R.; Lauriano, G.; Finoia, M.G.; et al. Fin Whales and Microplastics: The Mediterranean Sea and the Sea of Cortez Scenarios. Environ. Pollut. 2016, 209, 68–78. [Google Scholar] [CrossRef]
- Jaafar, N.; Azfaralariff, A.; Musa, S.M.; Mohamed, M.; Yusoff, A.H.; Lazim, A.M. Occurrence, Distribution and Characteristics of Microplastics in Gastrointestinal Tract and Gills of Commercial Marine Fish from Malaysia. Sci. Total. Environ. 2021, 799, 149457. [Google Scholar] [CrossRef]
- Gallo, F.; Fossi, C.; Weber, R.; Santillo, D.; Sousa, J.; Ingram, I.; Nadal, A.; Romano, D. Marine Litter Plastics and Microplastics and Their Toxic Chemicals Components: The Need for Urgent Preventive Measures. Environ. Sci. Eur. 2018, 30, 13. [Google Scholar] [CrossRef]
- Abbasi, S.; Soltani, N.; Keshavarzi, B.; Moore, F.; Turner, A.; Hassanaghaei, M. Microplastics in Different Tissues of Fish and Prawn from the Musa Estuary, Persian Gulf. Chemosphere 2018, 205, 80–87. [Google Scholar] [CrossRef] [PubMed]
- Barboza, L.G.A.; Lopes, C.; Oliveira, P.; Bessa, F.; Otero, V.; Henriques, B.; Raimundo, J.; Caetano, M.; Vale, C.; Guilhermino, L. Microplastics in Wild Fish from North East Atlantic Ocean and Its Potential for Causing Neurotoxic Effects, Lipid Oxidative Damage, and Human Health Risks Associated with Ingestion Exposure. Sci. Total. Environ. 2020, 717, 134625. [Google Scholar] [CrossRef] [PubMed]
- Gola, D.; Tyagi, P.K.; Arya, A.; Chauhan, N.; Agarwal, M.; Singh, S.; Gola, S. The Impact of Microplastics on Marine Environment: A Review. Environ. Nanotechnol. Monit. Manag. 2021, 16, 100552. [Google Scholar] [CrossRef]
- Wu, J.; Yin, X.; Liu, Y.; Chen, X.; Xie, C.; Liang, Y.; Li, J.; Jiang, Z. Seasonal Variation and Ecological Risk Assessment of Microplastics Ingested by Economic Fishes in Lake Chaohu, China. Sci. Total. Environ. 2022, 833, 155181. [Google Scholar] [CrossRef] [PubMed]
- Fang, C.; Zheng, R.; Chen, H.; Hong, F.; Lin, L.; Lin, H.; Guo, H.; Bailey, C.; Segner, H.; Mu, J.; et al. Comparison of Microplastic Contamination in Fish and Bivalves from Two Major Cities in Fujian Province, China and the Implications for Human Health. Aquaculture 2019, 512, 734322. [Google Scholar] [CrossRef]
- Adam, V.; von Wyl, A.; Nowack, B. Probabilistic Environmental Risk Assessment of Microplastics in Marine Habitats. Aquat. Toxicol. 2021, 230, 105689. [Google Scholar] [CrossRef]
- Li, J.; Lusher, A.L.; Rotchell, J.M.; Deudero, S.; Turra, A.; Bråte, I.L.N.; Sun, C.; Hossain, M.S.; Li, Q.; Kolandhasamy, P.; et al. Using Mussel as a Global Bioindicator of Coastal Microplastic Pollution. Environ. Pollut. 2018, 244, 522–533. [Google Scholar] [CrossRef]
- Dellisanti, W.; Leung, M.M.-L.; Lam, K.W.-K.; Wang, Y.; Hu, M.; Lo, H.S.; Fang, J.K.H. A Short Review on the Recent Method Development for Extraction and Identification of Microplastics in Mussels and Fish, Two Major Groups of Seafood. Mar. Pollut. Bull. 2023, 186, 114221. [Google Scholar] [CrossRef]
- Bessa, F.; Barría, P.; Neto, J.M.; Frias, J.P.; Otero, V.; Sobral, P.; Marques, J. Occurrence of Microplastics in Commercial Fish from a Natural Estuarine Environment. Mar. Pollut. Bull. 2018, 128, 575–584. [Google Scholar] [CrossRef]
- Li, J.; Green, C.; Reynolds, A.; Shi, H.; Rotchell, J.M. Microplastics in Mussels Sampled from Coastal Waters and Supermarkets in the United Kingdom. Environ. Pollut. 2018, 241, 35–44. [Google Scholar] [CrossRef]
- Pittura, L.; Garaventa, F.; Costa, E.; Minetti, R.; Nardi, A.; Ventura, L.; Morgana, S.; Capello, M.; Ungherese, G.; Regoli, F.; et al. Microplastics in Seawater and Marine Organisms: Site-Specific Variations over Two-Year Study in Giglio Island (North Tyrrhenian Sea). Mar. Pollut. Bull. 2022, 181, 113916. [Google Scholar] [CrossRef] [PubMed]
- Anastasopoulou, A.; Mytilineou, C.; Smith, C.J.; Papadopoulou, K.N. Plastic Debris Ingested by Deep-Water Fish of the Ionian Sea (Eastern Mediterranean). Deep. Sea Res. Part I Oceanogr. Res. Pap. 2013, 74, 11–13. [Google Scholar] [CrossRef]
- Vlachogianni, T.; Anastasopoulou, A.; Fortibuoni, T.; Ronchi, F.; Zeri, C. Marine litter assessment in the Adriatic and Ionian Seas. In IPA-Adriatic DeFishGear Project, MIO-ECSDE, HCMR and ISPRA; Marine Pollution Bulletin: Greece, 2017; p. 168. ISBN 978-960-6793-25-7. [Google Scholar]
- Boti, V.; Toli, V.; Efthymiou, C.; Albanis, T. Screening of Commonly Used Antibiotics in Fresh and Saltwater Samples Impacted by Aquacultures: Analytical Methodology, Occurrence and Environmental Risk Assessment. Sustainability 2023, 15, 9199. [Google Scholar] [CrossRef]
- Stock, F.; Kochleus, C.; Bänsch-Baltruschat, B.; Brennholt, N.; Reifferscheid, G. Sampling Techniques and Preparation Methods for Microplastic Analyses in the Aquatic Environment—A Review. TrAC Trends Anal. Chem. 2019, 113, 84–92. [Google Scholar] [CrossRef]
- Hurley, R.R.; Lusher, A.L.; Olsen, M.; Nizzetto, L. Validation of a Method for Extracting Microplastics from Complex, Organic-Rich, Environmental Matrices. Environ. Sci. Technol. 2018, 52, 7409–7417. [Google Scholar] [CrossRef]
- Hoellein, T.; Rovegno, C.; Uhrin, A.V.; Johnson, E.; Herring, C. Microplastics in Invasive Freshwater Mussels (Dreissena sp.): Spatiotemporal Variation and Occurrence with Chemical Contaminants. Front. Mar. Sci. 2021, 8, 690401. [Google Scholar] [CrossRef]
- Munno, K.; Helm, P.A.; Jackson, D.A.; Rochman, C.; Sims, A. Impacts of Temperature and Selected Chemical Digestion Methods on Microplastic Particles. Environ. Toxicol. Chem. 2018, 37, 91–98. [Google Scholar] [CrossRef]
- Yan, F.; Wang, X.; Sun, H.; Zhu, Z.; Sun, W.; Shi, X.; Zhang, J.; Zhang, L.; Wang, X.; Liu, M.; et al. Development of a Binary Digestion System for Extraction Microplastics in Fish and Detection Method by Optical Photothermal Infrared. Front. Mar. Sci. 2022, 9, 845062. [Google Scholar] [CrossRef]
- Frias, J.; Pagter, E.; Nash, R.; O’Connor, I.; Carretero, O.; Filgueiras, A.; Viñas, L.; Gago, J.; Antunes, J.; Bessa, F.; et al. Standardised Protocol for Monitoring Microplastics in Sediments; JPI-Oceans: Bruxelles, Belgium, 2018. [Google Scholar] [CrossRef]
- Shim, W.J.; Hong, S.H.; Eo, S.E. Identification Methods in Microplastic Analysis: A Review. Anal. Methods 2017, 9, 1384–1391. [Google Scholar] [CrossRef]
- Kılıç, E. Microplastic Ingestion Evidence by Economically Important Farmed Fish Species from Turkey. Mar. Pollut. Bull. 2022, 183, 114097. [Google Scholar] [CrossRef]
- Azizi, N.; Khoshnamvand, N.; Nasseri, S. The Quantity and Quality Assessment of Microplastics in the Freshwater Fishes: A Systematic Review and Meta-Analysis. Reg. Stud. Mar. Sci. 2021, 47, 101955. [Google Scholar] [CrossRef]
- Alonso-López, O.; López-Ibáñez, S.; Beiras, R. Assessment of Toxicity and Biodegradability of Poly(Vinyl Alcohol)-Based Materials in Marine Water. Polymers 2021, 13, 3742. [Google Scholar] [CrossRef]
- Khattab, Y.; Mohammadein, A.; Al Malki, J.S.; Hussien, N.A.; Tantawy, E.M. Preliminary Screening of Microplastic Contamination in Different Marine Fish Species of Taif Market, Saudi Arabia. Open Life Sci. 2022, 17, 333–343. [Google Scholar] [CrossRef]
- Badr, M.M.; Badr, M.M.; Mansour, N.A.; Abulyazied, D.E.; Amer, M.S.; Moustafa, H.Y.; Ali, I.M.; Motawie, A.M. Studies on Coating Properties of Diglycidyl Ether of Bisphenol—A Modified with Poly(Vinyl Acetal). Aust. J. Basic Appl. Sci. 2012, 6, 666–674. [Google Scholar]
- Ma, C.; Zhang, S.; Cong, F.; Xu, Y.; Zhang, J.; Zhang, D.; Zhang, L.; Su, Y. Sustained Oxygen Release of Hydrogen Peroxide-acrylic Resin Inclusion Complex for Aquaculture. J. Polym. Eng. 2023, 43, 167–178. [Google Scholar] [CrossRef]
- Tomba, J.P.; Mana, C.D.; Perez, C.; Desimone, P.M.; Galland, G.B. Microstructural Characterization of Semicrystalline Copolymers by Raman Spectroscopy. Polym. Test. 2016, 52, 71–78. [Google Scholar] [CrossRef]
- Thomas, K.J.; Sheeba, M.; Nampoori, V.P.N.; Vallabhan, C.P.G.; Radhakrishnan, P. Raman Spectra of Polymethyl Methacrylate Optical Fibres Excited by a 532 nm Diode Pumped Solid State Laser. J. Opt. A Pure Appl. Opt. 2008, 10, 055303. [Google Scholar] [CrossRef]
- Xingsheng, X.; Hai, M.; Qijing, Z.; Yunsheng, Z. Properties of Raman Spectra and Laser-Induced Birefringence in Polymethyl Methacrylate Optical Fibres. J. Opt. A Pure Appl. Opt. 2002, 4, 237–242. [Google Scholar] [CrossRef]
- Reinold, S.; Herrera, A.; Saliu, F.; Hernández-González, C.; Martinez, I.; Lasagni, M.; Gómez, M. Evidence of Microplastic Ingestion by Cultured European Sea Bass (Dicentrarchus labrax). Mar. Pollut. Bull. 2021, 168, 112450. [Google Scholar] [CrossRef]
- El-Sayed, A.A.; Ibrahim, M.I.; Shabaka, S.; Ghobashy, M.M.; Shreadah, M.A.; Ghani, S.A.A. Microplastics Contamination in Commercial Fish from Alexandria City, the Mediterranean Coast of Egypt. Environ. Pollut. 2022, 313, 120044. [Google Scholar] [CrossRef]
- Bayo, J.; Rojo, D.; Martínez-Baños, P.; López-Castellanos, J.; Olmos, S. Commercial Gilthead Seabream (Sparus aurata L.) from the Mar Menor Coastal Lagoon as Hotspots of Microplastic Accumulation in the Digestive System. Int. J. Environ. Res. Public Health 2021, 18, 6844. [Google Scholar] [CrossRef] [PubMed]
- Collard, F.; Gilbert, B.; Eppe, G.; Roos, L.; Compère, P.; Das, K.; Parmentier, E. Morphology of the Filtration Apparatus of Three Planktivorous Fishes and Relation with Ingested Anthropogenic Particles. Mar. Pollut. Bull. 2017, 116, 182–191. [Google Scholar] [CrossRef] [PubMed]
- Bråte, I.L.N.; Eidsvoll, D.P.; Steindal, C.C.; Thomas, K.V. Plastic Ingestion by Atlantic Cod (Gadus morhua) from the Norwegian Coast. Mar. Pollut. Bull. 2016, 112, 105–110. [Google Scholar] [CrossRef] [PubMed]
- Ferrante, M.; Pietro, Z.; Allegui, C.; Maria, F.; Antonio, C.; Pulvirenti, E.; Favara, C.; Chiara, C.; Grasso, A.; Omayma, M.; et al. Microplastics in Fillets of Mediterranean Seafood. A Risk Assessment study. Environ. Res. 2022, 204, 112247. [Google Scholar] [CrossRef]
- Suaria, G.; Avio, C.G.; Mineo, A.; Lattin, G.L.; Magaldi, M.G.; Belmonte, G.; Moore, C.J.; Regoli, F.; Aliani, S. The Mediterranean Plastic Soup: Synthetic Polymers in Mediterranean Surface Waters OPEN; Nature Publishing Group: London, UK, 2016. [Google Scholar] [CrossRef]
- Hussien, N.A.; Mohammadein, A.; Tantawy, E.M.; Khattab, Y.; Al Malki, J.S. Investigating Microplastics and Potentially Toxic Elements Contamination in Canned Tuna, Salmon, and Sardine Fishes from Taif Markets, KSA. Open Life Sci. 2021, 16, 827–837. [Google Scholar] [CrossRef]
- Celik, M.; Nakano, H.; Uchida, K.; Isobe, A.; Arakawa, H. Comparative Evaluation of the Carbonyl Index of Microplastics around the Japan Coast. Mar. Pollut. Bull. 2023, 190, 114818. [Google Scholar] [CrossRef]
- Castro, R.O.; da Silva, M.L.; Marques, M.R.; de Araújo, F.V. Spatio-Temporal Evaluation of Macro, Meso and Microplastics in Surface Waters, Bottom and Beach Sediments of Two Embayments in Niterói, RJ, Brazil. Mar. Pollut. Bull. 2020, 160, 111537. [Google Scholar] [CrossRef]
- Rodrigues, M.; Abrantes, N.; Gonçalves, F.; Nogueira, H.; Marques, J.; Gonçalves, A. Spatial and Temporal Distribution of Microplastics in Water and Sediments of a Freshwater System (Antuã River, Portugal). Sci. Total. Environ. 2018, 633, 1549–1559. [Google Scholar] [CrossRef]
- Chen, C.-F.; Ju, Y.-R.; Lim, Y.C.; Chen, C.-W.; Dong, C.-D. Seasonal Variation of Diversity, Weathering, and Inventory of Microplastics in Coast and Harbor Sediments. Sci. Total. Environ. 2021, 781, 146610. [Google Scholar] [CrossRef]
- Jeyasanta, K.I.; Jayanthi, M.; Laju, R.; Patterson, J.; Bilgi, D.S.; Sathish, N.; Edward, J.P. Seasonal and Spatial Variations in the Distribution Pattern, Sources and Impacts of Microplastics along Different Coastal Zones of Tamil Nadu, India. Mar. Pollut. Bull. 2023, 192, 115114. [Google Scholar] [CrossRef]
- Saeed, S.; Iqbal, A.; Deeba, F. Biodegradation Study of Polyethylene and PVC Using Naturally Occurring Plastic Degrading Microbes. Arch. Microbiol. 2022, 204, 497. [Google Scholar] [CrossRef] [PubMed]
- Fu, D.; Chen, F.; Peng, X.; Kuang, T. Polyamide 6 Modified Polypropylene with Remarkably Enhanced Mechanical Performance, Thermal Properties, and Foaming Ability via Pressure-Induced-Flow Processing Approach. Adv. Polym. Technol. 2018, 37, 2721–2729. [Google Scholar] [CrossRef]
- Ahmed, A.A.; Ahmed, D.S.; El-Hiti, G.A.; Alotaibi, M.H.; Hashim, H.; Yousif, E. SEM Morphological Analysis of Irradiated Polystyrene Film Doped by a Schiff Base Containing a 1,2,4-Triazole Ring System. Appl. Petrochem. Res. 2019, 9, 169–177. [Google Scholar] [CrossRef]
- Dai, Z.; Zhang, H.; Zhou, Q.; Tian, Y.; Chen, T.; Tu, C.; Fu, C.; Luo, Y. Occurrence of Microplastics in the Water Column and Sediment in an Inland Sea Affected by Intensive Anthropogenic Activities. Environ. Pollut. 2018, 242, 1557–1565. [Google Scholar] [CrossRef] [PubMed]
- Vilakati, B.; Sivasankar, V.; Mamba, B.B.; Omine, K.; Msagati, T.A. Characterization of Plastic Micro Particles in the Atlantic Ocean Seashore of Cape Town, South Africa and Mass Spectrometry Analysis of Pyrolyzate Products. Environ. Pollut. 2020, 265, 114859. [Google Scholar] [CrossRef] [PubMed]
- Liu, B.; Lu, Y.; Deng, H.; Huang, H.; Wei, N.; Jiang, Y.; Jiang, Y.; Liu, L.; Sun, K.; Zheng, H. Occurrence of Microplastics in the Seawater and Atmosphere of the South China Sea: Pollution Patterns and Interrelationship. Sci. Total. Environ. 2023, 889, 164173. [Google Scholar] [CrossRef]
- Jiang, Y.; Yang, F.; Zhao, Y.; Wang, J. Greenland Sea Gyre Increases Microplastic Pollution in the Surface Waters of the Nordic Seas. Sci. Total. Environ. 2020, 712, 136484. [Google Scholar] [CrossRef] [PubMed]
- Rodrigues, M.O.; Abrantes, N.; Gonçalves, F.; Nogueira, H.S.; Marques, J.; Gonçalves, A.M. Impacts of Plastic Products Used in Daily Life on the Environment and Human Health: What Is Known? Environ. Toxicol. Pharmacol. 2019, 72, 103239. [Google Scholar] [CrossRef] [PubMed]
- Sathish, M.N.; Jeyasanta, I.; Patterson, J. Occurrence of Microplastics in Epipelagic and Mesopelagic Fishes from Tuticorin, Southeast Coast of India. Sci. Total. Environ. 2020, 720, 137614. [Google Scholar] [CrossRef] [PubMed]
- Rosas, B.R.C.; Sakthi, J.; Barjau-González, E.; Rodríguez-González, F.; Galván-Magaña, F.; Ramírez, S.F.; Gómez-Chávez, F.; Sarkar, S.; Jonathan, M. First Account of Microplastics in Pelagic Sporting Dolphinfish from the Eastern Mexican Coast of Baja California Sur. Environ. Toxicol. Pharmacol. 2023, 100, 104153. [Google Scholar] [CrossRef] [PubMed]
- Karbalaei, S.; Golieskardi, A.; Hamzah, H.B.; Abdulwahid, S.; Hanachi, P.; Walker, T.R.; Karami, A. Abundance and Characteristics of Microplastics in Commercial Marine Fish from Malaysia. Mar. Pollut. Bull. 2019, 148, 5–15. [Google Scholar] [CrossRef] [PubMed]
- Jonathan, M.; Sujitha, S.; Rodriguez-Gonzalez, F.; Villegas, L.E.C.; Hernández-Camacho, C.J.; Sarkar, S. Evidences of Microplastics in Diverse Fish Species off the Western Coast of Pacific Ocean, Mexico. Ocean Coast. Manag. 2021, 204, 105544. [Google Scholar] [CrossRef]
- Matluba, M.; Ahmed, K.; Chowdhury, K.A.; Khan, N.; Ashiq, A.R.; Islam, M.S. The Pervasiveness of Microplastic Contamination in the Gastrointestinal Tract of Fish from the Western Coast of Bangladesh. Mar. Pollut. Bull. 2023, 193, 115145. [Google Scholar] [CrossRef] [PubMed]
- Cocci, P.; Gabrielli, S.; Pastore, G.; Minicucci, M.; Mosconi, G.; Palermo, F.A. Microplastics Accumulation in Gastrointestinal Tracts of Mullus barbatus and Merluccius merluccius Is Associated with Increased Cytokine Production and Signaling. Chemosphere 2022, 307, 135813. [Google Scholar] [CrossRef] [PubMed]
- Gniadek, M.; Dąbrowska, A. The Marine Nano- and Microplastics Characterisation by SEM-EDX: The Potential of the Method in Comparison with Various Physical and Chemical Approaches. Mar. Pollut. Bull. 2019, 148, 210–216. [Google Scholar] [CrossRef]
- Sunitha, T.; Monisha, V.; Sivanesan, S.; Vasanthy, M.; Prabhakaran, M.; Omine, K.; Sivasankar, V.; Darchen, A. Micro-Plastic pollution along the Bay of Bengal Coastal Stretch of Tamil Nadu, South India. Sci. Total. Environ. 2021, 756, 144073. [Google Scholar] [CrossRef]
- Gambelli, A.M.; Tinivella, U.; Giovannetti, R.; Castellani, B.; Giustiniani, M.; Rossi, A.; Zannotti, M.; Rossi, F. Observation of the Main Natural Parameters Influencing the Formation of Gas Hydrates. Energies 2021, 14, 1803. [Google Scholar] [CrossRef]
- Truchet, D.; López, A.F.; Ardusso, M.; Rimondino, G.; Buzzi, N.; Malanca, F.; Spetter, C.; Severini, F. Microplastics in Bivalves, Water and Sediments from a Touristic Sandy Beach of Argentina. Mar. Pollut. Bull. 2021, 173, 113023. [Google Scholar] [CrossRef] [PubMed]
- Wang, Z.-M.; Wagner, J.; Ghosal, S.; Bedi, G.; Wall, S. SEM/EDS and Optical Microscopy Analyses of Microplastics in Ocean Trawl and Fish Guts. Sci. Total. Environ. 2017, 603–604, 616–626. [Google Scholar] [CrossRef] [PubMed]
- Mazzoni, M.; Lattanzio, G.; Bonaldo, A.; Tagliavia, C.; Parma, L.; Busti, S.; Gatta, P.P.; Bernardi, N.; Clavenzani, P. Effect of Essential Oils on the Oxyntopeptic Cells and Somatostatin and Ghrelin Immunoreactive Cells in the European Sea Bass (Dicentrarchus labrax) Gastric Mucosa. Animals 2021, 11, 3401. [Google Scholar] [CrossRef]
- Nikolopoulou, D.; Moutou, K.; Fountoulaki, E.; Venou, B.; Adamidou, S.; Alexis, M. Patterns of Gastric Evacuation, Digesta Characteristics and pH Changes along the Gastrointestinal Tract of Gilthead Sea Bream (Sparus aurata L.) and European Sea Bass (Dicentrarchus labrax L.). Comp. Biochem. Physiol. Part A Mol. Integr. Physiol. 2011, 158, 406–414. [Google Scholar] [CrossRef] [PubMed]
- Furfaro, G.; D’elia, M.; Mariano, S.; Trainito, E.; Solca, M.; Piraino, S.; Belmonte, G. SEM/EDX Analysis of Stomach Contents of a Sea Slug Snacking on a Polluted Seafloor Reveal Microplastics as a Component of Its Diet. Sci. Rep. 2022, 12, 10244. [Google Scholar] [CrossRef] [PubMed]


Disclaimer/Publisher’s Note: The statements, opinions and data contained in all publications are solely those of the individual author(s) and contributor(s) and not of MDPI and/or the editor(s). MDPI and/or the editor(s) disclaim responsibility for any injury to people or property resulting from any ideas, methods, instructions or products referred to in the content. |
© 2023 by the authors. Licensee MDPI, Basel, Switzerland. This article is an open access article distributed under the terms and conditions of the Creative Commons Attribution (CC BY) license (https://creativecommons.org/licenses/by/4.0/).