Article

Self-Start Characteristics of Hypersonic Inlet When Multiple Unstart Modes Exist

College of Aerospace Science and Engineering, National University of Defense Technology, Changsha 410073, China
*
Author to whom correspondence should be addressed.
Appl. Sci. 2023, 13(17), 9752; https://doi.org/10.3390/app13179752
Submission received: 12 July 2023 / Revised: 12 August 2023 / Accepted: 19 August 2023 / Published: 29 August 2023
(This article belongs to the Section Aerospace Science and Engineering)

Abstract

:
Intense shock boundary-layer interaction may lead to multiple unstart modes existing in a hypersonic inlet. Thus, self-start problems become complex and cannot be explained using the classical double-solution theory of air inlet. The essence of the self-start process of a hypersonic inlet is the vanishment of separations near or in the inlet. To clarify self-start characteristics, experiments were conducted on three distinct types of unstart mode: the flow mode of small separation on body (SSB), large separation on body (LSB), and dual separations on both body and lip (DSBL); researchers recently discovered these as the unstart modes of hypersonic inlet. The results from the current experiment are as follows: (1) The SSB vanishes by raising the angle of attack (alpha). Before the vanishing point is reached, there is a dwindling process for this separation. (2) The LSB vanishes through acceleration or a decreasing alpha. (3) DSBL are difficult to vanish directly, which results in poor self-start performance. However, the DSBL flow mode may convert to LSB unstart form—which is easier to self-start—by decreasing the alpha. The Flow Field Reconstruction Method was designed to improve the self-start of the DSBL flow mode, and it was validated through experiments. Analysis of the flow mechanism revealed the reason for the poor self-start performance of the DSBL unstart mode: large-scale separation on the lip side cannot be promoted to vanish through broadwise spillage due to the resistance of sideboards. The results of this study could greatly enrich the existing theory of start problems for hypersonic inlets.

1. Introduction

Scramjet engines are widely used in air-breathing hypersonic aircraft, and combustion inside the engine requires sufficient air to serve as an oxidizer [1]. Therefore, enhancing the air capture capability of hypersonic inlets is in great demand. Under normal conditions, the working state of a hypersonic inlet is classified into two forms: start and unstart. Because of the low air-capture efficiency and large flow loss when an inlet unstarts, the thrust performance of the engine degrades substantially, and flameout may occur even in extreme circumstances [2,3]. Therefore, it is urgently necessary to conduct research about the start problem in hypersonic air inlets.
In a hypersonic inlet, throat congestion and shock boundary layer interference are the two main causes of unstart [4,5,6]. Most of the time, unstart results from the combined action of both factors [7,8], and hysteresis occurs in the conversion between start and unstart. The specific performance issue is that the inlet may not restart immediately after returning to the original path when the status converts from start into unstart, and restart does not take place until the situation is resolved [9,10,11]. Usually, the process of transitioning from unstart to start is called “self-start”. Accordingly, the working plane of the inlet is classified into three independent regions: the unstart region, double-solution region, and self-start region [12].
Self-start characteristics are the core of the start problem of hypersonic inlets, and clarifying the flow structure of unstart status is the foundation of the study of self-start characteristics. In a hypersonic inlet, large-scale separated flow is easily induced when intense lip shock compacts into the opposite boundary layer. The status of the inlet then becomes unstart, which is the most conventional unstart mode [13,14,15,16]. The oscillation of the unstart mode is stronger than that of the start mode, which is affected by factors including the boundary layer [17] and back pressure [18]. Self-sustained separation near or in the inlet is considered to be the main reason for the maintenance of the unstart flow mode, and self-start may be achieved by breaking that separation [19]. Based on the relative position between the lip and the separation near or in the inlet (including the resulting separation shock), some scholars have classified the separation into two types: opened separation and closed separation, of which the opened separation is much easier to self-start [20,21].
Regarding the conventional unstart mode, at most times, inlet self-start can be completed through increasing the Mach number [22,23,24]. Because decreasing the angle of attack (alpha) increases the Mach number in front of the inlet, self-start can also be achieved through this process [25,26]. Furthermore, if unstart is caused by excessive back pressure [27,28] and other factors allow the inlet to self-start, self-start can be achieved after the back pressure is released [29,30].
Many advances have been made in the study of the forecast of inlet self-start in recent years. Molder developed the inlet self-start formula for the hybrid compression hypersonic inlet, obtaining results that approximate the Kantrowitz limitation [31]. Based on that research, Veillard and Timofeev further studied the influence of external compression and flow spillage on the ultimate contraction ratio of 2D inlets, which determines the working state (start or unstart) [12,32]. Xie established a self-start prediction model in the state of "hard unstart" flow mode for a 2D hypersonic inlet [33].
A special unstart mode might be induced when the actual inflow Mach number exceeds the designed Mach number [34,35]. This kind of flow mode is called "overrated unstart". In overrated status, the shocks and compression waves produced by the forebody should have gathered in the leading edge of the lip impact the inner surface of the lip. Then, large-scale separated flow is induced, and a suspended shock structure typically appears near the leading edge of the lip [36,37]. Jiao and Wang conducted systematic research into overrated unstart and clarified the flow characteristics and variation in the regularity of overrated unstart. Furthermore, these researchers also found that the phenomenon of hysteresis also occurs during overrated unstart [38,39,40].
The use of CFD methods can quickly and effectively solve hypersonic flow problems. In contrast to low-speed flow problems, it is necessary to accurately capture the wave structure of the flow field and truly reflect the shock boundary layer interference phenomenon when solving hypersonic flow problems [41]. However, hypersonic flow is often influenced by internal and external uncertainties, which increases the difficulty of CFD calculations. In order to overcome this difficulty, the Uncertainty Quantification method was developed in recent years. The use of Uncertainty Quantification can support our understanding of physical problems and improve the accuracy and reliability of numerical simulations [42]. Thanks to recent improvements in both soft computing algorithms and hardware performance, the application of Uncertainty Quantification is becoming increasingly widespread [43,44], and great progress has been made in the field of hypersonic flow and shock boundary-layer interaction [45,46,47].
To sum up, fruitful research has been achieved regarding the start problem of hypersonic inlets, which helps lay a strong theoretical foundation for inlet start regularity, factors influencing inlet start, the process of self-start, simulation methods of the start problem, and so on. However, no research on self-start characteristics has been documented in cases when multiple unstart modes exist in a specific hypersonic inlet, let alone a discussion about the diversity of self-start abilities among these different unstart modes. Because of complex flow in hypersonic inlets where intense shock boundary-layer interference and significant three-dimensional effects exist, multiple unstart modes inevitably occur. For example, in a recent study, three distinct types of unstart modes which are not related to overrating were discovered in a hypersonic inlet [48]: the flow mode of large separation on body (LSB), small separation on body (SSB), and dual separations on both body and lip (DSBL). These are described in detail in Section 3.1. Based on this reality, this paper describes profound research into the self-start characteristics of the hypersonic inlet when LSB, SSB, and DSBL unstart modes exist. As for the most inferior unstart mode, DSBL, this paper also presents the Flow Field Reconstruction Method to improve self-start performance, and shows why self-start is difficult through flow mechanisms.

2. Model and Experimental/Numerical Methods

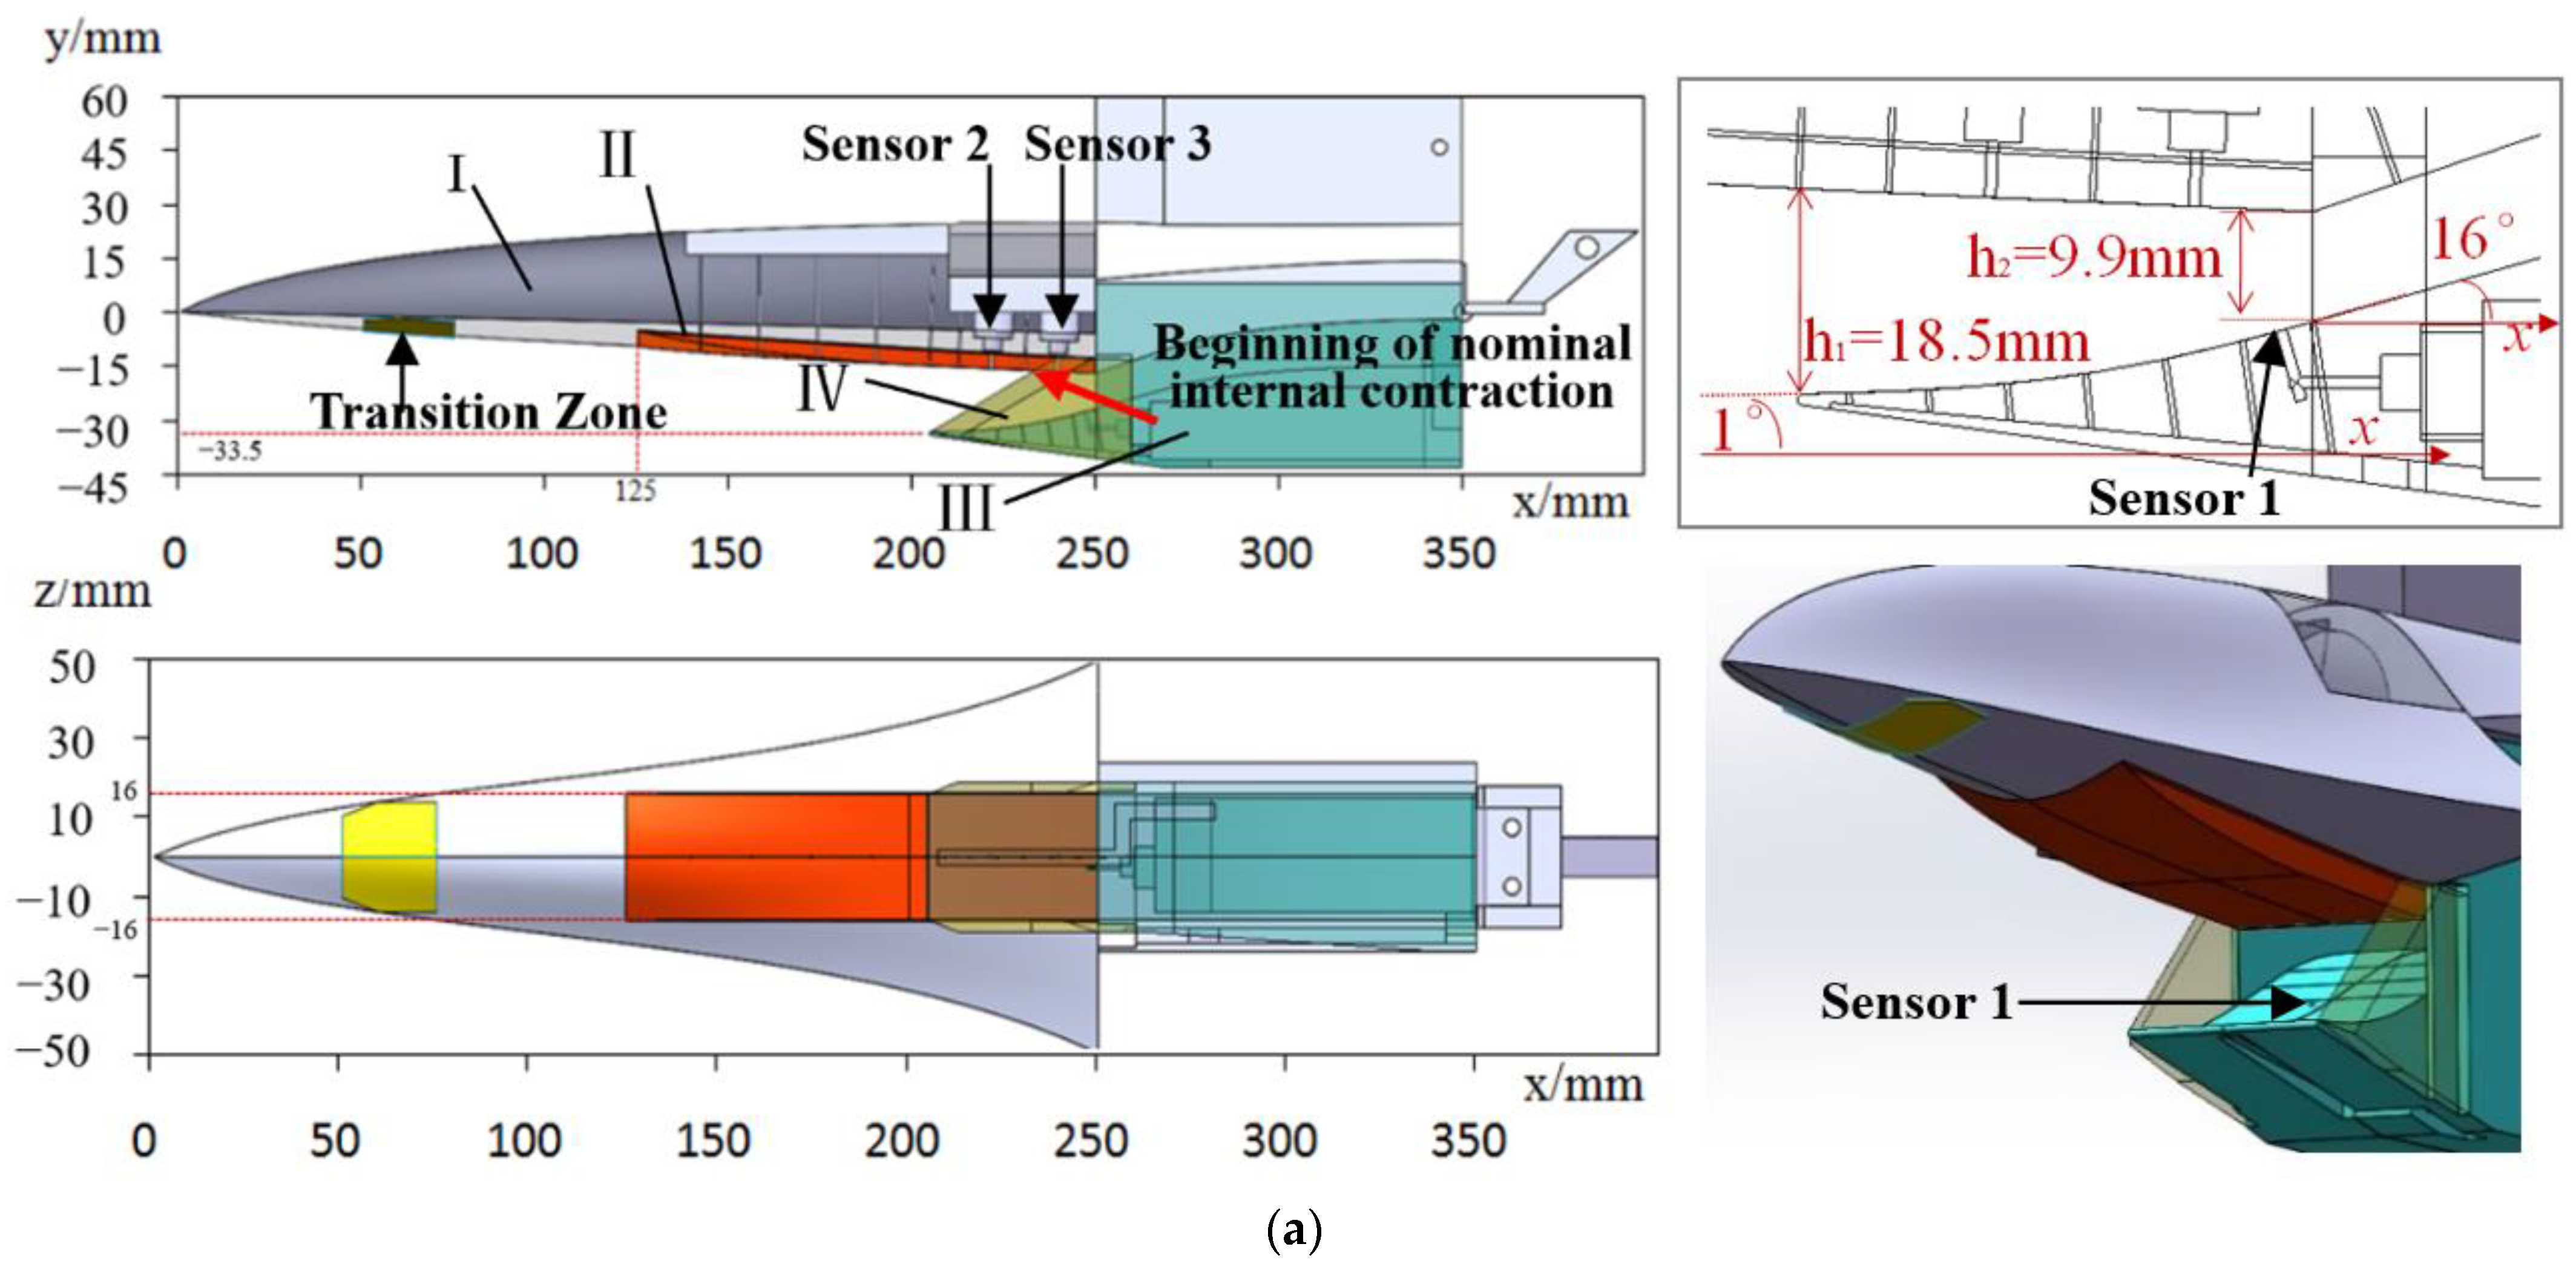
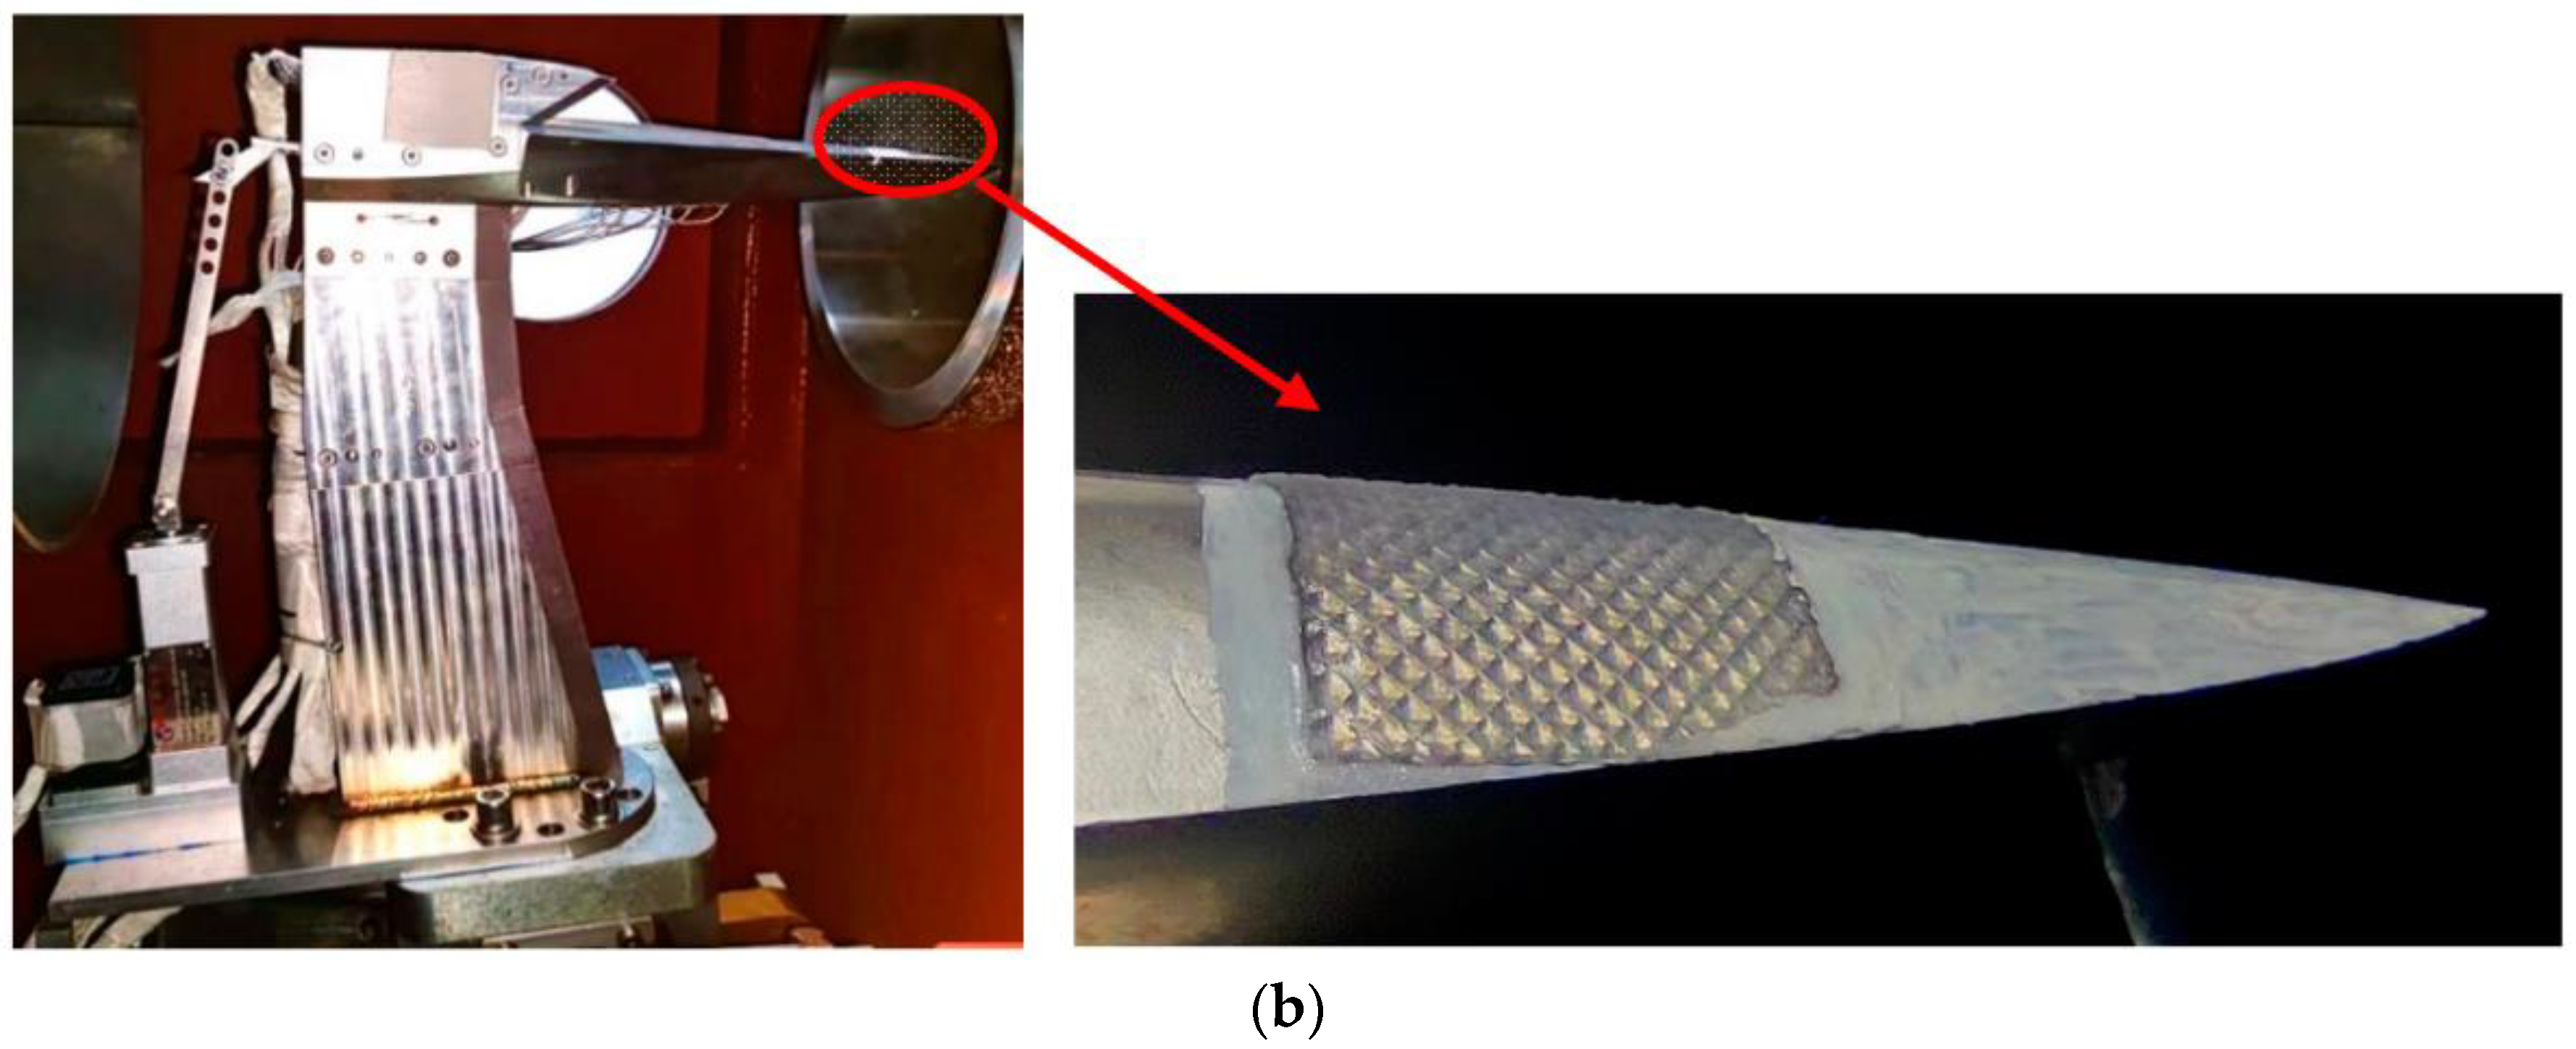
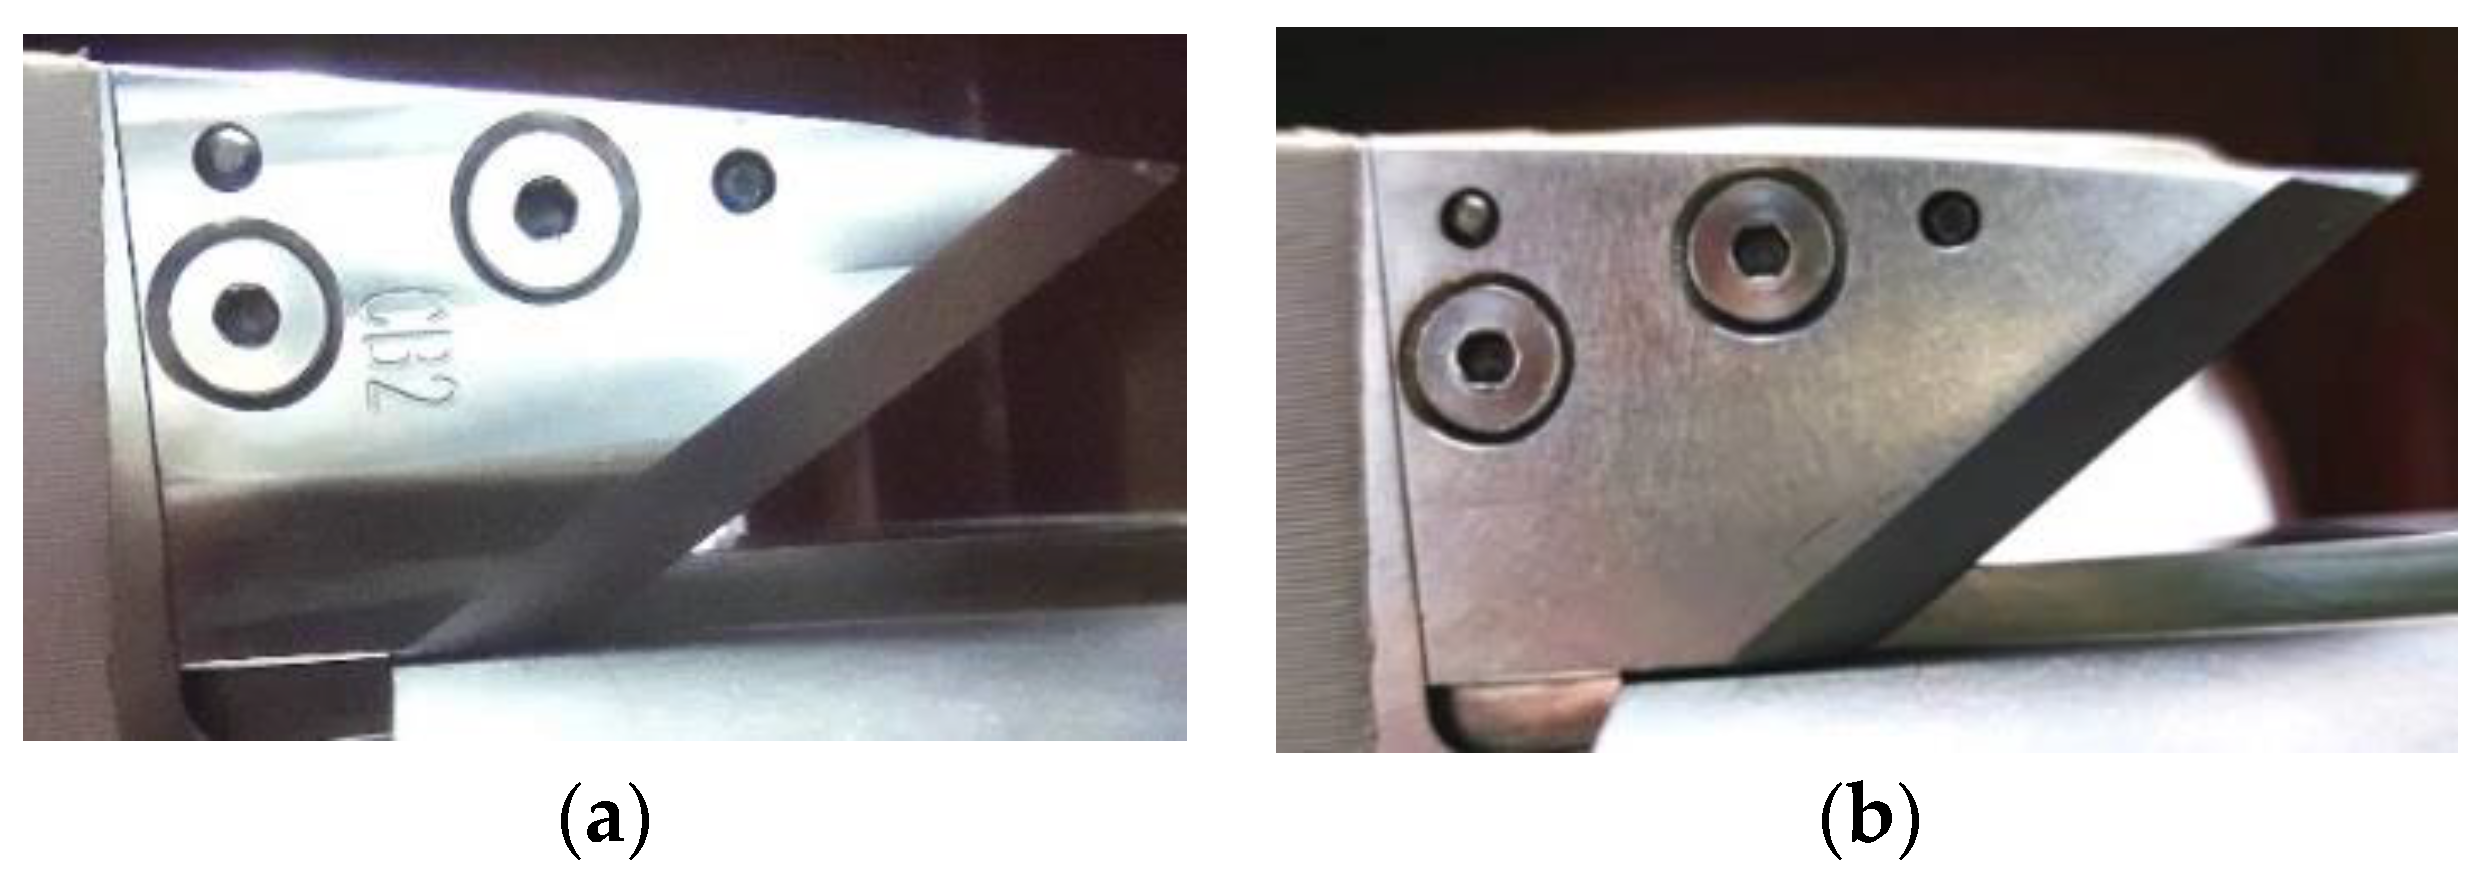
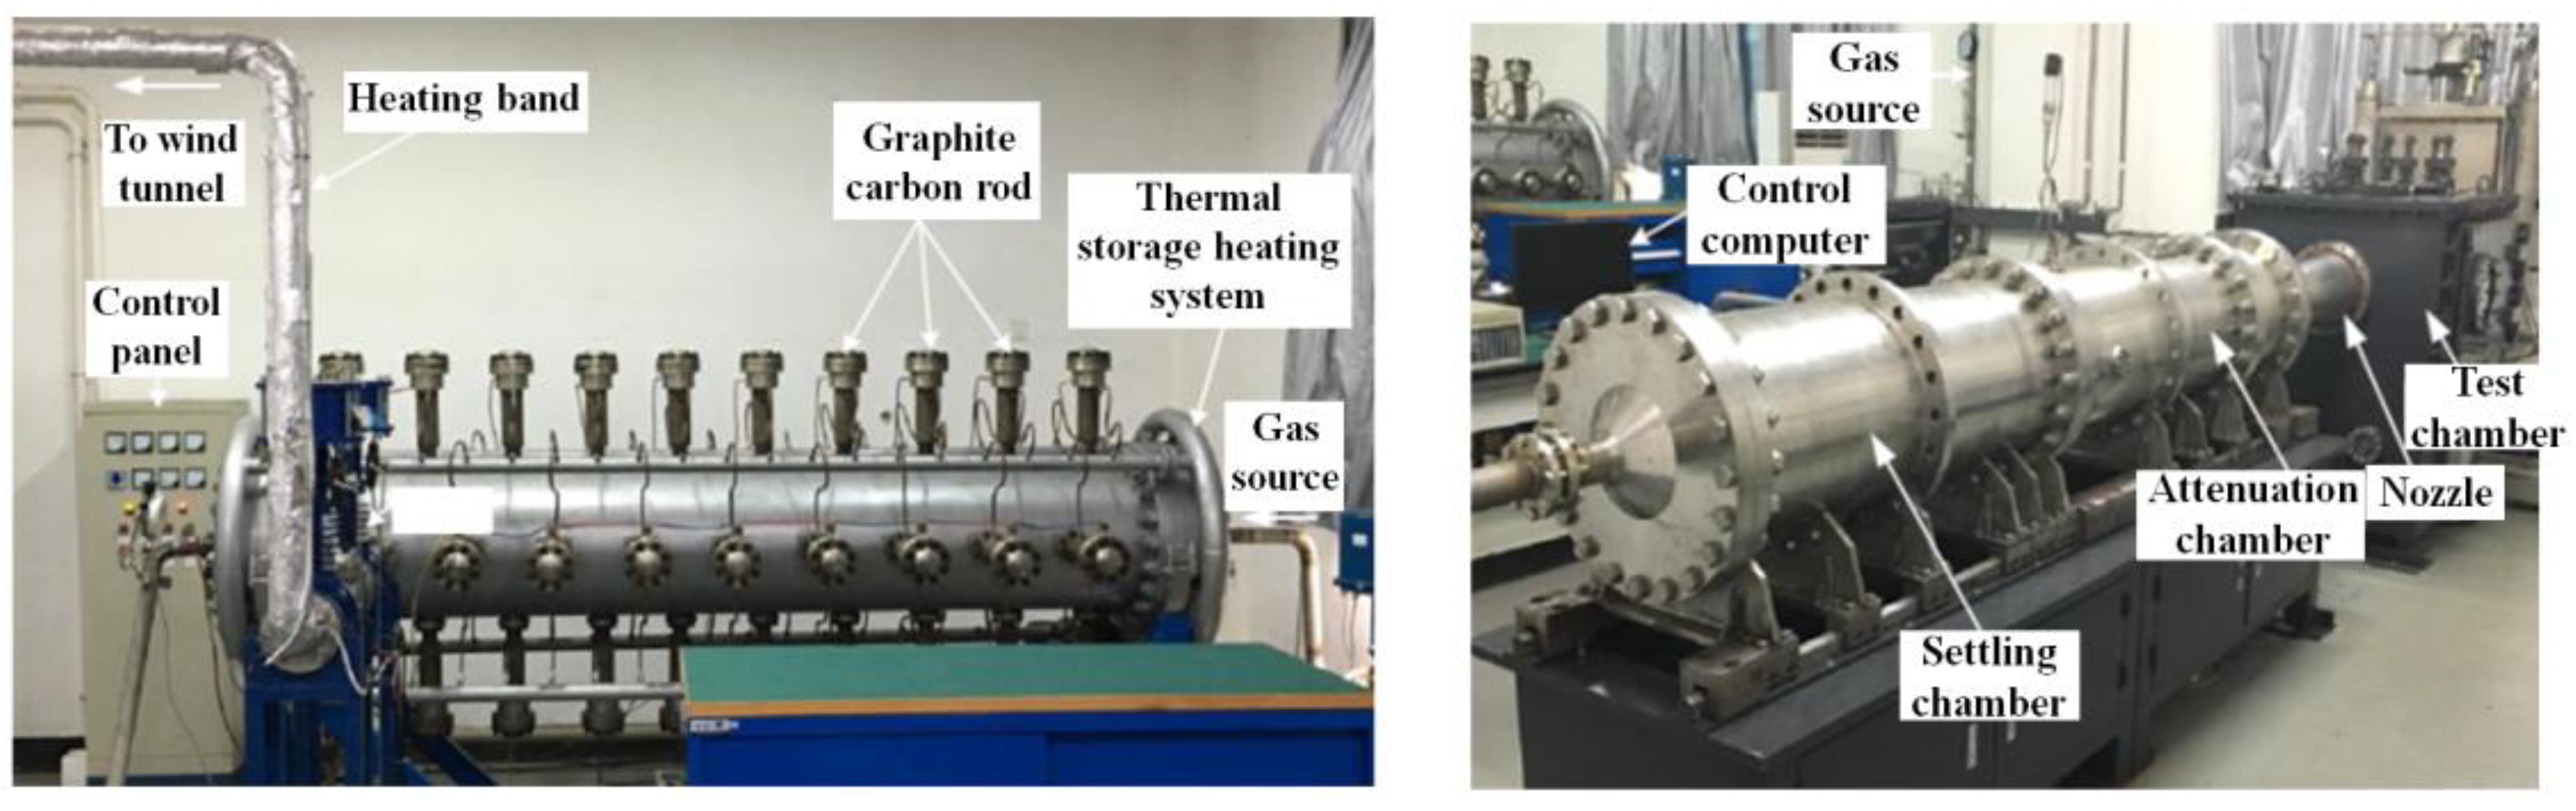
2.1. Experimental Model and Method

The experimental model was designed by integrating a forebody with a 2D inlet, which was equipped with two pieces of sweepback sideboards, as shown in Figure 1. The mode consisted of four main parts: Ι. the body; Ⅱ. the pre-compression bump; Ⅲ. the inlet cowl lip; and Ⅳ. the sideboards. An on–off throttle system was installed at the end of the model so that the back pressure could be imitated in the experimental process.
The total length (l) and width (w) of the model were 350 mm and 100 mm, respectively. The inlet width was 32 mm, and the compression angle of the leading edge of the lip was 1° (angle with x axis). The height of the inlet entrance (h1) was 18.5 mm and the height of the inlet throat (h2) was 9.9 mm. More detailed dimension parameters are shown in Figure 1. Because of the small size of the model, laminar flow might extend to an excessive range on the compression surface of the forebody, which is very different from the case in full-scale aircrafts; the proportion of the laminar flow area on the compression surface is never too large. To avoid the influence of laminar flow, a transition zone was installed in front of the compression surface of the forebody.
Considering the support and motion requirements, the model was installed upside down in the wind tunnel; thus, the original Schlieren was also upside down. For the convenience of analysis, the Schlieren images shown in this paper are all rotated by 180°. Therefore, in all the Schlieren images of this paper, the flow direction is from left to right.
The sideboards could be replaced conveniently. Two pairs of sideboards named SB-1 and SB-2 were employed to conduct this experiment, as shown in Figure 2. Then, we defined the area ratio of the inner section, which was perpendicular to the flow direction and went through the point indicated by the red arrow (shown in Figure 1) into the inlet throat, as the nominal internal contraction ratio. Thus, the nominal internal contraction ratio of Model/SB-1 and Model/SB-2 was 1.485 and 1.557, respectively.
Fourteen conventional pressure-measuring points and three high-frequency pressure-measuring points were arranged in the model, as shown in Table 1. The measure range of conventional pressure measuring points was 0~103 kPa, the sampling frequency was 100 Hz, and the measurement accuracy was ±0.05%FS. The high-frequency pressure points adopted the NS-2 pressure sensor, the working voltage was 5 V, the measure range was 0~200 kPa, and the measurement accuracy was ±0.25% FS. Combined with the DH5926 dynamic signal acquisition and processing system, the sampling frequency could reach 20 kHz. A Butterworth filter was used to filter and process the high-frequency signal, where the cutoff frequency was equal to the sampling frequency divided by 2.56.
Figure 3 shows the wind tunnel used for this experiment. A high-pressure gas source combined with downstream vacuum suction was the operation mechanism for the wind tunnel. Four components made up the wind tunnel. They were a thermal storage heating system, a settling chamber/attenuation chamber, a nozzle (φ220 mm), and a vacuum test chamber. A variable attack/sideslip angle mechanism with five degrees of motion was installed in the vacuum test chamber so that the state of the model could be adjusted continuously during the experiment. The wind tunnel was equipped with a set of comprehensive detection systems from which both high-/low-frequency pressure and fast-/slow-speed Schlieren images could be collected.

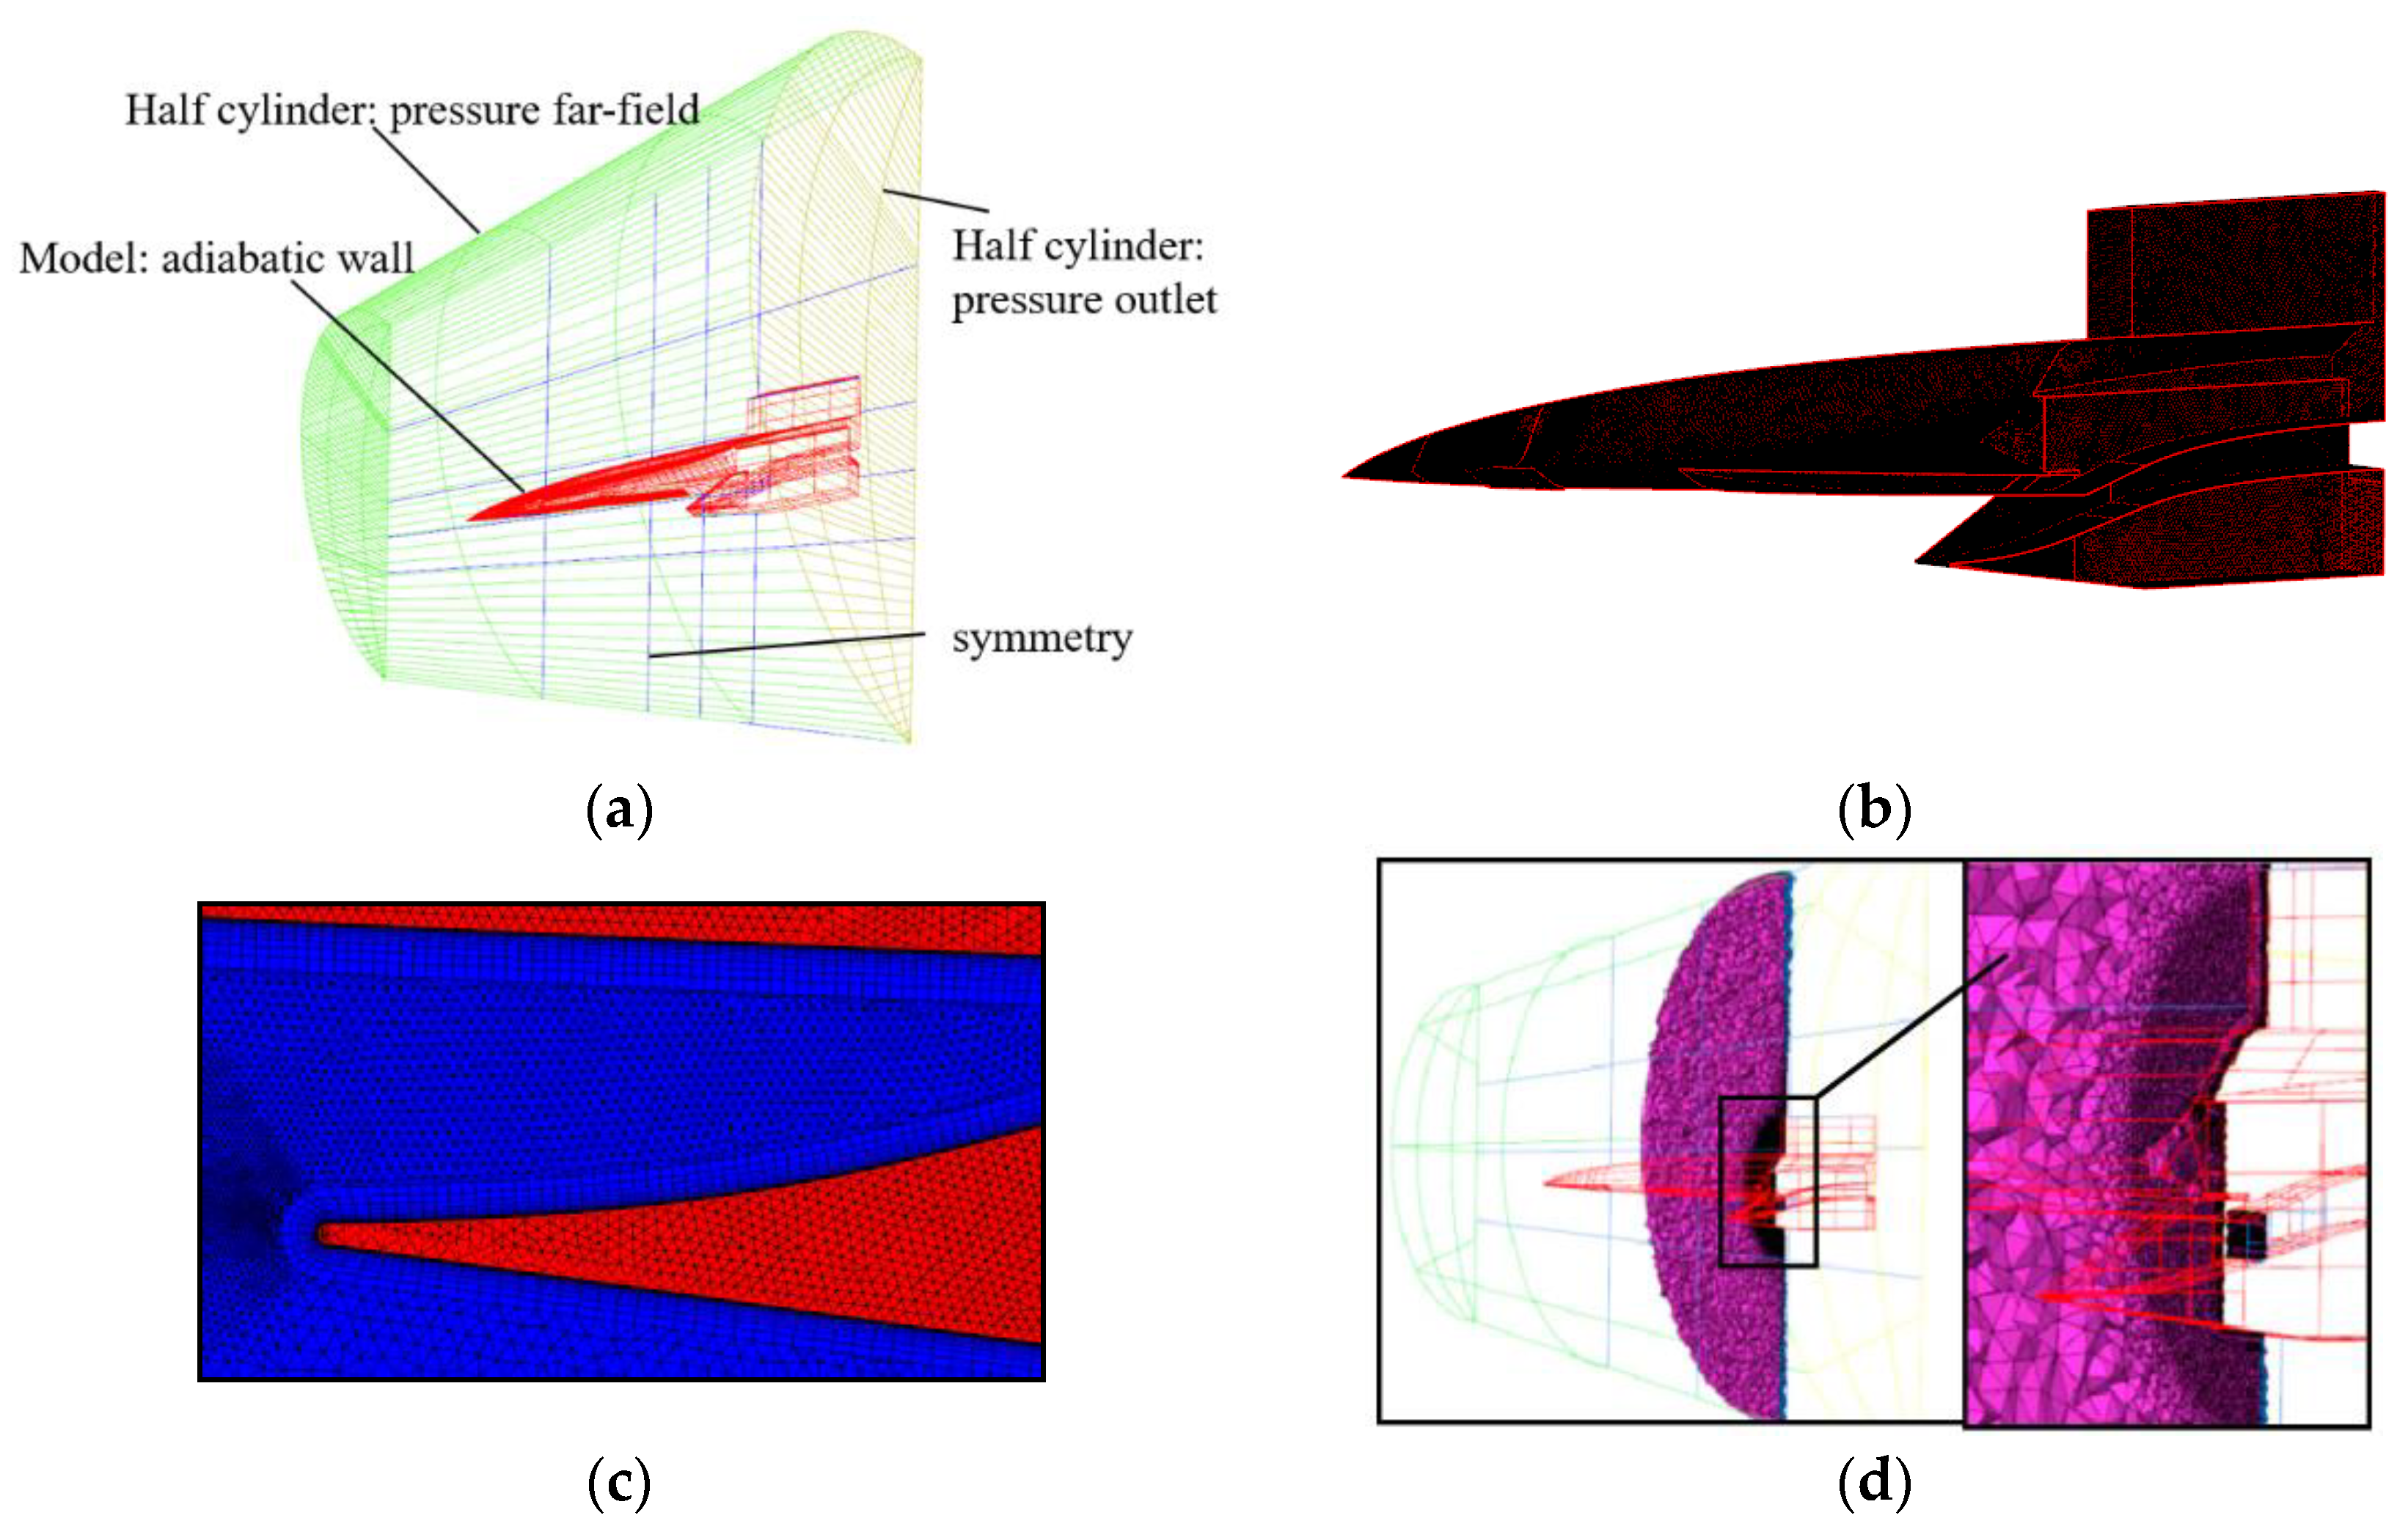
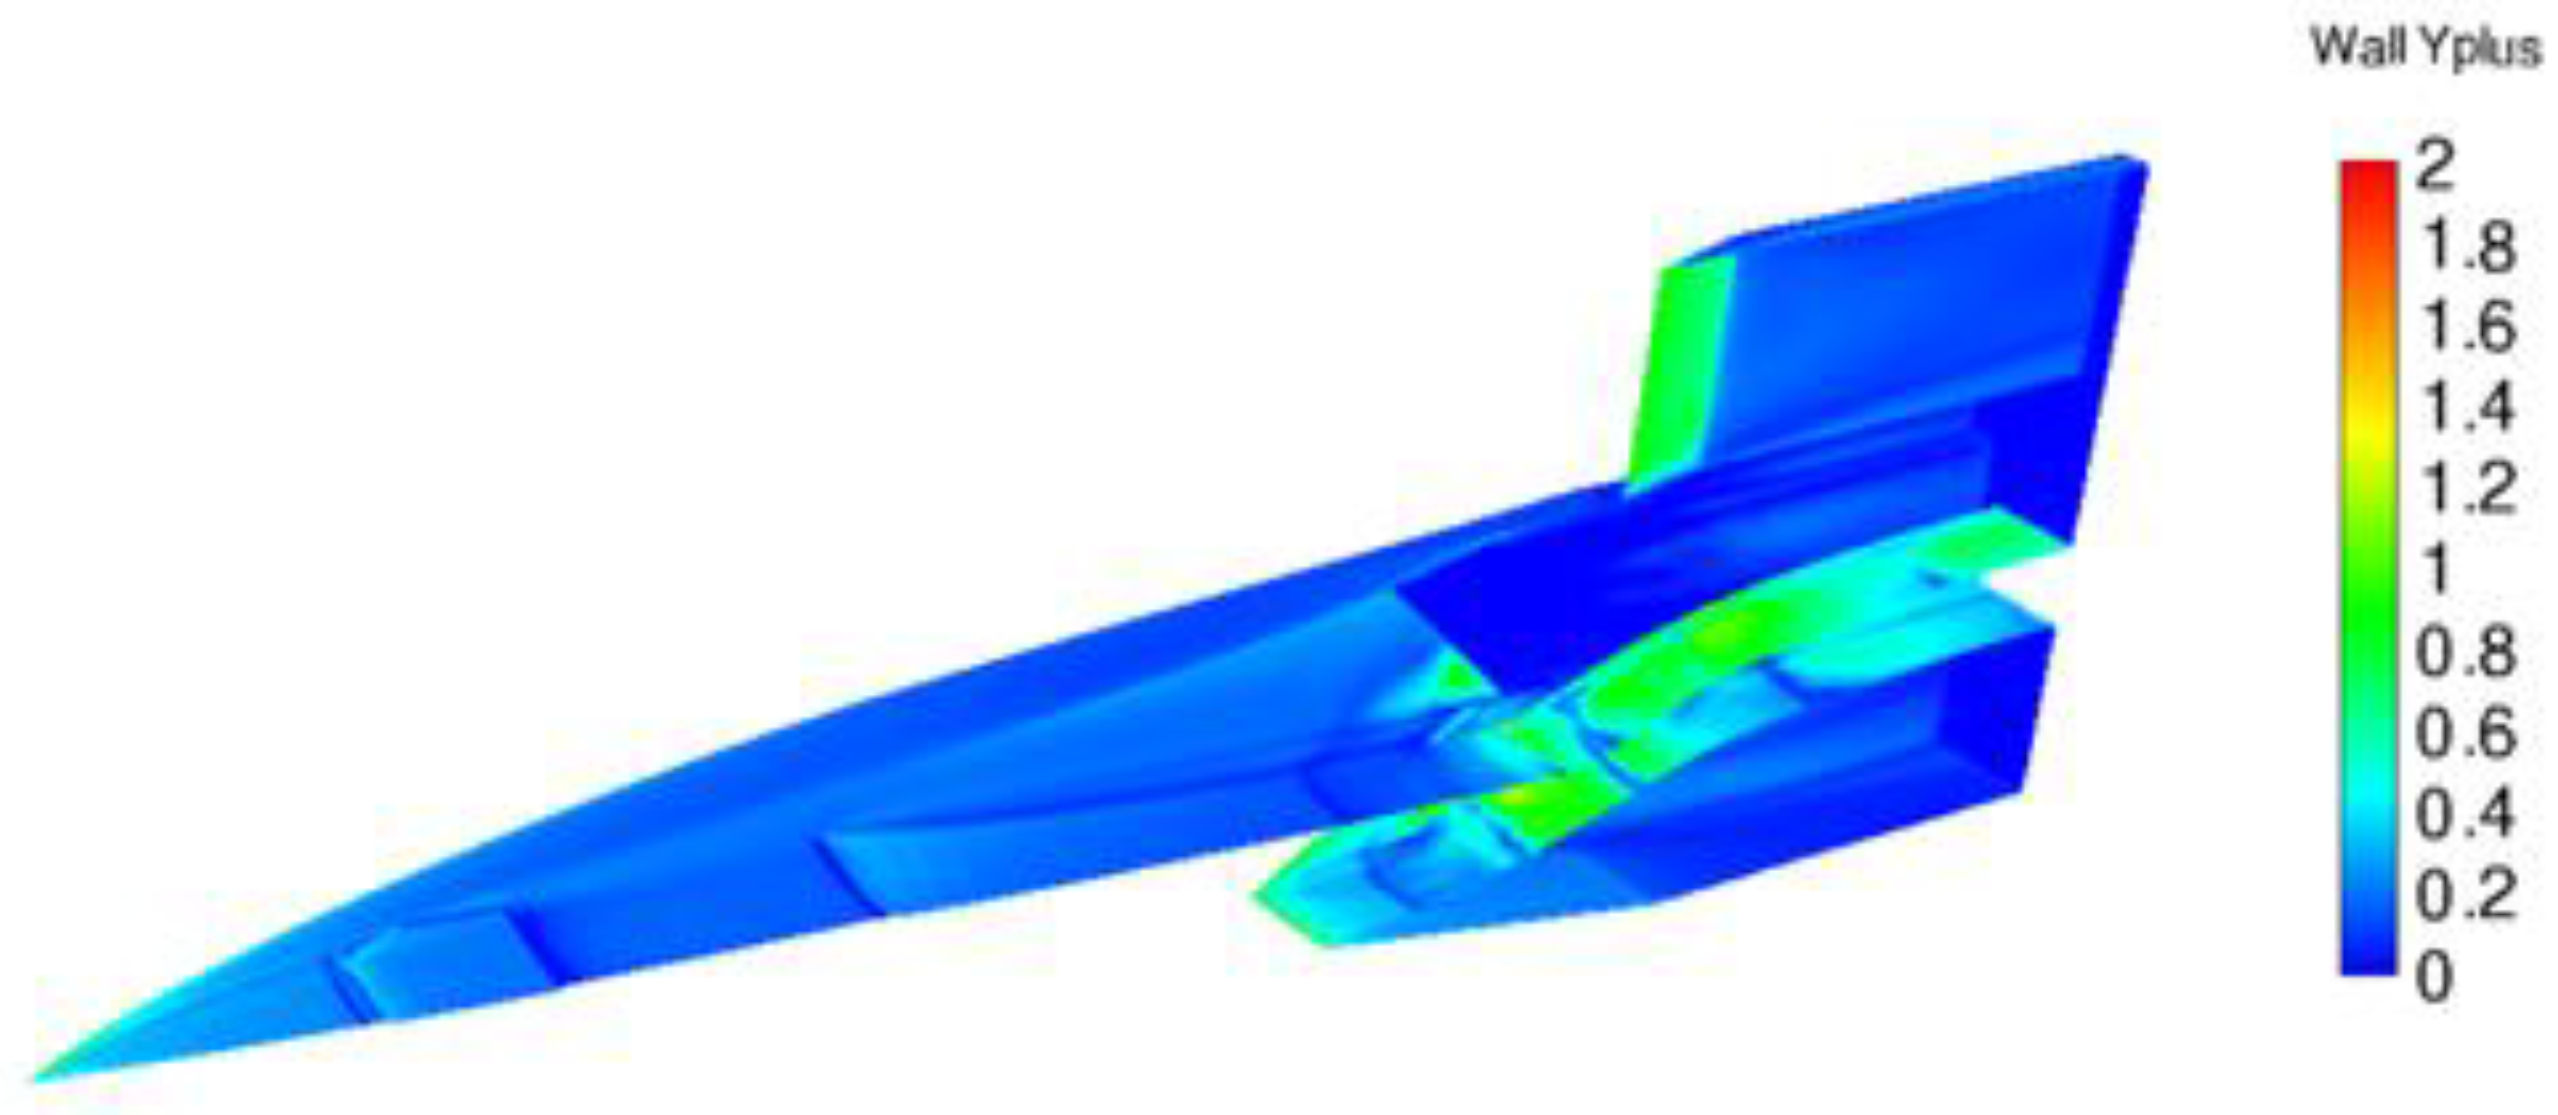
2.2. Computational Fluid Dynamics (CFDs) Method

Based on the experimental model shown in Figure 1a, due to its vertical symmetric shape, only half of the model was used for the analysis to save computing costs. Surrounding the model with a half cylinder whose diameter was variable, a computational domain integrating internal and external flow was formed between the symmetry plane, the model, and the half cylinder, as shown in Figure 4a. An unstructured hybrid grid was chosen as the pattern of the computational grid. The wall was composed of triangular grids. In the external flow region, the overall size of the wall grids was not greater than 1.2 mm, and in the internal flow region, the overall size was not greater than 0.8 mm. Prisms covered the whole aerodynamic surface. The height of the first layer of the prisms was 0.005 mm, and the height of each layer increased proportionally, with an increase ratio of 1.35. The total thickness of the prisms in the external flow region was 4.26 mm, while in the internal flow region, the total thickness was 2.33 mm. The remaining computational domain was filled with tetrahedral grids. Figure 4 shows the detailed characteristics of the CFD grid; the number of the grid reached 24 million. The far-field pressure inlet boundary condition was set on the green surface of the half cylinder. The pressure outlet condition was set on the yellow surface of the half cylinder. The symmetry boundary condition was set on the symmetry plane, and the adiabatic wall boundary condition was set on the aerodynamic surface of the model.
The calculation results were obtained using the finite volume method (FVM) and Reynolds-averaged Navier–Stokes equations. Equation (1) is the conservation form of compressible Navier–Stokes equations. The calculation object was perfect gas (air) [9,13,15,48], and the fluid’s viscosity was computed using the Sutherland equation. Since the calculation problem concerned compressible flow, and in order to address to the calculation accuracy and efficiency, a density-based solver conducted via an implicit time integration method and second-order upwind ROE difference scheme was chosen to solve the complex problem. Considering that the flow separation caused by the shock boundary-layer interaction is widespread in hypersonic inlets, the Kω-SST mode (which has good simulation ability for separated flow) was selected for the turbulence model. Effectiveness was validated for this turbulence model via an extensive application in solving the shock boundary-layer interaction problems and flow mechanism problems in air inlets [49,50,51].
U ¯ t + F ¯ x + G ¯ y + H ¯ z = S x ¯ x + S y ¯ y + S z ¯ z
Based on the above grid and CFD method, wall Y-plus could be controlled near to or less than one, as shown in Figure 5. More than that, as described in Section 5, the flow field structure and pressure distribution obtained from the CFD calculation and experiments were compared, and the results showed a high degree of agreement.

3. Self-Start Characteristics of Different Unstart Modes

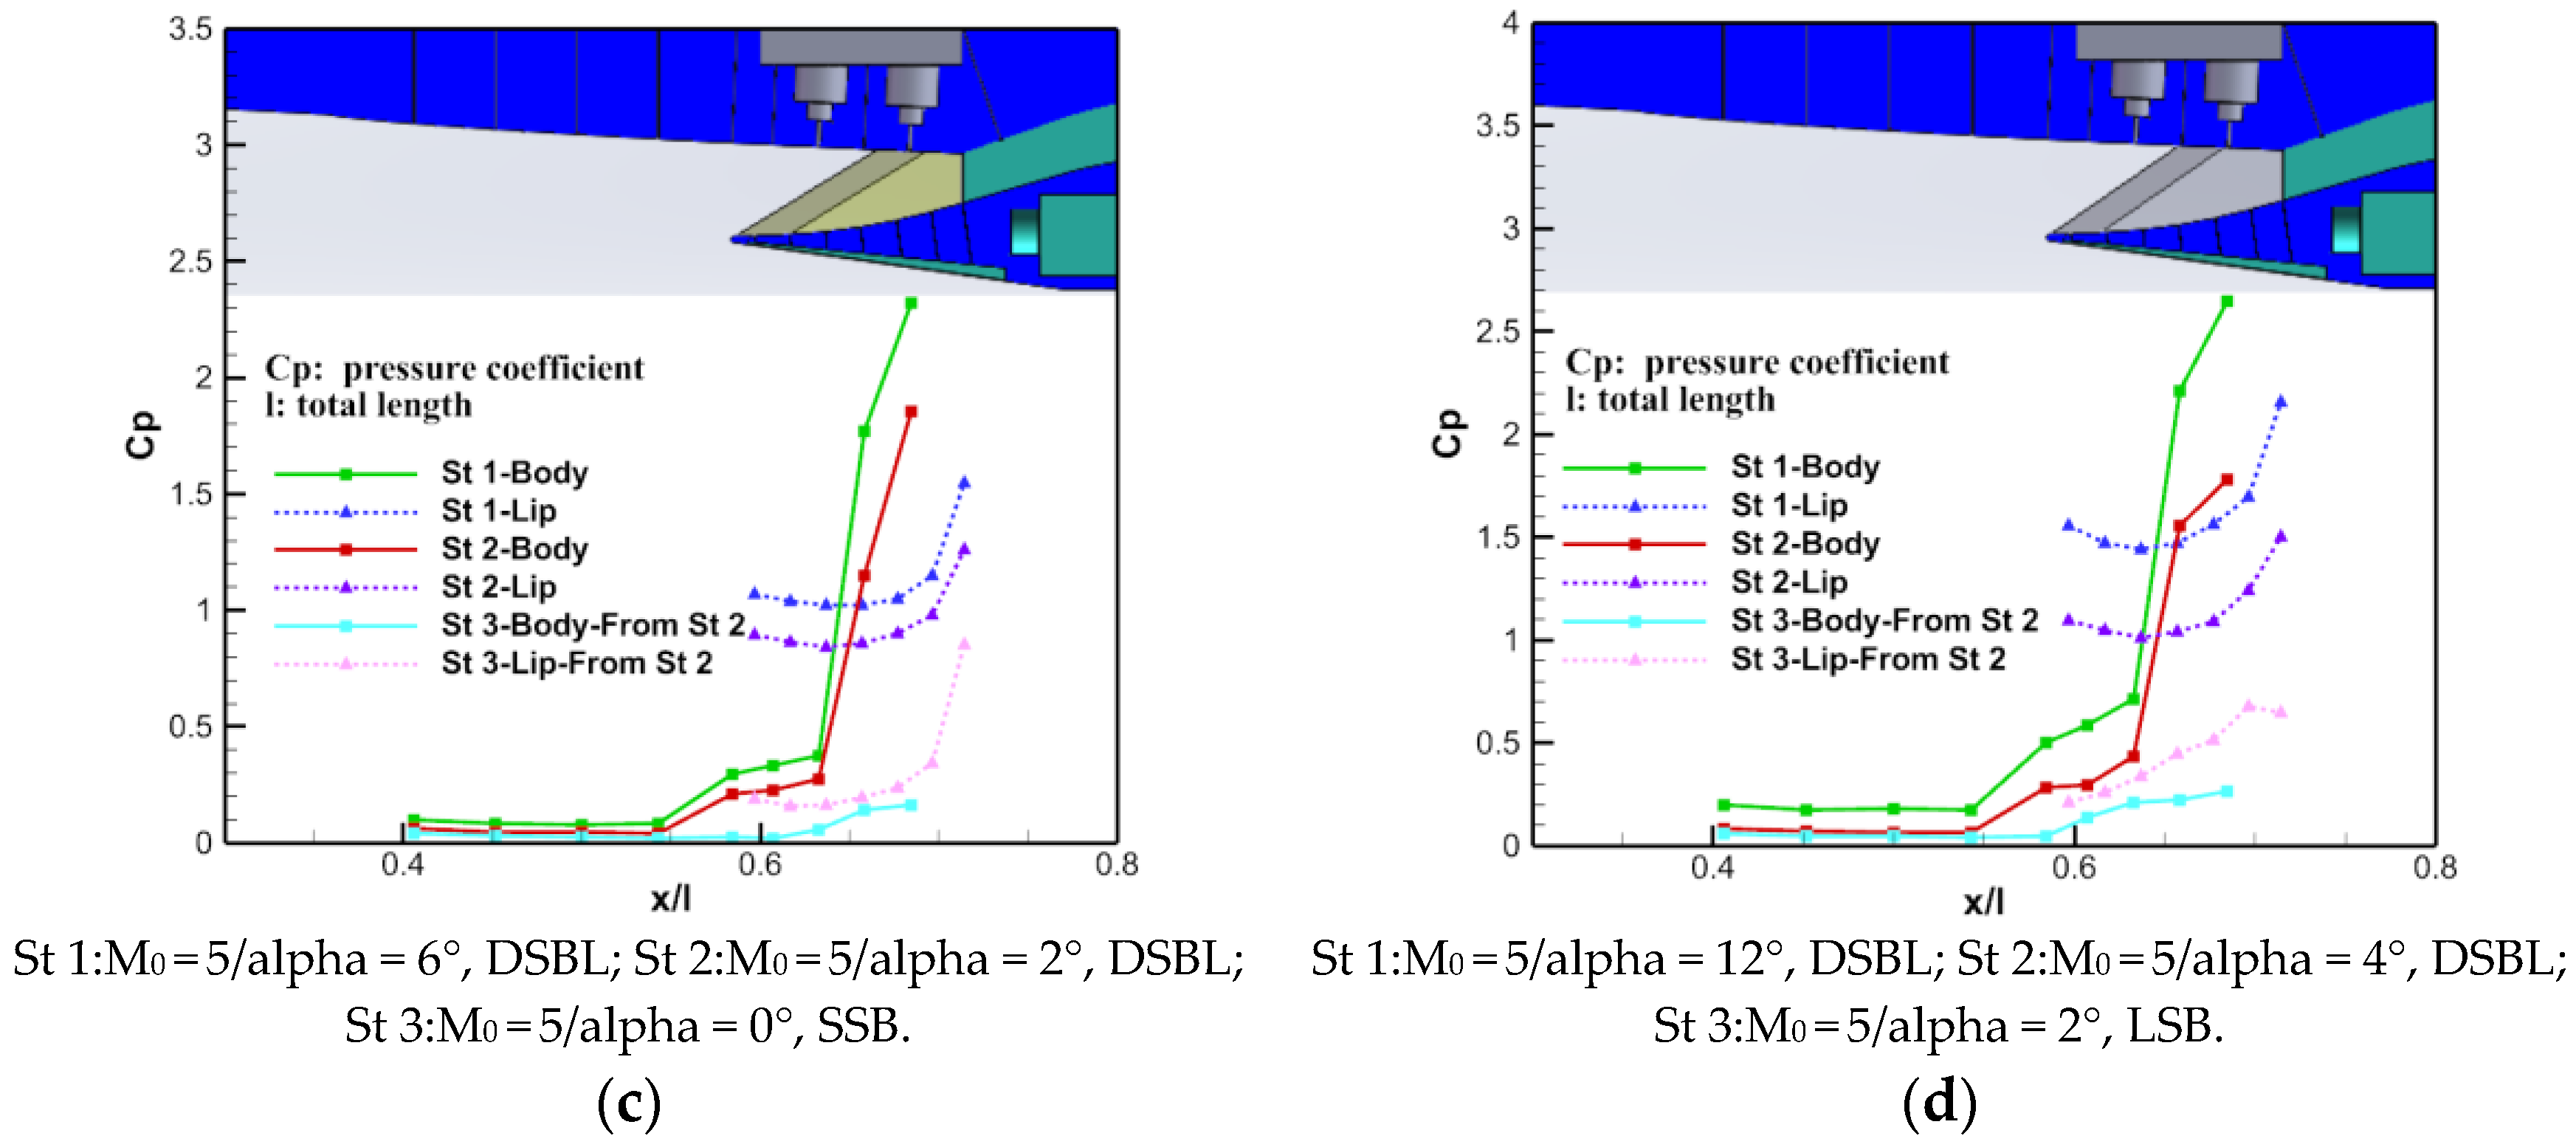
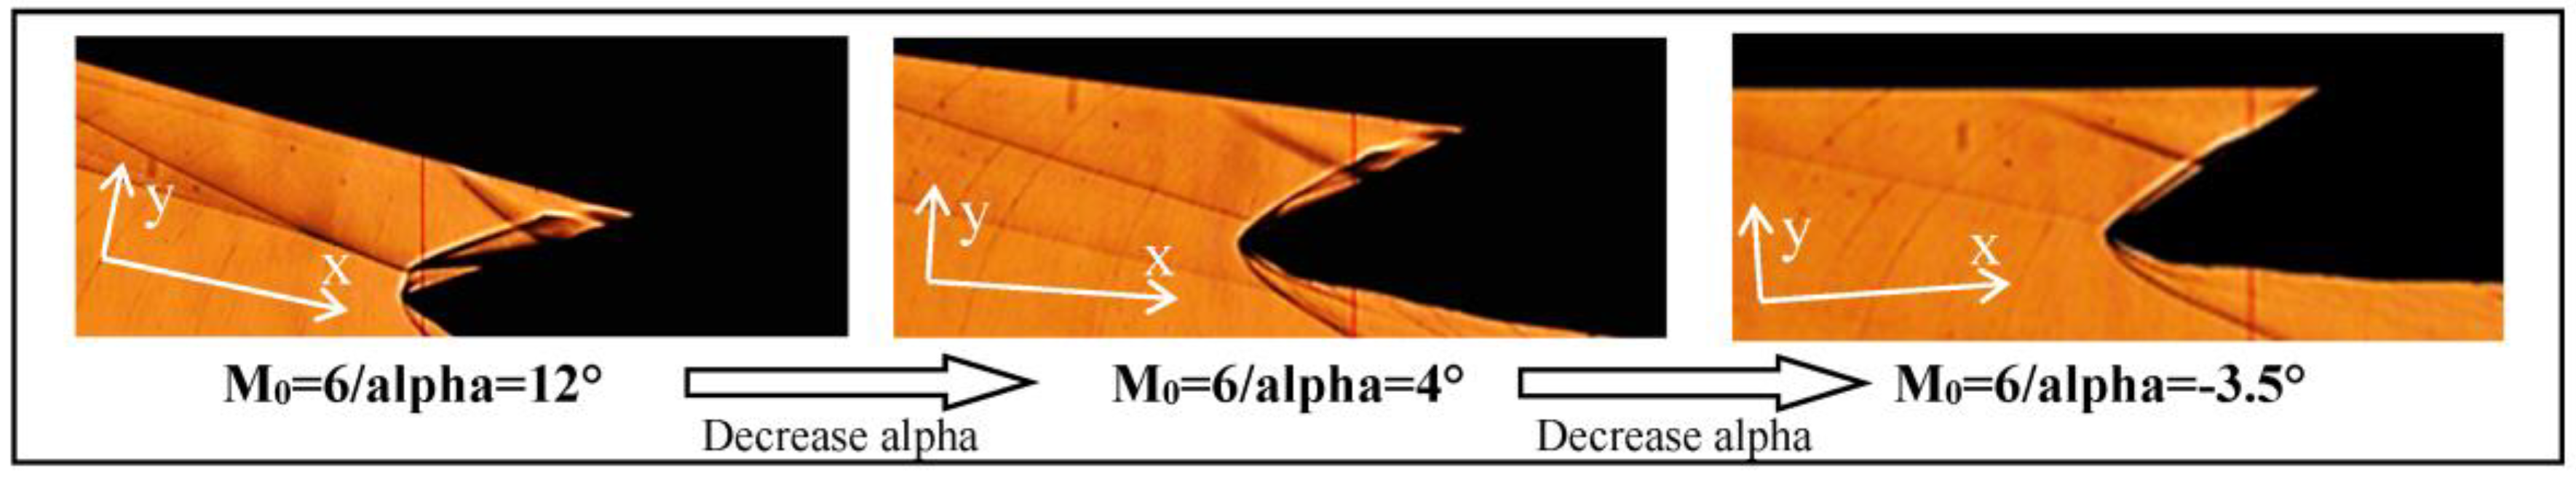
3.1. Three Distinct Types of Unstart Mode

The previous discovery shows that there are three distinct types of unstart modes in some hypersonic inlets [48]. They are the flow mode of large separation on body (LSB), flow mode of small separation on body (SSB), and flow mode of dual separations on both body and lip (DSBL).
Figure 6 shows the Schlieren images of these different unstart modes (M0: inflow Mach number, alpha: angle of attack). As seen in Figure 6, all status parameters of SSB and LSB flow mode were the same, which indicates that the most significant difference between the two flow modes is the scales of the body-side separations. The dominant separations were located on the body side for both LSB and SSB flow modes. As for the DSBL flow mode, separations on both the body side and lip side dominated the flow structure of the inlet.
Reference [19] points out that the essence of the self-start of hypersonic inlets is the vanishment of separations near or in the inlet. Thus, since the separations of these three unstart modes are quite different, there must be great differences in their self-starting performance.
In order to clarify the self-start characteristics of these three unstart modes, a series of free jet experiments were conducted; Table 2 shows the detailed parameters of the incoming flow.

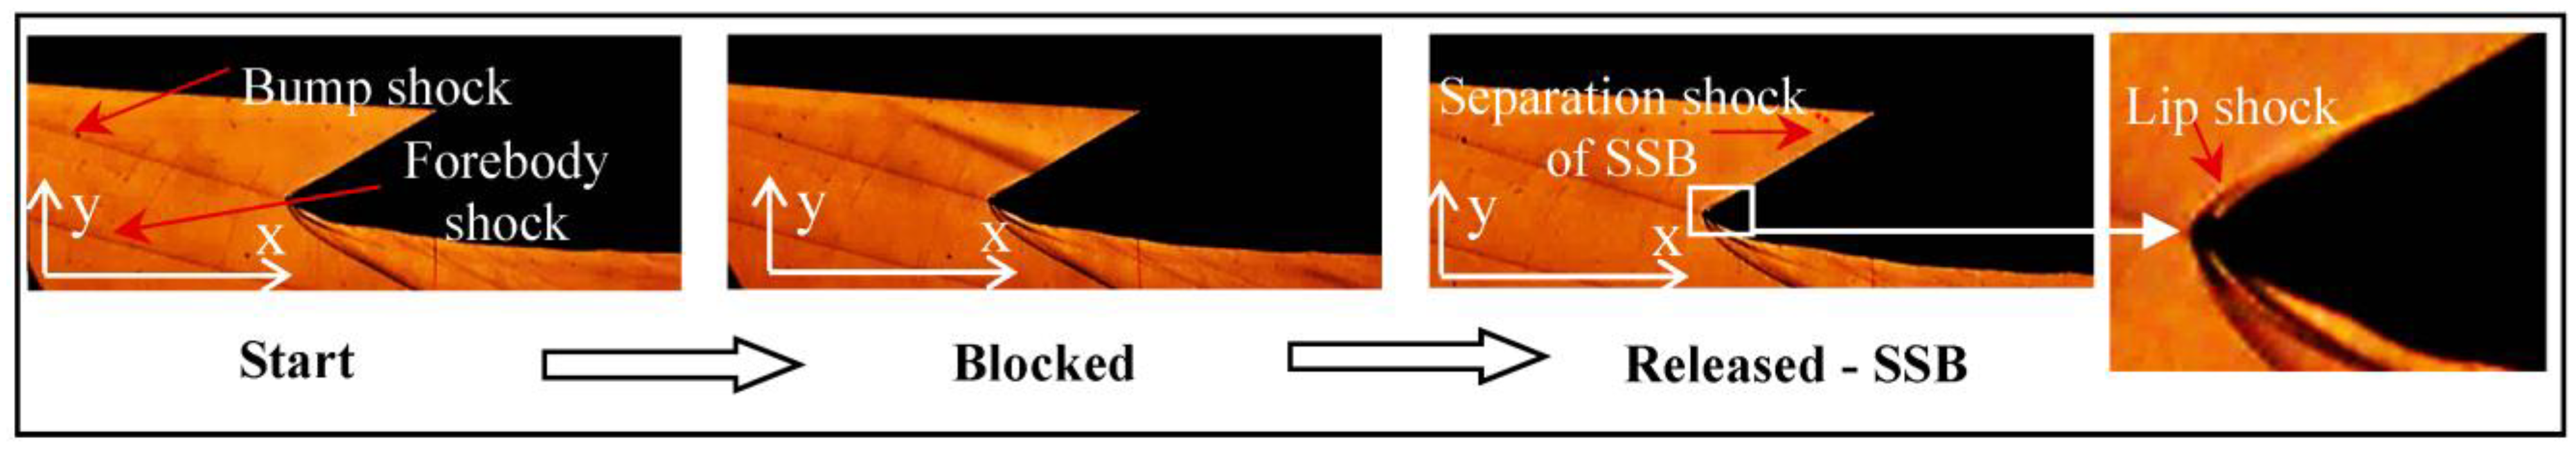
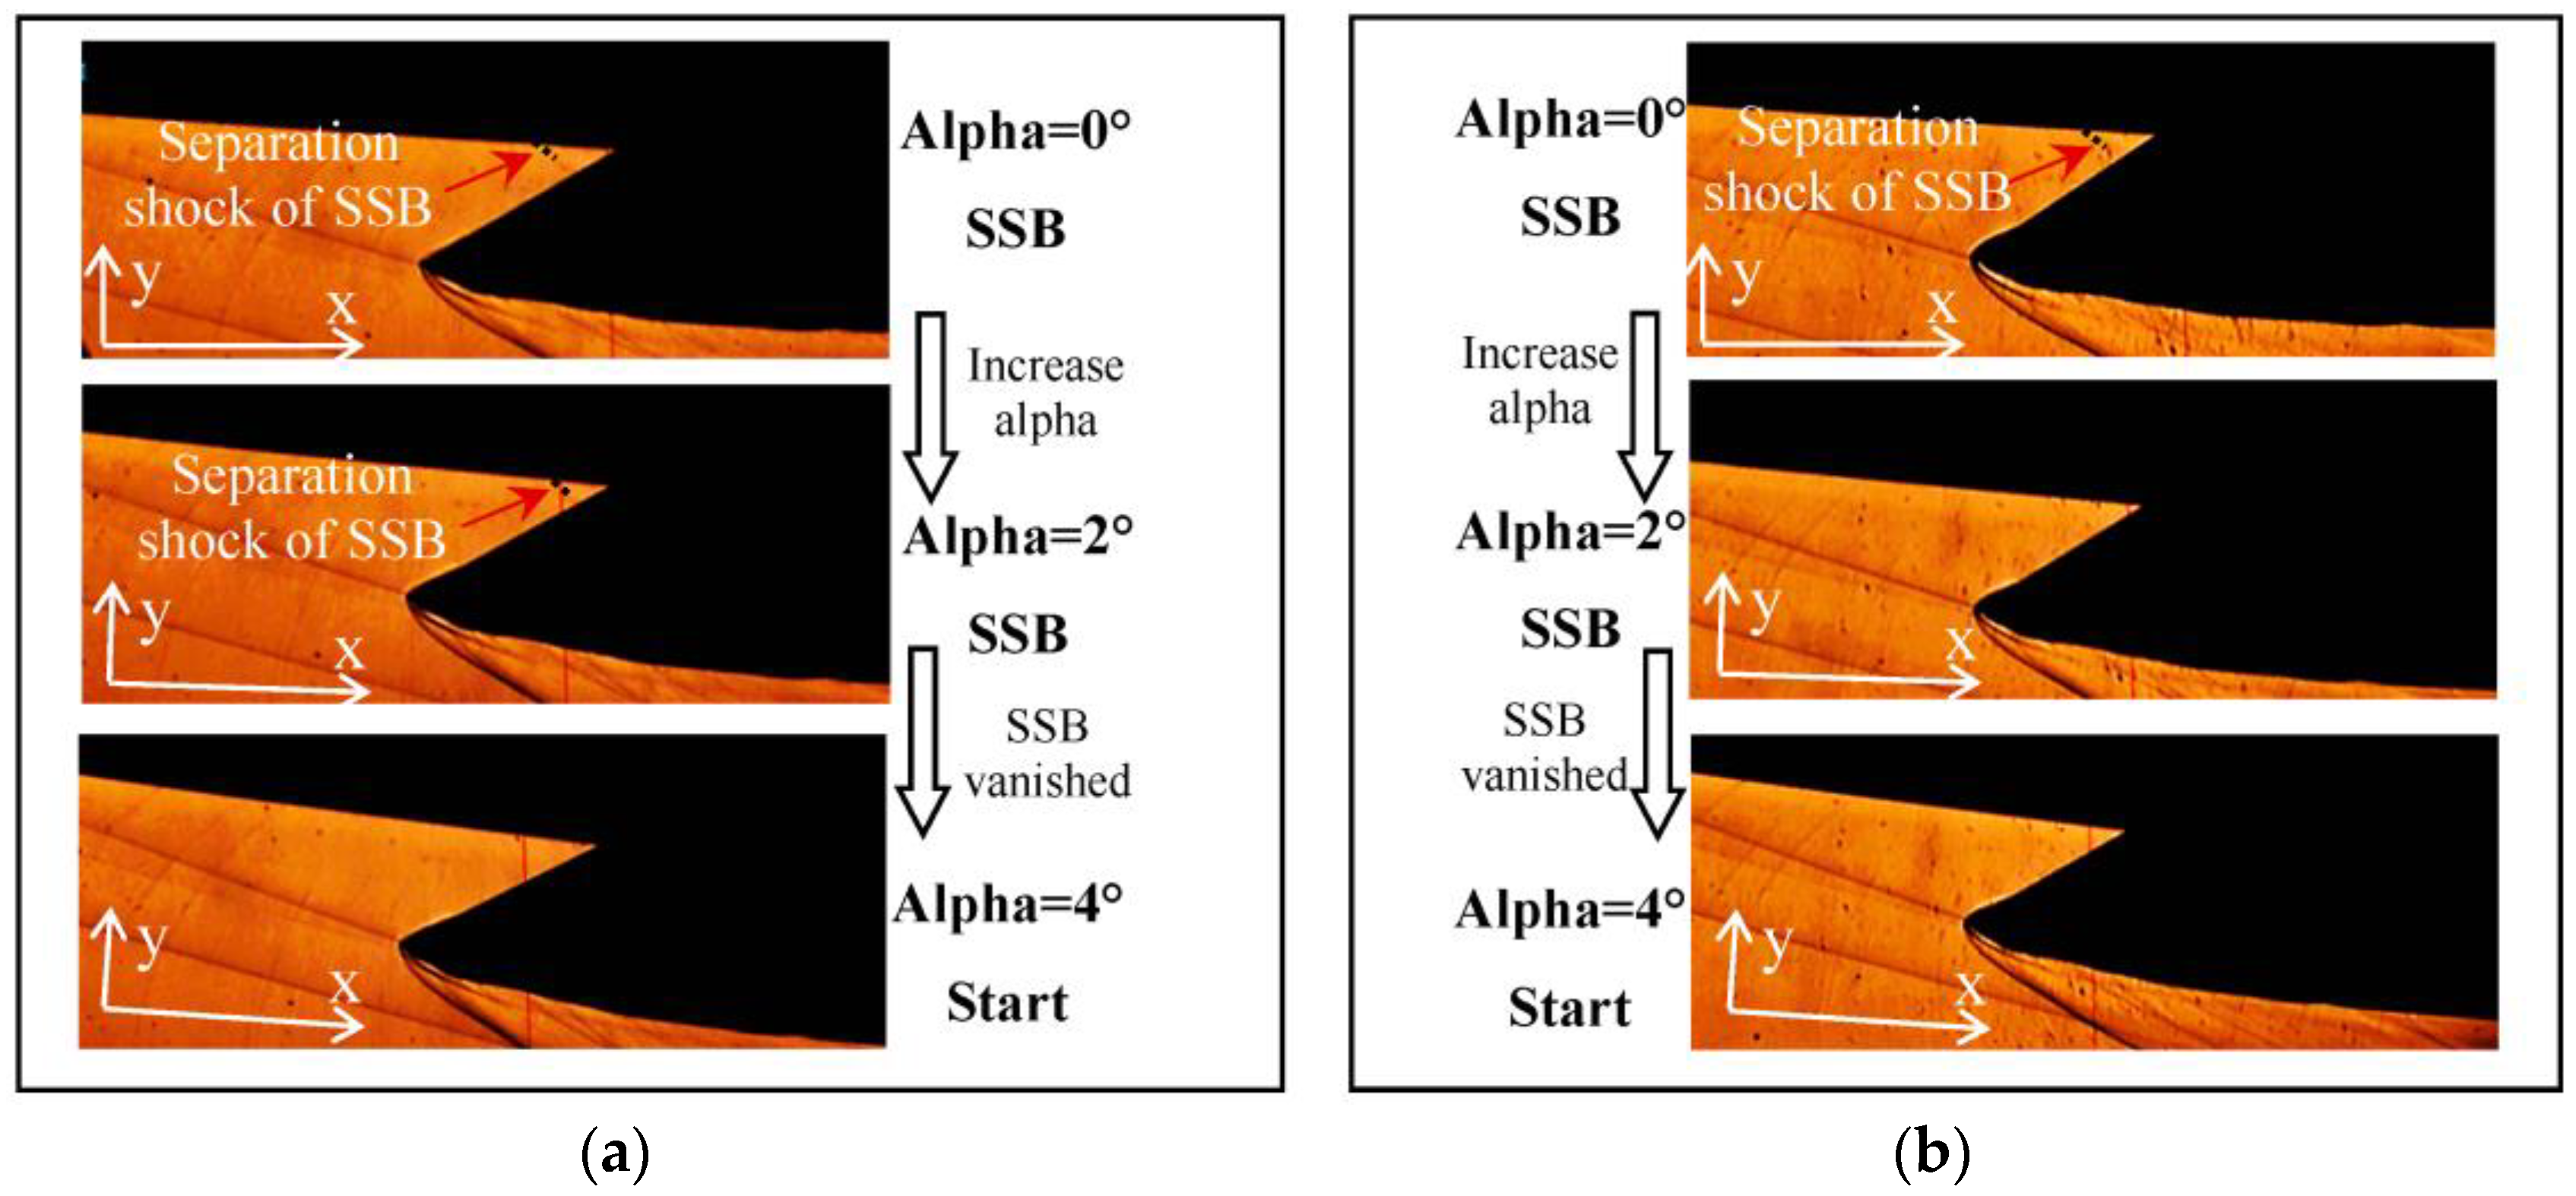
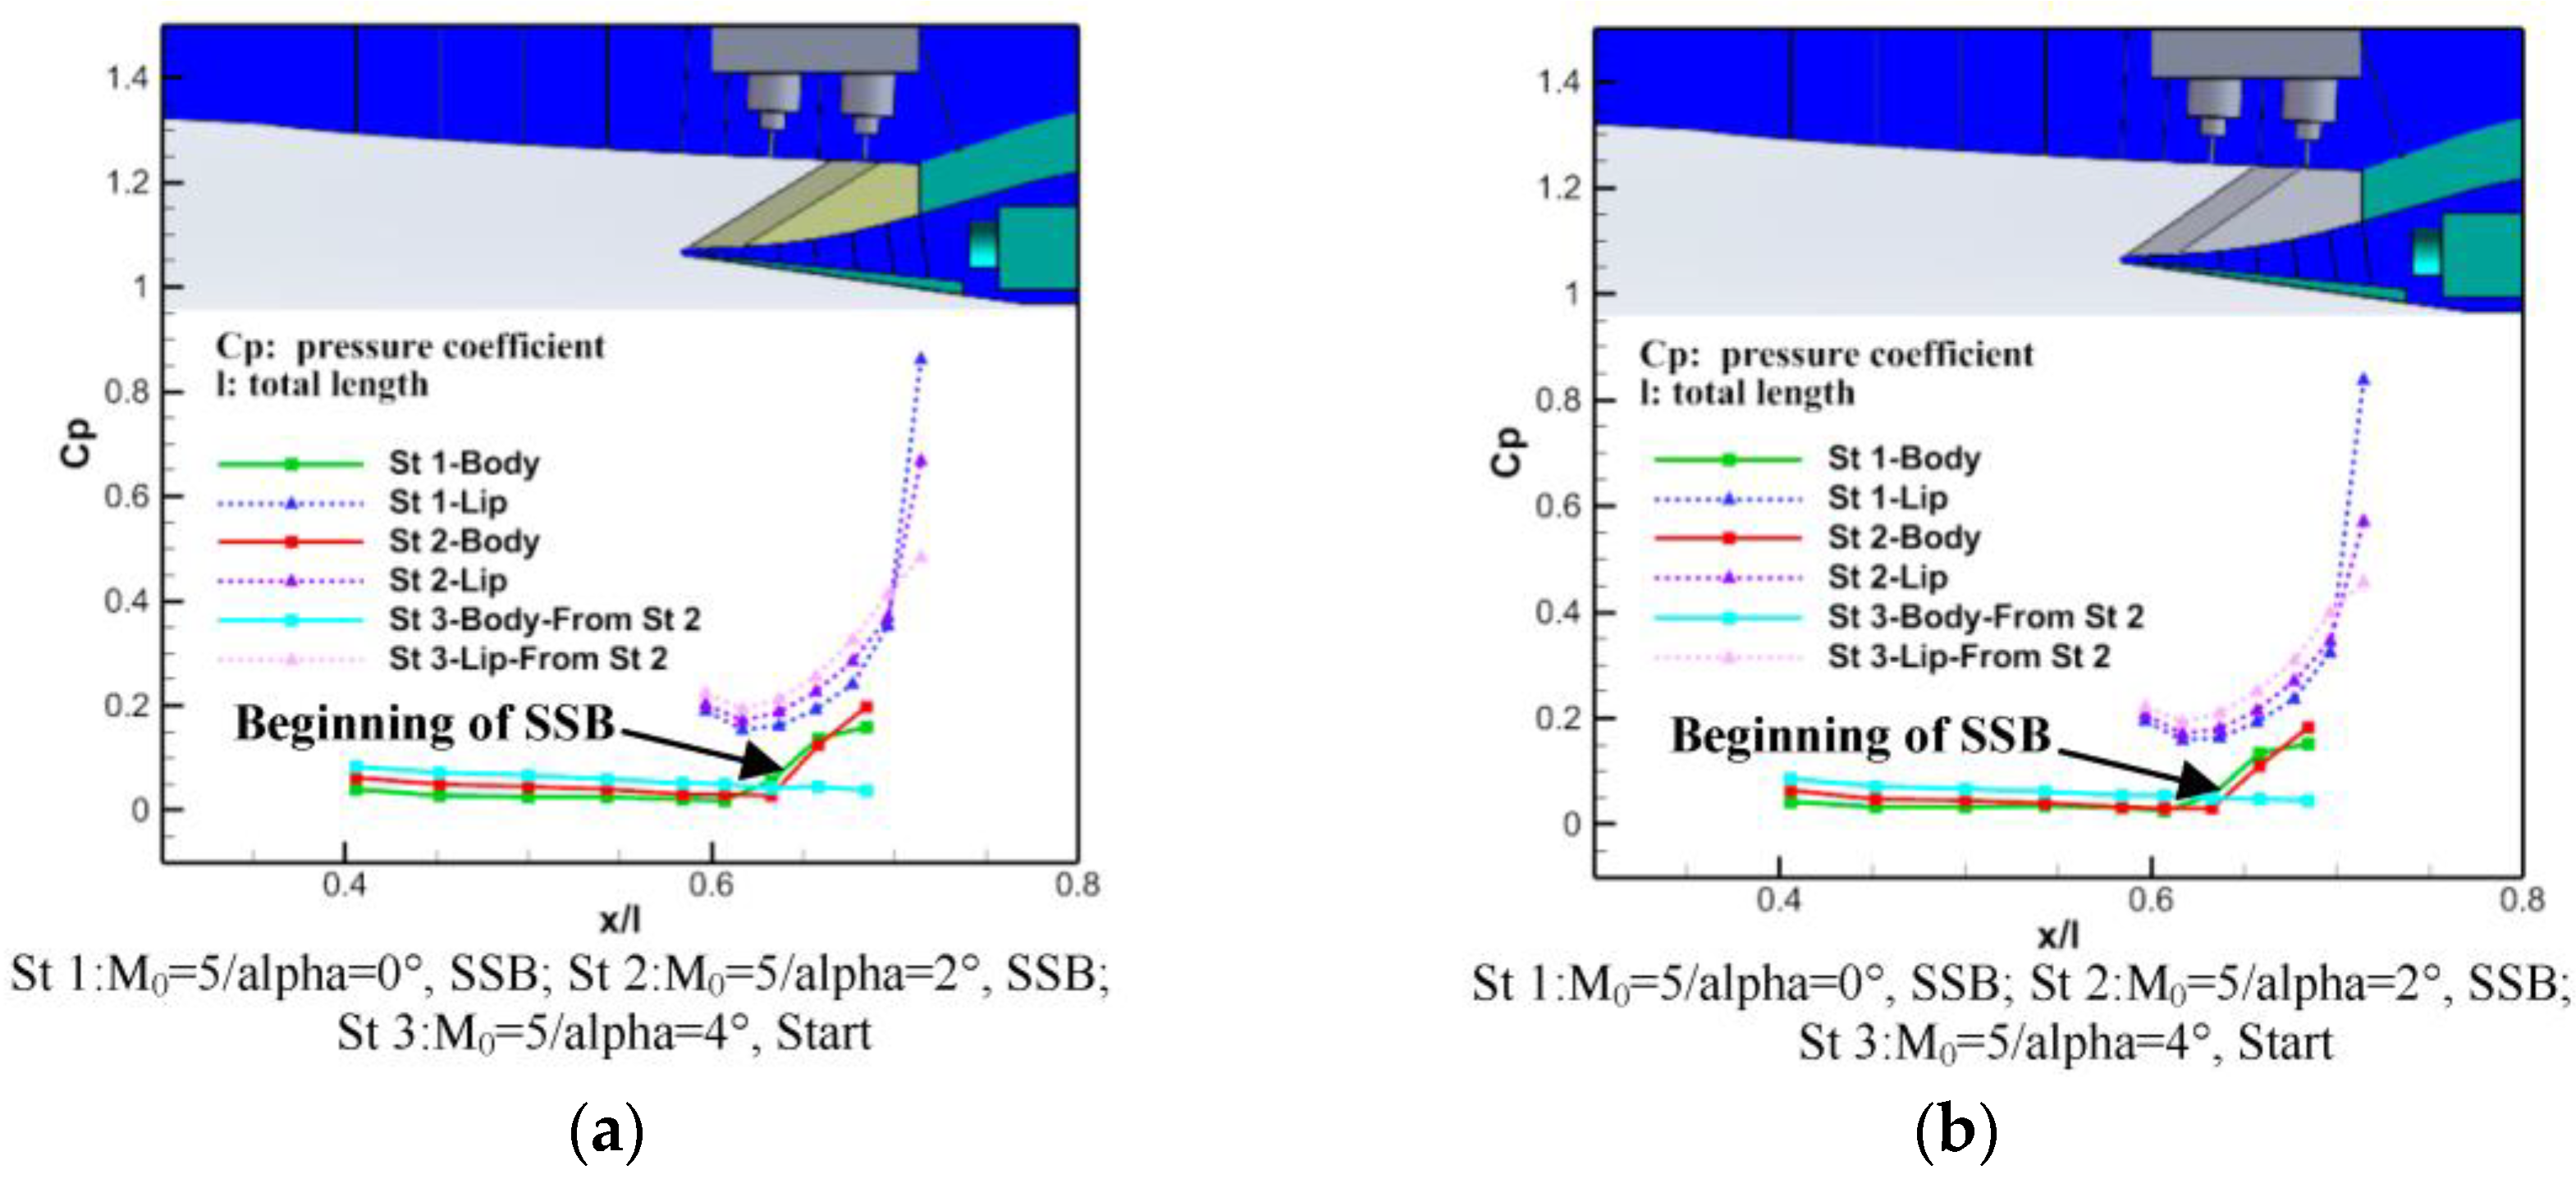
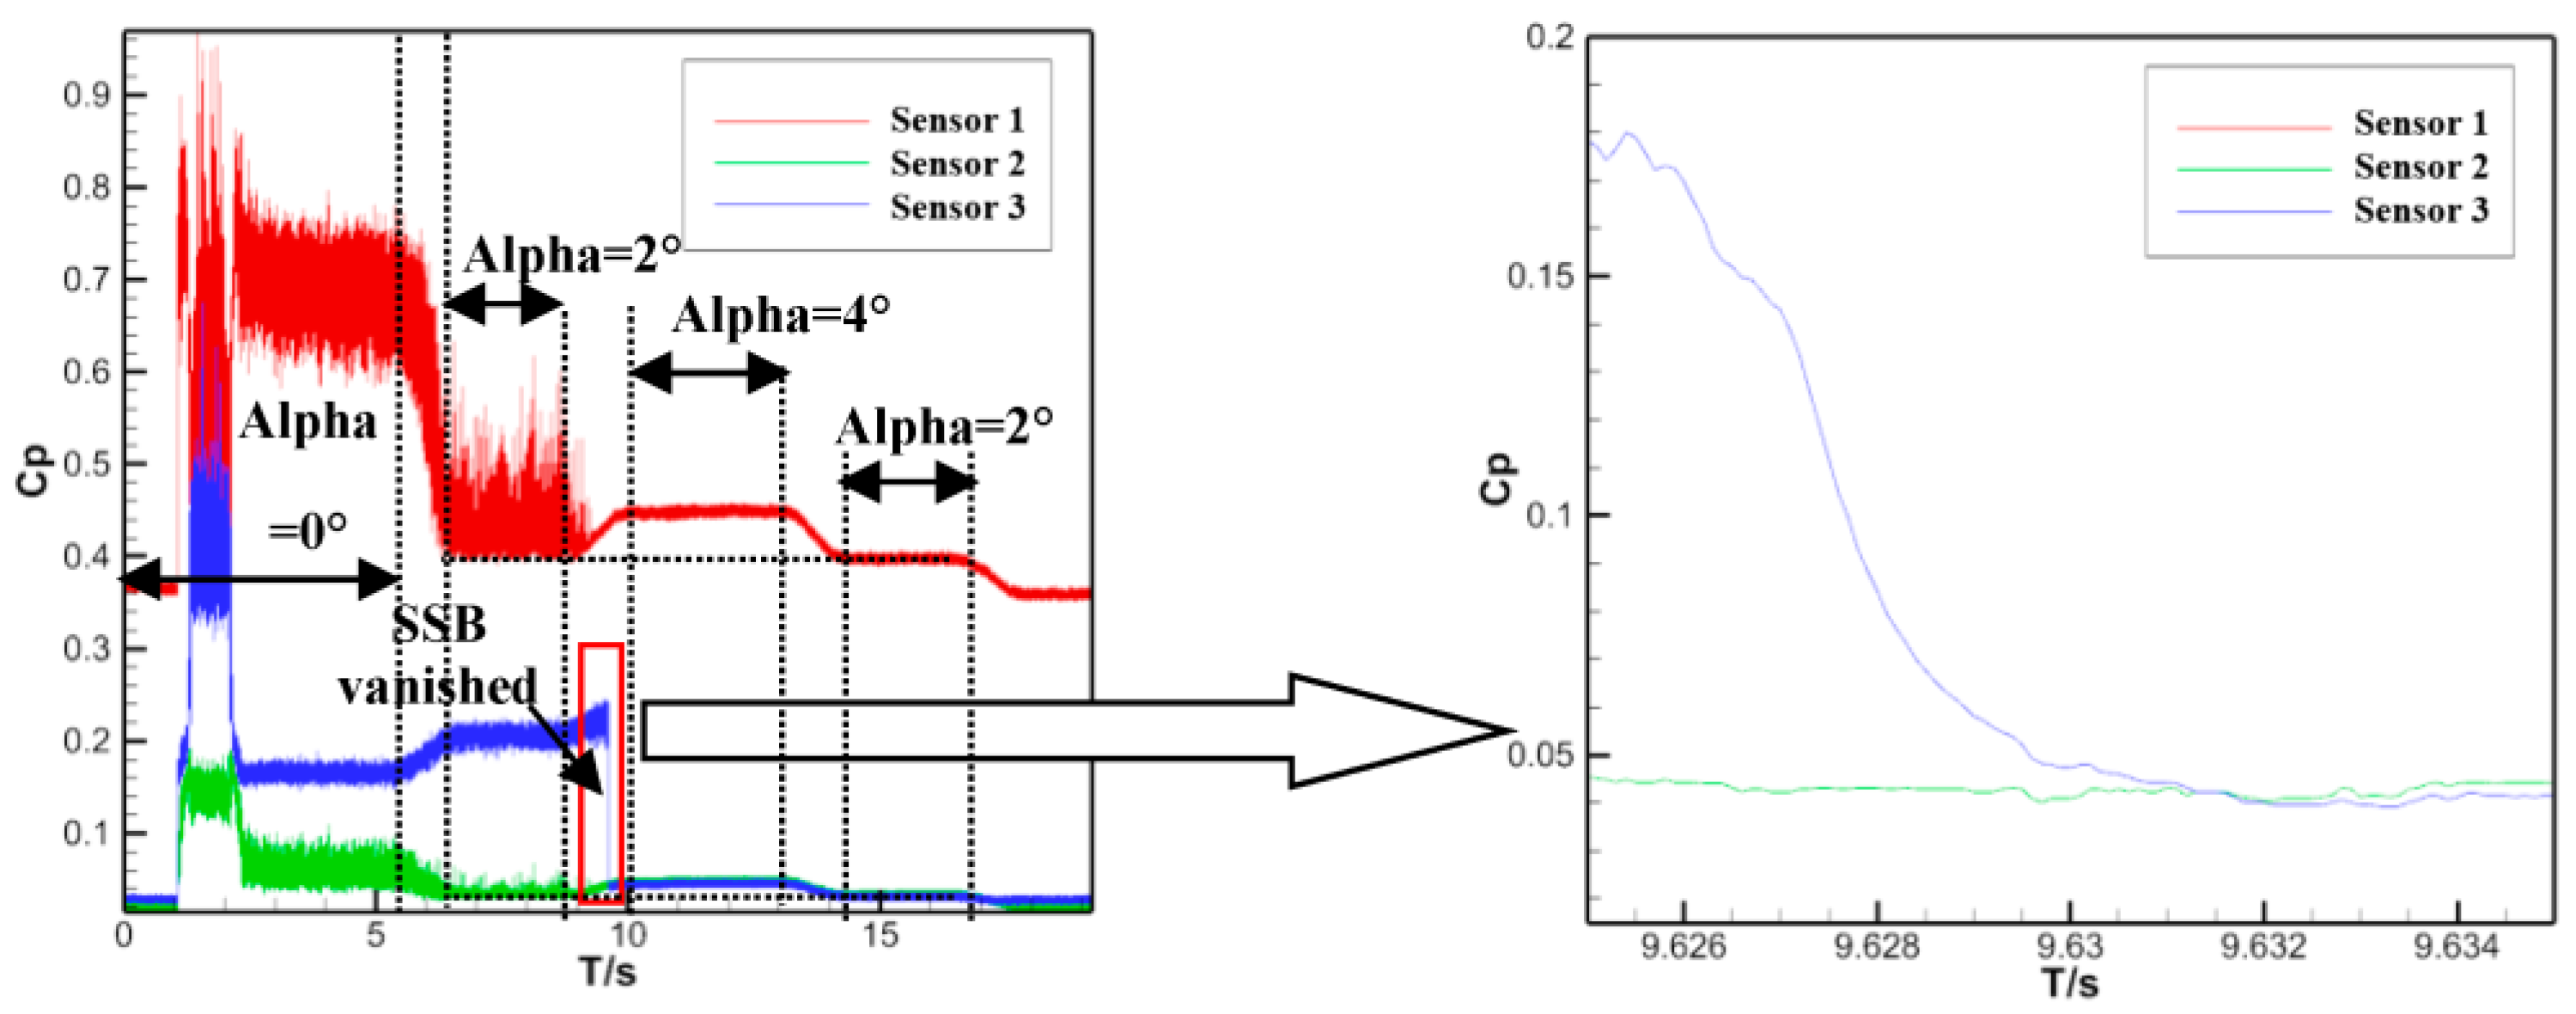
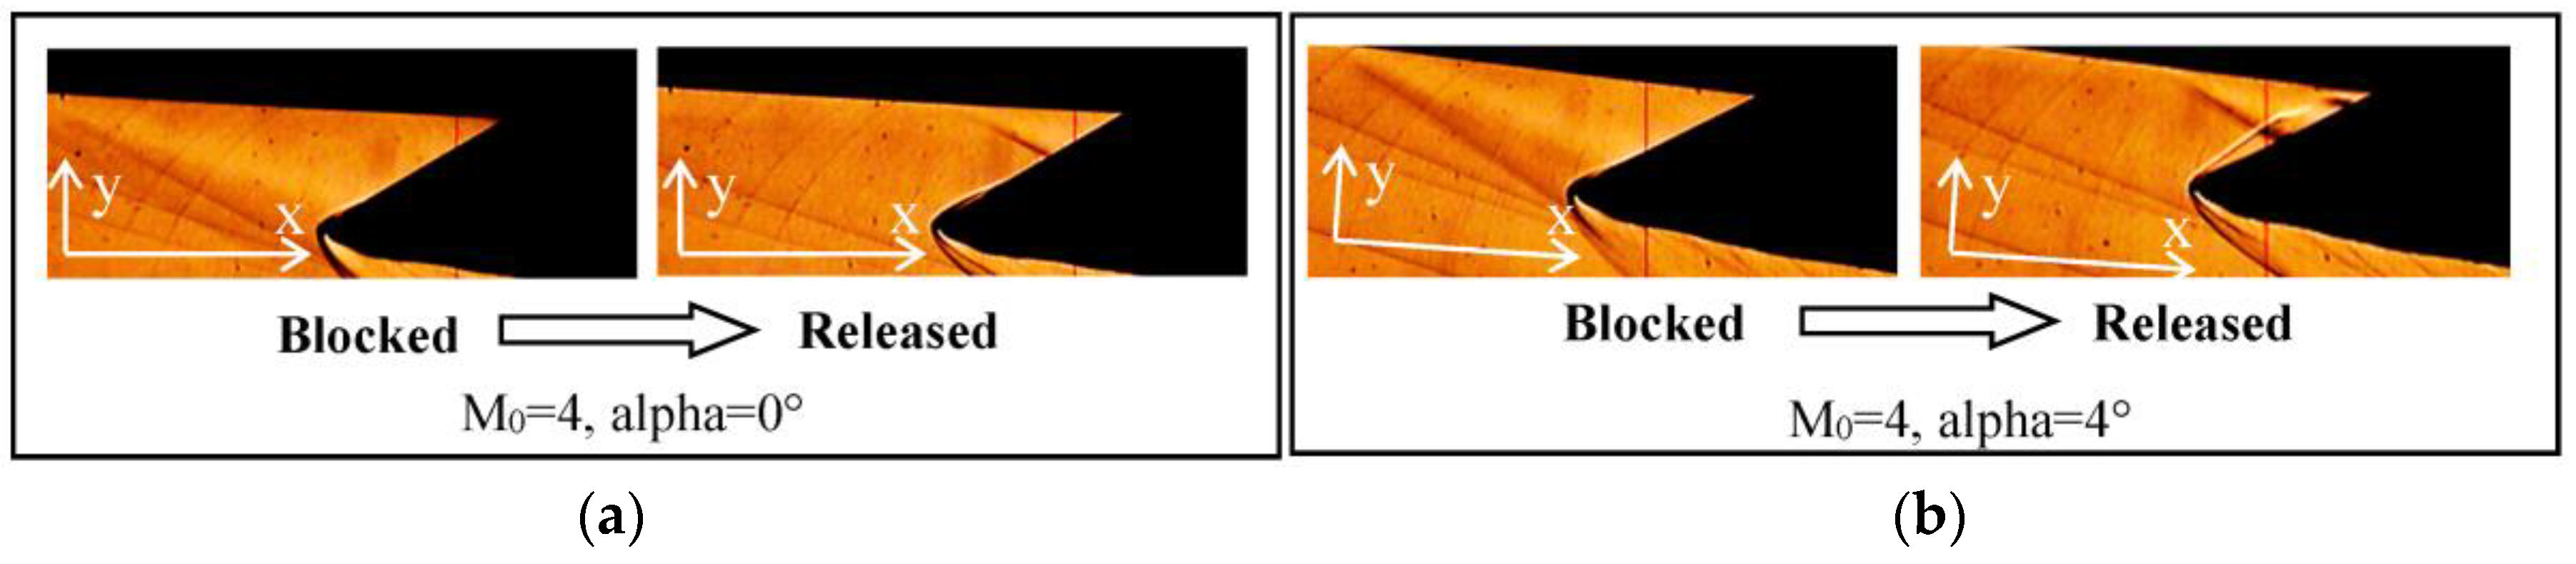
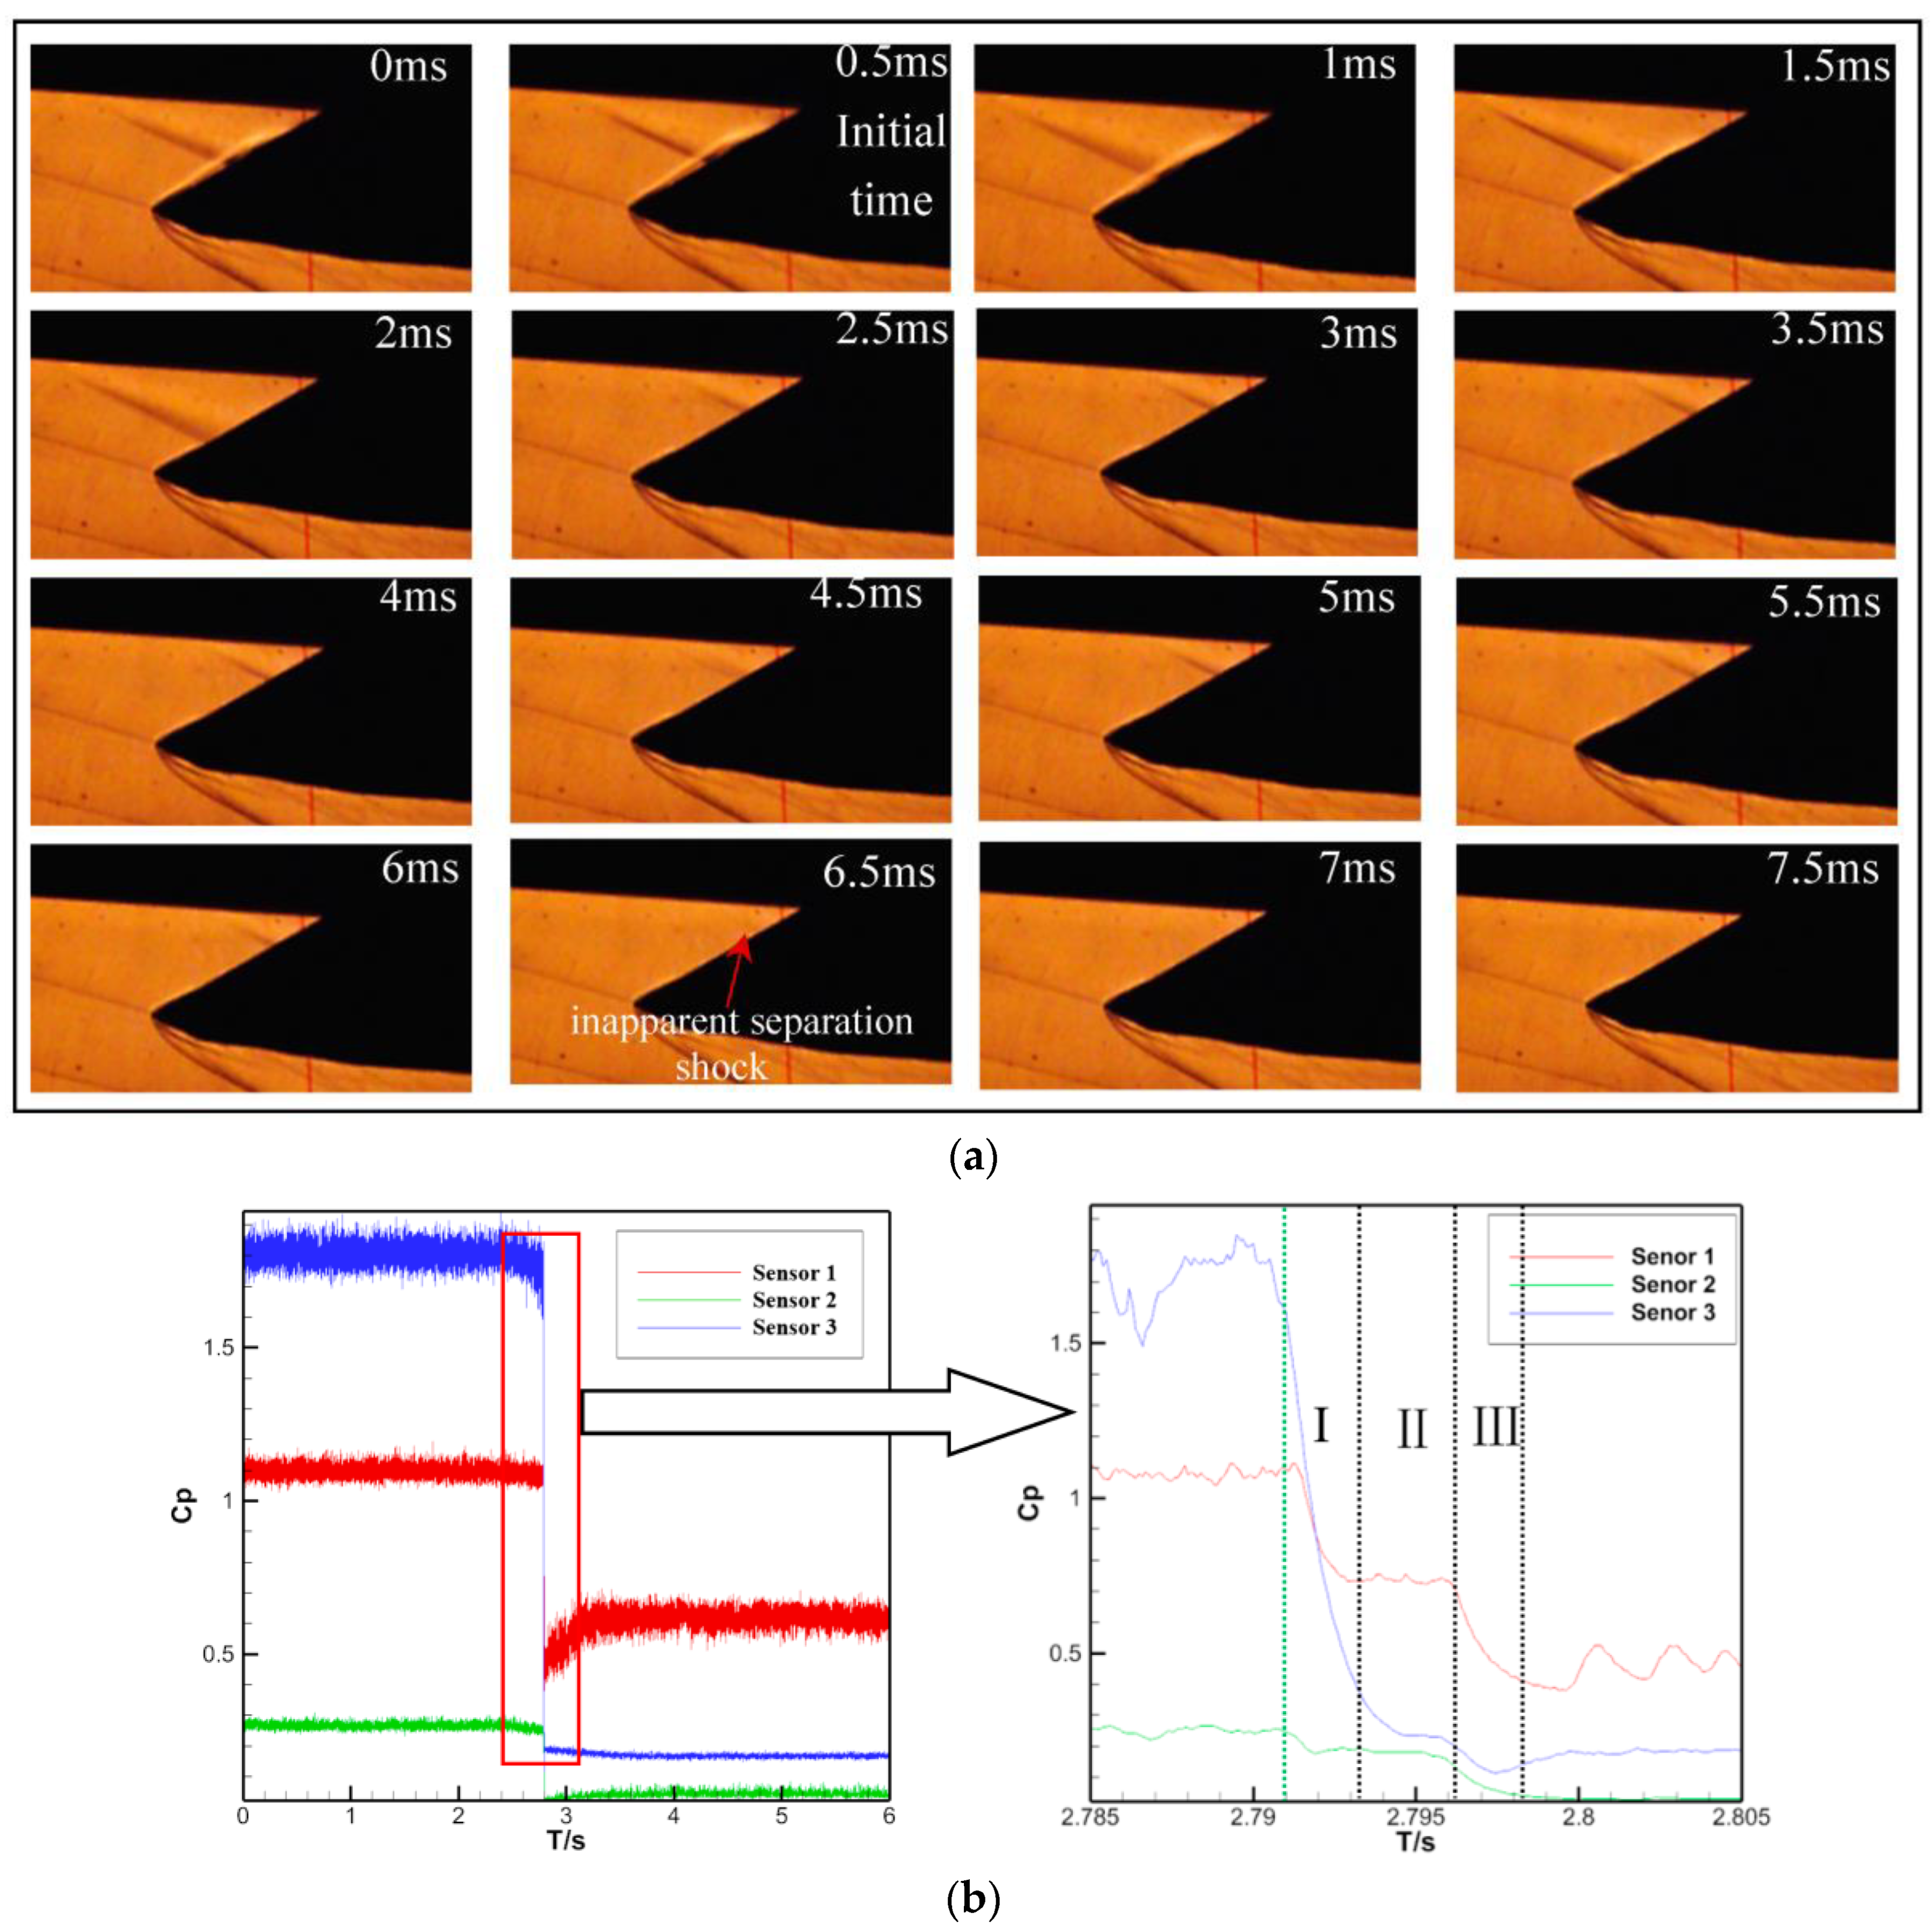
3.2. Self-Start Characteristics of SSB Flow Mode

The start flow mode was gained at M0 = 5/alpha = 0° (M0: inflow Mach number, alpha: angle of attack) when the wind tunnel started, both for Model/SB-1 and Model/SB-2. This process is called pulse start. Then, the SSB flow mode could be obtained by blocking and then releasing the downstream channel gradually through the throttle system, as shown in Figure 7. The forebody shock, bump shock, and separation shock caused by the small-scale separation can be seen in these figures. Observing the Schlieren images carefully, we can see the beginning section of the lip shock, which was a detached shock caused by the rounded corner of the leading edge. The rest lip shock hid behind the sideboards, so it could not be observed.
Increasing the alpha from the initial SSB flow mode, we found that the inlets could self-start. For both Model/SB-1 and Model/SB-2, self-start took place whilst alpha increased from 2° to 4°. Figure 8 and Figure 9 separately exhibit the Schlieren images and pressure distributions along the flow direction in this process. As shown, even though the SSB is difficult to distinguish in the Schlieren images (oscillation could be observed more clearly in the process of continuous animation), the pressure increased at the points indicated by black arrows at the beginning of the SSB. Congestion in the throat of the inlet and shock boundary-layer interaction are the two main causes which give rise to inlet unstart. Additionally, the compression of the forebody abdominal surface strengthens as the alpha rises, which results in the Mach number decreasing in front of the inlet and the boundary-layer thinning in the forebody abdominal surface [52]. If the main cause of the SSB is congestion in the throat of the inlet, self-start should occur as the alpha decreases, which is incongruent with our experimental results. If the main cause of the SSB is shock boundary-layer interaction, self-start should take place as the alpha increases because the resistance to the flow separation of the thinner boundary layer is stronger [34], which is consistent with our experimental results. Therefore, the shock boundary-layer interaction accounts for the SSB unstart mode.
For Model/SB-1, Figure 10 displays the variations in high-frequency pressure in the process of blocking and then releasing the downstream channel gradually at M0 = 5/alpha = 0° and then changing the alpha. The locations of the sensors are shown in Figure 1. As can be seen in Figure 10, the pressures of all the sensors increased after the flow mode converted from start to SSB unstart by blocking and then gradually releasing the downstream channel. However, the pressures of sensor 1 (which was affected by the separation shock of the SSB) and sensor 2 decreased when the alpha reached 2°, and the low limitation was closed to the pressures of the start mode, which was at the same status. Unilateral oscillation was ongoing based on this low limitation, and the oscillation intensity remained unchanged in sensor 1 but weakened in sensor 2. As for sensor 3, the pressure increased continuously as alpha increased from 0° to 2°, while the oscillation was constant. This means that the SSB was dwindling as alpha increased, and so was the scope of influence. Furthermore, the influence of the produced separation shock moved downstream. These variations are in accordance with the above theory regarding the cause of the SSB flow mode. With alpha continuing to rise, the influence of the SSB on sensor 1 and sensor 2 became smaller and smaller and finally disappeared, which implies that the separation continued to dwindle. At that moment, indicated by an arrow, the pressure in sensor 3 dropped suddenly, representing that the SSB was swallowed into the throat and vanished, and self-start was achieved. As shown in this figure, the time consumed for the self-start of the SSB flow mode was 4~5 ms.

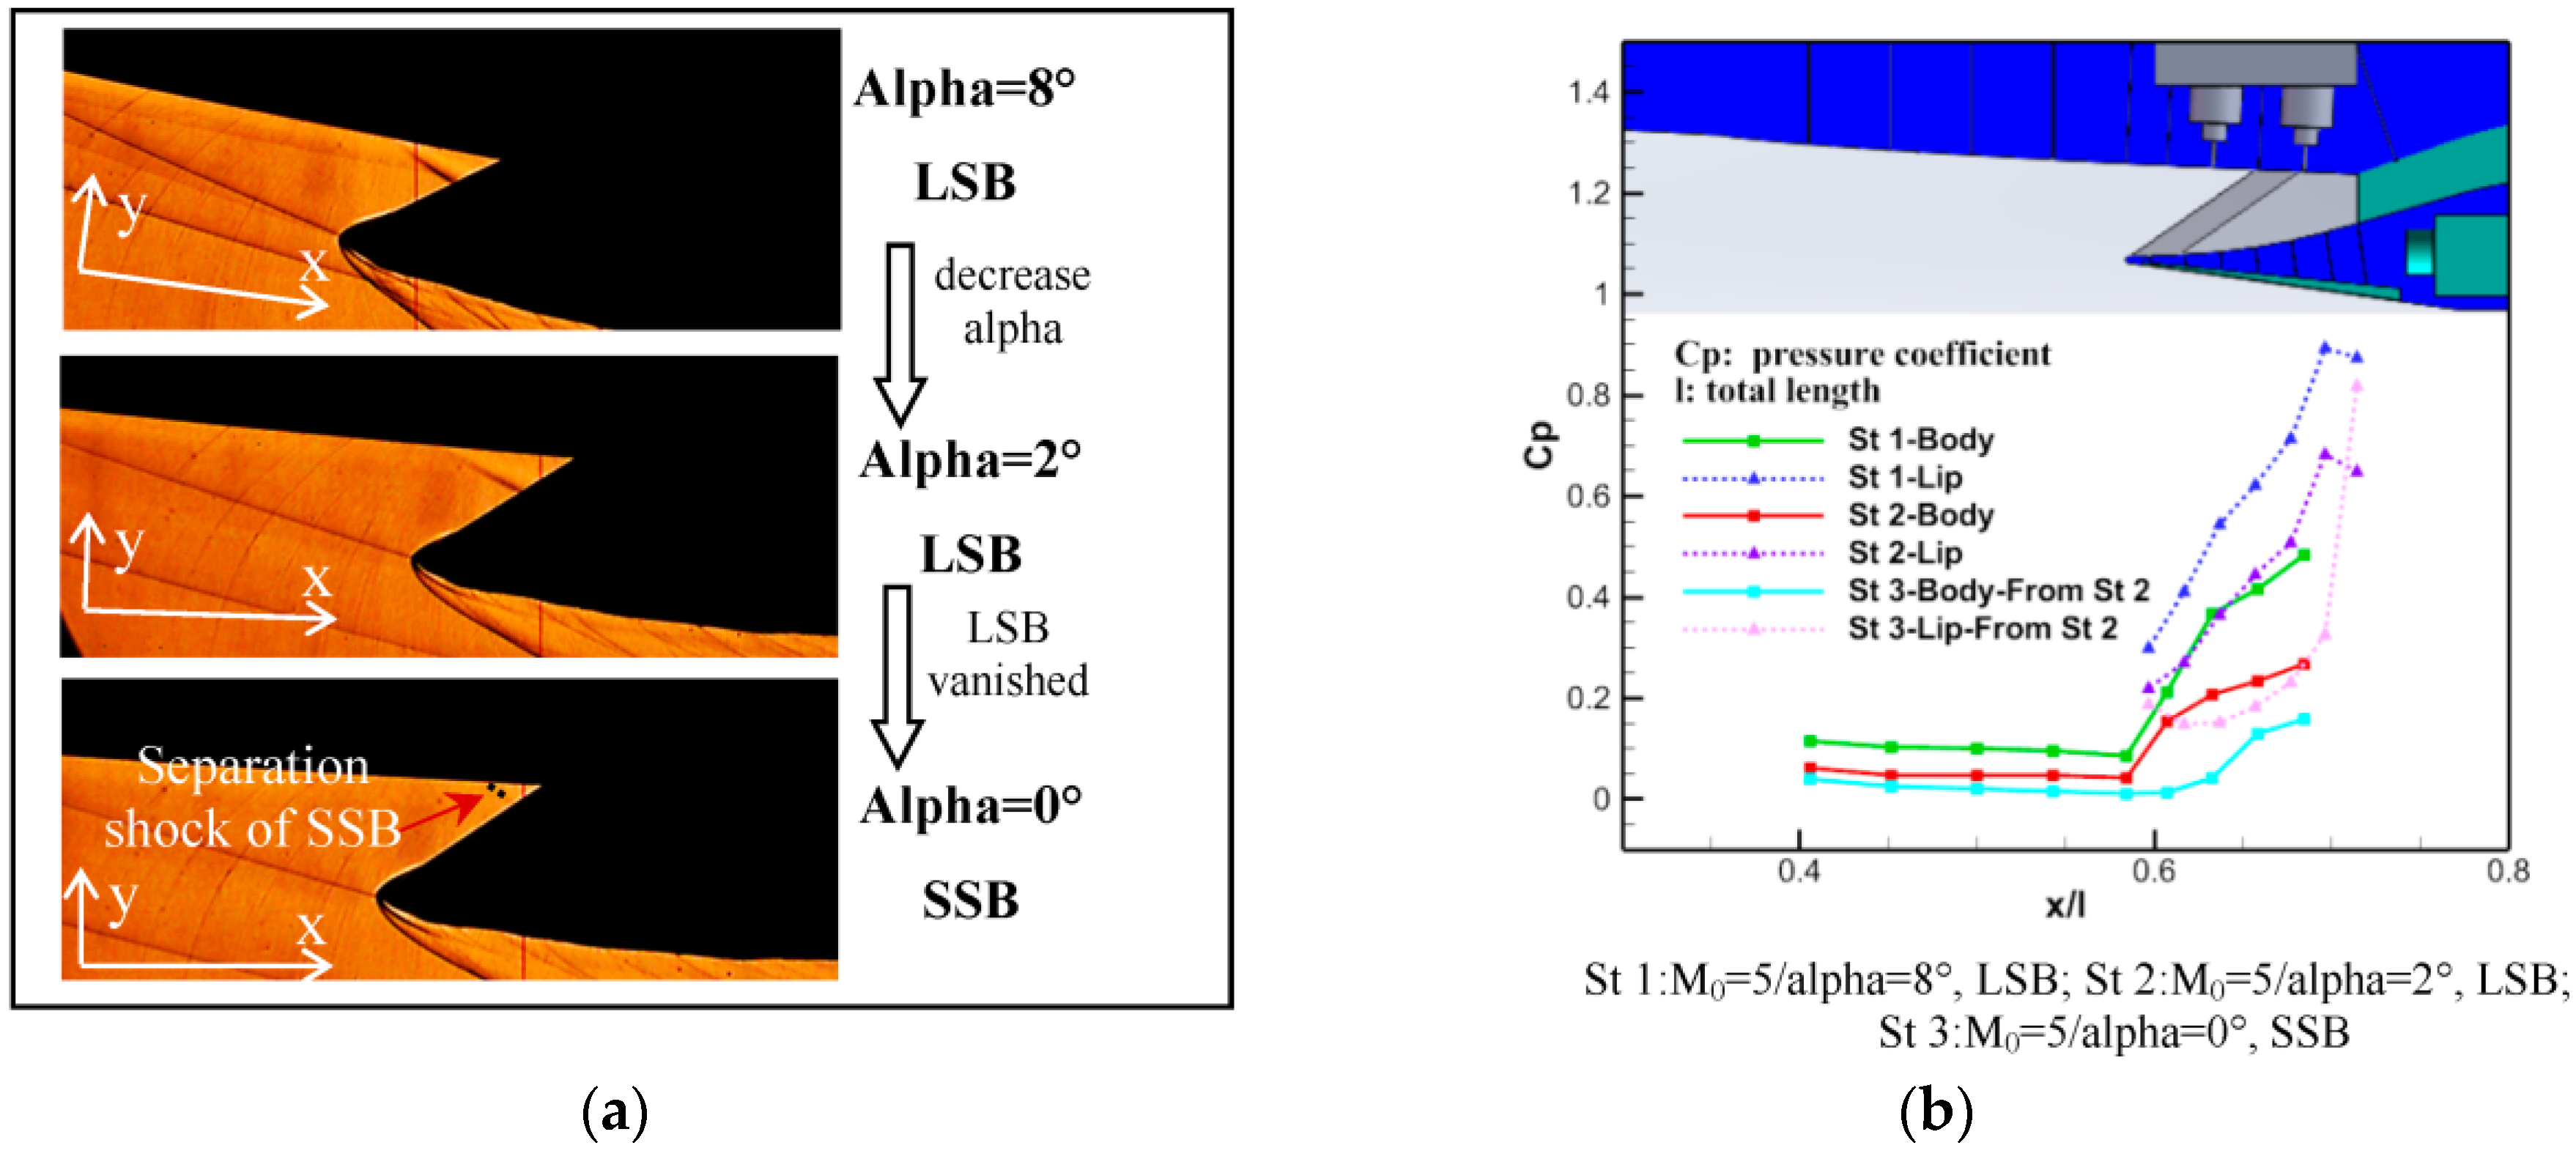
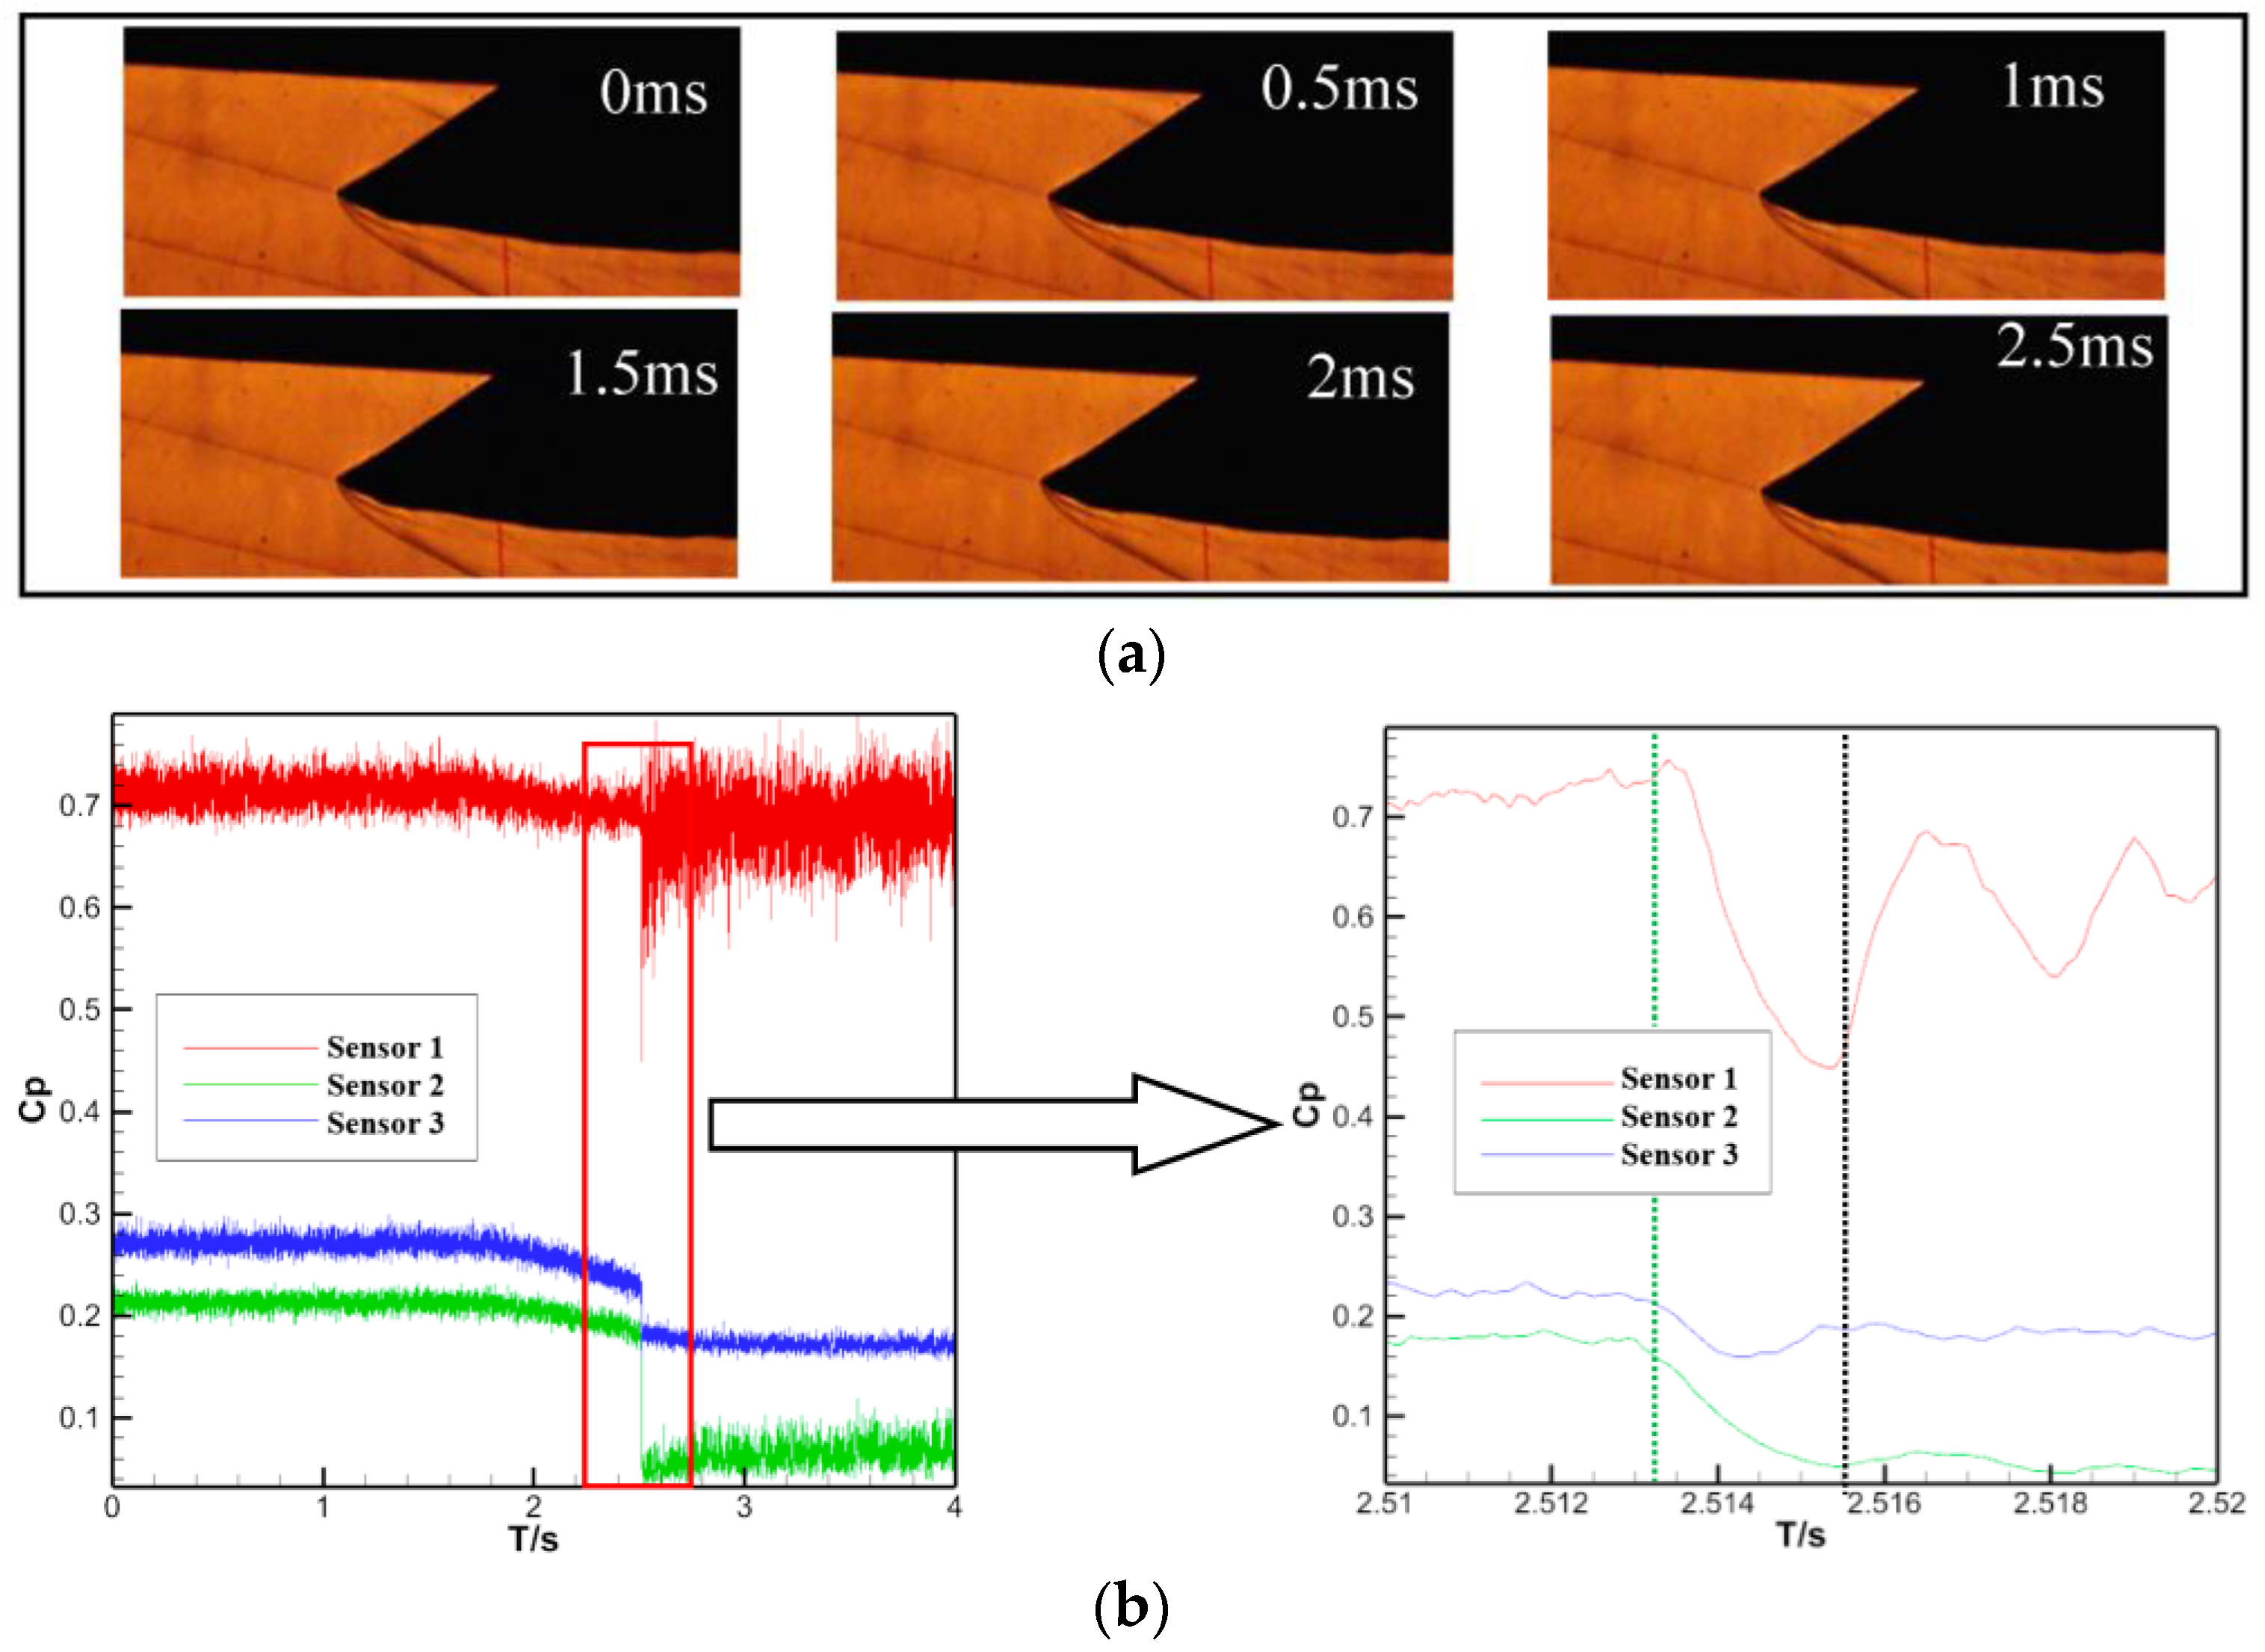
3.3. Self-Start Characteristics of LSB Flow Mode

LSB flow mode is the most common unstart form, about which research is the most extensive. The combined action of congestion in the throat of the inlet and shock boundary-layer interaction is usually thought to be the cause of this unstart mode. Normally, self-start can be achieved via increasing the Mach number or decreasing the alpha. A dwindling internal contraction ratio also benefits the self-start for the geometry-variable inlet.
Experiments were conducted to reveal the self-start characteristics of the LSB unstart mode for the present models, and the details are as follows.
We first introduce the experimental results when M0 = 4. Figure 11 shows the effects of increasing the alpha for the LSB flow mode. In Figure 11, we can see that for both Model/SB-1 and Model/SB-2, the LSB flow mode withstood values alpha = 0° to alpha = 10° and was converted into DSBL flow mode at alpha = 12°, which means that the LSB cannot vanish at M0 = 4.
We then analyzed the experimental results for Model/SB-2 at M0 = 5. Figure 12 shows the process of decreasing the alpha after inducing LSB at alpha = 8° by blocking and then releasing the downstream channel. It can be seen that the LSB vanished as the alpha decreased from 2° to 0°. Because of the small alpha value at this time, a tiny separation was left as a remnant of the LSB (the reason is described in the previous subsection), which formed SSB flow mode. The transient process of the LSB vanishing is displayed in Figure 13, and the green dotted line in (b) indicates the initial time in (a). As seen in these pictures, the time for the LSB to vanish was about 2 ms. Comparing the flow structure of the first picture in Figure 13a with the first and second pictures in Figure 12a, we can see that the scale of the LSB did not dwindle gradually before vanishing, which is different from the vanishing process of the SSB. As discussed above, the following self-start was completed when the alpha increased to 4°.
For Model/SB-1, the LSB vanishing process was not observed when changing the alpha at M0 = 5. In order to clarify the LSB vanishing characteristics in this situation, we refer to the experiment results from blocking and then gradually releasing the downstream channel. Therefore, the next discussion is the action of flow modes formed by blocking and then gradually releasing the downstream channel in these experiments.
Figure 14 displays the results for Model/SB-1 of gradually releasing the downstream channel after blocking it at M0 = 4/alpha = 0° and M0 = 4/alpha = 4°. It can be seen from Figure 14 that the LSB flow mode was formed after releasing the downstream channel when the alpha was small (alpha = 0°). However, when the alpha increased (alpha = 4°), the DSBL flow mode appeared.
In engineering practice, unstart is often induced by increasing the downstream back pressure (such as blocking the downstream channel). Then, the back pressure is gradually released to observe whether the inlet can self-start. It is generally believed that the critical status of self-start obtained using this method is consistent with the critical status obtained by changing the alpha or M0. However, this method is only applicable in the cases where only the conventional unstart mode (LSB flow mode) exists. Therefore, in order to make the above method available when multiple unstart flow modes exist, we revised it as follows (considering the analysis results shown in Figure 14): if the alpha is not big enough to form DSBL flow mode, blocking and then gradually releasing the downstream channel could result in the same critical status for LSB vanishing, just like that which was obtained by changing the alpha or M0. To verify the correctness of this revised method, an experiment was conducted at M0 = 5 for Model/SB-2: alpha = 0° (pulse start) → alpha = 2° (blocking and then gradually releasing the downstream channel) → alpha = 0° (blocking and then gradually releasing the downstream channel). The Schlieren images and pressure distributions along the flow direction are separately shown in Figure 15 and Figure 16. From these figures, it can be seen that the inlet flow mode was converted into LSB unstart from the start, after releasing the downstream channel at alpha = 2°, and then was converted to the SSB flow mode when the alpha dropped back to 0°. At this time, the LSB did not appear again after we blocked and then gradually released the downstream channel. Thus, whether the downstream channel was blocked and then gradually released or the alpha decreased, the same critical status for the LSB vanishing was obtained (alpha = 0°), which proves the correctness of the revised method.
Based on the above analysis, we introduced the self-start characteristics of the LSB flow mode at M0 = 5 for Model/SB-1. Figure 17 and Figure 18 show the pressure distributions and Schlieren images before and after blocking and then gradually releasing the downstream channel when the degrees of alpha were 5° and 6°. Self-start was achieved in the experiment where alpha = 5°. As for the experiment where alpha = 6°, the DSBL flow mode was induced, and this flow mode was maintained after the throttle system fully opened. From these experiments, we can conclude that the critical alpha of LSB self-start is not smaller than 5°.
In summary, both acceleration and a decreasing alpha contribute to the vanishment of LSB. For Model/SB-1, LSB cannot vanish at M0 = 4, and the critical alpha of LSB self-start is not smaller than 5° at M0 = 5. The LSB of Model/SB-2 is more stable and it also cannot vanish at M0 = 4; its vanishing degree of alpha is 0° at M0 = 5.

3.4. Self-Start Characteristics of DSBL Flow Mode

First, experimental results of the DSBL flow mode at M0 = 5 are introduced. The DSBL flow mode was obtained at an alpha of 6° and 12°, respectively, for Model/SB-1 and Model/SB-2 by blocking and then gradually releasing the downstream channel. Then, the alpha was decreased. The variation in Schlieren images and pressure distributions are shown in Figure 19. As these figures depict, the DSBL vanished when the alpha decreased to 0° for Model/SB-1 and the flow mode was converted into SSB unstart. The following self-start could be completed by increasing the alpha again, as discussed above. With regard to Model/SB-2, the flow mode was converted into LSB as the alpha decreased from 4° to 2°. As previously stated, allowing the alpha to keep decreasing would let the LSB vanish; the remnant of the LSB—the SSB—would vanish as the alpha increased, and then self-start could be achieved.
High-speed Schlieren images and high-frequency pressures regarding the vanishment of DLSB for Model/SB-1 (Figure 19a,c) are shown in Figure 20, and the green dotted line in (b) indicates the initial time in (a). The transient process is clearly shown in these figures. Firstly, the separation on the lip side was swallowed downstream, while the separation on the body side moved slightly upstream; then, the body-side separation moved downstream again so that the LSB flow mode was formed. This process corresponds to 0.5~2.5 ms in Figure 20a and region Ⅰ in Figure 20b. Then, the LSB flow mode was maintained for about 3 ms, which corresponds to 2.5~5.5 ms in Figure 20a and region Ⅱ in Figure 20b. After that, the LSB was also swallowed downstream in 2 ms—5.5~7 ms in Figure 20a and region Ⅲ in Figure 20b. From this, we can see that the vanishment of the DSBL could not be achieved in one stroke. The DSBL flow mode was converted to the intermediate form of the LSB flow mode at a small alpha first, and then the LSB continued to vanish if it could not be maintained. For Model/SB-2 (Figure 19b,d), the flow mode was converted from DSBL to LSB with the condition that the LSB could be maintained; so, the flow mode did not continue changing.
According to the analysis above, the critical alpha of LSB self-start is bigger than 5°, but the DSBL is maintained even if the alpha decreases to 2° at M0 = 5 for Model/SB-1, which indicates, to some extent, that the self-start performance of the LSB flow mode is better. Next, we examine the self-start performance of the DSBL flow mode at M0 = 6. Figure 21 displays the Schlieren images as alpha decreased after DSBL was induced at M0 = 6/alpha = 12° for Model/SB-1. As shown in these pictures, DSBL was maintained even when the alpha dropped to −3.5°. This reveals that DSBL is difficult to vanish via only increasing the Mach number. In other words, once DSBL is induced, the inlet cannot easily self-start unless the flow mode is converted into LSB.
The essence of the self-start of hypersonic inlets is the vanishment of separations near or in the inlet. As described above, three types of unstart modes of hypersonic inlets were analyzed in detail, from which the characteristics of the separation vanishing and inlet self-start were obtained. A summary of this is shown in Table 3.

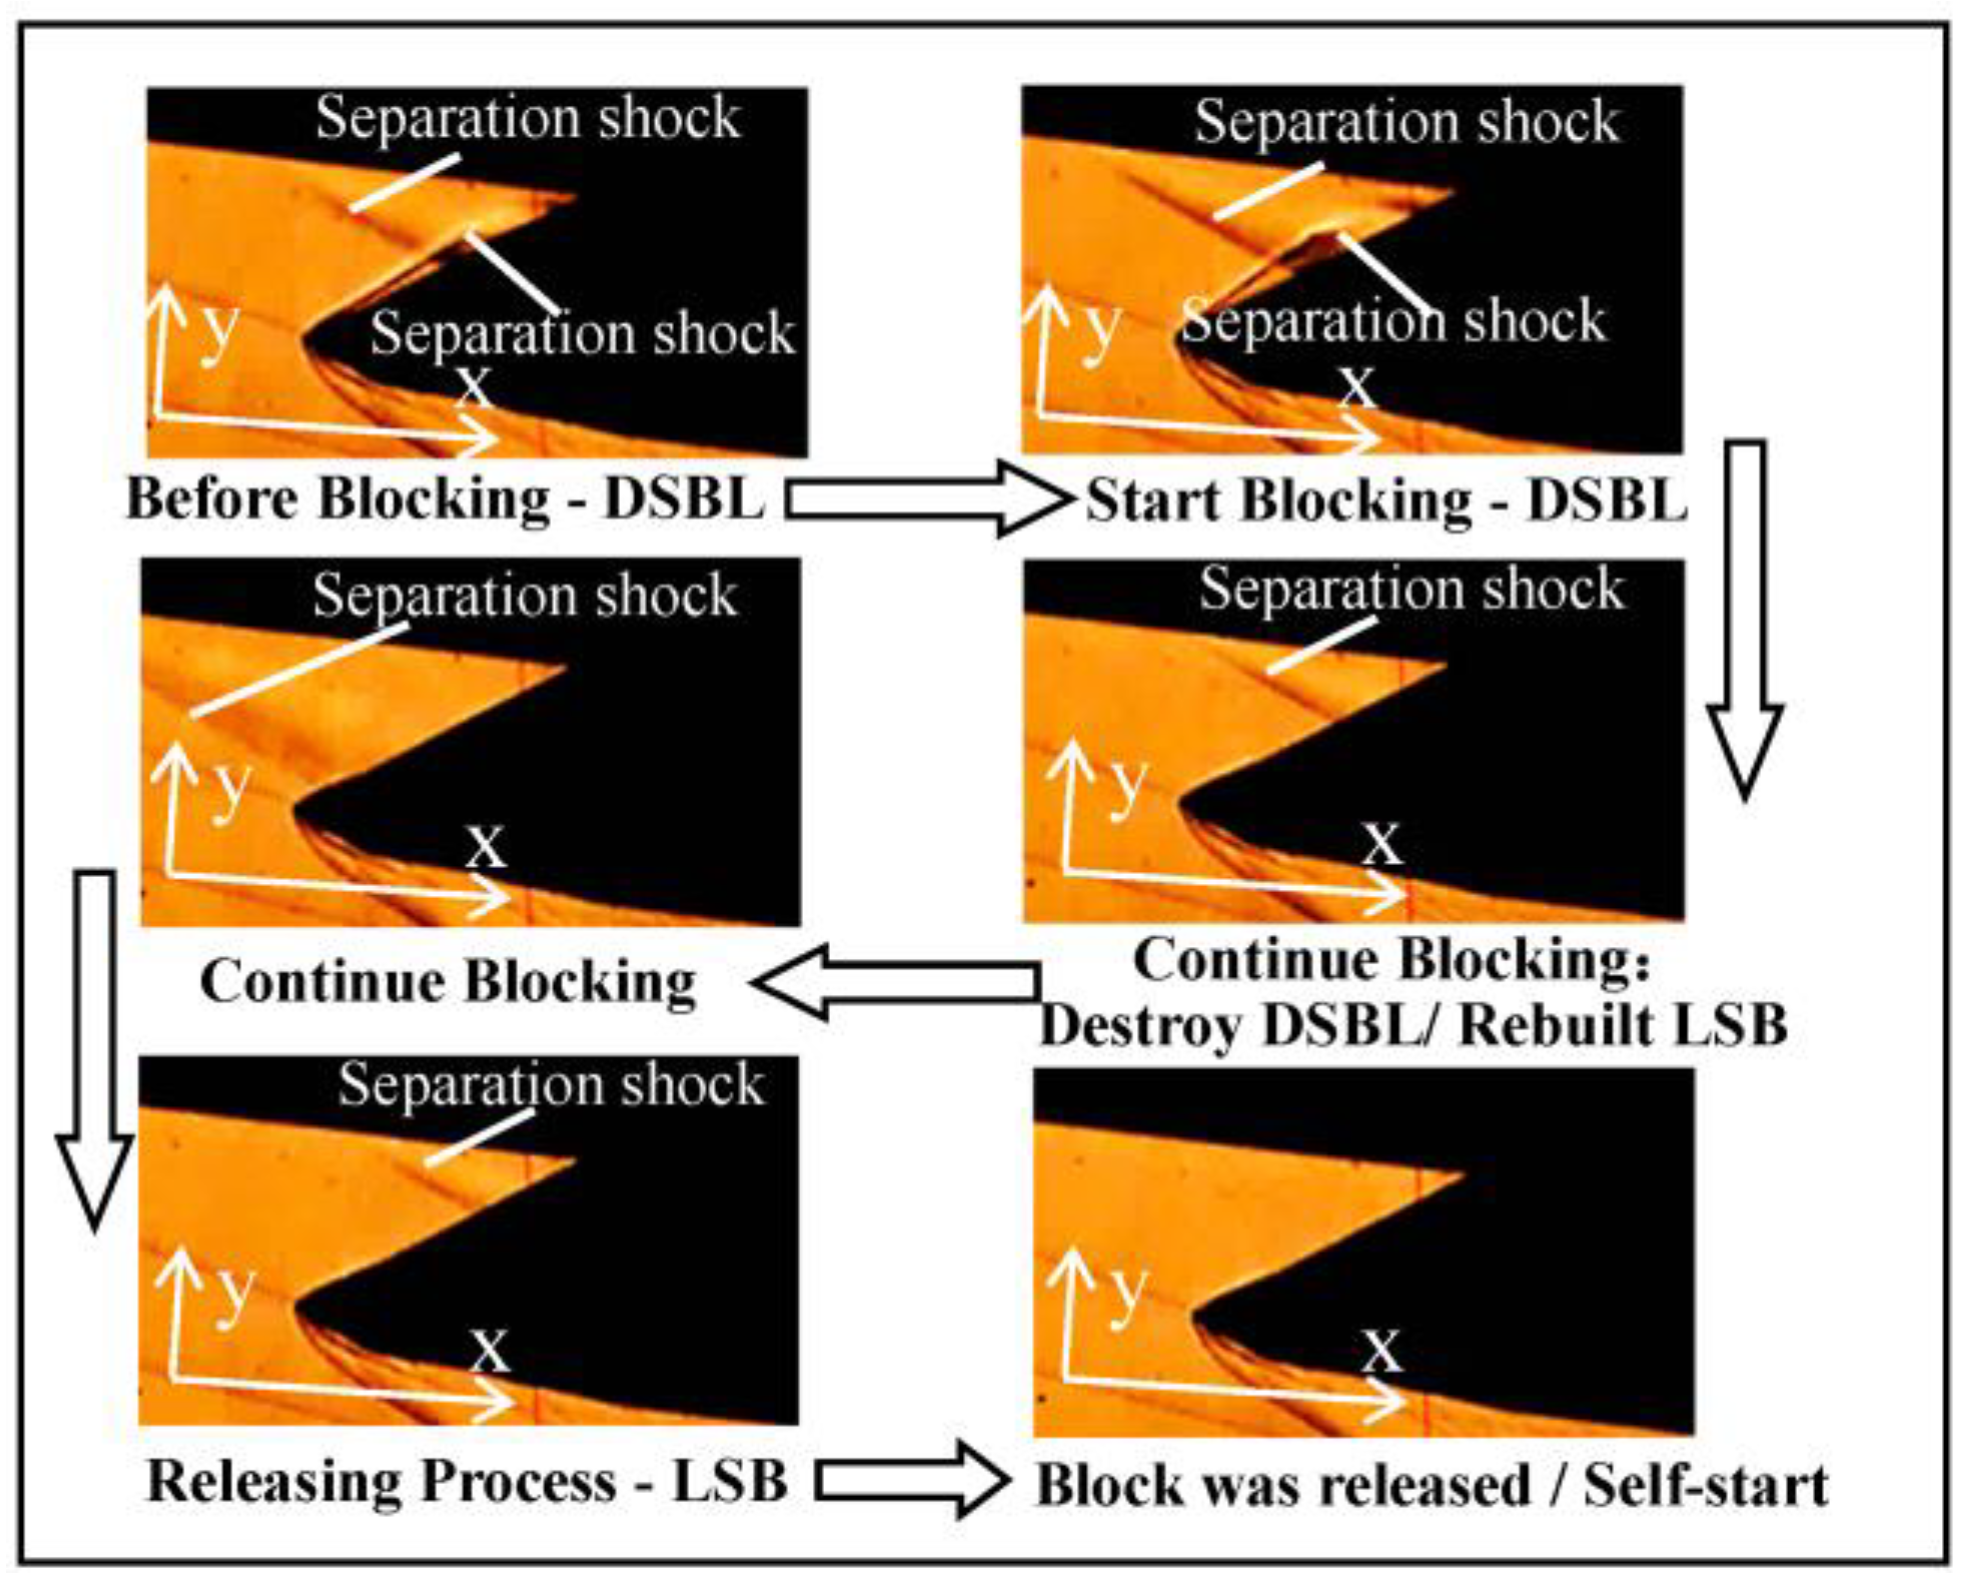
4. Improving Self-Start with “Flow Field Reconstruction Method”

As previously stated, the self-start characteristics of the DSBL flow mode are very unsatisfactory. Therefore, the theory of first eliminating this inferior unstart form and then reconstructing a new flow structure which is easy to self-start was taken into consideration. This tactic is named the Flow Field Reconstruction Method (FFRM), and the simplest way to destroy a flow mode is applying downstream back pressure (for example, by blocking the downstream channel).
Figure 22 shows the change in Schlieren images utilizing FFRM with an initial flow mode of DSBL unstart form—M0 = 5/alpha = 4°, Model/SB-1. Figure 23 is the variation in high-frequency pressure with time in this process. As shown in these figures, by continuing to block the downstream channel, the DSBL flow mode was eliminated and converted into LSB at the moment indicated by the blue arrow in Figure 23. At this time, the pressure dropped sharply. Then, the scale of the body-side separation was enlarged by continuously increasing the extent of the block of the downstream channel. The point indicated by the black arrow is the max extent of the block of the downstream channel, and after that, the process of releasing the downstream channel began. Self-start was achieved in this process, indicated by the green arrow.
Figure 24 shows the high-speed Schlieren images of releasing the downstream channel. It can be seen from these pictures that the whole process could be divided into countless quasi-stable states, and the body-side separation oscillated around a certain range in each quasi-state. However, for a large time span, the body-side separation dwindled with the oscillating process. At a certain moment, the inlet self-started and DSBL did not emerge in the whole process of releasing the downstream channel.

5. Flow Mechanism for the Poor Self-Start Ability of DSBL Flow Mode

Compared with the conventional unstart (LSB), the DSBL flow mode is a special unstart form whose self-start ability is far inferior. We have compared the flow characteristics of these two unstart modes to reveal the intrinsic mechanism of the poor self-start ability of the DSBL flow mode. We chose to study Model/SB-1.
First, we analyzed the LSB unstart mode. Figure 25 shows the comparison of flow structures and pressure distributions along the flow direction between the experiment and CFD calculation at M0 = 4/alpha = 0°. As shown in Figure 25, both CFD and experimental results clearly demonstrate the flow field structure, and their results are consistent. Among them, the CFD results display more detailed flow information.
Figure 26 depicts the flow structures (the Mach number contours and pressure contours) of different longitudinal sections for the LSB unstart mode (Z-c is the dimensionless width; Z-c = 0 and Z-c = 1 represent the plane of symmetry and the inner wall plane of the sideboard, respectively) based on the CFD results. In these contours, we can observe the overall detailed flow field structure of the LSB unstart mode. As shown, two vortexes of an equivalent scale were located in the separation from the symmetry plane. The flow structure in the longitudinal section of Z-c = 0.375 was similar to that of the symmetry plane. For the longitudinal sections of bigger Z-c, the body-side separation shrank as the Z-c increased. This regularity indicates that there was significant broadwise spillage deriving from the body-side large separation and flowing through the triangle window, which was formed by the sweepback sideboards and forebody. Figure 27 displays a spatial streamline from the body-side separation and through the longitudinal section of Z-c = 0.062, which exhibits flow characteristics of the body-side separation finely. Dense longitudinal vortexes were spread within a certain transversal span close to the symmetry plane. However, with the approach to sideboard where the flow direction points outward, longitudinal vortexes became increasingly sparse. In conclusion, the flow characteristics expressed in Figure 26 and Figure 27 are consistent.
We then analyzed the DSBL unstart mode. The comparison of flow structures and pressure distributions between the experiment and CFD calculation is shown in Figure 28 (at M0 = 4/alpha = 8°), and the results of both are also consistent.
The flow structures of different longitudinal sections for the DSBL flow mode based on the CFD results are shown in Figure 29. As seen from the symmetry plane in Figure 29a, two vortexes of an equivalent scale existed in the lip-side separation, while a single vortex was maintained around the position of the lip separation shock impact. Comparing the flow structures of different longitudinal sections, we found that the lip-side separation enlarged gradually as it approached the sideboard, while the body-side separation was diminished (although the enlargement trend in the lip-side separation in Figure 29b is not very distinct, it can clearly be seen in Figure 29a). This indicates that the broadwise spillage of the lip-side separation was very weak for the resistance of sideboards. On the other hand, the junction flow near the corner between the sideboards and lip made the separation flow more complex. As for the flow of the body side, separation could spill broadwise through that triangle window. Figure 30 displays two spatial streamlines which came from the body-side separation and lip-side separation, respectively, both through the longitudinal section of Z-c = 0.062. Firstly, the spatial streamline from the body side shows that there also was a tendency to flow outward in body-side separation. More than that, the density of longitudinal vortexes was much sparser compared with the LSB flow mode, which implies that the broadwise spillage was stronger. The reason for this difference has also been analyzed: the increase in the lip-side separation with the approach to sideboards would have squeezed the body-side separation, which enhanced the body-side broadwise spillage. Then, we observed the spatial streamline from the lip-side separation. As shown, longitudinal vortexes were distributed in a wide transversal span of lip-side separation, and finally the streamline pointed downstream. No broadwise spillage could be observed.
To sum up, the scale of separations on the body side could be diminished from broadwise spillage, both for the LSB flow mode and DSBL flow mode. As for lip-side separation, there was no broadwise spillage to promote separation vanishing, and the vanishment could only have been completed by being swallowed downstream. The concept of “opened separation” and “closed separation” could be analogized here. The opened separation with spillage which resembles the LSB flow mode can self-start easily, while the closed separation without spillage which has the characteristics of lip-side separation cannot easily self-start. Therefore, the self-start ability of DSBL is poor.

6. Conclusions

The essence of the self-start of hypersonic inlets is the vanishment of separations near or in the inlet. Experiments were conducted to reveal the self-start characteristics of three distinct types of unstart modes of the hypersonic inlet (flow modes SSB, LSB, and DSBL). After that, a “Flow Field Reconstruction Method” was used to improve the self-start ability of the DSBL flow mode (which is the most difficult to self-start). Finally, the intrinsic flow mechanism of the poor self-start performance of the DSBL unstart form was revealed via CFD calculation. The main achievements of this study are as follows:
(1)
Shock boundary-layer interaction is the main factor inducing the SSB flow mode. This flow mode appears when at a small alpha, and self-start is achieved as the alpha is increased. This kind of self-start takes about 4~5 ms, and the small body-side separation noticeably dwindles as it approaches the transition point.
(2)
The combined action of congestion in the inlet throat and shock boundary-layer interaction is thought to be the cause of the LSB unstart mode. Both acceleration and a decreasing alpha contribute to the vanishing of LSB, which takes about 2 ms. If LSB vanishing occurs at a small alpha, a remnant of LSB may form the SSB flow mode, and self-start can subsequently be achieved by increasing the alpha. Conversely, self-start can be achieved directly.
(3)
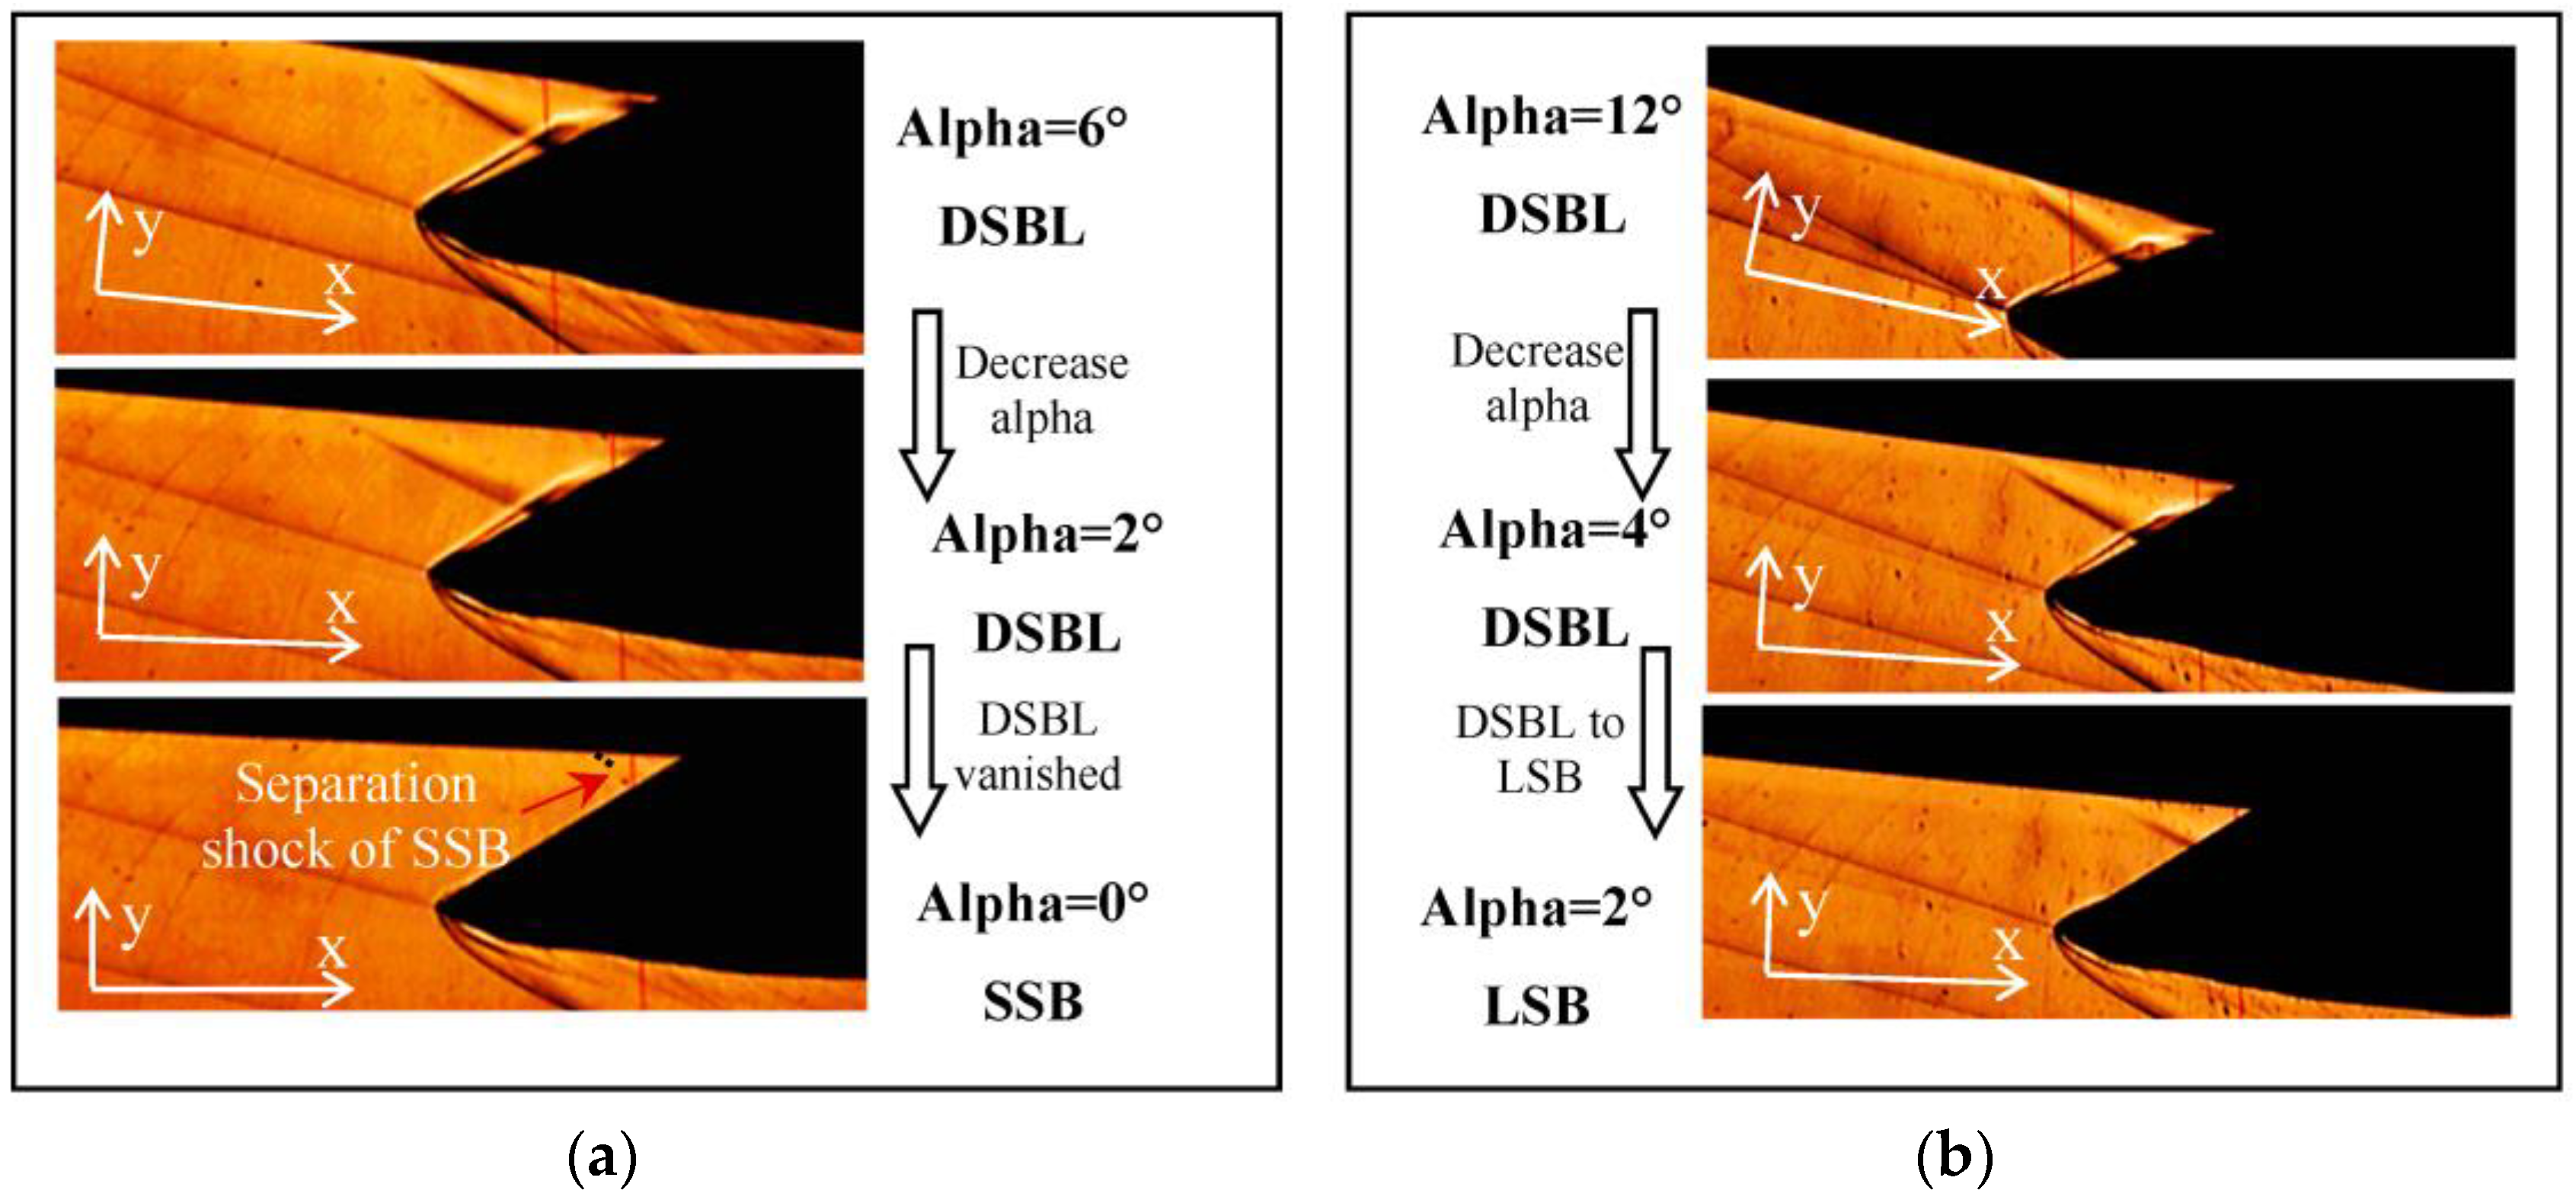
Separations of the DSBL unstart mode are difficult to vanish directly. Thus, self-start is hard to achieve only through acceleration. Because a decreasing alpha contributes to the flow mode transformation from DSBL to LSB (the time consumed is about 2 ms), self-start may be achieved via the following path: the prompt flow mode being converted into the intermediate form of LSB at first, and then achieving self-start.
(4)
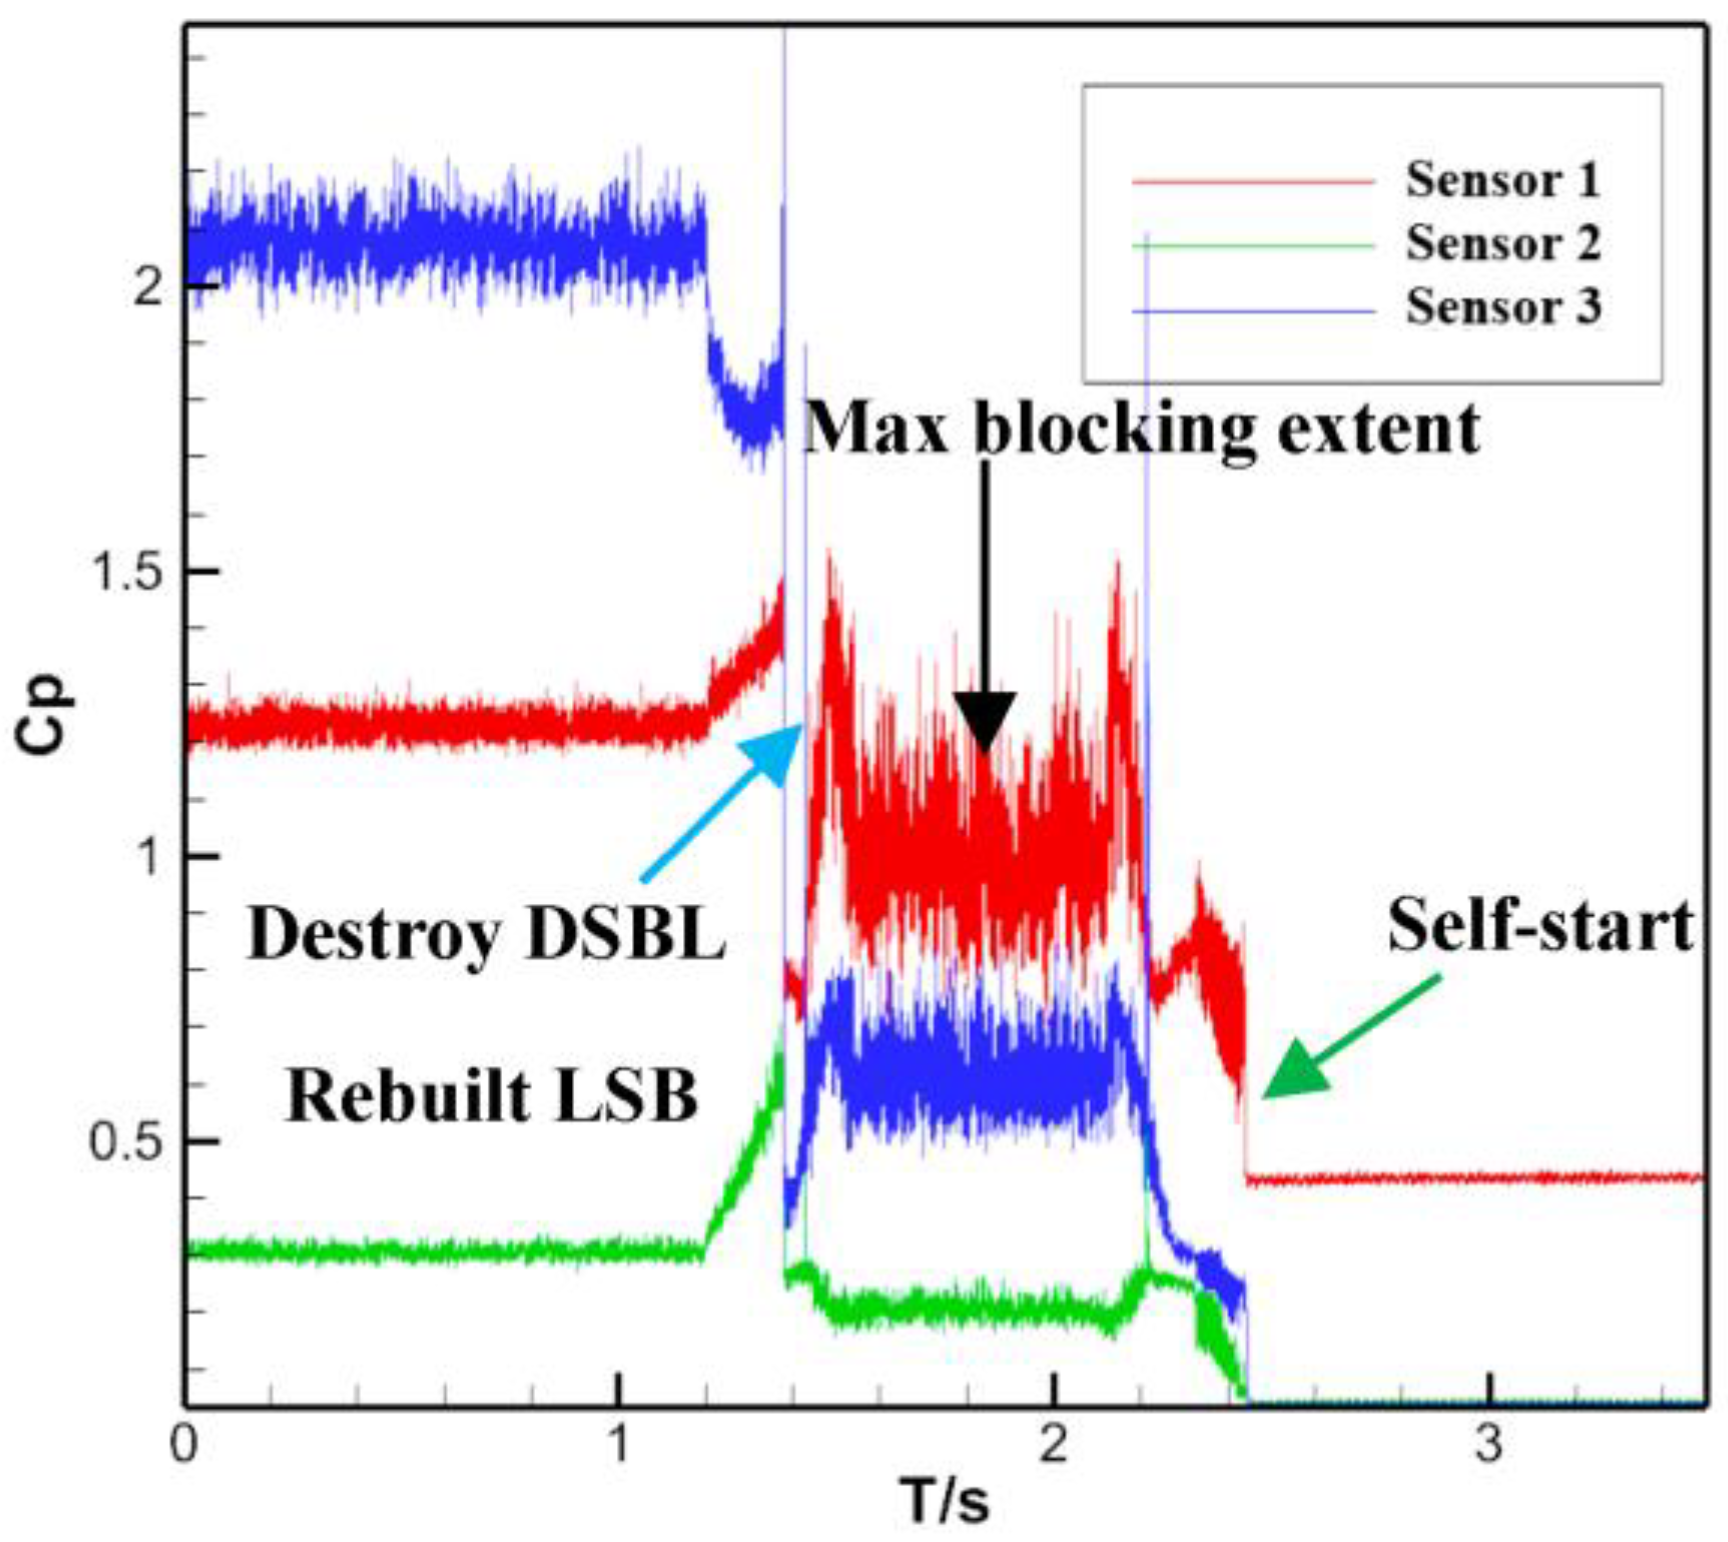
The stable flow structure of DSBL at M0 = 5/alpha = 4° (Model/SB-1) was eliminated by blocking the downstream channel, and then the LSB flow mode was reconstructed. Self-start was subsequently achieved in the process of releasing the downstream channel. This self-start improvement method is named the “Flow Field Reconstruction Method”.
(5)
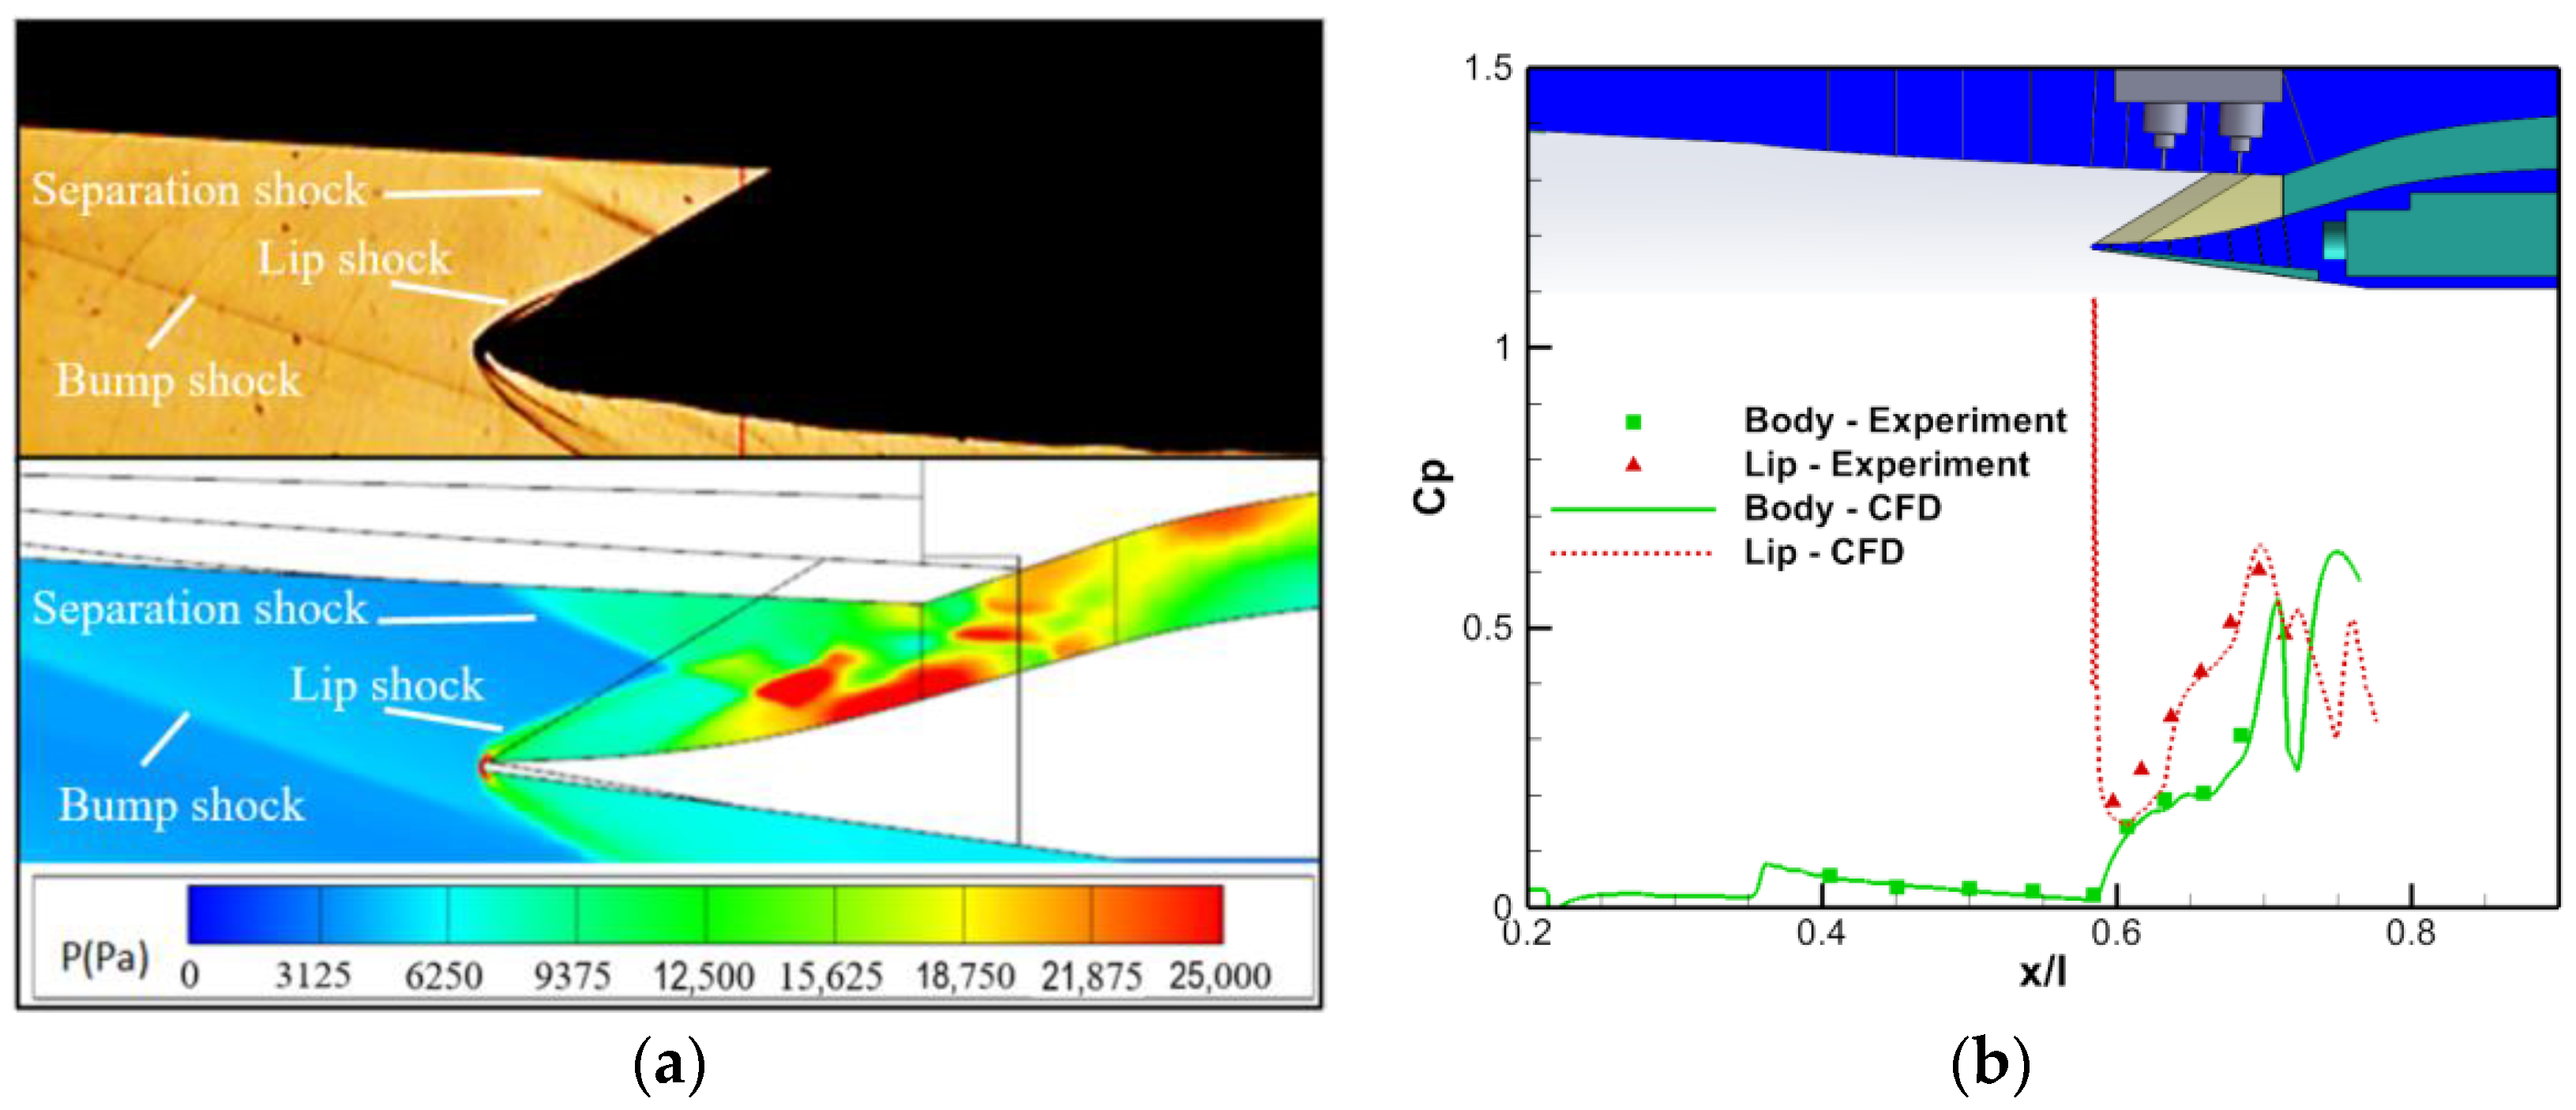
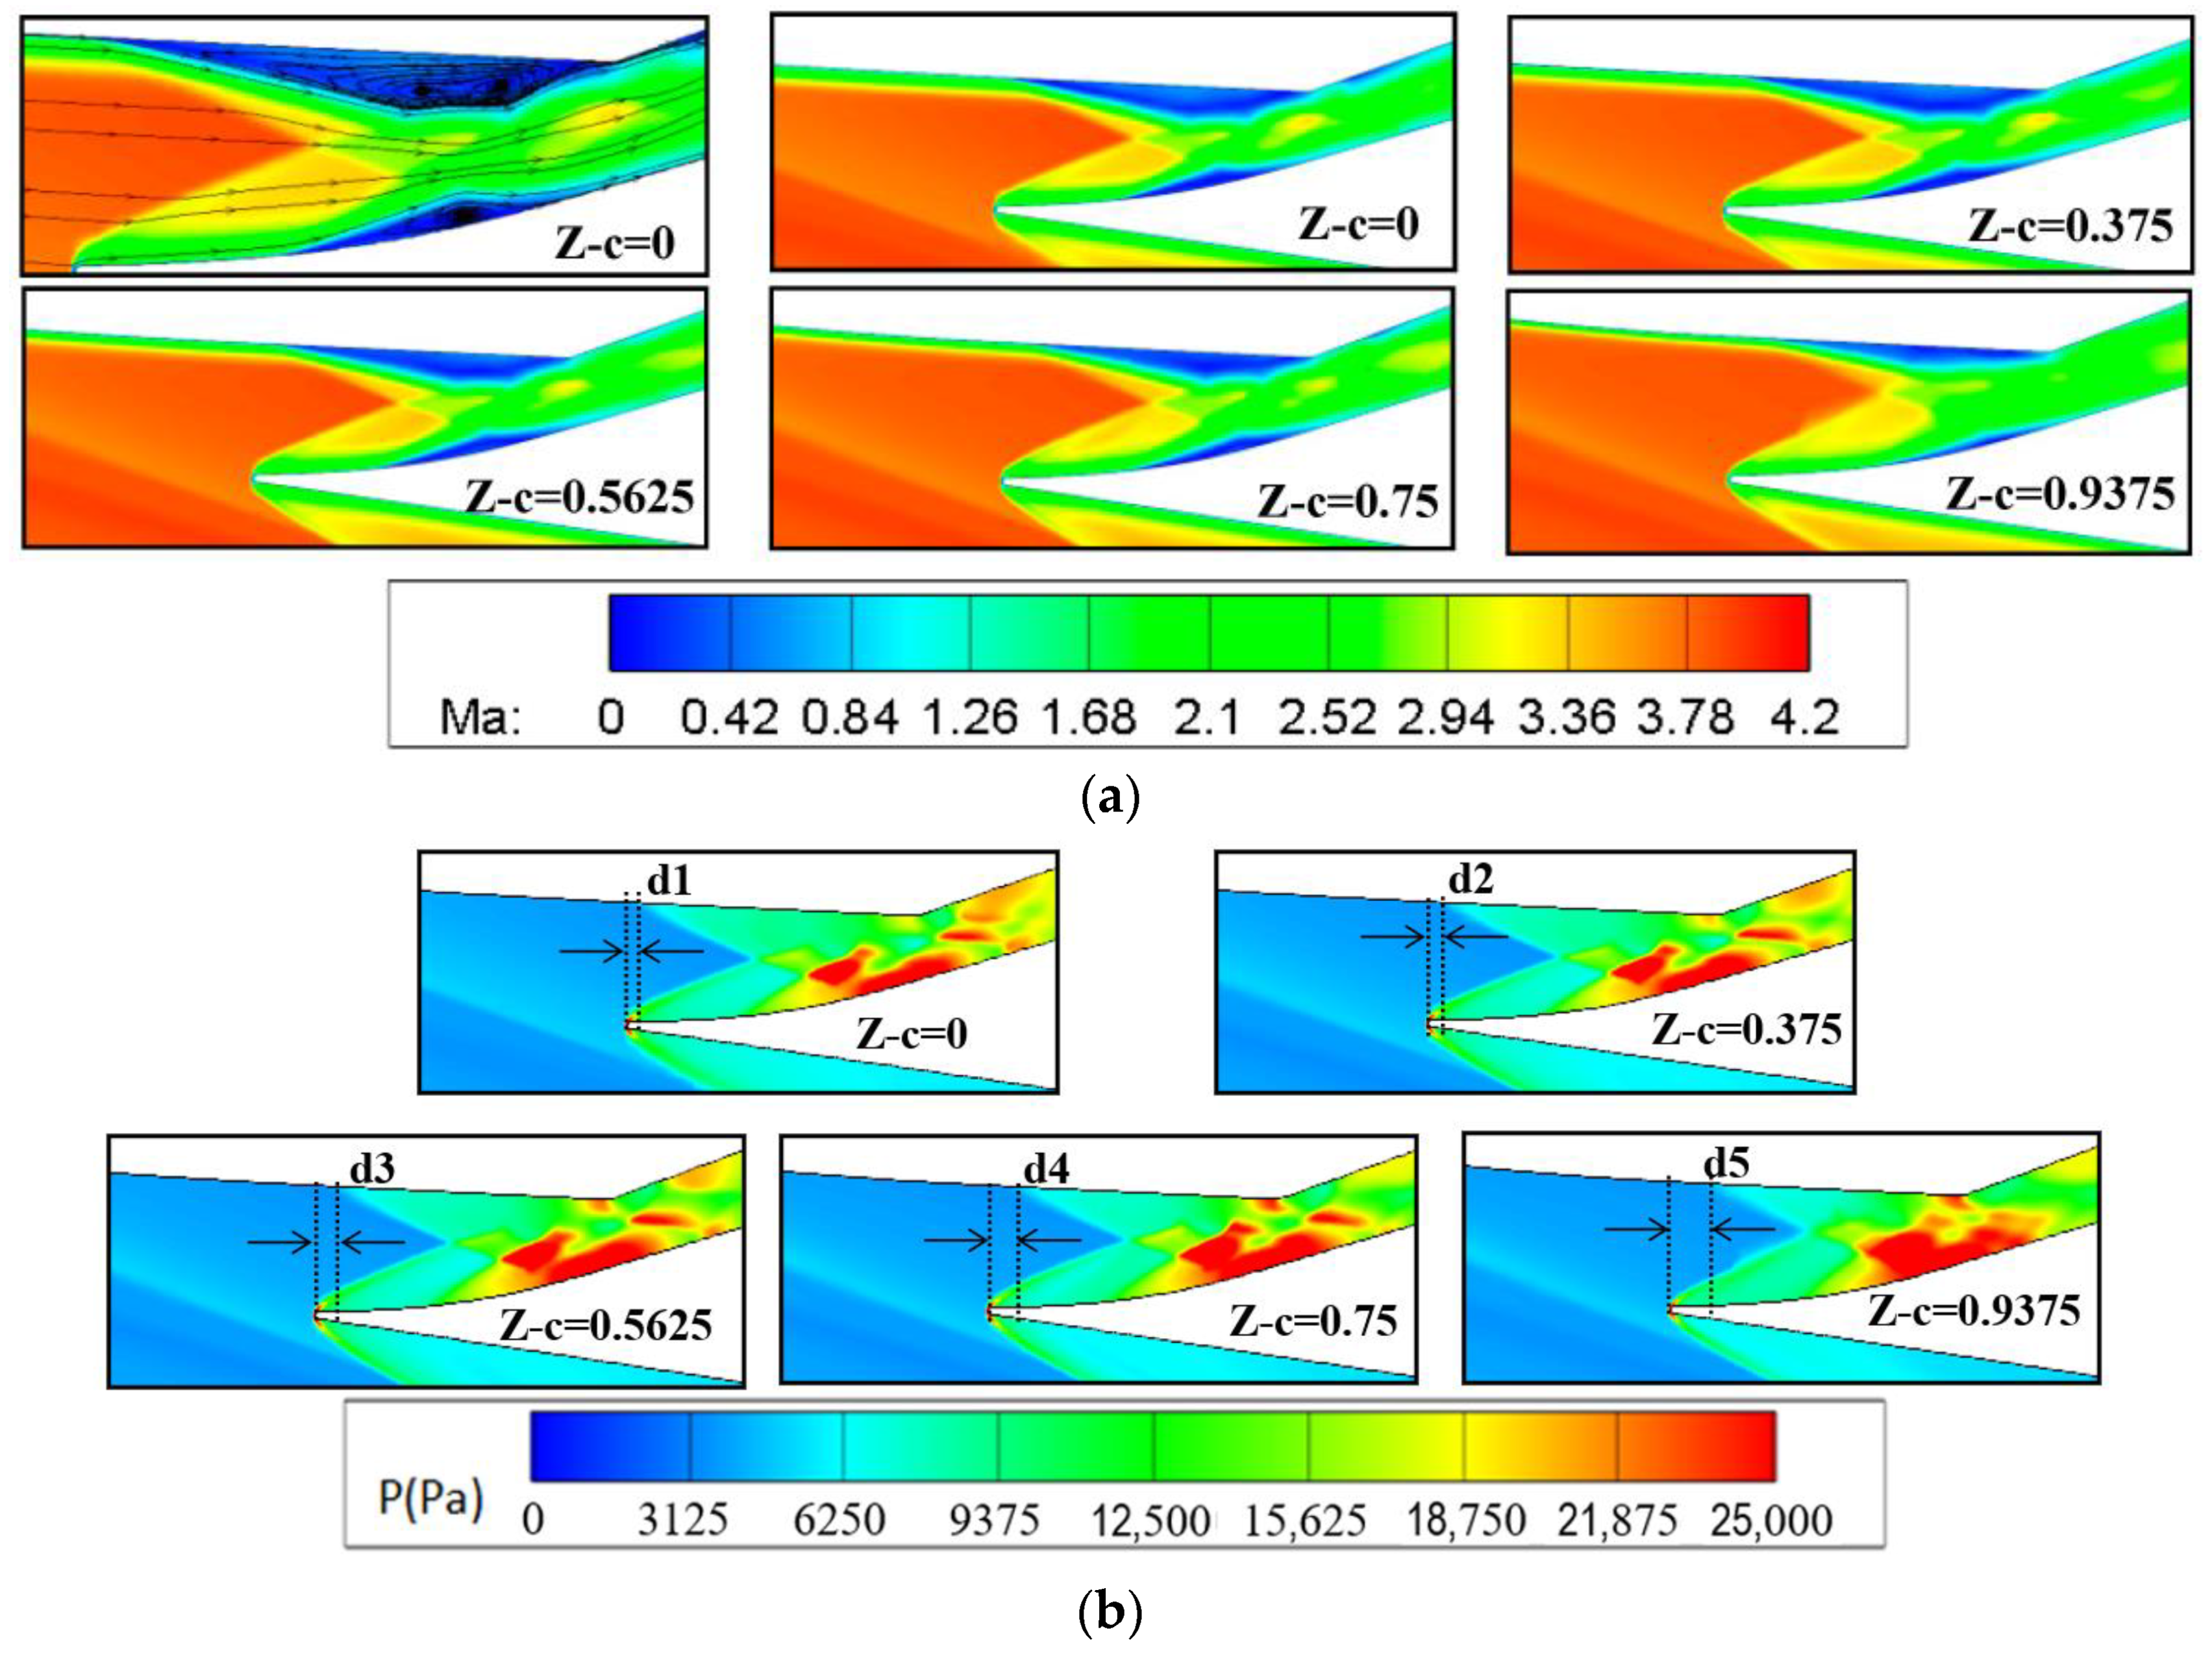
Detailed flow characteristics of the LSB and DSBL flow modes were revealed via the CFD calculation, from which the reason for the poor self-start performance of the DSBL flow mode was deduced: the vanishment of lip-side separation cannot benefit from broadwise spillage with the resistance of sideboards. Regardless, large-scale separation on the lip side is very difficult to vanish only by swallowing downstream.
Because of a strong shock boundary-layer interaction and significant three-dimensional flow, the flow problems of a hypersonic inlet are very complex. Thus, multiple unstart modes were induced, which made the self-start characteristics of hypersonic inlets extremely intricate, and classical double-solution theory was no longer applicable. Based on this, the self-start characteristics of a hypersonic inlet with the existence of multiple unstart modes were revealed in this study. As for the worst unstart form, the DSBL flow mode, the mechanisms of this mode’s poor self-start performance and self-start improving method were explored. Therefore, this study is very innovative; it not only expands the theory of start problems but also has great significance in guiding the engineering design of hypersonic inlets.

Author Contributions

X.T.: Investigation (lead); Formal analysis (lead); Methodology (lead); Writing—original draft (lead); Writing—review and editing (lead). B.X.: Project administration (lead); Funding acquisition (supporting); Formal analysis (supporting); Writing—review and editing (supporting); X.F.: Funding acquisition (lead); Conceptualization (lead); Supervision (lead); L.W.: Methodology (supporting); Writing—original draft (supporting). All authors have read and agreed to the published version of the manuscript.

Funding

National Natural Science Foundation of China [11872071;12102470]; NUDT Research Project [ZK20-05].

Institutional Review Board Statement

Not applicable.

Informed Consent Statement

Not applicable.

Data Availability Statement

The data that support the findings of this study are available from the corresponding authors upon reasonable request.

Acknowledgments

This study was financed by the National Natural Science Foundation of China [11872071;12102470] and the NUDT Research Project [ZK20-05]. The authors would like to give thanks to the funding committees.

Conflicts of Interest

The authors declare no potential conflict of interest with respect to the research, authorship, and/or publication of this article.

References

  1. Sziroczak, D.; Smith, H. A review of design issues specific to hypersonic flight vehicles. Prog. Aerosp. Sci. 2016, 84, 1–28. [Google Scholar] [CrossRef]
  2. Chang, J.T.; Li, N.; Xu, K.J.; Bao, W.; Yu, D.R. Recent research progress on unstart mechanism, detection and control of hypersonic inlet. Prog. Aerosp. Sci. 2017, 89, 1–22. [Google Scholar] [CrossRef]
  3. Shimura, T.; Mitani, T.; Sakuranaka, N.; Izumikawa, M. Load oscillations caused by unstart of hypersonic wind tunnels and engines. J. Propuls. Power 1998, 14, 348–353. [Google Scholar] [CrossRef]
  4. Kantrowitz, A.; Donaldson, C. Preliminary Investigation of Supersonic Diffuser; WRL-713; NACA: Edwards, CA, USA, 1945. [Google Scholar] [CrossRef]
  5. Van Wie, D.M.; Kwok, F.T.; Walsh, R.F. Starting Characteristics of Supersonic Inlets; AIAA: Las Vegas, NV, USA, 1996; p. 2914. [Google Scholar]
  6. Im, S.; Do, H. Unstart phenomena induced by flow choking in scramjet inlet-isolators. Prog. Aerosp. Sci. 2018, 97, 35–60. [Google Scholar] [CrossRef]
  7. Saravanan, R.; Desikan, S.L.N.; Francise, K.J.; Kalimuthu, R. Experimental investigation of start/unstart process during hypersonic intake at Mach 6 and its control. Aerosp. Sci. Technol. 2021, 113, 106688. [Google Scholar] [CrossRef]
  8. Liu, X. Investigation on Start Process of Hypersonic Inlets and Flow Mechanism in Isolators. Ph.D. Thesis, National University of Defense Technology, Changsha, China, 2016. [Google Scholar]
  9. Sekar, K.R.; Karthick, S.K.; Jegadheeswaran, S.; Kannan, R. On the unsteady throttling dynamics and scaling analysis in a typical hypersonic inlet-isolator flow. Phys. Fluids 2020, 32, 126104. [Google Scholar] [CrossRef]
  10. Xu, S.C.; Wang, Y.; Wang, Z.G.; Fan, X.Q.; Xiong, B. Experimental investigations of hypersonic inlet unstart/restart process and hysteresis phenomenon caused by angle of attack. Aerosp. Sci. Technol. 2022, 126, 107621. [Google Scholar] [CrossRef]
  11. Zhang, Q.F.; Chen, H.; Wu, Z.J.; Gao, Z.B.; Luo, W.H.; Gu, H.B.; Yue, L.J. Experimental investigation of combustion-induced starting hysteresis in the scramjet. Phys. Fluids 2022, 34, 096103. [Google Scholar] [CrossRef]
  12. Timofeev, E.V.; Tahir, R.B.; Mölder, S. On Recent Development Related to Flow Staring in Hypersonic AIR Intakes; AIAA: Las Vegas, NV, USA, 2008; p. 2512. [Google Scholar]
  13. Siqueira, J.V.M.B.; Rosa, M.A.P.; Ribeiro, G.B. Numerical evaluation of effects of the isolator height and the leading-edge bluntness on a scramjet inlet. J. Braz. Soc. Mech. Sci. Eng. 2020, 42, 1–13. [Google Scholar] [CrossRef]
  14. Hawkins, W.; Marquart, E. Two-Dimensional Generic Inlet Unstart Detection at Ma 2.5–5.0; AIAA: Las Vegas, NV, USA, 1995; p. 6019. [Google Scholar] [CrossRef]
  15. James, J.K.; Kim, H.D. Flow characteristics of a mixed compression hypersonic intake. J. Appl. Fluid Mech. 2022, 15, 633–644. [Google Scholar] [CrossRef]
  16. Jana, T.; Thillaikumar, T.; Kaushik, M. Assessment of cavity covered with porous surface in controlling shock/boundary-layer interactions in hypersonic intake. Int. J. Aeronaut. Space Sci. 2020, 21, 924–941. [Google Scholar] [CrossRef]
  17. Lee, J.; Kang, S.H. Numerical study on the start and unstart phenomena in a scramjet inlet-isolator model. PLoS ONE 2019, 14, e0224994. [Google Scholar] [CrossRef] [PubMed]
  18. Chen, H.; Tan, H.J.; Zhang, Q.F.; Zhang, Y. Throttling process and buzz mechanism of a supersonic inlet at overspeed mode. AIAA J. 2018, 56, 1953–1964. [Google Scholar] [CrossRef]
  19. Wang, Y. Investigation on the Starting Characteristics of Hypersonic Inlet. Ph.D. Thesis, National University of Defense Technology, Changsha, China, 2008. [Google Scholar]
  20. Zhou, Y.F.; Xu, S.C.; Wang, Y. Effects of cowl lip angle on starting performances for a mixed-compression two-dimensional axisymmetric hypersonic inlet. Appl. Sci. 2022, 12, 7127. [Google Scholar] [CrossRef]
  21. Jin, Y.; Sun, S.; Tan, H.J.; Zhang, Y.; Huang, H.X. Flow response hysteresis of throat regulation process of a two-dimensional mixed-compression supersonic inlet. Chin. J. Aeronaut. 2022, 35, 112–127. [Google Scholar] [CrossRef]
  22. Wu, J.; Yu, A.Y.; He, Y.Y.; Le, J.L. Self-starting simulation of a hypersonic inlet with variable free stream condition. J. Appl. Fluid Mech. 2020, 13, 1683–1691. [Google Scholar] [CrossRef]
  23. Huo, C.; Yang, Z.H.; Zhang, Z.Z.; Liu, P.J. Numerical analysis on the conceptual design of an air-breathing engine inlet working in mach number 3~5.5. Proc. Inst. Mech. Eng. Part G J. Aerosp. Eng. 2022, 236, 294–307. [Google Scholar] [CrossRef]
  24. Xu, S.C.; Wang, Y.; Wang, Z.G.; Fan, X.Q.; Xiong, B. Effects of bump parameters on hypersonic inlet starting performance. J. Zhejiang Univ. Sci. A 2022, 23, 807–819. [Google Scholar] [CrossRef]
  25. Hohn, O.; Gülhan, A. Experimental Investigation on the Influence of Sidewall Compression on the Flowfield of a Scramjet Inlet at Mach 7; AIAA: Las Vegas, NV, USA, 2011; p. 2350. [Google Scholar] [CrossRef]
  26. Jia, Y.L.; Zhang, Q.F.; Tong, X.T.; Yue, L.J.; Zhang, X.Y. Effect of the inlet internal compression shock waves on restart characteristics of the hypersonic inlets. J. Exp. Fluid Mech. 2019, 33, 60–67. [Google Scholar] [CrossRef]
  27. Devaraj, M.K.K.; Jutur, P.; Rao, S.M.; Jagadeesh, G.; Anavardham, G.T.K. Experimental investigation of unstart dynamics driven by subsonic spillage in a hypersonic scramjet intake at Mach6. Phys. Fluids 2020, 32, 026103. [Google Scholar] [CrossRef]
  28. Berto, F.; Benini, E.; Wyatt, C.; Quinn, M.K. Time-accurate experimental investigation of hypersonic inlet buzz at Mach5. AIAA J. 2020, 58, 2197–2205. [Google Scholar] [CrossRef]
  29. Xie, W.Z.; Yi, J.; Ge, Y.; Yang, S.Z.; Zeng, C.; Guo, S.M. Feasibility of employing the restarting process to evaluate the self-starting ability for hypersonic inlets. Aerosp. Sci. Technol. 2020, 107, 106347. [Google Scholar] [CrossRef]
  30. Chang, J.T.; Lei, W.; Qin, B.; Bao, W.; Yu, D.R. Real-time unstart prediction and detection of hypersonic inlet based on recursive Fourier transform. Proc. Inst. Mech. Eng. Part G J. Aerosp. Eng. 2015, 229, 772–778. [Google Scholar] [CrossRef]
  31. Molder, S.; Timofeev, E.; Tahir, R. Flow Starting in High Compression Hypersonic Air Inlets by Mass Spillage; AIAA: Las Vegas, NV, USA, 2004; p. 4130. [Google Scholar]
  32. Veillard, X.; Timofeev, R.T.E.; Molder, S. Limiting contractions for starting simple ramp-type scramjet intakes with overboard spillage. J. Propul. Power 2008, 24, 1042–1049. [Google Scholar] [CrossRef]
  33. Xie, W.Z.; Ma, G.F.; Guo, R.W.; Chen, H.; Wen, Y.F. Flow-based prediction for self-starting limit of two-dimensional hypersonic inlets. J. Propul. Power 2016, 32, 1–9. [Google Scholar] [CrossRef]
  34. Tao, Y. The Study of the Shock Wave/Boundary Layer Interactions in Hypersonic Inlet. Ph.D. Thesis, National University of Defense Technology, Changsha, China, 2018. [Google Scholar] [CrossRef]
  35. Zhang, W.L.; Shi, Z.W.; Zhang, C.H.; Geng, X.; Li, K.L.; Chen, Z. A study on flow control in a hypersonic inlet using a plasma synthetic jet actuator. Phys. Fluids 2022, 34, 106109. [Google Scholar] [CrossRef]
  36. Devaraj, M.K.K.; Jutur, P.; Rao, S.M.; Anavardham, G.T.K. Investigation of local unstart in a hypersonic scramjet intake at a Mach number of 6. Aerosp. Sci. Technol. 2021, 115, 106789. [Google Scholar] [CrossRef]
  37. Tao, Y.; Liu, W.D.; Fan, X.Q.; Zhao, Y.L. Structural characteristics of the shock-induced boundary layer separation extended to the leading edge. Phys. Fluids 2017, 29, 071701. [Google Scholar] [CrossRef]
  38. Jiao, X.L. Research on Hypersonic Inlet Unstart Multimodes and Mode Transition. Ph.D. Thesis, Harbin Institute of Technology, Harbin, China, 2017. [Google Scholar]
  39. Jiao, X.L.; Chang, J.T.; Wang, Z.Q.; Yu, D.R. Hysteresis phenomenon of hypersonic inlet at high Mach number. Acta Astronaut. 2016, 128, 657–668. [Google Scholar] [CrossRef]
  40. Jiao, X.L.; Chang, J.T.; Wang, Z.Q.; Yu, D.R. Investigation of hypersonic inlet pulse-starting characteristics at high Mach number. Aerosp. Sci. Technol. 2016, 58, 427–436. [Google Scholar] [CrossRef]
  41. Knight, D.; Longo, J.; Drikakis, D.; Lani, A.; Nompelis, I.; Reimann, B.; Walpot, L. Assessment of CFD capability for prediction of hypersonic shock interactions. Prog. Aerosp. Sci. 2012, 48, 8–26. [Google Scholar] [CrossRef]
  42. Cravero, C.; De Domenico, D.; Marsano, D. Uncertainty Quantification Analysis of Exhaust Gas Plume in a Crosswind. Energies 2023, 16, 3549. [Google Scholar] [CrossRef]
  43. Cravero, C.; De Domenico, D.; Marsano, D. The Use of Uncertainty Quantification and Numerical Optimization to Support the Design and Operation Management of Air-Staging Gas Recirculation Strategies in Glass Furnaces. Fluids 2023, 8, 76. [Google Scholar] [CrossRef]
  44. Xia, L.; Zou, Z.J.; Wang, Z.H.; Zou, L.; Gao, H. Surrogate model based uncertainty quantification of CFD simulations of the viscous flow around a ship advancing in shallow water. Ocean. Eng. 2021, 234, 109206. [Google Scholar] [CrossRef]
  45. Cortesi, A.; Constantine, P.; Magin, T.; Congedo, P.M. Forward and backward uncertainty quantification with active subspaces: Application to hypersonic flows around a cylinder. J. Comput. Phys. 2020, 407, 109079. [Google Scholar] [CrossRef]
  46. Burt, J.M.; Josyula, E. Global Sensitivity Analysis and Uncertainty Quantification for a Hypersonic Shock Interaction Flow. J. Thermophys. Heat Transf. 2015, 29, 439–449. [Google Scholar] [CrossRef]
  47. Burt, J.M.; Josyula, E.; Blankson, I.M. DSMC-based uncertainty quantification for a hypersonic shock interaction flow. In Proceedings of the 28th International Symposium on Rarefied Gas Dynamics, Zaragoza, Spain, 9–13 July 2012; Volume 1501, pp. 573–578. [Google Scholar] [CrossRef]
  48. Tang, X.; Fan, X.Q.; Xiong, B.; Chen, L.; Chen, J.F. Study of multiple solution phenomenon for hypersonic air inlet. Aerosp. Sci. Technol. 2023, 136, 108236. [Google Scholar] [CrossRef]
  49. Prasad, T.G.; Kumar, G.D.; Patel, R.; Mounika, C.; Shankar, D.G. Computational Analysis of 2D Transition Inlets for Supersonic Capture. IJVSS 2022, 14, 68–74. [Google Scholar] [CrossRef]
  50. Deng, R.; Jin, Y.; Kim, H.D. Numerical simulation of the unstart process of dual-mode scramjet. Heat Mass Transf. 2017, 105, 394–400. [Google Scholar] [CrossRef]
  51. Jintu, K.J.; Abhilash, S.; Dong, K.H. Buzz characteristics and separation bubble dynamics in supersonic intake. Aerosp. Sci. Technol. 2021, 115, 106795. [Google Scholar] [CrossRef]
  52. Bai, B.H.; Li, X.D. Improvement of airfoil turbulent trailing-edge noise semi-empirical prediction formulation. J. Beijing Univ. Aeron. Astron. 2017, 43, 86–92. [Google Scholar] [CrossRef]
Figure 1. Experiment model: aircraft with integrated forebody and a 2D air inlet—sideboards 1 (SB-1). (a) Three-dimensional digital model of the experiment model—sideboards 1 (SB-1). (b) Photograph of the experiment model installed in wind tunnel.
Applsci 13 09752 g001aApplsci 13 09752 g001b
Figure 2. Installation photos of sideboards. (a) SB-1—nominal internal contraction ratio 1.485. (b) SB-2—nominal internal contraction ratio 1.557.
Applsci 13 09752 g002
Figure 3. Wind tunnel system of this experiment.
Applsci 13 09752 g003
Figure 4. Computational domain, CFD grid, and boundary condition. (a) Computational domain/boundary condition. (b) Wall grid. (c) Boundary-layer grid. (d) Space grid.
Applsci 13 09752 g004
Figure 5. Wall Y-plus contours from the above CFD method—Model/SB-1 at the status of M0 = 4/alpha = 0°, LSB flow mode.
Applsci 13 09752 g005
Figure 6. Schlieren images of three different types of unstart mode—LSB, SSB, and DSBL [48]. (a) LSB—M0 = 4, alpha = 0°; (b) SSB—M0 = 4, alpha = 0°; (c) DSBL—M0 = 4, alpha = 4°.
Applsci 13 09752 g006
Figure 7. Schlieren images of forming SSB flow mode by blocking and then releasing downstream channel gradually—M0 = 5/alpha = 0°; Mode/SB-1.
Applsci 13 09752 g007
Figure 8. Schlieren images of self-start process for SSB flow mode—M0 = 5. (a) Model/SB-1. (b) Model/SB-2.
Applsci 13 09752 g008
Figure 9. Pressure distributions of self-start process for SSB flow mode—M0 = 5. (a) Model/SB-1. (b) Model/SB-2.
Applsci 13 09752 g009
Figure 10. Cp-T (pressure coefficient–time). Curves—process of inducing SSB and self-starting.
Applsci 13 09752 g010
Figure 11. Maintenance of LSB flow mode and the transformation from LSB to DSBL flow mode—M0 = 4. (a) Model/SB-1, Schlieren images. (b) Model/SB-2, Schlieren images.
Applsci 13 09752 g011
Figure 12. Vanishment of the LSB in the process of decreasing alpha—Model/SB-2—M0 = 5. (a) Schlieren images. (b) Pressure distributions.
Applsci 13 09752 g012
Figure 13. Transient process of the LSB vanishing when alpha decreased from 2° to 0°—Model/SB-2—M0 = 5. (a) Transient Schlieren images of the LSB vanishing. (b) High-frequency pressure curves of the LSB vanishing.
Applsci 13 09752 g013
Figure 14. Schlieren images of blocking and then releasing downstream channel—Model/SB-1—M0 = 4. (a) Blocking/releasing at small degree of alpha. (b) Blocking/releasing at medium degree of alpha.
Applsci 13 09752 g014
Figure 15. Schlieren images of seeking the critical status for LSB vanishing—Model/SB-2—M0 = 5.
Applsci 13 09752 g015
Figure 16. Pressure distributions of seeking the critical status for LSB vanishing—Model/SB-2—M0 = 5.
Applsci 13 09752 g016
Figure 17. Pressure distribution before and after blocking/releasing downstream channel—Model/SB-1—M0 = 5.
Applsci 13 09752 g017
Figure 18. Schlieren images of blocking/releasing downstream channel—Model/SB-1—M0 = 5. (a) M0 = 5/alpha = 5°—self-start. (b) M0 = 5/alpha = 6°—form DSBL.
Applsci 13 09752 g018
Figure 19. Maintenance of DSBL flow mode and the flow mode transformation—M0 = 5. (a) Model/SB-1—Schlieren images. (b) Model/SB-2—Schlieren images. (c) Model/SB-1—pressure distributions. (d) Model/SB-2—pressure distributions.
Applsci 13 09752 g019aApplsci 13 09752 g019b
Figure 20. Transient process of the DSBL vanishing when alpha decreased from 2° to 0°—Model/SB-1—M0 = 5. (a) Transient Schlieren images of the DSBL vanishing. (b) High-frequency pressure curves of the DSBL vanishing.
Applsci 13 09752 g020
Figure 21. Maintaining of DSBL flow mode—Model/SB-1—M0 = 6.
Applsci 13 09752 g021
Figure 22. Self-start process of FFRM—Schlieren images. (Model/SB-1 at the status of M0 = 5/alpha = 4°).
Applsci 13 09752 g022
Figure 23. Self-start process of FFRM—pressure variations. (Model/SB-1 at the status of M0 = 5/alpha = 4°).
Applsci 13 09752 g023
Figure 24. Transient process of releasing downstream channel—Schlieren images. (Model/SB-1 at the status of M0 = 5/alpha = 4°).
Applsci 13 09752 g024
Figure 25. Comparison of results between experiment and CFD calculation—LSB unstart mode. (a) Comparison of flow structures (Schlieren image and pressure contour of symmetry plane). (b) Comparison of pressure distributions along flow direction.
Applsci 13 09752 g025
Figure 26. Flow structures of different longitudinal sections—Model/SB-1 at the status of M0 = 4/alpha = 0°, LSB flow mode. (a) Mach number contours. (b) Pressure contours (d1 ≤ d2 < d3 < d4 < d5).
Applsci 13 09752 g026
Figure 27. Spatial streamline from the LSB—Model/SB-1 at the status of M0 = 4/alpha = 0°.
Applsci 13 09752 g027
Figure 28. Comparison of results between experiment and CFD calculation—DSBL unstart mode. (a) Comparison of flow structures (Schlieren image and pressure contour of symmetry plane). (b) Comparison of pressure distributions along flow direction.
Applsci 13 09752 g028
Figure 29. Flow structures of different longitudinal sections—Model/SB-1 at the status of M0 = 4/alpha = 8°, DSBL flow mode. (a) Mach number contours. (b) Pressure contours (d1 > d2 > d3 > d4 > d5).
Applsci 13 09752 g029
Figure 30. Spatial streamlines from body-side and lip-side separations—Model/SB-1 at the status of M0 = 4/alpha = 8°.
Applsci 13 09752 g030
Table 1. Details of pressure-measuring points and their location distribution.
Order Number12345678910
x/l0.4060.4510.50.5430.5840.6070.6590.5970.6170.637
SideBBBBBBBLLL
Order Number11121314Sensor 1Sensor 2Sensor 3
x/l0.6570.6770.6970.7140.7060.6330.684
SideLLLLLBB
B: Body side; L: Lip side.
Table 2. Parameters of wind tunnel inflow in the experiments.
M0p0 (MPa)p (Pa)T0 (K)T (K)Unit Re/107
40.432832.029870.951.95
51.12079.0340567.501.94
62.121342.740549.392.53
p0—total pressure; p—static pressure; T0—total temperature; T—static temperature; Re—Reynolds number.
Table 3. Self-start characteristics of different unstart modes.
Unstart ModesSeparation Vanishing/Self-Starting MethodPoint of Separation Vanishing or Inlet Self-StartFeature
Small separation on bodyIncreasing alphaModel/SB-1: alpha = 4°(M0 = 5)
Model/SB-2: alpha = 4°(M0 = 5)
Easy to self-start
Large separation on bodyAcceleration/decreasing alphaModel/SB-1: M0 = 5/alpha = a, a ≥ 5°
Model/SB-2: M0 = 5/alpha =0°
Easy to self-start
Dual separation on both body and lipThrough the intermediate flow mode of LSB by decreasing alphaCannot vanish directly at M0 = 5 and M0 = 6Very difficult to self-start directly
Disclaimer/Publisher’s Note: The statements, opinions and data contained in all publications are solely those of the individual author(s) and contributor(s) and not of MDPI and/or the editor(s). MDPI and/or the editor(s) disclaim responsibility for any injury to people or property resulting from any ideas, methods, instructions or products referred to in the content.

