Article

Investigation of Fruit Growth Patterns, Olive Fly Bactrocera oleae (Rossi) Infestation, and Genetic Diversity in Italian Olive Cultivars

Department of Agricultural Sciences, University of Naples Federico II, Via Università 100, 80055 Portici, NA, Italy
*
Authors to whom correspondence should be addressed.
Appl. Sci. 2023, 13(17), 9929; https://doi.org/10.3390/app13179929
Submission received: 25 July 2023 / Revised: 21 August 2023 / Accepted: 29 August 2023 / Published: 2 September 2023
(This article belongs to the Section Agricultural Science and Technology)

Abstract

:
The olive fruit fly Bactrocera oleae (Rossi, 1790) poses a significant threat to oliviculture worldwide, despite extensive chemical control measures. The susceptibility of olive (Olea europaea L.) to this pest varies among cultivars, with fruit size being a key factor of interest, as it can be assessed using non-destructive automated technologies. In this study, we investigated the oviposition preferences of the olive fruit fly in six Italian olive cultivars, tracking fertile and sterile punctures in relation to the diametric growth of the drupe. Additionally, we assessed the genetic diversity among cultivars using SSR markers, aiming to uncover a potential correlation between variation in the genetic diversity patterns and infestation levels. The results revealed that the relationship between fruit size and infestation level is non-linear and varies across different cultivars. The co-inertia analysis (COIA) performed on the genetic and infestation datasets revealed possible shared patterns of diversity and relationships between the two datasets. This study emphasizes the complex and diverse nature of the interaction between the olive fruit fly and its host, underscoring the importance of comprehending non-linear relationships to develop accurate genotypic-specific predictions and models.

1. Introduction

The olive (Olea europaea L.) is today an international agricultural crop that has been cultivated for thousands of years for its drupes and the production of oil. Although this tree is known for its hardiness and ability to tolerate sub-optimal growing conditions (e.g., poor soils, drought, and high temperatures), its yield is frequently reduced by the olive fruit fly Bactrocera oleae (Rossi, 1790) (Diptera: Tephritidae), which is considered the key pest of olive worldwide [1]. The olive fruit fly is a small insect (approximately 4–6 mm in length) that lays its eggs in the olive fruit. The feeding tunnel excavated by the hatched larva causes fruit spoilage and premature drop due to direct (mechanical damage, subtraction of material) and indirect (opportunistic pathogens) effects [1,2,3].
The life cycle of the insect is completed in approximately 4–6 weeks, strongly depending on the climate conditions and fruit availability [4,5]. The interaction between the olive fruit fly and the olive tree is complex [1,6]. The insect is a specialist pest, with a very narrow host range. It feeds largely on olives and, to a lesser extent, wild olives and some other species of the genus Olea [1]. B. oleae has coevolved with the olive tree, developing specific adaptations that allow it to use the fruit resources and overcome most of the plant defense, as it is one of the very few insects that is able to feed on the olive pulp [7,8]. The olive has developed a range of direct and indirect defense mechanisms that help both to reduce pest damage on the fruit and deter the adult fly. One of the most important defense mechanisms is the production of secondary metabolites such as phenolic compounds (e.g., oleuropein, hydroxytyrosol, and tyrosol), terpenes (e.g., alpha- and beta-pinene, limonene, and linalool), and a range of volatile organic compounds (VOCs) [9,10,11]. These chemicals have been shown to significantly impact plant–pest interaction and are likely to control the behavior of the olive fruit fly by deterring the females from laying eggs on the fruit, hampering larval feeding and reducing the attractiveness of the drupe [11,12,13]. In addition to chemical defenses, the olive tree also has evolved physical defenses [14]. These include, for instance, the thickness and elasticity of the fruit skin, which can hamper the sting of the fruit and subsequent oviposition [14]. Moreover, the olive fruit fly is also influenced by the skin color and pulp texture [15,16,17]. It is generally thought that Tephritidae are particularly attracted to mature fruits that have a softer texture and, according to the variety and species, also a darker color [18,19].
The olive germplasm has ample diversity because of the long history of cultivation and selection, the ability of the plant to survive without cultural practices, the diffusion of local germplasm, and a slow varietal renewal in the widespread traditional, low-input farming systems [20]. Olive varieties can differ in the level of susceptibility to B. oleae [6,21,22,23]. The molecular response of the drupe to the fruit fly involves a number of functions and biological processes [9,21,24,25], and it is likely that various chemical and physical factors, along with their interactions with the environment, are the base of the variation in resistance in the olive germplasm. For instance, different susceptibility levels in olive varieties have been associated with the physical and/or chemical characteristics of the fruits [16,17,23,26,27]. The intimate relation between O. europaea and its specialized pest B. oleae implies a coevolutionary process that should be characterized by reciprocal changes in morphological characteristics over a long period of time. This process should have generated an intimate adaptation and counter-adaptation that allow both parties to better exploit or defend against each other [28]. The coevolutionary theory proposes that the reciprocal evolutionary change between a plant species and its most damaging specialized herbivorous pest should play a role in the diversification and composition of genetic diversity [29,30].
The main aim of this work was to investigate the level of fruit infestation of the olive fly B. oleae on adult olive trees of different varieties in relation to fruit growth. Moreover, in an attempt to correlate the different levels of observed susceptibility with the genetic variation among varieties, we also performed DNA typing using highly informative simple sequence repeats (SSRs). Considering that the phenotypic and genetic data were collected from the same set of varieties, the co-inertia analysis (COIA) was used as a multivariate statistical analysis of the relationship between the two datasets [31].

2. Materials and Methods

2.1. Plant Material

This study was conducted on 30-year-old olive trees (Olea europaea L. subp. europaea) belonging to the collection located at the experimental field of the Department of Agricultural Sciences, University of Naples Federico II (Portici, Naples, Italy). The experiment was carried out on six cultivars, namely ‘Frantoio’, ‘Leccino’, ‘Nocellara etnea’, ‘Nocellara messinese’, ‘Pendolino’, and ‘Sant’Agostino’. Trees were grafted on wild olive (Olea europaea subsp. Europaea var. sylvestris) seedlings, spaced 5 × 4 m (corresponding to a planting density of 500 trees/ha), and trained to an open-vase system. Trees were managed according to common protocols for commercial olive production with the only exception that pest management was not applied during the trial. Drupe growth was monitored on ten dates (7, 18, and 28 July; 4 and 23 August; 5 and 16 September; 4, 14, 28 October 2005, corresponding to the day of the year (DOY) 188, 199, 209, 216, 235, 248, 259, 277, 287, and 301. Two orthogonal, transversal diameters (maximum and minimum transversal diameters) were measured on thirty randomly selected drupes around the tree using a digital caliper. The two diameters were averaged to obtain the drupe diameter.

2.2. Fruit Olive Fly Infestation

On DOY 199, 209, 216, 248, 259, 277, 287, and 301, a random sample of 50 drupes was collected (for a total of 400 drupes per variety) and immediately transported to the lab for checking the presence of olive fruit fly attacks. First, the olives’ surfaces were visually examined to identify the drupes that showed oviposition scars. After the detection, the drupes with scars were counted and kept separate. Later, each drupe with an oviposition sign was dissected with a scalpel, and the pulp was examined under a stereomicroscope to confirm the presence of eggs or larvae. The drupes showing a fertile puncture in any developmental stage of B. oleae (egg or hatched larva) were counted and classified as infested. Punctured fruits without any evidence of olive fly eggs or larvae, were categorized as drupes with a sterile puncture. The total percentage of punctured drupes (%PDtot), the percentage of drupes with fertile punctures (%PDfert), and the percentage of drupes with sterile punctures (%PDster) were calculated as follows:
% P D t o t = N P D t o t N D t o t × 100
% P D f e r t = N P D f e r t N D t o t × 100
% P D s t e r = N P D s t e r N D t o t × 100
where NDtot is the total number of sampled drupes, NPDtot is the total number of punctured drupes, NPDfert is the number of drupes with fertile punctures, and NPDster is the number of drupes with sterile punctures.

2.3. Statistical Analysis of Morphological Data

The significance of the effect of the cultivar (CV), time (T), and CV × T interaction on drupe diameter was assessed with a two-way ANOVA using Tukey’s honestly significant difference (HSD) test for mean separation (p ≤ 0.05). Separately, for each cultivar, the relationship between drupe diameter and %PDtot, %PDfert, and %PDster was studied by regression analysis fitting linear or quadratic functions, depending on the parameter and the cultivar. Model selection was performed using the simplest significant model that allowed a normal distribution of the residuals. To analyze the contribution to the variation and reduce the dimensionality of the measured parameters, we used the Principal Component Analysis (PCA) by identifying patterns and relationships among varieties using, as inputs, the 24 original variables (drupe diameter, %PDfert, and %PDster measured on the various dates). Statistical analysis and plot representation were performed using R 4.2.

2.4. DNA Isolation

Genomic DNA was isolated from young leaves (4 g) of two plants per variety using a modified CTAB-based method [32]. The plant material was ground in liquid nitrogen with a mortar and pestle. Five mL of DNA extraction buffer (100 mM Tris-HCl, 1.4 M NaCl, 20 mM EDTA, 2% (w/v) CTAB, 1% (v/v), and 0.2% β-mercaptoethanol, 0.1% (v/v) NaHSO3; pH 8) preheated to 65 °C were added, and the samples were incubated at 65 °C for 30 min. The samples were left on a rotary shaker at room temperature for about 15 min, and then 25 μL of RNAse A (10 μg/mL) were added. After incubation for 30 min at 37 °C, 1 volume of a chloroform:isoamyl alcohol solution (24:1) was added to each sample. The samples were mixed and centrifuged at 13,000 rpm for 10 min. This step was repeated, and then nucleic acids were precipitated with the addition of 3 volumes of ice-cold ethanol. After centrifugation at 13,000 rpm for 10 min, the pellet was washed with 500 μL of a 75% ethanol solution with 0.2 M sodium acetate, air-dried, and resuspended in 100 μL of 1× TE solution [33]. All chemicals were purchased from Sigma-Aldrich (Milan, Italy).

2.5. SSR Amplification and Electrophoresis

PCR amplification was carried out in a final volume of 25 μL containing 25 ng of genomic DNA, 1 mM dNTPs (Promega, Milan, Italy), 0.3 μM each primer, 1× Buffer (Promega), and 0.5 U Taq DNA polymerase (Promega). The reactions were performed in the Mastercycler Gradient thermocycler (Eppendorf, Milan, Italy). The sequences of the 10 primer pairs, the type of labeling at 5′ of each forward primer, and the annealing temperature (Ta) are shown in Supplementary Table S1 [34,35,36]. The amplification conditions were one cycle at 94 °C for 5 min, followed by 35 cycles consisting of a 30 s step at 94 °C, a step at the specific Ta for 15 s, and an elongation phase at 72 °C for 1 min. An ending polymerization stage was carried out at 72 °C for 10 min. The PCR products were first analyzed first by horizontal 2% (w/v) agarose gel electrophoresis in a 1× TAE buffer [33] and then by denaturing capillary electrophoresis in an ABI PRISM 3100 Genetic Analyzer (Applied Biosystems, Milan, Italy). Each run lasted about 45 min and was performed at 15 kV and 60 °C using the POP4 polymer (Applied Biosystems). The signal height of each peak and the allele size were calculated using the ABI Prism Genotyper (v. 3.7) software (Applied Biosystems) according to the GeneScan 500 Liz dye molecular weight marker (Applied Biosystems). Duplicate analysis of each variety provided the same SSR profile.

2.6. SSR Data Analysis

The size of each allele was binned according to the core motif reported in the literature. For each SSR locus, we calculated the number of different alleles (N), Shannon’s information index, the observed heterozygosity (Ho), and the Polymorphic Information Content(which isequivalent to the expected heterozygosity), and the Evenness as previously described [37,38]. Principal Component Analysis was carried out on mean-centered allelic frequencies without scaling using the ade4 package [39].

2.7. Co-Inertia Analysis (COIA)

To evaluate the concordance between the structure of the olive varieties based on the morphological and molecular datasets, we employed a co-inertia analysis between the PCAs [31]. We used the RV coefficient as a measure of the similarity between the configuration of the dataset [40], which was calculated as follows:
R V = c o n i e r t i a ( X , Y ) c o i n e r t i a ( X , X ) c o i n e r t i a ( Y , Y )
where X and Y are two data matrices on the same sample of given individuals (i.e., the six varieties). A permutation test with 999 replications was performed to create a null distribution and test for significant differences. These calculations were performed with R 4.2.

3. Results

3.1. Drupe Growth

The fruit diameter is a relevant factor for olive management, influencing cultural practices and susceptibility to pests and disease. Figure 1 shows a graphical representation of the seasonal pattern of the fruit diameter in the six different cultivars under investigation, with changes over time reported for each variety (Figure 1).
As expected, the diametric growth was found to be significantly influenced by two main factors, cultivar and time (Table 1). Moreover, the interaction between these two factors significantly affected the diametric growth of the drupes (CV × T) (Table 1).
As indicated by the main effect analysis, each cultivar differed in drupe diameter. Specifically, ‘Sant’Agostino’ and ‘Nocellara messinese’ had the largest drupes (mean drupe diameters of 17.2 and 15.9 mm, respectively) and ‘Pendolino’ and ‘Frantoio’ had the smallest (drupe diameters of 9.0 and 10.4 mm, respectively), whereas the fruit size of ‘Nocellara etnea’ and ‘Leccino’ was intermediate (a diameter of around 11 mm) (Table 1). Regardless of the cultivar, drupe diameter increased by 64% during the experiment (between DOY 188 and 301) (Table 1). Differences between cultivars in drupe diameter were significant on all the measuring dates, and as suggested by the significant effect of the CV × T interaction, these differences progressively increased during fruit development (Table 1 and Figure 1). For instance, the diameter of ‘Sant’Agostino’ drupes was 81% and 87% larger than ‘Pendolino’ on the first and last measuring dates, respectively.

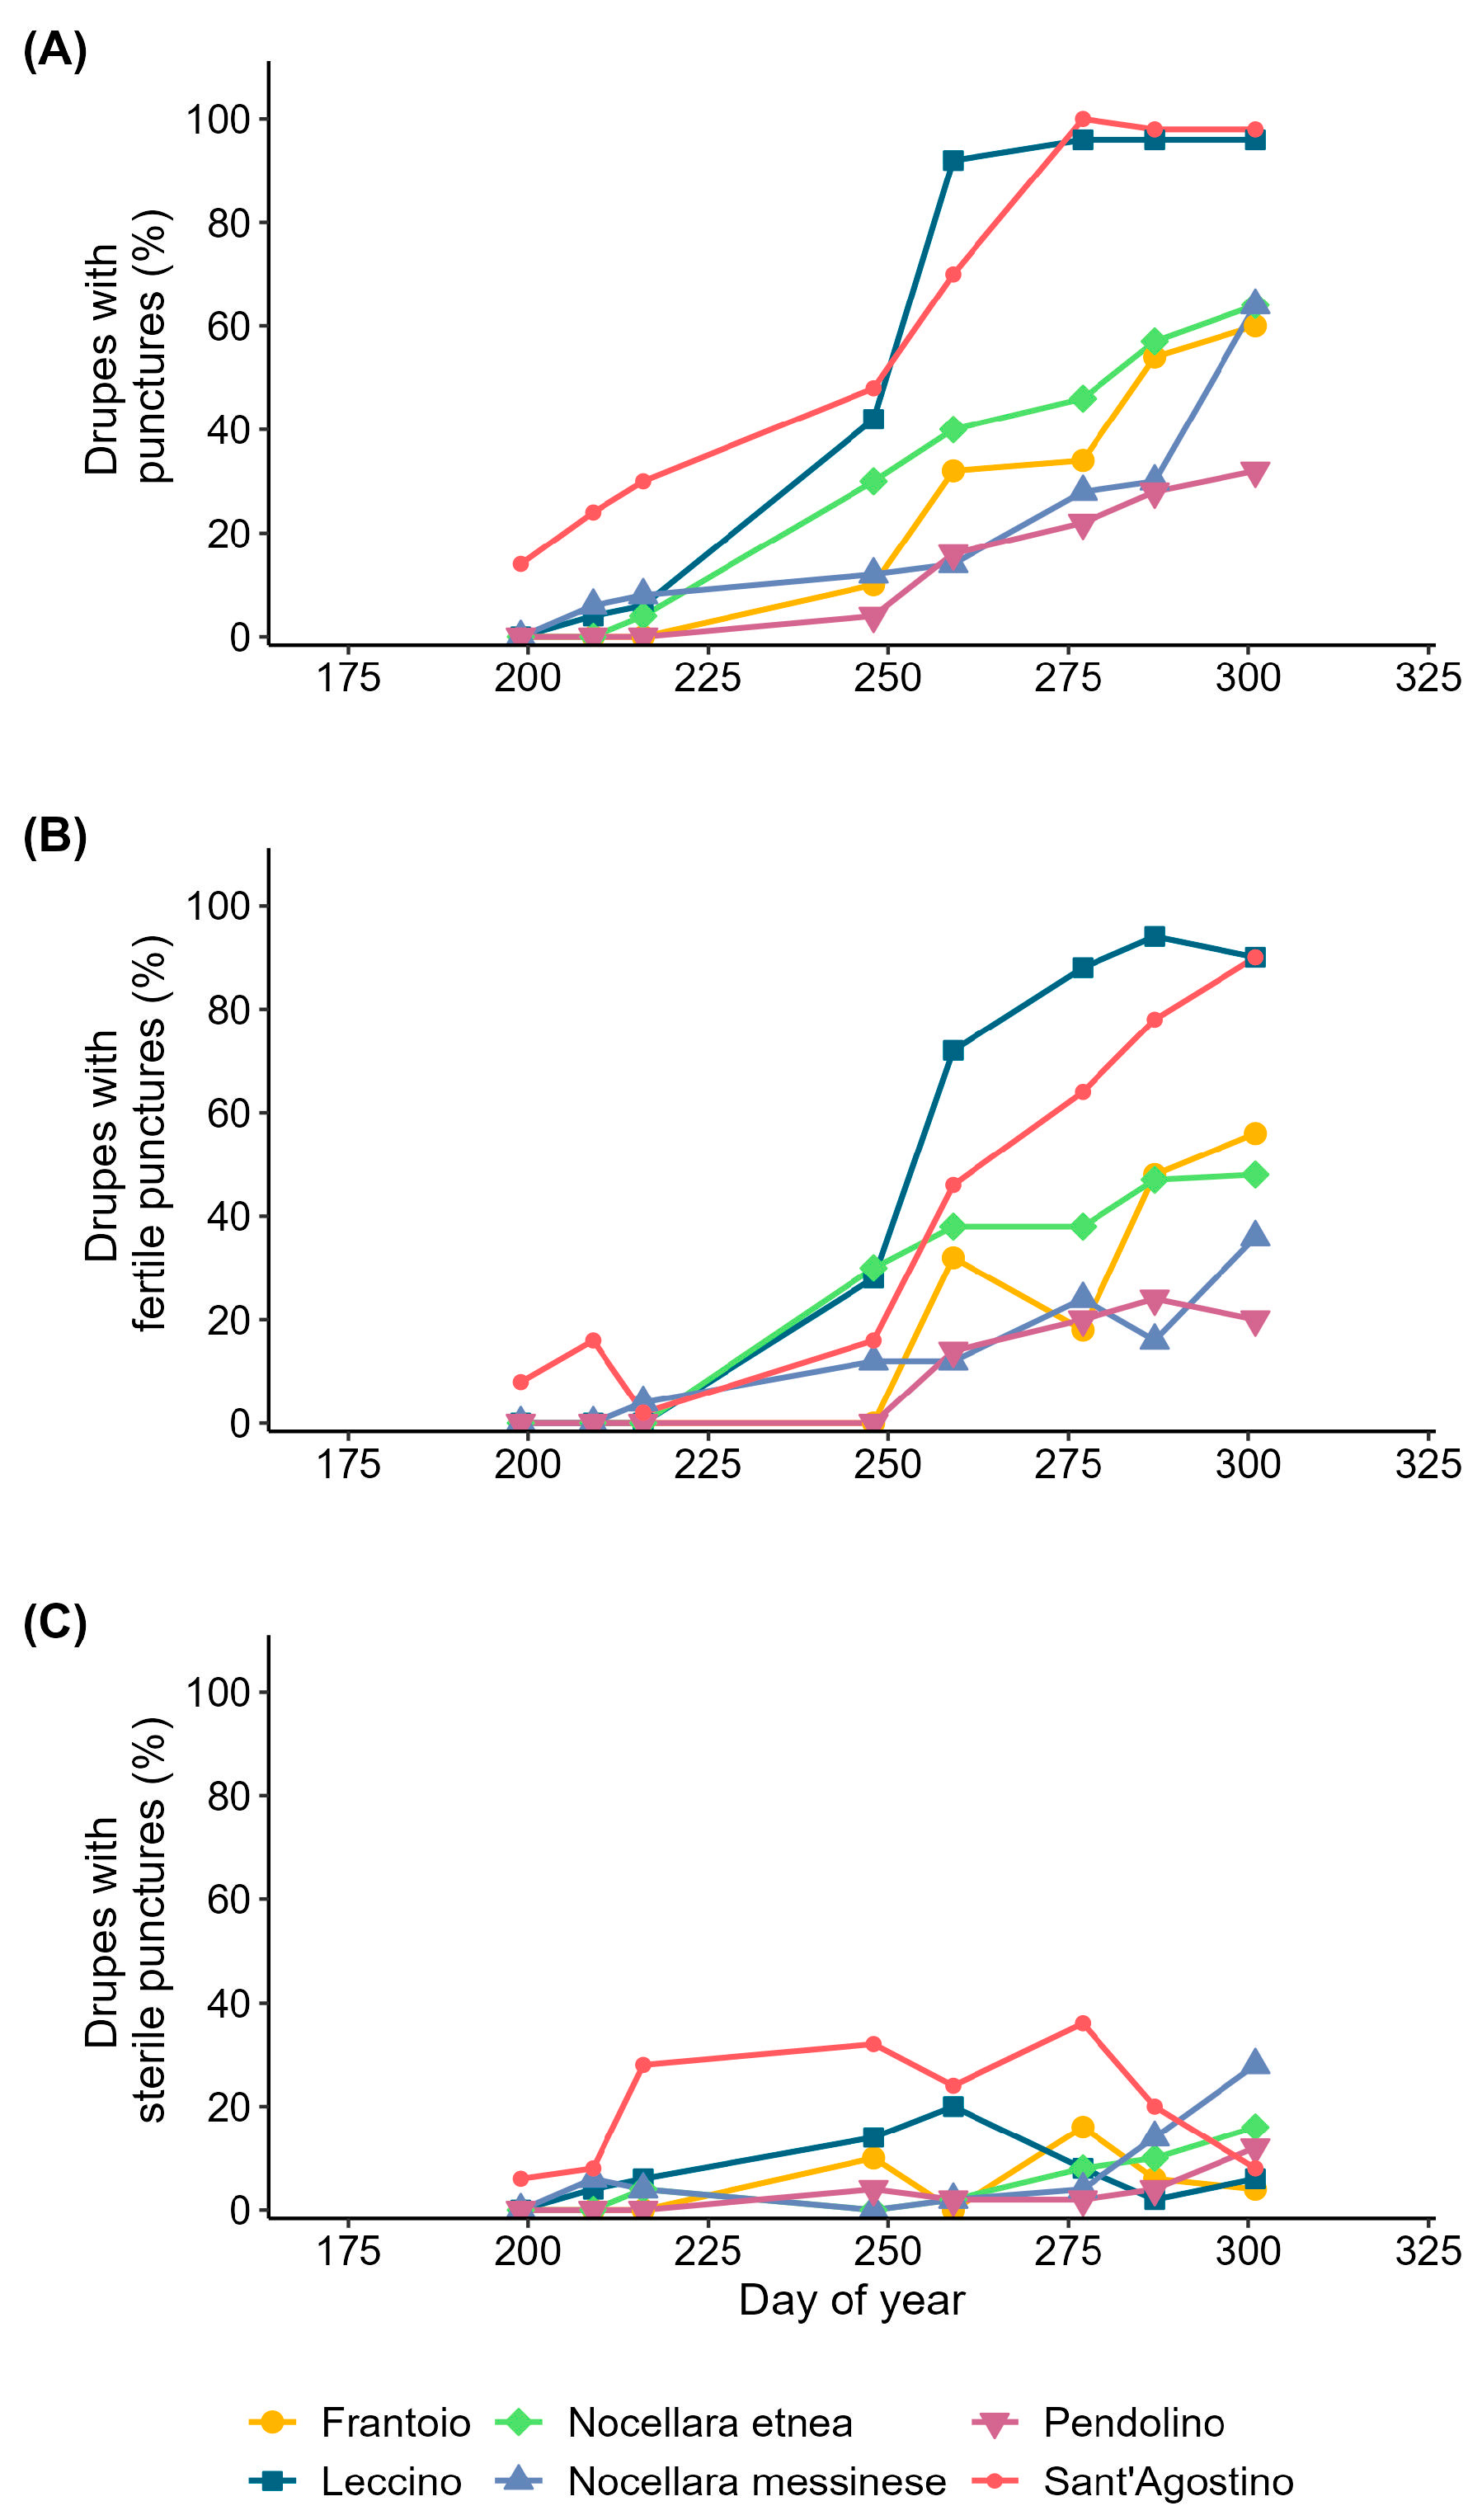
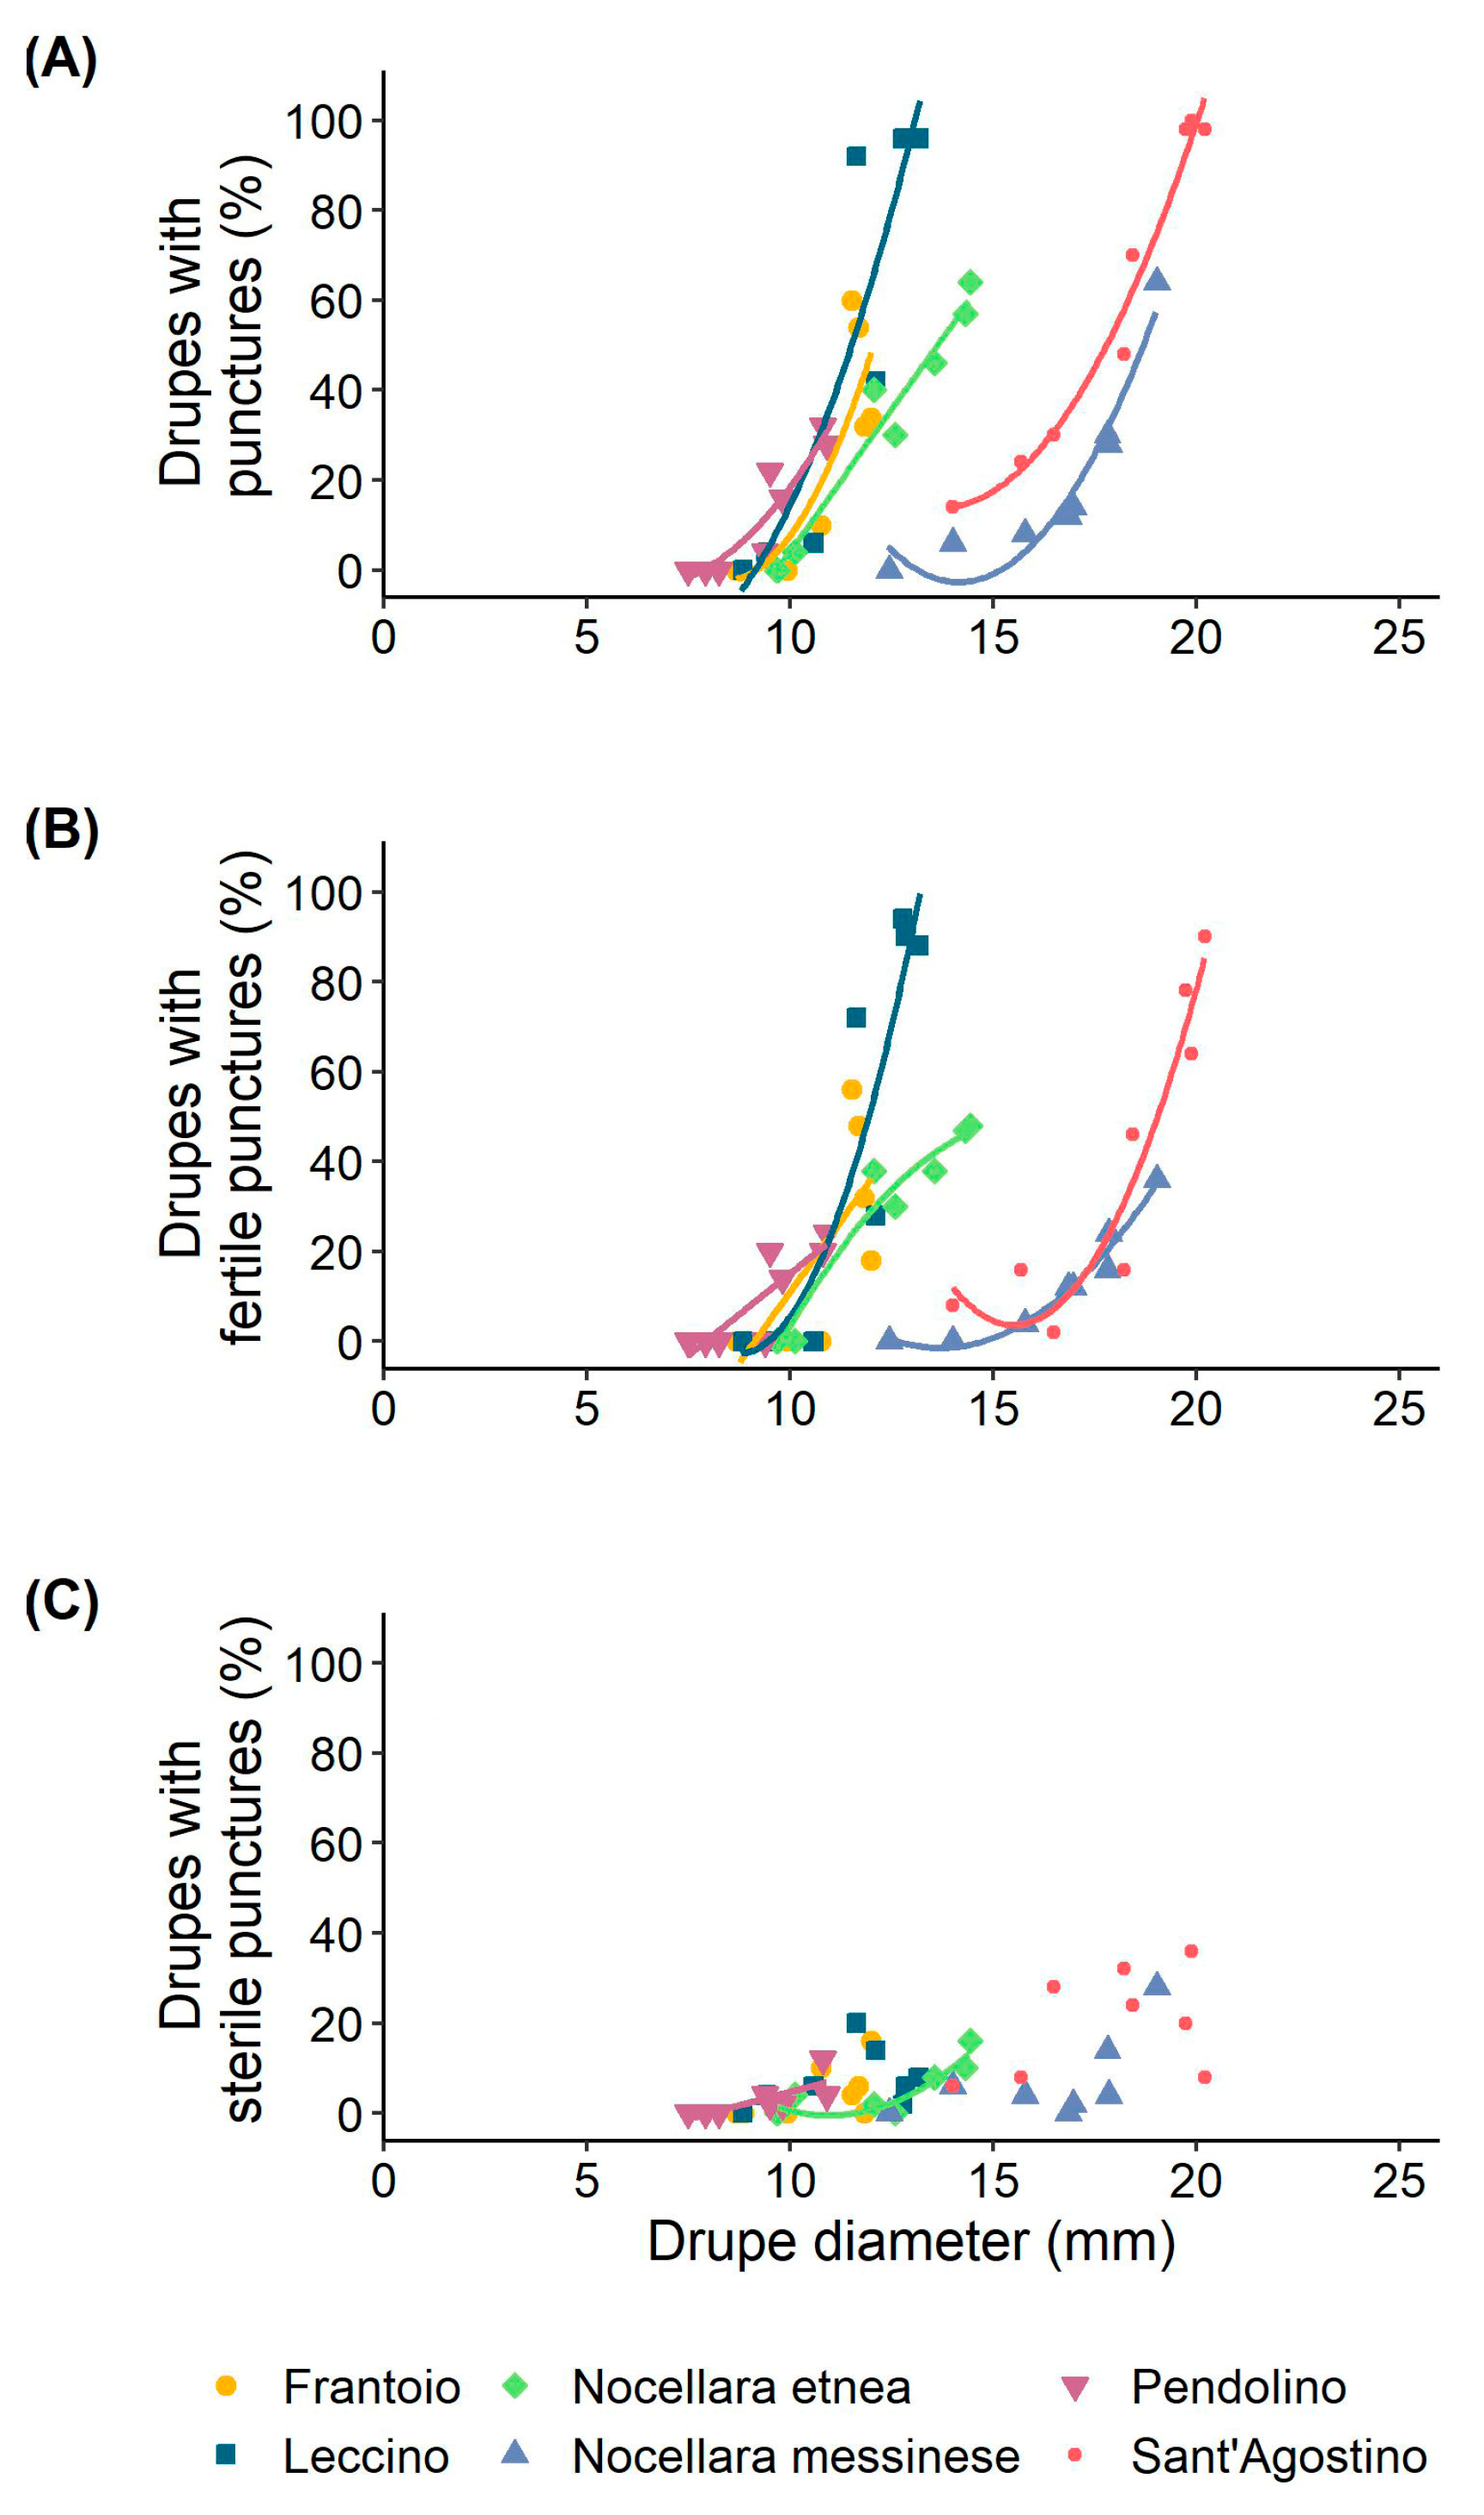
3.2. Olive Fruit Fly Infestation of the Drupes

The seasonal pattern of the infestation by the fruit olive fly largely differed among cultivars. A visual representation of the impact of the olive fruit fly on the six different cultivars over time is presented in Figure 2.
One of the interesting differences among cultivars was the DOY when the first attacks on the drupes were detected. In ‘Sant’Agostino’, a total of 14% of drupes were punctured on the first measuring dates (DOY 199) (Figure 2A), whereas the dates when the first attacks were detected were DOY 209 for ‘Leccino’ and ‘Nocellara messinese’ (a %PDtot of 4% and 6%, respectively), DOY 216 for ‘Nocellara etnea’ (%PDtot = 4%), and DOY 248 for ‘Frantoio’ and ‘Pendolino’ (a %PDtot of 10% and 4%, respectively). On the last measuring date, the %PDtot also differed among cultivars and was highest in ‘Leccino’ and ‘Sant’Agostino’ (a %PDtot of 96% and 98%, respectively), intermediate in ‘Frantoio’, ‘Nocellara etnea’, and ‘Nocellara messinese’ (a %PDtot of 60%, 64%, and 64%, respectively), and the lowest in ‘Pendolino’ (%PDtot = 32%). The seasonal pattern of %PDfert was like %PDtot for most of the cultivars, with the exception of ‘Sant’Agostino’ (Figure 2B). This difference was mainly related to the relatively high %PDster measured during the fruit development period in ‘Sant’Agostino’ compared to the other cultivars (an average %PDster of 22% in ‘Sant’Agostino’ compared to 5% of the other cultivars) (Figure 2C). Despite this, on the last measuring date, ‘Sant’Agostino’ reached %PDster values like ‘Leccino’ (90%) (Figure 2B). While the number of punctured olives and drupe diameters increased over time for all the varieties, there were cultivar-specific relationships between the diameter and the occurrence of punctures caused by the olive fruit fly (Figure 3).
In all the cultivars, the percent of %PDtot increased, according to a quadratic function with drupe diameter (dd) with the exception of ‘Nocellara etnea’, for which the relationship was linear (‘Frantoio’: %PDtot = 3.94 dd2 − 66.34 dd + 276.88, R2 = 0.70, p = 0.049; ‘Leccino’: %PDtot = 2.80 dd2 − 36.74 dd + 102.24, R2 = 0.82, p = 0.015; ‘Nocellara etnea’: %PDtot = 12.69 dd − 122.8, R2 = 0.96, p < 0.001; ‘Nocellara messinese’: %PDtot = 2.57 dd2 − 72.85 dd + 513.36, R2 = 0.93, p = 0.001; ‘Pendolino’: %PDtot = 1.73 dd2 − 22.40 dd + 68.9, R2 = 0.87, p = 0.006; ‘Sant’Agostino’: %PDtot = 2.15 dd2 − 58.82 dd + 416.41, R2 = 0.97, p < 0.001) (Figure 3A). These relationships were similar among ‘Frantoio’, Leccino’, and ‘Pendolino’.
The %PDfert also increased according to a quadratic function with drupe diameter, with the only exception being ‘Frantoio’ and ‘Pendolino’, for which these parameters were related according to a positive linear relationship (‘Frantoio’: %PDfert = 12.61 dd − 115.12, R2 = 0.52, p = 0.042; ‘Leccino’: %PDfert = 5.18 dd2 − 90.60 dd + 393.86, R2 = 0.83, p = 0.012; ‘Nocellara etnea’: %PDfert = −1.24 dd2 + 40.01 dd − 272.91, R2 = 0.96, p < 0.001; ‘Nocellara messinese’: %PDfert = 1.29 dd2 − 35.47 dd + 241.69, R2 = 0.97, p < 0.001; ‘Pendolino’: %PDfert = 7.27 dd − 57.56, R2 = 0.75, p = 0.006; ‘Sant’Agostino’: %PDfert = 3.71 dd2 − 115.11 dd + 896.26, R2 = 0.91, p = 0.002) (Figure 3B). These relationships were similar between ‘Frantoio’ and Leccino’ and between ‘Sant’Agostino’ and ‘Nocellara messinese’. The %PDster increased with fruit diameter only in ‘Nocellara etnea’ and ‘Pendolino’ (a quadratic and linear relationship, respectively) (‘Nocellara etnea’: %PDster = 1.15 dd2 − 25.17 dd + 137.50, R2 = 0.84, p = 0.011; ‘Pendolino’: %PDster = 2.38 d − 19.07, R2 = 0.58, p = 0.028), whereas for the other cultivars, these two parameters were not related by linear or quadratic relationships (Figure 3C).
We performed a PCA to summarize the multivariate dataset in a reduced number of variables and graphically illustrate the relationships among the cultivars. Among the five extracted principal components (PCs), the first three had an eigenvalue higher than 1, and altogether explained the vast majority (95.8%) of the total variance (Table 2), suggesting that the observed phenomena can be largely described by a small number of underlying factors.
PC1 and PC2, which captured 86.3 of the total variance, were retained to visualize the cultivar resemblance (Figure 4). The cultivars appear scattered and spread out in the different quadrants, without any obvious clusters or trends related to drupe size or susceptibility. For instance, the two cultivars with the bigger drupes, ‘Sant’Agostino’ and ‘Nocellara messinese’, had distinct positions on PC1 and PC2, respectively. On the other hand, the closest varieties in the plot (‘Frantoio’ and ‘Nocellara etnea’) have very similar infestation levels. All this can be explained considering that the observed relationships among the measured parameters are non-linear; hence, they are not well-captured by the PCA.

3.3. Genetic Diversity

The genetic diversity of the six varieties was assessed using ten highly informative SSR loci selected from the literature. The main genetic indexes of diversity are reported in Table 3.
The ten loci were all polymorphic, and the size of the alleles was within the variation reported in the literature (Supplementary Table S1). We detected fifty-two alleles (for an average of 5.2 alleles per locus), ranging from a minimum of three alleles for DCA5 to a maximum of seven alleles for UDO31. There was a strong positive correlation between the number of alleles and the Shannon Index of Diversity (r = 0.90, p < 0.001; Pearson). The genotypes were highly heterozygotes. The observed heterozygosity was maximum (i.e., one) at four loci but did not significantly correlate with the number of alleles (r = 0.15, p > 0.05; Pearson). The Polymorphic Information Content (PIC), a measure of the informativeness of genetic markers based on allelic frequency, was on average high (0.72) and, as expected, was positively correlated with the number of alleles (r = 0.77, p < 0.01; Pearson). Considering the effective number of alleles, a measure of genetic diversity that takes into account the squared frequencies of different alleles at a given locus, the most informative loci were GAPU47 and UDO31. DCA17 was the marker that detected more diversity, taking into consideration the number of genotypes and their relative frequencies (i.e., the evenness, E5). The ten SSRs were able to provide a unique profile for each variety.
To identify relationships and visualize possible patterns of genetic variation among varieties using the whole marker set, we performed a PCA (Figure 5).
This analysis showed a clear separation between the different varieties, indicating that the genetic markers used were effective at distinguishing the germplasm. The first two principal components explained 61.26% of the total variation in the data, suggesting that the SSRs were also informative and able to capture a good proportion of the (hypothetical) underlying factors that determine the genetic diversity between the plant varieties.

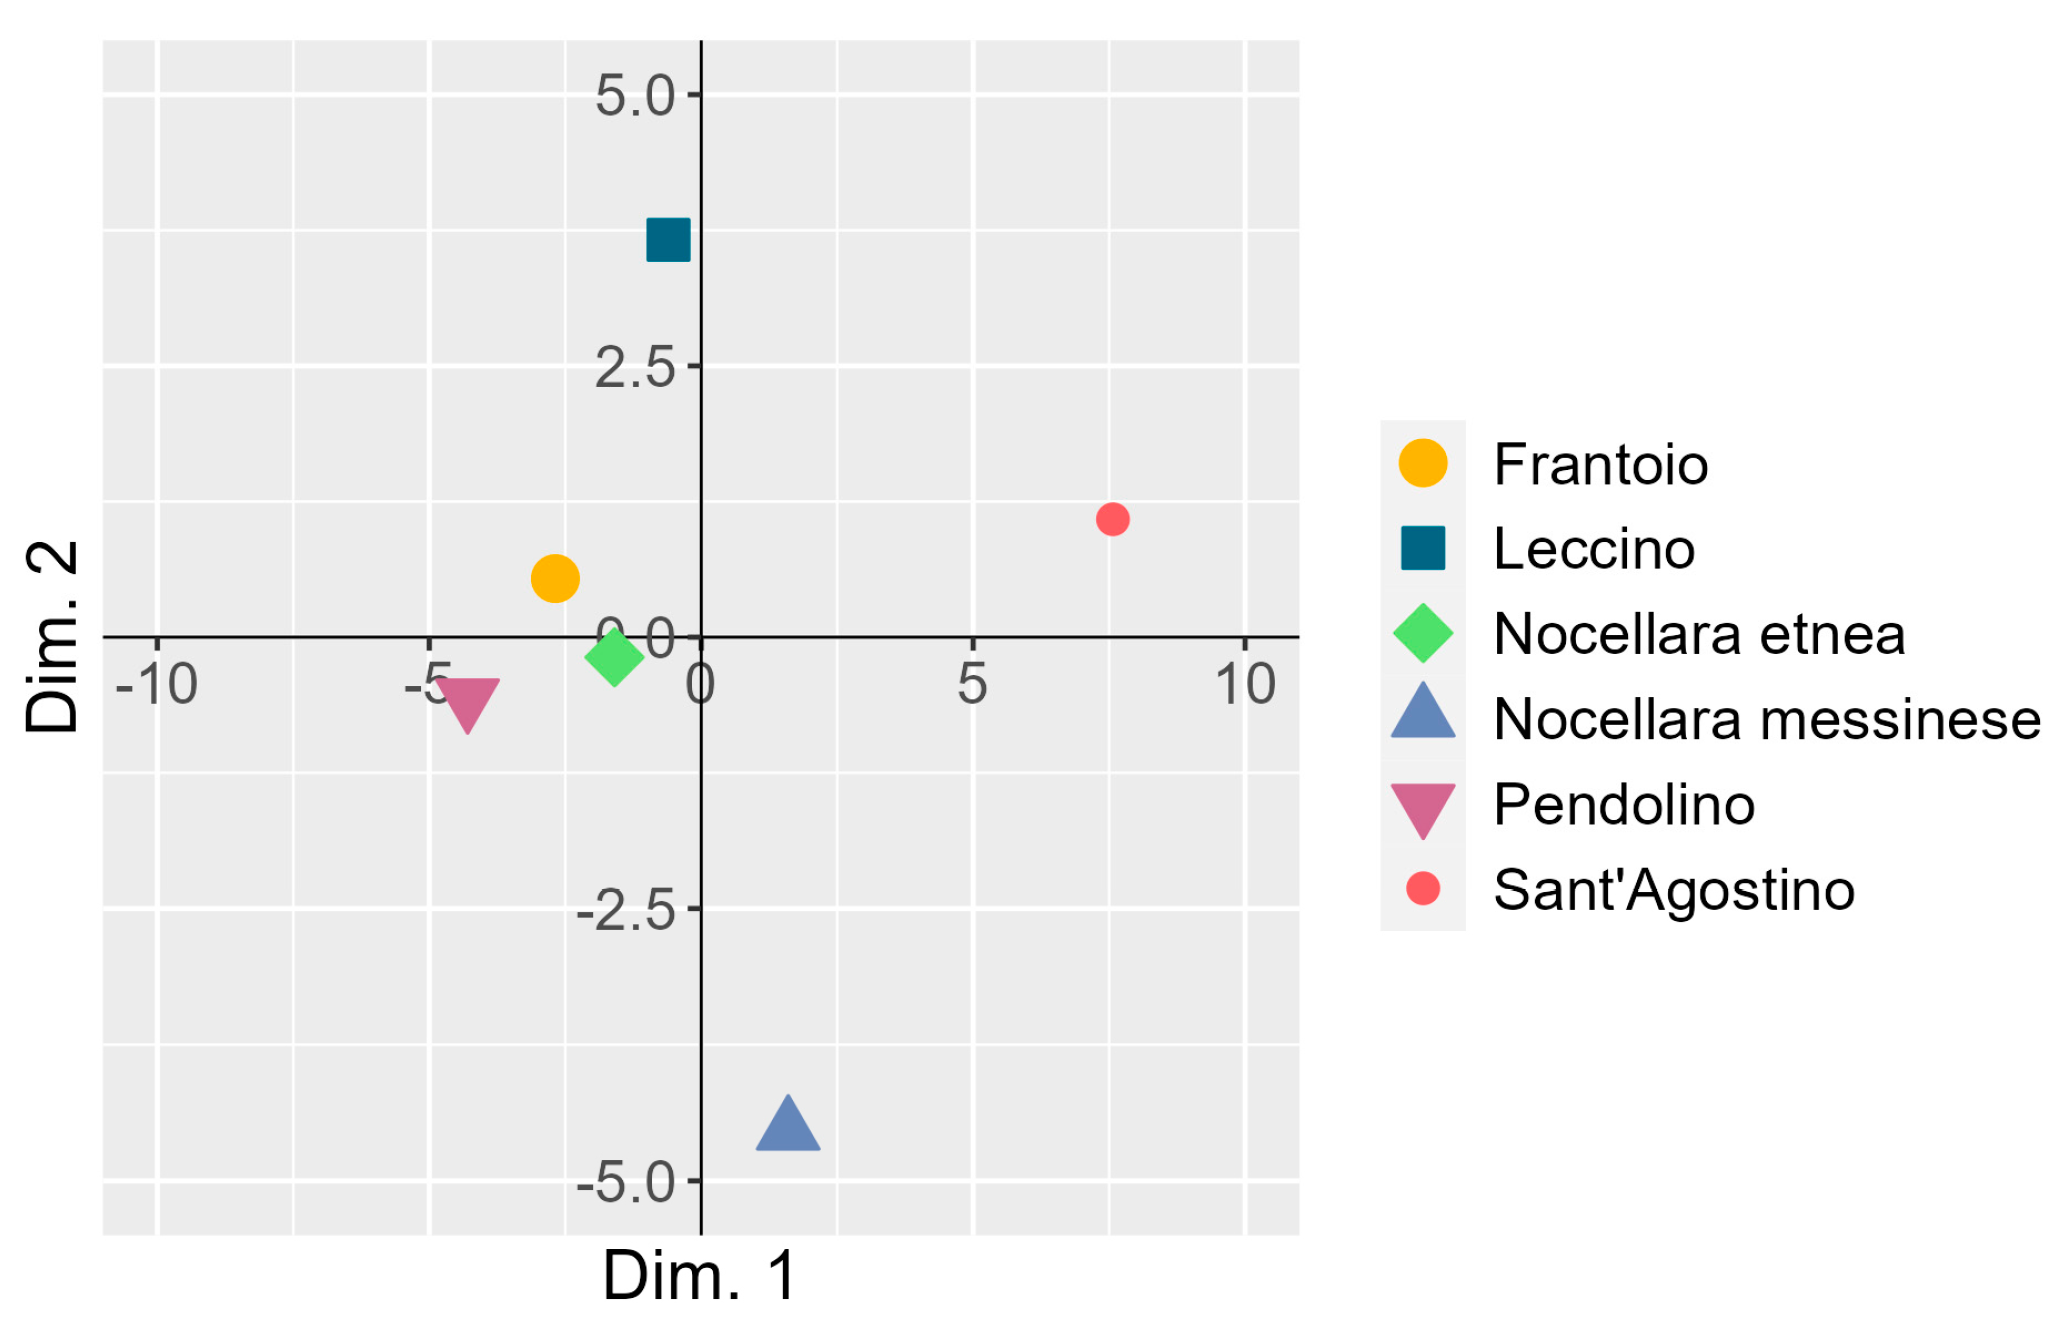
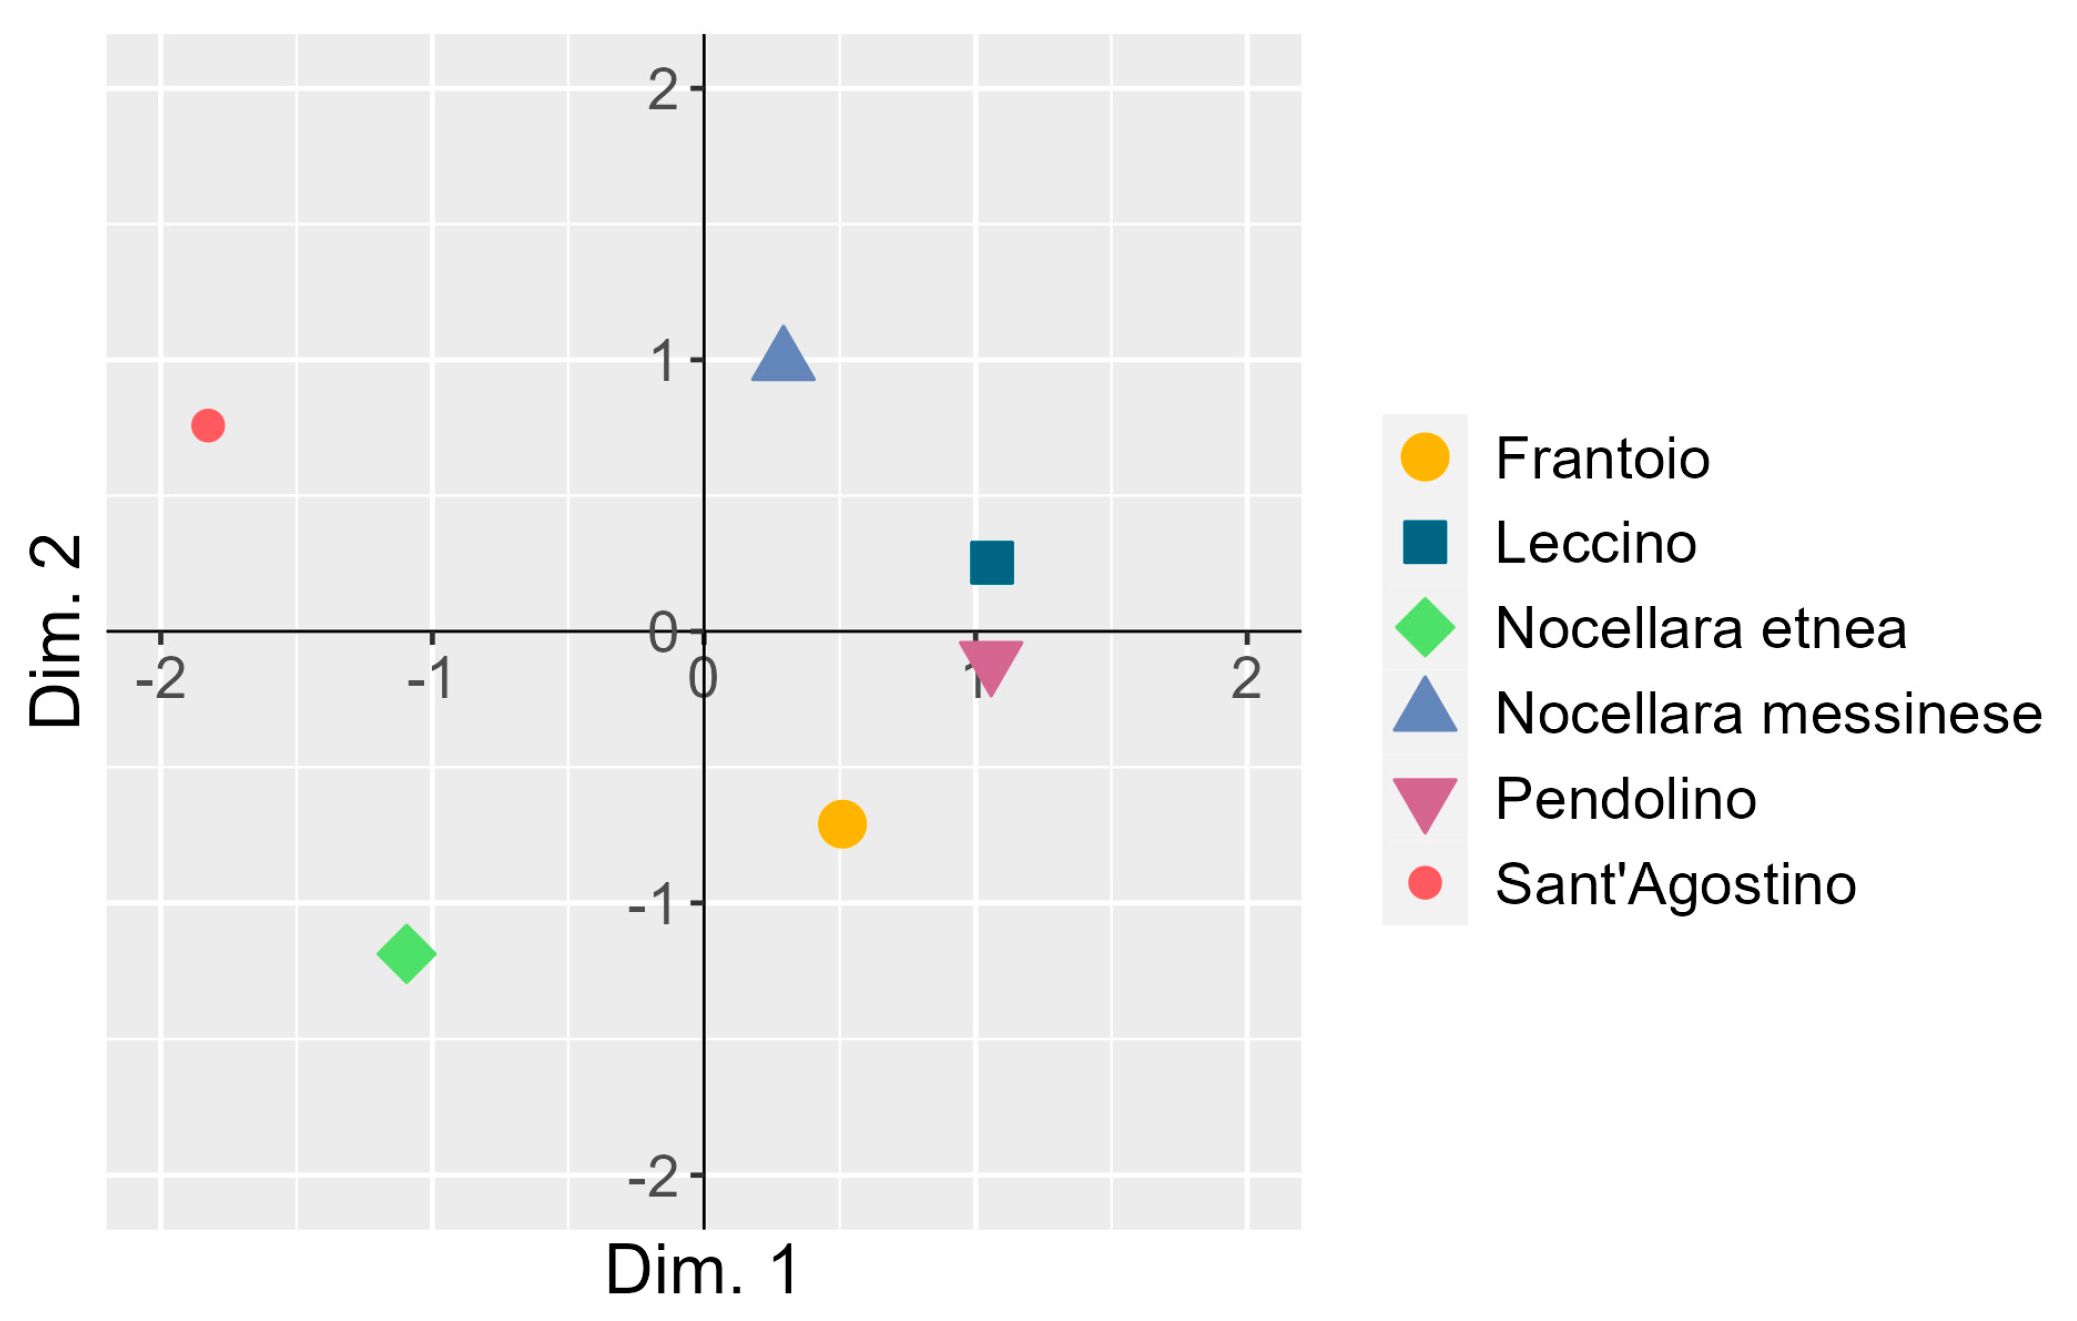
3.4. Co-Inertia between the Two Principal Component Analyses

We performed a co-inertia analysis (COIA) to investigate if and how the two detected PCA patterns are related. A COIA is a dimensionality reduction method that allows for the simultaneous exploration and visualization of the relationships between variables in two distinct datasets. This analysis was intended to identify patterns of variation and covariation that exist between the intrinsically different variables that underlie the structure of the analysis of the infestation level and genetic diversity. The co-inertia coefficient (RV, which spans from 0 to 1, according to the strength of the correlation between the two datasets) was 0.64. Moreover, the first two axes had eigenvalues higher than one (13.23 and 2.4, respectively), with a projected inertia (i.e., the measure of the proportion of variance shared between two datasets) of 77.6% and 14.2%. We performed a permutation test to assess, in statistical terms, the strength of the relationship. The simulated p-value was not significant (p = 0.16).

4. Discussion

The susceptibility of O. europaea to the olive fruit fly is the result of a complex plant–pest interaction [6,41], and it significantly varies according to the cultivar and the features of the drupe [42,43]. Among the factors involved, fruit diameter is of interest because it is relatively easy and quick to monitor, and its measurement is not necessarily destructive. The rapid development of in-field image analysis suggests that the measurement of fruit size in relation to infestation level should be an important component of pest management and crop yield optimization in agricultural systems characterized by large orchards [44,45,46]. In our field study, the presence of different cultivars allowed us to evaluate the ovipositional preferences of the fly throughout the fruit growing season. In the same environmental conditions and with plants of similar age, the overall drupe growth model was similar, with an almost steady increase in size during the season and early differences among varieties that were confirmed and amplified at the end of the trial. The statistical analysis also indicated significant factors’ interaction, which suggests the involvement of (a) factors related to both drupe and fly phenology and/or (b) differential responses to environmental factors, such as temperature and water availability. In all the studied cultivars, the percentage of total infestation (%PDtot) increased with time and reached the highest and the lowest values in the cultivars with the largest (‘Sant’Agostino’) and the smallest drupes (‘Pendolino’), respectively. Conversely, at the end of the experiments, ‘Leccino’ drupes were severely infested by the fly despite the relatively small fruit size, and ‘Nocellara messinese’ had intermediate %PDtot values despite the large drupes. None of the varieties could be considered fully resistant, and the infestation level increased differently among cultivars. Interestingly, the first attack was associated with a high percentage of sterile punctures for ‘Sant’Agostino’, the cultivar with the largest drupes. Nonetheless, the other variety with the largest drupes (‘Nocellara messinese’) registered a strong increase in the total infestation level after DOY 250, while the cultivar that was mostly infected was ‘Leccino’, which only ranked fourth for drupe size at the end of the trial. In a broad sense, the size of the drupe is an important factor that determines the level of attack yet, the relation between size and infestation level is not linear, with differences that seem to be specifically related to the variety (e.g., the same model can be applied to different cultivars, but models cannot be grouped according to the size of the drupe). Moreover, a clear relation between size and puncture seems to explain the fertile punctures, while relationships for the sterile punctures are less evident. Our study highlights, along with other contributions, that the interaction that occurs between the olive fruit fly and its host is complex and dynamic but not totally unpredictable. Previous multivariate analyses indicated that a significant linear relationship between the infestation level and quantitative variables (e.g., elongation, hardness, and volume) of the drupes holds true when the ‘genotype’ factor is removed [17]. It seems evident that a larger and more in-depth understanding of the described non-linear relationships will be important to provide accurate genotypic-specific predictions and models.
Considering that different varieties have different tolerances to the fruit fly, we wanted to explore the relationships between the genetic diversity and the different behavior of the plants in relation to the fruit fly. The genetic analysis confirmed the high discriminant power of the selected SSR loci, and all six cultivars could be discriminated. Moreover, the molecular analysis indicated that the olive tree has a large number of alleles and a high level of heterozygosity, which is typical of perennial trees that are propagated through cloning [47,48].
We used the COIA to analyze the relationship between the two datasets after dimensionality reduction without the intrinsic limitation of correlating each measured molecular variable (e.g., the single molecular marker) with each morphological variable. Interestingly, the co-inertia coefficient indicated that a large covariation exists between the variables in each dataset. This implies that the structure of the molecular diversity and the susceptibility to the olive fruit fly are related. It is likely that the relationship among cultivars described by the SSRs is correlated to the diversity that influences the overall susceptibility of the cultivar, without meaning or suggesting any linkage with specific morphological traits [49]. Nonetheless, the permutation test for the co-inertia coefficient did not yield a significant value. Among the various possible reasons, larger sample sizes are needed for more accurate estimates and more power in the permutation test of the co-inertia coefficient [50]. Moreover, when the relationship between the two datasets is non-linear, the co-inertia coefficient (which is a linear correlation coefficient) may not be fully able to make evident statistically significant relationships [51]. Another limitation is that the quantification of genetic variability among the cultivars considered only the allelic diversity of molecular markers [52]. Moreover, our experimental design did not consider the genetic variability of the fruit fly that may be present across different environments and years and the differences in monovarietal and multivarietal agricultural systems in host selection. Finally, additional analyses related to olive fly infestation, such as the abundance of the insect population, may positively impact the comprehensive understanding of the infestation dynamics.

5. Conclusions

Understanding and modeling the olive—B. oleae interaction requires considering various environmental and biological factors [10,16,17,18,41,53,54]. Our analysis indicated that the diameter of the drupe is an easy-to-score parameter that, when properly related to the cultivar, could be exploited in the future to obtain more insights and accurate predictions of the infestation level. Under this perspective, this study supports the possibility of developing more effective pest management strategies that can reduce the impact of the olive fruit fly on olives [55]. Moreover, our work paves the way for the possibility that the process of reciprocal evolutionary change between the olive tree and its most damaging specialized pest may have played a significant role in the diversification and composition of the cultivated germplasm.

Supplementary Materials

The following supporting information can be downloaded at https://www.mdpi.com/article/10.3390/app13179929/s1, Table S1: SSR markers employed in this study and their main features.

Author Contributions

Conceptualization, G.C. and B.B.; methodology, G.C., A.P.G., R.R. and B.B.; formal analysis, G.C., A.P.G. and B.B.; investigation, G.C., A.M., A.P.G. and B.B.; writing—original draft preparation, G.C., A.P.G. and B.B.; writing—review and editing, G.C. and B.B.; visualization, A.M. and B.B. All authors have read and agreed to the published version of the manuscript.

Funding

This research received no external funding.

Institutional Review Board Statement

Not applicable.

Informed Consent Statement

Not applicable.

Data Availability Statement

The data that are not already present in the manuscript and supporting information will be available from the corresponding authors (G.C. and B.B.) upon reasonable request.

Acknowledgments

We thank Luisita Cartelletta for the assistance with data entry, cleaning, and storage.

Conflicts of Interest

The authors declare no conflict of interest.

References

  1. Daane, K.M.; Johnson, M.W. Olive fruit fly: Managing an ancient pest in modern times. Annu. Rev. Entomol. 2010, 55, 151–169. [Google Scholar] [CrossRef] [PubMed]
  2. Koprivnjak, O.; Dminić, I.; Kosić, U.; Majetić, V.; Godena, S.; Valenčič, V. Dynamics of oil quality parameters changes related to olive fruit fly attack. Eur. J. Lipid Sci. Technol. 2010, 112, 1033–1040. [Google Scholar] [CrossRef]
  3. Gómez-Caravaca, A.M.; Cerretani, L.; Bendini, A.; Segura-Carretero, A.; Fernández-Gutiérrez, A.; Del Carlo, M.; Compagnone, D.; Cichelli, A. Effects of fly attack (Bactrocera oleae) on the phenolic profile and selected chemical parameters of olive oil. J. Agric. Food Chem. 2008, 56, 4577–4583. [Google Scholar] [CrossRef]
  4. Girolami, V. Studies on the biology and population ecology of Dacus oleae (Gmelin). 1. Influence of environmental abiotic factors on the adult and on the immature stages. Redia 1979, 62, 147–191. [Google Scholar]
  5. Kounatidis, I.; Papadopoulos, N.; Mavragani Tsipidou, P.; Cohen, Y.; Tertivanidis, K.; Nomikou, M.; Nestel, D. Effect of elevation on spatio-temporal patterns of olive fly (Bactrocera oleae) populations in northern Greece. J. Appl. Entomol. 2008, 132, 722–733. [Google Scholar] [CrossRef]
  6. Malheiro, R.; Casal, S.; Baptista, P.; Pereira, J.A. A review of Bactrocera oleae (Rossi) impact in olive products: From the tree to the table. Trends Food Sci. Technol. 2015, 44, 226–242. [Google Scholar] [CrossRef]
  7. Pavlidi, N.; Gioti, A.; Wybouw, N.; Dermauw, W.; Ben-Yosef, M.; Yuval, B.; Jurkevich, E.; Kampouraki, A.; Van Leeuwen, T.; Vontas, J. Transcriptomic responses of the olive fruit fly Bactrocera oleae and its symbiont Candidatus Erwinia dacicola to olive feeding. Sci. Rep. 2017, 7, 42633. [Google Scholar] [CrossRef]
  8. Ben-Yosef, M.; Pasternak, Z.; Jurkevitch, E.; Yuval, B. Symbiotic bacteria enable olive fly larvae to overcome host defences. R. Soc. Open Sci. 2015, 2, 150170. [Google Scholar] [CrossRef]
  9. Notario, A.; Sánchez, R.; Luaces, P.; Sanz, C.; Pérez, A.G. The Infestation of Olive Fruits by Bactrocera oleae (Rossi) Modifies the Expression of Key Genes in the Biosynthesis of Volatile and Phenolic Compounds and Alters the Composition of Virgin Olive Oil. Molecules 2022, 27, 1650. [Google Scholar] [CrossRef]
  10. Spadafora, A.; Mazzuca, S.; Chiappetta, F.F.; Parise, A.; Perri, E.; Innocenti, A.M. Oleuropein-specific-β-glucosidase activity marks the early response of olive fruits (Olea europaea) to mimed insect attack. Agric. Sci. China 2008, 7, 703–712. [Google Scholar] [CrossRef]
  11. Aluja, M.; Mangan, R.L. Fruit fly (Diptera: Tephritidae) host status determination: Critical conceptual, methodological, and regulatory considerations. Annu. Rev. Entomol. 2008, 53, 473–502. [Google Scholar] [CrossRef] [PubMed]
  12. Scarpati, M.L.; Scalzo, R.L.; Vita, G. Olea europaea volatiles attractive and repellent to the olive fruit fly (Dacus oleae, Gmelin). J. Chem. Ecol. 1993, 19, 881–891. [Google Scholar] [CrossRef] [PubMed]
  13. Malheiro, R.; Casal, S.; Baptista, P.; Pereira, J.A. Physico-chemical characteristics of olive leaves and fruits and their relation with Bactrocera oleae (Rossi) cultivar oviposition preference. Sci. Hortic. 2015, 194, 208–214. [Google Scholar] [CrossRef]
  14. Neuenschwander, P.; Michelakis, S.; Holloway, P.; Berchtol, W. Factors affecting the susceptibility of fruits of different olive varieties to attack by Dacus oleae (Gmel.) (Dipt., Tephritidae). Z. Für Angew. Entomol. 1985, 100, 174–188. [Google Scholar] [CrossRef]
  15. Katsoyannos, B.I.; Kouloussis, N.A. Captures of the olive fruit fly Bactrocera oleae on spheres of different colours. Entomol. Exp. Appl. 2001, 100, 165–172. [Google Scholar] [CrossRef]
  16. Gonçalves, M.F.; Malheiro, R.; Casal, S.; Torres, L.; Pereira, J.A. Influence of fruit traits on oviposition preference of the olive fly, Bactrocera oleae (Rossi) (Diptera: Tephritidae), on three Portuguese olive varieties (Cobrançosa, Madural and Verdeal Transmontana). Sci. Hortic. 2012, 145, 127–135. [Google Scholar] [CrossRef]
  17. Rizzo, R.; Caleca, V.; Lombardo, A. Relation of fruit color, elongation, hardness, and volume to the infestation of olive cultivars by the olive fruit fly, B actrocera oleae. Entomol. Exp. Et Appl. 2012, 145, 15–22. [Google Scholar] [CrossRef]
  18. Fletcher, B. The biology of dacine fruit flies. Annu. Rev. Entomol. 1987, 32, 115–144. [Google Scholar] [CrossRef]
  19. Rattanapun, W.; Amornsak, W.; Clarke, A.R. Bactrocera dorsalis preference for and performance on two mango varieties at three stages of ripeness. Entomol. Exp. Appl. 2009, 131, 243–253. [Google Scholar] [CrossRef]
  20. Rallo, L.; Barranco, D.; Díez, C.M.; Rallo, P.; Suárez, M.P.; Trapero, C.; Pliego-Alfaro, F. Strategies for olive (Olea europaea L.) breeding: Cultivated genetic resources and crossbreeding. Adv. Plant Breed. Strateg. Fruits 2018, 3, 535–600. [Google Scholar]
  21. Grasso, F.; Coppola, M.; Carbone, F.; Baldoni, L.; Alagna, F.; Perrotta, G.; Pérez-Pulido, A.J.; Garonna, A.; Facella, P.; Daddiego, L. The transcriptional response to the olive fruit fly (Bactrocera oleae) reveals extended differences between tolerant and susceptible olive (Olea europaea L.) varieties. PLoS ONE 2017, 12, e0183050. [Google Scholar] [CrossRef] [PubMed]
  22. Iannotta, N.; Scalercio, S. Susceptibility of Cultivars to Biotic Stresses. In Olive Germplasm; Innocenzo, M., Ed.; IntechOpen: Rijeka, Croatia, 2012; Chapter 5. [Google Scholar]
  23. Medjkouh, L.; Costa, A.; Tamendjari, A.; Bekdouche, F.; Bouarroudj, K.; Oliveira, M.B.P. Susceptibility of eight Algerian olive cultivars to Bactrocera oleae infestation—A pomological and nutritional quality perspective. Phytoparasitica 2018, 46, 595–605. [Google Scholar] [CrossRef]
  24. Corrado, G.; Alagna, F.; Rocco, M.; Renzone, G.; Varricchio, P.; Coppola, V.; Coppola, M.; Garonna, A.; Baldoni, L.; Scaloni, A. Molecular interactions between the olive and the fruit fly Bactrocera oleae. BMC Plant Biol. 2012, 12, 86. [Google Scholar] [CrossRef]
  25. Alagna, F.; Kallenbach, M.; Pompa, A.; De Marchis, F.; Rao, R.; Baldwin, I.T.; Bonaventure, G.; Baldoni, L. Olive fruits infested with olive fly larvae respond with an ethylene burst and the emission of specific volatiles. J. Integr. Plant Biol. 2016, 58, 413–425. [Google Scholar] [CrossRef] [PubMed]
  26. Garantonakis, N.; Varikou, K.; Markakis, E.; Birouraki, A.; Sergentani, C.; Psarras, G.; Koubouris, G.C. Interaction between Bactrocera oleae (Diptera: Tephritidae) infestation and fruit mineral element content in Olea europaea (Lamiales: Oleaceae) cultivars of global interest. Appl. Entomol. Zool. 2016, 51, 257–265. [Google Scholar] [CrossRef]
  27. Rebora, M.; Salerno, G.; Piersanti, S.; Gorb, E.; Gorb, S. Role of fruit epicuticular waxes in preventing Bactrocera oleae (Diptera: Tephritidae) attachment in different cultivars of Olea europaea. Insects 2020, 11, 189. [Google Scholar] [CrossRef]
  28. Nardi, F.; Carapelli, A.; Boore, J.; Roderick, G.; Dallai, R.; Frati, F. Domestication of olive fly through a multi-regional host shift to cultivated olives: Comparative dating using complete mitochondrial genomes. Mol. Phylogenetics Evol. 2010, 57, 678–686. [Google Scholar] [CrossRef]
  29. Ehrlich, P.R.; Raven, P.H. Butterflies and plants: A study in coevolution. Evolution 1964, 18, 586–608. [Google Scholar] [CrossRef]
  30. Futuyma, D.J.; Agrawal, A.A. Macroevolution and the biological diversity of plants and herbivores. Proc. Natl. Acad. Sci. USA 2009, 106, 18054–18061. [Google Scholar] [CrossRef]
  31. Doledec, S.; Chessel, D. Co-inertia analysis: An alternative method for studying specie-environment relationships. Freshw. Biol. 1994, 31, 277–294. [Google Scholar] [CrossRef]
  32. Corrado, G.; Imperato, A.; La Mura, M.; Perri, E.; Rao, R. Genetic diversity among olive varieties of Southern Italy and the traceability of olive oil using SSR markers. J. Hortic. Sci. Biotechnol. 2011, 86, 461–466. [Google Scholar] [CrossRef]
  33. Sambrook, J.; Fritsch, E.F.; Maniatis, T. Molecular Cloning: A Laboratory Manual; Cold Spring Harbor Laboratory Press: Long Island, NY, USA, 1989. [Google Scholar]
  34. Sefc, K.; Lopes, M.; Mendonça, D.; Santos, M.R.D.; Machado, M.L.D.C.; Machado, A.D.C. Identification of microsatellite loci in olive (Olea europaea) and their characterization in Italian and Iberian olive trees. Mol. Ecol. 2000, 9, 1171–1173. [Google Scholar] [CrossRef] [PubMed]
  35. Cipriani, G.; Marrazzo, M.; Marconi, R.; Cimato, A.; Testolin, R. Microsatellite markers isolated in olive (Olea europaea L.) are suitable for individual fingerprinting and reveal polymorphism within ancient cultivars. Theor. Appl. Genet. 2002, 104, 223–228. [Google Scholar] [CrossRef] [PubMed]
  36. Carriero, F.; Fontanazza, G.; Cellini, F.; Giorio, G. Identification of simple sequence repeats (SSRs) in olive (Olea europaea L.). Theor. Appl. Genet. 2002, 104, 301–307. [Google Scholar] [CrossRef]
  37. Manco, R.; Basile, B.; Capuozzo, C.; Scognamiglio, P.; Forlani, M.; Rao, R.; Corrado, G. Molecular and phenotypic diversity of traditional European plum (Prunus domestica L.) germplasm of Southern Italy. Sustainability 2019, 11, 4112. [Google Scholar] [CrossRef]
  38. Corrado, G.; Forlani, M.; Rao, R.; Basile, B. Diversity and relationships among neglected apricot (Prunus armeniaca L.) landraces using morphological traits and SSR markers: Implications for agro-biodiversity conservation. Plants 2021, 10, 1341. [Google Scholar] [CrossRef]
  39. Dray, S.; Dufour, A.-B. The ade4 package: Implementing the duality diagram for ecologists. J. Stat. Softw. 2007, 22, 1–20. [Google Scholar] [CrossRef]
  40. Robert, P.; Escoufier, Y. A unifying tool for linear multivariate statistical methods: The RV-coefficient. J. R. Stat. Soc. Ser. C: Appl. Stat. 1976, 25, 257–265. [Google Scholar] [CrossRef]
  41. Corrado, G.; Garonna, A.; Cabanás, C.G.-L.; Gregoriou, M.; Martelli, G.P.; Mathiopoulos, K.D.; Mercado-Blanco, J.; Saponari, M.; Tsoumani, K.T.; Rao, R. Host response to biotic stresses. In The Olive Tree Genome; Springer: Cham, Switzerland, 2016; pp. 75–98. [Google Scholar]
  42. Malheiro, R.; Casal, S.; Pinheiro, L.; Baptista, P.; Pereira, J. Olive cultivar and maturation process on the oviposition preference of Bactrocera oleae (Rossi) (Diptera: Tephritidae). Bull. Entomol. Res. 2019, 109, 43–53. [Google Scholar] [CrossRef]
  43. Fletcher, B.; Pappas, S.; Kapatos, E. Changes in the ovaries of olive flies (Dacus oleae (Gmelin)) during the summer, and their relationship to temperature, humidity and fruit availability. Ecol. Entomol. 1978, 3, 99–107. [Google Scholar] [CrossRef]
  44. Vibhute, A.; Bodhe, S.K. Applications of image processing in agriculture: A survey. Int. J. Comput. Appl. 2012, 52, 34–40. [Google Scholar] [CrossRef]
  45. Pontikakos, C.M.; Tsiligiridis, T.A.; Drougka, M.E. Location-aware system for olive fruit fly spray control. Comput. Electron. Agric. 2010, 70, 355–368. [Google Scholar] [CrossRef]
  46. Miranda, M.Á.; Barceló, C.; Valdés, F.; Feliu, J.F.; Nestel, D.; Papadopoulos, N.; Sciarretta, A.; Ruiz, M.; Alorda, B. Developing and implementation of Decision Support System (DSS) for the control of olive fruit fly, Bactrocera oleae, in mediterranean olive orchards. Agronomy 2019, 9, 620. [Google Scholar] [CrossRef]
  47. Belaj, A.; Satovic, Z.; Cipriani, G.; Baldoni, L.; Testolin, R.; Rallo, L.; Trujillo, I. Comparative study of the discriminating capacity of RAPD, AFLP and SSR markers and of their effectiveness in establishing genetic relationships in olive. Theor. Appl. Genet. 2003, 107, 736–744. [Google Scholar] [CrossRef] [PubMed]
  48. Trujillo, I.; Ojeda, M.A.; Urdiroz, N.M.; Potter, D.; Barranco, D.; Rallo, L.; Diez, C.M. Identification of the Worldwide Olive Germplasm Bank of Córdoba (Spain) using SSR and morphological markers. Tree Genet. Genomes 2014, 10, 141–155. [Google Scholar] [CrossRef]
  49. Menkir, A.; Adetimirin, V.O.; Yallou, C.G.; Gedil, M. Relationship of genetic diversity of inbred lines with different reactions to Striga hermonthica (Del.) Benth and the performance of their crosses. Crop Sci. 2010, 50, 602–611. [Google Scholar] [CrossRef]
  50. Dray, S. On the number of principal components: A test of dimensionality based on measurements of similarity between matrices. Comput. Stat. Data Anal. 2008, 52, 2228–2237. [Google Scholar] [CrossRef]
  51. Legendre, P.; Legendre, L. Canonical analysis. In Developments in Environmental Modelling; Elsevier: Amsterdam, The Netherlands, 2012; Volume 24, pp. 625–710. [Google Scholar]
  52. Hughes, A.R.; Inouye, B.D.; Johnson, M.T.; Underwood, N.; Vellend, M. Ecological consequences of genetic diversity. Ecol. Lett. 2008, 11, 609–623. [Google Scholar] [CrossRef]
  53. Scarpati, M.L.; Scalzo, R.L.; Vita, G.; Gambacorta, A. Chemiotropic behavior of female olive fly (Bactrocera oleae Gmel.) on Olea europaea L. J. Chem. Ecol. 1996, 22, 1027–1036. [Google Scholar] [CrossRef]
  54. Malheiro, R.; Casal, S.; Cunha, S.C.; Baptista, P.; Pereira, J.A. Olive volatiles from Portuguese cultivars Cobrançosa, Madural and Verdeal Transmontana: Role in oviposition preference of Bactrocera oleae (Rossi) (Diptera: Tephritidae). PLoS ONE 2015, 10, e0125070. [Google Scholar] [CrossRef]
  55. Li, W.; Zheng, T.; Yang, Z.; Li, M.; Sun, C.; Yang, X. Classification and detection of insects from field images using deep learning for smart pest management: A systematic review. Ecol. Inform. 2021, 66, 101460. [Google Scholar] [CrossRef]
Figure 1. Seasonal pattern of the olive fruit diameter in six olive cultivars. The x-axis corresponds to the dates of measurement and the y-axis corresponds to the diameter in millimeters. Each cultivar is represented by a different symbol and color. Separately, for each day of measurement, different letters indicate significant differences in the fruit diameter between cultivars, according to Tukey’s post hoc test (p ≤ 0.05).
Applsci 13 09929 g001
Figure 2. Seasonal pattern of the olive fruit fly infestation on the six olive cultivars. The graph displays the changes in the percentage of punctured drupes (panel A), drupes with a fertile puncture (panel B) and a sterile puncture (panel C) over time. Each cultivar is represented by a different symbol and color.
Applsci 13 09929 g002
Figure 3. Relationship between the diameter of the drupe and the occurrence of (A) punctures (both fertile and sterile), (B) fertile punctures, and (C) sterile punctures caused by the olive fruit fly. Only significant regression curves (p ≤ 0.05) were reported.
Applsci 13 09929 g003
Figure 4. Principal Component Analysis (PCA) plot of the olive varieties based on the morphological measurements. Each data point represents a variety, indicated by a different color and symbol. The first principal component (PC1) explains 61.4 of the variance in the data, while the second principal component (PC2) explains 24.9.
Applsci 13 09929 g004
Figure 5. Principal Component Analysis (PCA) plot of the olive varieties based on the molecular markers. Each data point represents a variety, indicated by a different color and symbol. The first principal component (PC1) explains 40.88 of the variance in the data, while the second principal component (PC2) explains 20.38.
Applsci 13 09929 g005
Table 1. Effect of cultivar (CV: ‘Frantoio’, ‘Leccino’, ‘Nocellara etnea’, ‘Nocellara messinese’, ‘Pendolino’, ‘Sant’Agostino’), time (T: expressed in the day of the year, DOY), and CV × T interaction (assessed by two-way ANOVA) on the drupe diameter.
Source of VariationMarginal Mean of Drupe Diameter (mm)dfSSMSF Valuep-Value
Cultivar (CV) 516,04732093038.6<0.001
‘Frantoio’10.4 ± 0.1 e
‘Leccino’11.0 ± 0.1 d
‘Nocellara etnea’11.6 ± 0.1 c
‘Nocellara messinese’15.9 ± 0.2 b
‘Pendolino’9.0 ± 0.1 f
‘Sant’Agostino’17.2 ± 0.2 a
Time (T) 96315702664.4<0.001
DOY 1889.0 ± 0.1 h
DOY 19910.2 ± 0.2 g
DOY 20910.9 ± 0.2 f
DOY 21611.9 ± 0.2 e
DOY 23512.7 ± 0.2 d
DOY 24813.3 ± 0.2 c
DOY 25913.5 ± 0.2 c
DOY 27714.3 ± 0.3 b
DOY 28714.5 ± 0.3 ab
DOY 30114.8 ± 0.3 a
CV × T 456271413.2<0.001
Residuals 174018381
Footnote: separately, for each source of variation, means followed by different letters are significantly different, according to Tukey’s test (p ≤ 0.05). df: degrees of freedom; SS: sum of squares; MS: mean squares.
Table 2. Eigenvalue, percent of explained variance, and cumulated percentage of explained variance by the five principal components (Dim.) extracted.
Principal
Component
EigenvalueVariance Explained
(%)
Cumulated Variance Explained (%)
Dim. 114.7461.461.4
Dim. 25.9824.986.3
Dim. 32.279.595.8
Dim. 40.632.698.4
Dim. 50.381.6100.0
Table 3. Main genetic indexes of diversity. Na: number of different alleles; ASR: allelic size range in bp; I: Shannon Index of Diversity; Ho: observed heterozygosity; PIC: polymorphic information content; E5: evenness.
LocusNaASR (bp)IHoPICE5
DCA35228–2501.310.830.670.73
DCA45128–1601.420.830.720.82
DCA53198–2060.720.500.400.64
DCA95162–2061.551.000.780.95
DCA166124–1761.470.830.690.68
DCA175102–1401.591.000.790.97
DCA186171–1851.630.830.780.85
GAPU476187–2031.701.000.810.92
GAPU71b4124–1441.311.000.710.90
UDO317106–1501.790.670.810.83
Disclaimer/Publisher’s Note: The statements, opinions and data contained in all publications are solely those of the individual author(s) and contributor(s) and not of MDPI and/or the editor(s). MDPI and/or the editor(s) disclaim responsibility for any injury to people or property resulting from any ideas, methods, instructions or products referred to in the content.

