Article

Monitoring the Microbiomes of Agricultural and Food Waste Treating Biogas Plants over a One-Year Period

1
Department of Agronomy Food Natural Resources Animals and Environment (DAFNAE), Waste to Bioproducts-Lab, University of Padova, Agripolis, Viale dell’Università 16, 35020 Legnaro, PD, Italy
2
Department of Biology (DiBio), University of Padova, Via U. Bassi 58/b, 35121 Padova, PD, Italy
3
S.E.S.A. S.p.A., Via Comuna 5/b, 35042 Este, PD, Italy
*
Author to whom correspondence should be addressed.
These authors equally contributed to the work and shared last authorship.
Appl. Sci. 2023, 13(17), 9959; https://doi.org/10.3390/app13179959
Submission received: 30 June 2023 / Revised: 29 August 2023 / Accepted: 31 August 2023 / Published: 3 September 2023

Abstract

:
The knowledge of the microbiome in the anaerobic digestion (AD) is critical for stabilizing the process and optimizing the biogas yield. This work investigates the microbial ecology in four full-scale biogas plants with different feedstocks and process parameters. The three agricultural plants sharing similar feedstocks’ composition (mostly rich in proteins, cellulose and hemicellulose), have several hydrolytic and methanogenic species in common, suggesting that their substrates specifically shape the microbiomes. Particularly, the hydrolytic and likely syntrophic Defluviitoga tunisiensis was detected as the most abundant species in one reactor, representing 21.2% of the community. On the other hand, the biogas plant treating the organic fraction of municipal solid waste (OFMSW), whose composition was much higher in hash and lower in proteins, displayed a quite different microbiome with a much lower abundance of Bacteroidales sp. much higher of Clostridiaceae. Moreover, this AD was clearly influenced by COVID-19 restrictions as both substrate availability and composition suddenly changed causing the wash-out of most bacterial and methanogenic species and leading to a deep modification of the microbial structure. The abundance of Methanosarcina flavescens greatly increased up to 36.5% of the total operational taxonomic units (OTUs), suggesting a switch from the hydrogenotrophic to the acetoclastic methanogenic pathway. This is the first report on the COVID-19 impact on the AD microbiome of a full-scale anaerobic digestor. Moreover, this paper demonstrated that the feedstock composition can differentially shape both bacterial and archaeal strains of the AD process.

Graphical Abstract

1. Introduction

Biogas production from anaerobic digestion (AD) of organic matter is a worldwide renewable technology that has become very relevant in recent decades. AD is an attractive approach to both recover renewable energy and valorize biowaste through the production of biogas and biomethane [1,2]. The process consists of four steps: hydrolysis, acidogenesis, acetogenesis, and methanogenesis. The sequential conversion of organic matter into simpler intermediate molecules, such as volatile fatty acids (VFAs), H2, and CO2 leads to the production of biogas containing CO2 and CH4 in variable percentages as main components [3]. The intricate process of AD involves the concerted effort of microorganisms that work in a coordinated manner, playing a specific role through metabolic cooperation [4,5].
The efficiency of the process is heavily reliant on the composition of the microbiome, making the understanding of microbial structure a crucial aspect for optimizing digestion and increasing methane yield [6]. Therefore, extensive research has been conducted to comprehend anaerobic communities and elucidate the biological roles of the species involved [7]. The emergence of new generation sequencing (NGS) technologies and the advancements in the field of bioinformatics facilitated the exploration of microbial population structures and the study of metabolic potential within the anaerobic microbiomes. Specifically, this approach can examine the evolution of communities under specific process conditions, and it can follow the dynamicity of populations through a snapshot analysis [8]. 16S rRNA gene sequencing provides a rapid response on the most abundant species in the biogas system, while the whole genome analysis (metagenomic) offers a deeper knowledge on the bacteria and archaea populating the community by assembling genomes to Metagenome Assembled Genomes (MAGs) [9]. However, despite the numerous studies, a more extensive comprehension of the functional activity of single microbes and the microbial interactions in the AD system remains a relevant challenge.
AD community and performance efficiency are influenced by the source of inoculum, as well as the processed substrates [8,10]. However, Campanaro et al. [11] have revealed the existence of a functional core of microorganisms common to various biogas plants. As such, the exploration of AD ecology may help in the comprehension of the correlation between substrate and anaerobic microbiomes. Changes in substrate composition or organic source overload can cause alterations in the microbial structure, resulting in process imbalances and modification of the microbiome’s stability [12,13]. As a result, ongoing studies are focused on understanding the relationship between feedstock macrostructure and the bacterial and archaeal communities [14,15].
Nowadays, in Italy, most biogas plants co-digest residues from farms and agro-food industries, such as sewage, manure, silages, or vegetables [16,17]. As such, to investigate the microbiome compositions of anaerobic digestors treating feedstocks mostly adopted in Italy, four full-scale anaerobic biogas digesters, three treating agricultural and zootechnical residues into biogas, and one dealing with the organic fraction of municipal solid waste (OFMSW) were specifically selected in this study. The final goal is to elucidate at what level the different substrates shape the microbial compositions of AD plants. Such insight will be relevant towards a deeper understanding of the role of microbes in boosting biogas yields from different waste streams.

2. Materials and Methods

2.1. Sampling and DNA Extraction

Four thermophilic biogas plants located in the Veneto region (Italy) were selected to be regularly sequenced every two months over a period of one year. As reported in Table 1, three digesters (D1, D2, D3) were fed in different fractions with agricultural byproducts and poultry manure quite abundant in Italy and available as feedstocks for the production of valuable bioproducts [18,19,20,21,22]. The last biogas plant (D4) treated OFMSW which underwent a preliminary step of household collection and separation (Table 1). All reactors operated at stable conditions. The samples were initially filtered to remove the large particles and centrifuged to separate the supernatant from the pellet (4000 rpm, 15 min at 4 °C). DNeasy PowerSoil® (QIAGEN GmbH, Hilden, Germany) was used for genomic DNA extraction, modifying the protocol as previously reported [13]. Briefly, the cells are lysed using an additional step of phenol/chloroform/isoamyl alcohol (25:4:1) (PCIAA) in Eppendorf-containing beads for sample purification. DNA quality and concentration were further measured using NanoDrop 1000 (Thermofisher, Waltham, MA, USA) and Qubit 2.0 fluorometer (Invitrogen, Waltham, MA, USA). DNA extractions were conducted in triplicate.

2.2. Analytical Methods

Total Solids (TS), Volatile Solids (VS), ammonium nitrogen (NH4+-N), Total Kjeldahl Nitrogen (TKN), Flüchtige Organische Säuren (FOS), Totales Anorganisches (TAC), and pH were measured for each sample according to APHA standard methods for the examination of water and wastewater [23]. pH, NH4+-N, FOS, and TAC values, provided by the owners of each biogas plant, are more frequent than the sampling times of the digestates for the DNA extraction.
The macromolecular composition of each sample was analyzed in terms of ash, starch, hemicellulose, cellulose, lignin, protein, and lipids according to international standard methods [24]. Biogas production and organic matter removal rate were not monitored in this study because of the specific operational contexts of the four study digestors. All the digestors, indeed, cannot assess the organic matter removal and utilize a reservoir-based collection system where biogas is accumulated and utilized for electricity production through combustion. As such, the biogas owners and managers do not monitor both the quantity and quality of the produced biogas.

2.3. Sequencing Data Analysis and Statistical Correlations

Microbial composition was determined by amplifying the hypervariable V4 region of bacterial and archaeal 16S rRNA gene. PCR amplicons were generated in 50 μL PCR reaction mixtures using the following conditions: 0.5 μM both forward and reverse degenerate primers 515F-806R, 10 ng template DNA, 10 μL 5× Phusion high-fidelity (HF) buffer containing 200 μM each deoxynucleotide in a master mix, molecular biology grade water, and 1 unit (0.5 μL) of Phusion high-fidelity DNA polymerase. Cycling conditions include initial denaturation at 98 °C for 3 min, followed by 35 cycles of denaturation at 95 °C for 45 s, annealing at 58 °C for 45 s, and extension at 72 °C for 50 s, and a final extension phase was conducted at 72 °C for 5 min. Amplicons’ quality was assessed with gel electrophoresis using 0.8% agarose gel. Amplicons were purified through AMPure XP beads (Beckman Coulter, Brea, CA, USA), libraries were prepared with Nextera XT (Illumina, San Diego, CA, USA) and sequenced with Illumina Miseq System Platform at BMR Genomics srl (Padova, Italia). Raw sequences were submitted to the NCBI sequence read archive database (SRA) under the BioProject PRJNA982054. Raw sequencing data were analyzed using CLC Genomics Workbench (V.20.0.4) as previously reported [13]. Briefly, reads were trimmed and filtered to remove the low-quality and chimeral sequences, operational taxonomic units (OTUs) were clustered and alpha and beta diversity were calculated. The most abundant OTUs (>1% in at least one of the sampling points) were taxonomically verified by BLAST at NCBI using the 16S ribosomal RNA database. Multi experiment viewer software (MeV 4.9.0) [25] was used for heatmap drawing and hierarchical clustering of the 73 most abundant OTUs, which were selected considering their abundance according to the values obtained at each sampling point. In short, the relative abundances of the OTUs were used to compare the profile of each digester and follow the specific dynamic of their populations. InteractiVenn [26] was adopted to represent the distribution of the most representative OTUs per reactor among the total selected. PCoA plot was performed using STAMP (STatistical Analysis of Metagenomic Profiles) [27].

3. Results

3.1. Chemical Characterization and Composition of the Digestates of the Selected Full-Scale Anaerobic Digesters

Four full-scale biogas plants operated in Veneto (Italy) were selected to be monitored for one year in terms of both their microbiomes and the chemical compositions of their digestates. According to their substrates (Table 1), the studied biogas plants can be classified into two categories, including agricultural plants (D1, D2, and D3) and an OFSMW-treating digester (D4).
The qualitative and quantitative composition of their digestates, including cellulose, hemicellulose, lipids, proteins, and ashes, has been first investigated (Figure 1a). The agricultural AD plants exhibit similar characteristics in terms of dry matter content (approximately 9.86%), ash, protein, and hemicellulose, with values around 26, 24, and 12% of the dry weight, respectively (Figure 1a). Lignin and cellulose are generally higher in D2 and D3, compared to the levels detected in the digestate of the plant D1 (approximately 7 and 10% of the dry weight, respectively).
Except for starch and lipids content, which were similar in all four digesters, the composition of the D4 plant fed with OFMSW was notably different (Figure 1a). The plant had a very high ash concentration (about 49% in dry weight) and significantly lower protein content compared to the agricultural plants, with proteins, cellulose, and hemicellulose present, on average, at concentrations of 15, 5, and 6% of dry matter, respectively. The dry matter content of D4 digestate was 11.9% till the summer period, after which a significant decrease occurred, specifically dropping to 6.83% in July (Figure 1a). This decrease was due to the reduction of food waste availability during COVID-19 restrictions and transport limitations, suggesting that the digestate has been diluted. Further analysis conducted in the same month revealed a significant increase in lipid and cellulose levels, as well as a noteworthy decrease in ash content (Figure 1a).
Parameters such as pH, N-NH₄⁺, FOS, TAC, and the FOS/TAC ratio were also monitored in all the selected biogas plants. The average pH values observed in the agricultural biogas systems were found to be stable within the alkaline range of 8.28–8.32, slightly higher considering the optimal values for a biogas process indicated in the literature [2,3]. Similarly, the FOS/TAC ratio and the N-NH₄⁺ content was stable, with average values of 0.31, 0.24 and 0.27, and 3541, 3568, and 3788 mg N/Kg for D1, D2, and D3, respectively. Overall, while the digesters D1, D2, and D3 showed constant kinetics throughout the monitored period (Figure S1), the values of the biogas plant D4 greatly varied in summer as a consequence of the sharp decrease in OFMSW availability due to COVID-19-related restrictions (Figure 1b,e). The pH value suddenly and sharply decreased, indicating a significant shift in the AD stability. The FOS and TAC parameters also underwent substantial alterations, leading to a FOS/TAC ratio as high as 4, significantly deviating from the optimal value around 0.3. This is clear from Figure 1e which shows the simultaneous increase of FOS values, attributable to high levels of VFAs in the digestate which further causes a drop of pH (Figure 1b), and the reduction of buffer capacity. This calls for an unbalance in the activity of methanogenic archaea, which were unable to efficiently process acetic acid into CH4. As indicated in the Materials and Methods section, due to the specific operational context of the four industrial digestors, neither biogas production nor organic matter removal rate were monitored. As such, both indicators are missing and could be of great importance to assess the fermentation efficiency of the full-scale anaerobic digestors.

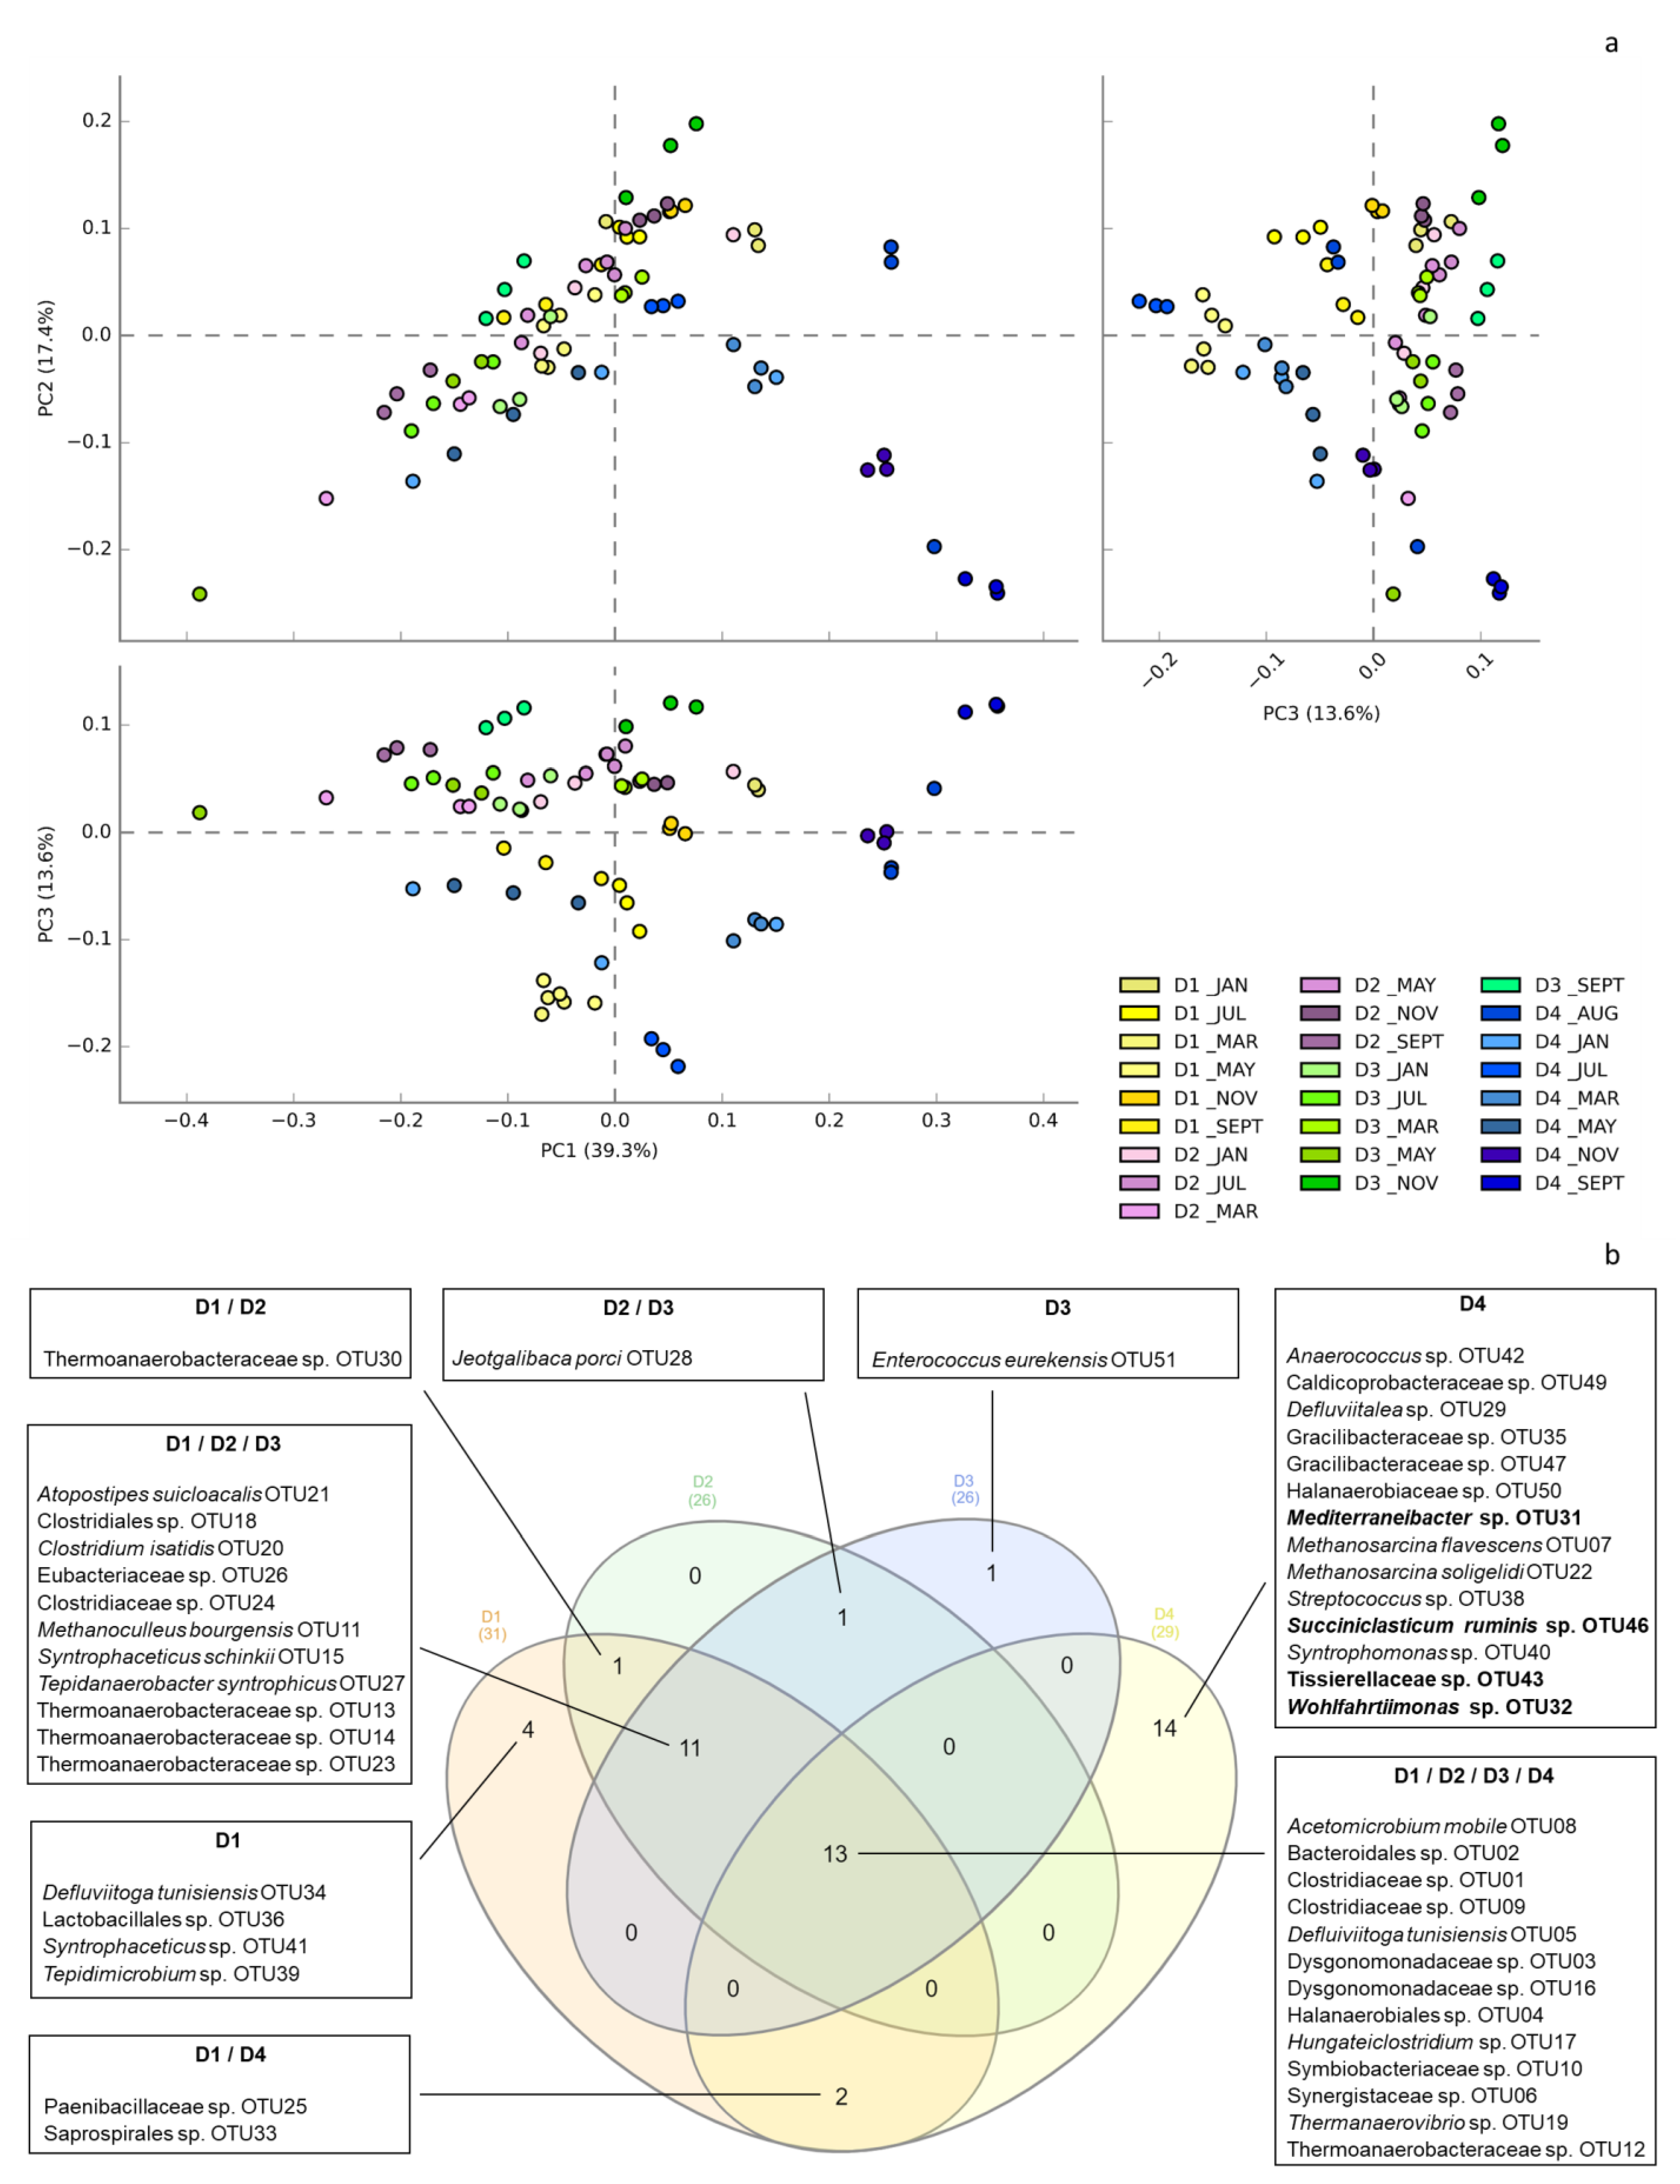
3.2. Global Overview of the Microbial Ecology in the Monitored AD Plants

The monitoring of bacterial and archaeal compositions of the four selected AD plants was obtained using 16S rRNA gene sequencing. The main results are reported in Table 2. About 48% of the sequenced reads from the digesters D2 and D3 have been assigned to OTUs, while for D1 and D4 the percentage is slightly lower, 41 and 40%, respectively. Alpha diversity indexes were similar for D2-D4 and slightly higher in the case of D1. Rarefaction curves (Figure S2) show that adequate sequencing depth was achieved to thoroughly describe the microbial community. Given the negligible impact of the less abundant OTUs on the production of intermediate compounds and biogas, only the 73 OTUs with a relative abundance higher than 0.5% in at least one of the three replicates have been considered in the following analyses. Particularly, the dominant OTUs account, on average, for 85% of the diversity of the microbial community in the biogas plants.
The beta diversity was represented in Figure 2a as a principal coordinate analysis (PCoA) plot. PCo1, PCo2, and PCo3 explained 39.3, 17.2, and 13.6% of the total diversity, respectively. As expected, samples collected from agricultural plants were clearly clustered in restricted areas and well-separated from samples of reactor D4. This finding can be ascribed to the major contribution of the feedstocks (agricultural vs. municipal waste) in shaping the microbiome (Table 1). The marked difference in feedstock composition and microbial structure resulted also in a different digestate composition (Figure 1a).
Moreover, the three agricultural AD plants were characterized by a stable microbial composition, whereas the D4 showed clear microbial changes throughout the monitored period (Figure 2a). This agrees with recent surveys on the monitoring of microbiomes of agricultural and food waste-treating AD plants [28,29]. The progressive shift in the microbiome composition experienced by D4 is evident in Figure 2a where the dots form a long tail diverging from the central cluster.
At a higher taxonomic level, Firmicutes, followed by Bacteroidetes, and Synergistetes were found to be the predominant phyla in all the AD plants (Figure S3), in agreement with previous studies [10,28], while Thermotogae specifically contributed to the hydrolysis and fermentation of nutrient sources in D1 and D4. Among the methanogenic archaea, the identified microbes belong to the orders Methanosarcinales, Methanomicrobiales, and Methanobacteriales.
The microbial structure of D2 and D3 was nearly identical, dominated by Firmicutes (approximately 50.6%), Bacteroidetes and Synergistetes (about 21.2 and 8.6%, respectively), while Euryarchaeota was less than 1.6% on average. D1 had a slightly different microbial distribution with a lower frequency of Firmicutes and Bacteroidetes but an increased abundance of Thermotogae. Due to its specific feedstock (OFMSW), and in line with the data displayed in the PCoA (Figure 2a), plant D4 exhibited a different microbial population. Notably, the methanogenic Euryarchaeota was found to be one of the second most abundant phyla (13.7%) after Firmicutes, with a relative abundance 8 times higher than those of the other digesters (Figure S3). However, to ensure an accurate analysis of microbial systems more detailed information about the taxonomic assignment of OTUs is required. A more precise taxonomic assignment was tentatively performed using results obtained from the Blast, but authors are aware that species-level assignment from 16S rRNA analysis could be misleading. Results reported at the species level should be indeed considered with caution.
A first comparison between the four digesters is shown in Figure 2b, where the OTUs with a relative abundance higher than 0.5% were reported. 13 of the dominant OTUs were common to all microbiomes, including members of the families Clostridiaceae, Bacteroidales, Dysgonomonadaceae and Halanaerobiales. Putative acetogenic bacteria, such as Synergistaceae sp. OTU06, are also present in this common core microbiome, as well as bacteria likely able to establish putative syntrophic relationships with hydrogenotrophic archaea, including Defluviitoga tunisiensis OTU05 and Acetomicrobium mobile OTU08 as recently proposed by Zampieri and colleagues [30]. The three agricultural digesters shared an additional cluster of 11 OTUs, most of them already reported in the literature [15,28,29], including the syntrophic acetate oxidizing bacterium (SAOB) Syntrophaceticus schinkii OTU15 and its methanogenic partner Methanoculleus bourgensis OTU11. The microbiomes present in D2 and D3 further share the species Jeotgalibaca porci OTU28, which uses a range of different sugars for growing, while D1 and D2 have just one more OTU in common. Moreover, D1 and D3 have four and one plant-specific OTUs. Specifically, Enterococcus eurekensis OTU51 may be one of the major players in the hydrolysis of starch in digester D3 [31].
Fourteen specific OTUs, including both bacterial and archaeal representatives, were found in the case of the D4 plant. A similar core microbiome specifically tailored for the AD of food waste was already reported [28,32,33]. In addition to the numerous OTUs taxonomically assigned to family level, saccharolytic species such as Defluviitalea sp. OTU29, Mediterraneibacter sp. OTU31, Streptococcus sp. OTU38, and peptone and amino acid fermenting Anaerococcus sp. OTU42 were also found in the D4 reactor. Their products are degraded by VFAs oxidizer bacteria, represented by the particularly abundant Syntrophomonas sp. OTU40 and, probably, by species of Wohlfahrtiimonas genus (i.e., OTU32). Interestingly, D4 displayed the highest abundance of archaeal OTUs in the studied AD plants, which further differentiates it from the other microbiomes. As previously discussed, this finding suggests the presence in reactors D1-D3 of a high fraction of hydrolytic species involved in polysaccharides utilization that dwarfed the relative abundance of methanogens [9]. Moreover, the high content in Methanosarcina species (OTU07 and OTU22) in D4 highlights a potential massive utilization of the acetoclastic pathway, instead of the prevailing hydrogenotrophic pathway employed by the methanogenic archaea in the other digesters. Finally, except for the 13 OTUs above mentioned, only two other OTUs from D4 were common with the agricultural plant D1, further confirming the heterogeneity of this microbiome compared to the others.

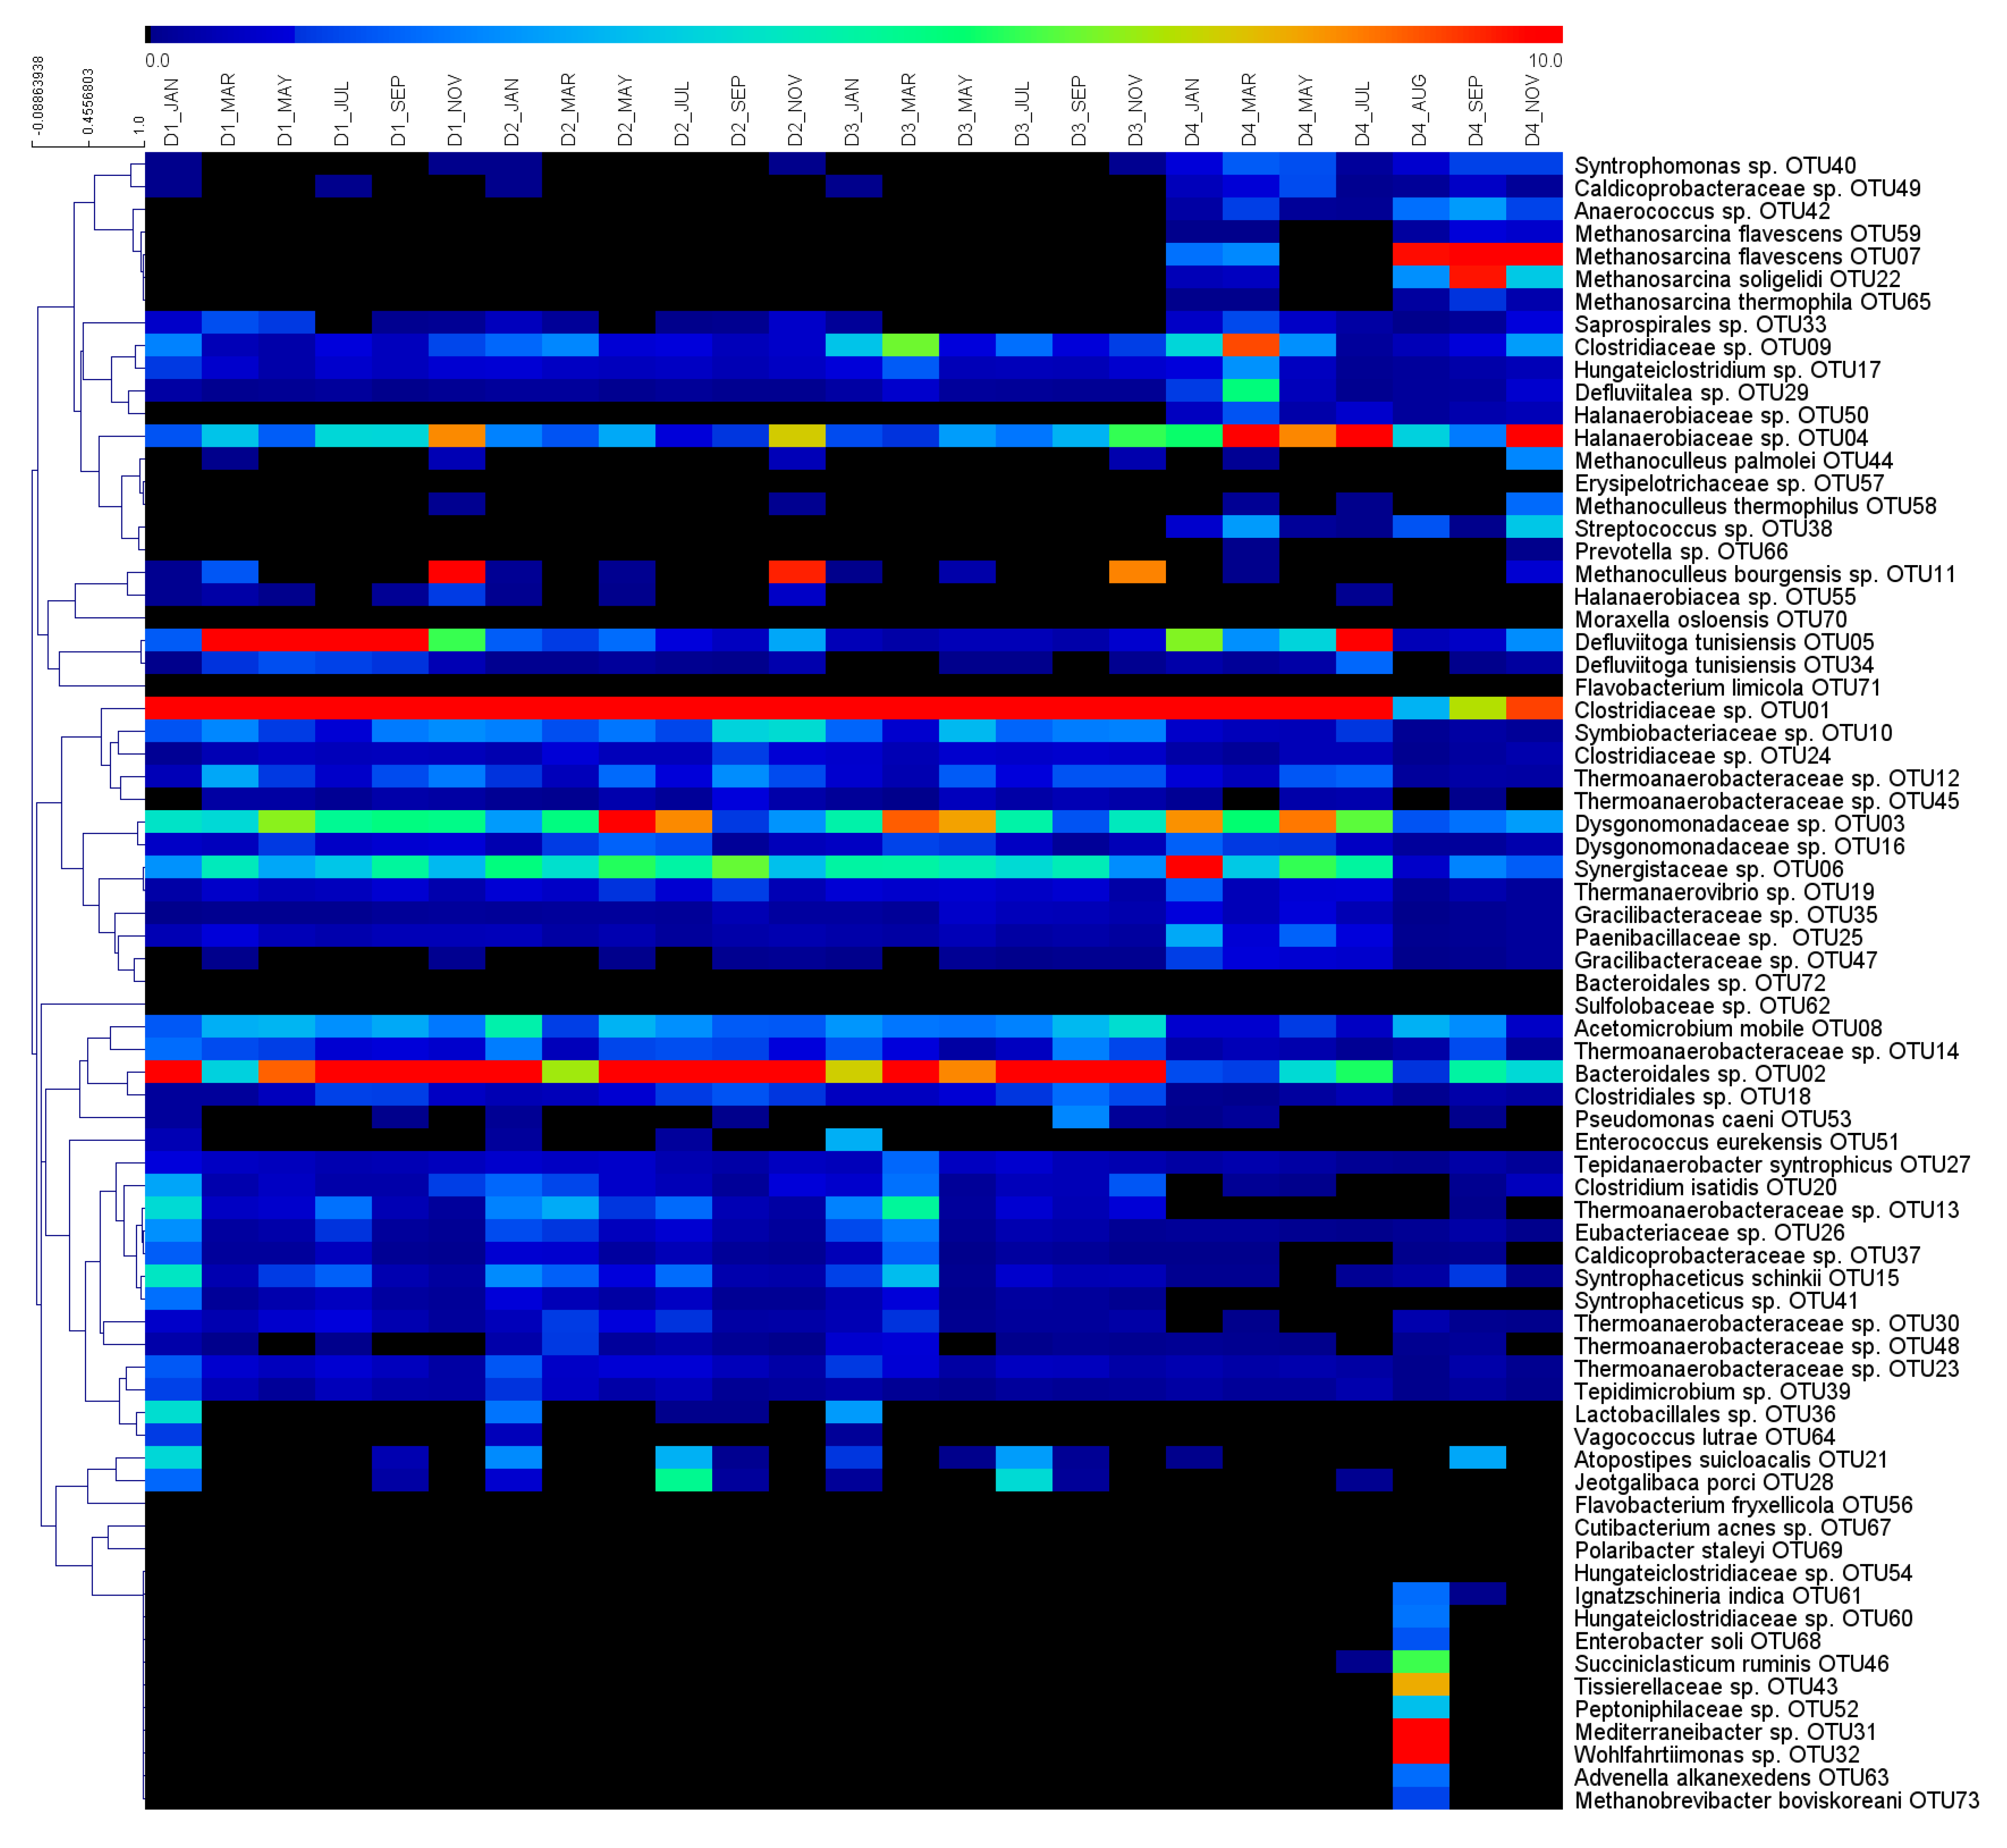
3.3. Dynamics of Microbial Populations

The heatmap in Figure 3 depicts the evolution of microbial communities represented as changes in the distribution of the 73 dominant OTUs.
D1 exhibited a stable profile, where the most relevant variations are associated with the first months of the year, showing a change in OTUs abundance from January (D1_JAN) to March (D1_MAR). These fluctuations were followed by a stabilization period up to September (D1_SEP), followed by an alteration in November (D1_NOV). These changes were in agreement with the variation in the macromolecular composition of digestates (Figure 1a). Specifically, the bacterial OTUs were the most significantly affected by the change between D1_JAN and D1_MAR. Bacteroidales sp. OTU02, Thermoanaerobacterales sp. OTU13, Syntrophaceticus schinkii OTU15, Atopostipes suicloacalis OTU21, and Lactobacillales OTU36 are all decreased in D1_ MAR, while D. tunisiensis OTU05 and Dysgonomonadaceae sp. OTU03 increased in this same period and then reduced their abundance in the later sampling D1_ NOV. This suggests that the mentioned OTUs are responsible for the hydrolysis of abundant recalcitrant polysaccharides (i.e., cellulose and hemicellulose) and the fermentation of their monomers along the whole year [34,35], replacing the metabolic activity of the previous OTUs. Furthermore, it has been found that members of Dysgonomonadaceae participate in the hydrolysis of complex protein substrates [36], as such, the fluctuations of Dysgonomonadaceae sp. OTU03 and Synergistaceae sp. OTU06 in the same period, are likely due to the competition for the same substrate, since both families are known for the efficient utilization of sugars and proteins [37,38]. Competitive effects are among the most important microbial interactions and have a very important role in shaping the anaerobic digestion systems [4,30].
Interestingly, the hydrolytic Clostridiaceae sp. OTU01, although fluctuating along the year, showing a peak in March (27.0%) and a trough in July (17.6%) in D1, was the prevalent microbe also in the other reactors (Figure 3). In fact, similar abundances and metabolic activities are reported when cellulose and hemicellulose are the main components of the AD feedstocks [39], as for D1, D2, and D3 digesters (Figure 1a). Moreover, it is widely reported in the literature that members of this family, such as C. thermocellum or C. cellulolyticum, are involved in recalcitrant lignocellulosic compounds degradation supported by cellulolytic and hemicellulolytic enzymes such as endoglucanases and glycoside hydrolases [40,41,42]. Bacteroidales sp. OTU02 underwent a slight reduction in March but gradually increased again from May onwards (D1_MAY), highlighting its crucial involvement in the anaerobic degradation of the processed agricultural substrates. On the same line, the hydrolytic and homoacetogenic D. tunisiensis OTU05 increased 12-fold during March, and reached 21.2% of the community in May (D1_ MAY), but then exhibited a fall to 6.5% in December. The unexpected development of this species is likely due to its metabolic flexibility since the fermentative activity of D. tunisiensis enables the utilization of simple sugars as well as cellulose, chitin, and xylan [43]. Additionally, the genome analysis of D. tunisiensis underscores the potential for syntrophic interactions with methanogenic archaea, as this bacterium is predicted to produce acetate, CO2, and H2 as fermentation end-products [34]. Finally, variations in the microbial structure in D1_NOV were related to the bacterial Halanaerobiaceae sp. OTU04 and the methanogenic species M. bourgensis OTU11. This can be explained considering a positive interaction established between homoacetogenic bacteria and their hydrogenotrophic partners determined a significant increase in archaeal abundance, leading to an increment of M. bourgensis OTU11 from 0.1 to 10.3% from January to December. This trend seems to be similar also in the case of the other two agricultural AD plants. It is noteworthy that, over the course of the last few months, the abundance of Methanoculleus thermophilus OTU58 increased significantly from 0.003 to 0.1%, confirming an increased role of the hydrogenotrophic pathway in D1.
The microbiome composition over time for reactors D2 and D3 can be considered quite similar, showing a remarkable predominance of the bacteria Clostridiaceae OTU01 and Bacteroidales OTU02. Their abundance can be explained by considering the huge amount of polysaccharides and proteins available in the feedstocks co-processed in both reactors (Table 1, Figure 1a). Moreover, Dysgonomonadaceae sp. OTU03 and Synergistaceae sp. OTU06 are highly abundant species which fluctuate with a similar dynamicity in both digesters throughout the year. Specifically, in both communities, the Dysgonomonadaceae sp. OTU03 abundance increased in the first half of the year, then decreased from July down to levels below 1.5% in September in both microbiomes. This trend seems to follow the protein concentration (Figure 1a) suggesting that Dysgonomonadaceae sp. OTU03 plays a relevant role in protein hydrolysis, in agreement with the study of Maus and colleagues [7]. Similarly, to the taxonomy of D1, the most frequently detected methanogenic species in D2 and D3 is the hydrogenotrophic M. bourgensis OTU11, which rapidly increased in the last period, rising from undetectable levels to 9.5 and 8.5%. In addition, a similar trend was observed for Halanaerobiales sp. OTU04, a member of a taxonomic order known for being halophilic and consuming cellulose-based substrates [44].
A different scenario is depicted by the heatmap when referring to reactor D4, which provides evidence of a clearly distinct microbiome. The five dominant OTUs (OTU01 and OTU03-OTU06) exhibit a relatively stable trend in the first three time points, followed by a reduction in abundance in the second half of the year. These species experienced a significant decrease from July, and while Clostridiaceae sp. OTU01 and Halanaerobiales sp. OTU04 increased again in December, Dysgonomonadaceae sp. OTU03, D. tunisiensis OTU05 and Synergistaceae sp. OTU06 significantly reduced their abundance. Bacteroidales sp. OTU02, typically dominant in the other monitored digesters, was much less abundant in D4, although it increased from May on. However, as already mentioned, the COVID-19-related issues determined a reduction in substrate availability, which could have triggered the wash-out of most of the microbes. As such, a deep alteration in the microbiome occurred, since many microbial species experienced a strong reduction, while different species started colonizing the anaerobic environment. In this context, the sharp decline in biogas production in digester D4, triggered by the substrate limitation, led the authors to increase sampling frequency to obtain a more detailed microbial insight. As expected, the genomic analysis of the sampling D4_AUG revealed a deeply perturbed microbiome in comparison to the profile obtained at D4_JUL. The prevalent bacteria involved in the hydrolysis of the organic matter of D4 were replaced by new species, such as Mediterraneibacter sp. OTU31, Wohlfahrtiimonas sp. OTU32, Tissierellaceae sp. OTU43 and Succiniclasticum ruminis OTU46. Particularly, the increase in abundance of Mediterraneibacter sp. OTU31 was likely driven by the increment of lipid content in the feedstock of digester D4 (Figure 1a) since this genus is well-known for its efficient lipolytic enzymes [45].
The archaeal population in D4 initially represented a small fraction of the community, consisting of few OTUs belonging to the genus Methanosarcina. This is in accordance with the low abundance of archaeal species found in the case of the other three monitored digesters. This finding should be mostly ascribed to a huge abundance of hydrolytic and fermenting bacterial species rather than to 16S rRNA sequencing biases, which were minimized in this paper by adopting the best practices reported in the recent literature [9,14,15]. Overall, despite PCR and primer biases, the 16S rRNA sequencing method remains a valuable and practical tool for analyzing microbial communities in biogas plants [7,9,14,34]. The samplings D4_MAY and D4_JULY showed a significant contraction of the methanogenic community, which explains the reduction in methane production experienced by the biogas plant. However, in the following period, new archaeal OTUs began to colonize the digester, and among them, Methanosarcina flavescens OTU07 and OTU59, Methanosarcina soligelidi OTU22, Methanosarcina thermophila OTU65, and Methanobrevibacter boviskoreani OTU73 can be recognized. Specifically, while the last species grows only using CO2 and H2 [46], the genus Methanosarcina is known to be metabolically versatile. In fact, most microorganisms taxonomically assigned to Methanosarcina can employ all three pathways to produce methane despite their preference for the acetoclastic one [47,48]. Although at low levels, the presence in the first sampling points of hydrogenotrophic species such as Methanoculleus sp. OTU11, OTU44, and OTU58 or M. boviskoreani OTU73, besides metabolically switchable species of Methanosarcina, may indicate that the prevalent pathway was the one converting H2/CO2 to methane. Interestingly, the following samplings D4_SEP and D4_NOV revealed that M. flavescens OTU07 stabilized as the main species, increasing up to 36.5% of the total microbiome (Figure 3). The reduction of the bacterial OTU01-OTU06 likely led to a higher production of VFAs (including acetic acid) by the new OTUs, such as Mediterraneibacter sp. OTU31, Wohlfahrtiimonas sp. OTU32 and Succiniclasticum ruminis OTU46 [45,49,50]. The pH, FOS, and TAC values monitored in D4_5 and D4_6 (Figure 1b–e) strengthen these hypotheses, as the pH drastically decreased, and FOS increased up to values typical of unstable AD systems. These findings suggest a shift in the main route of methane production from the hydrogenotrophic to the acetoclastic pathway dominated by Methanosarcina [47,51]. Moreover, the evidence that in the same period, the archaeal species of Methanoculleus were not detected further supports this hypothesis.
Further sampling and taxonomic analyses are currently ongoing to assess if the newly dominating archaeal OTUs have been permanently involved in the AD as key players of the D4 microbiome, or, alternatively, have been replaced by hydrogenotrophic strains which were the main archaeal components before the COVID-19 related feedstock shortage.

4. Conclusions

Investigation of four biogas plants located in the same area of Italy revealed a core AD microbiome, with specific bacterial and archaeal OTUs found to be common. The microbiomes of the selected digestors were specifically shaped by their feedstocks, and, for the first time, this paper reported that an AD plant was deeply and negatively affected by the shortage of feedstock (i.e., OFMSW) due to COVID-19-related transportation issues. The microbiome was significantly altered, with sharp shifts mostly related to its bacterial fractions, which were temporarily washed out, whereas the archaeal species Methanosarcina became dominant and was able to constantly populate the reactor later on.
Overall, this research further highlights the relevance of metagenomic insights in AD towards a deeper understanding of the correlation between the species abundance, feedstocks characteristics, availability, and AD parameters.

Supplementary Materials

The following supporting information can be downloaded at: https://www.mdpi.com/article/10.3390/app13179959/s1, Figure S1: Monitoring of pH, N-NH4+, FOS, TAC and FOS/TAC ratio in the biogas plants D1, D2, D3; Figure S2: Rarefaction curves of annotated species richness in reactors’ samples extracted in triplicates; Figure S3: Taxonomic classification at phylum level in the four reactors. D1; D4; D2; D3.

Author Contributions

Conceptualization, L.T., S.C. and L.F.; methodology, D.P., M.Z., L.T., S.C. and L.F.; software, L.T.; validation L.T., S.C. and L.F.; formal analysis, F.M., L.T. and L.F.; investigation, F.M., D.P. and M.Z.; resources, L.T., S.C. and L.F.; data curation, S.A. and F.M.; writing—original draft preparation, S.A.; writing—review and editing, S.C. and L.F.; visualization, S.A.; supervision, L.T. and L.F.; project administration, L.F.; funding acquisition, L.T., S.C. and L.F. All authors have read and agreed to the published version of the manuscript.

Funding

This research was financially supported by S.E.S.A. S.p.a. (FAVA_EPPR19_01).

Institutional Review Board Statement

Not applicable.

Informed Consent Statement

Not applicable.

Data Availability Statement

Raw sequences are available on NCBI sequence read archive database (SRA) under the BioProject PRJNA982054.

Conflicts of Interest

The authors declare no conflict of interest.

References

  1. Atelge, M.R.; Atabani, A.E.; Banu, J.R.; Krisa, D.; Kaya, M.; Eskicioglu, C.; Kumar, G.; Lee, C.; Yildiz, Y.Ş.; Unalan, S.; et al. A Critical Review of Pretreatment Technologies to Enhance Anaerobic Digestion and Energy Recovery. Fuel 2020, 270, 117494. [Google Scholar] [CrossRef]
  2. Brojanigo, S.; Alvarado-Morales, M.; Basaglia, M.; Casella, S.; Favaro, L.; Angelidaki, I. Innovative Co-Production of Polyhydroxyalkanoates and Methane from Broken Rice. Sci. Total Environ. 2022, 825, 153931. [Google Scholar] [CrossRef] [PubMed]
  3. Li, Y.; Chen, Y.; Wu, J. Enhancement of Methane Production in Anaerobic Digestion Process: A Review. Appl. Energy 2019, 240, 120–137. [Google Scholar] [CrossRef]
  4. Basile, A.; Campanaro, S.; Kovalovszki, A.; Zampieri, G.; Rossi, A.; Angelidaki, I.; Valle, G.; Treu, L. Revealing Metabolic Mechanisms of Interaction in the Anaerobic Digestion Microbiome by Flux Balance Analysis. Metab. Eng. 2020, 62, 138–149. [Google Scholar] [CrossRef] [PubMed]
  5. Pan, X.; Zhao, L.; Li, C.; Angelidaki, I.; Lv, N.; Ning, J.; Cai, G.; Zhu, G. Deep Insights into the Network of Acetate Metabolism in Anaerobic Digestion: Focusing on Syntrophic Acetate Oxidation and Homoacetogenesis. Water Res. 2021, 190, 116774. [Google Scholar] [CrossRef] [PubMed]
  6. Theuerl, S.; Klang, J.; Heiermann, M.; De Vrieze, J. Marker Microbiome Clusters Are Determined by Operational Parameters and Specific Key Taxa Combinations in Anaerobic Digestion. Bioresour. Technol. 2018, 263, 128–135. [Google Scholar] [CrossRef] [PubMed]
  7. Maus, I.; Klocke, M.; Derenkó, J.; Stolze, Y.; Beckstette, M.; Jost, C.; Wibberg, D.; Blom, J.; Henke, C.; Willenbücher, K.; et al. Impact of Process Temperature and Organic Loading Rate on Cellulolytic/Hydrolytic Biofilm Microbiomes during Biomethanation of Ryegrass Silage Revealed by Genome-Centered Metagenomics and Metatranscriptomics. Environ. Microbiome 2020, 15, 7. [Google Scholar] [CrossRef] [PubMed]
  8. Duan, N.; Kougias, P.G.; Campanaro, S.; Treu, L.; Angelidaki, I. Evolution of the Microbial Community Structure in Biogas Reactors Inoculated with Seeds from Different Origin. Sci. Total Environ. 2021, 773, 144981. [Google Scholar] [CrossRef]
  9. Campanaro, S.; Treu, L.; Rodriguez-R, L.M.; Kovalovszki, A.; Ziels, R.M.; Maus, I.; Zhu, X.; Kougias, P.G.; Basile, A.; Luo, G.; et al. New Insights from the Biogas Microbiome by Comprehensive Genome-Resolved Metagenomics of Nearly 1600 Species Originating from Multiple Anaerobic Digesters. Biotechnol. Biofuels 2020, 13, 25. [Google Scholar] [CrossRef] [PubMed]
  10. Abu Hanifa Jannat, M.; Hyeok Park, S.; Chairattanawat, C.; Yulisa, A.; Hwang, S. Effect of Different Microbial Seeds on Batch Anaerobic Digestion of Fish Waste. Bioresour. Technol. 2022, 349, 126834. [Google Scholar] [CrossRef] [PubMed]
  11. Campanaro, S.; Treu, L.; Kougias, P.G.; Luo, G.; Angelidaki, I. Metagenomic Binning Reveals the Functional Roles of Core Abundant Microorganisms in Twelve Full-Scale Biogas Plants. Water Res. 2018, 140, 123–134. [Google Scholar] [CrossRef] [PubMed]
  12. Fontana, A.; Kougias, P.G.; Treu, L.; Kovalovszki, A.; Valle, G.; Cappa, F.; Morelli, L.; Angelidaki, I.; Campanaro, S. Microbial Activity Response to Hydrogen Injection in Thermophilic Anaerobic Digesters Revealed by Genome-Centric Metatranscriptomics. Microbiome 2018, 6, 194. [Google Scholar] [CrossRef]
  13. Cardona, L.; Cao, K.A.L.; Puig-Castellví, F.; Bureau, C.; Madigou, C.; Mazéas, L.; Chapleur, O. Integrative Analyses to Investigate the Link between Microbial Activity and Metabolite Degradation during Anaerobic Digestion. J. Proteome Res. 2020, 19, 3981–3992. [Google Scholar] [CrossRef] [PubMed]
  14. Hashemi, S.; Hashemi, S.E.; Lien, K.M.; Lamb, J.J. Molecular microbial community analysis as an analysis tool for optimal biogas production. Microorganisms 2021, 9, 1162. [Google Scholar] [CrossRef] [PubMed]
  15. Yadav, M.; Joshi, C.; Paritosh, K.; Thakur, J.; Pareek, N.; Masakapalli, S.K.; Vivekanand, V. Reprint of Organic waste conversion through anaerobic digestion: A critical insight into the metabolic pathways and microbial interactions. Metab. Eng. 2022, 71, 62–76. [Google Scholar] [CrossRef] [PubMed]
  16. Mistretta, M.; Gulotta, T.M.; Caputo, P.; Cellura, M. Bioenergy from anaerobic digestion plants: Energy and environmental assessment of a wide sample of Italian plants. Sci. Total Environ. 2022, 843, 157012. [Google Scholar] [CrossRef] [PubMed]
  17. EBA. EBA Statistical Report 2022; EBA: Brussels, Belgium, 2022. [Google Scholar]
  18. Costa, P.; Basaglia, M.; Casella, S.; Favaro, L. Polyhydroxyalkanoate Production from Fruit and Vegetable Waste Processing. Polymers 2022, 14, 5529. [Google Scholar] [CrossRef]
  19. Cucchiella, F.; D’Adamo, I.; Gastaldi, M. Sustainable Italian cities: The added value of biomethane from organic waste. Appl. Sci. 2019, 9, 2221. [Google Scholar] [CrossRef]
  20. Czubaszek, R.; Wysocka-Czubaszek, A.; Tyborowski, R. Methane Production Potential from Apple Pomace, Cabbage Leaves, Pumpkin Residue and Walnut Husks. Appl. Sci. 2022, 12, 6128. [Google Scholar] [CrossRef]
  21. Favaro, L.; Basaglia, M.; Rodriguez, J.E.G.; Morelli, A.; Ibraheem, O.; Pizzocchero, V.; Casella, S. Bacterial production of PHAs from lipid-rich by-products. Appl. Food Biotechnol. 2019, 6, 45–52. [Google Scholar] [CrossRef]
  22. Gupte, A.P.; Basaglia, M.; Casella, S.; Favaro, L. Rice waste streams as a promising source of biofuels: Feedstocks, biotechnologies and future perspectives. Ren. Sustain. Energy Rev. 2022, 167, 112673. [Google Scholar] [CrossRef]
  23. APHA. Standard Methods for the Examination of Water and Wastewater; APHA: Washington, DC, USA, 2005. [Google Scholar]
  24. Brojanigo, S.; Parro, E.; Cazzorla, T.; Favaro, L.; Basaglia, M.; Casella, S. Conversion of starchy waste streams into polyhydroxyalkanoates using Cupriavidus necator DSM 545. Polymers 2020, 12, 1496. [Google Scholar] [CrossRef] [PubMed]
  25. Saeed, A.I.; Bhagabati, N.K.; Braisted, J.C.; Liang, W.; Sharov, V.; Howe, E.A.; Li, J.; Thiagarajan, M.; White, J.A.; Quackenbush, J. [9] TM4 Microarray Software Suite. Methods Enzymol. 2006, 411, 134–193. [Google Scholar] [CrossRef] [PubMed]
  26. Heberle, H.; Meirelles, G.V.; da Silva, F.R.; Telles, G.P.; Minghim, R. InteractiVenn: A Web-Based Tool for the Analysis of Sets through Venn Diagrams. BMC Bioinform. 2015, 16, 169. [Google Scholar] [CrossRef] [PubMed]
  27. Parks, D.H.; Beiko, R.G. Identifying Biologically Relevant Differences Between Metagenomic Communities. Bioinformatics 2010, 26, 715–721. [Google Scholar] [CrossRef]
  28. Calusinska, M.; Goux, X.; Fossépré, M.; Muller, E.E.; Wilmes, P.; Delfosse, P. A year of monitoring 20 mesophilic full-scale bioreactors reveals the existence of stable but different core microbiomes in bio-waste and wastewater anaerobic digestion systems Biotechnol. Biofuels 2018, 11, 196. [Google Scholar] [CrossRef]
  29. Liu, T.; Goux, X.; Calusinska, M.; Westerholm, M. Analyzing Microbial Core Communities, Rare Species, and Interspecies Interactions Can Help Identify Core Microbial Functions in Anaerobic Degradation. In Assessing the Microbiological Health of Ecosystems; John Wiley & Sons Ltd.: Hoboken, NJ, USA, 2022; pp. 127–157. [Google Scholar] [CrossRef]
  30. Zampieri, G.; Campanaro, S.; Angione, C.; Treu, L. Metatranscriptomics-Guided Genome-Scale Metabolic Modeling of Microbial Communities. Cell Rep. Methods 2023, 3, 100383. [Google Scholar] [CrossRef]
  31. Cotta, M.A.; Whitehead, T.R.; Falsen, E.; Moore, E.; Lawson, P.A. Erratum to: Two Novel Species Enterococcus lemanii Sp. Nov. and Enterococcus eurekensis Sp. Nov., Isolated from a Swine-Manure Storage Pit. Antonie Leeuwenhoek 2013, 103, 1409–1418. [Google Scholar] [CrossRef] [PubMed]
  32. Lim, J.W.; Park, T.; Tong, Y.W.; Yu, Z. The microbiome driving anaerobic digestion and microbial analysis. In Advances in Bioenergy; Elsevier: Amsterdam, The Netherlands, 2020; Volume 5, pp. 1–61. [Google Scholar]
  33. Sposob, M.; Moon, H.S.; Lee, D.; Yun, Y.M. Microbiome of seven full-scale anaerobic digestion plants in South Korea: Effect of feedstock and operational parameters. Energies 2021, 14, 665. [Google Scholar] [CrossRef]
  34. Maus, I.; Cibis, K.G.; Bremges, A.; Stolze, Y.; Wibberg, D.; Tomazetto, G.; Blom, J.; Sczyrba, A.; König, H.; Pühler, A.; et al. Genomic Characterization of Defluviitoga tunisiensis L3, a Key Hydrolytic Bacterium in a Thermophilic Biogas Plant and Its Abundance as Determined by Metagenome Fragment Recruitment. J. Biotechnol. 2016, 232, 50–60. [Google Scholar] [CrossRef]
  35. Owusu-Agyeman, I.; Plaza, E.; Cetecioglu, Z. Long-Term Alkaline Volatile Fatty Acids Production from Waste Streams: Impact of PH and Dominance of Dysgonomonadaceae. Bioresour. Technol. 2022, 346, 126621. [Google Scholar] [CrossRef]
  36. Hahnke, S.; Langer, T.; Koeck, D.E.; Klocke, M. Description of Proteiniphilum saccharofermentans Sp. Nov., Petrimonas mucosa Sp. Nov. and Fermentimonas caenicola Gen. Nov., Sp. Nov., Isolated from Mesophilic Laboratory-Scale Biogas Reactors, and Emended Description of the Genus Proteiniphilum. Int. J. Syst. Evol. Microbiol. 2016, 66, 1466–1475. [Google Scholar] [CrossRef] [PubMed]
  37. Li, X.; Deng, L.; Li, F.; Zheng, D.; Yang, H. Effect of Air Mixing on High-Solids Anaerobic Digestion of Cow Manure: Performance and Mechanism. Bioresour. Technol. 2023, 370, 128545. [Google Scholar] [CrossRef]
  38. Pradel, N.; Fardeau, M.-L.; Bunk, B.; Spröer, C.; Boedeker, C.; Wolf, J.; Neumann-Schaal, M.; Pester, M.; Spring, S. Aminithiophilus ramosus Gen. Nov., Sp. Nov., a Sulphur-Reducing Bacterium Isolated from a Pyrite-Forming Enrichment Culture, and Taxonomic Revision of the Family Synergistaceae. Int. J. Syst. Evol. Microbiol. 2023, 73, 005691. [Google Scholar] [CrossRef] [PubMed]
  39. Suksong, W.; Kongjan, P.; Prasertsan, P.; O-Thong, S. Thermotolerant Cellulolytic Clostridiaceae and Lachnospiraceae Rich Consortium Enhanced Biogas Production from Oil Palm Empty Fruit Bunches by Solid-State Anaerobic Digestion. Bioresour. Technol. 2019, 291, 121851. [Google Scholar] [CrossRef] [PubMed]
  40. Basak, B.; Ahn, Y.; Kumar, R.; Hwang, J.-H.; Kim, K.-H.; Jeon, B.-H. Lignocellulolytic Microbiomes for Augmenting Lignocellulose Degradation in Anaerobic Digestion. Trends Microbiol. 2022, 30, 6–9. [Google Scholar] [CrossRef] [PubMed]
  41. Brulc, J.M.; Antonopoulos, D.A.; Berg Miller, M.E.; Wilson, M.K.; Yannarell, A.C.; Dinsdale, E.A.; Edwards, R.E.; Frank, E.D.; Emerson, J.B.; Wacklin, P.; et al. Gene-Centric Metagenomics of the Fiber-Adherent Bovine Rumen Microbiome Reveals Forage Specific Glycoside Hydrolases. Proc. Natl. Acad. Sci. USA 2009, 106, 1948–1953. [Google Scholar] [CrossRef] [PubMed]
  42. Kougias, P.G.; Campanaro, S.; Treu, L.; Tsapekos, P.; Armani, A.; Angelidaki, I. Spatial Distribution and Diverse Metabolic Functions of Lignocellulose-Degrading Uncultured Bacteria as Revealed by Genome-Centric Metagenomics. Appl. Environ. Microbiol. 2018, 84, e01244-18. [Google Scholar] [CrossRef]
  43. Ben Hania, W.; Godbane, R.; Postec, A.; Hamdi, M.; Ollivier, B.; Fardeau, M.-L. Defluviitoga tunisiensis Gen. Nov., Sp. Nov., a Thermophilic Bacterium Isolated from a Mesothermic and Anaerobic Whey Digester. Int. J. Syst. Evol. Microbiol. 2012, 62, 1377–1382. [Google Scholar] [CrossRef] [PubMed]
  44. Simankova, M.V.; Chernych, N.A.; Osipov, G.A.; Zavarzin, G.A. Halocella cellulolytica Gen. Nov., Sp. Nov., a New Obligately Anaerobic, Halophilic, Cellulolytic Bacterium. Syst. Appl. Microbiol. 1993, 16, 385–389. [Google Scholar] [CrossRef]
  45. Li, Y.; Fang, W.; Xue, H.; Yang, X.; Xie, S.; Wang, L. Wohlfahrtiimonas Populi Sp. Nov., Isolated from Symptomatic Bark of a Populus × Euramericana Canker. Int. J. Syst. Evol. Microbiol. 2017, 67, 4424–4428. [Google Scholar] [CrossRef] [PubMed]
  46. Lee, J.-H.; Kumar, S.; Lee, G.-H.; Chang, D.-H.; Rhee, M.-S.; Yoon, M.-H.; Kim, B.-C. Methanobrevibacter boviskoreani Sp. Nov., Isolated from the Rumen of Korean Native Cattle. Int. J. Syst. Evol. Microbiol. 2013, 63, 4196–4201. [Google Scholar] [CrossRef]
  47. Kern, T.; Fischer, M.A.; Deppenmeier, U.; Schmitz, R.A.; Rother, M. Methanosarcina flavescens Sp. Nov., a Methanogenic Archaeon Isolated from a Full-Scale Anaerobic Digester. Int. J. Syst. Evol. Microbiol. 2016, 66, 1533–1538. [Google Scholar] [CrossRef]
  48. Wagner, D.; Schirmack, J.; Ganzert, L.; Morozova, D.; Mangelsdorf, K. Methanosarcina soligelidi Sp. Nov., a Desiccation- and Freeze-Thaw-Resistant Methanogenic Archaeon from a Siberian Permafrost-Affected Soil. Int. J. Syst. Evol. Microbiol. 2013, 63, 2986–2991. [Google Scholar] [CrossRef] [PubMed]
  49. Togo, A.H.; Diop, A.; Bittar, F.; Maraninchi, M.; Valero, R.; Armstrong, N.; Dubourg, G.; Labas, N.; Richez, M.; Delerce, J.; et al. Description of Mediterraneibacter massiliensis, Gen. Nov., Sp. Nov., A New Genus Isolated from the Gut Microbiota of an Obese Patient and Reclassification of Ruminococcus faecis, Ruminococcus lactaris, Ruminococcus torques, Ruminococcus gnavus and Clostridium glycyrrhizinilyticum as Mediterraneibacter faecis Comb. Nov., Mediterraneibacter lactaris Comb. Nov., Mediterraneibacter Torques Comb. Nov., Mediterraneibacter gnavus Comb. Nov. and Mediterraneibacter glycyrrhizinilyticus Comb. Nov. Antonie Leeuwenhoek 2018, 111, 2107–2128. [Google Scholar] [CrossRef]
  50. Van GYLSWYK, N.O. Succiniclasticum ruminis Gen. Nov., Sp. Nov., a Ruminal Bacterium Converting Succinate to Propionate as the Sole Energy-Yielding Mechanism. Int. J. Syst. Evol. Microbiol. 1995, 45, 297–300. [Google Scholar] [CrossRef] [PubMed]
  51. Kurade, M.B.; Saha, S.; Salama, E.-S.; Patil, S.M.; Govindwar, S.P.; Jeon, B.-H. Acetoclastic Methanogenesis Led by Methanosarcina in Anaerobic Co-Digestion of Fats, Oil and Grease for Enhanced Production of Methane. Bioresour. Technol. 2019, 272, 351–359. [Google Scholar] [CrossRef]
Figure 1. (a) Feedstocks composition (expressed as % of TS) digested in the four biogas plants. Monitoring of pH (b), N-NH4+ (c) FOS/TAC ratio (d), TAC and FOS (e) in the biogas plant D4.
Applsci 13 09959 g001
Figure 2. (a) PCoA plots representing the similarity in the microbial communities of the four biogas plants obtained from the beta-diversity values (each spot is the average of the three biological replicates as described in Section 2.1); (b) Venn diagram representing the main OTUs shared among biogas plants and those specifically identified in one of the four microbiomes. OTUs reported in bold started populating D4 reactor only after COVID-19 related issues.
Applsci 13 09959 g002
Figure 3. Heatmap of the relative abundance of the most abundant OTUs in the sampled reactors. The color scale changes from blue to red for lower to higher abundant OTUs.
Applsci 13 09959 g003
Table 1. Functional parameters and location of the four full-scale thermophilic anaerobic digesters monitored in this study.
Temperature Range (°C)HRT (Days)Operation Volume (m3)LocationMain Feeding Substrates
D150–5528–323000Mira, Venezia, ItalyAgricultural by-products, manure and bovine slurry
D250–5530–313200Noventa Vicentina, Vicenza, ItalyResidues of agro-food activities; effluent of poultry manure/pig manure; by-products of terrestrial and aquatic animals
D350–5530–313200Ospedaletto Euganeo, Padova, ItalyAgri-food products and sub-products; poultry manure and similar; pig slurry
D450–5536–372500Este, Padova, ItalyOFMSW
Table 2. Summary of sequencing results and alpha diversity indexes.
D1D2D3D4
Raw reads241,360227,000235,940225,250
Assigned reads100,600109,500113,70090,510
OTUs387389395393
Alpha diversity86.683.583.284.3
Disclaimer/Publisher’s Note: The statements, opinions and data contained in all publications are solely those of the individual author(s) and contributor(s) and not of MDPI and/or the editor(s). MDPI and/or the editor(s) disclaim responsibility for any injury to people or property resulting from any ideas, methods, instructions or products referred to in the content.

