Article

The Real-Time Optimal Attitude Control of Tunnel Boring Machine Based on Reinforcement Learning

School of Mechanical Engineering, Dalian University of Technology, Dalian 116024, China
*
Author to whom correspondence should be addressed.
Appl. Sci. 2023, 13(18), 10026; https://doi.org/10.3390/app131810026
Submission received: 24 July 2023 / Revised: 15 August 2023 / Accepted: 17 August 2023 / Published: 5 September 2023

Abstract

:
Efficient control of tunnel boring machine (TBM) tunneling along the designed tunnel axis in an unknown variable geological environment is a difficult and significant task. At present, the TBM attitude during tunneling is mostly manually controlled based on the deviation between the tunneling axis and the designed tunnel axis and their experiences. The tunneling axis from manual control is often the snakelike motion around the designed tunnel axis, even exceeding the deviation limit, for which this paper analyzed three reasons, the unknown geological environment, the hysteresis of TBM position response, and the unsolved overall optimization of tunneling axis. For these reasons, this paper proposed a real-time optimal control framework of TBM attitude based on reinforcement learning, which contains the geological information predictive model, TBM attitude and position (TBMAP) predictive model, and optimal attitude control policy (OACP). This framework can predict the current geological information in real-time and provide the corresponding real-time optimal attitude control that simultaneously considers the hysteresis of TBM position response and the overall optimization of the tunneling axis. This attitude control framework can be directly deployed to TBM without increasing costs and excessive modifications to the equipment. To verify the effectiveness of this attitude control framework, the Xinjiang Yiner Water Supply Phase II Project, using the TBM method, was adopted as a case study. The results revealed that the accuracy of geological environment recognition reached 94%, and OACP can significantly reduce the accumulated deviation of the tunneling axis from the designed tunnel axis by over 80% compared with the manual control and easily provide real-time decision support for attitude control in actual engineering.

1. Introduction

The tunnel is a key component of a series of major line projects, such as water conservancy, transportation, and energy transportation. Tunnels in different geological environments require different construction methods. The mountain tunnels generally adopt the mining method and the TBM method. The shallow buried and soft tunnels generally adopt the open excavation method, cover excavation method, shield tunneling method, and new Austrian tunneling method. The underwater tunnels generally adopt the sink-and-bury method and the shield tunneling method. TBMs [1,2] have become the optimal tool for tunnel engineering due to their high efficiency, automation, economy, and environmental friendliness compared with conventional blasting tunneling. It is a large-scale comprehensive equipment integrating machinery, electronics, hydraulic pressure, and control. During excavation, TBM must pass a wide variety of geological environments that have significantly different properties [3,4]. Based on the geological survey obtained by sampling, the engineers will design the optimal tunnel axis before construction, which can meet the requirements of the current demand and avoid unfavorable geology as much as possible. TBM needs to precisely tunnel according to the designed tunnel axis, which is that the tunneling axis should be within the required deviation range from the designed tunnel axis and sufficiently smooth without snakelike motion. The efficient TBM attitude control meeting these requirements under frequently changeable and unforeseen geological environments is a complex and difficult problem.
At present, the TBM attitude is mostly manually controlled during tunneling. The laser-based guidance system [5,6] installed on TBM can measure and display TBM attitude and position deviation relative to the designed tunnel axis in real time. The TBM operators set the appropriate control parameters for TBM attitude based on the current attitude and position deviation and the rough geological information from a geological survey using their experience [7,8]. Because of the complex and ever-changing geological environment, the operators cannot obtain enough current geological information according to the geological survey and personal perception. The current attitude control will affect the next attitude and position state and further affects the next attitude control; this correlation will lead to the hysteresis of position response of attitude control, which is difficult to predict by the operators. The optimization of the overall tunneling axis is difficult to solve by operators because of the huge search space composed of the long action sequence and continuous action value and the limited exploration. Therefore, in order to automatically and timely provide the optimal control for TBM attitude during tunneling, it is necessary to timely recognize the current geological environment, take hysteresis of TBM position response into consideration, and conduct sufficient exploration for the optimal overall tunneling axis.
Geological information can provide important support for the optimal control of TBM attitude. However, due to the deep burying, complex and ever-changing geology, it is difficult to obtain sufficient geological information before excavation. Therefore, many scholars have studied the prediction methods of geological information. Liu et al. [9] obtained a three-dimensional seismic ahead-prospecting method by optimizing the filtering method and imaging algorithm, which can accurately judge and locate the fault ahead of the tunnel face. Lee et al. [10] proposed a method of electrical resistivity tomography survey, which can predict the abnormal strata ahead of the tunnel face. Park et al. [11] comprehensively applied the induced polarization and the resistance coefficient methods to analyze the induced polarization and resistivity measured in the tunnel face to predict the advanced geological state. Although the above methods can obtain advanced geological information by analyzing the various feedback signals, they need the shutdown state of TBM when measuring, which cannot achieve convenience and real-time prediction.
To this end, many scholars have studied the real-time prediction methods of geological information during tunneling, which can provide support for efficient excavation. Liu et al. [12,13] applied the forward propagation neural network and the improved support vector machine to build the rock mass parameters prediction model, which can predict the uniaxial compressive strength, brittleness index, and other rock mass parameters with the excavation parameters as the input. Zhang et al. [14] applied K++ means clustering algorithm to find the hidden classification pattern in the data and applied the support vector machine method to build the prediction model of the geological environment based on excavation parameters. Jung et al. [15] applied an artificial neural network to build the prediction model of the geological environment category (GEC), which can predict the current GEC according to the TBM excavation parameters, which can achieve 96% prediction accuracy.
In order to achieve the optimal control of the TBM attitude, a feasible solution is to establish the TBMAP prediction model first and adjust and control the TBM attitude based on it. Therefore, many scholars have conducted research on TBMAP prediction. Xiao et al. [16] established eight prediction models of shield machine attitude based on the data from five earth pressure balance shield machines and obtained two best algorithms, the LSTM and GRU with EVS > 0.9 and RMSE < 1.5. Fu et al. [17] proposed the deep learning model with a graph convolutional network and long short-term memory, which can predict the vertical and horizontal deviations at the articulation and tail of TBM with high accuracy. Zhou et al. [18] presented a prediction framework for TBMAP in shield tunneling by applying a hybrid deep learning model, which contains a wavelet transform noise filter, convolutional neural network feature extractor, and long short-term memory. Chen et al. [19] proposed an intelligent method based on a Bayesian-light gradient boosting machine model with 29 excavation parameters and 6 parameters about the shield attitude, which can predict the shield attitude and support attitude control by adjusting control parameters and conducting iterative prediction.
In order to ensure that TBM can tunnel according to the designed tunnel axis within a certain deviation range, it is necessary to control TBM to the set attitude accurately. So, many scholars have conducted research on how to control TBM to the set attitude. Zhang et al. [20] proposed a cascade control system combining outer-loop trajectory tracking and inner-loop pressure control to enable unmanned automatic tunneling of TBM, in which the inner loop of the system is a cooperative control system of different hydraulic units while the outer loop is a fuzzy attitude correction system. Wang et al. [21] constructed the tunneling axis deviation prediction model based on the improved XGboost and the multi-loop model of shield tunneling axis deviation correction based on the fusion of the geometric model and association rule, which can realize the accurate deviation prediction and deviation correction. Xie et al. [22] proposed an integrated control system that consists of one trajectory planning controller for both cylinders and an individual cylinder controller for each hydraulic cylinder, and a cascade control strategy which comprises a feedforward controller of fixed-value compensation and feedback controller of Variable-gain PID, which can achieve the automatic control of the thrust trajectory.
For the tunneling axis problems caused by manual attitude control, namely the snakelike motion around the design tunnel axis and even exceeding the deviation limit, numerous technologies proposed in the above research, including the attitude and position prediction, specify attitude accurate control and deviation correction path planning can help to solve these problems to a certain extent. To achieve a better effect, this paper proposed an end-to-end optimal attitude control framework based on the actual engineering data, which can integrate the tunneling axis planning, the overall optimization of the tunneling axis, and attitude control. This control framework can predict the current geological information in real-time and provide the corresponding real-time optimal attitude control during tunneling. The main innovations of this study are as follows: (1) the GEC predictive model with the real-time excavation parameters as input is proposed to obtain the real-time GEC information as the input of the optimal attitude control policy during tunneling; (2) the TBMAP predictive models for four GECs are established based on the actual engineering data, which can be used as the interactive environment to train the attitude control policy under the reinforcement learning framework; and (3) for solving the hysteresis of TBM position response and the overall optimization of the tunneling axis, the optimization framework of attitude control policy using the PPO algorithm is proposed based on the TBMAP predictive model, which can easily provide real-time decision support for attitude control in actual engineering combined with GEC predictive model.
The structure of this paper is organized as follows. Section 2 introduces the origin data from the actual engineering, training dataset construction, and data analysis. Section 3 introduces the overall modeling and training framework of the real-time optimal attitude control policy. Section 4 applies the proposed framework to the Xinjiang Yiner Water Supply Phase II Project to verify its effectiveness. Section 5 summarizes the paper.

2. Data Review

2.1. The Origin Data

In order to ensure the efficient and healthy excavation of TBM, it was necessary to monitor and coordinate various subsystems. The TBM carries a variety of sensors, which collect 228 kinds of excavation parameters, and record them every minute. These parameters include the control parameters set by TBM operators according to the current geological environment and the response state under the control parameters. In order to ensure that TBM could tunnel according to the designed tunnel axis, the VMT automatic guidance system installed in the system was used for real-time monitoring of TBMAP during tunneling. This measurement system is composed of the total station, laser targets, rear-view prisms, industrial computer, and other modules, which can measure the position deviation of TBM head and tail center from the designed tunnel axis, including horizontal deviation of the head (HDTH), vertical deviation of the head (VDTH), horizontal deviation of the tail (HDTT), and vertical deviation of the tail (VDTT). Based on these data, the deviation of the tunneling axis from the designed axis could be calculated, namely TBM dip angle (TDA) and TBM flip angle (TFA), which represent the direction deviation of the tunneling axis from the designed axis in the up and down directions and the left and right directions, respectively. These deviation data are symmetrical of positive and negative, representing the two opposite directions.
The GEC is a kind of engineering geological classification standard for the geological environment in the “Code for Geological Survey of Water Conservancy and Hydropower Engineering (GB50487-2008)” [23]. This standard is based on the rock mass feature parameters, such as rock strength, rock integrity, and rock mass structure type, and divides the stability of the geological environment into five categories. This index is widely used to measure the engineering stability of the geological environment in actual engineering and provides a basis information for setting the control parameters of TBM tunneling. Before construction, geological researchers conduct a rough exploration of the geological environment by sampling and analyzing its category. After excavation, the category of tunneled geological environment was re-analyzed to correct the previous judgment, and the final accurate GEC data was obtained.

2.2. Training Dataset Construction

(1)
Data Preprocessing
For learning from the large amount of the original data collected by TBM during excavation, it was necessary to remove the invalid data for the training model through preprocessing. The preprocessing of excavation parameters was as follows. An abnormal sampling of the sensor leads to the missing value data, deleted directly. Routine maintenance and cutter change during excavation will result in non-working state data, which can be judged by zero value of the products of thrust, penetration, torque, and rotational speed, and deleted directly. Every normal cycle of TBM excavation went through three stages: start-up, stabilization, and shut-down, as shown in Figure 1. Only the data in the stabilization stage are suitable for training the model. So, the origin data were divided according to the tunneling cycle, and the data at start-up and shutdown state were judged according to the fixed time of start-up and shutdown stages and deleted directly. For abnormal data caused by external factors, the 3 σ method was used to judge and delete the abnormal values. The paper only considers the attitude control under the situation of the designed tunnel axis of a straight line; the excavation data under this situation were selected as the training data. In this paper, the origin excavation data from Xinjiang Yiner Water Supply Phase II Project were used. There were 1,157,693 sets of original excavation data, and only 151,447 sets of valid data were obtained after preprocessing.
(2)
Data Matching and Combination
The training dataset for GEC predictive model should be built from the preprocessed data. Based on physical mechanism analysis, 40 excavation parameters were selected according to the survey questionnaires from the construction engineers. Then 40 excavation parameters were evaluated according to the correlation with GEC using the Decision Tree method. Finally, 20 excavation parameters composed of the control parameters and the response state parameters were selected from 228 excavation parameters according to the correlation with GEC as the input of the GEC predictive model, of which the names and abbreviations are shown in Table 1. The GEC data in the engineering data used in this paper included GEC 2, 3a, 3b, 4, and 5. In order to have enough data for model training of GEC 3, 3a, and 3b were treated as the same category, finally obtaining four GECs. The recorded excavation parameters and GEC data were all indexed by time, so they could be matched by time, forming the training dataset of the GEC prediction model.
The training dataset for TBMAP predictive model should be built from the preprocessed data. The model predicts the next moment TBMAP based on the current TBMAP and attitude control parameters. Four measuring parameters were selected to represent TBMAP, and two control parameters were selected to be the attitude control parameters, which were combined as the input of this model, and the next moment TBMAP representation data were taken as the output. Their names and abbreviations are shown in Table 1. The recorded TBMAP representation and control parameters data were all indexed by time so that they could be matched by time. The prediction time interval of TBMAP was set to 2 min. The next moment TBMAP representation data could be obtained by time index, which formed the training dataset of the TBMAP predictive model.

2.3. Data Analysis

The statistical analysis was conducted on the overall preprocessed data used in the paper. The data included five GECs, namely 2, 3a, 3b, 4, and 5, and the ratio of each GEC is shown in Figure 2. The TBMAP representing parameters and attitude control parameters, namely TDA, TFA, HDTH, VDTH, DDSB, and DLTC, are the important parameters data to build the optimal attitude control policy, and their statistical distributions were analyzed, as shown in Figure 3. From the figure, it can be seen that these parameters as a whole are similar to the normal distribution. There were significant differences in the range of values between various parameters. So, normalization was needed to eliminate these differences when modeling with them as inputs.

3. Methodology

3.1. Objective and General Idea

The problems of the unknown geological environment, the hysteresis of TBM position response, and the unsolved overall optimization of the tunneling axis should be solved to avoid the snakelike motion and exceeding the deviation limit of manual attitude control. The TBM tunneling processes and geological environments of different engineering are complex and different, which are difficult to be analyzed and established to be a unified model. So, the data produced from specific engineering should be used to build the corresponding model to guide its excavation by deep learning method, which can simplify the modeling. For a better tunneling axis, the OACP should be established by learning from the generated excavation data and optimized for tunneling axis quality. The trained OACP should take current TBMAP and GEC information and output the optimal control parameters, which can achieve the real-time optimal attitude control and minimize the overall deviation between the tunneling axis and the designed tunnel axis. When collecting more new excavation data, the OACP model can adapt to the new geological environment by learning from the new data to provide the corresponding optimal attitude control.
For these targets, this paper proposed the modeling framework for OACP based on the data introduced in Section 2, shown in Figure 4. The data generated during tunneling, including excavation parameters data, GEC data, TBMAP data, and attitude control parameters data, were collected and preprocessed. In order to obtain real-time geological information, the GEC predictive model was built using a deep neural network (DNN) and trained by the corresponding dataset of excavation parameters and GEC data. To solve the problems of the hysteresis of TBM position response and the unsolved overall optimization of the tunneling axis, the paper applied the reinforcement learning method to optimize the attitude control policy built by DNN. Due to security and feasibility, the real excavation interaction environment could not be used for optimizing OACP, which is needed in reinforcement learning. The TBMAP prediction models were established for four GECs based on the corresponding dataset of TBMAP parameters and attitude control parameters, which can be used as the simulated TBMAP interaction environment for optimizing OACP. With four established simulated interaction environments, four OACPs were optimized during the alternating process between the interaction of the policy and the environment and policy training using the PPO algorithm. When applied in actual engineering, the trained GEC prediction model was used to recognize the current GEC in real time, and the corresponding OACE was selected based on the current GEC to provide the real-time optimal attitude control parameters.

3.2. PPO Algorithm

(1)
Policy-Based Framework
The interaction process between intelligent agents and the environment is a continuous decision-making process, and there is a correlation between actions and the next state. Markov chain can be used to simplify and model this process and is parameterized as (S, A,   r , P 0 , P , γ ). Among them, S is the state space of the environment, A is the action space of agent, r s t is the timely reward to the environment, P 0 s 0 is the probability distribution of the environment initial state, P s t + 1 | s t ,   a t   is the probability distribution of environment state transition, and γ is the discount factor for discounting future rewards. For sequential decision-making optimization, the policy-based method is an effective optimization framework, which firstly parameterizes the policy, sets the evaluation index of the policy, and finally optimizes the parameters with the evaluation index as the objective function. The policy is parameterized by the neural network expressed as π a t | s t , and the evaluation index of the policy is the discounted episode reward expectation η π which is optimized to obtain the optimal policy, as shown in Formula (1).
η π = Ε s 0 , a 0 , s 1 , ~ π t = 0 γ t r s t
where s 0 ~ P 0 , a t ~ π a t | s t , s t ~ P s t + 1 | s t ,   a t   .
(2)
TRPO Method
Since the environment was unknown, it was necessary to estimate the statistics variables through sampling for the optimization solution. To reduce the large estimation error of the direct sampling method by the temporal difference method (TD), the state value function V π s t , the action-state value function Q π s t ,   a t and the advantage value function A π o l d s t ,   a t were introduced and applied to the objective function [24,25]. The TD method can greatly reduce the estimated variance of the variables while appropriately increasing the estimated deviation, and the n-step bootstrap method can make a trade-off between the estimated deviation and variance according to the need. For the unstable caused by the fixed step size of the random gradient method, TRPO [26] introduced the trust region method, which transforms the optimization problem into the iterative subproblems. To ensure the monotonic improvement of the objective function, the objective function of the subproblem should meet three conditions: (1) be the lower bound of the original objective function; (2) approximate the original objective function within a certain region; and (3) be easy to solve. The relationship between the episode reward expectations from the two policies is established in Formula (2). By deducing and simplifying, the approximate episode reward expectation L π o l d π in Formula (3) was obtained, which can be easy to solve. L π o l d π can approximate the original objective function in a certain region. Further, the lower bound of the original objective function is constructed using L π o l d π , as shown in Formula (4), which satisfies the above three conditions at the same time. The function can be used as the objective function of the subproblem for an iterative optimization, as shown in Formula (5), which can guarantee the monotonic improvement of the original objective function. To ensure the sufficient update step size on the premise of robustness, Formula (5) was equivalently transformed into an optimization form with constraints, and the maximum divergence constraint was simplified to an average divergence constraint to ensure that the problem can be solved, as shown in Formula (6).
η π = η π o l d + E s 0 , a 0 , s 1 , π t = 0 γ t A π o l d s t ,   a t
where A π o l d s t ,   a t is the advantage function of π o l d .
L π o l d π = η π o l d + s ρ π o l d s a π a | s A π o l d s ,   a
where ρ π o l d s = P s 0 = s + γ P s 1 = s + γ 2 P s 2 = s + is the discount status distribution.
η π L π o l d π C D K L m a x π o l d ,   π
where C = 4 ϵ γ 1 γ 2 , D K L m a x π o l d ,   π = m a x s D K L π o l d · | s   | |   π · | s , D K L is KL divergence.
argmax π L π i π C D K L m a x π i ,   π
argmax θ Ε s ~ ρ θ o l d   ,   a ~ π θ o l d π θ a | s π θ o l d a | s Q θ o l d s ,   a subject   to   Ε s ~ ρ θ o l d D K L π θ o l d · | s   | |   π θ · | s δ
(3)
PPO Method
According to the analysis in the paper [27], the TRPO optimization method has two disadvantages. One is that the objective function with the average KL divergence constraint makes the smaller update step size, which results in slower learning efficiency, and the other is that the optimization problem with constraints requires higher calculated cost, and the solving process is cumbersome. For these reasons, the PPO method [27] is proposed to replace the constraint with the penalty, which can solve the problem of determining the universal penalty factor and obtain a more concise optimization form, as shown in Formula (7). Applying r t θ as a distance measure between the updated policy and the original policy, the application of clipping eliminates the driving force of r t θ exceeding [1 − ϵ , 1 + ϵ ], which limit the policy update within a certain range. This concise form can realize the constraint effect of Formula (6) and have a more universal applicability hyperparameter ϵ . From the perspective of the gradient composition of the objective function, the gradient of Formula (7) eliminates the gradients from the data whose r t θ is out of the range [1 − ϵ , 1 + ϵ ], compared with the case without clipping, which ensures the robustness of the policy update.
L C L I P = Ε π θ o l d min r t θ A ^ t , clip r t θ , 1 ϵ , 1 + ϵ A ^ t
where r t θ = π θ a t | s t π θ o l d a t | s t , A ^ t = A π o l d s t ,   a t is the advantage function of π o l d .

3.3. Base Model

(1)
GEC Predictive Model
The rough sampling analysis of the geological environment before excavation cannot provide effective, accurate geological environment information for TBM tunneling. In order to realize the real-time optimal attitude control according to the current geological environment, it is necessary to predict the current geological environment in real time. Considering that the excavation parameters can be obtained in real-time during tunneling, the GEC prediction model can be built to predict the current GEC according to the current excavation parameters. The predictive model is established using a fully connected DNN, which has strong fitting ability. Twenty excavation parameters introduced in Section 2.2 are taken as input of the model, and the probabilities of four GECs are outputs. The training dataset matched by the 20 excavation parameters and GEC data introduced in Section 2.2, are used to train the GEC prediction model by supervised learning, and the cross entropy is used as the loss function for this multi-classification problem, as shown in Formula (8).
L θ L = 1 N i = 1 N j = 1 5 y j i l o g y ^ j x i
where θ L represents the parameters of the GEC model, x i represents the 20 excavation parameters, y j i represents the real probability that the input x i is GEC j, y ^ j x i represents the predictive probability that the input x i is GEC j.
(2)
TBMAP Predictive Model
Considering the safety and feasibility, it is necessary to construct a simulated environment to replace the real excavation environment for training attitude control policy. This environment model should predict the next moment TBMAP based on the current TBMAP and the attitude control parameters. The TBMAP can be represented by the measuring parameters TDA, TFA, HDTH, and VDTH, which are introduced in Section 2.1. During tunneling, the attitude of the TBM left and right deflection angle is controlled by adjusting the displacement of the left and right support boot cylinders. The attitude of the TBM up and down deflection angle is controlled by adjusting the displacement of the torque cylinders. Therefore, the displacement difference between the left and right support boot cylinders (DDSB) and the displacement of the left torque cylinder (DLTC) are used as TBM attitude control parameters. With six parameters combined by TBMAP parameters and attitude control parameters as input, the TBMAP predictive model is established by fully connected DNN and output the next moment TBMAP parameters. Based on the matched dataset introduced in Section 2.2, composed of TBM attitude control parameters, current TBMAP parameters, and the next moment TBMAP parameters, the TBMAP predictive model is trained by supervised learning, with the mean square error as the loss function, as shown in Formula (9).
L θ T D ,     θ T F ,     θ H D ,   θ V D = 1 N i = 1 N f T D x i y i T D 2 + f T F x i y i T F 2                                                                                               + f H D x i y i H D 2 + f V D x i y i V D 2
where θ T D ,   θ T F ,   θ H D ,   θ V D represent, respectively, the parameters of the measuring parameters TDA, TFA, HDTH and VDTH predictive model, x i represents the input parameters of the model, f T D x i , f T F x i , f H D x i and f V D x i represent, respectively, the predictive value of these measuring parameters, and y i P , y i P , y i P and y i A represent, respectively, the real value of these measuring parameters.

3.4. OACP Model

For the OACP model, the two problems of hysteresis of TBM position response and the unsolved overall optimization of the tunneling axis should be solved. To end this, reinforcement learning is selected to optimize the attitude control policy. In this method, the Markov chains can model the hysteresis of the TBM position response, which establishes the connections between the attitude control action and subsequent TBMAP states using chains. Because the accumulated episode rewards used as the optimization objective in the method can be as the overall quality evaluation of the tunneling axis, the optimal solution of the reinforcement learning corresponds to the overall optimal of the tunneling axis.
The TBMAP prediction model established above is used as the interactive environment for optimizing the attitude control policy. Due to the optimization goal of making the tunneling axis as consistent as possible with the designed axis, the negative distance between the cutter head center and the designed axis is used as the reward of the environment state. The cumulated reward expectation of interaction episode is used as the optimization objective. Two attitude control parameters, DDSB and DLTC, introduced in Section 3.3, are used as the actions outputted by attitude control policy, and four TBMAP parameters as the state outputted by the environment. The conditions for ending the episode are when the number of interaction steps exceeds the maximum interaction times, which is set to 400 timesteps in this paper, and when the attitude and position deviations with the designed axis are all less than the minimum deviations, which is set to 0.01 in this paper.
With four TBMAP representation parameters as inputs, the fully connected DNN is applied to model the attitude control policy for each GEC, which outputs two attitude control parameters. Due to the continuity of the state space and action space and to ensure the monotonicity of optimization, the PPO algorithm introduced in Section 3.2 is selected to train the attitude control policy. With the TBMAP predictive model trained in Section 3.3 as the interactive environment, the attitude control model is gradually optimized during the alternating process between the interaction of the policy and the environment and policy training.

4. Case Study

The engineering data used in this paper come from the Xinjiang Yiner Water Supply Phase 2 Project, excavated mainly by the TBM construction method. The total length of the tunnel was 283.27 km, and the tunneling diameter of 7.03 m. According to the analysis of the engineering geological report, the stratum lithology that the tunnel passes through is greater, and the GECs include 2 to 5. The geology was mainly dominated by massive fresh rock mass, and the integrity of the rock mass was high. TBM, developed by China Railway Construction Heavy Industry, was used for tunneling. The length of the main engine was about 23.8 m, and the diameter of the cutter head was 7.03 m. The cutter head split method is a partial split type, with a total of 49 cutters.

4.1. GEC Predictive Model

Based on the matched training dataset of the excavation parameters and GEC, a fully connected DNN was used to establish the GEC predictive model. The 20 excavation parameters introduced in Section 2.2, including 2 excavation control parameters and 18 excavation response parameters, were used as the input. The model outputs four values corresponding to the probabilities of four GECs, because of four GECs in the training dataset introduced in Section 2.2. The hidden layer of the model structure was set to six layers, and the unit number of each layer adopted a symmetrical structure, set to 30, 60, 90, 60, 30, and 10, respectively. Each layer used the Relu function as the activation function and added a Batchnorm layer before the Relu function to prevent gradient explosion and disappearance. In order to output the probability, the Softmax function was used as the activation function of the output layer.
In order to eliminate the difference between different inputs and improve the convergence efficiency, each input was normalized by the standardization method of standard deviation. One-hot encoding was used for GEC data to easily calculate the loss function. For this multi-classification problem, the categorical cross-entropy introduced in Section 3.3 was selected as the loss function. A total of 151,447 sets of matched data were selected from the total dataset and divided into a training set and test set according to the ratio of 4:1. The batch size was set to 5000, 35 epochs were trained, the learning rate was set to 0.001, and the optimizer used Nadam.
After training, the training set and test set accuracy of the GEC predictive model were 0.9616 and 0.9453, respectively, which showed the effectiveness of the GEC predictive model. Taking the number of epochs as the abscissa, the change curve of the training set and the test set accuracy during the training are shown in Figure 5. In the early stage of training, the prediction accuracy of the model had a steep increase, while the prediction accuracy of the model had a slow increase in the later stage of training. The precision, recall, and F1-score of various GECs were analyzed statistically, as shown in Table 2. From the table, it can be seen that all indexes of each GEC have exceeded 0.83, which indicates that the GEC predictive model has sufficient credibility.

4.2. TBMAP Predictive Model

Due to the variation patterns of TBMAP being different in different GECs, the TBMAP predictive model needs to be established for four GECs using the same framework. For each GEC, the TBMAP prediction model was established using the full-connected DNN structure and trained by the matched data from this GEC environment introduced in Section 2.2, which is composed of the current TBMAP parameters, attitude control parameters, and the next moment TBMAP parameters. Because of four representation parameters of TBMAP, four independent DNN models with the same structure were established to predict them. Each DNN model took six parameters as input, including two attitude control parameters and four current TBMAP parameters, and outputted one value corresponding to one of the next moment TBMAP parameters. The DNN model adopted four hidden layers with Relu as an activation function, and the unit number of each layer adopted a symmetrical structure, which were 36, 72, 36, and 12, respectively. The Batchnorm layer was added before the Relu activation function of each layer to prevent gradient explosion and disappearance. The activation function of the output layer adopted the Tanh function to limit the output between [−1, 1], corresponding to the normalized TBMAP parameter.
Four TBMAP prediction models used the same data preprocessing method and loss function. The corresponding training data for each TBMAP predictive model were selected from the total of the 151,447 sets of preprocessed data introduced in Section 2.2 and divided into training sets and test sets according to the ratio of 4:1. In order to eliminate the difference between different inputs; each input was normalized by the Min-Max normalization method to limit the input between [−1, 1], which can maintain the symmetry of original data. The output TBMAP parameters were also normalized by the Min-Max normalization to limit between [−1, 1] for the TBMAP predictive models with normalized parameters as output. For this supervised learning, the MSE introduced in Section 3.3 was selected as the loss function. The training hyperparameters of the TBMAP prediction models of different GECs were the same, while the training hyperparameters of the different representation parameter predictive models of the same GEC were different. The training hyperparameters of four representation parameter predictive models of GEC 2 are shown in Table 3.
After training, four TBMAP predictive models were obtained for different GEC environments. The models had been well-fitted with the training data, and their MSE of the test set had also significantly decreased. R2s of different representation parameters of different TBMAP models were computed, shown in Table 4. From the table, it can be seen that all R2s exceed 0.85, which indicates that the predictive models all have obtained sufficient fitting. The predictive performance of the predictive models of four GECs on the test set are shown in Figure 6, Figure 7, Figure 8 and Figure 9. From the figure, it can be seen that the prediction of various representation parameters of each GEC all had a good generalization effect, which indicates that the TBMAP predictive model can replace the real TBM excavation environment to give accurate next-moment TBMAP parameters. It can be seen that the TBMAP predictive models have sufficient predictive accuracy and calculation efficiency, which can be used as the interactive environment to train the attitude control policy under the reinforcement learning framework.

4.3. OACP Model

Due to the different TBMAP response laws of different GEC environments, it was necessary to establish corresponding OACP for four GECs using reinforcement learning. For each GEC, the full-connect DNN was used to establish the attitude control policy, which outputted two continuous control parameters corresponding to DDST and DLST. To ensure the exploration, the distributions of control parameters for each TBMAP input were modeled as the normal distribution, defined by the mean and variance from the established full-connect DNN model, and the output control parameters were sampled from their distributions. The DNN model took four TBMAP parameters as input and outputted four values according to the means and variances of two control parameters. For some general hyperparameters of the PPO algorithm they were set as the same value as the original paper on the PPO algorithm, for example, the PPO clip coefficient and learning rate. For some non-general hyperparameters, they were optimized using grid search, for example, network structural parameters and total timesteps. For the output mean values, the DNN model adopted three hidden layers with Relu as the activation function and the symmetrical layer unit numbers, which were 64, 64, and 64, respectively. The model a the learnable values without connection with the input as the output variances. Under the PPO framework introduced in Section 3.2, the value function for the environment state was established by the DNN model, which took four TBMAP parameters as input and outputted one value corresponding to the environment state value. The value function adopted three hidden layers with Relu as the activation function and the symmetrical layer unit numbers, which were 64, 64, and 64, respectively.
Under the PPO framework, the attitude control policy was gradually optimized during the alternating process between the interaction of policy and environment and policy training. The total number of interaction steps was set to one million. Eight environments were used to interact with policy in parallel for obtaining interaction data. The policy was trained using the interaction data every 2000 interaction steps, in which eight epoch updates were performed with the batch size of 1600. The GAE technology was used to estimate the state advantage to reduce its estimation bias, and batch normalization was performed on the state advantage to ensure a more stable learning process. The ADAM method was used to gradient update the policy and state value model, and the truncating of the update gradient was performed to prevent gradient explosion. The specific hyperparameter values are shown in Table 5.
Using the training strategy and hyperparameters introduced above, four attitude control policies were trained for one million interaction steps in their environments. The episode rewards of the control policy produced in the training process were recorded, and the changes in episode rewards of four control policies with the interactive timesteps as the abscissa are shown in Figure 10. In order to better view the trend of episode rewards change, the episode rewards were smoothed using the smoothing parameter 0.9, shown in Figure 10. From the figure, it can be seen that the episode rewards of four control policies all have significantly decreased by 80~95%, which indicates the effectiveness of optimizing the attitude control policy by reinforcement learning.
To verify the effectiveness of the obtained OACPs, the effects of OACP model control and manual control were compared. The total fitting degree between the tunneling axis and the designed axis is the evaluation of the attitude control effect. The deviation between the tunneling axis and the designed axis in the heading face could be obtained at each timestep. The cumulative discount sum of each timestep deviation from a section of the tunneling axis was used to evaluate the fitting degree, which was called the episode reward. The episode reward with 400 interaction steps was used as the comparison evaluation index. The OACP model was used to interact with the TBMAP predictive environment to sample the episode rewards, and the episode rewards of manual control were obtained by sampling the cumulated reward of 400 interaction steps from the actual engineering data. For each GEC, 2000 episode rewards from OACP control and manual control were compared, as shown in Figure 11. From the figure, it can be seen that the OACPs of four GECs all had lower episode rewards than the manual control. This indicates that the tunneling axis under the OACP control had a lower overall deviation than the designed tunnel axis. The OACPs also had better stability compared with manual control.

5. Conclusions

In the current tunnel engineering constructed by TBM, the actual tunneling axis of manual control is often the snakelike motion around the design axis, even exceeding the deviation limit. This paper summarized three reasons for these problems: the unknown geological environment, the hysteresis of TBM position response, and the unsolved overall optimization of the tunneling axis. For these reasons, this paper proposed a real-time optimal attitude control framework based on the data obtained from the actual engineering, which contains the GEC predictive model, TBMAP predictive model, and OACP model. Based on these reasons, the control framework can effectively solve the problems of manual control. To verify the effectiveness of the proposed control framework, the Xinjiang Yiner Water Supply Phase II Project was adopted as a case study. This study has three major contributions to research and practice as follows:
(1)
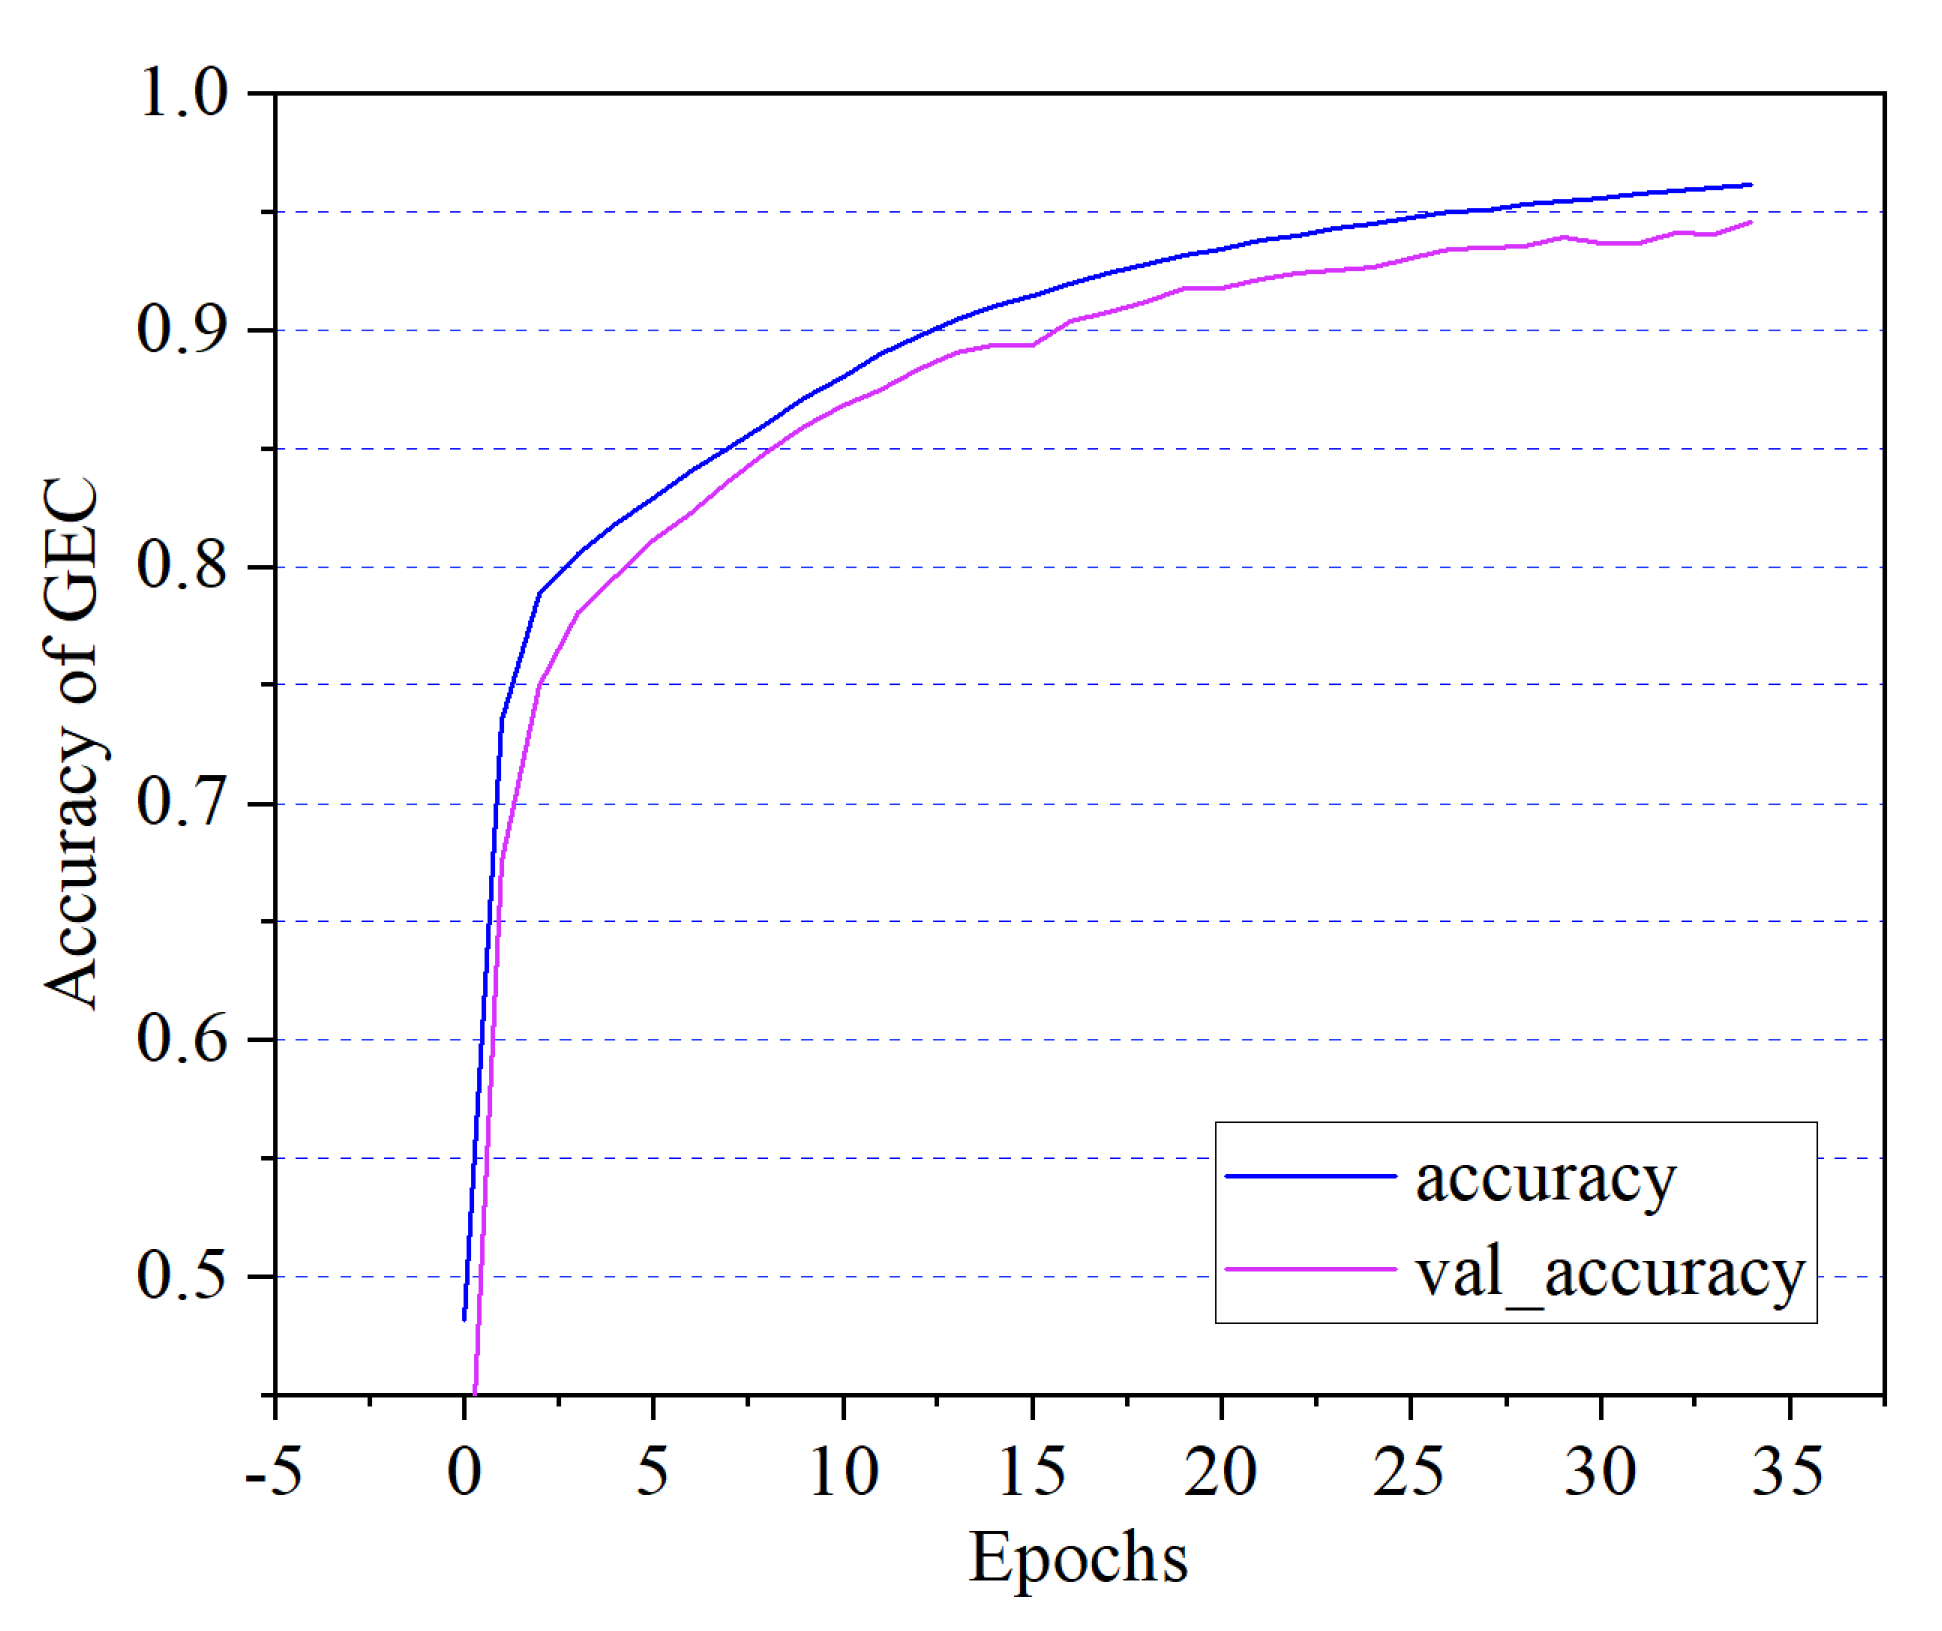
The paper proposes the GEC predictive model to obtain the real-time GEC for attitude control policy during tunneling. The GEC predictive model established using the DNN model was trained using the corresponding data of excavation parameters and GEC from the actual construction engineering. The accuracy of the trained GEC predictive model could reach 94%, and the model took excavation parameters as input, which indicates that the model can recognize the real-time GEC information from the excavation parameters as the input of the attitude control model.
(2)
The paper established the TBMAP predictive model for four GECs to be the interactive environment for training the attitude control policies. The TBMAP predictive model established by DNN was trained using the TBMAP parameters and attitude control parameters data of the corresponding GEC from the actual engineering. After training, R2s of different representing parameters prediction of different TBMAP models were computed, which all exceeded 0.85. It can be seen that the TBMAP predictive models have sufficient predictive accuracy and calculation efficiency, which can be used as the interactive environment to train the attitude control policy under the reinforcement learning framework.
(3)
For the hysteresis of TBM position response and the overall optimization of the tunneling axis, the paper proposes the optimization framework of attitude control policy based on reinforcement learning. The attitude control policy for each GEC was established by the DNN model and was gradually optimized during the alternating process between the interaction of the policy and the established TBMAP predictive environment and policy training using the PPO algorithm, which can optimal the policy based on the episode deviation. To verify its effectiveness, the obtained OACP was compared with manual control based on practical engineering data. The results revealed that OACP can significantly reduce the accumulated deviation of the tunneling axis from the design tunnel axis by over 80% compared with the manual control. OACP combined with the GEC predictive model can easily provide real-time decision support for attitude control in actual engineering.

Author Contributions

Conceptualization, G.J.; Methodology, G.J. and J.H.; Software, J.H. and B.Y.; Formal analysis, G.J. and J.H.; Data curation, G.J. and J.H.; Writing–original draft, B.Y. and Z.W.; Writing–review & editing, B.Y. and Z.W.; Visualization, B.Y. and Z.W.; Supervision, Z.W. All authors have read and agreed to the published version of the manuscript.

Funding

This work was supported in part by the National Natural Science Foundation of China (No. 52275236).

Institutional Review Board Statement

Not applicable.

Informed Consent Statement

Not applicable.

Data Availability Statement

Not applicable.

Conflicts of Interest

We declare that we have no financial and personal relationships with other people or organizations that can inappropriately influence our work; there is no professional or other personal interest of any nature or kind in any product, service, and/or company that could be construed as influencing the position presented in, or the review of, the manuscript entitled “The Real-Time Optimal Attitude Control of Tunnel Boring Machine Based on Reinforcement Learning”.

References

  1. Bayati, M.; Hamidi, J.K. A case study on TBM tunnelling in fault zones and lessons learned from ground improvement. Tunn. Undergr. Space Technol. 2017, 63, 162–170. [Google Scholar] [CrossRef]
  2. Gong, Q.M.; Yin, L.J.; Wu, S.Y.; Zhao, J.; Ting, Y. Rock burst and slabbing failure and its influence on TBM excavation at headrace tunnels in Jinping II hydropower station. Eng. Geol. 2012, 124, 98–108. [Google Scholar] [CrossRef]
  3. Du, C.; Pan, Y.; Liu, Q.; Huang, X.; Yin, X. Rockburst inoculation process at different structural planes and microseismic warning technology: A case study. Bull. Eng. Geol. Environ. 2022, 81, 499. [Google Scholar] [CrossRef]
  4. Sun, J.; Wang, S.J. Rock mechanics and rock engineering in China: Developments and current state-of-the-art. Int. J. Rock Mech. Min. Sci. 2000, 37, 447–465. [Google Scholar] [CrossRef]
  5. Lin, J.; Gao, K.; Gao, Y.; Wang, Z. Combined measurement system for double shield tunnel boring machine guidance based on optical and visual methods. J. Opt. Soc. Am. A-Opt. Image Sci. Vis. 2017, 34, 1810–1816. [Google Scholar] [CrossRef]
  6. Mao, S.; Shen, X.; Lu, M. Virtual Laser Target Board for Alignment Control and Machine Guidance in Tunnel-Boring Operations. J. Intell. Robot. Syst. 2015, 79, 385–400. [Google Scholar] [CrossRef]
  7. Pan, G.; Fan, W. Automatic Guidance System for Long-Distance Curved Pipe-Jacking. KSCE J. Civ. Eng. 2020, 24, 2505–2518. [Google Scholar] [CrossRef]
  8. Shen, X.; Lu, M.; Chen, W. Tunnel-Boring Machine Positioning during Microtunneling Operations through Integrating Automated Data Collection with Real-Time Computing. J. Constr. Eng. Manag. 2011, 137, 72–85. [Google Scholar] [CrossRef]
  9. Liu, B.; Chen, L.; Li, S.; Song, J.; Xu, X.; Li, M.; Nie, L. Three-Dimensional Seismic Ahead-Prospecting Method and Application in TBM Tunneling. J. Geotech. Geoenvironmental Eng. 2017, 143, 04017090. [Google Scholar] [CrossRef]
  10. Lee, K.-H.; Park, J.-H.; Park, J.; Lee, I.-M.; Lee, S.-W. Electrical resistivity tomography survey for prediction of anomaly in mechanized tunneling. Geomech. Eng. 2019, 19, 93–104. [Google Scholar] [CrossRef]
  11. Park, J.; Ryu, J.; Choi, H.; Lee, I.-M. Risky Ground Prediction ahead of Mechanized Tunnel Face using Electrical Methods: Laboratory Tests. KSCE J. Civ. Eng. 2018, 22, 3663–3675. [Google Scholar] [CrossRef]
  12. Liu, B.; Wang, R.; Zhao, G.; Guo, X.; Wang, Y.; Li, J.; Wang, S. Prediction of rock mass parameters in the TBM tunnel based on BP neural network integrated simulated annealing algorithm. Tunn. Undergr. Space Technol. 2020, 95, 103103. [Google Scholar] [CrossRef]
  13. Liu, B.; Wang, R.; Guan, Z.; Li, J.; Xu, Z.; Guo, X.; Wang, Y. Improved support vector regression models for predicting rock mass parameters using tunnel boring machine driving data. Tunn. Undergr. Space Technol. 2019, 91, 102958. [Google Scholar] [CrossRef]
  14. Zhang, Q.; Liu, Z.; Tan, J. Prediction of geological conditions for a tunnel boring machine using big operational data. Autom. Constr. 2019, 100, 73–83. [Google Scholar] [CrossRef]
  15. Jung, J.-H.; Chung, H.; Kwon, Y.-S.; Lee, I.-M. An ANN to Predict Ground Condition ahead of Tunnel Face using TBM Operational Data. KSCE J. Civ. Eng. 2019, 23, 3200–3206. [Google Scholar] [CrossRef]
  16. Xiao, H.; Xing, B.; Wang, Y.; Yu, P.; Liu, L.; Cao, R. Prediction of Shield Machine Attitude Based on Various Artificial Intelligence Technologies. Appl. Sci. 2021, 11, 10264. [Google Scholar] [CrossRef]
  17. Fu, X.; Wu, M.; Ponnarasu, S.; Zhang, L. A hybrid deep learning approach for dynamic attitude and position prediction in tunnel construction considering spatio-temporal patterns. Expert Syst. Appl. 2023, 212, 118721. [Google Scholar] [CrossRef]
  18. Zhou, C.; Xu, H.; Ding, L.; Wei, L.; Zhou, Y. Dynamic prediction for attitude and position in shield tunneling: A deep learning method. Autom. Constr. 2019, 105, 102840. [Google Scholar] [CrossRef]
  19. Chen, H.; Li, X.; Feng, Z.; Wang, L.; Qin, Y.; Skibniewski, M.J.; Chen, Z.-S.; Liu, Y. Shield attitude prediction based on Bayesian-LGBM machine learning. Inf. Sci. 2023, 632, 105–129. [Google Scholar] [CrossRef]
  20. Zhang, Z.; Ma, L. Attitude Correction System and Cooperative Control of Tunnel Boring Machine. Int. J. Pattern Recognit. Artif. Intell. 2018, 32, 1859018. [Google Scholar] [CrossRef]
  21. Wang, P.; Kong, X.; Guo, Z.; Hu, L. Prediction of Axis Attitude Deviation and Deviation Correction Method Based on Data Driven During Shield Tunneling. IEEE Access 2019, 7, 163487–163501. [Google Scholar] [CrossRef]
  22. Xie, H.; Duan, X.; Yang, H.; Liu, Z. Automatic trajectory tracking control of shield tunneling machine under complex stratum working condition. Tunn. Undergr. Space Technol. 2012, 32, 87–97. [Google Scholar] [CrossRef]
  23. GB50487-2008; Code for engineering geological investingation of water resources and hydropower. Ministry of Water Resources of the People’s Republic of China: Beijing, China, 2008.
  24. Wang, Z.; Bapst, V.; Heess, N.; Mnih, V.; Munos, R.; Kavukcuoglu, K.; de Freitas, N. Sample Efficient Actor-Critic with Experience Replay. arXiv 2016, arXiv:1611.01224. [Google Scholar]
  25. Zhao, T.; Hachiya, H.; Niu, G.; Sugiyama, M. Analysis and improvement of policy gradient estimation. Neural Netw. 2012, 26, 118–129. [Google Scholar] [CrossRef] [PubMed]
  26. Schulman, J.; Levine, S.; Moritz, P.; Jordan, M.; Abbeel, P. Trust Region Policy Optimization. In International Conference on Machine Learning; Bach, F., Blei, D., Eds.; JMLR-Journal Machine Learning Research: San Diego, CA, USA, 2015; Volume 37, pp. 1889–1897. Available online: https://www.webofscience.com/wos/woscc/full-record/WOS:000684115800200 (accessed on 1 January 2015).
  27. Schulman, J.; Wolski, F.; Dhariwal, P.; Radford, A.; Klimov, O. Proximal policy optimization algorithms. arXiv 2017, arXiv:1707.06347. [Google Scholar]
Figure 1. TBM tunneling cycle.
Applsci 13 10026 g001
Figure 2. Ratios of each GEC.
Applsci 13 10026 g002
Figure 3. Statistical distributions of the excavation parameters: (a) statistical distribution of parameter TDA, (b) statistical distribution of parameter TFA, (c) statistical distribution of parameter HDTH, (d) statistical distribution of parameter VDTH, (e) statistical distribution of parameter DDSB, (f) statistical distribution of parameter DLTC.
Applsci 13 10026 g003
Figure 4. OACP modeling framework.
Applsci 13 10026 g004
Figure 5. Change curve of GEC predictive model accuracy.
Applsci 13 10026 g005
Figure 6. Predictive performance of TBMAP predictive model of GEC 2: (a) predictive performance of TDA, (b) predictive performance of TFA, (c) predictive performance of HDTH, and (d) predictive performance of VDTH.
Applsci 13 10026 g006
Figure 7. Predictive performance of TBMAP predictive model of GEC 3: (a) predictive performance of TDA, (b) predictive performance of TFA, (c) predictive performance of HDTH, and (d) predictive performance of VDTH.
Applsci 13 10026 g007
Figure 8. Predictive performance of TBMAP predictive model of GEC 4: (a) predictive performance of TDA, (b) predictive performance of TFA, (c) predictive performance of HDTH, and (d) predictive performance of VDTH.
Applsci 13 10026 g008
Figure 9. Predictive performance of TBMAP predictive model of GEC 5: (a) predictive performance of TDA, (b) predictive performance of TFA, (c) predictive performance of HDTH, and (d) predictive performance of VDTH.
Applsci 13 10026 g009
Figure 10. Changes in episode rewards with epochs: (a) episode rewards change in GEC 2, (b) episode rewards change in GEC 3, (c) episode rewards change in GEC 4, and (d) episode rewards change in GEC 5.
Applsci 13 10026 g010
Figure 11. Episode rewards comparison of OACP and manual control: (a) episode rewards comparison in GEC 2, (b) episode rewards comparison in GEC 3, (c) episode rewards comparison in GEC 4, and (d) episode rewards comparison in GEC 5.
Applsci 13 10026 g011
Table 1. Statistical analysis of the excavation parameters.
NameAbbreviationMinimum ValueMaximum ValueAverage ValueUnit
20 excavation parametersAdvancing speedAS0.031234.24536.577mm/min
PenetrationPE0.00339.0226.575mm/rot
Total thrust forceTF1063.31017,741.30012,474.052kN
Cutterhead rotation speedCRS0.2858.7885.888r/min
Cutterhead torqueCT150.6763827.0901501.380kN·m
Cutterhead average currentCAC48.901390.743188.012A
Pressure of chamber with rod of roof supportPWRS−1.000227.41971.209bar
Pressure of chamber without rod of roof supportPORS22.031263.534115.070bar
Pressure of chamber with rod of left supportPWLS−69.000195.43944.932bar
Pressure of chamber without rod of left supportPOLS−1.000236.89996.525bar
Pressure of chamber with rod of right supportPWRS−50.000192.18965.765bar
Pressure of chamber without rod of right supportPORS−18.000291.743130.415bar
Pressure of chamber with rod of propulsion cylinderPWPC−0.2704.0671.032bar
Pressure of chamber without rod of propulsion cylinderPWPC30.104229.142159.032bar
Pressure of chamber with rod of left support bootsPWLS0.000107.16237.583bar
Pressure of chamber with rod of right support bootsPWRS−1.00096.99341.707bar
Pressure of chamber without rod of left torque cylindersPOLT45.391202.264123.194bar
Pressure of chamber with rod of left torque cylindersPWLT−1.000172.91264.262bar
Pressure of chamber without rod of right torque cylindersPORT44.074147.43991.565bar
Pressure of chamber with rod of right torque cylindersPWRT22.114166.529100.531bar
Attitude control parametersDisplacement deviation of two support bootsDDSB−175.000204.00023.464mm
Displacement of left torque cylindersDLTC55.743155.000109.593mm
TBMAP representation parametersTBM dip angleTDA−3.27912.4054.520mm
TBM flip angleTFA−11.2027.442−1.549mm
Horizontal deviation of TBM headHDTH−241.000307.35113.818mm
Vertical deviation of TBM headVDTH−77.684160.23432.658mm
Table 2. Different statistical indexes of various GECs.
GECPrecisionRecallF1-ScoreSupport
20.95710.96910.960413,234
30.92940.92540.927410,125
40.88280.83660.85911585
50.97690.95620.96645346
Table 3. Training hyperparameters of different representation parameter models.
EpochsLearning RateBatch SizeVerification Set ProportionOptimization Algorithm
TDA1400.00410000.1SGD
TFA1400.00420000.1SGD
HDTH2000.00420000.1SGD
VDTH2000.00410000.1SGD
Table 4. R2s of different representation parameters of different TBMAP models.
TDATFAHDTHVDTH
GEC 20.9130.9320.9280.943
GEC 30.9620.9410.8730.933
GEC 40.9210.8650.9280.923
GEC 50.9590.9280.8890.958
Table 5. Hyperparameter values for training.
Hyperparameter NameHyperparameter Value
Total timesteps1,000,000
Learning rate3 × 10 4
Parallel environment number8
Policy updates frequency2000
Lambda for GAE ( λ )0.95
Discount factor ( γ )0.95
Policy updates epochs8
PPO clip coefficient0.2
Coefficient of the value function loss0.5
The maximum norm for the gradient clipping0.5
Policy updates batch-size1600
Disclaimer/Publisher’s Note: The statements, opinions and data contained in all publications are solely those of the individual author(s) and contributor(s) and not of MDPI and/or the editor(s). MDPI and/or the editor(s) disclaim responsibility for any injury to people or property resulting from any ideas, methods, instructions or products referred to in the content.

