Article

WASPAS Based Multi Response Optimization in Hard Turning of AISI 52100 Steel under ZnO Nanofluid Assisted Dual Nozzle Pulse-MQL Environment

Machining Research Laboratory (MRL), School of Mechanical Engineering, Kalinga Institute of Industrial Technology (KIIT), Deemed to Be University, Bhubaneswar 751024, India
*
Author to whom correspondence should be addressed.
Appl. Sci. 2023, 13(18), 10062; https://doi.org/10.3390/app131810062
Submission received: 11 August 2023 / Revised: 25 August 2023 / Accepted: 30 August 2023 / Published: 6 September 2023
(This article belongs to the Special Issue Advances in Machining Process for Hard and Brittle Materials)

Abstract

:
Hard turning is an emerging machining technology that evolved as a substitute for grinding in the production of precision parts from hardened steel. It offers advantages such as reduced cycle times, lower costs, and environmental benefits over grinding. Hard turning is stated to be difficult because of the high hardness of the workpiece material, which causes higher tool wear, cutting temperature, surface roughness, and cutting force. In this work, a dual-nozzle minimum quantity lubrication (MQL) system’s performance assessment of ZnO nano-cutting fluid in the hard turning of AISI 52100 bearing steel is examined. The objective is to evaluate the ZnO nano-cutting fluid’s impacts on flank wear, surface roughness, cutting temperature, cutting power consumption, and cutting noise. The tool flank wear was traced to be very low (0.027 mm to 0.095 mm) as per the hard turning concern. Additionally, the data acquired are statistically analyzed using main effects plots, interaction plots, and analysis of variance (ANOVA). Moreover, a novel Weighted Aggregated Sum Product Assessment (WASPAS) optimization tool was implemented to select the optimal combination of input parameters. The following optimal input variables were found: depth of cut = 0.3 mm, feed = 0.05 mm/rev, cutting speed = 210 m/min, and flow rate = 50 mL/hr.

Graphical Abstract

1. Introduction

Hard turning is a machining technique that focuses on the cylindrical surface of heat-treated steel with a hardness that varies between 45 and 68 HRC. It entails the use of a variety of single-point turning tools. The technique is difficult, owing to the material’s extreme hardness, which results in greater cutting forces, cutting temperature, tool wear, and probable damage to the finished surface. Hard turning, on the other hand, has advantages such as shorter cycle times and lower costs as compared to grinding processes [1,2,3]. Dry hard turning has faced countless challenges like the generation of high cutting temperature, high tool wear, and poor surface quality. Therefore, to overcome these issues, many researchers have focused on improving the machinability of hard turning using various sustainable cooling technologies.
In the modern machining scenario, a cleaner advanced technological machining process can develop the technical, economical, and environmental viability of traditional methods, resulting in human-centered, sustainable, and compatible machining [4]. The use of nanofluids with hybrid-type nanofluids surpass other types of cooling and lubrication methods. The use of nanofluids and hybrid nanofluids improves the surface quality and decreases the cutting temperature, cutting tool wear, and cutting force during the machining process [5]. Hard machining has captured the interest of many researchers as a potential substitute for many conventional finish grinding techniques because of its high productivity, ease of adjusting to complicated part forms, lack of cutting fluids, high-quality surface quality, and minimal investment in machine equipment. The intense heat created by the cutting zone, on the other hand, always mandates the use of premium cutting tools and limits the cutting environment. The MQL process for severe machining aids in increasing cutting performance while ensuring environmental friendliness [6]. More efficient hard machining methods have seen a significant increase in demand in recent years, not just for enhanced productivity, but also for environmental friendliness. The greatest challenges remain higher hardness strength, and a significant cutting temperature. To address these issues, NFMQL (nanofluid minimum quantity lubrication)-assisted hard part machining has emerged as a viable process [7]. Because of environmental concerns about the use and disposal of cutting fluids during machining, the MQL approach was developed, which necessitates the use of specialized fluids with better qualities. Nano-lubricants have been found to meet the qualities of cutting fluids employed in MQL. The primary difficulties in hard machining technology continue to be friction and extremely high temperatures, both of which have a considerable impact on cutting competence. The employment of nanoparticles in the MQL technique to advance the cooling lubrication capabilities of cutting oil (base) has been demonstrated to be a feasible solution [8]. Based on the findings [9], the implementation of nano-cutting fluids in turning operations has demonstrated a notable enhancement in surface finish, as well as a substantial reduction in tool wear, cutting force, and cutting zone temperature.
To know the current advancement in hard turning research, a detailed literature review was carried out as follows. Junankar et al. [10] experimentally explored the impacts of CuO and ZnO nanofluids on process variables for MQL-assisted turning. Experimentation revealed that a CuO-assisted nanofluid provides the most effective cooling conditions when compared to a ZnO-based nanofluid. Khan et al. [11] developed experimental models for energy and cost consumption under different cooling conditions, which is the proposed hybrid energy–cost models and their experimental validations. Khandekar et al. [12] observed that when compared to dry cutting and machining with traditional cutting fluid, using nano-cutting fluid minimizes cutting force, tool wear, workpiece surface roughness, and chip thickness. Sertsöz [13] concluded that nano-MoS2 contributed to minimizing tool wear in the cutting edge of tools. Ngoc et al. [14] performed the hard part turning of 90CrSi steel in an MQL situation using a hybrid nanofluid (Al2O3/MoS2) and mono nanofluids (Al2O3 and MoS2). The results showed that employing hybrid nano-cutting oils in MQL rather than mono-nanofluids improves hard machining performance. Subsequently, in another research, the Taguchi experimental design was ascertained by Usluer et al. [15] for the turning of S235JR steel using dry MQL, 0.2% (MWCNT) nanoparticle reinforced N-MQL, and 0.1% MWCNT + 0.1% MoS2 nanoparticle reinforced HN-MQL, with defined cutting speeds and feed rate as input parameters. When assessing output parameters, it was determined that N-MQL conditions generated the best consequences for both cutting forces and cutting zone temperatures of all the trials conducted.
Tuan et al. [16] evaluated the hard turning efficiency of 90CrSi steel using Al2O3 and MoS2 nano-cutting fluids under MQL and MQCL cutting conditions. Moreover, MQCL exceeds MQL in terms of machining performance, and Al2O3 nanofluid outperforms MoS2 nanofluid in terms of surface roughness values. Duc et al. [17] focused on developing MQL technology for hard turning 90CrSi steel by adding Al2O3 and MoS2 nanoparticles to soybean oil and water-based emulsion. MQL with Al2O3 and MoS2 nanofluids improves coated carbide cutting tools. Machining performance also depends on fluid type, nanoparticles, and concentration. Wickramasinghe et al. [18] investigated the sustainability needs of manufacturing applications that employ MWFs in machining processes. Vegetable oil outperformed mineral oil as a sustainable substitute during machining process, with no harmful consequences on ecological systems. Dubey and Sharma [10] dealt with the tribological characteristics of various hybrid nanofluid and the temperature control in the machining process. It was summarized that Abbas et al. [19] evaluated the surface quality by precision hard turning AISI 4340 steel with wiper-nose and standard round inserts under different machining conditions. The data show that, across the spectrum of cutting conditions tested, wiper inserts provided minimum surface roughness values than traditional inserts, indicating superior performance. The recommendation put forward by Mondal et al. [20] suggested that the utilization of an emulsifier comprising rice bran oil exhibits superior performance in terms of prolonging the lifespan of tools when compared to an alkaline solution. Additionally, this emulsifier is deemed to possess a more environmentally sustainable profile, thereby contributing to a cleaner ecosystem. In their experimental study, Junankar et al. [21] employed monotype nanofluids consisting of copper oxide and zinc oxide, as well as a hybrid nanofluid comprising both copper oxide and zinc oxide. The effects of three distinct nanofluids were examined by the authors in their study. The investigation focused on analyzing various response variables, such as surface roughness and cutting temperature. In addition, it is worth noting that the utilization of a hybrid nanofluid consisting of copper oxide and zinc oxide has demonstrated a reduction in cutting temperature. Specifically, the cutting temperature was observed to decrease by 11% and 13% in comparison to the individual nanofluids of copper oxide and zinc oxide, respectively.
Babu et al. [22] conducted an investigation into the effectiveness of utilizing graphene-based nanofluids during the turning process on D3 hardened tool steel with (MQL) technique. The evaluation focused on various aspects, including surface roughness, cutting temperature, tool wear, and chip morphology. The findings of the study indicate that the utilization of graphene nanofluids with minimum quantity lubrication (MQL) demonstrates promising potential as an effective alternative for reducing surface roughness, tool flank wear, and cutting temperature. Javid et al. [23] explored the efficacy of nanofluid in terms of its impact on tool life, wear mechanisms, surface roughness, machined surface morphology, and material removal rate during the turning process of 30CrMnSiA high-strength low-alloy steel. The experimental setup involved the utilization of the minimum quantity lubrication (MQL) technique along with SiO2–H2O nanofluids (referred to as NF-MQL). The Multi-response optimization analysis unveiled that the NF-MQL cutting condition emerged as the most optimal choice, leading to notable enhancements of 28.34% and 5.09% in surface roughness and material removal rate, respectively. Thakur et al. [24] conducted process parameter optimization utilizing sustainable cooling techniques, with the objective of enhancing the surface quality of the finished product while simultaneously reducing energy and resource consumption. The nanofluids were prepared by incorporating silicon carbide (SiC) nanoparticles (NPs) into a soluble oil medium at different weight percentages (0.5 wt%, 1 wt%, and 1.5 wt%). Furthermore, the experimental findings indicate that the SiC-based nanofluids, when employed in MQL mode, exhibit superior turning performance compared to conventional MQL.

Research Gap, Novelty, and Objectives

Due to an unanticipated increase in cutting temperature at the cutting interface during the hard turning operation of heat-treated AISI 52100 steels in a dry environment, this causes quick tool wear and degradation of the workpiece’s surface quality. To resolve this problem, appropriate cooling and lubrication procedures should be used to lessen the cutting temperature, which will prevent rapid tool wear and power consumption and enhance the product’s surface quality.
MQL (with a single-nozzle arrangement) is one of the most well-known and extensively used cooling technologies for machining hardened steel. A dual-nozzle MQL configuration, a recently developed idea for enhancing the cooling performance of the current MQL, was employed in this investigation. Dual-nozzle MQL has not yet been documented in any literature studies for machining hardened AISI 52100 steel. The key novelty of this research is the employment of ZnO nanofluid with a dual-nozzle MQL setup in hard turning. Additionally, the employment of WASPAS in hard turning performance optimization is a new effort in and of itself. Furthermore, very little research has been performed to explain how hard turning affects power consumption and sound levels, thus a thorough analysis is essential for hard turning success. Considering these novelties, the current research implemented ZnO nanoparticle-based green and sustainable cutting fluid through dual-nozzle MQL in turning heat-treated AISI 52100 steel (56 ± 1 HRC) using PVD single-layer (AlTiN)-coated carbide inserts. The impact of process variables like cutting speed, feed, depth of cut, the flow rate of lubricant on response parameters like tool wear, surface roughness, cutting temperature, cutting sound, power consumption, and chip morphology has been thoroughly investigated during the experiment. In addition, a novel WASPAS-based MCDM (multi-criteria decision-making) optimization technique is utilized to obtain the best possible input parameter combination for increasing product cost by enhancing the product’s surface finish, decreasing production cost by lowering cutting temperature and tool wear, and achieving noise reduction as well as lowering power consumption during hard turning operation for a sustainable industry application of AISI 52100 steel.

2. Implementation Details

There has been a revolution, particularly in aircraft/aerospace industries, in relation to the manufacturing and development of highly precise components of aircraft with superior strength, toughness, and corrosion resistance properties. AISI 52100 steel is a high-carbon chromium alloy steel used widely in aircraft bearings and in automobile applications such as shafts, heavy-duty gear, pinions, gudgeon pins, ball screws, camshafts, gauges, CV joints, etc., because of their certain properties like a higher hardness value, superior load capacity to thermal shock, and high wear resistance effects. However, due to its high strength and toughness, AISI 52100 alloy steel is very complex to cut. Therefore, for the machinability improvement of this material, a cylindrical shape of AISI 52100 steel rod, with dimensions of length and diameter of 150 mm and 50 mm, respectively, was chosen for machinability investigation. Initially, the selected rod specimens were heated uniformly to the hardening temperature, 850 °C, and held at 850 °C for 30 min. Then, each set of specimens were quenched immediately in an oil chamber for an oil bath for 4 h. After quenching, the specimens were taken out from the oil chamber and cleaned properly for the process of tempering. Then, the quenched specimens again heated up to 250 °C slowly and held at that temperature for 30 min (soaking time). Then, let the material cool slowly in the air to develop the desired levels of hardness and toughness (55 ± 1) HRC [25].
The hard turning operation was performed using a Jyoti DX 200-4A-CNC lathe machine tool. This machine tool has a power rating of 7.5 kW and a variable spindle speed range of 50 to 4000 r/min. In the present study, the finishing operation involved the utilization of a WIDIA carbide insert coated with a single-layer PVD (AlTiN) coating, specifically the CNMG120408MS-WS10PT grade. Additionally, a PCLNR 2525M12 tool holder was employed. The hard turning experiment involved the selection of four cutting parameters, namely cutting speed (70, 140, 210, and 280 m/min), feed (0.05, 0.1, 0.15, and 0.2 mm/rev), depth of cut (0.1, 0.2, 0.3, and 0.4 mm), and lubricant flow rate (20, 30, 40 and 50 mL/hr). The current experiment follows the Taguchi-based L16 OA design of experiment. Various output responses, including flank wear, cutting temperature, cutting power, surface roughness, cutting sound, and chip morphology, were observed and analyzed for each experiment.
The analysis of tool wear and chip images was conducted using an Olympus STM 6 optical microscope manufactured by Olympus Corporation, Shinjuku, Tokyo, Japan. The surface finishing of a machined cylindrical surface was achieved by utilizing the Surftest SV-2100 surface measuring instrument manufactured by Mitutoyo Corporation, Sakado, Takatsu-ku, Kawasaki, Kanagawa, Japan. The three-phase multi-function bidirectional power cum energy meter, specifically the EMT34 model, was employed for power measurement purposes. The T540 professional thermal camera by FLIR was employed to examine the temperature degradation that occurs during machining in the cutting zone. Noise emission during the turning process is recorded by a sound level meter manufactured by Fluke (Model-Fluke 945) (Everett, WA, USA). The advanced analysis of tool wear and chip morphology was conducted using the ZEISS Gemini SEM 450 (Jena, German) scanning electron microscope, and the resulting reports were analyzed using the EDS or EDAX software.
The study commenced by procuring commercially accessible ZnO nanoparticles (supplied by AD-Nano Technologies Pvt Ltd., Shimoga, Karnataka, India) with a size range of 30–50 nm. The details of EDS test of ZnO powder are displayed in Figure 1. From this analysis, it is ensured that the powder contains element Zn and O with % weight of 98.1% and 1.9%, respectively. Prior to the preparation of the nanofluid, the ZnO nanoparticles undergo a preheating process lasting 3 h, aimed at eliminating any moisture content present within the nanoparticles. Subsequently, the dispersion of zinc oxide (ZnO) nanoparticles is achieved by incorporating them into LRT 30 mineral oil. In the present study, a nanofluid containing ZnO with a weight concentration of 0.5% has been formulated and employed as a coolant in the conducted experiment. Zinc oxide (ZnO) nanoparticles are introduced into LRT 30 mineral oil as a means of pre-dispersion, facilitated by a mechanical stirrer for a duration of 2 h. Next, the sample is transferred to the ultrasonication order to subject it to sonication, which serves the purpose of reducing the agglomeration of nanoparticles. The nanofluid sample was subjected to sonication for a duration of approximately 4 h. In the case of the homogeneous mixture of a nanofluid sample, the ZnO nanofluid sample was subjected to continuous mixing using a magnetic stirrer for duration of 4 h. The pictorial image of synthesis of LRT 30-based ZnO nanofluid was displayed in Figure 2. The machinability performance of AISI D2 steel under ZnO-nanofluid MQL environment is evaluated through turning experiments using the Taguchi L16 OA design after achieving a homogeneous dispersion of the nanofluid.
In the current experimental configuration, the continuous supply of lubricant in the normal minimum quantity lubrication (MQL) mode system was modified to a pulse mode. This modification was made in order to gain control over the timing or frequency of the ejection of the air-lubricant mist jet over the machining zone. The primary objective of employing pulse MQL mode is to further reduce lubricant consumption and investigate its heat dissipation capacity, as well as its impact on machining performance. In the current configuration, compressed air is introduced into the solenoid valve, subsequently flowing into the moisture control valve via the air pressure control valve and oil control valve. A minute proportion of the compressed air is introduced into the mixing chamber. Conversely, the lubricant (referred to as LRT 30) is introduced into the mixing chamber from the oil tank as a result of gravitational force. In order to achieve the atomization of the lubricant, compressed air is introduced into the mixing chamber. The compressed air, which has been depleted of moisture, is subsequently introduced into the flow control valve. This valve is responsible for dispensing the mist lubricant in the form of a spray, which is directed into the machining zone through the utilization of a CH10 5/16-type spray nozzle. Pulse time refers to the frequency or timing at which lubricant flow occurs. In this current scenario, pulse timing is set to one second; this implies that when the pulse time is set to 1 s, the lubricant will consistently flow over the machining zone for a duration of one second, followed by a cessation of lubricant flow for the subsequent one second. This cyclic pattern of lubricant flow and pause is then repeated. Moreover, to diminish the undesirable temperature rise in the area of cutting zone, double-nozzle MQL flow can be effective. Nozzles are kept pointed toward to the top and bottom surfaces of the cutting tool in a 90-degree angle position from the tool holder axis. The experimentation details with nozzle positions are displayed in Figure 3.

3. Results and Discussion

The results of responses, namely tool wear (VB), surface roughness (Ra), power consumption (P), cutting temperature (T), and cutting noise, are reported in Table 1.

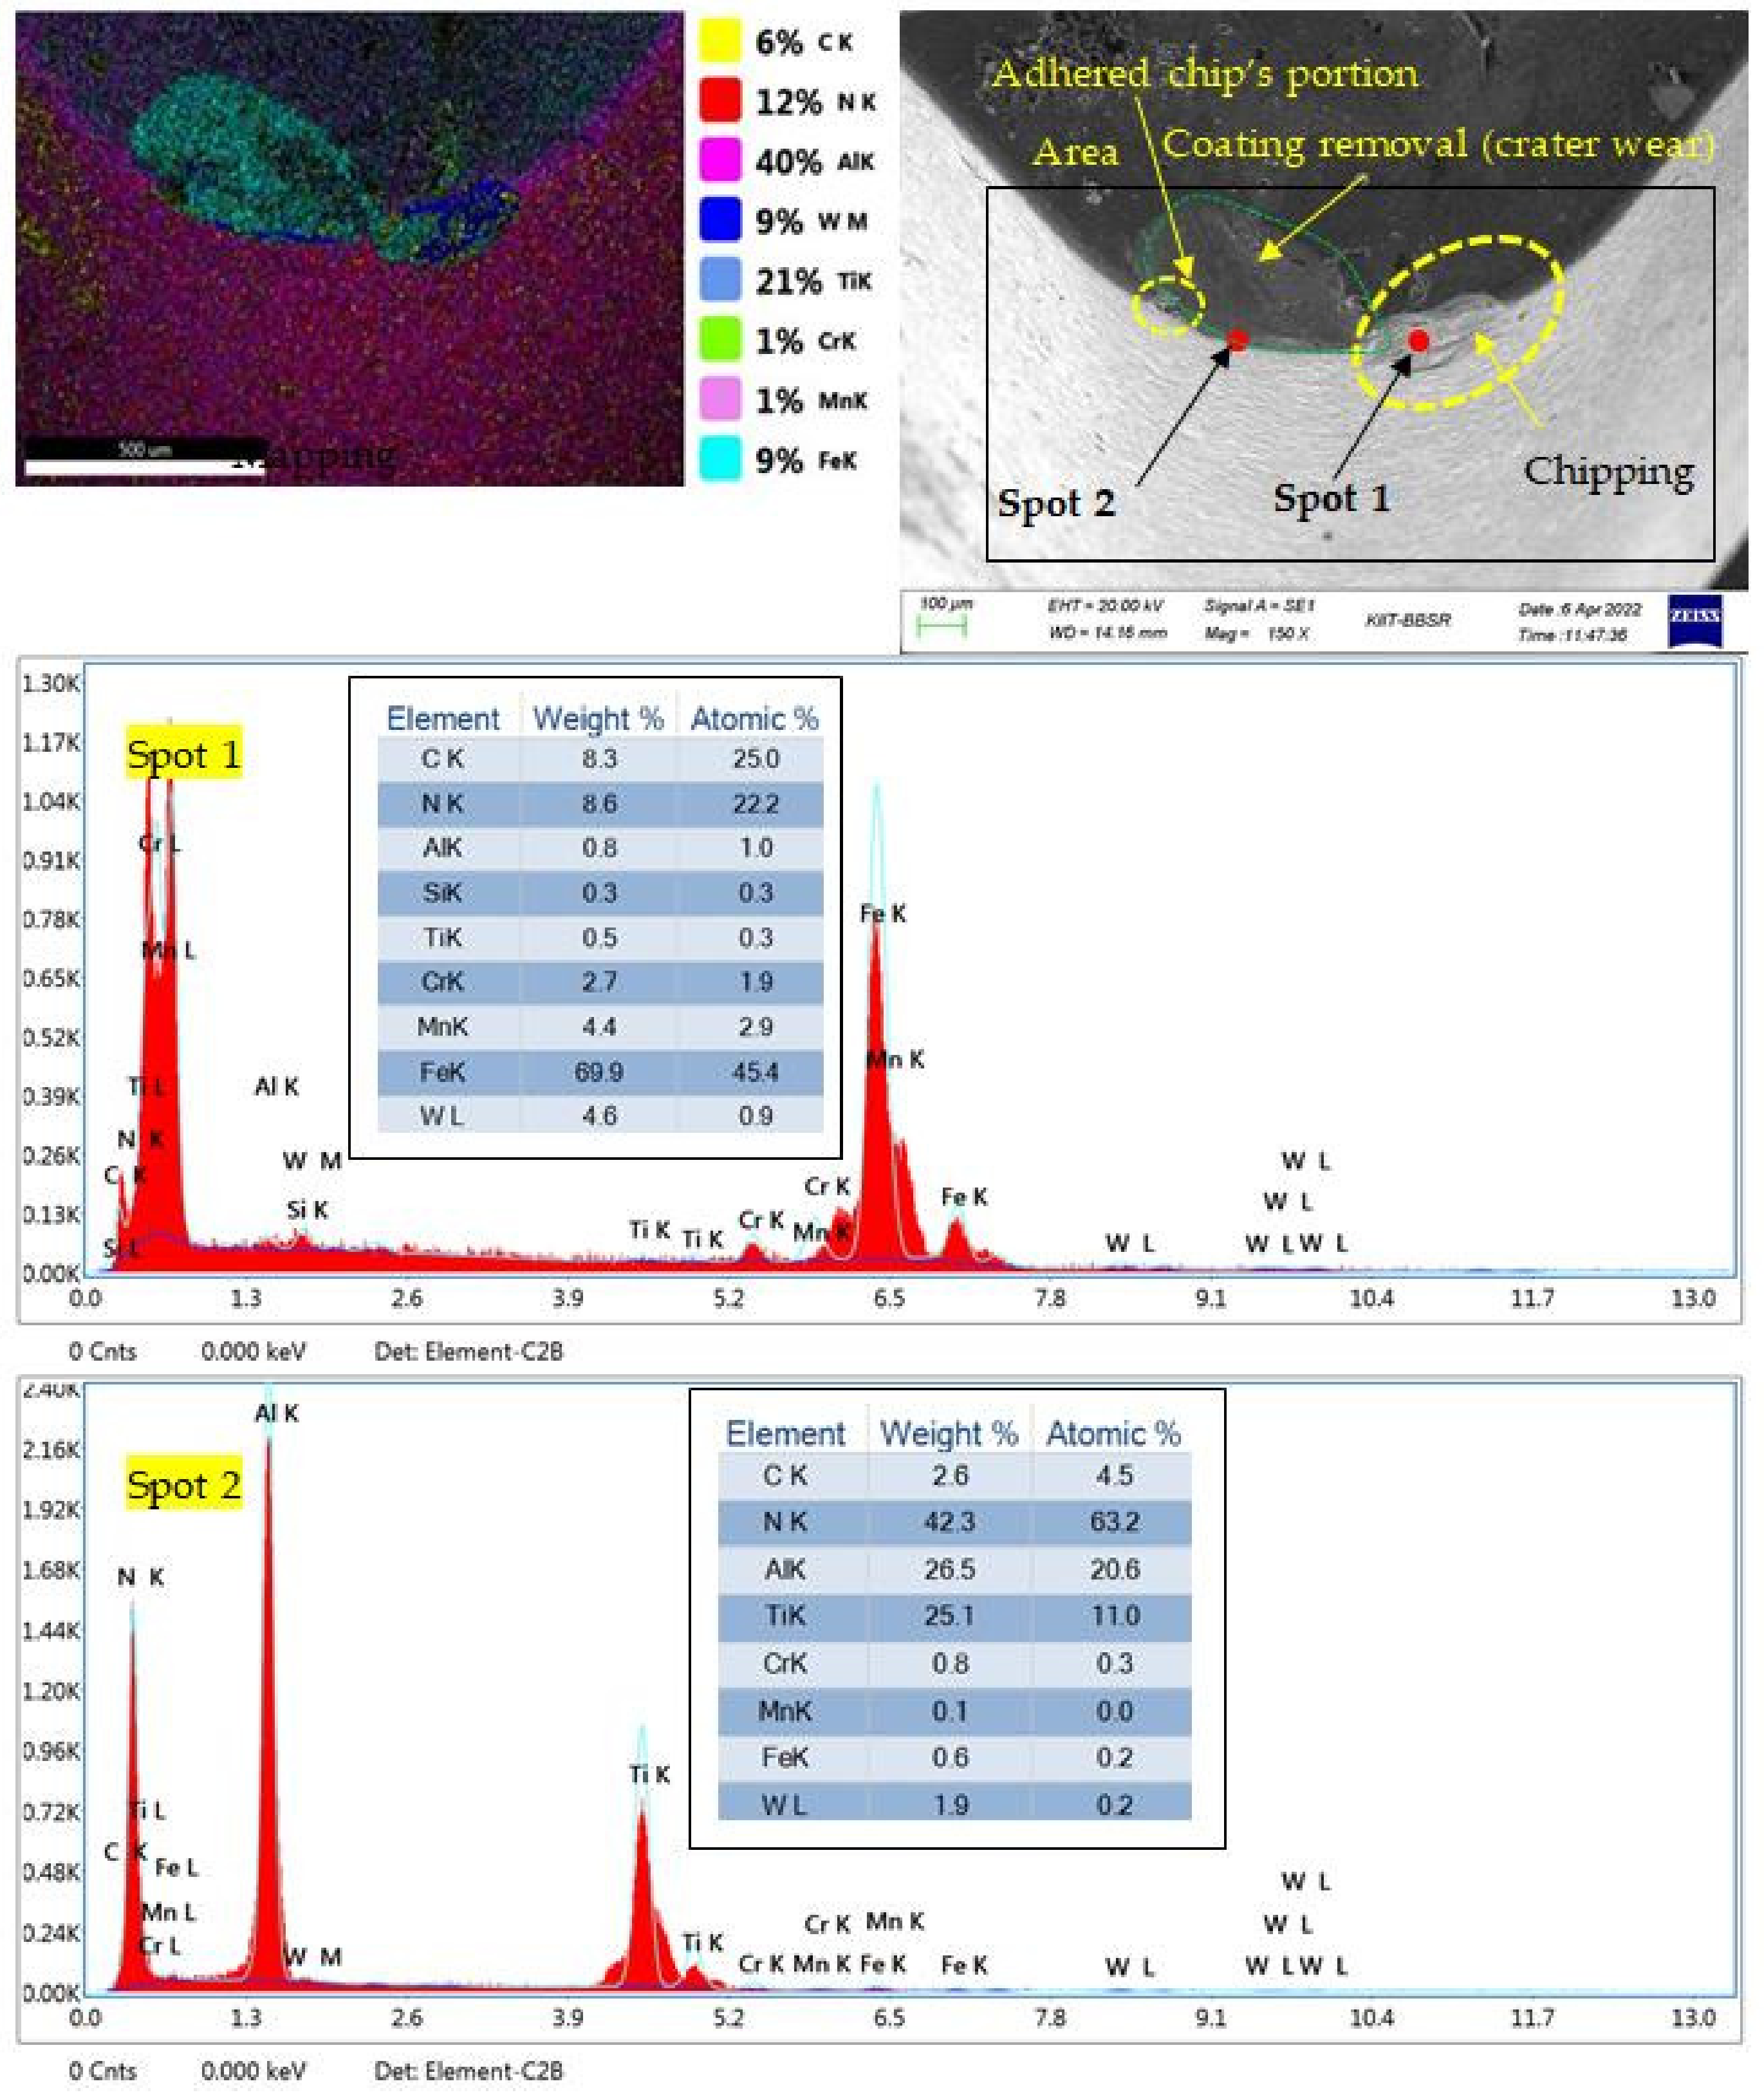
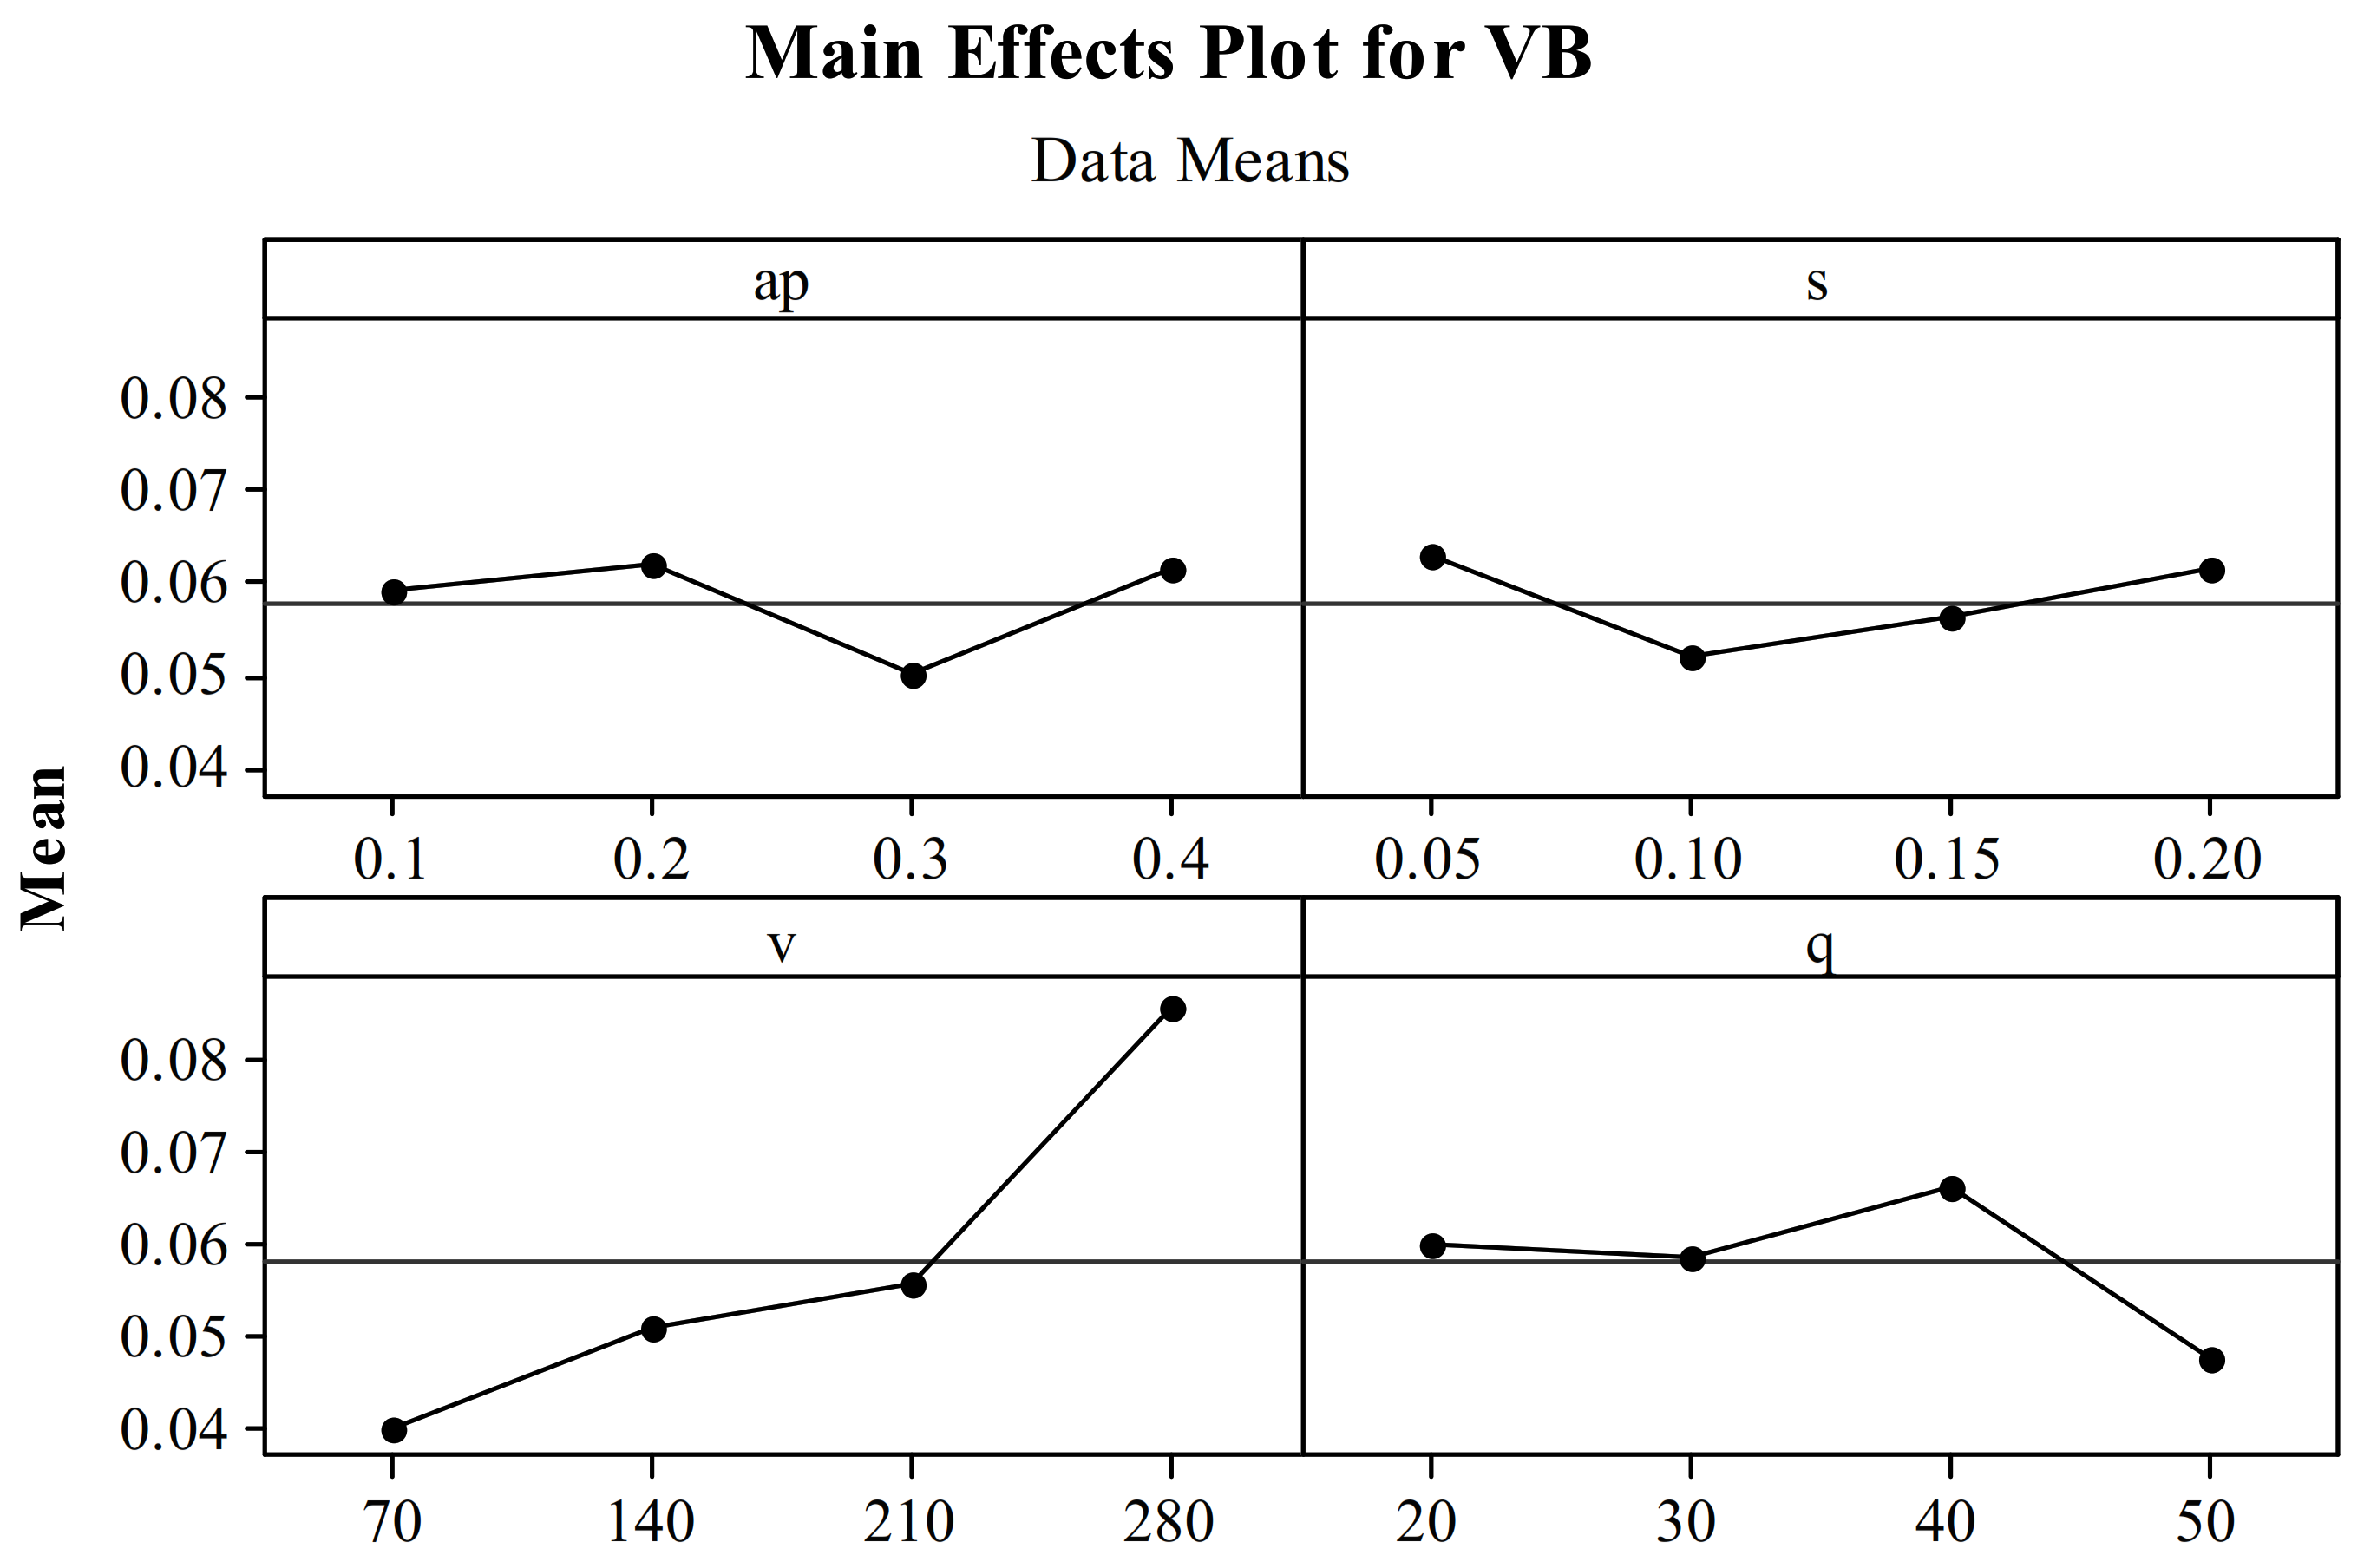
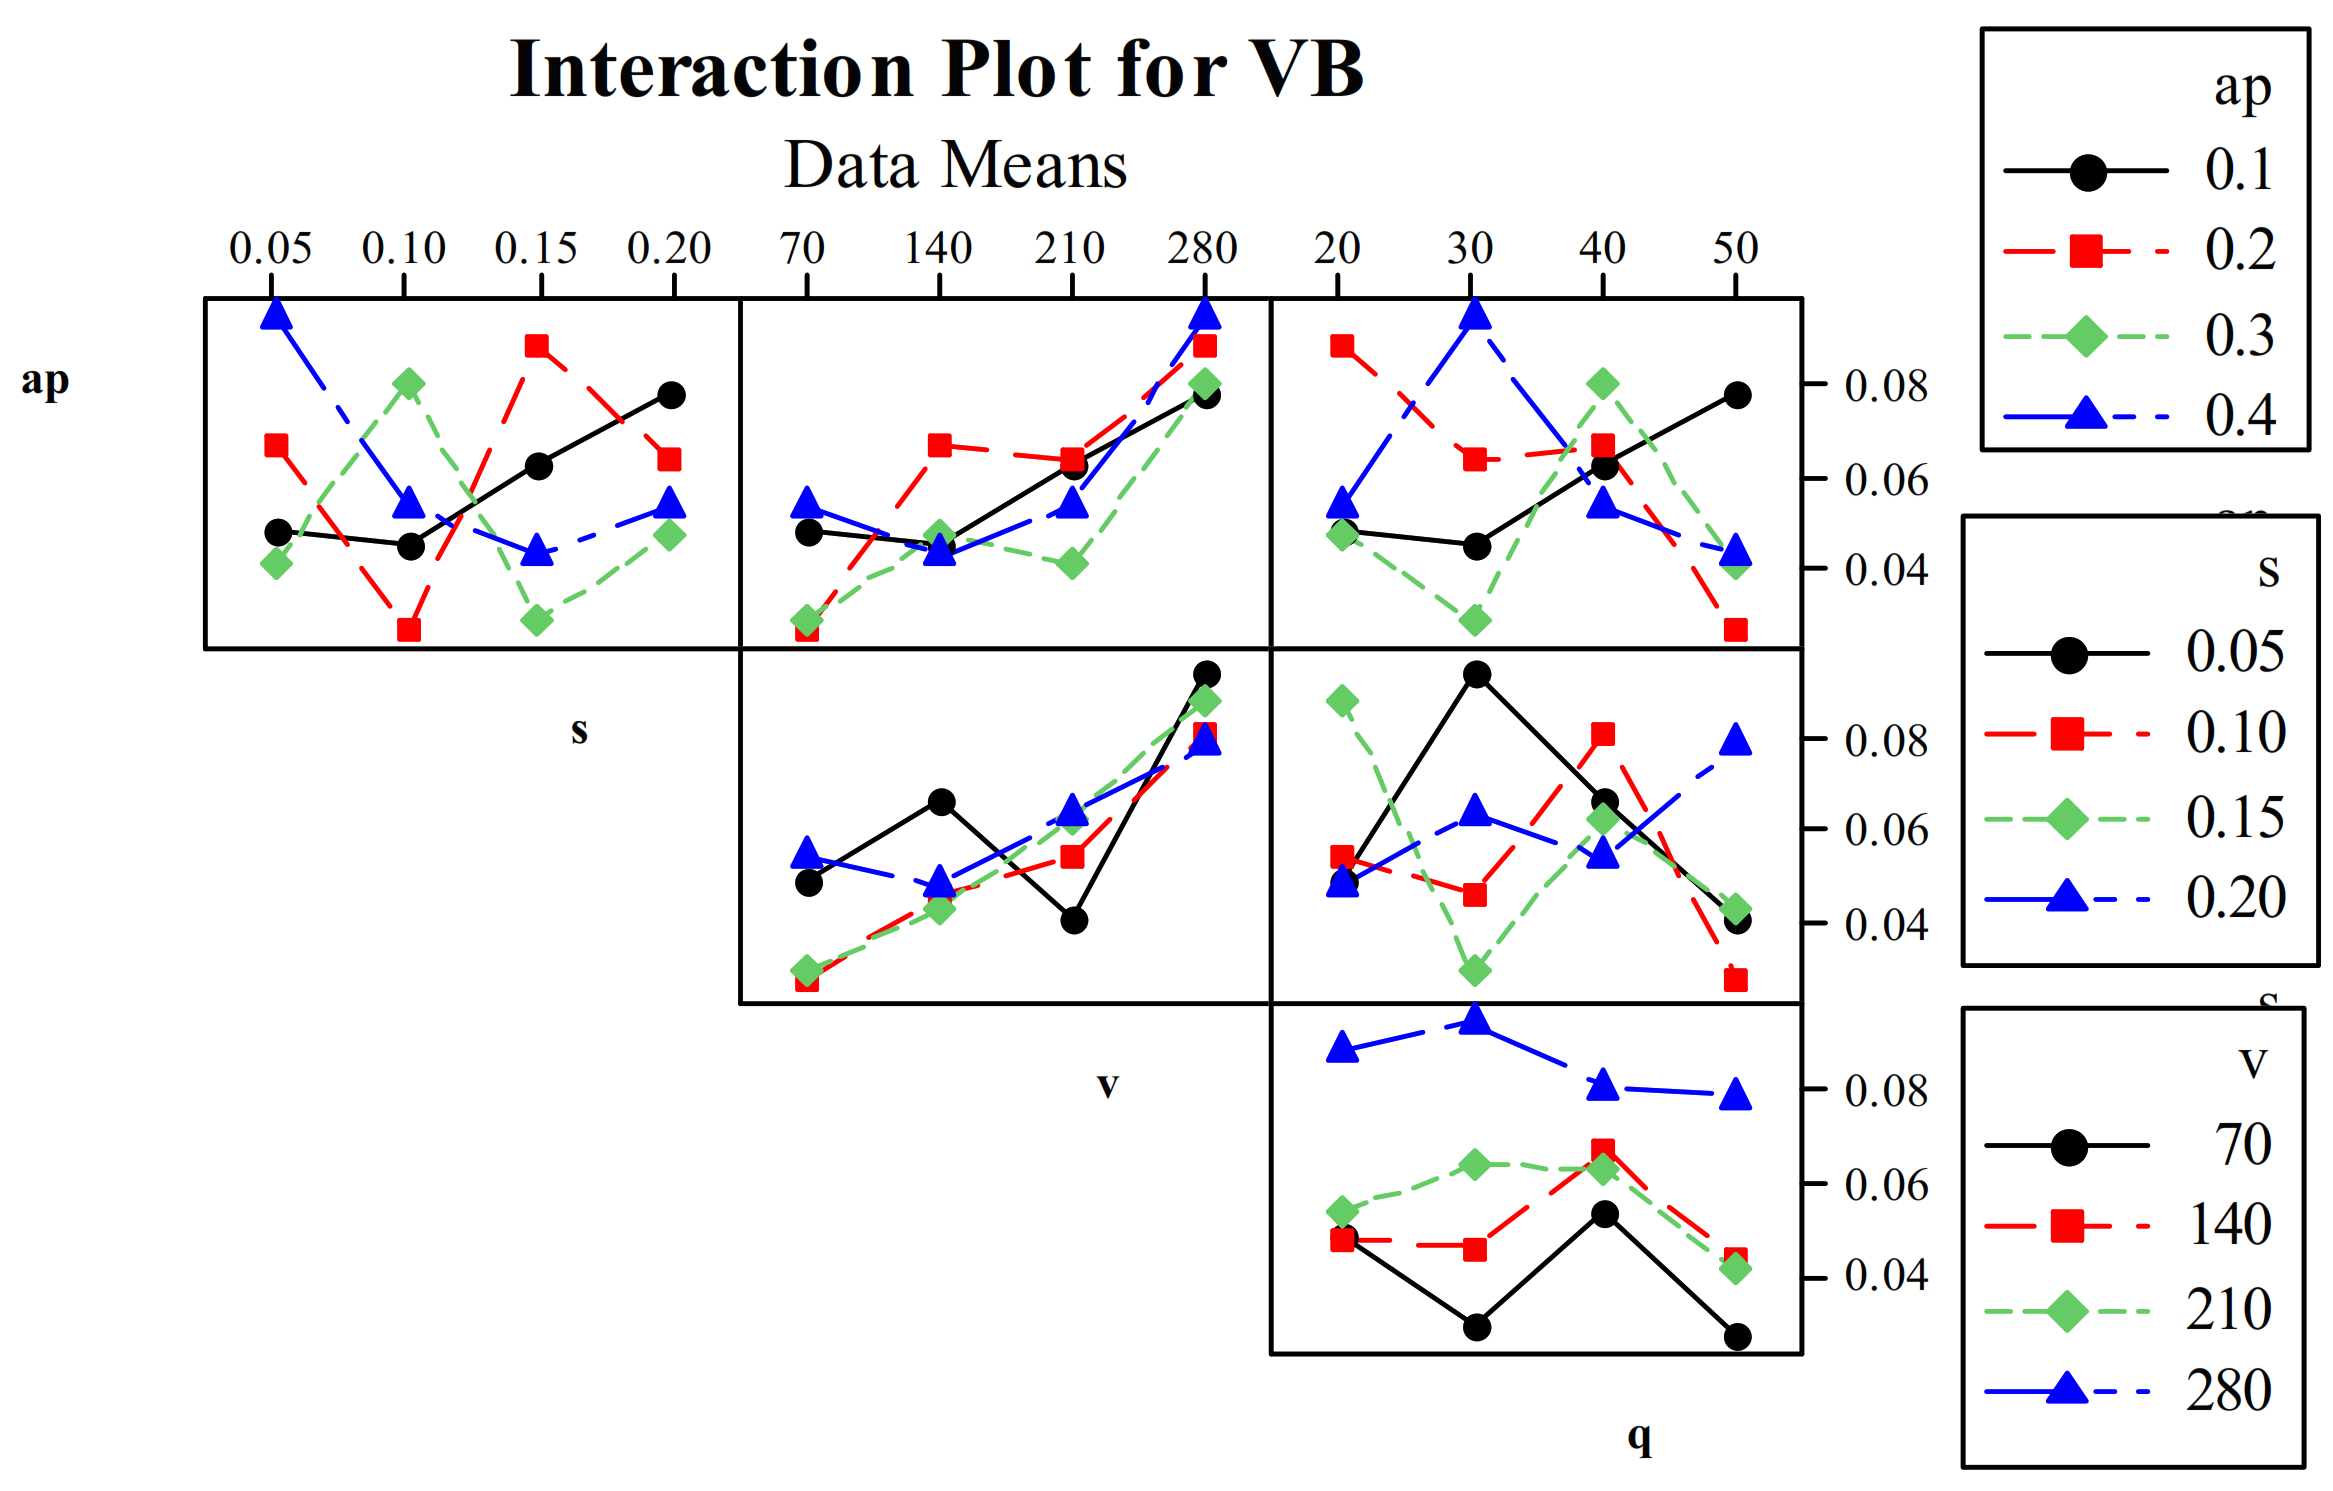
3.1. Assessment of Tool Wear

Hard turning faces severe tool wear issues in the absence of suitable cooling application. Therefore, the current research utilized a sustainable cooling technology (ZnO nano-cutting fluid through dual-nozzle MQL) to control the growth of wear in turning hardened bearing steel (57 ± HRC). The tool wear numeric value was obtained using an optical microscope and is displayed in Table 1. It is evident that the tool flank wear was greatly subsidized due to the effective cooling and lubricating capability of ZnO nano-cutting fluid. The dual-nozzle coolant injecting system provided two directions of cooling (toward perpendicular to rake face and tool flank face); however, rapid heat transfer from the tool–work contact region to the environment was noticed resulting lower growth in tool wear. The obtained wear values (ranging from 0.027 mm to 0.095 mm) were much lower for hard turning concerns, which ensured the suitability of the TiAlN–PVD-coated carbide tool for machining hardened steel under dual-nozzle dispersed ZnO nano-cutting fluid.
Moreover, wear mechanism was addressed using optical images, SEM images and EDS results. The optical images of tool wear (at 0.1 mm of depth cut) are displayed in Figure 4. It was noted that abrasion was the main wear mechanism responsible for growth in flank wear. Deep grooves on the tool edge were noticed due to the continuous flow of the heated chip over the tool edge, as shown in Figure 4. At the highest-speed (240 m/min) conditions, the highest tool wear was found. The least wear (0.027 mm) was produced when turning was executed at the lowest speed (70 m/min) with a combination of the highest depth of cut (0.2 mm), moderate feed (0.1 mm/rev), and the highest flow rate (50 mL/hr). Further, the fresh tool SEM and EDS tests were carried out and their results are disclosed in Figure 5. Moreover, SEM and EDS tests were also performed for tools having the least (Figure 6) and largest tool wear (Figure 7). From the fresh tool analysis, it can be determined that the tool has titanium (Ti), aluminum (Al), and nitrogen (N) elements, which are the constituents of the coating layer, TIAlN. Also, the elements carbon (C) and tungsten (W) are found in EDS test. The mapping result of the fresh tool (Figure 5) ensured the presence of 5% of C, 17% of N, 53% of Al, 25% of Ti, and 1% of W, while the lowest wear (Figure 6) tool contains 4% of C, 10% of N, 61% of Al, 21% of Ti, and 1% of O, Fe, Mn, and W each. Therefore, it can be stated that the worn tool lost some amount of C, N, and Ti elements due to friction from rubbing the tool tip with the workpiece. Similarly, the percentage amount of other elements like Al, O, Fe, and Mn were improved due to the adhesion of work materials or chip particles on the tool tip region. Similarly, if the results of spot 1 (Figure 6) were compared with a fresh tool, then it can be said that the % of C, Al, and W are increased on worn tools. The increment in C is possible due to the adhesion of the chip’s portion or workpiece material (C is the element of the workpiece). The increment in Al and W are possible due to the increasing exposure of tool coating/tool substrate after the chipping of the tool edge. The other element like Ti has been greatly reduced due to the chipping of the tool. Moreover, the elements like Cr, Mn, and Fe are found in that region, which ensures the presence of workpiece elements in that region through adhesive action. Moreover, for a more in-depth analysis, the elemental analysis was accomplished at the edge of the tool as shown in spot 2 (Figure 6). The percentage of C and N was improved in comparison to the fresh tool. The percentage increment of C ensured the adhesion of workpiece elements, while N might be gained due to the exposure of the element N of the coating layer due to the rubbing action. Similarly, decrements in other elements like, Al, Ti, and W are noticed due to gradual wear occurring at the tool tip due to friction between the tool edge and the workpiece during cutting action.
The wear analysis of the highest wear tool was also accomplished with the use of SEM and EDS test results (Figure 7). The element Fe was found to be the highest (69.9% by weight) on spot 1, which ensured the presence of element Fe into the chipped portion due to a micro-diffusion of the workpiece or the chip’s material at an elevated temperature (214.9 °C). Also, the % of C was also improved due to the diffusion of C elements from the workpiece to the tool tip. In comparison to the fresh tool, decrements in the weight % of elements (N, Al, and Ti) were found due to the removal of the coating layer from spot 1 due to chipping. Furthermore, new elements like Cr, Mn, and Si were found on the tool tip due to micro-diffusion or the adhesion of the chip portion on the tool tip. Also, due to chipping at the edge, the coating was removed, and substrate element W was increasingly exposed; hence, the % of W was improved in comparison to the fresh tool. Further, another point on the tool edge (spot 2) was analyzed. The % of C was improved due to the adhesion and/or diffusion of the workpiece element. The % of N might have been enhanced due to the presence of a higher N content in the coating layer (TiAlN) on that spot. However, as the % of N was higher, the other elements of coating (Ti and Al) were reduced on that spot. The presence of workpiece elements (Cr, Mn, and Fe) on that spot ensured the diffusion or adhesion mode of the mechanism in hard turning. The crater wear was clearly shown on the tool tip. It developed due to the removal of the coating layer from the rake surface of the workpiece. The removal of the coating layer occurred due to the higher temperature generated during machining.
Further, the wear result was analyzed using main effects plot (Figure 8), interaction plots (Figure 9), and ANOVA (Table 2). Figure 8 shows that the tool wear was aggressively influenced by cutting speed as the curve was rising with speed. Considering individual effects, the average wear was found to be the least when the depth of cutting was set as moderate (0.3 mm), while 0.1 mm feed was attributed to the least average wear. Similarly, the highest flow rate (50 mL/hr) enabled machining attributed to the least average wear. The trend of wear was not clear with varying feed, depth of cutting, and flow rate. The effect of the pair of terms on tool wear was analyzed using interaction plots. The interaction effects of the pair of terms were relevant when the curve lines were parallel. The effects of interaction terms on tool wear deteriorated when the lines deviated from the parallel position. Based on this, the pair of parameters, namely s–ap, q–ap, and q–s, have relevant effects on tool wear, while other terms seem to be irrelevant (Figure 9). ANOVA (Table 2) results revealed that the cutting speed had the largest impact on tool wear (76.68%), succeeded by flow rate (11.94%), depth of cut (6.27%), and feed (4.94%). It also affirmed that all the input terms have significant consequences on tool wear.

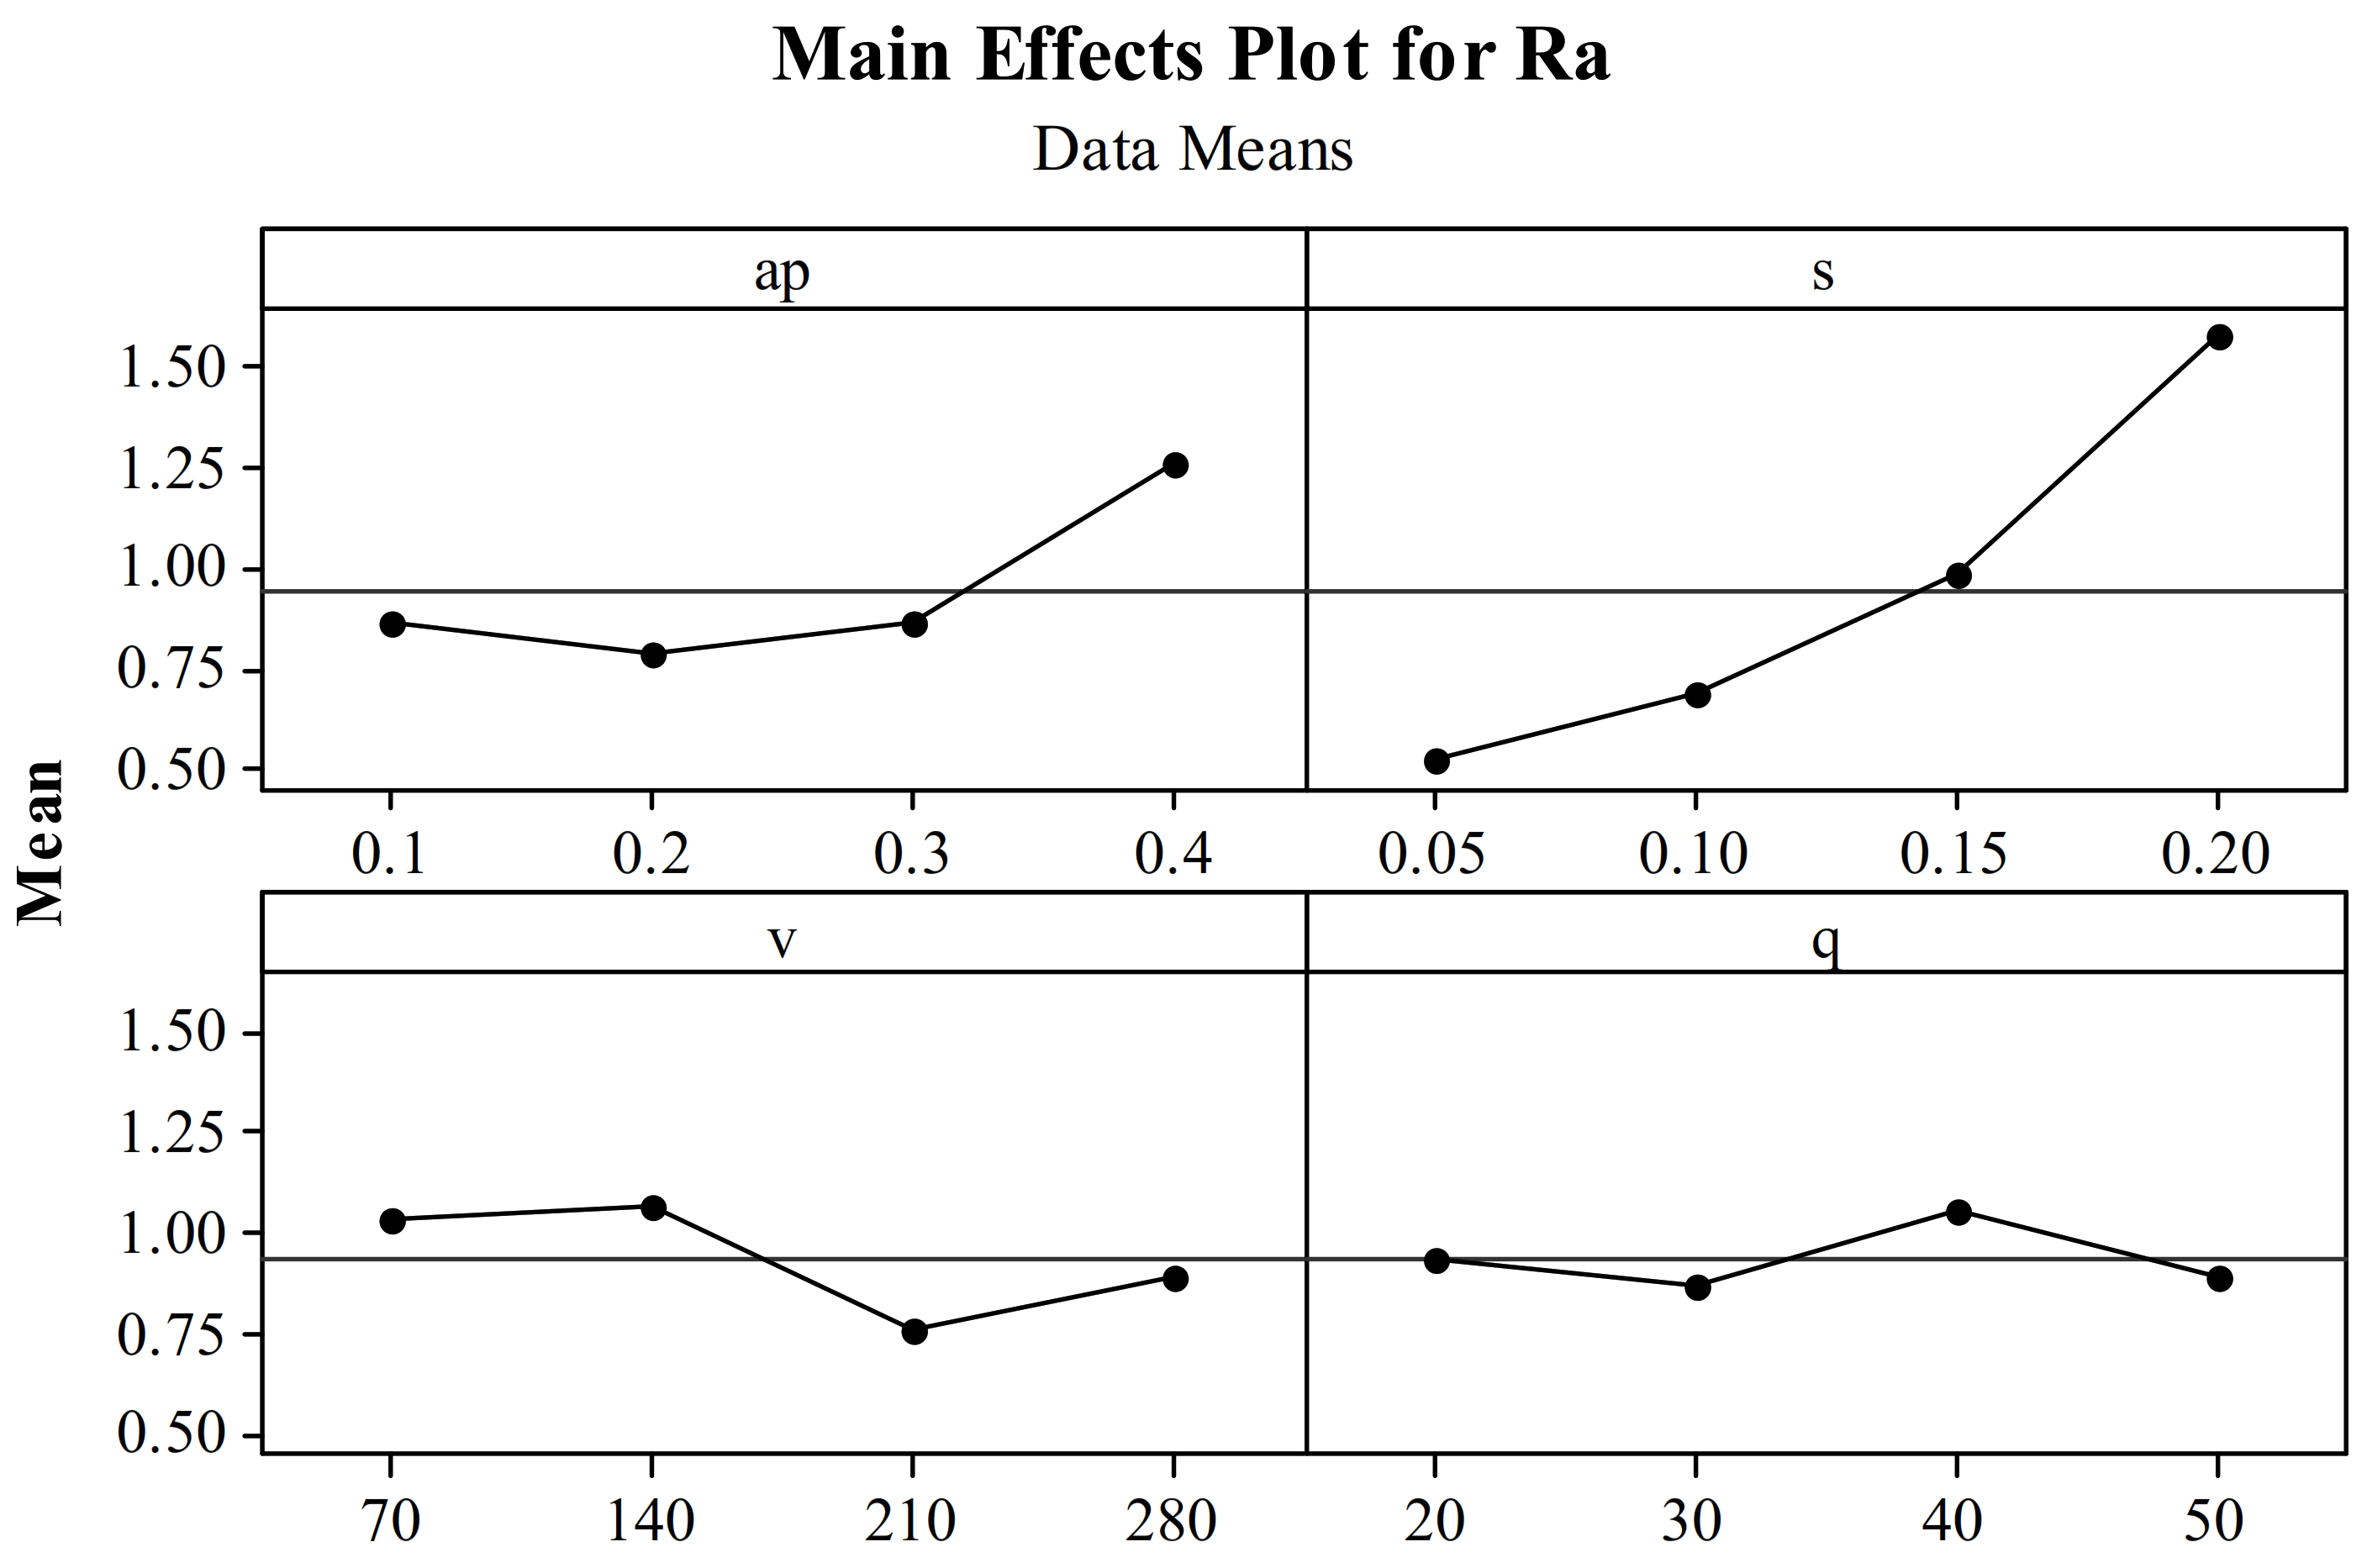
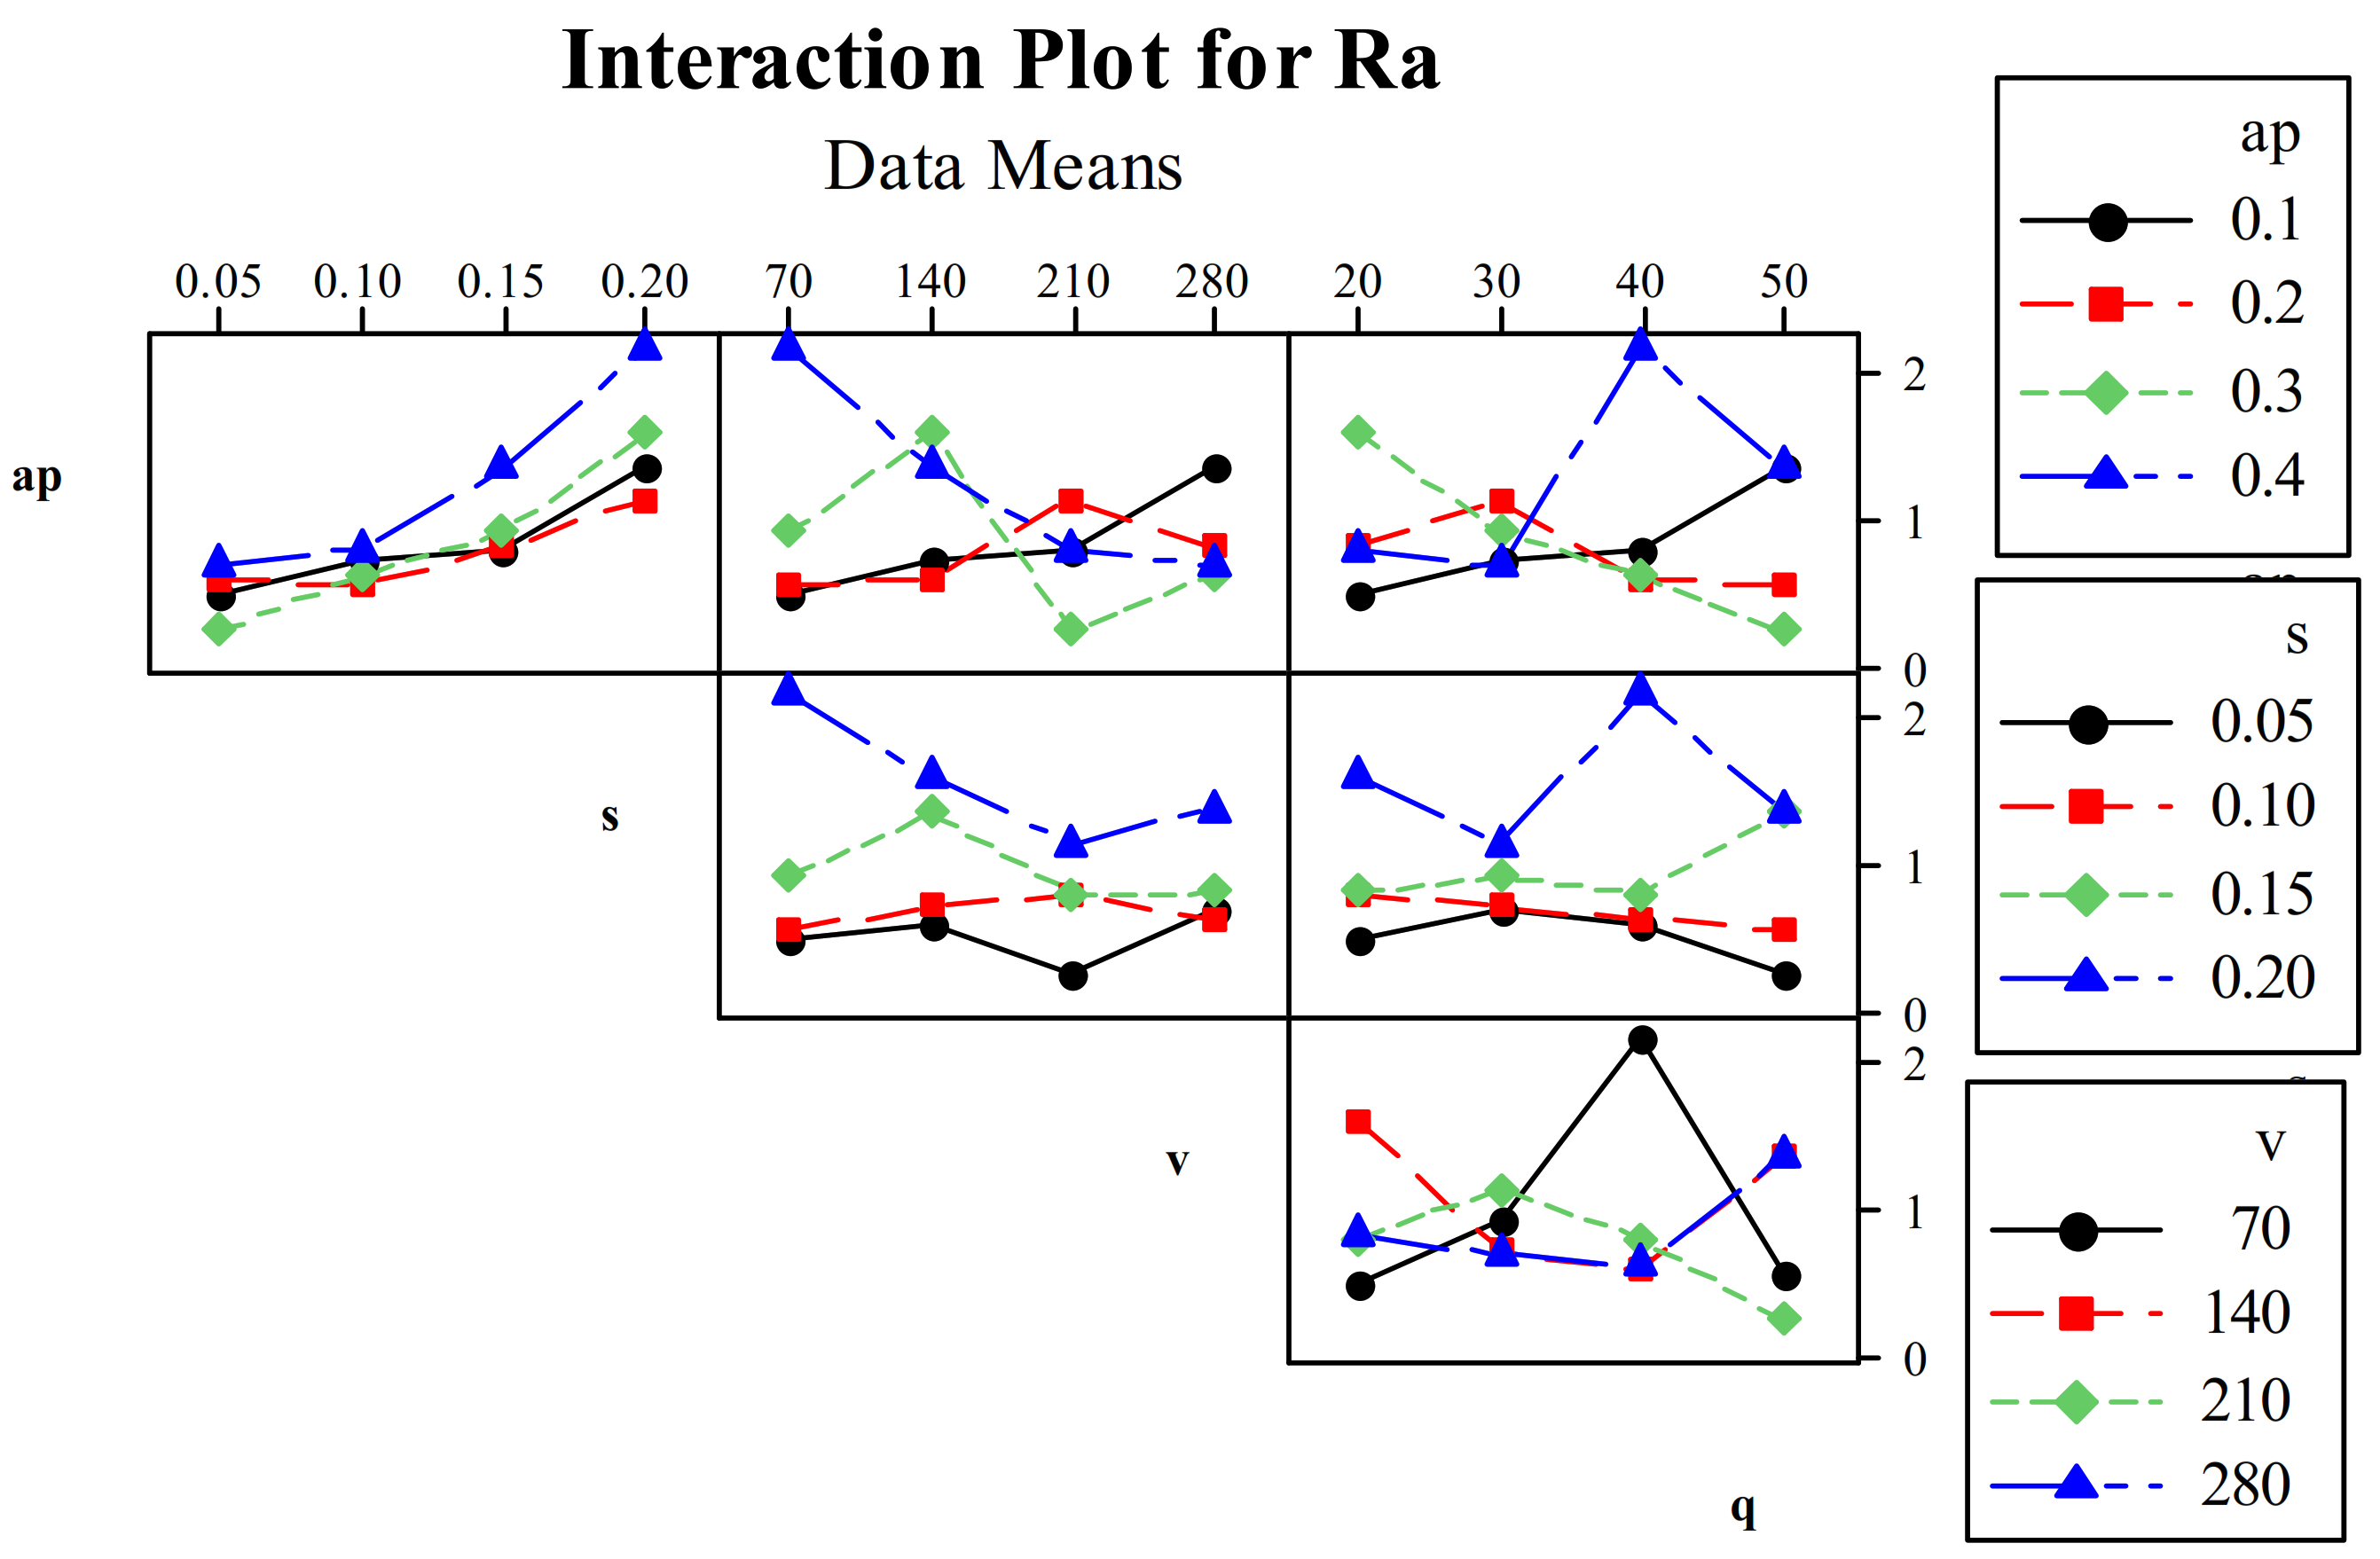
3.2. Assessment of Surface Roughness

The quality of the finished products can be controlled by controlling the surface roughness with the use of appropriate cutting variable values and lubrication strategies. Surface roughness should be evaluated to assess the functioning of machined components and determine whether the desired requirements are met under acceptable cutting and cooling conditions [26]. The surface roughness (Ra) of hard bearing steel in turning was evaluated under the ZnO nanofluid cooling condition by varying different control variables such as cutting speed, feed rate, depth of cut, and flow rate. The obtained Ra varied from 0.252 μm (test no. 9: ap = 0.3 mm, s = 0.05 mm/rev, v = 210 m/min, q = 50 mL/hr) to 2.174 μm (test no. 16: ap = 0.4 mm, s = 0.2 mm/rev, v = 70 m/min, q = 40 mL/hr). The surface roughness was traced to be higher in magnitude when the feed rate was the highest (0.2 mm/rev). Also, Ra increased due to a gain in feed rate [27]. With an increase in feed rate, the volume of material increases, and material buildup in the form of chips occurs across the tool–work–chip interface. Consequently, rising friction increased the roughness of the surface. Heat transmission is very minimal at higher cutting rates due to insufficient time. With increasing temperature, the surface quality deteriorated [28].
Moreover, the influence of input variables on surface roughness was discussed using the main effects plot, interaction plots, and ANOVA. According to the main effects diagram (Figure 10), the surface roughness increased with a growing feed rate. This may be because the distances among peaks and valleys expand as the feed rate per tooth rises, and in hard machining processes, surface roughness is mainly generated by cutting tool scratches on the machined work surface [29]. The value of surface roughness decreased with the slight gain in depth of cut (0.1 to 0.2 mm), beyond which it gradually improved at a lower rate. The surface roughness was almost the same when cutting speed changed from 70 to 140 m/min, but when the speed reached 210 m/min, the roughness deteriorated due to the softening of work material due to the relatively higher temperature generation at 210 m/min. Further, when the cutting speed was raised to 280 m/min, the surface roughness slightly improved due to the generation of a higher tool wear at the highest cutting speed. The effect of flow rate seemed to be very low, as the mean surface roughness varied along the mean line. Therefore, it can be said that, as the impact of other variables on surface roughness was higher, hence, the actual effect of flow rate on surface roughness was not clear. Thus, for a clear understanding of the effect of lubricant flow rate, all other variables should be fixed. The interaction plots for surface roughness (Figure 11) confirmed the relevant interaction effect of the pair of terms ap–q, s–q, v–q, and ap–v on surface roughness. An ANOVA (Table 3) approach was used to determine the percentage impact of input terms on Ra. The ANOVA affirmed that the flow rate had the least contribution, at about 2.26%, on the surface roughness, while the surface roughness was majorly dominated by the feed rate (74.26%), followed by the depth of cut (15.88%) and the cutting speed (7.13%).

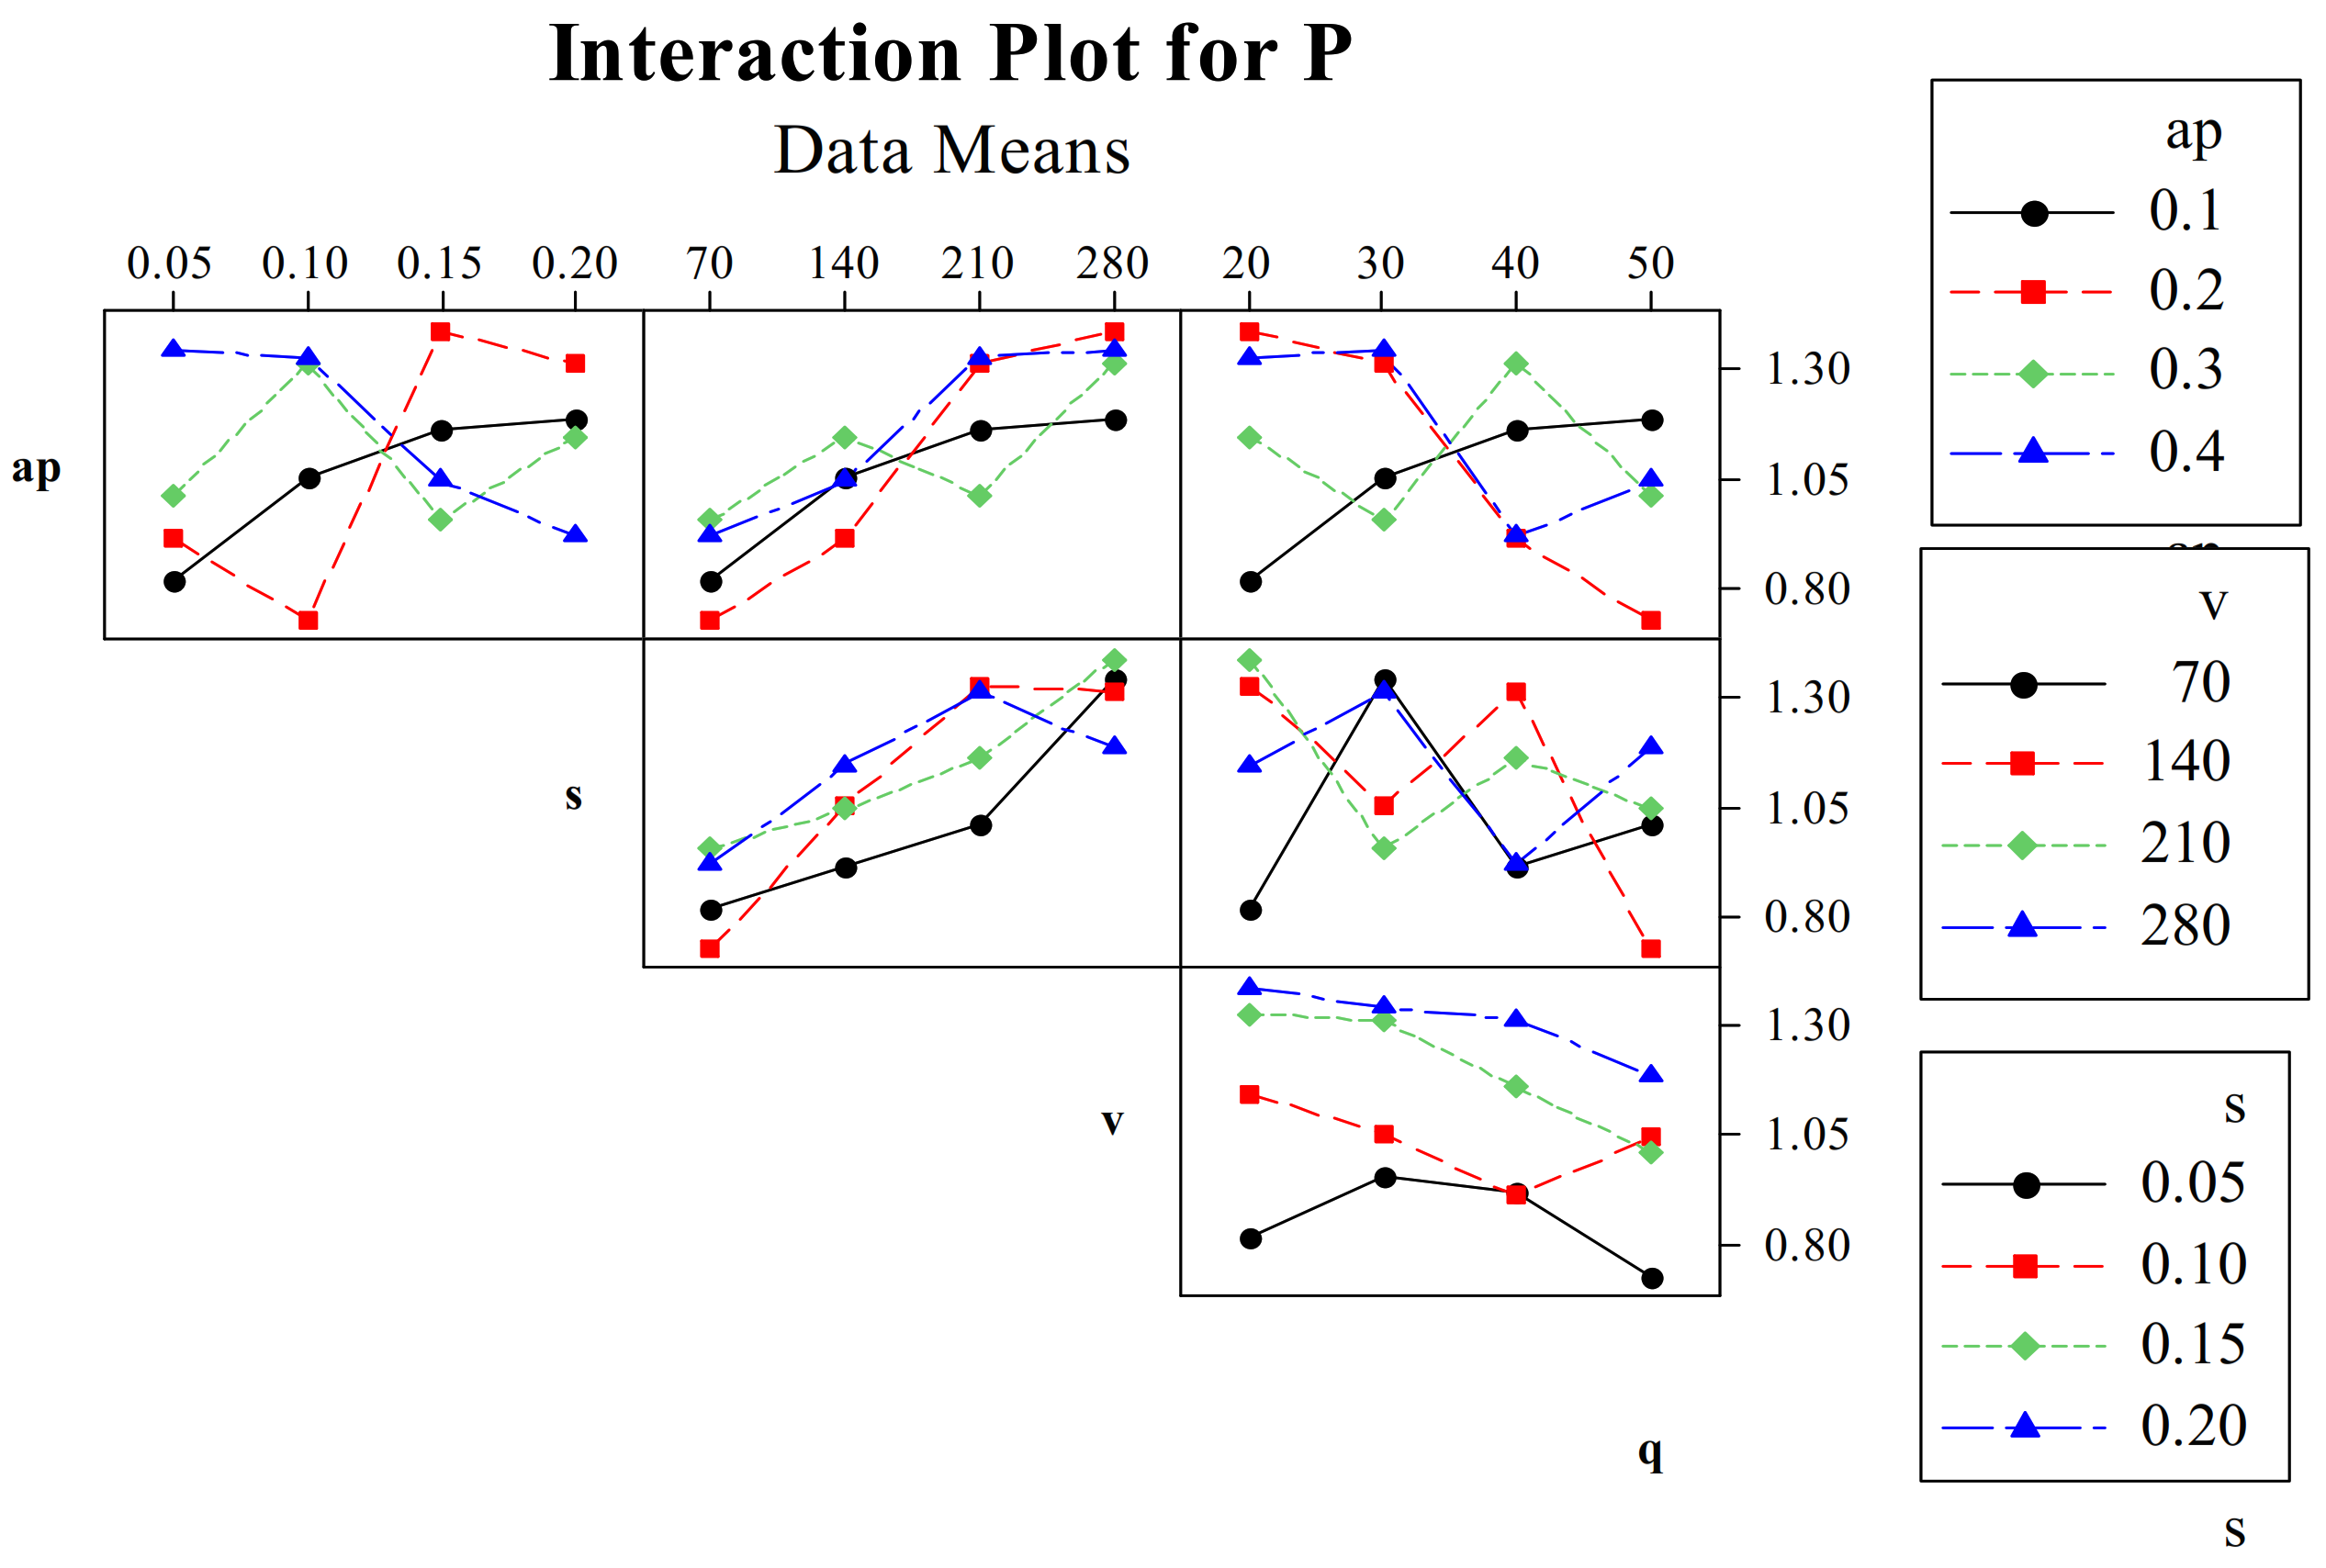
3.3. Assessment of Power Consumption

In manufacturing units, most machining procedures are carried out with the help of electricity. The manufacturing industry is responsible for 36% of the world’s CO2 emissions and 30% of the world’s energy use. Energy efficiency, power factor, active power, and active energy consumed by machines are significant responses that have a direct impact on sustainable machining [30]. From the measured power results, it can be said that the cutting power was the highest (1.388 kW obtained in test no. 7) when the cutting speed was the highest 280 m/min. It is a fact that the lathe motor needs more power to revolve the spindle at a faster speed. The motor uses significantly more power to keep the spindle speed set when cutting is being performed. It is noteworthy that prior research indicated that other cutting factors besides cutting speed are also responsible for changes in power usage [31,32]. The main effect plots’ results (Figure 12) indicated that the power consumption during machining was increasing with gains in cutting speed, feed, and depth of cut, while it was diminishing with increasing flow rate. The power consumption was greatly improved due to gaining speed as the motor consumed more power to rotate the workpiece at a higher speed [32]. Additionally, as the cutting speed increased, the mechanical and thermal load increased as well, which led to better power utilization [33]. Additionally, when the feed value increased, the amount of friction between the tool and work surface increased. This resulted in a larger cutting force, which increased cutting power consumption. Furthermore, when the cutting feed and depth grow, a larger cross-section of the workforce must be removed during the cutting process, increasing the need for a higher cutting force and energy use. This outcome agrees with the interaction plots’ results (Figure 13). The improvement in flow rate enabled a much easier cutting due to the reduced friction between the tool and workpiece by applying the ZnO nano-cutting lubricant. The nanoparticles present in the nano-cutting lubricant may act as a rolling agent, thus reducing the contact surface area between the tool and workpiece as a result friction; furthermore, cutting forces were abridged, thus enabling a much easier cutting with less power consumption. The cutting speed was the most dominant variable and was noticed as the graph line increased with a higher slope, resulting in faster changes in power consumption. Moreover, the interaction consequences of several terms, namely ap–s, s–q, and ap–q, on power consumption were found to be significant as their curves were randomly oriented, as displayed in Figure 13. Other terms such as ap–v, s–v, and v–q graphs were mostly parallel, which indicates the poor interactions for cutting power during the hard turning of AISI 52100 steel. Similar observations were traced in the literature [34]. Moreover, ANOVA was also developed (Table 4) to visualize the impact of input parameters on power consumption. From the ANOVA results, all the parameters were concluded to be significant with regard to power consumption, with cutting speed presenting the largest contribution (75.94%), succeeded by flow rate (13.89%), feed rate (6.02%), and depth of cut (3.78%).

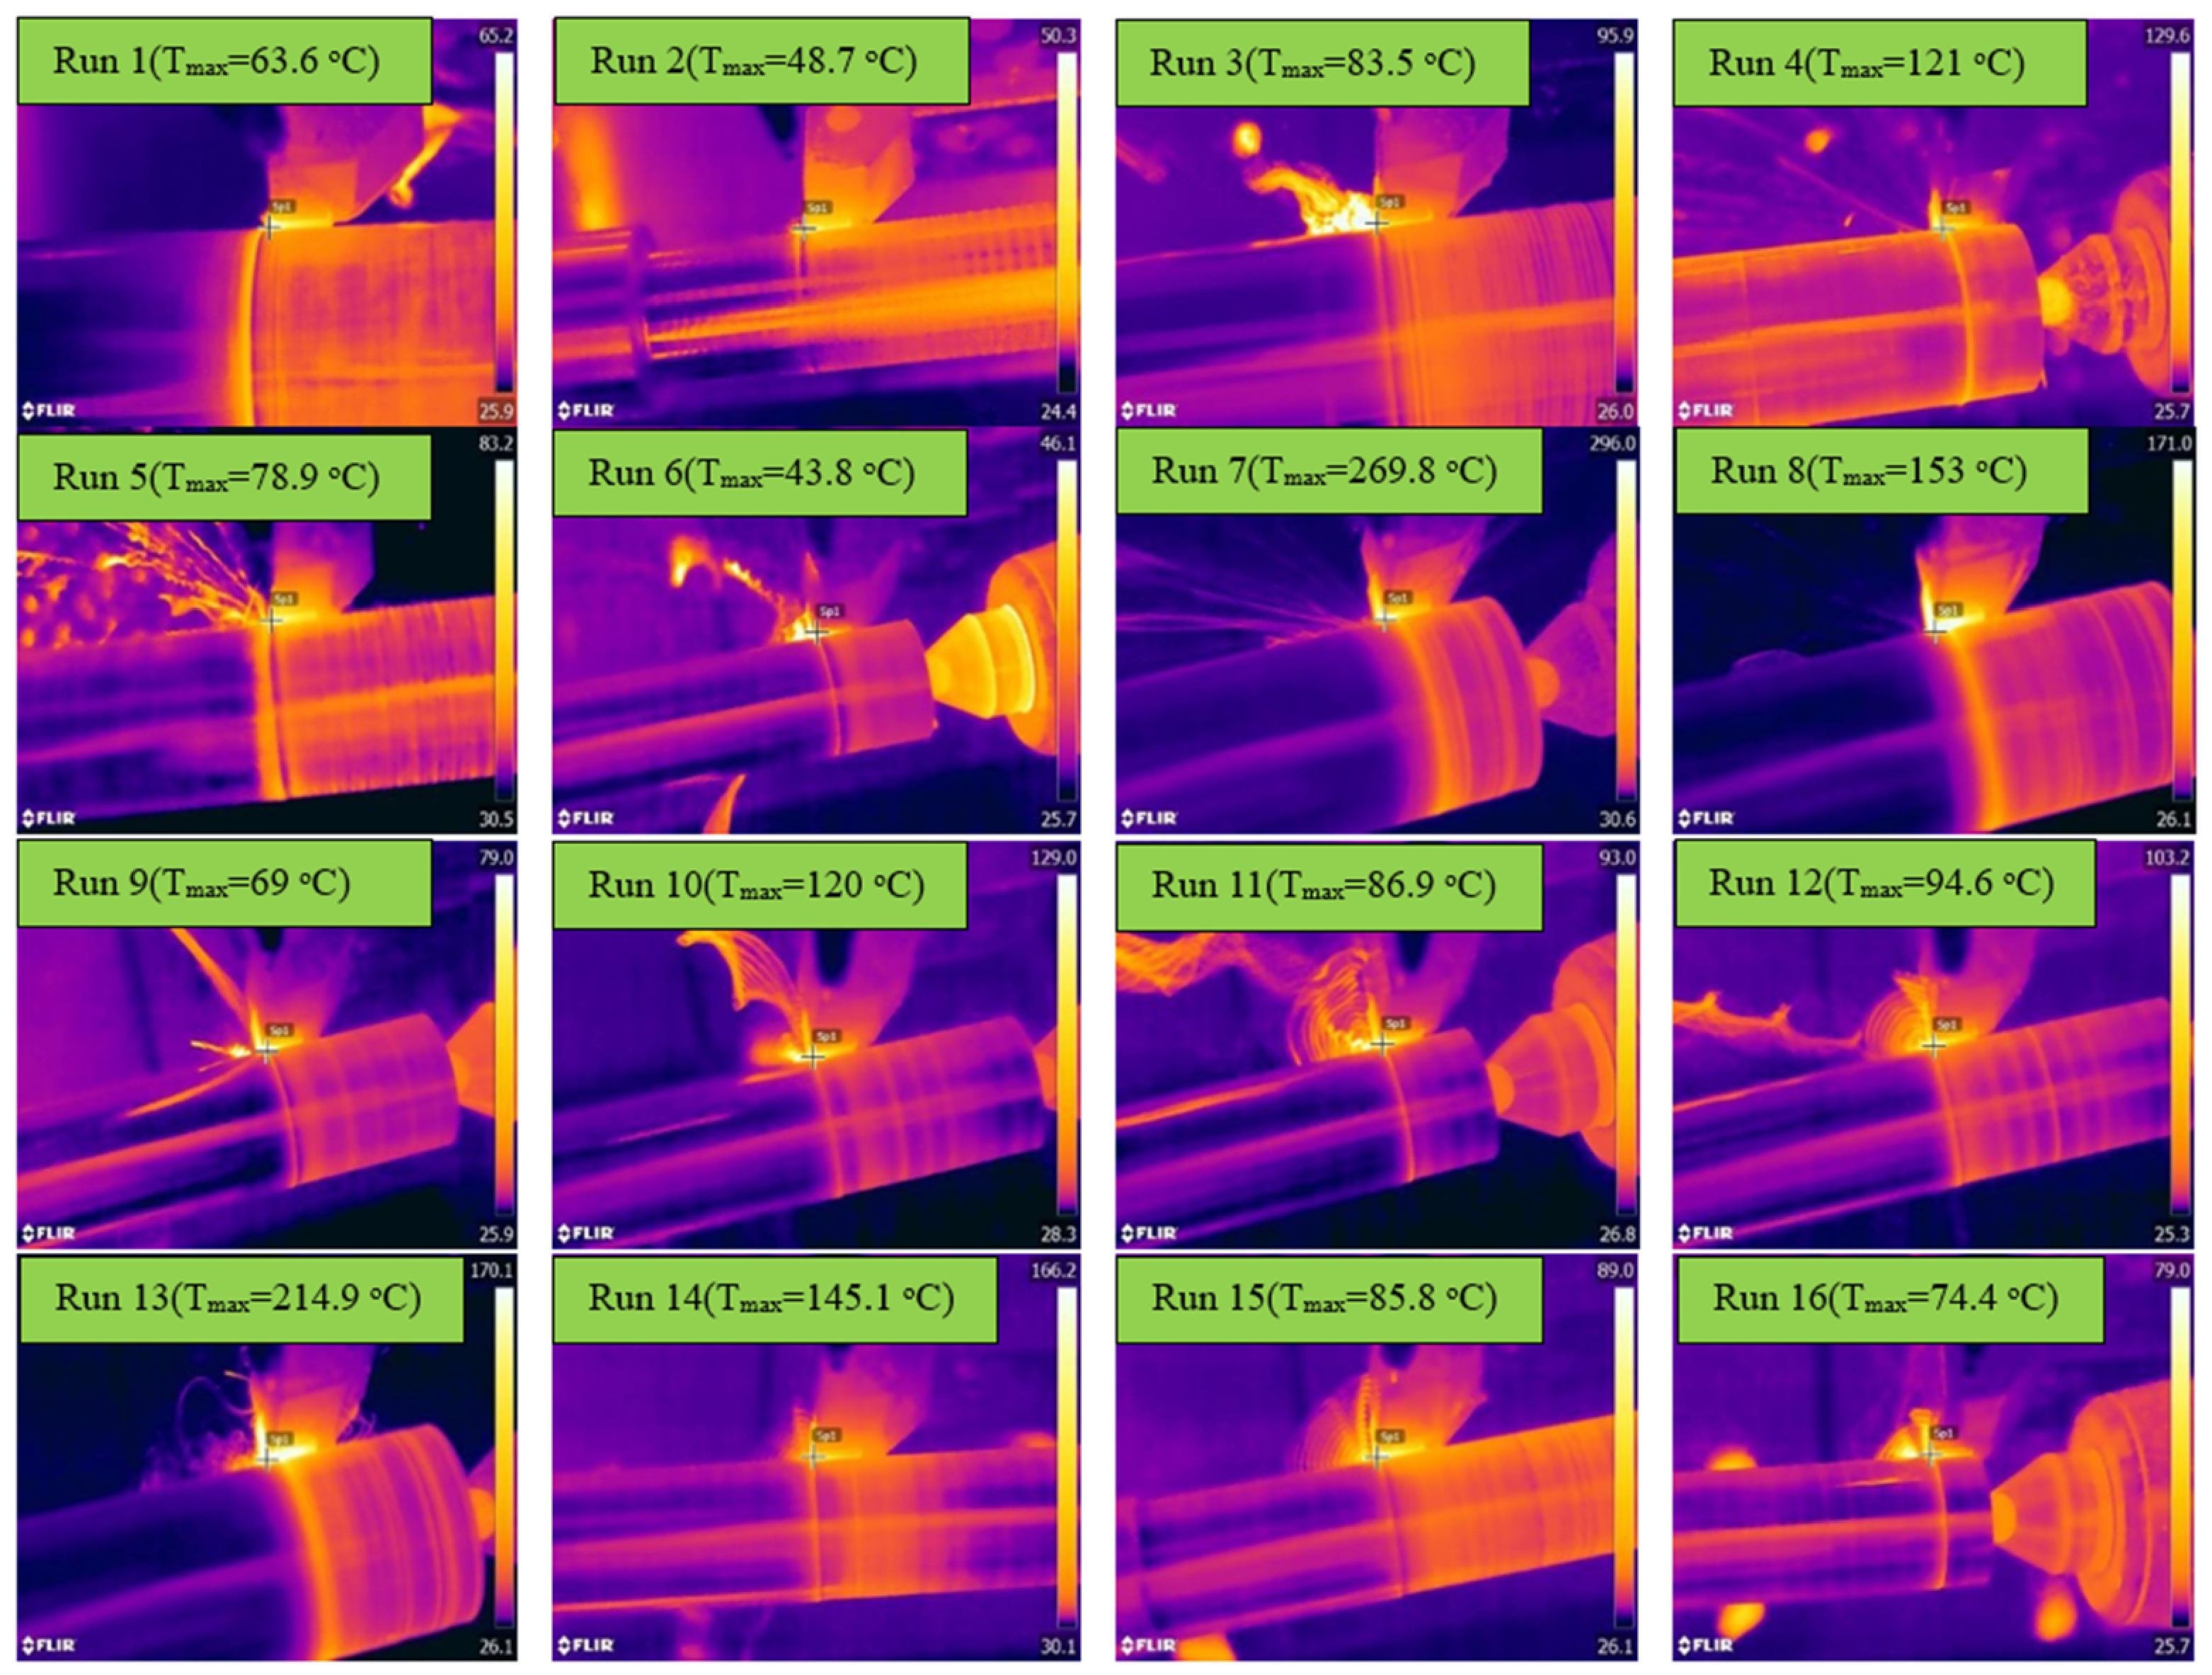
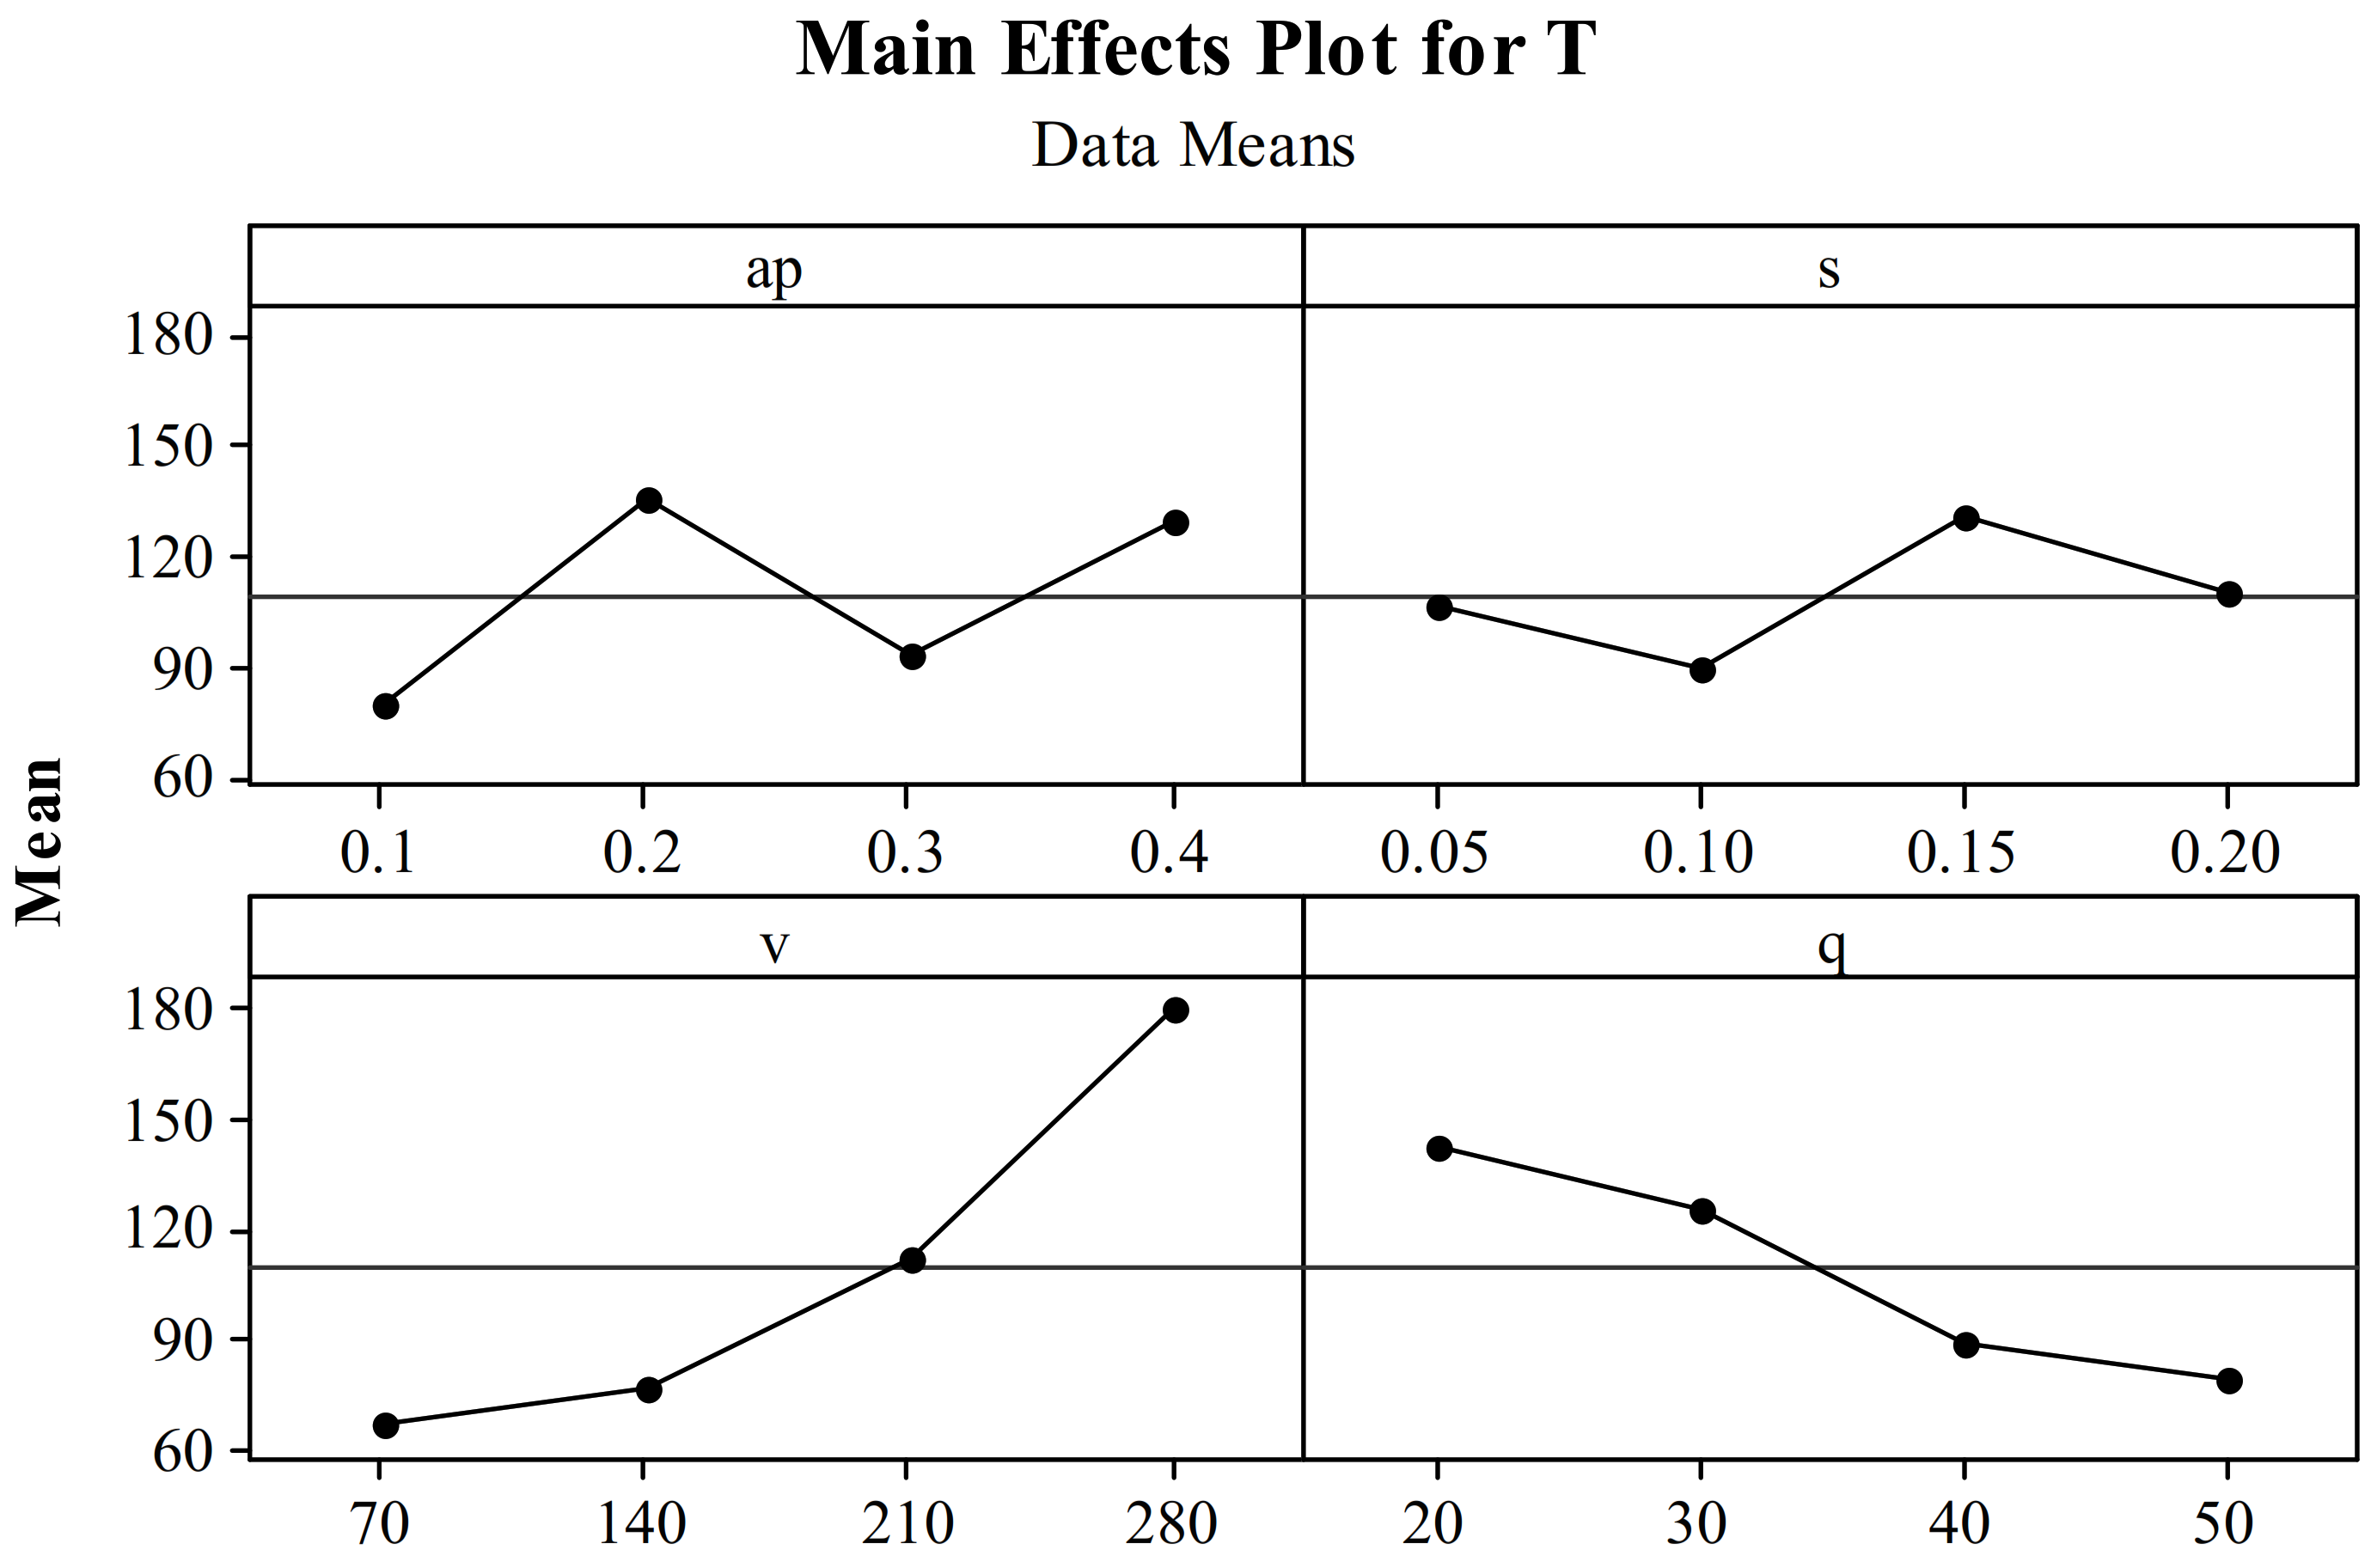
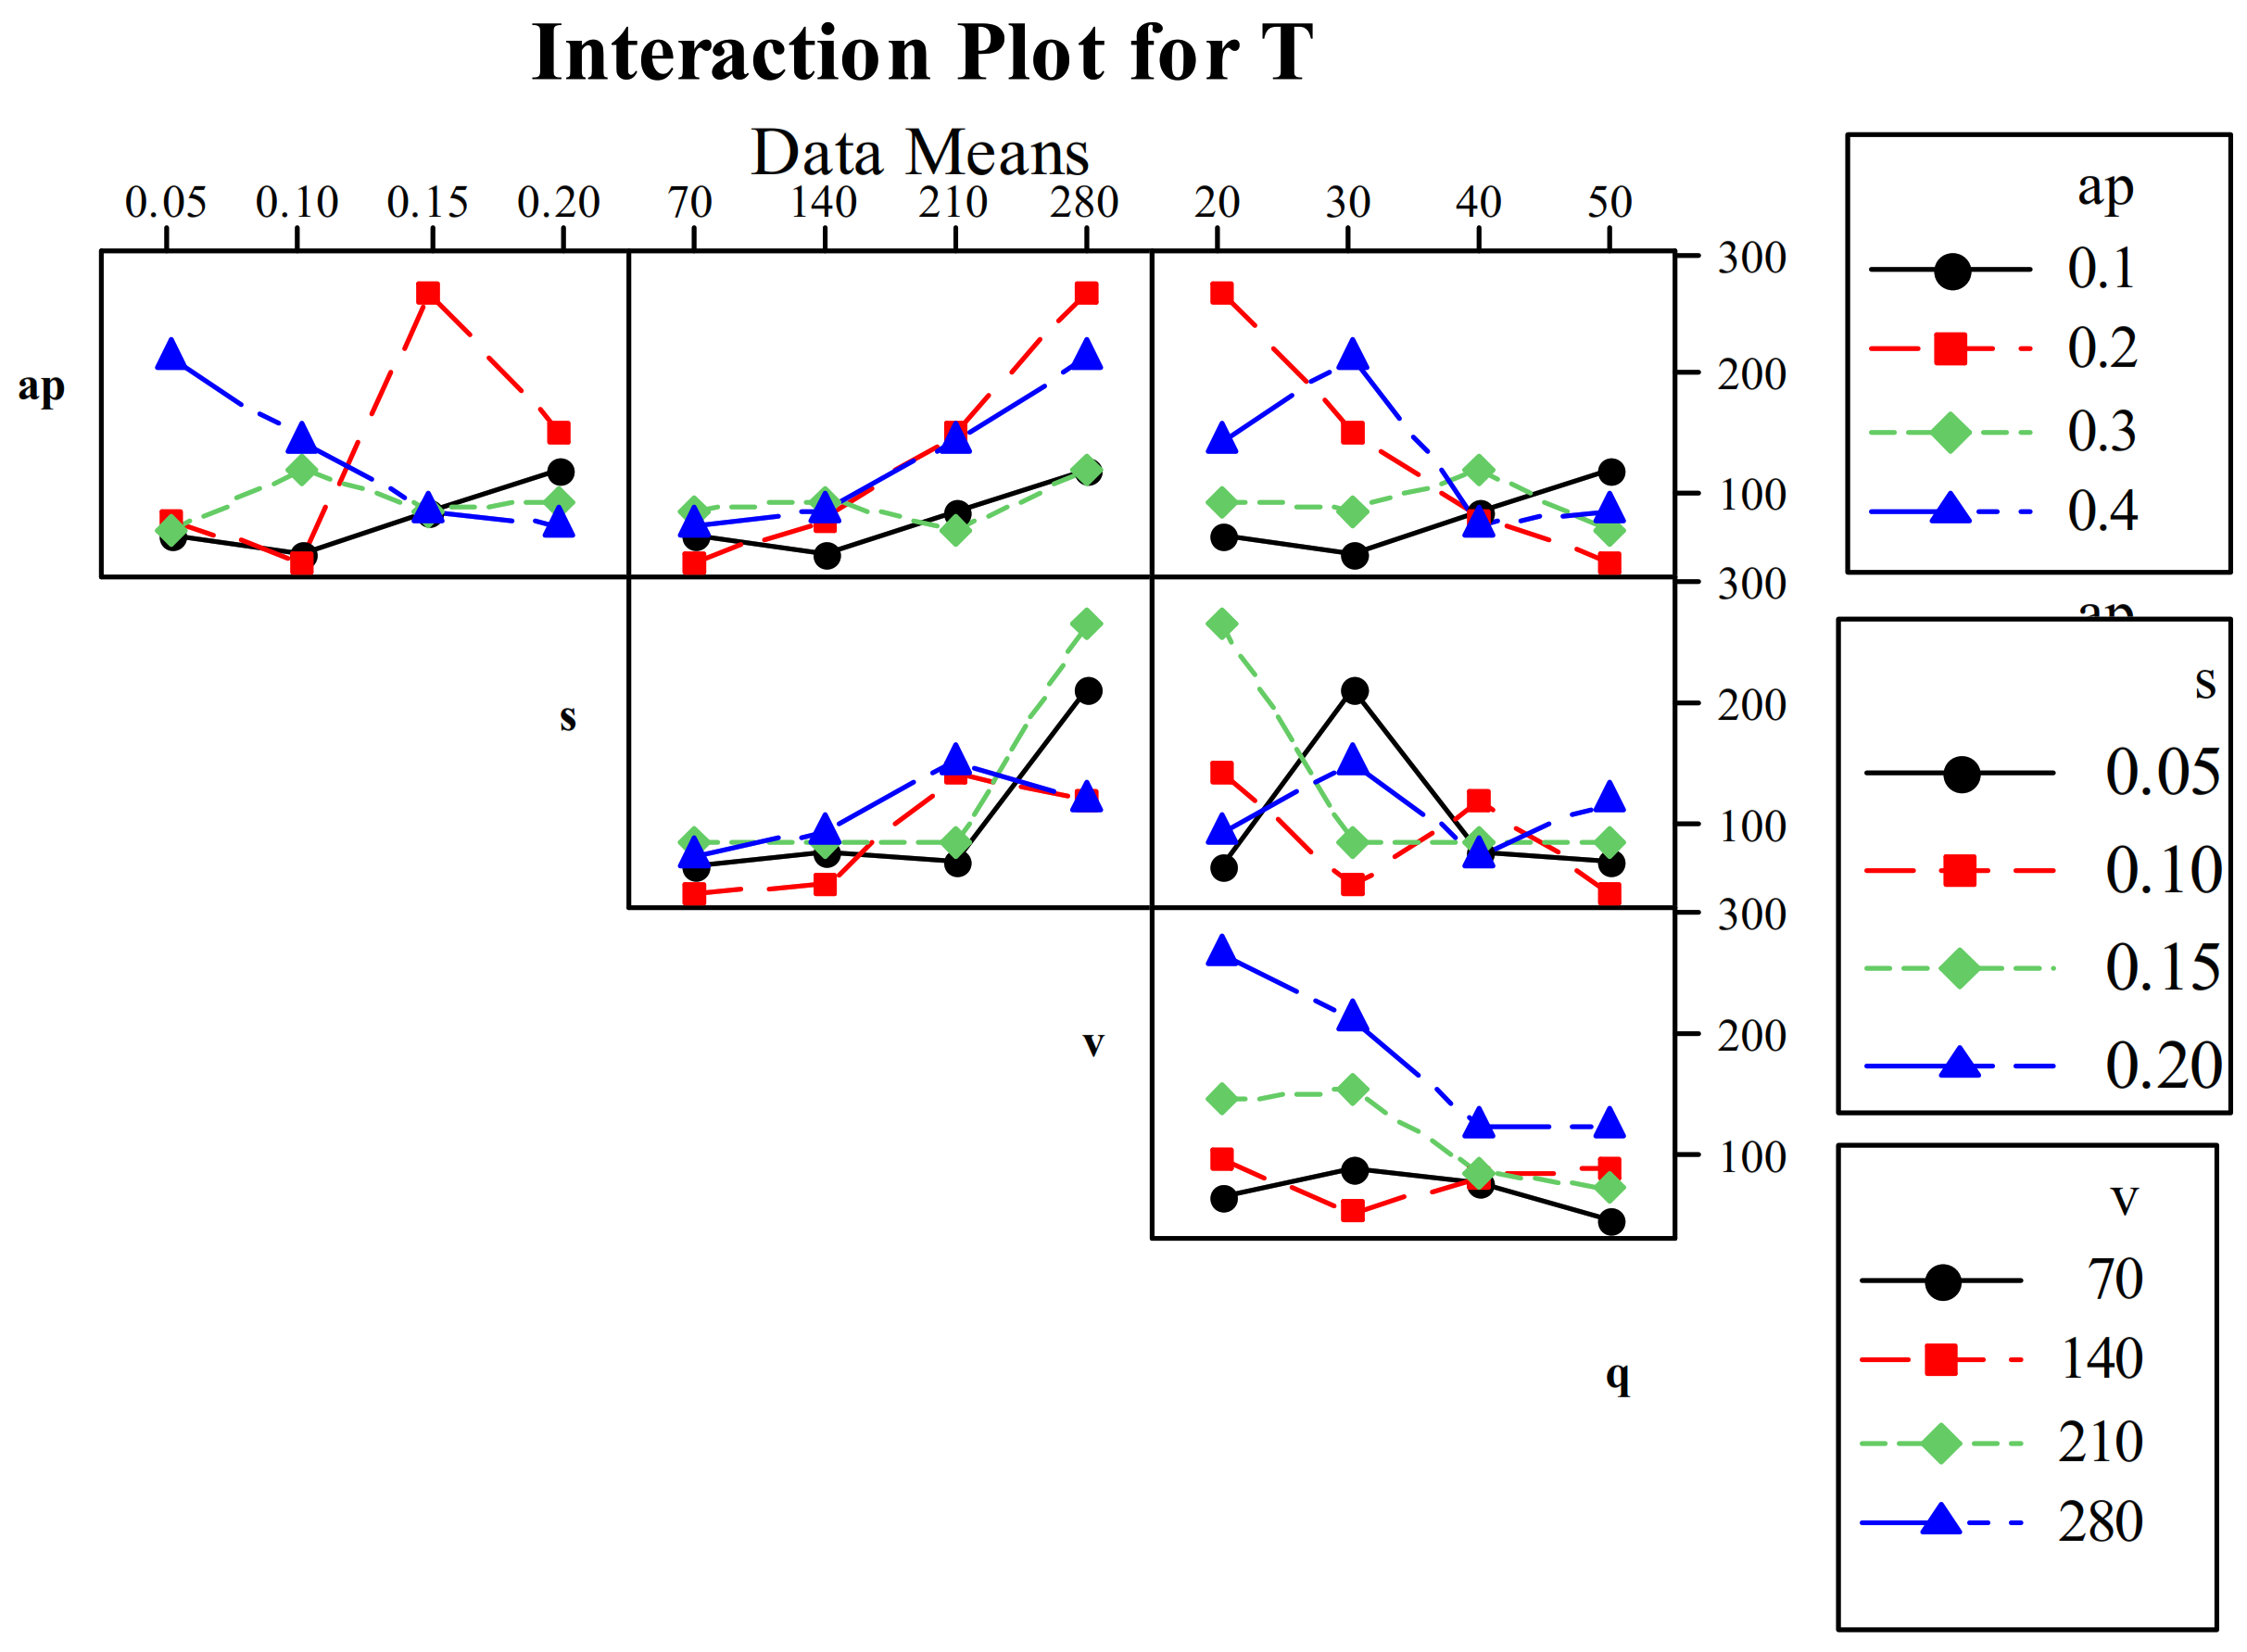
3.4. Assessment of Cutting Temperature

The cutting temperature in hard turning is a significant factor that influences both the machining performance and the longevity of the cutting tool. The regulation of cutting temperature is of utmost importance as an excessive amount of heat can result in an expedited deterioration of the cutting tool, thermal harm to the workpiece, and a decrease in dimensional precision. By effectively controlling the cutting temperature, the hard turning process can yield favorable results, including an enhanced surface finish, a prolonged tool lifespan, minimized tool deterioration, and an increased productivity. Several strategies are utilized in order to control the cutting temperature and optimize the hard turning process. These strategies encompass the selection of cutting parameters, tool geometry, cutting fluid application, and cooling techniques. The utilization of optimal cutting temperatures in hard turning operations serves to guarantee the achievement of appropriate chip formation, the minimization of tool wear, and the enhancement of surface integrity in the machined components. These outcomes subsequently contribute to improved productivity, reduced costs, and enhanced product quality. In this recent research, to reduce the unexpected temperature rise in the hard turning of an AISI 52100 steel rod, ZnO nano-cutting lubricant through a dual jet was used.
From the experimental results (Table 1), it can be observed that the cutting zone temperature varied from 43.8 °C to 269.8 °C throughout the experiment. The maximum temperature generated during the hard turning of AISI 52100 steel for each experiment is shown in Figure 14. The highest cutting temperature was generated at run no. 7 at a higher cutting speed level of 210 m/min, with the lowest MQL flow rate of 20 mL/hr, a higher feed (0.15 mm/rev), and a moderate depth of cut (0.2 mm). Cutting temperature was boosted accordingly with an increase in cutting speed, due to the rise in friction between the workpiece and cutting tool during the turning process. At higher cutting speed levels (210 and 280 m/min), the formation of the chip is faster; and thus, the chip was accumulated near the cutting zone and enabled a higher temperature range. At the lowest cutting speed of 70 m/min, the maximum temperature was recorded as 86.9 °C, which was very low for hard turning. Moreover, at highest cutting speed (280 m/min), the maximum temperature was recorded as 269.8 °C (Figure 14), which was more than 3 times higher than the maximum temperature obtained at 70 m/min. At the highest cutting speed (280 m/min) with an improving flow rate (20 to 50 mL/hr), the temperature reduced due to the increasing amount of nano-cutting lubricant supplied in hard turning. A higher amount of lubricant helped toward a rapid reduction in cutting zone temperature.
From the main effect plot (Figure 15), it can be observed that the cutting temperature was boosting with rising cutting speed. The variations in temperature by changing the feed and depth of cut were uneven and varied near about the mean-value straight line, thus signifying a lower impact of both terms toward the cutting temperature. Furthermore, MQL flow rate has a significant effect on mitigating cutting temperature gradually when the flow rate is enhanced to 50 mL/hr. On increasing flow rate, more amount of cutting fluid was deposited on the interface of the tool tip and workpiece contact zone, which diminished the adverse effect of friction effectively, resulting in low cutting temperature generation.
Figure 16 depicts the manifestation of the interaction effect between various cutting factors. The interaction effect between terms ap–s, ap–q, and s–q were pronounced due to the non-parallel nature of their graphs. As stated by Senthilkumar et al. [35], the presence of non-parallel graphs indicates the presence of interaction among the control factors, whereas parallel lines do not exhibit such interaction; for example, while other pairs of terms such as v–q showed less interaction for the cutting temperature, ap–v and s–v exhibited negligible or insignificant interactions for the cutting temperature due to their parallel graphs. From the ANOVA (Table 5), it can be noticed that speed is the most influential factor, which affects the cutting temperature mostly with a contribution rate of 57.25%. After speed, the flow rate of MQL affects cutting zone temperature effectively with a contribution of 19.22%, followed by a depth of cut and feed with 16.73% and 6.40% contributions, respectively.

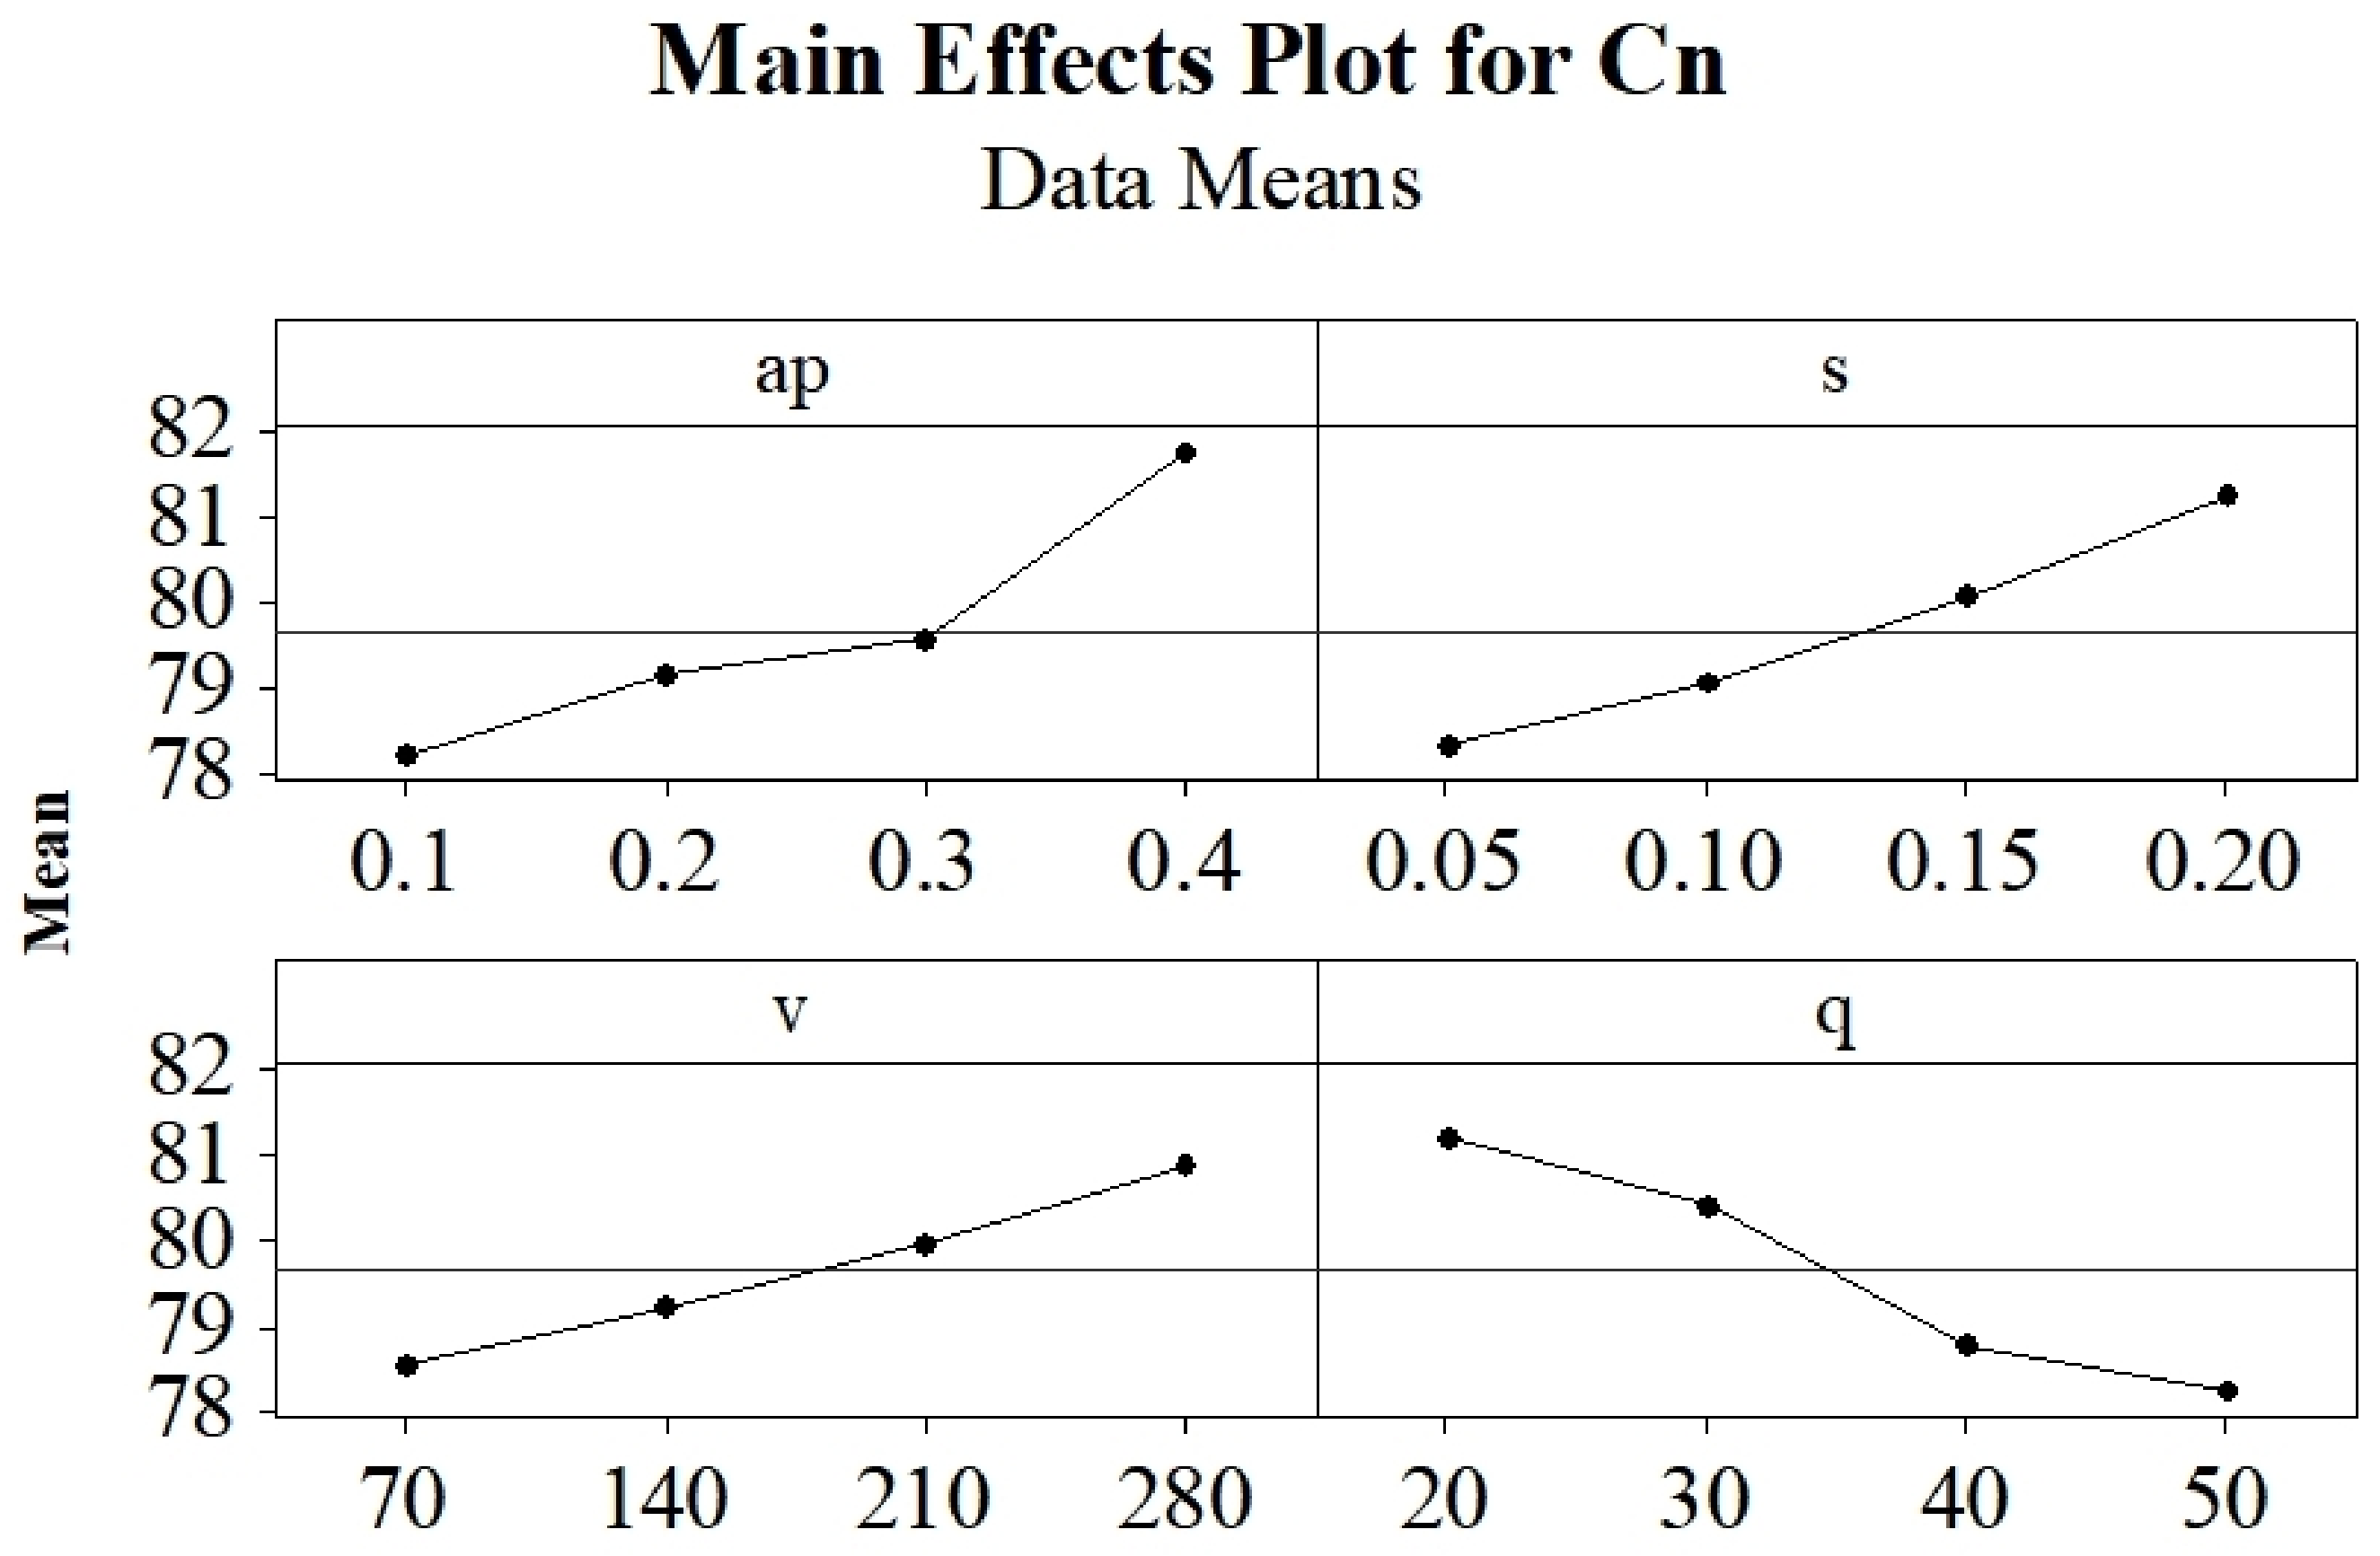
3.5. Assessment of Cutting Noise

In the recent progress of manufacturing research, environmental sustainability is highly essential toward the welfare of society and machinist. Cutting sound generation is one of the important indexes for attaining environment sustainability. The cutting sound directly affects the machinist’s hearing capability as well as their efficiency. Louder sound during machining greatly affects the machinist’s health and working capability. Therefore, controlling the intensity of sound in the course of cutting is greatly needed to control its adverse effects on the machinist. It has been observed that an increase in cutting force often leads to a corresponding increase in the noise level produced during the cutting process. The aforementioned factor, nevertheless, influences the energy consumption associated with the cutting operation. In the literature [32], it has been observed that during the cutting action, the presence of fixtures and mechanical parts can lead to the generation of noise. This noise is primarily caused by the mechanical disturbance of these components. Moreover, it was noticed that an increase in cutting force often leads to a corresponding increase in the sound level produced during the cutting process.
The control of the cutting noise is imperative to prevent potential harm to the auditory system of workers who are present during the machining process. Considering this aspect, the current research measured the cutting sound in every 10 s of one pass of machining and their average values were analyzed for each test. The highest and least cutting noise was obtained as 77.03 and 83.11 dB, respectively. According to the scientific report, the cutting noise should be smaller than 85 dB to prevent human hearing loss [36,37]. Therefore, as the maximum evolved sound (83.11 dB) was lowered to the safe limit of 85 dB, the current study can hence be suitable to achieve sustainable machining.
Moreover, to control the noise emission, it is required to analyze the impact of the process variables on cutting noise. Therefore, main effects plot, interaction plots, and ANOVA were developed to analyze the impact of process variables on cutting noise. The cutting noise increased with increasing speed due to the vibration and speed associated in hard turned processes. When the cutting speed, feed rate, and depth of cut increase, the noise intensity increases, as displayed in the main effects plot (Figure 17). The depth of cut was aggressively affecting the cutting noise in comparison to other variables. Moreover, the cutting noise was slowing down when the coolant flow rate was improving. It might have possibly been due to a considerable reduction in friction by applying a higher volume of nano-lubricant in the shearing zone. Figure 18 shows the interaction plots’ effects of different couples of input process parameters on cutting noise. According to the interaction graphs, a logical interaction between ap–s, s–q, and v–q was developed, representing a good amount of interaction among all factors. However, other interaction terms such as ap–v and ap–q graphs are mostly parallel, indicating the reduced interactions for cutting noise during nano-based MQL hard turning of bearing steel. Table 6 presents ANOVA analysis results for cutting noise. The cutting parameters with a p-value less than 0.05 are statistically significant [38]. However, all the input parameters are said to be significant and have relevant effects on cutting noise. Among all input parameters, the depth of cut was attributed to the highest impact (33%), succeeded by flow rate (28.16%), feed (23.89%), and cutting speed (14.73%).

4. WASPAS Multi-Objective Assessment

WASPAS is a technique for optimizing responses to multiple-criteria queries. The total score for each potential solution is determined by assigning a weight to each criterion and then aggregating their individual scores. When some criteria are more important than others, or when the criteria have different units, WASPAS is useful [39]. Using this method, decision-makers can provide greater consideration to more significant factors without ignoring others. The WASPAS method algorithm comprises a series of consecutive stages [40].
Step 1: Normalizing the decision matrix.
Normalization is performed so that every response, including their dimensional units, is devoid of any abnormalities that may have occurred during measurement. For this, the responses are to be normalized using the highest-value criterion, i.e., Equation (1), or the lowest-value criterion, i.e., Equation (2).
Highest-value criterion:
x i j = x i j ( M a x i ) ( x i j )
Lowest-value criterion:
x i j = ( M i n i ) ( x i j ) x i j
Step 2: Calculating the total relative importance matrices based on the WSM method.
For the WSM method, the total relative importance for each cycle can be calculated using Equation (3):
Q i ( 1 ) = j = 1 n ( x i j ) ( W j )
Step 3: Calculating the total relative importance matrices based on the WPM method.
For the WPM method, the total relative importance for each cycle can be calculated using Equation (4):
Q i ( 2 ) = j = 1 n ( x i j ) W j
Step 4: Calculating Cumulative Relative Relevance Index (5).
A Cumulative Relative Relevance Index is calculated from each individual measurement. We compute this using Equation (5) and then arrange the results in a sequential fashion. The optimal response corresponds to the highest possible value of ( Q i ( 2 ) ):
Q i = λ Q i ( 1 ) + ( 1 λ ) Q i ( 2 )
In order to proceed from Equation (3), we need the values of weights. In this paper, weights are calculated using the entropy method.

4.1. Weight Calculation Using Entropy Method

When confronted with multi-criteria decision-making, or MCDM, the entropy approach can be used to determine the relative weight of each criterion. It is a mathematical technique that uses the concept of entropy from the theory of information to objectively and effectively designate weights to various criteria. In MCDM situations, decision-makers must consider a number of factors prior to making a final choice. By determining the relative significance of various criteria, the entropy technique facilitates the process of designating weights to various criteria. The technique attempts to reduce the uncertainty associated with each criterion by balancing the weights [41].
The entropy method is superior to other approaches because it is objective, straightforward, and time efficient. This method can process both quantitative and qualitative data, and it does not require any prior assumptions or restrictions regarding the criteria’s relationship [42].
Step 1: It is necessary to normalize arrays of decision matrix (performance indices) in order to acquire the project’s final outcome via Equation (6):
p i j = x i j i = 1 m x i j
Here, p i j is the value from the matrix whose desired weights are calculated.
Step 2: The formula for determining entropy as a measure of the result of the project is calculated using Equations (7) and (8):
E i j = k i = 1 m p i j . ln p i j
In   which ,   k = 1 ln ( m )
Step 3: Determining the objective weight using the concept of entropy via Equation (9).
W j = ( 1 E i j ) i = 1 n ( 1 E i j )

4.2. Implementation of WASPAS Optimization

To ensure convenience, the weight for the decision matrix is initially determined using the entropy method, a widely used technique in research and decision-making processes. The initial step in the research process involved the calculation of the Normalized Decision Matrix using Equations (1) and (2). In this current work, low value criteria have been followed for all the responses and evaluated by Equation (2). The estimated normalized results are shown in Table S1 (Supplementary File). P i j is calculated using Equation (6). To determine the entropy of the normalized matrix, it is necessary to analyze the distribution of values within the matrix. The entropy of a matrix can be calculated using information theory principles, which quantify the uncertainty or randomness present in the data. For determining the entropy of the normalized matrix, the first calculation of E i j has been performed, where E i j = P i j ln P i j . The results of P i j and E i j are displayed in Table S2 (Supplementary File). Moreover, the results of entropy of the normalized matrix E i j and entropy weight W j are shown in Table S3 (Supplementary File). The determination of weight is achieved through the utilization of the principle of entropy, as described using Equation (9). The weights for all parameters have been determined, and now these weights ( W j ) will be employed to ascertain the rank and identify the optimal input parameter using the Weighted Aggregated Sum Product Assessment (WASPAS) method. In this study, the total relative importance matrices are calculated using the Weighted Sum Model (WSM) method, as described by Equation (3), and values are displayed in Table S4 (Supplementary File). The total relative importance matrices are computed using the Weighted Product Model (WPM) method, as described using Equation (4) and displayed in Table S5 (Supplementary File). For the λ value, when we assign λ = 0 in Equation (5), Q i = Q i ( 2 ) , exhibiting a resemblance to the concept of WPM. Similarly, when we assign λ = 1 in Equation (5), Q i = Q i ( 1 ) , which resembles to the concept of WSM (Weighted Sum Model).
The WASPAS method is a widely used approach in decision-making research. It encompasses several key steps, including the normalization of the decision matrix, the assessment of entropy for the normalized matrix, the determination of relative importance for each criterion, and the utilization of entropy to derive weights for the criteria. These steps collectively contribute to the overall effectiveness and reliability of the WASPAS method in decision-making processes. The weights are subsequently utilized in the WSM and WPM methodologies to derive total relative importance matrices. The Cumulative Relative Relevance Index is computed ( Q i = 0.5) using Equation (5) and is shown in Table 7. From Table 7, it is observed that run 9 has the possible optimal input parameters (ap= 0.3 mm; s = 0.05 mm/rev; v = 210 m/min and q = 50 mL/hr) for achieving optimal results. In the seventh run of the experiment, it was observed that the cutting temperature reached its highest point. This increase in temperature was attributed to the combination of the highest speed and lowest flow rate. Consequently, the elevated cutting temperature had a detrimental effect on both the tool and the workpiece surfaces, resulting in rougher surfaces. The highest value of noise was observed in this particular run due to the high friction between the tool tip and workpiece. This increased the cutting force, resulting in higher power consumption during the machining operation. From the ranking of Cumulative Relative Relevance Index, run 7 has the lowest rank, which indicates the worst input parameter during the experiment and can be recommended to avoid this parameter during the hard turning of AISI 52100 steel.

5. Conclusions

The current investigation presents the synthesis and application of LRT-30 oil-based ZnO nano-cutting lubricant application in the hard turning of AISI 52100 bearing steel using dual-nozzle-injecting MQL system. The responses like tool wear, surface roughness, power consumption, cutting temperature, and cutting noise are measured and analyzed with respect to cutting inputs’ variables. The following key findings are observed:
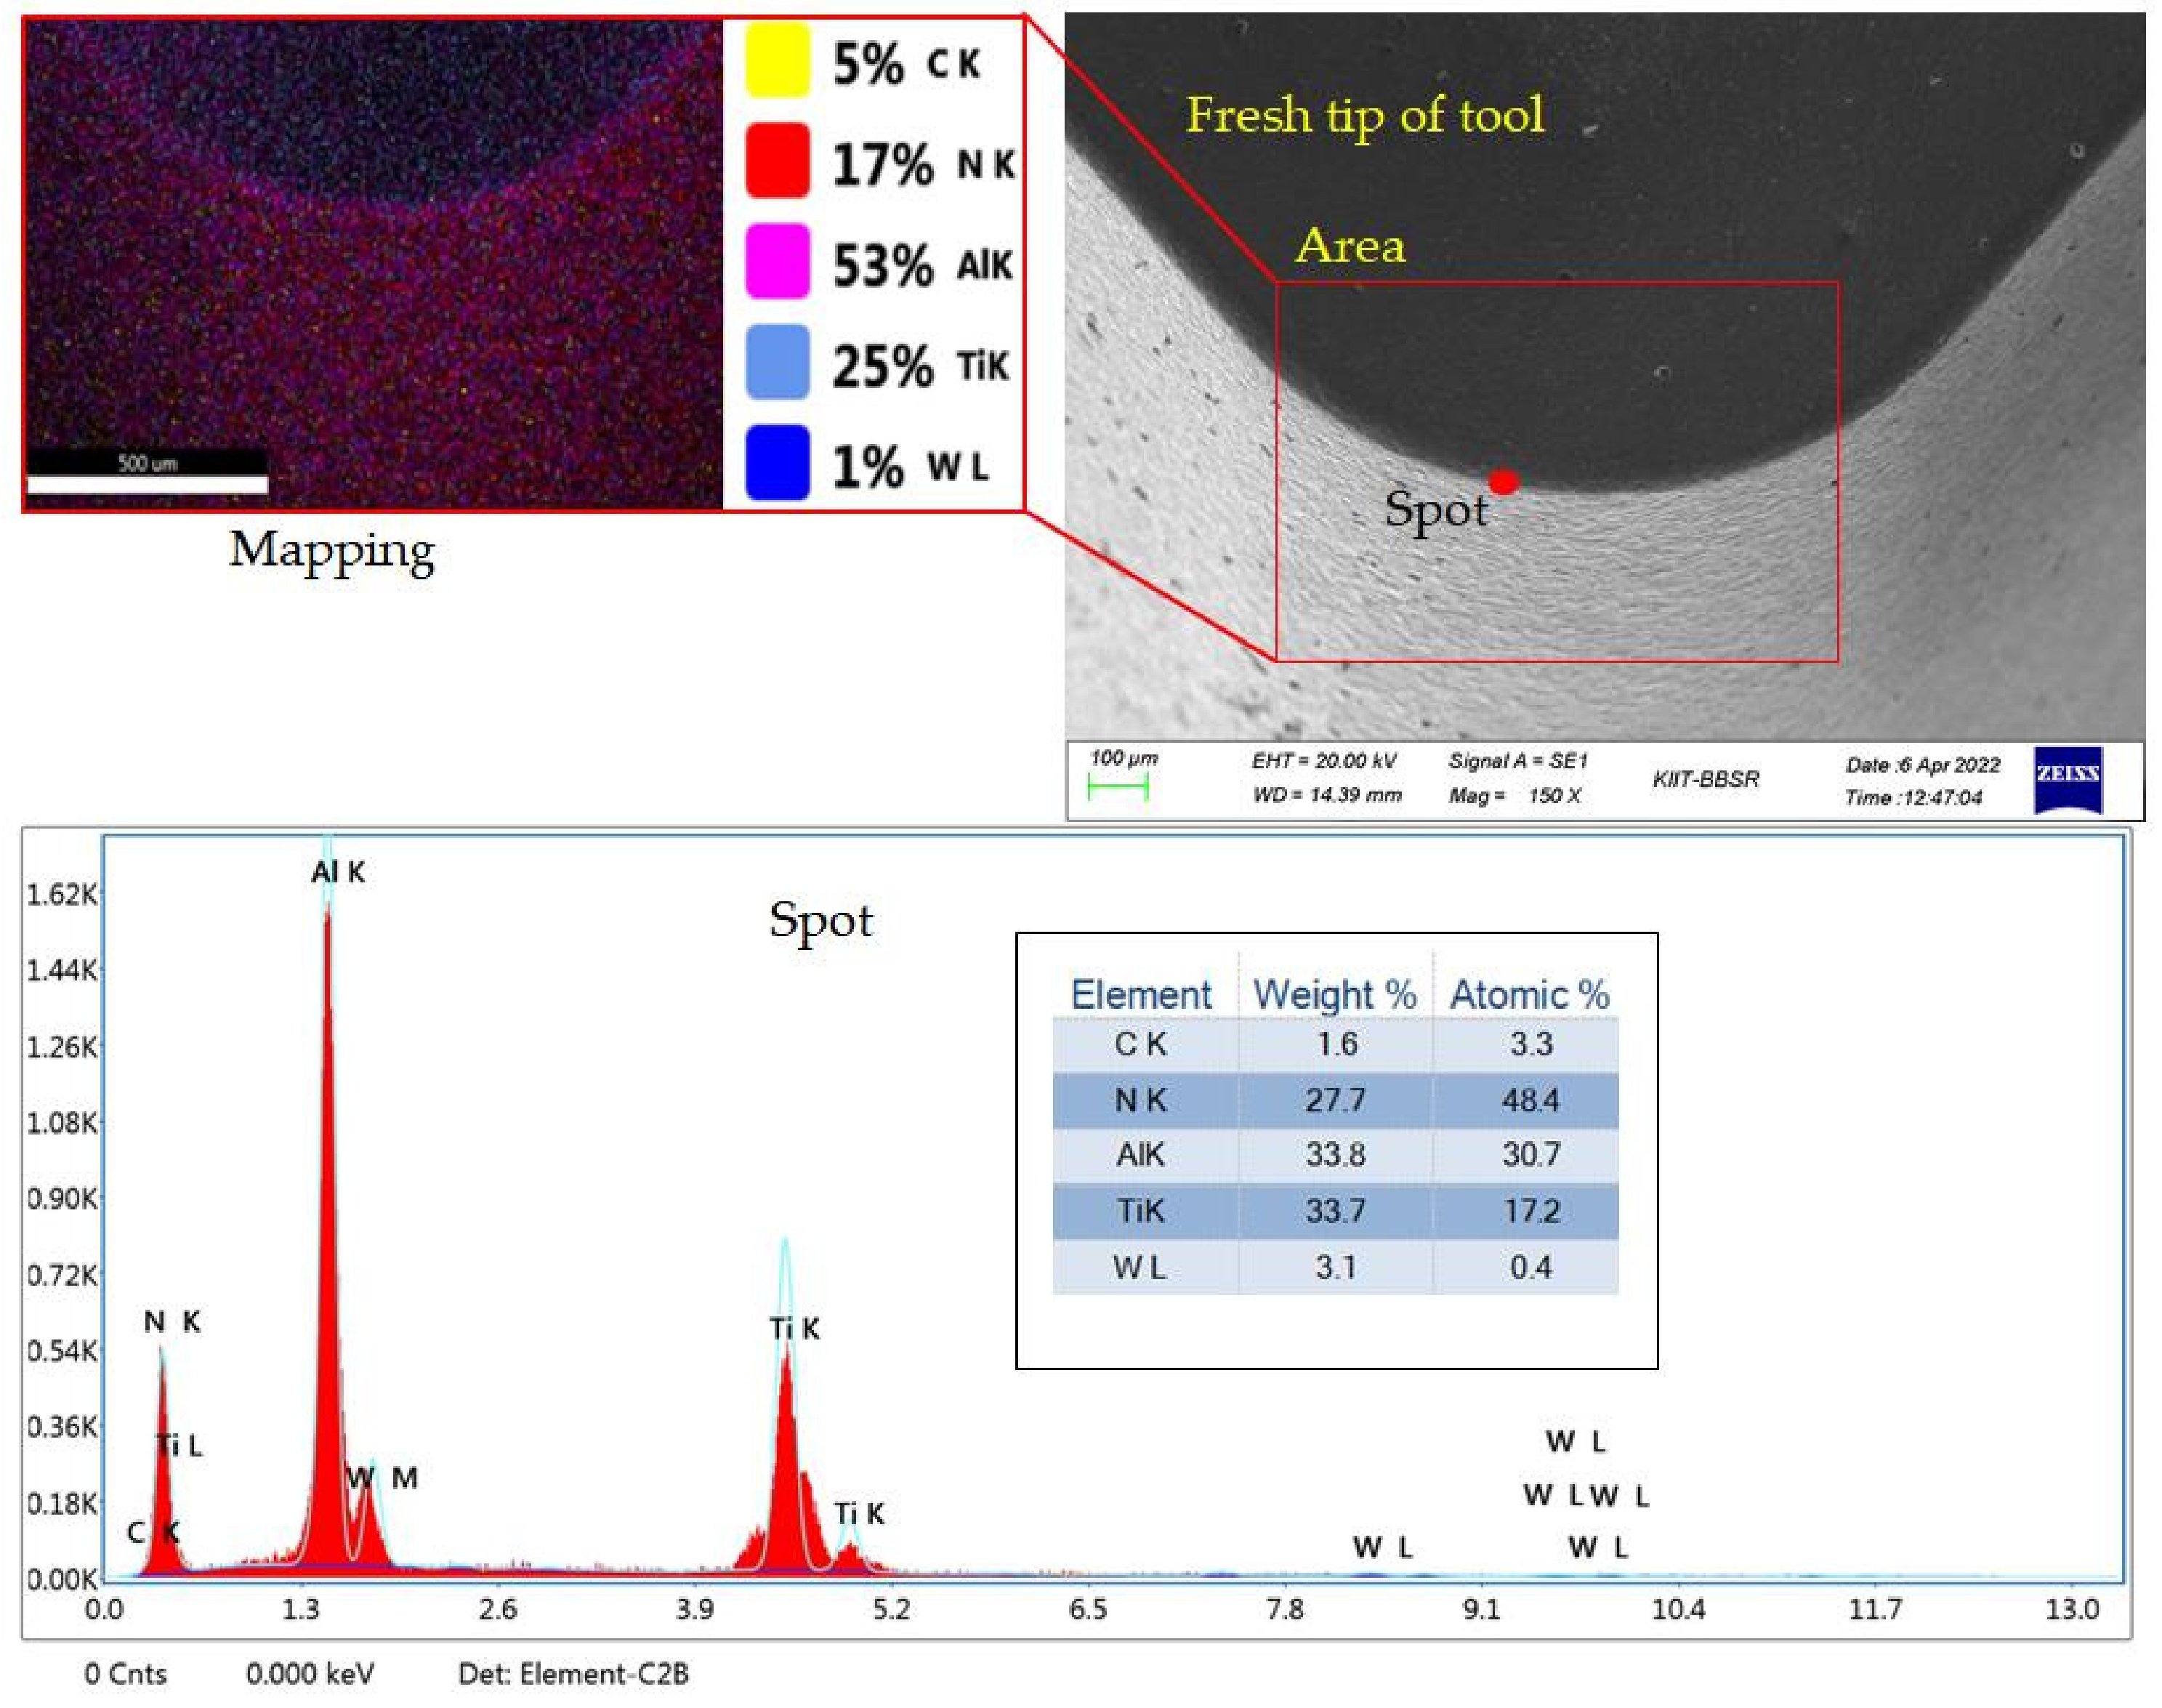
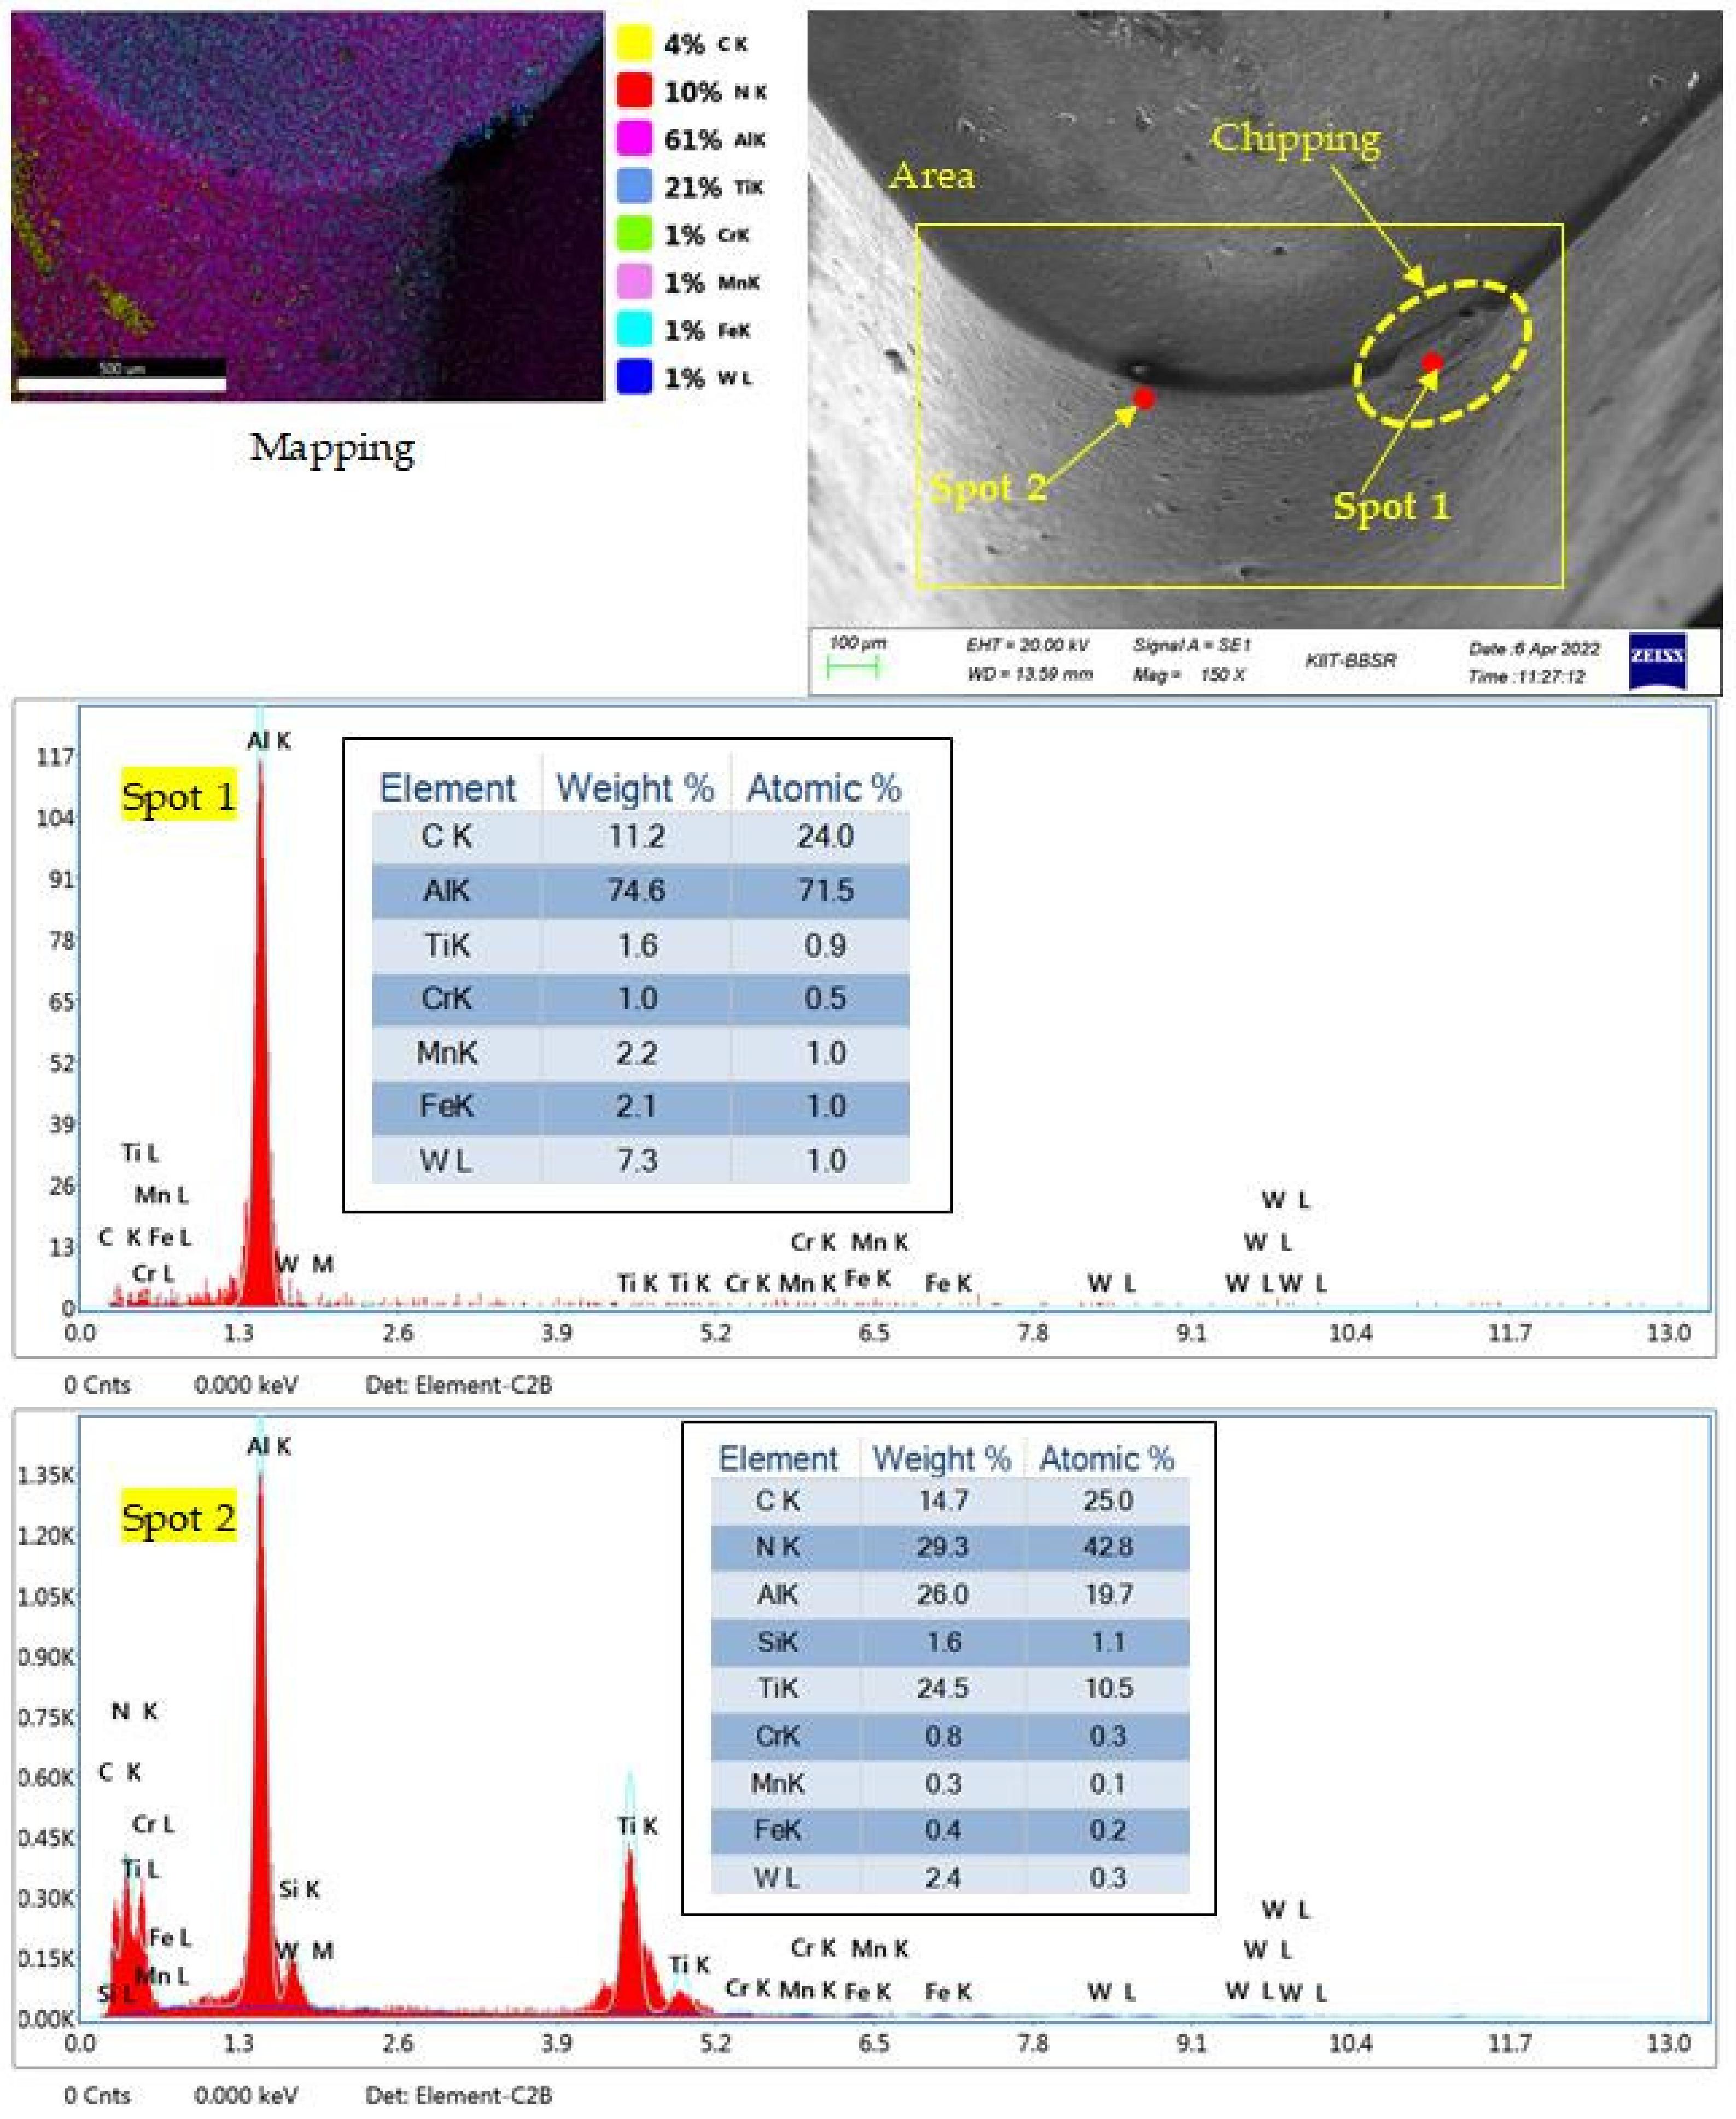
The tool-wear was greatly controlled using ZnO nano-cutting lubricant due to the better lubricating characteristics of the synthesized fluid. The effects of cutting speed were traced to be the largest (76.68%), followed by flow rate (11.94%), depth of cut (6.27%), and feed (4.94%). The mechanisms like abrasion, chipping, and diffusion were found to be dominant.
The surface roughness (Ra) was extensively influenced by feed (74.26%) and depth of cut (15.88%). The impact of flow rate over Ra was traced to be insignificant.
The power consumption observed throughout the machining process showed an increase in conjunction with elevated cutting speeds and flow rates. Significant impacts of the feed-depth of cut, feed-flow rate, and depth of cut-flow rate interactions were also found for power consumption.
The cutting temperature was greatly reduced with use of dual-nozzle nano-cutting lubricant. All the input variables had a significant impact on cutting temperature. The cutting speed was the largest consequence (57.25%) on cutting temperature, followed by flow rate (19.22%), depth of cut (16.73%), and feed (6.4%).
The cutting noise in the entire experiment was found to be in the range of 76.08 to 83.31 dB, which is relatively lower than the human hearing capability (85 dB). The effects of the depth of cut were determined to be the largest (33%) while other inputs were also significant.
In summary, ZnO-based nano-cutting fluid has great ability to retard growth in wear, surface roughness, and power consumption. In future research, different nozzle positions and nano-fluid concentrations can be used for machining this bearing steel. Also, uni-variate experiments can be conducted to study the effects of single factors on cutting performance.

Supplementary Materials

The following supporting information can be downloaded at: https://www.mdpi.com/article/10.3390/app131810062/s1. Table S1. Normalization. Table S2. Calculation for determining Pij and Eij. Table S3. Calculated values of normalized entropy E i j and weight ( W j ). Table S4. Total Relative Importance values based on WSM. Table S5. Total Relative Importance values based on WPM.

Author Contributions

Abstract, S.K. and R.K.; Introduction, A.P. and R.K.; Methodology implementation, S.K., A.K.S., R.K. and A.P.; Experimentation, S.K. and R.K.; Results and Discussion, S.K., A.P. and R.K.; Writing—review and editing, A.K.S. and R.K.; Supervision, R.K. and A.K.S.; Optimization, S.K., A.P. and R.K. All authors have read and agreed to the published version of the manuscript.

Funding

This study received no financial support. The APC was paid using the reviewer vouchers that the authors had on hand.

Institutional Review Board Statement

Not applicable.

Informed Consent Statement

Not applicable.

Data Availability Statement

Not applicable.

Acknowledgments

The authors acknowledge KIIT (deemed to be university) for providing all required research facilities.

Conflicts of Interest

The authors declare no conflict of interest.

References

  1. Davim, J.P. Machining of Hard Materials; Springer: New York, NY, USA, 2011. [Google Scholar]
  2. Chinchanikar, S.; Choudhury, S.K. Machining of hardened steel—Experimental investigations, performance modelling and cooling techniques: A review. Int. J. Mach. Tools Manuf. 2015, 89, 95–109. [Google Scholar] [CrossRef]
  3. Choudhury, S.K.; Chinchanikar, S. 1.3 Finish Machining of Hardened Steel. Compr. Mater. Finish. 2017, 1, 47–92. [Google Scholar]
  4. Karim, M.R.; Tariq, J.B.; Morshed, S.M.; Shawon, S.H.; Hasan, A.; Prakash, C.; Pruncu, C.I. Environmental, economical and technological analysis of MQL-assisted machining of Al-Mg-Zr alloy using PCD tool. Sustainability 2021, 13, 7321. [Google Scholar] [CrossRef]
  5. Kursus, M.; Liew, P.J.; Che Sidik, N.A.; Wang, J. Recent progress on the application of nanofluids and hybrid nanofluids in machining: A comprehensive review. Int. J. Adv. Manuf. Technol. 2022, 121, 1455–1481. [Google Scholar] [CrossRef]
  6. Sarikaya, M.; Gupta, M.K.; Tomaz, I.; Danish, M.; Mia, M.; Rubaiee, S.; Jamil, M.; Pimenov, D.Y.; Khanna, N. Cooling techniques to improve the machinability and sustainability of light-weight alloys: A state-of-the-art review. J. Manuf. Process. 2021, 62, 179–201. [Google Scholar] [CrossRef]
  7. Duc, T.M.; Tuan, N.M.; Long, T.T.; Ngoc, T.B. Machining feasibility and Sustainability study associated with air pressure, air flow rate, and nanoparticle concentration in Nanofluid minimum quantity lubrication-assisted hard milling process of 60Si2Mn steel. Proc. Inst. Mech. Eng. Part C J. Mechan. Eng. Sci. 2022, 23, 11256–11269. [Google Scholar] [CrossRef]
  8. Usha, M.; Rao, G.S. Machining Aspects of Al2O3 Nano Cutting Fluids–A Comparative Study. Tribol. Ind. 2022, 44, 1. [Google Scholar] [CrossRef]
  9. Khatai, S.; Sahoo, A.K.; Kumar, R.; Panda, A. Recent research progress on various cooling and lubrication techniques used in sustainable hard machining: A comprehensive review. Proc. Inst. Mech. Eng. Part E J. Process Mech. Eng. 2023, 09544089231169655. [Google Scholar] [CrossRef]
  10. Junankar, A.A.; Parate, S.R.; Dethe, P.K.; Dhote, N.R.; Gadkar, D.G.; Gadkar, D.D.; Gajbhiye, S.A. Optimization of bearing steel turning parameters under CuO and ZnO nanofluid-MQL using MCDM hybrid approach. Mater. Today Proc. 2021, 47, 4292–4297. [Google Scholar] [CrossRef]
  11. Khan, A.M.; Gupta, M.K.; Hegab, H.; Jamil, M.; Mia, M.; He, N.; Pruncu, C.I. Energy-based cost integrated modelling and sustainability assessment of Al-GnP hybrid nanofluid assisted turning of AISI52100 steel. J. Clean. Prod. 2020, 257, 120502. [Google Scholar] [CrossRef]
  12. Khandekar, S.; Sankar, M.R.; Agnihotri, V.; Ramkumar, J. Nano-cutting fluid for enhancement of metal cutting performance. Mater. Manuf. Process 2012, 27, 963–967. [Google Scholar] [CrossRef]
  13. Sertsöz, Ş. Nano mos2 application in turning process with minimum quantity lubrication technique (Mql). Teh. Vjesn. 2021, 28, 70–76. [Google Scholar]
  14. Ngoc, T.B.; Duc, T.M.; Tuan, N.M.; Hoang, V.L.; Long, T.T. Machinability Assessment of Hybrid Nano Cutting Oil for Minimum Quantity Lubrication (MQL) in Hard Turning of 90CrSi Steel. Lubricants 2023, 11, 54. [Google Scholar] [CrossRef]
  15. Usluer, E.; Emiroğlu, U.; Yapan, Y.F.; Kshitij, G.; Khanna, N.; Sarıkaya, M.; Uysal, A. Investigation on the effect of hybrid nanofluid in MQL condition in orthogonal turning and a sustainability assessment. Sustain. Mater. Technol. 2023, 36, e00618. [Google Scholar] [CrossRef]
  16. Tuan, N.M.; Duc, T.M.; Long, T.T.; Hoang, V.L.; Ngoc, T.B. Investigation of Machining Performance of MQL and MQCL Hard Turning Using Nano Cutting Fluids. Fluids 2022, 7, 143. [Google Scholar] [CrossRef]
  17. Duc, T.M.; Long, T.T.; Chien, T.Q. Performance evaluation of MQL parameters using Al2O3 and MoS2 nanofluids in hard turning 90CrSi steel. Lubricants 2019, 7, 40. [Google Scholar] [CrossRef]
  18. Wickramasinghe, K.C.; Sasahara, H.; Abd Rahim, E.; Perera, G.I.P. Green Metalworking Fluids for sustainable machining applications: A review. J. Clean. Prod. 2020, 257, 120552. [Google Scholar] [CrossRef]
  19. Abbas, A.T.; El Rayes, M.M.; Luqman, M.; Naeim, N.; Hegab, H.; Elkaseer, A. On the Assessment of Surface Quality and Productivity Aspects in Precision HardTurning of AISI 4340 Steel Alloy: Relative Performance of Wiper vs. Conventional Inserts. Materials 2020, 13, 2036. [Google Scholar] [CrossRef]
  20. Mondal, K.; Chatterjee, S.; Das, S.; Mandal, B. An Investigation on Turning of AISI 4340 Steel Using Innovative Eco-Friendly Cutting Fluids. In Recent Advances in Thermofluids and Manufacturing Engineering: Select Proceedings of ICTMS; Springer Nature: Singapore, 2022; pp. 429–445. [Google Scholar]
  21. Junankar, A.A.; Yashpal, Y.; Purohit, J.K. Experimental investigation to study the effect of synthesized and characterized monotype and hybrid nanofluids in minimum quantity lubrication assisted turning of bearing steel. Proc. Inst. Mech. Eng. J. Eng. 2022, 236, 1794–1813. [Google Scholar] [CrossRef]
  22. Naresh Babu, M.; Anandan, V.; Muthukrishnan, N.; Arivalagar, A.A.; Dinesh Babu, M. Evaluation of graphene based nano fluids with minimum quantity lubrication in turning of AISI D3 steel. SN Appl. Sci. 2019, 1, 1–15. [Google Scholar] [CrossRef]
  23. Javid, H.; Jahanzaib, M.; Jawad, M.; Ali, M.A.; Farooq, M.U.; Pruncu, C.I.; Hussain, S. Parametric analysis of turning HSLA steel under minimum quantity lubrication (MQL) and nanofluids-based minimum quantity lubrication (NF-MQL): A concept of one-step sustainable machining. Int. J. Adv. Manuf. Technol. 2021, 117, 1915–1934. [Google Scholar] [CrossRef]
  24. Thakur, A.; Manna, A.; Samir, S. Multi-response optimization of turning parameters during machining of EN-24 steel with SiC nanofluids based minimum quantity lubrication. Silicon 2020, 12, 71–85. [Google Scholar] [CrossRef]
  25. Ramoliya, P.; Vora, B.; Vaghasiya, N.; Prajapati, H.; Vaghasiya, H. Effect of Various Heat Treatment On The Mechanical Properties of Steel Alloy EN31. Int. J. Innov. Res. Sci. Technol. 2017, 3, 2349–6010. [Google Scholar]
  26. Yıldırım, Ç.V. Investigation of hard turning performance of eco-friendly cooling strategies: Cryogenic cooling and nanofluid based MQL. Tribo. Int. 2020, 144, 106127. [Google Scholar] [CrossRef]
  27. Anurag, K.R.; Sahoo, A.K.; Panda, A. Comparative performance analysis of coated carbide insert in turning of Ti-6Al-4V ELI grade alloy under dry, minimum quantity lubrication and spray impingement cooling environments. J. Mater. Eng. Perform. 2022, 31, 709–732. [Google Scholar] [CrossRef]
  28. Das, A.; Pradhan, O.; Patel, S.K.; Das, S.R.; Biswal, B.B. Performance appraisal of various nanofluids during hard machining of AISI 4340 steel. J. Manuf. Process 2019, 46, 248–270. [Google Scholar] [CrossRef]
  29. Tuan, N.M.; Ngoc, T.B.; Thu, T.L.; Long, T.T. Investigation of the Effects of Nanoparticle Concentration and Cutting Parameters on Surface Roughness in MQL Hard Turning Using MoS2 Nanofluid. Fluids 2021, 6, 398. [Google Scholar] [CrossRef]
  30. Bilga, P.S.; Singh, S.; Kumar, R. Optimization of energy consumption response parameters for turning operation using Taguchi method. J. Clean. Prod. 2016, 137, 1406–1417. [Google Scholar] [CrossRef]
  31. Rajemi, M.F.; Mativenga, P.T.; Aramcharoen, A. Sustainable machining: Selection of optimum turningconditions based on minimum energy considerations. J. Clean Prod. 2010, 18, 1059–1065. [Google Scholar] [CrossRef]
  32. Nur, R.; Noordin, M.; Izman, S.; Kurniawan, D. Machining parameters effect in dry turning of AISI 316L stainless steel using coated carbide tools. Proc. Inst. Mech. Eng. Part E J. Process Mech. Eng. 2015, 231, 676–683. [Google Scholar] [CrossRef]
  33. Ochengo, D.; Liang, L.; Zhao, W.; He, N. Optimization of Surface Quality and Power Consumption in Machining Hardened AISI 4340 Steel. Adv. Mater. Sci. Eng. 2022, 2022, 2675003. [Google Scholar] [CrossRef]
  34. Şahinoğlu, A.; Rafighi, M.; Kumar, R. An investigation on cutting sound effect on power consumption and surface roughness in CBN tool-assisted hard turning. Proc. Inst. Mech. Eng. Part E J. Process Mecha. Eng. 2022, 236, 1096–1108. [Google Scholar] [CrossRef]
  35. Senthilkumar, N.; Tamizharasan, T. Effect of tool geometry in turning AISI 1045 Steel: Experimental investigation and FEM Analysis. Arab. J. Sci. Eng. 2014, 39, 4963–4975. [Google Scholar] [CrossRef]
  36. Zaw, A.K.; Myat, A.M.; Thandar, M.; Htun, Y.M.; Aung, T.H.; Tun, K.M.; Han, Z.M. Assessment of Noise Exposure and Hearing Loss among Workers in Textile Mill (Thamine), Myanmar: A Cross-sectional Study. Saf. Health Work 2020, 11, 199–206. [Google Scholar] [CrossRef] [PubMed]
  37. Goelzer, B.; Hansen, C.H.; Sehrndt, G. Occupational Exposure to Noise: Evaluation, Prevention and Control; World Health Organisation: Geneva, Switzerland, 2001. [Google Scholar]
  38. Bouacha, K.; Yallese, M.A.; Mabrouki, T.; Rigal, J.F. Statistical analysis of surface roughness and cutting forces using response surface methodology in hard turning of AISI 52100 bearing steel with CBN tool. Int. J. Ref. Met. Hard Mate. 2010, 28, 349–361. [Google Scholar] [CrossRef]
  39. Perec, A.; Radomska-Zalas, A. WASPAS Optimization in Advanced Manufacturing. Procedia Comput. Sci. 2022, 207, 1193–1200. [Google Scholar] [CrossRef]
  40. Reddy, P.V.; Kumar, G.S.; Kumar, V.S. Multi-response optimization in machining Inconel-625 by abrasive water jet machining process using WASPAS and MOORA. Arab. J. Sci. Eng. 2020, 45, 9843–9857. [Google Scholar] [CrossRef]
  41. Kumar, R.; Singh, S.; Bilga, P.S.; Singh, J.; Singh, S.; Scutaru, M.L.; Pruncu, C.I. Revealing the benefits of entropy weights method for multi-objective optimization in machining operations: A critical review. J. Mater. Res. Technol. 2021, 10, 1471–1492. [Google Scholar] [CrossRef]
  42. Kumar, R.; Bilga, P.S.; Singh, S. Multi objective optimization using different methods of assigning weights to energy consumption responses, surface roughness and material removal rate during rough turning operation. J. Clean. Prod. 2017, 164, 45–57. [Google Scholar] [CrossRef]
Figure 1. EDS test of ZnO powder.
Applsci 13 10062 g001
Figure 2. ZnO nano-cutting fluid preparation.
Applsci 13 10062 g002
Figure 3. Experimental plan.
Applsci 13 10062 g003
Figure 4. Optical tool wear images obtained at the lowest depth of cut (0.1 mm).
Applsci 13 10062 g004
Figure 5. SEM with EDS test report of fresh tool tip.
Applsci 13 10062 g005
Figure 6. SEM with EDS test report of the lowest wear tool (run 6).
Applsci 13 10062 g006
Figure 7. SEM with EDS test report of the highest wear tool (run 13).
Applsci 13 10062 g007
Figure 8. Impact of input variables on tool wear.
Applsci 13 10062 g008
Figure 9. Interaction effects of input variables on tool wear.
Applsci 13 10062 g009
Figure 10. Impact of input variables on surface roughness.
Applsci 13 10062 g010
Figure 11. Interaction effects of input variables on surface roughness.
Applsci 13 10062 g011
Figure 12. Impact of input variables on power consumption.
Applsci 13 10062 g012
Figure 13. Interaction effects of input variables on power consumption.
Applsci 13 10062 g013
Figure 14. Cutting zone temperatures (Tmax) recorded using thermal camera.
Applsci 13 10062 g014
Figure 15. Impact of input variables on cutting temperature.
Applsci 13 10062 g015
Figure 16. Interaction effects of input variables on cutting temperature.
Applsci 13 10062 g016
Figure 17. Impact of input variables on cutting noise.
Applsci 13 10062 g017
Figure 18. Interaction effects of input variables on cutting noise.
Applsci 13 10062 g018
Table 1. Measured results of responses.
Test No.Input VariablesResponse Measured
ap
(mm)
s
(mm/rev)
v
(m/min)
q
(mL/hr)
VB (mm)Ra (μm)P
(kW)
T
(°C)
Cn (dB)
10.10.0570200.0490.4980.81763.677.13
20.10.1140300.0460.7221.05348.777.86
30.10.15210400.0630.8151.16183.578.08
40.10.2280500.0791.3951.18412179.71
50.20.05140400.0670.6030.91378.976.62
60.20.170500.0270.5670.72643.876.08
70.20.15280200.0890.8231.388269.882.31
80.20.2210300.0641.1531.31215381.62
90.30.05210500.0410.2521.0126977.03
100.30.1280400.0810.6361.31412079.18
110.30.1570300.0290.9240.95686.979.74
120.30.2140200.0481.6041.14794.682.34
130.40.05280300.0950.6971.342214.982.42
140.40.1210200.0540.8141.328145.183.11
150.40.15140500.0431.3631.04585.880.14
160.40.270400.0542.1740.91974.481.31
Table 2. ANOVA findings for VB.
SourceDFSeq-SSAdj-MSFP% ImpactSignificant
ap30.00038370.000127939.610.0076.27Yes
s30.00030220.000100731.190.0094.94Yes
v30.00468920.0015631484.050.00076.68Yes
q30.00073020.000243475.370.00311.94Yes
Error30.00000970.0000032
Total150.0061149
Summary: S: 0.00179699; R2 = 99.84%; R2 (adjacent) = 99.21%.
Table 3. ANOVA findings for Ra.
SourceDFSeq-SSAdj-MSFP% ImpactSignificant
ap30.565790.1886035.850.00815.88Yes
s32.644530.88151167.570.00174.26Yes
v30.254050.0846816.100.0247.13Yes
q30.080660.026895.110.1072.26No
Error30.015780.00526
Total153.56082
Summary: S: 0.0725293; R2 = 99.56%; R2 (adjacent)= 97.78%.
Table 4. ANOVA findings for P.
SourceDFSeq-SSAdj-MSFP% ImpactSignificant
ap30.0233680.0077899.950.0463.78Yes
s30.0372420.01241415.860.0246.02Yes
v30.4697420.156581200.040.00175.94Yes
q30.0859090.02863636.590.00713.89Yes
Error30.0023480.000783
Total150.618609
Summary: S = 0.0279773; R2 = 99.62%; R2 (adjacent)= 98.10%.
Table 5. ANOVA findings for T.
SourceDFSeq-SSAdj-MSFP% ImpactSignificant
ap39389.63129.944.030.00616.73Yes
s33591.91197.316.840.0226.40Yes
v332123.110707.7150.640.00157.25Yes
q310788.53596.250.590.00519.22Yes
Error3213.271.1
Total1556106.3
Summary: S: 8.43094; R2 = 99.62%; R2 (adjacent)= 98.10%.
Table 6. ANOVA findings for cutting noise.
SourceDFSeq-SSAdj-MSFp% ImpactSignificant
ap327.01369.0045152.580.00133.00Yes
s319.56266.5209110.490.00123.89Yes
v312.06094.020368.120.00314.73Yes
q323.05607.6853130.220.00128.16Yes
Error30.17700.0590
Total1581.8701
Summary: S = 0.242933; R2 = 99.78%; R2 (adjacent) = 98.92%.
Table 7. Ranking and Cumulative Relative Relevance Index obtained by WASPAS optimization.
Experiment No.Cumulative Relative Relevance IndexRank
10.6031624
20.6054533
30.4272787
40.29534613
50.4857985
60.7689642
70.2519216
80.29397414
90.7691631
100.379839
110.4839026
120.35265611
130.28780915
140.34886212
150.3962698
160.36462110
Disclaimer/Publisher’s Note: The statements, opinions and data contained in all publications are solely those of the individual author(s) and contributor(s) and not of MDPI and/or the editor(s). MDPI and/or the editor(s) disclaim responsibility for any injury to people or property resulting from any ideas, methods, instructions or products referred to in the content.

