Article

Feature Point Identification in Fillet Weld Joints Using an Improved CPDA Method

1
School of Mechanical and Electrical Engineering, Guilin University of Electronic Technology, Guilin 541004, China
2
Tebian Electric Apparatus Stock Co., Ltd., Changji 831100, China
*
Authors to whom correspondence should be addressed.
Appl. Sci. 2023, 13(18), 10108; https://doi.org/10.3390/app131810108
Submission received: 19 July 2023 / Revised: 31 August 2023 / Accepted: 31 August 2023 / Published: 7 September 2023
(This article belongs to the Topic Computer Vision and Image Processing)

Abstract

:
An intelligent, vision-guided welding robot is highly desired in machinery manufacturing, the ship industry, and vehicle engineering. The performance of the system greatly depends on the effective identification of weld seam features and the three-dimensional (3D) reconstruction of the weld seam position in a complex industrial environment. In this paper, a 3D visual sensing system with a structured laser projector and CCD camera is developed to obtain the geometry information of fillet weld seams in robot welding. By accounting for the inclination characteristics of the laser stripe in fillet welding, a Gaussian-weighted PCA-based laser center line extraction method is proposed. Smoother laser centerlines can be obtained at large, inclined angles. Furthermore, an improved chord-to-point distance accumulation (CPDA) method with polygon approximation is proposed to identify the feature corner location in center line images. The proposed method is validated numerically with simulated piece-wise linear laser stripes and experimentally with automated robot welding. By comparing this method with the grayscale gravity method, Hessian-matrix-based method, and conventional CPDA method, the proposed improved CPDA method with PCA center extraction is shown to have high accuracy and robustness in noisy welding environments. The proposed method meets the need for vision-aided automated welding robots by achieving greater than 95% accuracy in corner feature point identification in fillet welding.

1. Introduction

As a key method to achieve a permanent connection between materials, welding is becoming more and more important in manufacturing [1,2], bridge and/or ship construction [3,4], vehicle engineering [5], the aerospace industry [6], and so on. Moreover, with the rapid development of the industrial robot [7], the application of welding processes will continue to be broadened with automation and intelligence.
To meet the advancements of industrial modernization and the shortage of labor resources, the use of robot-aided automated welding systems has become a surging need in the welding fields [8]. Welding processes with robots are mainly achieved by three means: the teach and playback mode, offline programming, and vision-based automation. Due to the complexity of the working environment in welding processes with varied welding joint types, welding robots using the teach and playback mode are limited in meeting the requirements of flexible manufacturing [9]. Meanwhile, the offline programming mode is time- and labor-inefficient, especially in small-batch, customized production [10]. With the development of machine-vision sensing technology [11], automated welding robots with visual perception are becoming a promising solution to meet the developing trend of flexible and intelligent manufacturing.
In the sensing system of an automated welding robot, the recognition and positioning method of the weld seam is crucial. The accuracy of the methods for determining the weld seam position will greatly affect the automation robustness and the quality of the welding joints [12]. The visual sensors used in welding robots can be mainly divided into two types: passive sensing and active sensing. Commonly, studies on passive sensing methods for extracting the 3D position of a weld seam using stereo vision have focused on image processing algorithms. An automatic weld seam recognition method was developed using a stereo matching algorithm to obtain the 3D points of a square weld seam [13]. This method was further extended to the recognition of fillet weld joints using a developed adaptive line-growing algorithm based on the difference in gray-scale values in each pixel near the weld seam region [14]. To improve the detection accuracy, not only the feature points or lines but also the feature descriptor (e.g., binary robust independent elementary features, BRIEF) were used in stereo matching to obtain the 3D information of the fillet weld seam [15]. Both the 3D shape of the seam and the structure of the fillet weld can be measured for controlling the trajectory and posture of a robot torch. However, the passive visual sensing method is sensitive to the changing of light, while strong lightening occurs in the welding process. The passive vision method has poor robustness in the complex welding environment and is invalid during the welding process.
By utilizing the laser and/or structured light as the auxiliary light source, active visual sensing methods are found to be more robust in a complex industrial environment [16]. Active vision with laser light has the advantages of non-contact, high precision, and computational efficiency and has been widely used in welding guidance [17] and 3D detection [18]. The key challenge in the automatic guided welding robot based on an active laser sensing system is to identify the geometrical features of the welding seam in the captured image of a laser strip. The performance of feature point identification methods is directly related to the precision, accuracy, and speed of welding guidance. At present, the commonly used laser stripe feature extraction methods in robotic welding guidance include least-square and/or curve fitting [19], template matching and/or polygon approximation [20], sliding vector and Hough transform analysis [21], and corner-detection-based methods [22].
Active visual sensing methods with laser light have been studied and implemented in robotic welding applications by researchers [23,24,25]. The geometry of a welding seam can be effectively extracted by the developed image processing and feature extraction algorithms, even when the captured image quality is low [23]. With a developed line-shaped structured-light active sensing system, the weld seam can be recognized and located accurately and robustly [24]. By implementing an adaptive median filtering and feature point extraction algorithm based on automatic threshold processing for butt joints, a narrow weld seam of 0.1~0.5 mm can be accurately identified [25]. However, there are relatively few methods developed for feature point identification in fillet joint welding, which is more complex due to an indirect visual angle. The Hessian-matrix-based method [26] was found to have high center line extraction accuracy in fillet joint welding with an inclined laser stripe. However, it was computationally demanding. With an extracted center line, feature detectors were needed to detect the corner points of the fillet welding seams. Grayscale-intensity-based [27,28] and contour-based [29,30] methods have been proposed in the literature. However, the intensity-based methods were found to have low robustness in welding laser line images with insufficient grayscale variance, while the computation efficiency of the contour-based method needed to be further improved.
In this paper, a weld seam recognition and positioning method based on primary component analysis (PCA) and chord-to-point distance accumulation (CPDA) technologies is proposed for robotic fillet joint welding. Firstly, the obtained image with a structured laser stripe of a fillet weld joint is pre-processed. Then, the center line of the laser stripe is extracted using a proposed Gaussian-weighted, PCA-based method, after which the feature points of the fillet weld are extracted using the improved CPDA method with polygon approximation. Finally, for the robot welding application, the feature corner points that indicate the 3D position of the fillet weld seam can be identified and reconstructed.

2. Feature Point Recognition Model of Structured Laser Light in Fillet Welding

The developed three-dimension vision sensing system with structured laser light is shown in Figure 1a. The system consists of a CCD (charge-coupled-device) camera, a laser line projector, and an image processing unit. Figure 1b shows the developed 3D sensing system integrated on the robotic arm and Figure 1c is one of the obtained images of the structure-light laser stripe in the fillet welding. In this situation, the line-shaped structured laser is projected onto the surface of the fillet weld seam, which deformed the straight laser light into a twisted fringe pattern. The deformed fringe pattern is then captured with the CCD camera. As shown in Figure 1d, the interest here is to find the corner feature point P(x, y) in the image coordinate system {I} as it indicates the location of the weld seam. According to the pin-hole model, the corresponding 3D position (xw, yw, zw) of the weld seam can be obtained in each time constant by combining the camera model {C} with the ray-plane equation of the structured laser line using the triangulation model in Equation (1). As the 3D sensing system is mounted on the end-effector {Z}, the 3D spatial coordinate (xb, yb, zb) in base coordinate system {B} for a welding robot can be reconstructed with the given relation between the robot arms. Therefore, the key issues are the accurate extraction of the contour feature, which the projected laser deformed as a curve; and the robust identification of feature point P, which is the corner point on the projected laser line using image processing algorithm. Effective identification of these features is the key and the first step in enabling automatic robot welding for fillet weld seams.
x w y w z w = L f cos θ x x y f
where, in Equation (1), (x, y) are coordinates of the identified feature corner points of fillet welding in the image plane. (xw, yw, zw) represent the 3D position of fillet weld seam. f is the focal length for the CCD camera. L is the distance between the CCD camera and the laser projector. The value of f and L can be determined in the laser ray-plane calibration [31].

3. Feature Points Extraction Method in Fillet Welding

3.1. Image Pre-Processing

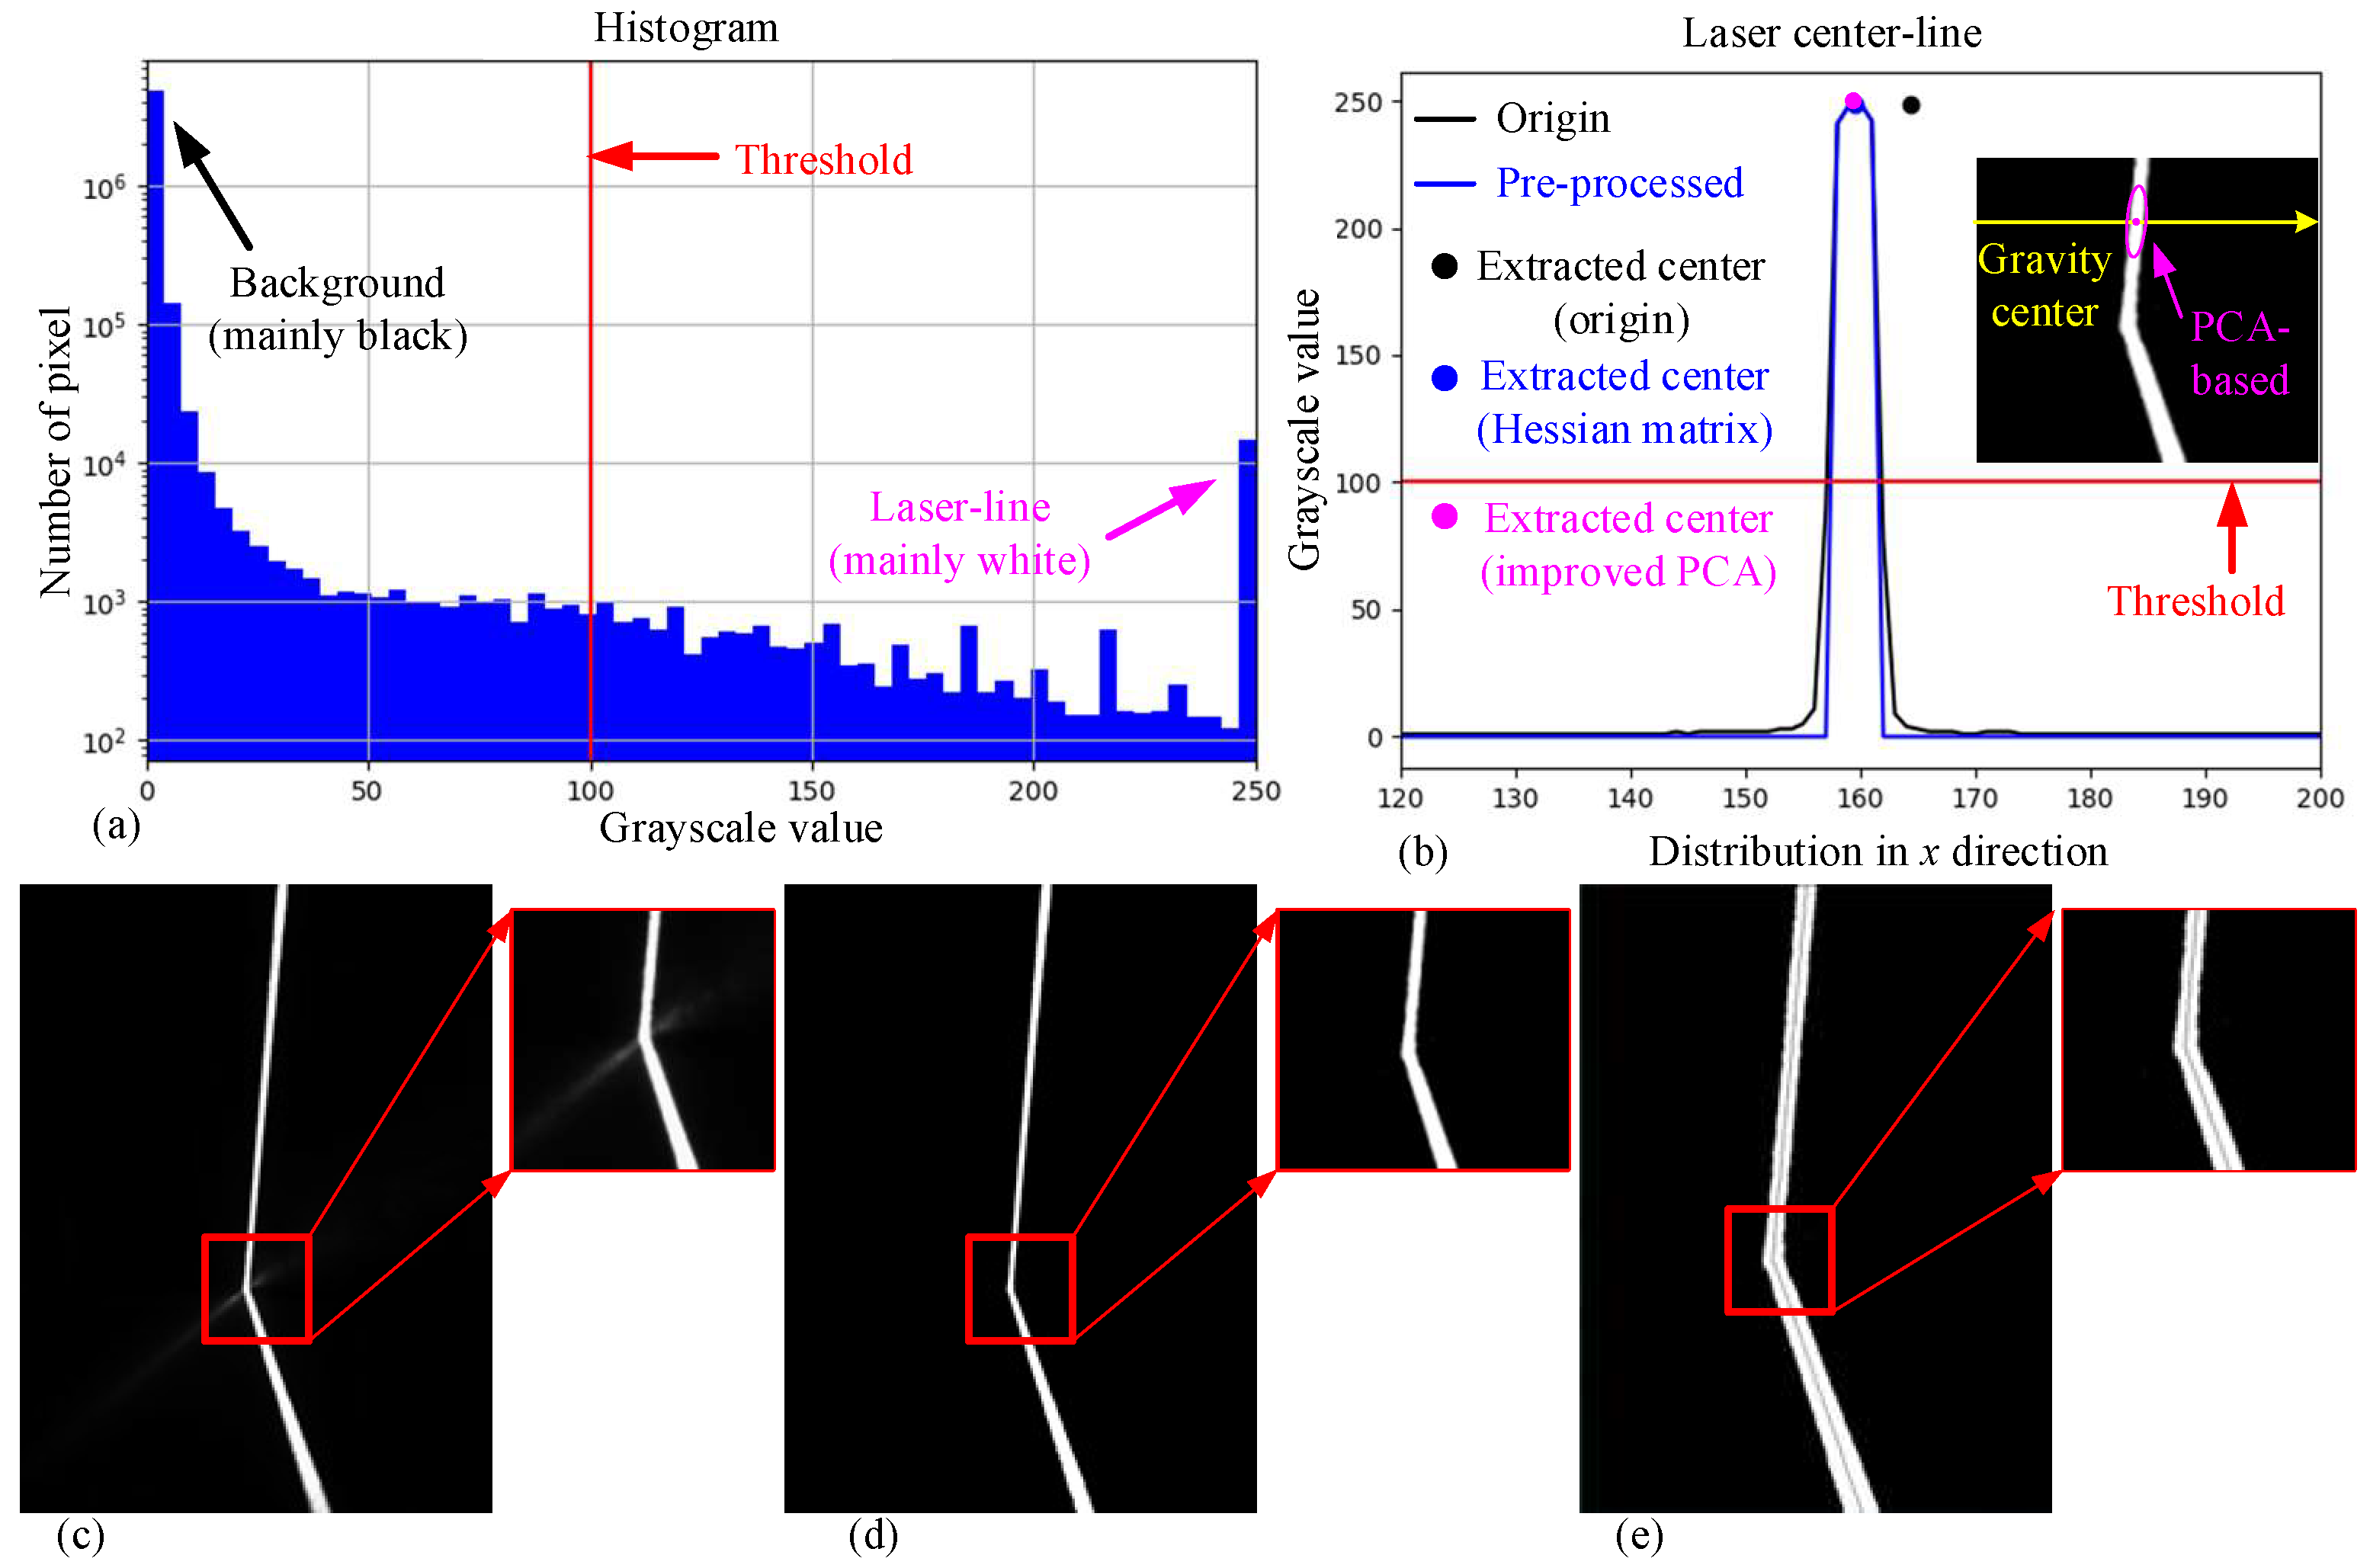
The pre-processing of the acquired image primarily involves performing a threshold segmentation, which aims to separate the light stripe information from the original image and minimize the influence of background on image processing. In the image (Figure 1c) that was captured with the developed sensing system, pixels can be mainly separated into two classes: the background with dark lightness, and the laser line with bright lightness. As shown in the histogram of a captured image with the resolution of 2592 × 1944 pixels in Figure 2a, a total number of 4.7 × 106 pixels are in black (grayscale value from 0 to 10) while 1.6 × 104 pixels are in white (grayscale value from 245 to 255). Other pixels with different grayscale values (the average number of pixels is 865) are an order of magnitude lower than these two classes. Therefore, the simple but effective Otsu’s method [32] is implemented to calculate an optimal threshold T (marked by a red line in the histogram in Figure 2a) by maximizing the variance between two classes of pixels to separate the laser line from the background. Pixels (u, v) in the image with grayscale values below the threshold T are set to 0, while pixels with grayscale values equal to or above the threshold T remain as themselves. The process can be summarized as follows:
f ( x , y ) = 0 , f ( u , v ) < T f ( u , v ) , f ( u , v ) T
Compared with the original image, the pre-processed image in Figure 2c,d shows that the gray-scale features become more pronounced after the image pre-processing. The interference image features caused by the metal reflection can be effectively filtered out. The brightness information of the laser stripe area can be better retained, which provides favorable conditions for the subsequent center extraction of laser fringe.

3.2. Laser Stripe Center Extraction Using a Gaussian-Weighted PCA Method

As shown in Figure 1c, because more than one pixel of the CCD camera received the metal-reflected light, the laser stripe has a center width. It is of high importance to identify the center laser stripe from the image, which will directly affect the accuracy of three-dimension reconstruction. There are demanding requirements for accuracy and stability for methods to extract the center line and identify feature points in robotic welding applications. Laser stripe center line extraction methods can be mainly divided into three types: grayscale-based peak-value and/or gravity method [33], model-based curve fitting method, and Hessian-matrix-based Steger method [26].
When the laser fringe is mainly distributed in the vertical direction in the image, the center pixel-coordinates of the laser stripe can be obtained as the grayscale gravity center [33] by extracting the grayscale distribution along the horizontal and vertical directions, respectively, using Equation (3):
x c = i = 1 N u i · f ( u i , v ) / i = 1 N f ( u i , v ) y c = j = 1 M v j · f ( u , v j ) / j = 1 M f ( u , v j )
where, (xc, yc) are the coordinates of the center line. (u, v) are the image coordinates for column and row in the range of [1, N] and [1, M], respectively. f(u, v) is the grayscale value for each pixel in (u, v). (i, j) are indexes used for calculating the gravity from left to right and top to bottom within the image, respectively.
However, as depicted in Figure 1c for the fillet welding application, the laser stripe is distributed at a significant angle with respect to the horizontal or vertical direction. Consequently, the obtained laser line centers exhibit higher errors. The Hessian-matrix-based method [26] has robust noise resistance and can maintain high center line extraction accuracy in complex environments. Nevertheless, it requires five large-scale Gaussian convolutions and second-order Taylor expansions, as formulated in Equation (4). These operations are in high computational complexity and cannot be implemented in real time.
H ( x , y ) = 2 G ( x , y ) / x 2 2 G ( x , y ) / x y 2 G ( x , y ) / y x 2 G ( x , y ) / y 2 f ( x , y )
where H(x, y) in Equation (4) is the Hessian matrix that related to the Gaussian kernel G(x, y) and grayscale image f(x, y). is the convolution operator.
To improve accuracy and optimize the extraction speed for fillet welding with an inclined laser stripe, a Gaussian-weighted PCA (principal component analysis)-based algorithm is proposed in this paper. For a given laser stripe coordinate set (gx, gy) in x and y directions, respectively, a covariance matrix [C] can be computed using Equations (5)–(7):
[ C ] = cov ( g x , g x ) cov ( g x , g y ) cov ( g y , g x ) cov ( g y , g y )
cov ( g i , g j ) = 1 N 1 n = 1 N ( g i n g ¯ i ) ( g j n g ¯ j )
g ¯ = 1 N n = 1 N g n
From Equation (5), the eigenvalue (λ1, λ2) can be determined in descending order, along with the corresponding eigenvectors (v1, v2) that represent the direction of the laser stripe. This determination is accomplished using the singular-value-decomposition method [34]. The inclined laser stripe can then be transformed into the PCA coordinate system using transformation matrix [A] as defined in Equation (8). This transformation allows for the retrieval of the center line of the laser stripe through a zero-mean Gaussian-weighted convolution in Equation (9).
P x P y = [ A ] g x g ¯ x g y g ¯ y   where   [ A ] = v 1 T v 2 T
G ( x , y ) = 1 2 π σ x σ y exp x 2 2 σ x 2 + y 2 2 σ y 2   where   σ x σ y = 3 λ 1 λ 2
where, in Equation (9), (σx, σy) are related with the eigenvalue (λ1, λ2) in Equation (3). Three sigma is used here to include 99.7% of laser stripe information in the Gaussian-weighted convolution.
Compared with the grayscale gravity method, the proposed PCA-based method first obtains the laser line distribution direction before calculating the laser line centers, leading to substantial enhancement in accuracy. When contrasted with the Hessian-matrix-based algorithm, the proposed PCA-based method obtains the normal direction of the optical laser line with just one Gaussian convolution, significantly reducing the computational time.
To illustrate the extraction results obtained through different methods, the grayscale values of the laser stripe image along the horizontal distribution are shown in Figure 2b. When directly calculating the laser line centers using the grayscale gravity method as defined in Equation (2), noticeable errors are observed, as indicated by the black point in Figure 2b. On the other hand, employing the Hessian-matrix-based Steger method [26] after pre-processing in Equation (2) yields more accurate results. However, it is worth noting that the Hessian-matrix-based method is computationally expensive. With the developed PCA-based method in Equations (5)–(8), the results of laser line center extraction from images during welding are shown in Figure 2e. It can be found that even in fillet welding with inclinations, the PCA-based method demonstrates relatively high extraction accuracy. With the distribution of image light stripes, the grayscale value of each line in the target area is calculated and the center of the line is extracted. Subsequently, the obtained center pixel coordinates are stored for the following fillet weld feature points extraction in the laser fringe.

3.3. Improved CPDA Corner Detection Method

After obtaining the contour-like laser center line, the subsequent crucial step involves identifying the feature corner points while they are directly related to the 3D location of the weld seam. In the literature, various methods for detecting corners and/or interest-points have been proposed, primarily falling into two categories: image intensity-based and contour-based methods. In intensity-based corner detection methods, it is necessary to evaluate the grayscale gradient at each pixel within its local neighborhood. A point is deemed a candidate corner point when the grayscale exhibits significant variations in all directions within the local region. Examples of such methods include BRISK (binary robust invariant scalable keypoints) [27] and SIFT (scale-invariant feature transform) [28] detectors. However, in fillet welding applications, the grayscale variance within the laser line is typically small (as illustrated in Figure 2b), while the edge contour is quite obvious. Consequently, the contour-based algorithm is better suited for identifying corner feature points in the weld seam.
The contour-based CPDA (chord-to-point distance accumulation) algorithm [29] was originally introduced in 2008 for discrete curvature estimation. As an enhancement of the CSS (curvature scale-space) [30] algorithm, which identifies corners as the points with maximum curvature along the contour, the CPDA method calculates the Euclidean distance accumulation instead. This approach avoids the need for calculating first and second derivatives, thereby improving the robustness and computational efficiency of the corner feature point. The principles underlying the CPDA technique are illustrated in Figure 3.
In Figure 3, P1, P2, P3,..., Pn are points on a curve P. Point P1 signifies the starting point of curve P, while Pn marks its end point. In the CPDA algorithm, a chord is moved along the curve P and the perpendicular distances between each point Pi on the curve to the chord di,j is summed up to represent the curvature at that specific point. The computation diagram for the corresponding value of corner point Pi is detailed as follows:
-
First, a reference chord-of-length L was defined. In Figure 3, for instance, the value of L value has been set to 10.
-
For each detected point Pi on the curve P, the point Pi−L+1 was taken as (L − 1) distance backward while Pi+1 was taken as 1 distance forward. So, a chord CL between these two points can be obtained.
-
We calculated the distance from Pi to chord CL, denoted as di,iL+1.
-
We moved the chord CL on each side of Pi one pixel in the same direction along the curve P while maintaining the length of the CL value as L. Then, similarly, calculate the distance from each point to the chord.
-
We repeated the former operation until one of the points on the chord was Pi. Then, the calculation was stopped. The chord-to-point distances were accumulated as:
h L ( i ) = j = i L + 1 i 1 d i , j
where di,j is chord-to-point distance as each point Pi. hL is the chord-to-point accumulation value with the chord-of-length of L.
The algorithm described above includes the calculation of the distance between two points and the computation of the chord-to-point distance. These distances are calculated using the following formulas, respectively.
C L = ( x 2 x 1 ) 2 + ( y 2 y 1 ) 2
d i = | A x i + B y i + C | A 2 + B 2
where (x1, y1) and (x2, y2) are coordinates of two points, respectively. di is the distance from point (xi, yi) to line Ax + By + C = 0.
Directly applying the CPDA algorithm with the above formulas may yield incorrect feature points. To filter out these incorrect feature points, it is essential to perform a linear normalization process to detect and eliminate false corners:
N L ( i ) = h L ( i ) min ( h L ) max ( h L ) min ( h L )
where NL is a normalized vector representing the corresponding value of each point on the curve P. max() and min() represent the maximum and minimum cumulative values of the chord-to-point distance on the curve, respectively. The normalization process prevents a situation where points in some flat planes exhibit large chord-to-point accumulation values. However, it was found in the experiments with noisy arc light interference that there are pseudo-corners and/or missing corners after the linear normalization filtering.
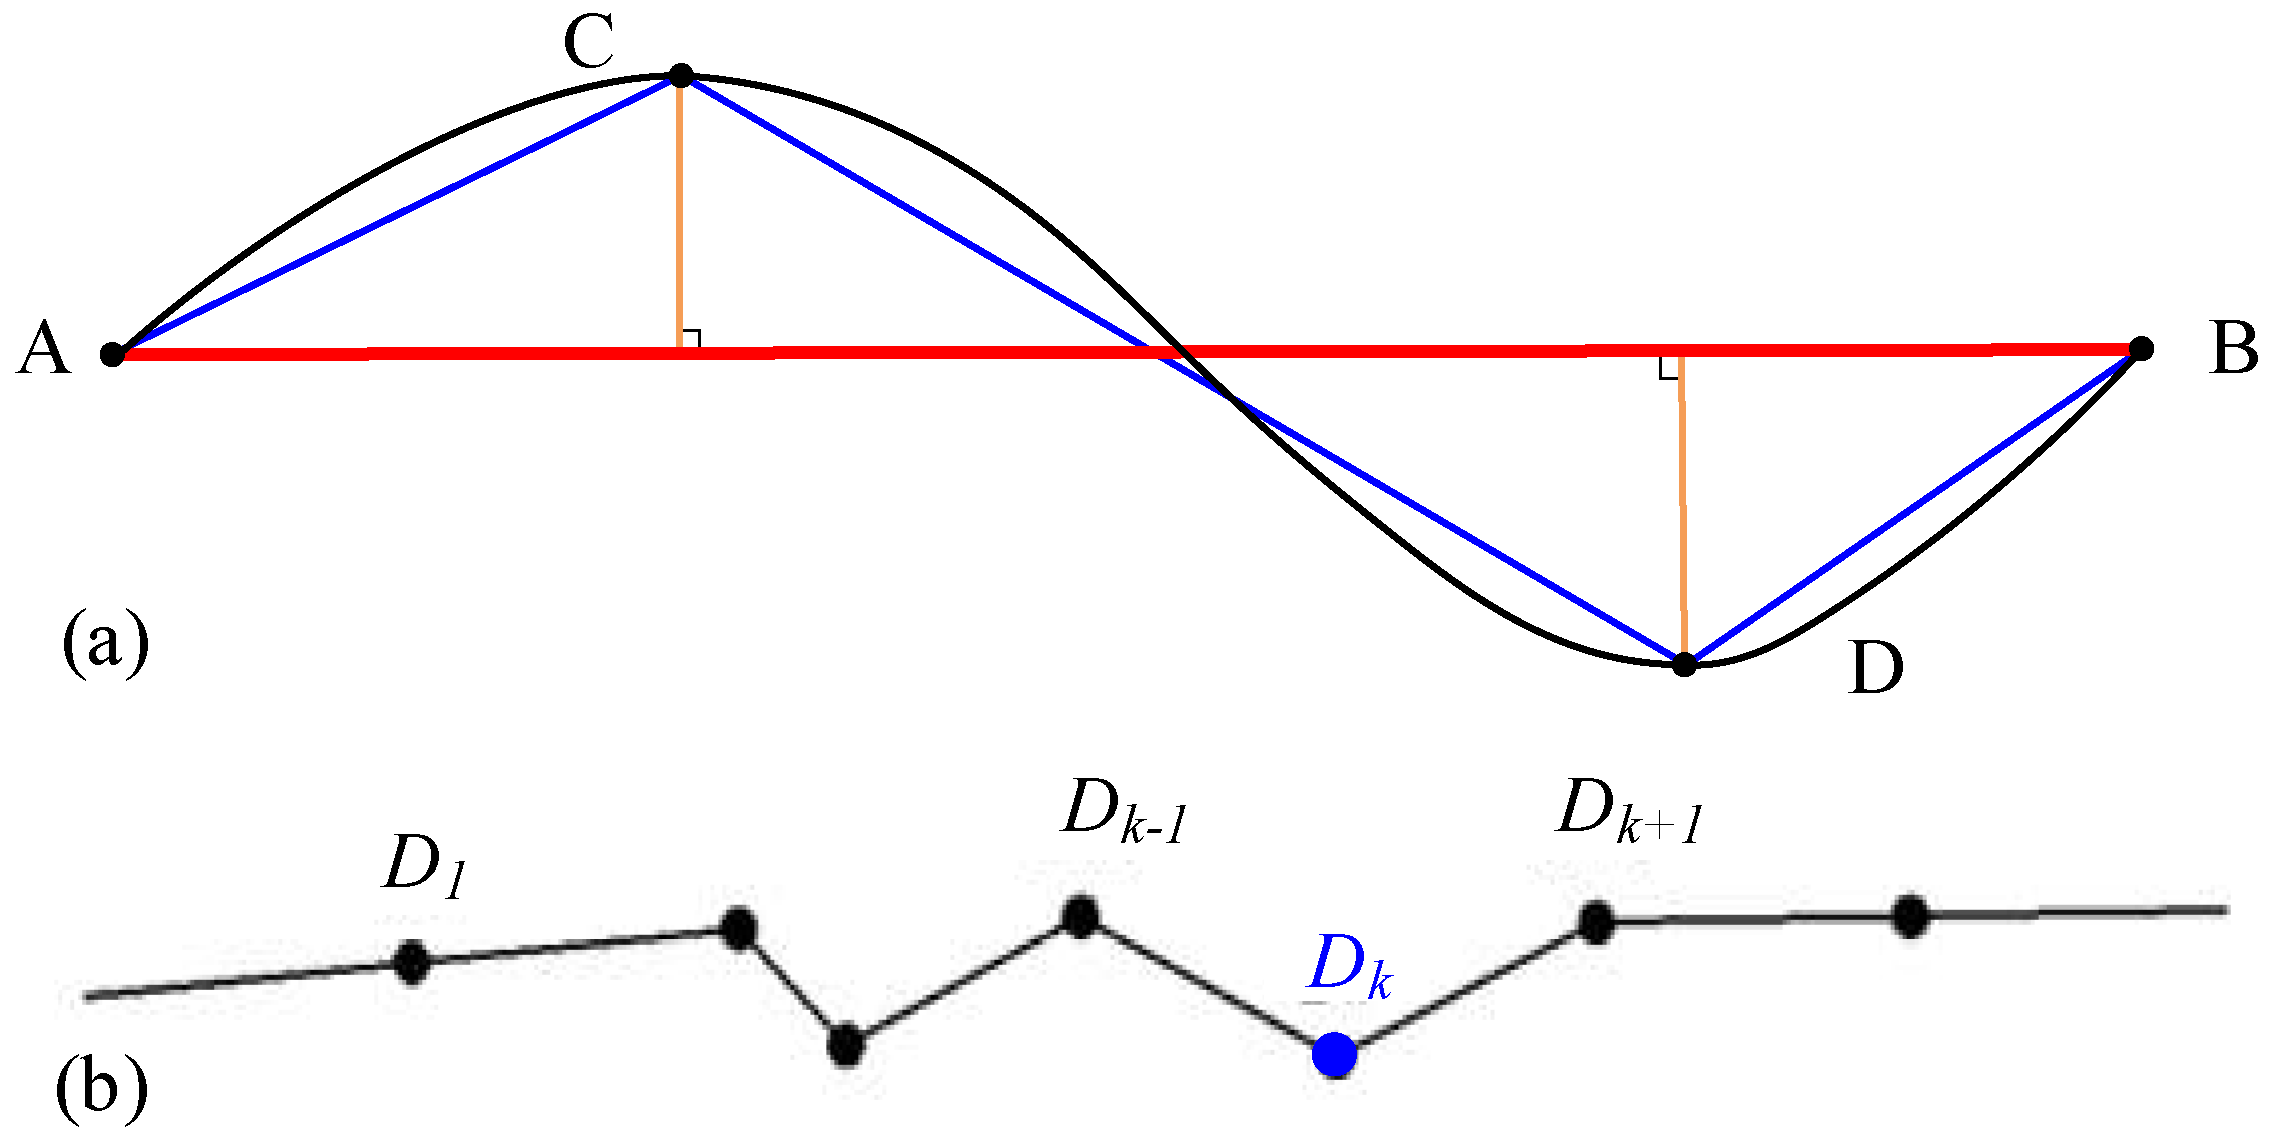
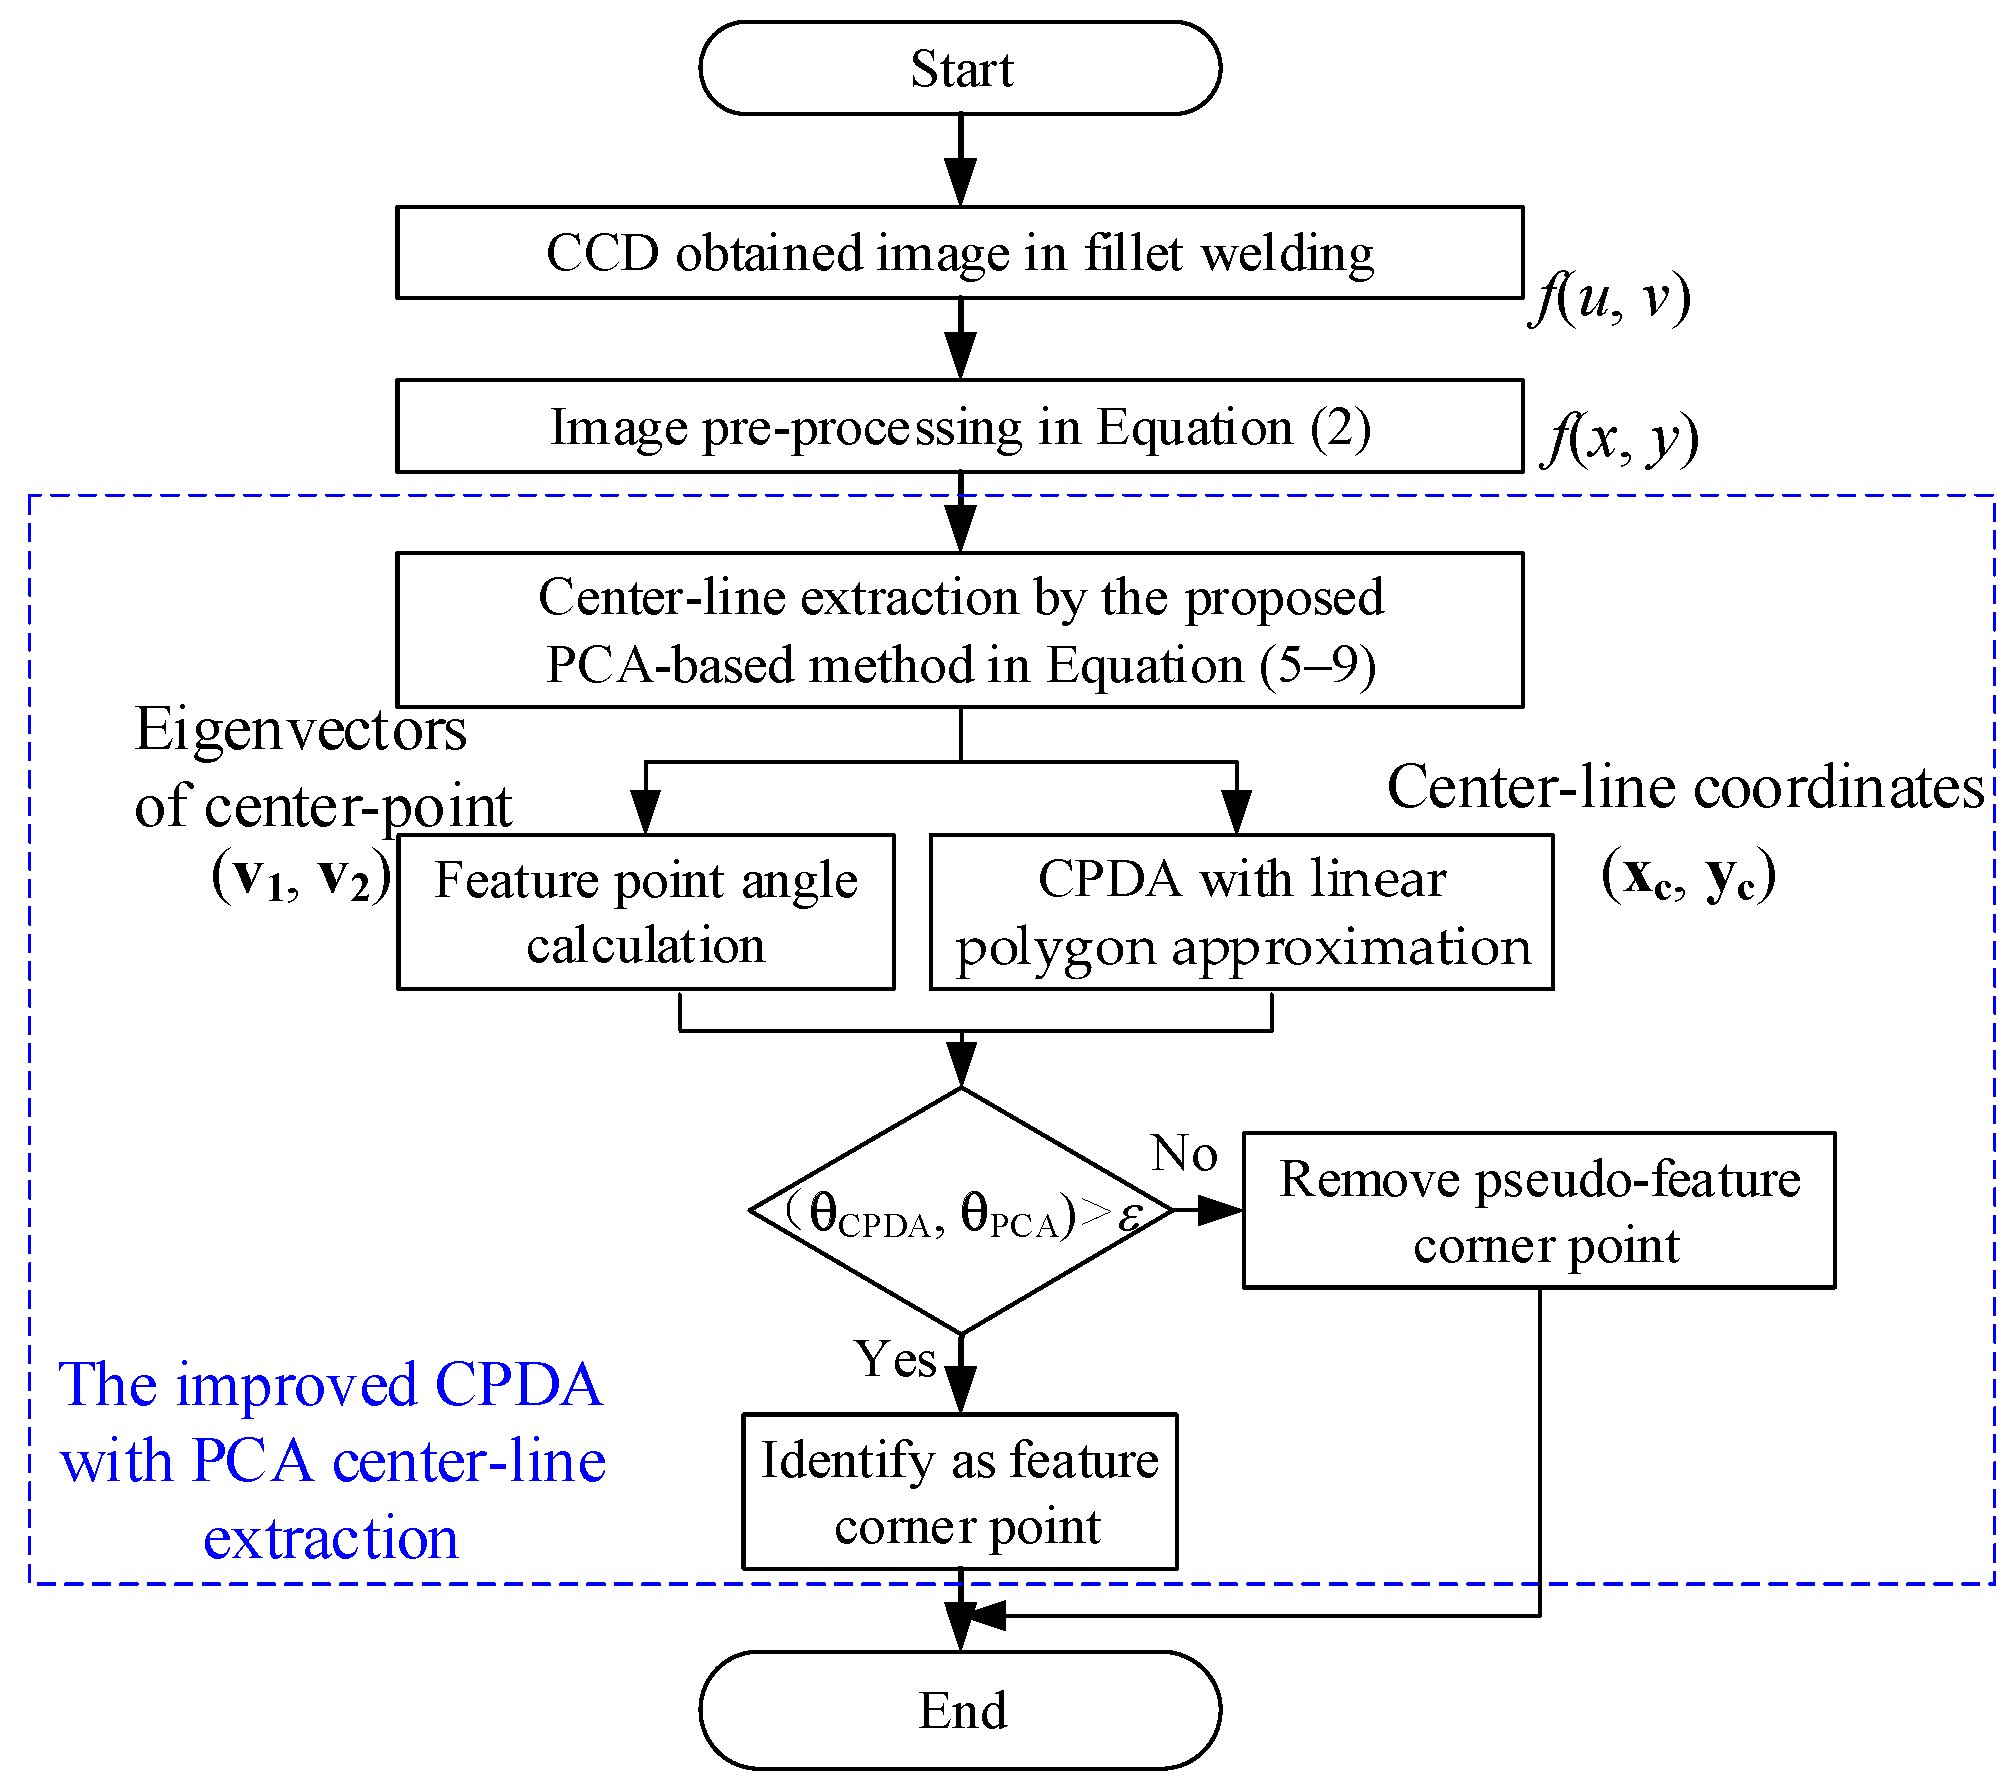
To improve computational efficiency while achieving robust feature corners detection in noisy environments, an improved CPDA method with linear polygon approximation and feature point angle monitoring strategy is proposed. The original CPDA detector remains computationally expensive as it calculates the discrete hL value in Equation (10) for every point on the curve. In the improved CPDA method, we select a set of potential candidate points during the center line extraction through PCA in Equation (8). The eigenvectors (v1, v2) representing the laser stripe direction at each point on the curve are stored. By monitoring the angle direction between each feature point, the points with large direction variance are chosen as the candidate points. Moreover, the proposed improved CPDA method calculates the angle between each line vector instead of computing the distance, resulting in further computational reduction. The diagram (Figure 4a,b) and steps of the improved CPDA are summarized as follows. With the input images of fillet welding, the feature corner points representing the 3D location of the weld seam on the laser line can be detected as outlined in the flow-chart presented in Figure 5.
-
Establish a straight line connecting the starting point A and the ending point B;
-
Find a point (e.g., denoted as C in Figure 4) on the original contour curve that is farthest from this line. If the calculated distance exceeds a predetermined threshold, this point is considered a feature corner point;
-
Iterate through the above two steps for the segmented contour of the curve until the shortest distance between all points and the polygon falls below the threshold;
-
Apart from the calculation of distance, determine the angle between two polygon lines. Select points Dk−1 and Dk+1 as the points preceding and succeeding and compute the angle between line vectors Dk−1Dk and DkDk+1.
-
Compare the obtained angle with the angle represented by the eigenvectors (v1, v2) calculated in the PCA process. Retain the angle if it surpasses a predefined threshold; otherwise, remove it.

4. Numerical Verification and Experimental Validation Results

To assess and validate the effectiveness of the proposed method incorporating PCA and the improved CPDA algorithm for identifying the feature corner points in laser stripe during fillet welding, numerical simulated and experimental captured images are used for comparing the performance between several state-of-the-art methods. To provide a “ground truth” for subsequent comparisons, a piece-wise linear line is defined with the following analytical equation:
x = y 150 cot 2 π 5 + 100 ,   for   y 150 , 350 150 y cot π 3 + 100 ,   for   y 0 , 150
The formulated piece-wise linear line as described by Equation (14) is visually represented in Figure 6a. A dilation morphological operation is implemented to the linear line to simulate the width of the laser stripe in the captured image with a 9 × 9 square kernel. The dilated laser stripe is shown in Figure 6b. In an effort to make the simulated laser stripe more closely resemble practical situations where a normal distribution is typically observed along the laser line, A Gaussian kernel with a sigma value of 3 is implemented through convolution and illustrated in Figure 6c. When extracting the grayscale distribution along the x direction with a row index of 100, as demonstrated with a yellow line arrow in Figure 6a,b,c, the simulated laser stripe exhibits a distribution similar to that of the experimental captured laser line in Figure 2b. The center point (denoted as a red dot in Figure 6d), which is the highest point on the piece-wise line, can serve as ground truth for comparisons among different methods.
Consequently, the simulated laser stripe images depicted in Figure 6c are used as input for extracting the laser center line via different methods: grayscale gravity method [33], Hessian-matrix-based Steger method [26], and our proposed Gaussian-weighted PCA-based method. The analytical expression of the piece-wise line in Figure 6a serves as the ground truth for the center line. Additionally, zero-mean random noise with different standard deviation is implemented to evaluate the performance of each method in a noisy environment.
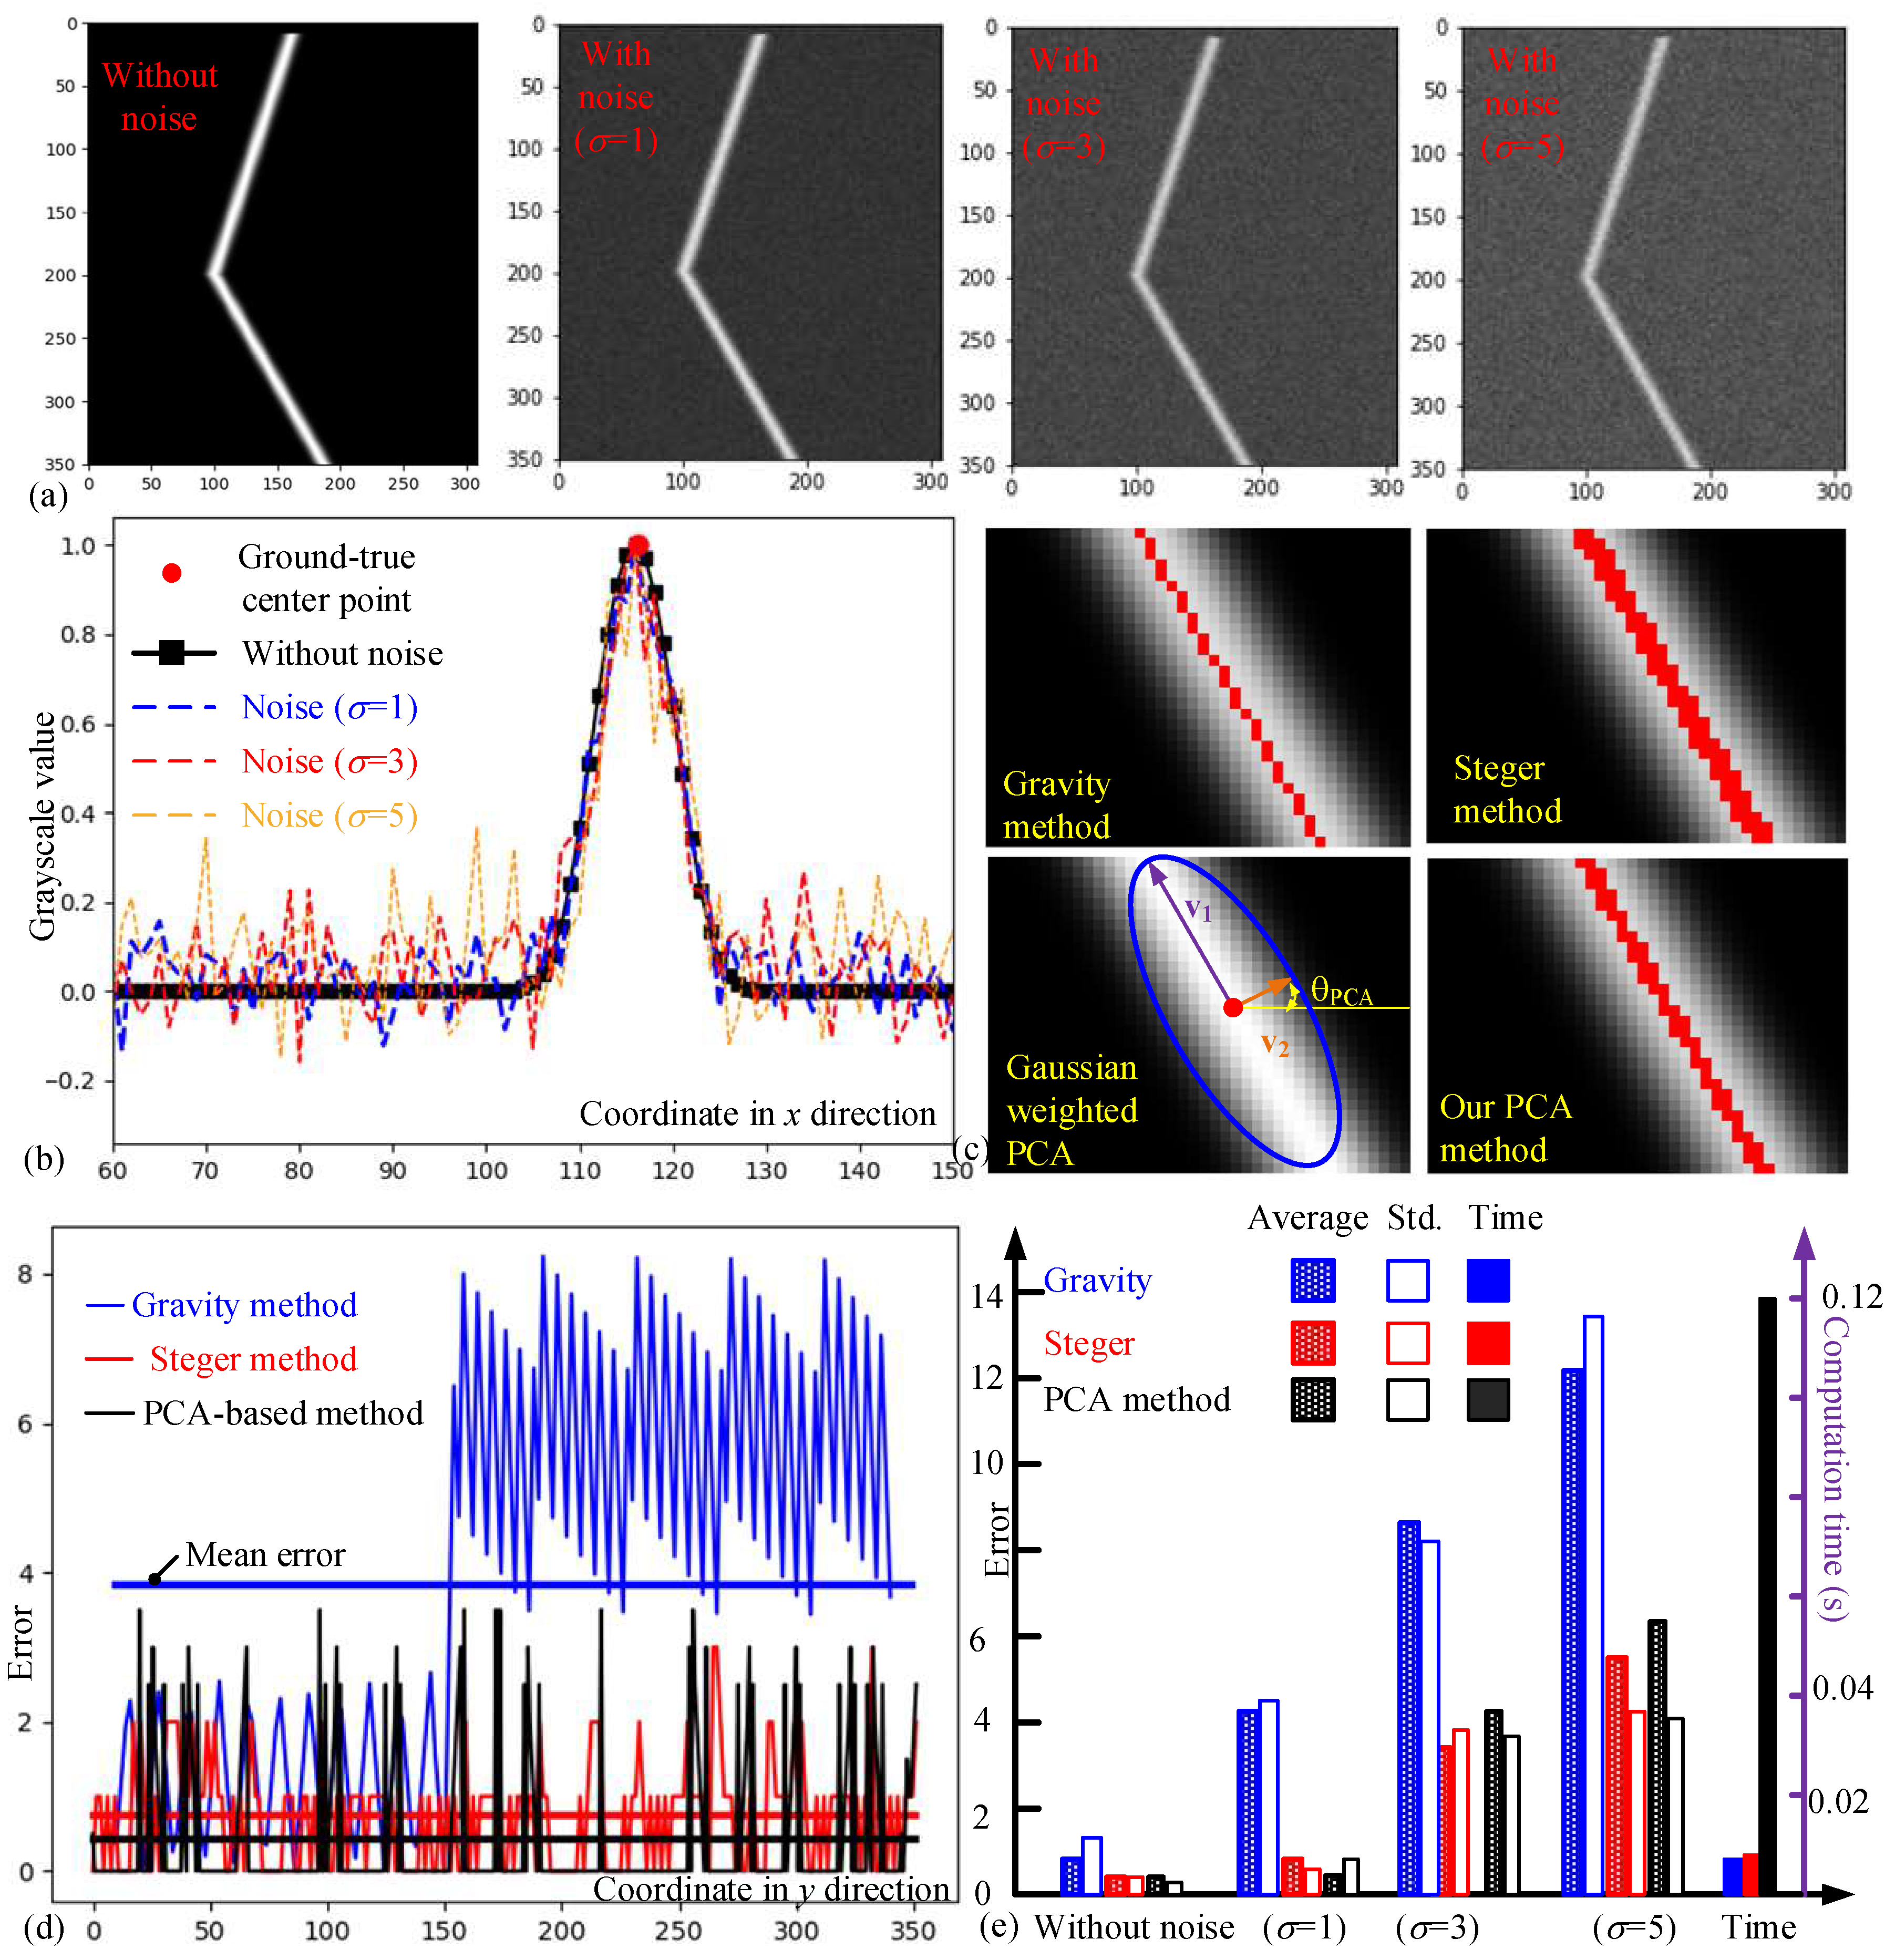
Several conclusions can be drawn from the results presented in Figure 7 and Table 1:
-
When extracting the grayscale value along the x direction using the simulated laser stripe images in Figure 7a, it becomes evident that the present of zero-mean Gaussian noise with different sigma values exerts a noticeable impact, as illustrated in Figure 7b. The location of the piece-wise line in this row (marked by the red dot) serves as the ground truth for comparison;
-
Figure 7c are the results of center line extraction achieved with different methods using simulated images without noise. The center line obtained through the gravity-based method [33] exhibits obvious discontinuities due to its sensitivity to rotation. Conversely, the Steger method [26] and our developed PCA-based method provide smoother extraction results by accounting for the rotation angle through Hessian matrix and PCA;
-
Figure 7d is the error comparison among different methods using image with noise (σ = 1). The error is defined as the distance between the extracted center line coordinates and Equation (14): error = Δ x 2 + Δ y 2 . It is worth noting that the gravity-based method has higher errors as the inclined angle increases, particularly in the lower part of the simulated laser stripe. In contrast, both the Steger method and our proposed method effectively reduce the effect of an inclined laser stripe in a fillet weld, resulting in lower errors;
-
Figure 7e and Table 2 show insights into the sensitivity of different methods to noise. The gravity-based method proves to be highly sensitive to noise, while both the Steger and our method demonstrate relatively high robustness. With respect to the extraction time, the Hessian-matrix-based method is computationally expensive, whereas the proposed PCA-based method achieves similar accuracy at a speed that is 10 times faster.
The experimental setup with the main components of the welding robot and sensing unit are shown in Figure 8. The captured images, utilized for feature points extraction, are processed on a Windows X64 system computer with an Intel (R) Core (TM) i5-10400F CPU processor. The hardware setup includes a CCD camera MV-EM500M and a linear laser projector with 650 nm wavelength. The programming for image processing is performed using Visual Studio 2015 (version 14.0.27544.0) software and the OpenCV image processing tool. In accordance with the calculations outlined in Section 3 regarding the CPDA algorithm, the value of L is set as 6 in the experiments. The details of the welding conditions employed in the experiments are summarized in Table 2.
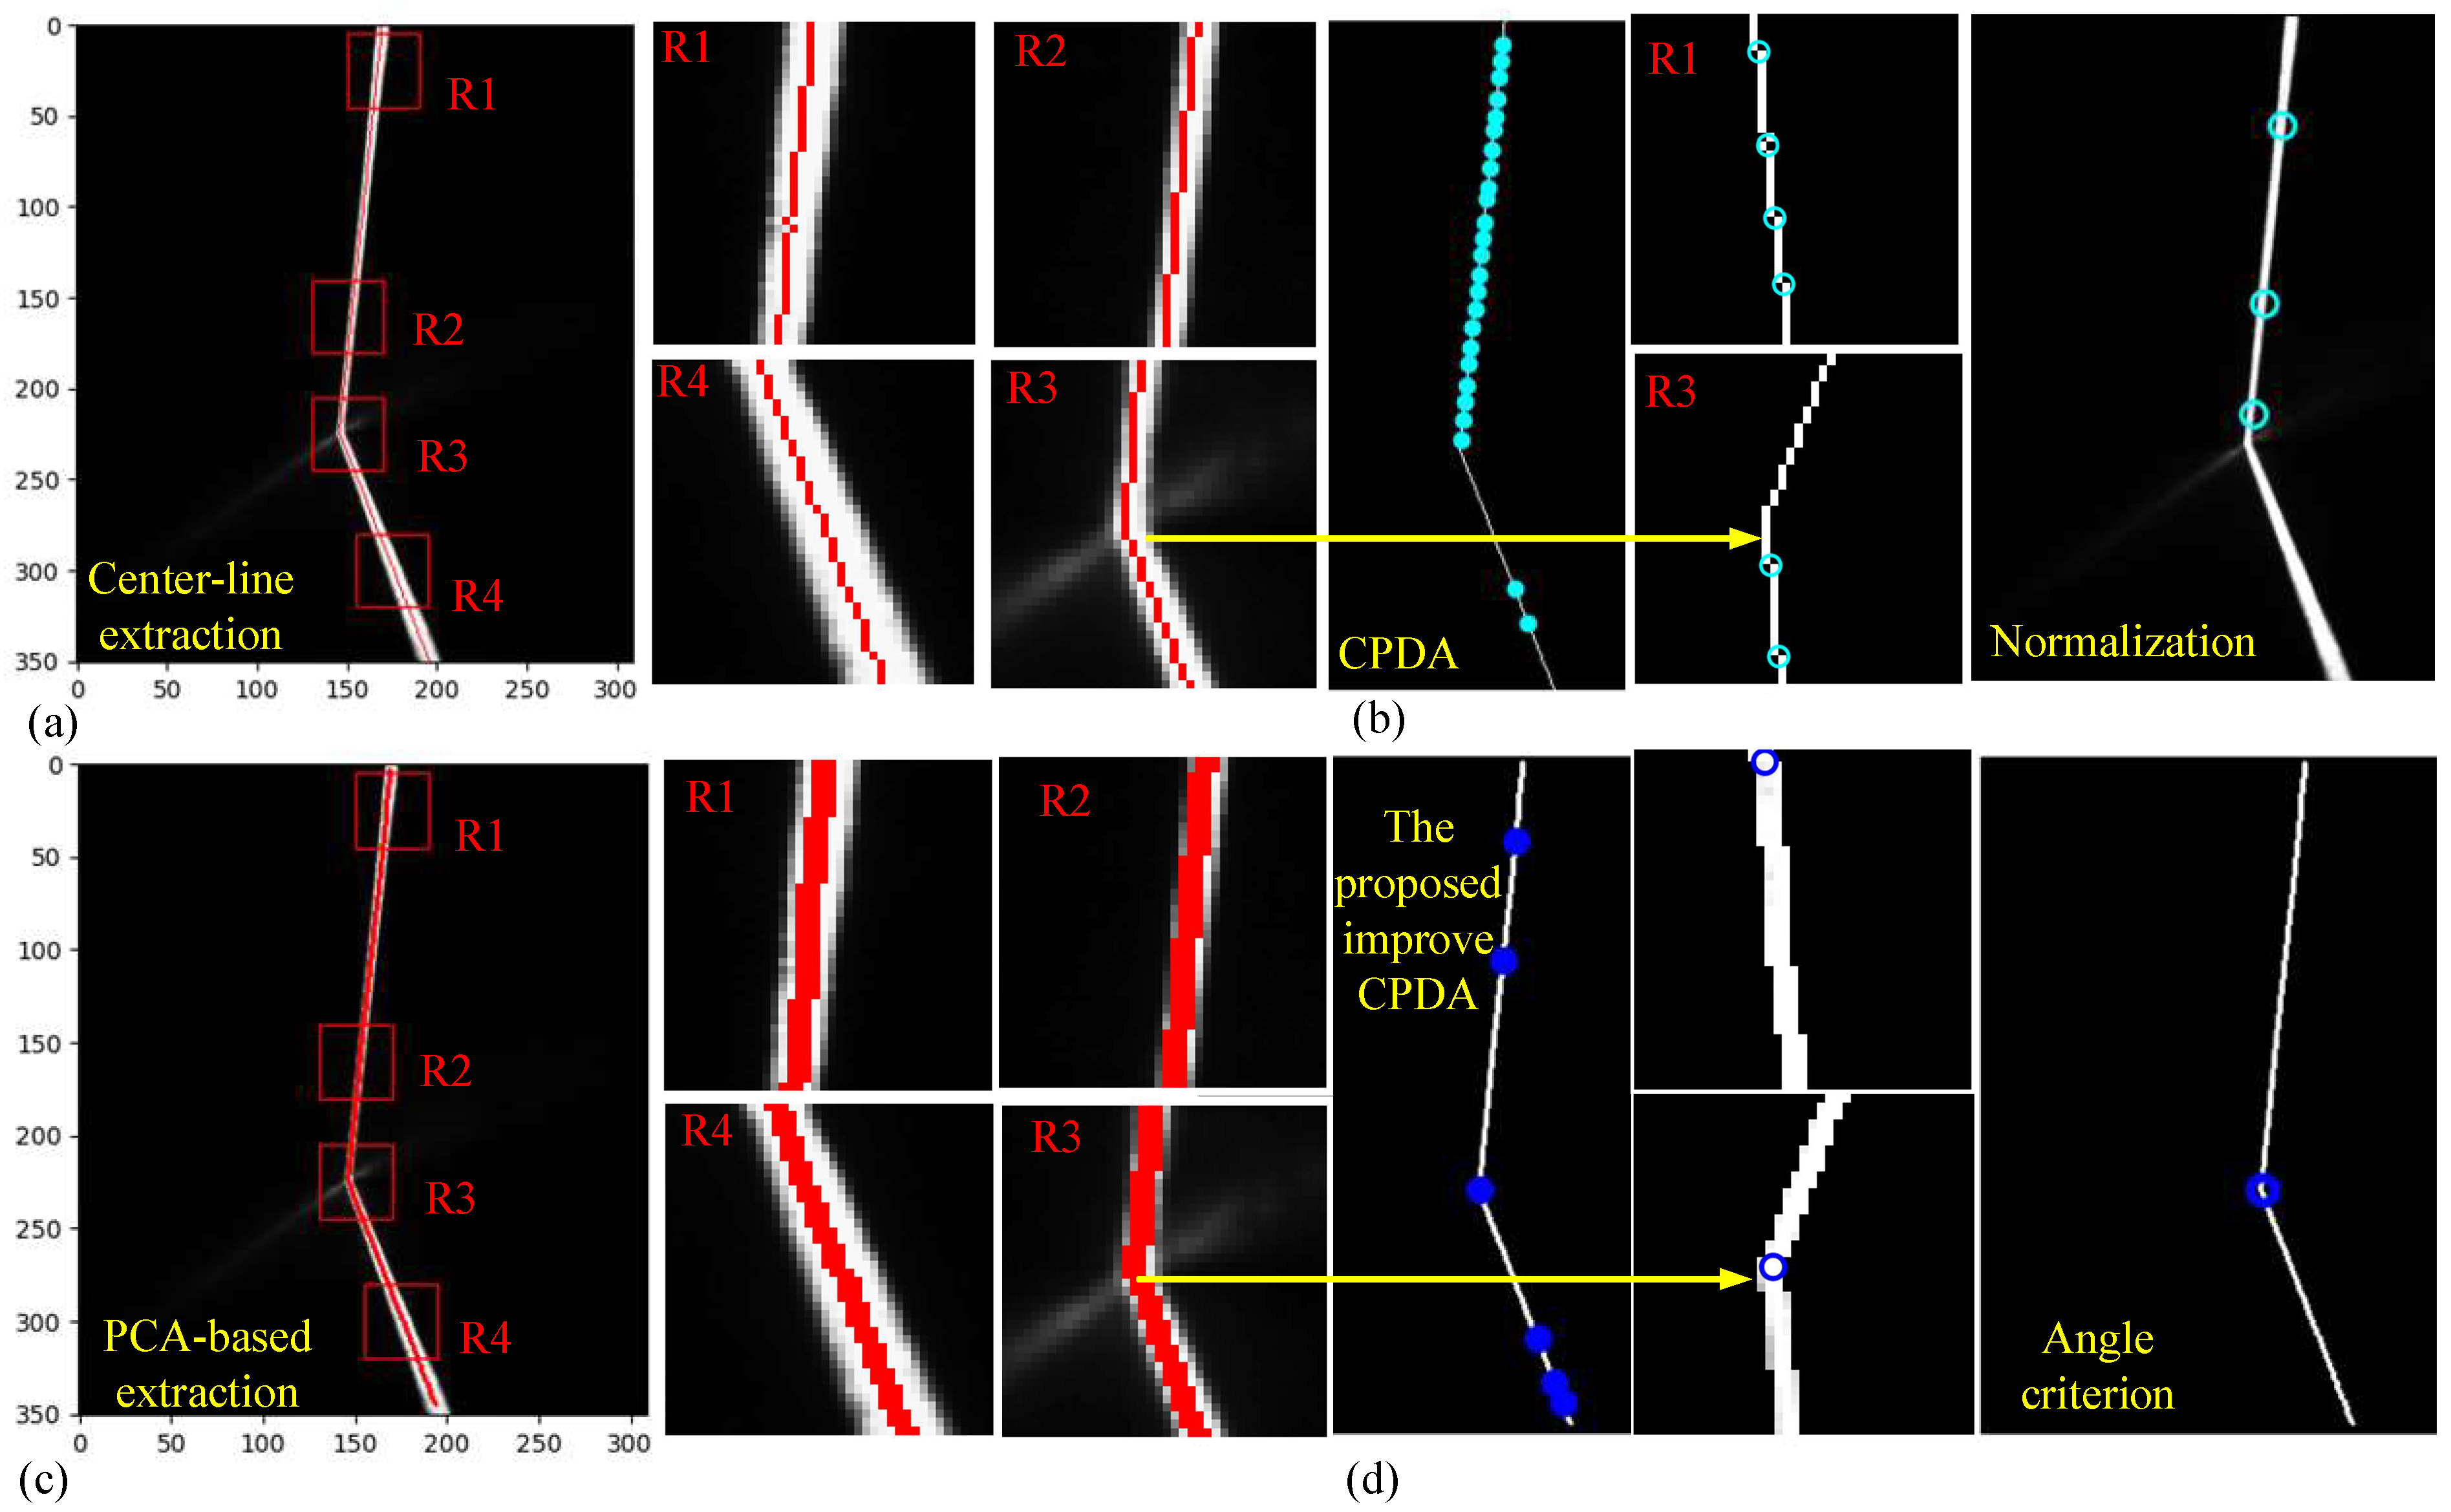
In the context of automated welding for the automatic creation of a 90° fillet weld structure, as shown in Figure 8b using an industrial robot, the primary challenge lies in the precise identification of feature corner points along the projected laser line. With the feature corner points in each image frame extracted with the proposed method, the 3D coordinates of the fillet weld seam can be reconstructed with Equation (1). To validate the effectiveness of the proposed method for extracting the feature corners in automated fillet robot welding, the robot arm was configured to perform a scanning motion from right to left in Figure 8b. During this single pass of scanning, the CCD camera in the sensing unit was set to capture images at a framerate of 12 FPS (frame per second). A total of 120 frame images were experimentally captured for the subsequent validation. An example of one such captured frame image is shown in Figure 9a. As can be found in Figure 9a,b, the discontinuities due to the laser stripe inclination in center line extraction in fillet welding result in many pseudo-feature-corners () being identified using the original CPDA. With the further normalization in Equation (13), some pseudo-corners are removed. However, the closest feature corner is also removed in this process, resulting in inaccurate feature corner identification. In contrast, by integrating PCA into center line extraction in our proposed method in Figure 9b,c, smoother results can be obtained. Furthermore, with the improved CPDA algorithm, more accurate feature corner points are detected. The integration of angle monitoring criteria, as outlined in the flowchart in Figure 5, further enables effective corner point identification in fillet welding. The accuracy and smoothness of laser center line extraction can be further improved by implementing the sub-pixel interpolation technique.
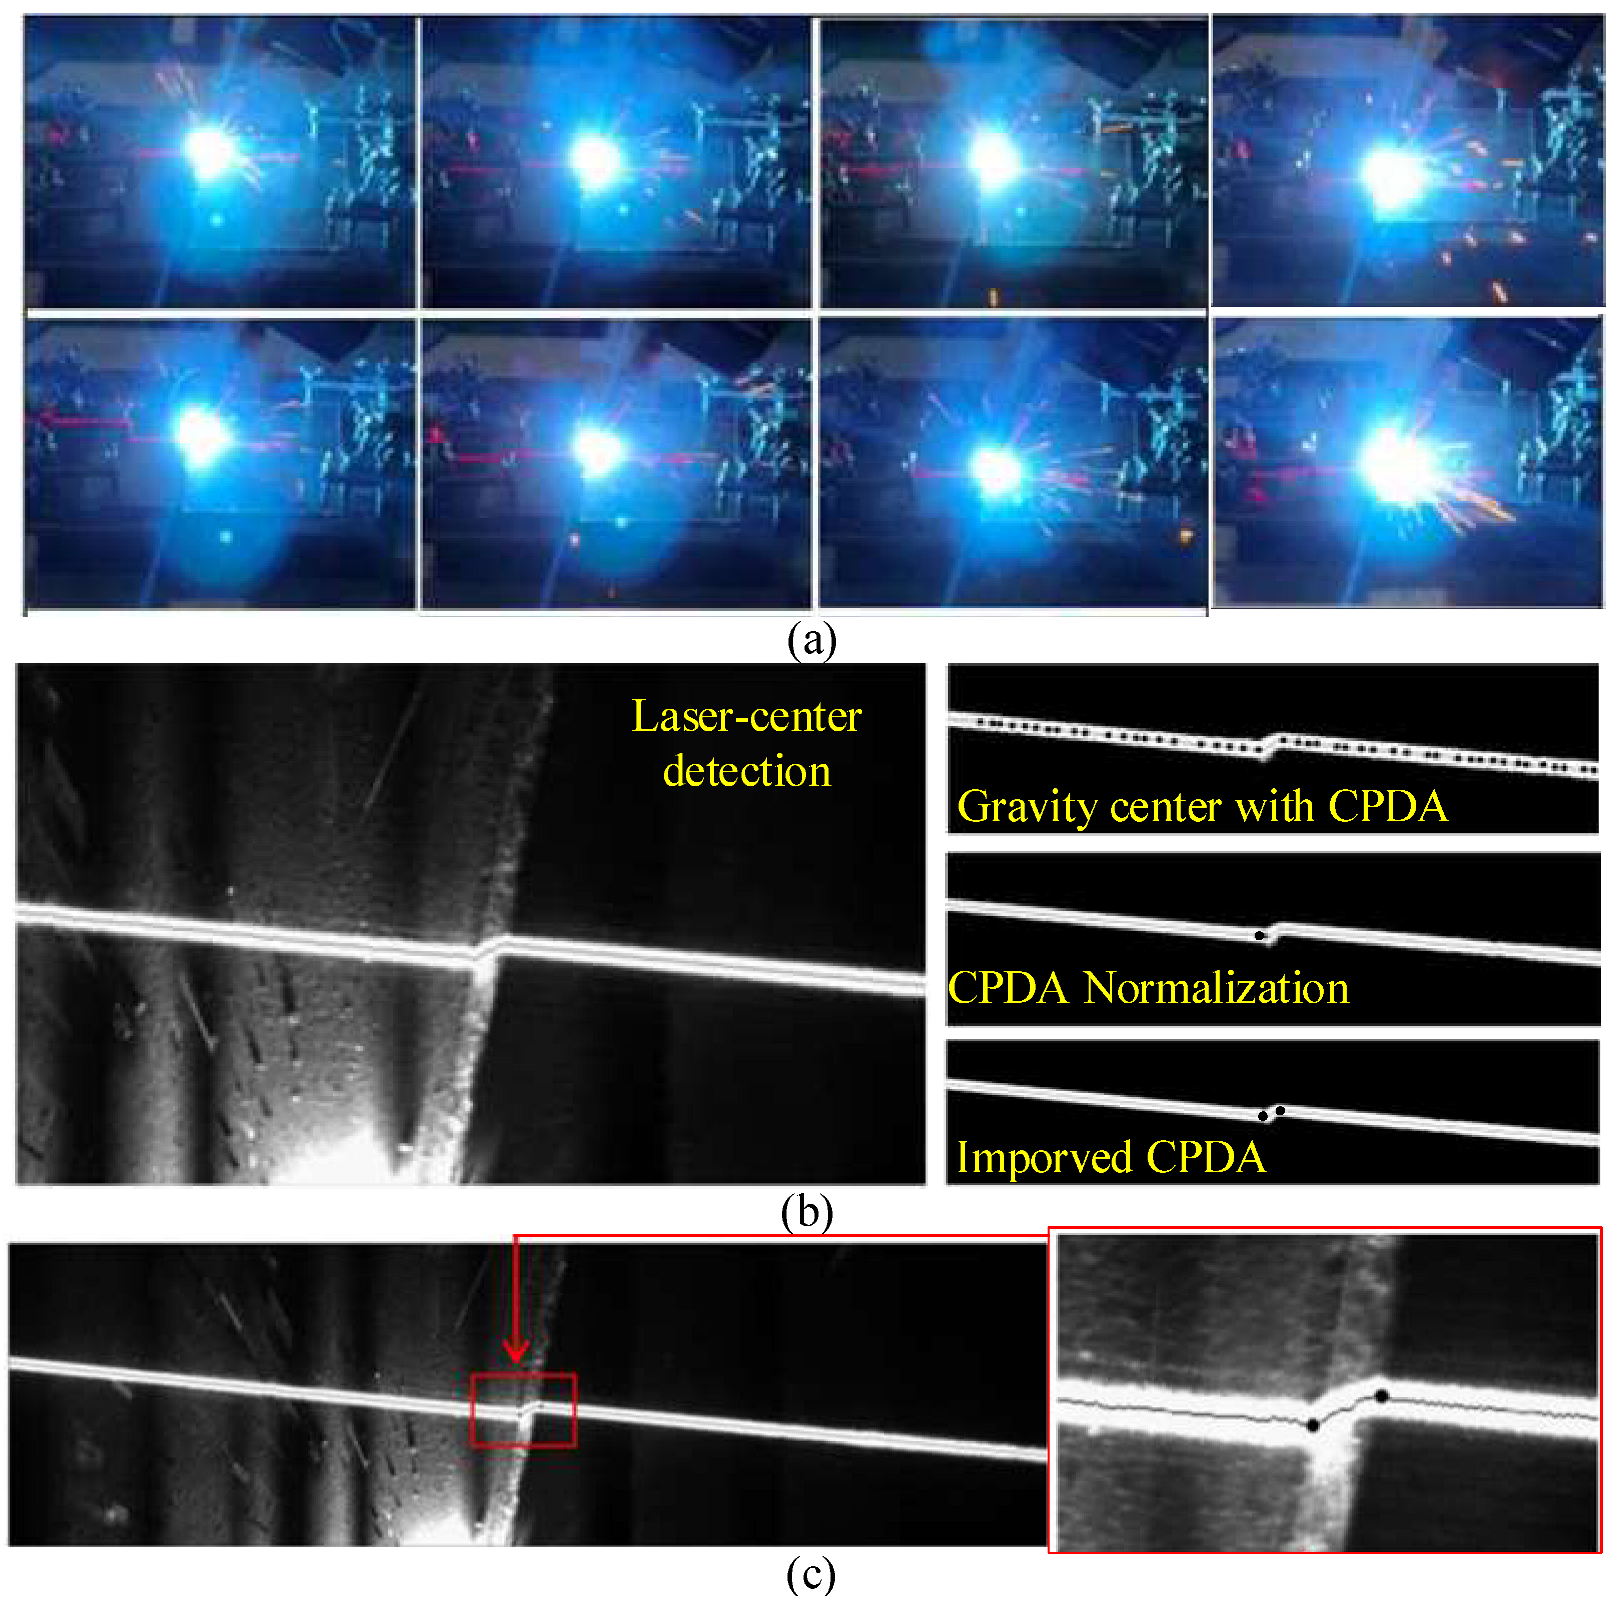
In the experiment of robot welding, a total of 120 captured frame images are collected, both before and after the corner identification. The corner identification result in each frame image is then checked manually. The experimental identification accuracy is then defined as the number of frame (n) with correct and unique identified corners divided by the total number (N) of frames in Table 3. Several experimental findings can be drawn from Figure 10 and Table 3:
-
As shown in the typical captured frame from the CCD camera mounted on the robot in Figure 10a, there is arc lighting interference during welding, resulting in a noisy sensing environment for image processing;
-
With the binarization pre-processing, the laser center line can be easily detected in the left column of Figure 10b. However, when calculating the feature corner points with only the CPDA algorithm, a multitude of pseudo-corners are generated. Moreover, the application of normalization to filter the corners obtained through CPDA results in the omission of some corners;
-
Through the utilization of the proposed method outlined in the flow-chart in Figure 5, missing corners can be effectively restored. And, as shown in Figure 10c, the feature corner points can be correctly extracted in fillet welding for automated robot welding tracking;
-
With acceptable increase in computation time, the proposed method yields significantly higher accuracy compared to the implementation of the CPDA algorithm in Table 3.
An effective method for identifying welding feature points should demonstrate the capability to extract corner features in fillet welding applications with different thicknesses. As shown in Figure 11 and Table 4, the proposed improved CPDA method was validated in thick and thin fillet weld joints. It is worth mentioning that the selection of length-of-chord value L has a great influence on the identification accuracy. Our proposed method has higher than 95% identification accuracy in both these two fillet welding situations that are shown in Figure 11b,c. When implementing the proposed method into a welding robot, the overall welding result on the workpiece is shown in Figure 11d,e. For better demonstration of the welding quality in the fillet joint, the workpiece is rotated by 90° in Figure 11e. As can be seen in Figure 11a,d, the welding torch mounted on the robot arm is accurately guided throughout the whole process, resulting in relatively good welding quality. This validation proves the effectiveness of the proposed method for feature corners identification in automated robotic fillet welding.

5. Conclusions

A feature point identification method that incorporates Gaussian-weighted PCA transformation and CPDA linear polygon approximation is proposed in this paper. Comparative analysis with existing methods for laser center line extraction and feature corner point identification reveals that our proposed method offers higher accuracy in fillet welding scenarios with inclined laser stripes. Even in a noisy environment, the proposed method achieves accuracy levels similar to those of the Hessian-matrix-based method while delivering computation speeds nearly 10 times faster. Consistently achieving an accuracy rate exceeding 95%, the proposed method ensures efficient computation speed by utilizing the PCA determined angle, thus eliminating the need for curvature calculation. The overall calculation time for each frame falls within the range of 0.18 to 0.25 seconds. Furthermore, the polygon approximation method is used to reduce the influence of the noisy welding environment on the pseudo-corner points generation, which further enhances the robustness of the proposed method. Experimental validations in various welding situations are demonstrated, proving the proposed improved CPDA method in identifying feature corner points for automated robot welding. In our future work, we will endeavor to extend the proposed method to identify the 3D location of weld seams across diverse welding joints.

Author Contributions

Conceptualization, Y.H., Y.Z. and M.L.; Methodology, Y.H., S.X. and Y.Z.; Software, C.W. and M.L.; Validation, M.L. and S.X.; Formal Analysis, X.G.; Writing—Original Draft Preparation, Y.H.; Writing—Review and Editing, Y.H. and M.L. All authors have read and agreed to the published version of the manuscript.

Funding

This research was funded in part by [National Natural Science Foundation of China] grant number [52005119]; in part by the [Natural Science Foundation of Guangxi] grant number [2020GXNSFBA297157] and the [China Postdoctoral Science Foundation] grant number [2021MD703864], in part by the [Teachers Research Basic Research Ability Improvement Project of Guangxi] grant number [2023KY0212] and the [Innovation Project of GUET Graduate Education] grant number [2022YCXS012].

Institutional Review Board Statement

Not applicable.

Informed Consent Statement

Not applicable.

Data Availability Statement

The proposed method with computer codes can be found in our GitHub repository (https://github.com/HUGTHAHAHA/IMPROVED_CPDA, accessed on 1 September 2023). The captured 120 frame images in the experiment of robotic fillet welding also can be found in this publicly shared repository.

Acknowledgments

The authors sincerely thank Yanyang Dang and Yong Leng for their helps with the welding robot.

Conflicts of Interest

The authors declare no conflict of interest.

References

  1. Kim, G.-G.; Kang, T.; Kim, D.-Y.; Kim, Y.-M.; Yu, J.; Park, J. Effects of Process Parameters on the Bead Shape in the Tandem Gas Metal Arc Welding of Aluminum 5083-O Alloy. Appl. Sci. 2023, 13, 6653. [Google Scholar] [CrossRef]
  2. Lee, S.-H.; Jeon, H.-C.; Park, J.-U. Reductions in the Laser Welding Deformation of STS304 Cylindrical Structure Using the Pre-Stress Method. Metals 2023, 13, 798. [Google Scholar] [CrossRef]
  3. Eazhil, K.M.; Sudhakaran, R.; Venkatesan, E.P.; Aabid, A.; Baig, M. Prediction of Angular Distortion in Gas Metal Arc Welding of Structural Steel Plates Using Artificial Neural Networks. Metals 2023, 13, 436. [Google Scholar] [CrossRef]
  4. Yu, R.; Luo, W.; Chen, H.; Liu, J. Experimental Research on Dynamic Behavior of Stiffened Plates under Drop-Weight Impacts of a Wedge Impactor. Materials 2023, 16, 3128. [Google Scholar] [CrossRef]
  5. de Leon, M.; Shin, H.-S. Review of the advancements in aluminum and copper ultrasonic welding in electric vehicles and superconductor applications. J. Mater. Process. Technol. 2022, 307, 117691. [Google Scholar] [CrossRef]
  6. Blackburn, J. Laser welding of metals for aerospace and other applications. In Welding and Joining of Aerospace Materials; Elsevier: Amsterdam, The Netherlands, 2012; pp. 75–108. [Google Scholar]
  7. Teslya, N.; Potryasaev, S. Execution Plan Control in Dynamic Coalition of Robots with Smart Contracts and Blockchain. Information 2020, 11, 28. [Google Scholar] [CrossRef]
  8. Wang, B.; Hu, S.J.; Sun, L.; Freiheit, T. Intelligent welding system technologies: State-of-the-art review and perspectives. J. Manuf. Syst. 2020, 56, 373–391. [Google Scholar] [CrossRef]
  9. Hou, Z.; Xu, Y.; Xiao, R.; Chen, S. A teaching-free welding method based on laser visual sensing system in robotic GMAW. Int. J. Adv. Manuf. Technol. 2020, 109, 1755–1774. [Google Scholar] [CrossRef]
  10. Yin, T.; Wang, J.; Zhao, H.; Zhou, L.; Xue, Z.; Wang, H. Research on Filling Strategy of Pipeline Multi-Layer Welding for Compound Narrow Gap Groove. Materials 2022, 15, 5967. [Google Scholar] [CrossRef] [PubMed]
  11. Xu, Y.; Yu, H.; Zhong, J.; Lin, T.; Chen, S. Real-time seam tracking control technology during welding robot GTAW process based on passive vision sensor. J. Mater. Process. Technol. 2012, 212, 1654–1662. [Google Scholar] [CrossRef]
  12. Chen, S.; Liu, J.; Chen, B.; Suo, X. Universal fillet weld joint recognition and positioning for robot welding using structured light. Robot. Comput.-Integr. Manuf. 2022, 74, 102279. [Google Scholar] [CrossRef]
  13. Dinham, M.; Fang, G. Autonomous weld seam identification and localisation using eye-in-hand stereo vision for robotic arc welding. Robot. Comput.-Integr. Manuf. 2013, 29, 288–301. [Google Scholar] [CrossRef]
  14. Dinham, M.; Fang, G. Detection of fillet weld joints using an adaptive line growing algorithm for robotic arc welding. Robot. Comput.-Integr. Manuf. 2014, 30, 229–243. [Google Scholar] [CrossRef]
  15. Wang, T.; Wang, Z.; Cao, Y.; Wang, Y.; Hu, S. A multi-BRIEF-descriptor stereo matching algorithm for binocular visual sensing of fillet welds with indistinct feature. J. Manuf. Process. 2021, 66, 636–650. [Google Scholar] [CrossRef]
  16. Brosed, F.J.; Aguilar, J.J.; Guillomía, D.; Santolaria, J. 3D Geometrical Inspection of Complex Geometry Parts Using a Novel Laser Triangulation Sensor and a Robot. Sensors 2011, 11, 90–110. [Google Scholar] [CrossRef]
  17. Li, G.; Hong, Y.; Gao, J.; Hong, B.; Li, X. Welding Seam Trajectory Recognition for Automated Skip Welding Guidance of a Spatially Intermittent Welding Seam Based on Laser Vision Sensor. Sensors 2020, 20, 3657. [Google Scholar] [CrossRef]
  18. Chen, J.; Wu, X.; Yu Wang, M.; Li, X. 3D Shape Modeling Using a Self-Developed Hand-Held 3D Laser Scanner and an Efficient HT-ICP Point Cloud Registration Algorithm. Opt. Laser Technol. 2013, 45, 414–423. [Google Scholar] [CrossRef]
  19. Wu, K.; Wang, T.; He, J.; Liu, Y.; Jia, Z. Autonomous Seam Recognition and Feature Extraction for Multi-Pass Welding Based on Laser Stripe Edge Guidance Network. Int. J. Adv. Manuf. Technol. 2020, 111, 2719–2731. [Google Scholar] [CrossRef]
  20. Wang, S.; Wang, H.; Zhou, Y.; Liu, J.; Dai, P.; Du, X.; Abdel Wahab, M. Automatic Laser Profile Recognition and Fast Tracking for Structured Light Measurement Using Deep Learning and Template Matching. Measurement 2021, 169, 108362. [Google Scholar] [CrossRef]
  21. Nguyen, H.-C.; Lee, B.-R. Laser-Vision-Based Quality Inspection System for Small-Bead Laser Welding. Int. J. Precis. Eng. Manuf. 2014, 15, 415–423. [Google Scholar] [CrossRef]
  22. Song, Z.; Chung, R.; Zhang, X.-T. An Accurate and Robust Strip-Edge-Based Structured Light Means for Shiny Surface Micromeasurement in 3-D. IEEE Trans. Ind. Electron. 2013, 60, 1023–1032. [Google Scholar] [CrossRef]
  23. Muhammad, J.; Altun, H.; Abo-Serie, E. A Robust Butt Welding Seam Finding Technique for Intelligent Robotic Welding System Using Active Laser Vision. Int. J. Adv. Manuf. Technol. 2018, 94, 13–29. [Google Scholar] [CrossRef]
  24. Wang, N.; Zhong, K.; Shi, X.; Zhang, X. A Robust Weld Seam Recognition Method under Heavy Noise Based on Structured-Light Vision. Robot. Comput.-Integr. Manuf. 2020, 61, 101821. [Google Scholar] [CrossRef]
  25. Shao, W.J.; Huang, Y.; Zhang, Y. A Novel Weld Seam Detection Method for Space Weld Seam of Narrow Butt Joint in Laser Welding. Opt. Laser Technol. 2018, 99, 39–51. [Google Scholar] [CrossRef]
  26. Liu, Z.; Sun, J.; Zhang, X.; Zeng, Z.; Xu, Y.; Luo, N.; He, X.; Shi, J. High-Accuracy Spectral Measurement of Stimulated-Brillouin-Scattering Lidar Based on Hessian Matrix and Steger Algorithm. Remote Sens. 2023, 15, 1511. [Google Scholar] [CrossRef]
  27. Liu, Y.; Zhang, H.; Guo, H.; Xiong, N.N. A FAST-BRISK Feature Detector with Depth Information. Sensors 2018, 18, 3908. [Google Scholar] [CrossRef] [PubMed]
  28. Tang, L.; Ma, S.; Ma, X.; You, H. Research on Image Matching of Improved SIFT Algorithm Based on Stability Factor and Feature Descriptor Simplification. Appl. Sci. 2022, 12, 8448. [Google Scholar] [CrossRef]
  29. Awrangjeb, M.; Lu, G. Robust Image Corner Detection Based on the Chord-to-Point Distance Accumulation Technique. IEEE Trans. Multimed. 2008, 10, 1059–1072. [Google Scholar] [CrossRef]
  30. Liu, T.; Lv, X.; Jin, M. Research on Image Measurement Method of Flat Parts Based on the Adaptive Chord Inclination Angle Algorithm. Appl. Sci. 2023, 13, 1641. [Google Scholar] [CrossRef]
  31. Arko, P.; Jezeršek, M. Automatic Calibration of the Adaptive 3D Scanner-Based Robot Welding System. Front. Robot. AI 2022, 9, 876717. [Google Scholar] [CrossRef]
  32. Sezgin, M.; Sankur, B. Survey over Image Thresholding Techniques and Quantitative Performance Evaluation. J. Electron. Imaging 2004, 13, 146–165. [Google Scholar] [CrossRef]
  33. Li, Y.; Zhou, J.; Huang, F.; Liu, L. Sub-Pixel Extraction of Laser Stripe Center Using an Improved Gray-Gravity Method. Sensors 2017, 17, 814. [Google Scholar] [CrossRef] [PubMed]
  34. Lu, J.; Huang, Y.; Lee, K.-M. Feature-Set Characterization for Target Detection Based on Artificial Color Contrast and Principal Component Analysis with Robotic Tealeaf Harvesting Applications. Int. J Intell. Robot. Appl. 2021, 5, 494–509. [Google Scholar] [CrossRef]
Figure 1. Laser structured-light 3D sensing system. (a) Schematic diagram of structure-light and CCD camera in fillet welding; (b) developed system on robot arm; (c) the obtained laser stripe image from the CCD camera; (d) the 3D reconstruction relation; (e) diagram of triangulation reconstruction.
Applsci 13 10108 g001
Figure 2. Laser stripe processing. (a) Threshold calculation; (b) laser center line determination; (c) original image; (d) pre-processed image; (e) center line extraction.
Applsci 13 10108 g002
Figure 3. Schematic diagram of CPDA calculation of point–chord distance.
Applsci 13 10108 g003
Figure 4. Schematic of (a) linear polygon approximation and (b) angle calculation between feature corner points.
Applsci 13 10108 g004
Figure 5. Flowchart of feature corner points detection with laser center extraction.
Applsci 13 10108 g005
Figure 6. Simulated images. (a) Piece-wise linear line in Equation (14); (b) after dilation operation; (c) after Gaussian convolution; (d) grayscale distribution along x direction.
Applsci 13 10108 g006
Figure 7. Numerical verification. (a) Simulated images with and without noise; (b) grayscale value distribution along x direction; (c) center line extraction results using different methods using image without noise; (d) error comparison using different methods (gravity method [33] and Steger method [26]) using image with noise of σ = 1; (e) average, standard deviation of error and computation time comparison.
Applsci 13 10108 g007
Figure 8. Experimental setup. (a) Welding robot; (b) sensing unit.
Applsci 13 10108 g008
Figure 9. Experimental result analysis (R1–R4 are four selected zoomed-in regions). (a) Center line extraction using grayscale gravity; (b) corner feature point identification using the original CPDA, the identified corners are denoted as cyan dots; (c) center extraction using the PCA-based method; (d) feature corner identification result with the proposed improved CPDA method, the identified corners are denoted as blue dots.
Applsci 13 10108 g009
Figure 10. Experimental result: (a) typical captured frame during welding; (b) image processing results of laser center detection, CPDA, normalization, and feature points merging; (c) final feature points extraction result using the proposed method for automated robot welding tracking.
Applsci 13 10108 g010
Figure 11. Experimental results in robotic welding. (a) 90° thick fillet weld seam with laser line; (b) identified feature corner points in thick fillet welding; (c) identified feature corner points in thin fillet welding; (d) thin fillet weld seam with laser line; (e) the welded thin fillet joint.
Applsci 13 10108 g011
Table 1. Comparison between different methods.
MethodError (Average, std.)Computation Time
per Frame (s)
σ = 0σ = 1σ = 3σ = 5
Gravity method [33] (0.83, 1.22)(4.31, 4.55)(8.43, 8.25)(12.0, 13.2)0.08
Steger method [26](0.45, 0.41)(0.85, 0.7)(3.24, 3.51)(5.23, 4.23)1.2
PCA-based method(0.41, 0.32)(0.52, 0.92)(3.62, 3.42)(6.17, 4.12)0.11
Table 2. Welding parameters.
ParameterValue
Workpiece materialQ235 steel
Workpiece thickness5 mm
Welding current70 A
Welding voltage5 V
Welding speed6 mm/s
Diameter of welding wire 1 mm
Shielding gasAr + CO2
Gas flowrate5 L/min
Table 3. Experimental results from identification of 120 frame images.
MethodNo. of Frames with Correct IdentificationDegree of AccuracyComputation Time per Frame (s)
Gravity center [33] with origin CPDA [29]6856.6%0.18
Our proposed method11696.6%0.25
Table 4. Experimental results from identification of 120 frame images in different welding joints.
Welding TypeL ValueNo. of Frames with
Correct Identification
Degree of
Accuracy
Computation Time per Frame (s)
Thick fillet welding1811595.8%0.18
Thin fillet welding511495.0%0.20
Disclaimer/Publisher’s Note: The statements, opinions and data contained in all publications are solely those of the individual author(s) and contributor(s) and not of MDPI and/or the editor(s). MDPI and/or the editor(s) disclaim responsibility for any injury to people or property resulting from any ideas, methods, instructions or products referred to in the content.