Article

Modeling of Digital Twin Workshop in Planning via a Graph Neural Network: The Case of an Ocean Engineering Manufacturing Intelligent Workshop

1
College of Mechanical and Electrical Engineering, Harbin Engineering University, Harbin 150001, China
2
Sanya Nanhai Innovation and Development Base of Harbin Engineering University, Harbin Engineering University, Sanya 572024, China
3
College of Shipbuilding Engineering, Harbin Engineering University, Harbin 150001, China
4
Tianjin Construction Company, Offshore Oil Engineering Co., Ltd., Tianjin 300461, China
*
Authors to whom correspondence should be addressed.
Appl. Sci. 2023, 13(18), 10134; https://doi.org/10.3390/app131810134
Submission received: 28 July 2023 / Revised: 2 September 2023 / Accepted: 5 September 2023 / Published: 8 September 2023
(This article belongs to the Special Issue Intelligent Production and Manufacturing Systems)

Abstract

:
In the era of Industry 4.0 to 5.0, the manufacturing industry is dedicated to improving its production efficiency, control capability and competitiveness with intelligent enhancement. As a typical discrete manufacturing industry, it is difficult for ocean engineering (OE) manufacturers to accurately control the entire production process, and the establishment of an integrated system supported by digital twin (DT) technology is a better solution. This paper proposes a comprehensive set of system architectures for the DT workshop. It focuses on planning, which is the main line of control, to establish a model based on graph neural networks (GNNs) and suggests five decision-support approaches associated with the model from a practical application perspective. The utilization of complete twin data for prediction and visual simulation effectively eliminates the problem of unexpected factors interfering with scheduling in enterprise production planning and achieves the goals of rapid processing and just-in-time completion. The planning model is based on the attention mechanism, which characterizes the disjunctive graph, extracts the input GNN, and outputs the scheduling decision by constructing the multi-attention network of operations and machines to deal with the complicated “operation–machine” combination relationship. The proposed method has been verified in the case of structural assembly and welding workshops, has validity and reliability, and is superior to the traditional priority scheduling rules and heuristics in terms of precision rate and rapidity. Furthermore, the DT system completes the production line application, and its proven reliability supports its full-scale application in future smart factories.

1. Introduction

The synchronization of rapid Artificial Intelligence innovation and the transformation and upgrading of the manufacturing industry is underway. Numerous companies are eliminating outdated capacity and creating a new generation of smart factories by introducing a large number of automated equipment, establishing production process simulations, and developing manufacturing execution systems. The Digital Twin (DT) workshop is driven by real-time data [1], is the representative of the subsequent generation of manufacturing and information technology integration [2] and is steadily evolving into the best intelligent solution. A DT system can integrate the entire range of production chain components efficiently in order to better address the management challenges of discrete manufacturing industries, such as a large amount of production data, high data maintenance workload, extensive product non-standardization, and reliance on manual experience. The productivity improvements have been wholly proven for the mainstream DT systems, such as Siemens Tecnomatix [3] and Dassault’s 3D Experience [4], piloted in civil engineering, robotics manufacturing, aerospace, and other fields. Prior to full commercial application, it is necessary to establish a reliable data processing model for the interaction of simulated and actual measurement data to achieve iterative optimization of the DT system.
Ocean Engineering (OE) manufacturing, a giant system engineering in discrete manufacturing mode, is developing late in the field of digitalization and has completed the networking and upgrading work of crucial equipment in recent years, lacking the ability to process and apply a large amount of production data to guide the optimization of production processes, and is in urgent need of a systematic, intelligent control framework for the whole production process. The OE manufacturing process is complicated and involves the intersection of multiple disciplinary fields, specifically material pretreatment, cutting, plate assembly, welding, and assembly, as shown in Figure 1. Considering two modes of the production process, human–machine collaboration and fully automated operation of equipment, the architecture must be designed according to the actual conditions and process routes when establishing the DT workshop. In this paper, based on the five-dimensional model proposed by Tao, Fei, et al. [5], we refine the operational behavior state criterion and real-time mapping under the finite state mechanism according to the integrated operation mode of structural assembly and welding workshop, and combine the feasible approaches in practice from several research papers [6,7,8,9] to design the architecture of OE intelligent workshop implementation, covering equipment layer, acquisition layer, data layer, application layer and presentation layer.
Compared with the DT system architecture utilized in the conventional manufacturing industry, this paper considers the data transformation process among multiple systems and the compatibility of multiple types of equipment due to the lack of production line flexibility in large-scale construction projects. Independent design for various degrees of digitization in the production process. For example, in the pre-processing, cutting, and part of the welding stages of full automation, the DT system is arranged to participate directly in the production process through the inter-system output instructions to organize the production, and the production status is presented with direct access to the system. In the manual phase, the DT system is responsible for issuing tasks, and each station receives the request to complete the work via a variety of terminals. The implementation of DT has had a revolutionary impact on the optimization of process workflows in OE assembly and construction. The core of DT is full-factor data-driven production process prediction and optimization to guide the operation execution and collect actual data for operation analysis to fulfill the timely adjustment in the execution process, not just a simple visualization display. The work in this paper is geared towards developing companies with large-scale engineering, where all-around compatibility and utilization of existing resources are the crucial roles of the proposed DT architecture.
Job planning, as the lifeblood of production control, determines production efficiency and capacity. The primary emphasis of establishing a DT workshop is to implement a twin data-driven planning methodology. In this paper, we propose an algorithmic model for job planning based on Graph Attention Networks (GATs), an improved version of GNN. Different from the traditional Priority Dispatch Rules (PDRs) and heuristic algorithms, a GAT extracts features from the disjunctive graph model in the scheduling problem, and outputs constraint-compliant “operation–machine” combinations from the set of operations and the set of machines based on the Markov Decision Process (MDP) to form the decision sequence. Among them, the weight parameters in a GAT are obtained by deep reinforcement learning (DRL) performing small-sample training. This is one of the latest mainstream algorithms in recent years, and most studies [10,11,12,13,14,15,16] have developed solutions for standard arithmetic cases, on the basis of which this paper completes customized development for the characteristics of the OE workshop and case validation based on actual production data. Its high performance, excellent computational effect, and ability to adapt to maintain rapidity computation under a large amount of data input from the DT system are the main reasons why it is selected instead of PDRs and heuristic algorithms in this paper, as compared with the traditional algorithms. Moreover, the GAT model enables effective interfacing between knowledge graphs and expert systems in the future, making it a superior optional method.
The DT workshop planning model is trialed under the scenario in the standardized test datasets and the OE manufacturing workshop. The scenario, as the critical node in the production chain of an OE smart factory, is capable of covering the production elements of the whole factory. The case validation is centered around ensuring the high availability of both the DT system and its associated model. There are prerequisites for this industry in the scenario, and the case validation can give a part of the reference of executable solutions to the peers.
In general, this paper makes the following contributions:
  • We design the DT workshop system architecture in detail, form a targeted five-dimensional model for OE intelligent manufacturing workshops, and create an integrated discrete operation workshop management model with “virtual-real co-drive”.
  • We present a novel model for the DT workshop planning that utilizes GNN. Our method realizes generating the workshop’s master plan that exhibits good generalization capabilities. This is achieved through node embedding, graph attention network structure building, and a deep reinforcement learning-based algorithm for model training.
  • Drawing upon the proposed GNN model, our research expands upon the discourse surrounding five distinct decision support techniques aimed at resolving production-related issues, with the ultimate objective of augmenting the efficacy of the planning model.
  • The feasibility of the model is verified, and a demand-oriented DT system is created for workshop job execution. We optimize the limitations of the current production mode by focusing on the critical development of DT technology and the efficient use of twin data—not just the simple interaction of visual simulation models.
The remainder of this paper is structured as follows: We detail previous theoretical literature reviews on DTs and GNNs in Section 2. The architecture of the DT Workshop System is briefly defined in Section 3. Section 4 proposes the graph attention network structure to solve the modeling problem of the DT workshop planning and extends the discussion of five decision support methods in Section 5. Section 6 summarizes the case validation results and discussion. Finally, conclusions and future work are presented in Section 7.

2. Literature Reviews

2.1. Digital Twin

The concept of Digital Twin (DT) was first proposed by Michael Grieves [17] when discussing the digital representation of physical objects or processes throughout the product lifecycle management. The theory originated in the aerospace field, where NASA introduced the “flying twin” for flight training and simulating spacecraft status [18]. Subsequent research further clarified the implementation of multidimensional and multi-attribute simulation models for monitoring and prediction functions by integrating multiple systems and high-precision sensors [19]. As simulation and Model-based Systems Engineering (MBSE) continue to develop, the DT field has expanded into industrial production and become a widely researched hotspot in recent years [20]. Establishing a digital twin workshop is the most fundamental and important research direction for manufacturing. F. Tao and M. Zhang [21] proposed a completely new workshop operation model. They summarized five essential elements of DT workshop composition, focusing on the perception access of heterogeneous multi-source data and the fusion ability of “human–machine–thing–environment”, i.e., all elements. Guo et al. [22] proposed a modular approach to construct a digital twin of the factory, considering frequent changes in the factory design stage. Designers can rapidly evaluate different designs and positively identify design defects. In the production stage, DT can improve the predictability and controllability of the production process. Zhang et al. [23] designed a control framework based on DT to address the problem of plan-based decision-making and control mechanisms that are inapplicable to uncertain production states by introducing optimal state control theory into the virtual layer and ensuring the production system is in the best state through dynamic matching mechanisms and hierarchical goal-cascading methods.
Workshop-oriented digital twin modeling is a systematic implementation of current researchers’ achievements in the DT key technologies and has formed a set of methodologies. In 2013, Lee [24] designed a coupled model for monitoring machine conditions, performing predictive analysis based on industrial big data, and improving management transparency. As a physical product twin for design and manufacturing, B. Schleich et al. [25] provided a thorough reference model based on the surface model form idea. They described the conception, representation, implementation, and application of the model throughout the product’s lifetime. Sun et al. [26] used DT technology to anticipate assembly process dependability and optimize assembly accuracy by using twin assembly data, the assembly and debugging full-element model, and iteration between virtual and actual assembly. Current research has concentrated on data collecting, heterogeneous data conversion, and model data matching in the data processing layer. There is still a large study area for data application and service of DT. This paper spotlights the data application modeling of intelligent services after the completion of data processing in the DT system.

2.2. Graph Neural Network

With the advancement of deep learning in recent years, the Graph Neural Network (GNN), a novel deep learning model, has drawn more and more attention. The GNN aims to map nodes and edges on the graph structure to low-dimensional vectors, i.e., output low-dimensional vectors for both the graph and nodes through artificial neural networks [27]. Unlike traditional deep learning models, such as Convolutional Neural Networks (CNNs) and Recurrent Neural Networks (RNNs), GNNs can handle the graph structure’s interaction information of nodes and edges. A GNN usually has a multi-layer structure, and each layer can calculate different features, thus being adaptable to different application scenarios [28]. The GNN was first proposed by Gori et al. [29] and was extended using RNN. In subsequent studies, two branches were developed: spectral domain and spatial domain. To solve the irregularity of spatial neighborhoods, J. Bruna et al. [30] introduced the Spectral Graft Theory to decompose the Laplacian matrix of the graph, obtained eigenvalues and eigenvectors, and then performed convolution operation. This is the starting point of the spectral-based GNN.
To deal with the high complexity, M. Defferrard et al. [31] proposed the ChebyNet, which defined the convolution kernel as a polynomial and used Chebyshev expansions to approximate the convolution kernel for efficiency improvement. Based on this, T.N. Kipf and M. Welling [32] further simplified the model by using a first-order approximation convolution kernel, forming the Graph Convolutional Network (GCN). In the spatial-based GNN, which is a recent research hotspot, there are mainly the Gate Graph Neural Network (GGNN) [33] that replaces the recursive neural network node update method, the Graph Attention Network (GAT) [34] that defines graph convolution with attention mechanism, the GraphSAGE [35] which inductive learning, and the message passing neural network (MPNN) [36], which unifies the message passing mode. Considering the outstanding cross-domain properties of graph neural networks and the fact that the current server computing power has reached the basic requirements based on the generalization ability of GNNs, introducing GNNs into the data application process of the Digital Twin workshops can effectively achieve decision support.

3. Architecture of DT Workshop System

An extensive analysis of physical entities, operational behavior, information transfer, and interaction rules is necessary for the development of the Digital Twin (DT) system for the Ocean Engineering (OE) manufacturing execution process, which is a complex system engineering involving many disciplines, resources, and technologies. The current OE production process generally adopts an integrated construction model, which collects huge amounts of materials, equipment, personnel, storage, and other elements. On the basis of satisfying the production line simulation, designing a DT workshop architecture covering the “Humans–Machines–Materials–Rules–Environments” is the first step of production data application modeling.

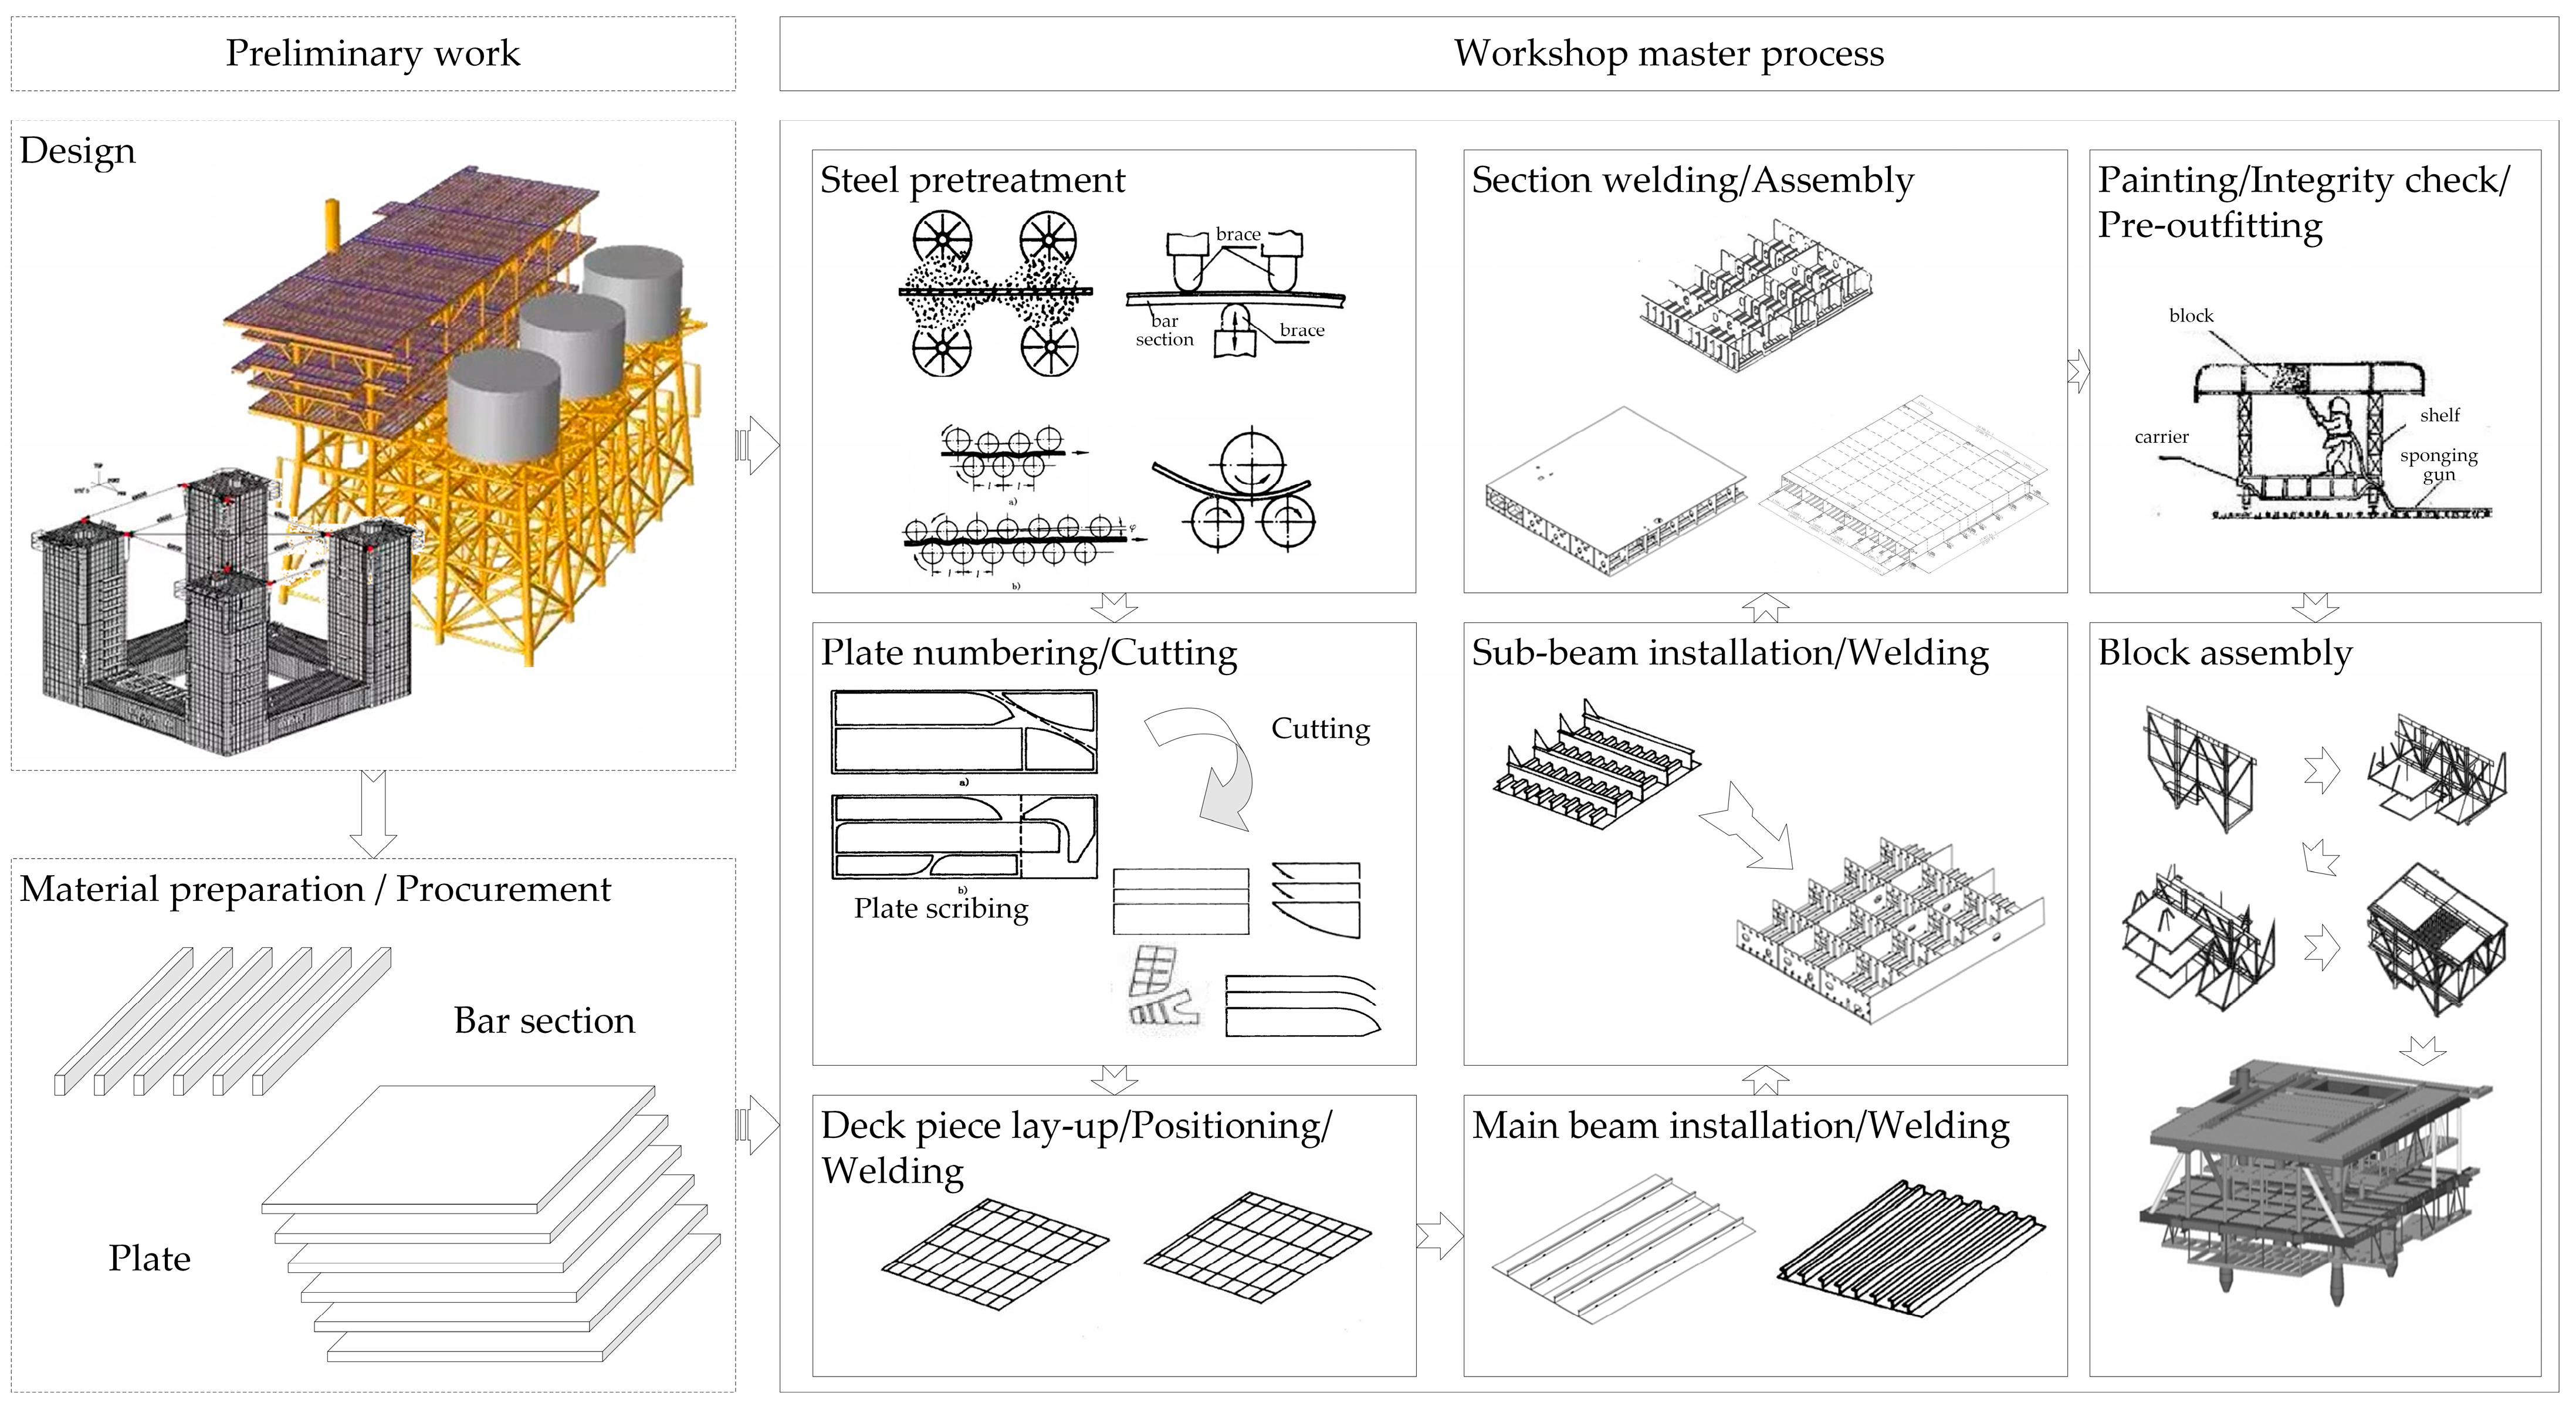
3.1. Intelligent Workshop Integrated Manufacturing Execution Mode

As the basic unit of offshore platform construction, the assembly and welding workshop is based on the principle of grouping technology, with the intermediate product as the guide, and production is organized by area, with the platform deck as the base and outfitting as the core, and the “structure–outfitting–painting” operations are separated in space and ordered in time to realize the integration of design, production, and management [37]. The integrated operation mode is balanced and continuous, avoiding the traditional mode of independent and uncoordinated production links, reducing the simultaneous cross-work of multi-disciplinary construction, and simplifying the work packages interface and the interference between different types of work.
The integration manufacturing execution mode has extremely strict requirements on the production data chain. As shown in Figure 2, the five major elements surrounding the operation of the workshop are associated with dozens of forms. They are intertwined with design, planning, materials, equipment, storage, quality control, and other professions. In the intelligent workshop, in addition to cranes, welding torches, material pallets, and other manually operated equipment, there are automatic plate-cutting machines, gantry-type welding robots, CNC pipe-cutting machines, automatic plate winders, material conveyors, uncrewed transportation vehicles, and other automated uncrewed equipment. In general, more than 60% of the equipment is networked. In the construction process, the operators adopt the workshop-level plan as the main line. Each workstation completes the processes of material collection, plate assembly, welding, and inspection according to the work order and provides progress and quality information in real time. Structural and quality experts simultaneously verify the weld quality and global strength properties of completed assemblies across multiple stations, in hours, to form production master data under a time series. With the addition of digital devices, data-aware collection devices, and simulation models in the smart shop, the conversion and integration of multidimensional heterogeneous data demand to be realized under a unified and customized architecture. A standardized production database relying on the model proposed in Section 4 enables optimizing production quantities, balancing operational tasks, improving equipment utilization, reducing energy consumption, etc.

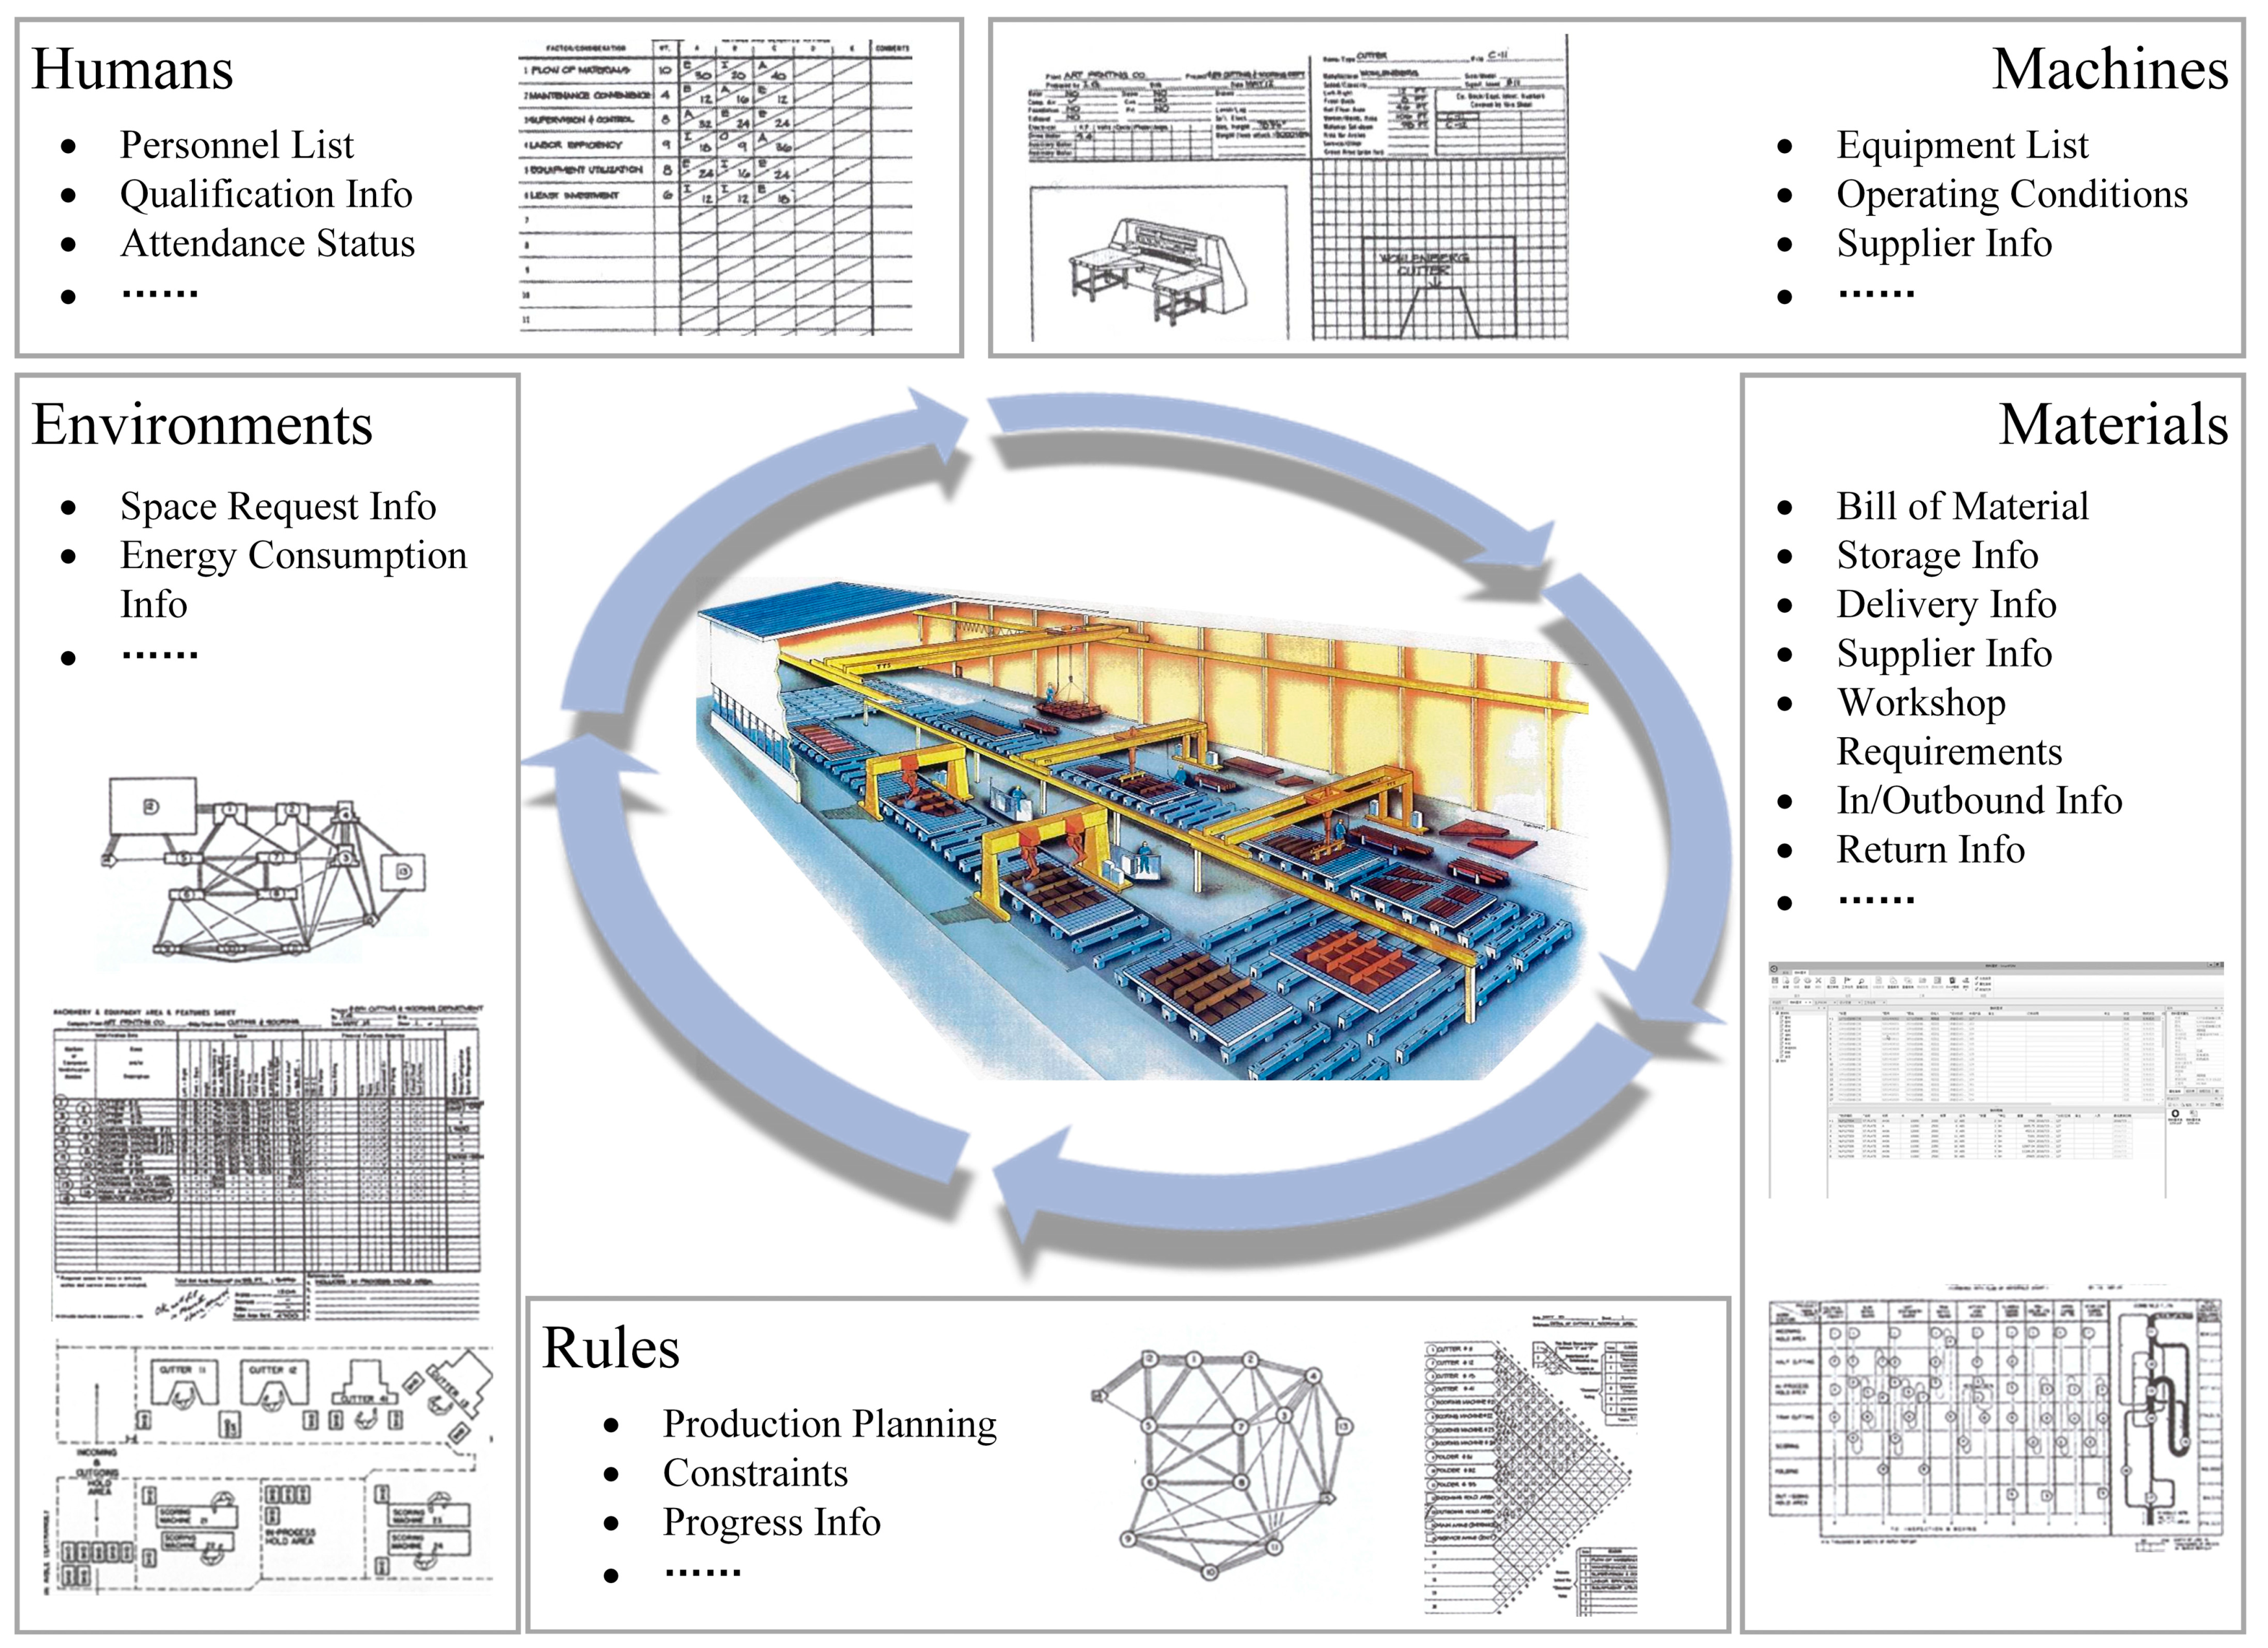
3.2. Design of DT Workshop Architecture Based on Five-Dimensional Model

Based on the five-dimensional model concept proposed in the literature [5], this paper designs the ocean engineering manufacturing DT workshop architecture as shown in Figure 3. The architecture unfolds from the 5D model, including Physical Entities ( P E ), Virtual Objects ( V O ), DT Data ( D D ), Connections ( C N ), and Application Services ( A S ), whose vector format can be expressed as Equation (1).
M D T _ w o r k s h o p = ( P E , V O , D D , C N , A S ) T
In the implementation of the digital twin workshop, five dimensions correspond to the Equipment Layer, the Data Acquisition Layer, the Service Drive Layer, the Application Service Layer, and the Digital Twin Display Layer, with each layer corresponding to handling various complex tasks. The architecture from the bottom up specifically includes:
  • Equipment Layer
This is the collection of physical entities. By establishing data tables for all production elements in the workshop, distinguishing fully automated uncrewed equipment from manually operated equipment by categories such as equipment, supplies, and buffers, forming information labels for corresponding entities, establishing fields for equipment status, operators, supplier information, consumables spare capacity, etc. These allow real-time mapping with subsequent operational processes to complete DT data input to equipment operation as well as actual measurement data feedback to DT console. The vectorized representation of P E is shown in Equations (2)–(5).
P E = ( E , M , A , ) T
E = ( N o . , E q u i p m e n t N a m e , S t a t u s , O p e r a t o r , S u p p l i e r , A m o u n t , ) T
M = ( N o . , M a t e r i a l N a m e , A m o u n t , S u p p l i e r , ) T
A = ( N o . , A r e a N a m e , L o c a t i o n , S i z e , ) T
where E represents the equipment, M is the material, and A is the area, each containing their respective detailed properties.
  • Data Acquisition Layer
This layer collects or uploads shop operation execution data through sensors, surveillance cameras, QR codes/RFID, etc., and develops heterogeneous data interfaces to link the equipment layer with the service driver layer. The scope of data collection includes, but is not limited to, equipment operation data, transportation process awareness, material information tracking, equipment status feedback, environmental monitoring, etc. The data interface development workload is enormous and requires one-to-one customization to be completed based on multiple models, protocols, and standards of the equipment to form a data chain for real-time transmission. An enormous quantity of basic work is a necessary component of constructing the DT workshop. The integrity and standardization of the collected data determine the operational efficiency and calculation accuracy of the service driver layer. The vectorized representation of the data connection process is exemplified by Equation (6).
As the central layer of the digital twin system, the service drive layer is responsible for data reception, conversion, and application. The data is accessed by the equipment layer feedback and digital twin emulation via interfaces to the Enterprise Services Bus and Data Warehouse. The data integration component standardizes the multi-source heterogeneous content in the database and updates the master database based on the information provided by the real-time mapping. The standardized production data is available to be input into the GNN-based DT workshop model to obtain the manufacturing execution plan with workshop schedule and optimal allocation of multiple resources. All data are uniformly stored in the data warehouse within this layer, and the logical model serves as the control core to integrate the DT model with the actual data, providing a unified description and encapsulation of geometric properties, physical properties, operational behaviors, and simulation rules for each production-related physical entity. When instantiated virtual objects receive iterative data updates, their information updates can be quickly completed in the logical model. The service drive layer of DT data support can be expressed as follows:
D D = ( D P E , D V O , D A S , D K , D Δ ) T
where D P E represents the physical workshop’s actual measurement data, D V O is the virtual object simulation data, D A S means the application service output data, D K represents the process knowledge base data, and D Δ represents the data fusion-derived data.
  • Application Service Layer
This layer supports the operation and maintenance of digital twin system applications. Based on the twin data and service drive layer, it is oriented to the workshop planning, work time, progress, resources, quality, storage, and energy control needs, extracting critical data in the logic model and supporting the realization of decision support functions. Intelligent workshop managers and workers can access application services through multiple clients. Taking the specific business of the welding workshop as an example, the application service provides block assembly and welding scheduling optimization, welding work time forecasting, steel resource demand analysis, sub-section quality traceability, storage availability analysis, logistics consolidation and distribution, energy consumption analysis, and other intelligent algorithm solutions. In the future, functions such as the welding process knowledge base and high-precision control of workshop equipment can be further expanded. The application services can be expressed as follows:
A S = ( S S c h e d u l i n g , S W o r k h o u r s , S Re s o u r c e s , ) T
where S means the data set corresponding to each service.
  • Digital Twin Display Layer
Visualization of system functions is the significant feature of this layer, which is the only layer that the users of the digital twin system visualize. The application module proceeds from the simulation model of the virtual workshop and enters the business module by selecting the workshop components. The business module displays the functional indicators of the workshop and the product information based on the data analysis results of the application service layer, specifically including the decision board, data analysis reports, the product DT simulation, workshop monitoring, etc. The functionalities of the digital twin display layer are realized entirely based on the integrity data of the virtual objects, whose vectorized form is:
V O = ( G V O , P V O , B V O , R V O ) T
where G V O corresponds to the geometric model, P V O is the set of physical attributes, B V O means the quantitative representation of the operational behavior, and R V O represents the rule model.
In a nutshell, the demand-oriented digital twin workshop architecture is based on the theory of the five-dimensional model, which is theoretically feasible and practically usable and sufficiently satisfies all elements of workshop production control. It realizes the comprehensive digital in the whole cycle of assembly and welding operation. With the logical model as the core and all production elements interlinked, the five-layer architecture materializes the iterative cycle of “DT data simulation guidance—actual measurement data optimization” based on the data chain.

3.3. Transfer Rules for Manufacturing Execution Behaviors under Finite State Mechanism

In contrast to a traditional workshop, the DT workshop enables the synchronization of the presentation of dynamic executions on virtual objects. The various types of platform assembly and welding operation behaviors require uniform quantitative transfer rules to complete the abstraction of production actions. In accordance with prior research [38,39] on Finite State Machines (FSM), which can guarantee the integrity of operational behaviors and state transfer in the workshop, the behaviors of workers and machines during assembly and welding operations could be categorized into a finite set of states.
In the instance of welding operations, there are standby, operational, and shutdown states for a single welding robot. The standby state is usually at the beginning or end of the task, as in Figure 4, S 0 and S 1 , which are transient states, while the continuous processes of operation and shutdown states are expressed as S r u n and S s h u t d o w n . The transition of the state depends on the trigger event a , which returns the event response information r after the completion of the state transition. Specifically, when the workstation receives a work order, it first confirms that the welder is in the S 0 available state. The DT system issues a welding start command to the instantiated object according to the task trigger a , enters the S r u n welding operation state, and confirms the receipt of r . After the task is completed, the equipment enters the S 1 completion state. If there is equipment downtime, insufficient material and other termination conditions, enter S s h u t d o w n until the repair is complete to restore the equipment to S 0 .
The states and commands of the equipment at each workstation in the workshop are integrated into the database in the form of a time series, enabling simultaneous simulation at the data twin display layer and direct issuance of commands to the machine at the equipment layer. Behavioral information is transmitted between the device layer and the digital twin model in order of task priority, and the “First-In-First-Out” principle is adopted when the same level is available. When conflicting data occurs, operation instructions are suspended on the equipment side, and simulation data are backed up and pushed to the system operator for confirmation. Transmission rules are the standard for interaction between the equipment layer and the digital twin model. Simplistic rules decrease the frequency of conflicts and provide robustness for the system’s daily operation, but standardized operation training for system participants is required to reduce the risk of interaction errors.

3.4. Real-Time Mapping of Workshop Processes

Multidimensional data fusion is the cornerstone of ensuring the reliability of virtual objects. The authenticity of the production process simulation relies on the comprehensive description of the actual environment. The multidimensional dynamic data is associated with physical entity properties via real-time mapping to support the operation of the service drive layer. Real-time mapping subjects are predominantly workpieces, equipment, workers, production environment, and production knowledge. At the physical entity side, multiple types of unstructured data (e.g., contracts, drawings, notifications, etc.), multi-device collection data, multi-resource structured forms, and existing systems (e.g., MES/ERP/WMS, etc.) are blended in each production stage, which standardization data based on association mapping algorithms is critical.
The mapping logic utilizes tagging. The workpiece/intermediate product forms a set of virtual tags, including product size, processing information, work order information, processing worker information, and other collections based on their self-encoding. During the work execution, operation behavior information and state transfer data are recorded synchronously to provide a process traceability interface. According to the rules of operation behavior transfer, the real-time mapping of equipment is stored with each piece of equipment corresponding to an independent database, and the digital twin system enables the virtual processing process to be launched according to the data so as to monitor the production quality. Workshop operations-oriented environment-aware data take the form of setting sensitive parameter thresholds in the mapping process due to the excessive amount of data and only convert and store records of environmental change periods. The knowledge data are scattered in the existing systems of the enterprise, where interfaces are established with the digital twin system for labeling transformation and storage by process category.
The real-time mapping process consists of three phases. Firstly, the initialization is completed, the corresponding interface is launched, the form information is verified, and the information on virtual workshop equipment, environment, and workers is adjusted to be consistent with the physical entity. Subsequently, the real-time mapping operates, and the background activates data mapping transmission monitoring to promptly adjust and make up the data for the interfaces with package loss. Finally, completing the data handling and the massive production data are used as the input of the service drive layer and application service layer to support production decision-making, scheduling optimization, abnormality warning, etc., which are specifically researched in Section 4 and Section 5. The schematic diagram of the real-time mapping of workshop operations is shown in Figure 5.
The manufacturing execution behavior transfer rules and the workshop process real-time mapping are the fundamental operations in the DT system development, which are indispensable links to support the simulation operation and provide feasibility guarantees for the introduction of subsequent mathematical models and the application of decision support methods.

4. DT Workshop Planning Modeling Based on GNN

This section proposes a DT workshop Planning model based on a Graph Neural Network, which aims to address the problem of twin data-based master production schedule generation and dynamic optimization. Planning is the pivotal segment of offshore platforms from design to fabrication, with the primary task being calculating the critical path of the assembly and welding process by combining the real-time multidimensional attribute data provided by the DT system, which obtains the full job duration and forms a schedule Gantt chart. Considering the high performance of GNNs in processing graph structure data, it is capable of solving the NP-hard problem effectively in the face of flexible process route mesh diagrams with plan, equipment, and resource integration.

4.1. Traditional Mathematical Model

Traditional planning methods perform mathematical modeling based on business requirements, integrating optimization objectives and constraints that are solved using, for example, heuristic algorithms. Considering that GNN models are trained to adapt the network parameters to the strategy of the target, the purpose of traditional mathematical modeling is to provide a planning reference benchmark to the neural network. The operational task of the Ocean Engineering manufacturing workshop is mainly the assembly and welding of blocks. The operational processes are material pre-treatment, cutting, coiling, plate assembly, welding, and others, which correspond to multiple networked pieces of equipment with different functions but capable of participating in multiple processes. Considering that the workshop has the characteristics of process flexibility and equipment flexibility, as well as the requirements for efficiency and energy cost, the planning of assembly and welding operations should be defined as an optimization problem for the flexible job shop.
Specifically, shop floor operations can be summarized as a process plan of size N × M , where N is the number of workpieces and M is the number of machines. There are multiple process routes for each part being machined, and the critical path needs to be solved to meet the makespan optimal objective, that is, to minimize the maximum completion time. The mathematical model containing the objective function is shown in Equation (9).
F = min { c m a x }
where c m a x represents the makespan. It is the time difference between the start and completion of all processes, with each process’s completion time being non-negative, illustrated in Equations (10) and (11).
c m a x = max 1 i N { c i , j = P i l , k }   k [ 1 , M ]
c i , 0 = 0 ,   c i , j > 0   i , j
the constraints include:
l X i l = 1   i [ 1 , N ]
k = 1 M Z i j l k = 1   i [ 1 , N ] , j [ 1 , P i l ] , l [ 1 , G i ]
( X i l × Z i j l k ) s i j l k ( X i l × Z i j l k ) ( s i j l k + t i j l k )
( X i l × Z i j + 1 l k ) s i j + 1 l k ( X i l × Z i j l k ) ( s i j l k + t i j l k )
where Equation (12) represents the multi-flexible process routes of a workpiece that is uniquely selectable, Equation (13) restricts a process to allow only one selectable device to be selected, Equation (14) indicates a machine constraint that only one process is performed at a time and Equation (15) acts as a process constraint, expressing that multiple process operations cannot be completed on the same workpiece at the same time. The definitions and descriptions of the symbols are listed in Table 1.
Prior to solving the model, the following assumptions are required to ensure that:
  • One machine operates only one process of one workpiece at the same time;
  • All the equipment is available at the starting moment;
  • The locations of the segments in the workshop are close to each other without considering the transfer time between different processes;
  • The equipment is available at all times, regardless of breakdowns;
  • The process has no other influence to interrupt the processing.

4.2. Graph Neural Network Structure

Recently, there has been a significant surge in scholarly inquiry regarding the utilization of Graph Neural Networks (GNNs) in conjunction with Deep Reinforcement Learning (DRL) for the purpose of resolving workshop job scheduling problems [10,11,12,13,14,15,16,40]. This approach is regarded as one of the most efficient computational methods for optimizing scheduling. In contrast to traditional heuristic rules and metaheuristic algorithms, which require computation under the objective function and constraints of the previous section, the priority scheduling rules (PDRs)-based sequential decision problem is turned into a Markov decision process (MDP) by training GNN parameters through DRL. This approach incorporates the optimization objectives and constraints into the reward mechanism, thereby achieving the generalization of the scheduler. This methodology can effectively decrease the computational burden of each scheduling computation while maintaining solution precision and enabling the repeated utilization of GNNs with stability subsequent to a solitary training iteration. Consequently, this methodology has the potential to significantly mitigate the substantial burden on the computing capacity of the planners’ personal computers during the plant’s planning phase and delegate the computationally intensive tasks to the server for execution. Furthermore, a server-side interface might be devised to retrieve real-time progress and work time information from jobs gathered in the DT system and incorporate it into the training sets. These can serve as an effective foundation for updating status or action values in subsequent rounds of training.
Combining the DT workshop foundation and job planning requirements, this paper proposes a planning framework based on a graph attention network (GAT) and DRL, as shown in Figure 6.

4.2.1. Disjunctive Graph

The use of a disjunctive graph is an intuitive method for describing workshop planning, which expresses the operations and machine attributes in a flexible job shop using graph-structured data. For a workshop scheduling environment with m machines and n workpieces, the disjunctive graph is represented as G = ( O , C , D ) , and where G represents the directed graph, and O = { O i j | i , j } { S , T } denotes the set of nodes corresponding to the operation time and the start/end time points of each job. C is a subset of n edges, indicated by solid lines representing the processing path from S to T for all operations. D is composed of multiple undirected disjunctive arcs, representing that a certain process can be completed on a certain machine. Under the flexible feature, an operation can be completed by any available machine. The plan-solving process involves determining a disjunction arc at each node, fixing the direction, and forming the workpiece processing sequence for a certain machine. After the scheduling calculation is completed, the disjunctive graph is converted into a directed acyclic graph, and the scheduling target is to select the least total operation time among multiple directed acyclic graphs.

4.2.2. Markov Decision Process

The MDP is a method that transforms the conventional workshop scheduling process into a five-tuple S , A , P ( s | s , a ) , r , γ to describe it. The five elements within the tuple correspond to the state, action, state transfer function, reward, and discount factor of the scheduling calculation, which are important parameters for the realization of the DRL-based scheduling decision process. The decision-making process is performed by discerning whether there is a combination of process o i j that needs to be scheduled and idle machine m k at each time point t within the planning time T p . The ( o i j , m k ) is transformed into A ( t ) input to the agent and obtains the reward r ( t ) from the environment at the current S ( t ) , which based on the makespan value. Finally, a complete plan scheme with the total operation time is obtained after several iterations. The detailed MDP definition is as follows.
(1) State. State definition is the pivotal aspect of solving scheduling problems by graph representation learning, and it is also the crucial step for feature extraction in a large-scale schedule optimization problem. The scheduling process state encompasses three types: completed operation, operation in progress and operation to be scheduled. Let the operation, device and action correspond to O ( t ) , M ( t ) and A ( t ) , respectively, and determine S ( t ) according to the decision step t together with the scheduling environment. By extracting the feature values of each element, the state S ( t ) forms a set of multidimensional feature vectors, including but not limited to operation features h o i j R 8 , o i j O ( t ) , machine features h m k R 5 , m k M ( t ) , and action features h ( o i j , m k ) R , ( o i j , m k ) A ( t ) .
To be specific, the operation features consist of eight-dimensional parameters, which are the operation status label (Whether to complete scheduling, 0—no, 1—yes), process time p i j k (the value of an unscheduled operation is the average of the completion times of that operation on all available machines, i.e., p i j k ¯ = m k M i j ( t ) p i j k / M i j ( t ) ), start time s t i j ( t ) (the start time is s t i j ( t ) = s t i l + p i l k when the preorder operation has been scheduled, otherwise it is estimated recursively according to s t i j ( t ) = s t i l ( t ) + p i l k ¯ ), remaining process time (Unscheduled operation is 0), completion time, latest deadline, operation waiting time and the number of remaining operations J i . The 5-dimensional machine features contain machine status (Available or not, 0—no, 1—yes), machine operating time, number of operations to be processed, waiting time and remaining processing time. The action feature corresponds to the operation–machine combination feature, taking the value of the process time p i j k for selecting machine k for the o i j . S ( t ) integrates the static and dynamic attributes of the scheduling process, which can be updated in a timely manner by the data acquired by the DT system, enabling a genuine realization of adaptive scheduling in the actual business of the workshop.
(2) Action. The action space A ( t ) , which is in a dynamic change process at each decision time, contains all feasible combinations of ( o i j , m k ) . Each action execution process first selects an eligible action o i j for which the predecessor operation has been scheduled, and then randomly picks a set of compatible combinations with available machines under this operation. During the candidate action set confirming action a ( t ) , the ( o i j , m k ) search space is narrowed down according to the operations priority and machine capacity constraints in conjunction with the invalid action masking [10] technique to achieve a more efficient output.
(3) State transition. At the time of T p ( t ) , when the agent executes the action a t , it determines ( o i j , m k ) as well as completes sampling, updating the state s t + 1 s t based on the scheduling environment. During the state transition, the disjunctive arc ascertains the direction depending on the selected machine m k ; meanwhile, the feature values of O ( t ) , M ( t ) and A ( t ) are updated. The decision-making time moves to T p ( t + 1 ) , which is the moment when the operation is concluded.
(4) Reward. The setting of the reward value r t depends on the scheduling objective, i.e., makespan denoted by c m a x , and takes the value of the difference between the completion time of the current state s t and the next state s t + 1 in Equation (16). As shown in Equation (17), maximizing the cumulative reward when γ = 1 is equivalent to minimizing the completion time.
r t = c m a x s t c m a x s t + 1
t = 0 | O | 1 r t = c m a x s 0 c m a x s | O |
where c m a x s 0 is a constant when t = 0 .
In the case of t > 0 , the scheduled o i j is available to calculate the reward value based on the completion time c i j , while the unscheduled operation replaces c i j approximately by calculating the sum of the completion time of the previous process and the work hours of the current process according to the method proposed in the literature [40], as shown in Equations (18) and (19).
C i j = C i ( j 1 ) + m i n k M ( t ) p i j k
C i 0 = 0
(5) Policy. The policy of the scheduling agent belongs to the category of stochastic policy, and the policy π ( a t | s t ) is the probability distribution of the scheduling action set A ( t ) , derived by the actor-critic network before the training process of policy parameters π for achieving optimal cumulative rewards, which later in this section, guiding the probability of the agent to choose a t A ( t ) in a certain state s t .

4.2.3. Graph Attention Network

The core of a GNN in solving scheduling problems is to embed operations and machine features, fix undirected arcs in the disjunction graph to form a job decision sequence, and ultimately obtain the maximum completion time. As shown in Table 2, current mainstream network structures mainly include traditional multi-layer GNNs, graph isomorphism networks (GINs), and heterogeneous graph neural networks (HGNNs), each of which has been adapted and innovated for the specific scheduling environment. Considering that the OE workshop requires dynamic adjustment of the number of operations and machines in each scheduling cycle based on the resource and machine information fed back from the DT system, the GAT eliminates the concern for multiple graph structures compared to GIN & HGNN, has simple data structures, and has the redundancy to handle large amounts of input data, adopting a GAT can effectively avoid the situation that the neural network is misaligned by the training parameters due to the non-uniform scheduling scale.
A GAT aggregate neighboring node is featured through the attention mechanism, and performs weight updates for each node and its first-order neighbor weight information. Where, the Graph Attention Layer (GAL) aggregates the graph containing the node feature vectors H = { h i R d | i [ 1 , N ] } and outputs the new feature vectors h i , for each node [34]. The correlation between neighboring nodes, as a scalar, can be obtained using a fully connected layer with an activation function of LeakyReLU, as shown in Equation (20).
e i j = LeakyReLU ( a T [ W h i W h j ] )
where the weight parameter is a R 2 d ( l + 1 ) , W R d ( l + 1 ) × d ( l ) represents the weight parameter of the node feature transformation in the layer and is the splicing operation. The correlation of node v i and all first-order neighbor nodes N ( v i ) are normalized based on Softmax function as shown in Equation (21), meanwhile, the new node feature vector h i , is derived from Equation (22).
α i j = softmax j ( e i j ) = exp ( e i j ) v k N ( v i ) exp ( e i j ) = exp ( LeakyReLU ( a T [ W h i W h j ] ) ) v k N ( v i ) exp ( LeakyReLU ( a T [ W h i W h j ] ) )
h i , = σ v j N ( v i ) α i j W h j
From the perspective of avoiding model performance degradation associated with different scheduling scales during the OE workshop planning, as well as efficiently selecting the appropriate machine among the multi-competitive relationships, this paper adopts a similar scheme as in [40], as shown in the GAT section of Figure 6, to construct a multi-head operation attention network and a multi-head machine attention network, respectively. The operation network receives inputs of operation features and outputs a new feature sequence of operations to be scheduled based on finite constraints. The machine network assigns available devices to each operation based on each machine’s operating status and process requirements with sufficient consideration of priority relationships. Collectively, the two networks form a complete GAT, and the output operation and machine features are stacked and pooled in L -layers to generate global features for the entire scheduling instance. The following describes in detail the computational process of the single-layer network at decision step t .
(1) Operation Node Embedding. In the same job, the operations are restricted by the existence of pre/post constraints on the process requirements, and the determination of the execution time for each operation depends on the node as well as the inherent attributes of the neighboring nodes, such as the priority level. Based on the aforementioned attention coefficient calculation method, for each operation o i j , it is necessary to analyze their attribute values for both the pre operation o i , j 1 and the post-operation o i , j + 1 in the operation attention network to obtain the attention coefficients for that operation. Taking the current operation o i j with its post-operation o i , j + 1 as an example, the coefficient e i , j , j + 1 calculation process is shown in Equation (23). Over the entire job, which usually has start/end nodes as well as some operations with no pre- or post-operation, a dynamic mask is used uniformly to cover their attention coefficient. As in Equation (21), the attention weights are obtained by normalizing all coefficients utilizing the Softmax function. Eventually, by the weighted linear combination of the input features W h o i l as well as the feed-forward updating of some weights and following the computation of the nonlinear activation function σ , the feature vector h o i j , of operation o i j is obtained as shown in Equation (24).
e i , j , j + 1 = LeakyReLU ( a T [ W h o i j W h o i , j + 1 ] )
h o i j , = σ l = j 1 j + 1 α i , j , l W h o i l
where l denotes the neighboring process of process j , and | l j | 1 .
Leveraging the data interaction between the multilayer networks, the operation o i j related parameters transferable to each related operation in this job.
(2) Machine Node Embedding. Machine node embedding is more complicated than operation nodes, considering that one operation can correspond to multiple machine executions. In the case of unscheduled operations o i j N t ( m k ) ( N t ( m k ) denotes the set of operations that can be processed by the idle machine m k ); the first step is to filter the machines based on their status, operation processing time, etc. to acquire a unique “operation–machine” combination. Hence, prior to computing the attention coefficients of each machine, the original feature vectors with their associated operations and “operation–machine” combination are expanded to obtain v i j k = h o i j | | h o i j , m k R 9 and the linear transformations W M R d × 5 and W O R d × 9 are set up in synchronization. It can be concluded that for a machine m k attention coefficient is calculated as Equation (25).
e i j k = LeakyReLU ( b T [ W M h m k W O v i j k ] )
For each machine, the effect of the self-attention coefficient additionally be considered before computing its new feature vectors, i.e., Equation (26).
e k k = LeakyReLU ( b T [ W M h m k W M h m k ] )
Eventually, the attention weights α i j k and α k k are obtained by normalizing e i j k and e k k based on the Softmax function and the feature vectors of the machine are successively solved, as shown in Equation (27).
h m k , = σ α k k W M h m k + o i j N t ( m k ) α i j k W O v i j k
(3) Multi-head Attention Mechanism. The multi-head attention mechanism provides an effective enhancement of the feature representation as well as the model self-learning capability of operation and machine attention networks. In this paper, this method is invoked in GAT, which is part of the procedure to realize the superior generalization ability of GNNs for different scale scheduling problems, and its computational principle is shown in Figure 7.
Specifically, by passing operation or machine features to the query, key and value, K attention heads are set up to individually form attention blocks with different parameters, which are able to compute the attention coefficients in parallel. The output is fed back to the aggregation operator for splicing, as shown in Equation (28). The averaging operator with σ activation is executed after the last layer of network computation completes to obtain efficient feature expression results. The method ensures that localization is preserved without affecting the global features.
h o i j , = k = 1 K σ o i j O α o i j W h o i j
(4) Pooling. The mentioned GAT exports a set of features h o i j ( l ) and h m k ( l ) at each single layer. When l = 1 , the operation and machine feature are determined by the original feature values. In addition, the “operation–machine” combination is consistently input to the original features during calculating in each layer. After stacking the L layers, the ultimate outputs h o i j ( L ) and h m k ( L ) are used in the subsequent decision network. The whole scheduling features are spliced based on the mean pool of operation and machine features as in Equation (29).
h T o t a l ( L ) = [ o i j O h o i j , ( L ) O m k M h m k , ( L ) M ]
(5) Decision Making: Actor-Critic Algorithm. Following the acquisition of the graph representation, policy network development is the culminating step in the fulfillment of the decision support. The main purpose of the policy network is to emit a feasible action a ( t ) and obtain the reward value r t of that action to form an optimal sequence of actions. The actor-critic algorithm is compatible with variable-size attention models and is a superior method for achieving scheduling decisions. While the actor network and the critic network each correspond to a Multi-Layer Perceptron (MLP), the former task is interacting with the scheduling environment to generate a priority index μ ( a t |   s t ) in the first step, and in the second step, to randomize the policies π θ ( a t |   s t ) based on the expectation distribution solved by the Softmax function, described in Equations (30) and (31). For the action a t = o i j , m k operation features, machine features, global features, and “operation–machine” combination feature information have been fused.
μ ( a t |   s t ) = M L P θ h o i j ( L ) h m k ( L ) h T o t a l ( L ) h o i j , m k
π θ ( a t |   s t ) = e x p ( μ ( a t |   s t ) ) b t A ( t ) e x p ( μ ( b t |   s t ) )
The latter network objective aims to collect the value function ν ϕ ( s t ) during the actor network’s interaction with the environment to recognize the action’s merits and demerits. The actor-critic advances the state transition process through the continuous execution of actions by the agents until the total operation scheduling has been completed, with the objective function and the total loss function for each agent as in Equations (32) and (33).
L t C I L P θ = E t ^ m i n ( R t θ A t ^ , c l i p ( R t θ , 1 ε , 1 + ε ) A t ^ )
L t θ , ϕ = c p L t C I L P θ + c e L t E θ c v L t V θ
where R t θ = π θ ( a t |   s t ) / π θ o l d ( a t |   s t ) stands for the ratio of the probability distributions between the old and new policy, A t ^ represents the dominance estimation function, and ε denotes the amount of fluctuation control. The total loss function is the weighted sum of the objective function with its entropy and mean square error, c p , c e , c v represent the loss coefficients, respectively.

4.3. Model Training

The proposed model employs the MLP to implement both state representation learning and strategy learning. In order to better the GAT fit the optimal solution with superior generalization, the training process is completed using the Proximal Policy Optimization (PPO) [41] algorithm based on the actor-critic structure to achieve network parameter updates. PPO, as an easy-to-implement policy gradient algorithm, is the current solution to similar problems in the mainstream approach. The fast convergence and output strategy stability compared to other deep reinforcement learning algorithms is proven in [41], adopting the easy-to-implement PPO algorithm is far more suitable for other algorithms.
The pseudo-code of the training algorithm is illustrated in Algorithm 1. Both the actor network and the critic network adopt MLPs, which represent policies and states, respectively. ν ϕ is obtained by inputting state embedding values passed to GAT. Training operations are executed after I iterations, in which the loss function is solved and the model parameters are updated in PPO update steps K . In addition, a set of policy validations is fulfilled every ten iterations in the test sets.
Algorithm 1: The PPO-based training procedure
Applsci 13 10134 i001

5. DT Workshop Planning Model-Based Decision Support Methodology

In a broad sense, the workshop Master Production Schedule (MPS) management includes the production forecast and execution decision of the next stage of the workshop. On the basis of the GNN-based planning model, this section expands data availability and supports dynamic decision-making of the whole production process by combining the large amount of time series data formed by the DT workshop. Specifically, in the planning aspect, the job schedule is dynamically optimized according to the real-time progress of the DT system, and in the resource aspect, the job bill of materials (BOMs) is associated with the enterprise resource plan, and the resource procurement, storage, and distribution plan is optimized in the reverse direction from the workstation demand, to realize the workshop operations’ work time accuracy and resource equalization.

5.1. Work Hours Forecasting

The colossal assembly and welding workloads are determined by the intricate design of OE platforms. The operators’ estimation of their working hours is inaccurate due to the twin effects of the learning effect, including operation proficiency, and the deterioration effect, including fatigue degree. The errors’ cumulative effect severely hampers the execution rate of the workshop plan. Hence, it is essential to anticipate labor hours using DT.
Based on the previous study [42], the measured data access and the forecasted data output are additional elements in the work hours forecasting framework, as shown in Figure 8. The measured data from the data acquisition layer of the DT framework is input to the work hours quota database and the process route database, and K-means-based clustering analysis of welding processes is performed according to the operational characteristics to evaluate the work hours quotas according to the classification of different types of welding processes with various difficulties. The evaluation method uses a slack-based measure model in data envelopment analysis to update the time quota O P i for the process type i according to the planned data and execution data and to evaluate the validity. Finally, according to the same type of process over time iteration of work time rules, the formation of dynamic standard work time allows MPS to achieve highly reliable data input. Equation (34) shows the prediction model W H F M ( P O T i , f t i ) for work hours of welding operations with welding characteristics as the independent variable.
W H F M ( P O T i , f t i ) = f ( O P i )
subject to:
min ( f t i )   i [ 1 , N ]
min ( P O T i + f t i A O T i )   i [ 1 , N ]
min i = 1 N P O T i + f t i A O T i
where P O T i is planned operating time, A O T i represents actual operating time, and f t i stands for floating time. f ( O P i ) is a recursive equation based on Graph Long Short-Term Memory (Graph LSTM):
f ( O P i ) = σ ( W f o p i ( t ) + U m ( i , k ) f h i k ( t 1 ) + b f )
where W stands for the weights, U for the weight matrix to be trained, m ( i , k ) indicates the relationship type label between nodes, h for the hidden vector, and b for the training bias.

5.2. Resource Demand Forecasting

With the granularity refinement of the DT system, the resource demand forecast originates from the demand side of the operators, and the workshop resource plan and the enterprise resource plan are backed up in time with the progress of each workstation’s assembly and welding operations. In contrast to the traditional resource supply mode, in which the top level conducts the whole resource plan and breaks down BOMs to the basic operation units, the real-time demand and buffer capacity of each workstation will be dynamically adjusted along with the manufacturing execution status to ensure the quantity and period of material supply, such as plate, steel, and welding material. The limitation of demand forecasting is the uncertainty of manufacturing progress and the uncoordinated procurement/storage plan with the workshop schedule.
There are two stages of demand forecasting from the operation execution side: material demand clustering and quantity forecasting. Firstly, the material demand clustering is based on the steel, welding material and equipment necessary for each workstation in the process of job execution to establish the attribute class rules to complete the clustering analysis. Given that R = { r 1 , r 2 , , r i , , r n } is the set of material resource demand, and k attributes exist under each material, the material attribute matrix is obtained as follows:
( r i ) n × k = r 11 r 12 r 1 k r 21 r 22 r 2 k r n 1 r n 2 r n k
c = c min ( c ) max ( c ) min ( c ) × 100 %
S ( c i , c j ) = d i s t ( c i , c j ) = l = 1 k ( c i l c j l ) 2
To reduce the impact brought by different quantiles, the material attribute matrix is normalized by Equation (40) and then solved for the similarity of demand at different workstations. As in Equation (41), the higher the similarity, the smaller the Euclidean distance value, representing the high demand for certain types of resources at certain workstations and the need to increase the advanced procurement and supply of this type of resource.
The second step is quantity forecasting based on the work orders and BOMs of each workstation to count the demand of each type of resource combined with the real-time capacity of the material buffer monitored by the DT system. In addition, the material ratio must be outputted according to the clustering results of the dependence of each workstation on different materials, and the relevant information must be adjusted in MPS and Enterprise Resource Planning (ERP) in time.

5.3. Resource Bottleneck Identification

Resource bottlenecks are an important factor affecting the continuity of operations. Dynamic resource bottleneck identification methods and optimization of manufacturing resources [43] have been explored in many studies, and the feasibility and practicality of bottleneck identification analysis are further enhanced with the support of the Digital Twin. In the event that the sensor identifies fluctuations in the amount of material in the operation area or buffer, the bottleneck identification method timely pushes the operation blocking node to the DT system and triggers the rapid adjustment of MPS and ERP.
The bottleneck identification calculation mainly includes resource state, device state, and buffer state characteristics. In addition, further consideration is given to the interactions between operational links. The real-time bottleneck calculation methodology can be summarized as follows:
R B I ( i ) = ω f r e s ( i ) + μ f e q ( i ) + λ f b u f f e r ( i )
f ( i ) = ν m e a s u r e max { ν m e a s u r e ( 1 ) , ν m e a s u r e ( 2 ) , , ν m e a s u r e ( t ) }
ω + μ + λ = 1
where i is the workstation number, f r e s ( i ) is the resource state function, f e q ( i ) represents the device state function, and the buffer state function is f b u f f e r ( i ) . The state calculation function is shown specifically in Equation (43) as the ratio of the real-time measured value to the maximum value in time t . ω , μ , and λ are the weight coefficients, whose sum is 1 as shown in Equation (44).
Demand forecasting and bottleneck identification are the two most significant aspects of workshop resource management, which are intimately related to the planning model. Based on the real-time update of resource information by the DT system, managers are able to analyze the operation plan and resource plan collaboratively and construct an effective “Plan-Resource” management framework, as shown in Figure 9.

5.4. Dynamic Job Shop Scheduling

The dynamic environment-oriented planning method has been proposed in the planning model study in Section 4. However, during the execution of the plan, if there are uncertain events, such as equipment malfunction, production insertion order, material blockage, etc., it will greatly interfere with the plan and cause the manufacturing tasks to be unable to be completed within the scheduled time. Accordingly, it is essential to design a dynamic scheduling strategy for uncertain events and to reduce the impact of unexpected occurrences on job execution by making small-scale process start time adjustments. Meanwhile, multiple optimization objectives to obtain optimal or non-dominated solutions require consideration in the dynamic adjustment process.
In the previous studies [44,45], focusing on the multi-objective optimization strategy of dynamic scheduling problems in the presence of uncertain events and proposing optimization algorithms for the makespan and optimal energy consumption, the ability to deal with event occurrences was theoretically developed. However, the prior algorithm research is based on definite assumptions, and the uncertain events appear randomly with probability, which is still partially deviated from the actual working conditions. Based on the real-time monitoring of progress, materials, equipment, and other attributes of the DT system to achieve effective identification of uncertain events, which completely responds to the actual situation of the workshop, there is a higher requirement for dynamic scheduling algorithm triggering and rapid calculation. By constructing a hybrid cycle and event-driven strategy, the workshop problem node production plan is optimized in time for different types of events, and the adjustment of the total plan is minimized. As shown in Figure 10, after an uncertain event such as equipment damage at workstation 2, the remaining workload of the current work order is first recalculated, then the three affected subsequent tasks with floating time are statistically counted, and finally, the fine-tuning of the plan is accomplished. The dynamic scheduling process is shown in Figure 11. The efficiency of the dynamic scheduling trigger and plan iteration process based on the DT system is significantly improved compared with the traditional manual adjustment, with a saving of about 17.1% or more according to statistics. The dynamic scheduling model that makespan and minimizes energy consumption for production can be expressed as follows:
min F ( x ) = [ f 1 , f 2 ]
f 1 = min ( C m a x )
f 2 = min ( E )
where F ( x ) denotes the target vector, F = ( f 1 , f 2 ) Y , Y is the target space formed by multiple target vectors, x is the decision vector, C is the completion time, E is the energy consumption parameter, f 1 represents the makespan, and f 2 is the minimum production energy consumption. The constraints are the same as in Equations (12)–(15).

5.5. Multi-Station Collaborative Distribution

The delivery of materials and intermediate products within the workshop has been a relatively neglected part of production planning. In contrast to the high priority given to supply chain and in-factory logistics distribution, the scheduling of logistics distribution between workstations is autonomously done by operators, which easily causes blockages in the flow between processes. Based on the digital twin workshop planning model, expanding the multi-station collaborative distribution method enables the effective improvement of the inter-operational material and intermediate product turnover efficiency. Starting from the assignment plan of each workstation, based on the work sequential relationship between multiple workstations, the distribution requests are received and associated with BOMs to transport the target objects in the form of pallets to the specified workstations or buffer zones, and the idle vehicles and optimal paths within the effective turnaround time are calculated, and the distribution plan is output, as shown in Figure 12. The collaborative distribution model with the minimum empty time of transportation equipment as the optimization objective is:
f = m = 1 M j = 1 , j i n i = 1 n y i m j · N t i j + m = 1 M j = 1 n y 0 m j · N t 0 j + m = 1 M i = 1 n y i m 0 · N t i 0
y i m j = 1   V e h i c l e   m   t r a n s p o r t   t a s k   i   a f t e r   t r a n s p o r t   t a s k   j 0   e l s e
the constraints include:
R t i R t j + U t i + L T i + y i m j · N t i j R · ( 1 m M y i m j ) i , m , j
y 0 m j = 1
S t i R t i E t i
i n , i j n y i m j + y 0 m j = x j m   m , j
j n , j i n y i m j + y i m 0 = x i m   i , m
j n , j i n y i m j x j m   i , m
x i m = 1   t a s k   i   i s   t r a n s p o r t e d   b y   v e h i c l e   m 0   e l s e
where i and j are task numbers, m represents the vehicle number, x i m and y i m j are decision variables for task assignment, S t i , R t i , E t i denote the earliest start time, actual start time and latest end time respectively, L T i is the load run time, and N t i j represents the no-load time.
In summary, the five decision support methods proposed in this section are all application services tightly associated with the DT workshop planning model, which enrich the practicality of the DT architecture and enormously enhance the value of utilization and service-driven importance of the GNN-based planning model. This section maintains immense significance as it is dedicated to studying the feasibility of expanding the application of the DT service-driven layer. According to the development trend of intelligent workshops, the existing quality management and traceability methods [46], as well as inspection, safety, green production, and other workshop control businesses, may be explored in the future to integrate into the intelligent management solutions of “virtual-real co-drive” to assist enterprises achieve full digital coverage.

6. Case Validation and Discussion

This section concentrates on validating the effectiveness of the aforementioned GNN-based planning model and the application of the digital twin system by ocean engineering enterprises. We analyze the proposed model in terms of the computational effect and generalization ability under the attention mechanism, as well as discuss the feasibility and practicability of the DT system for actual execution in enterprises.

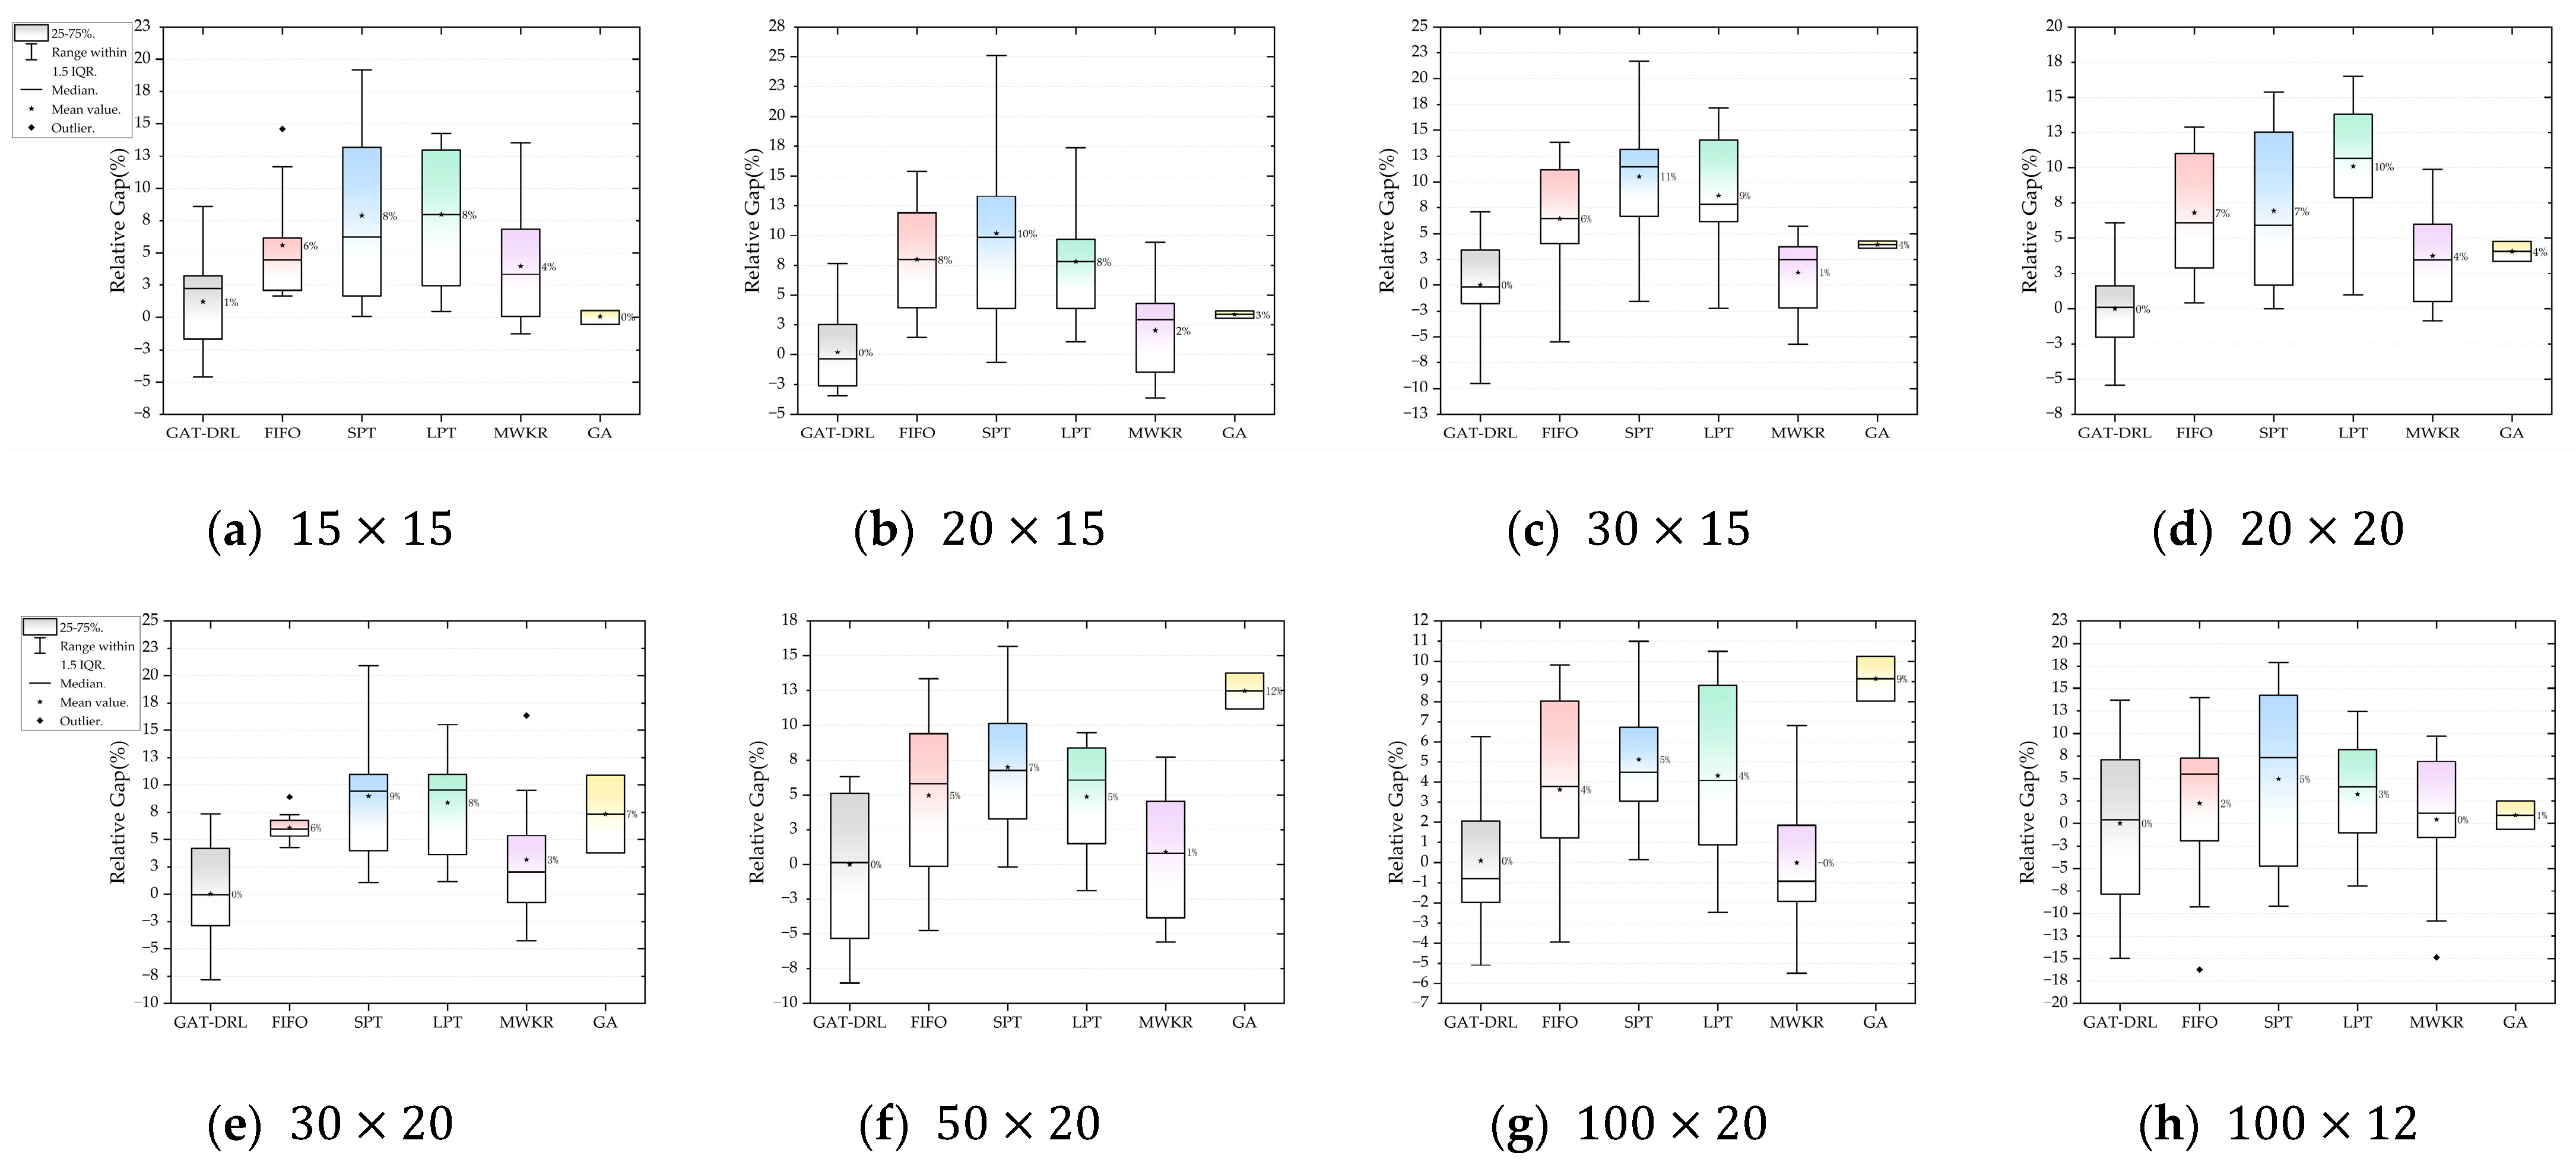
6.1. Effectiveness of GNN-Based Planning Model

The model proposed in this paper for solving the workshop planning problem is a combination of Graph Attention Networks and Deep Reinforcement Learning, i.e., GAT-DRL. In order to validate the computational effectiveness of the planning model in the actual scheduling environment, a synthetic dataset consisting of standard arithmetic examples and workshop planning samples are employed as the GNN training, validation and testing dataset. The training dataset has a total of four scales corresponding to the number of jobs n = { 15 ,   20 ,   30 } and machines m = { 15,20 } , where each operation o i j contains available machine M and workhour values p i j k sampled integrally from the set of machines U ( 1 ,   m ) and the set of workhours U ( 1 ,   99 ) , respectively.
The PPO hyperparameters of the model, in accordance with the optimal scheme of comparable research [10,11,12,13,14,15,16,40], are configured with the total number of iterations I = 1000 , the instance batch size (training environment) B = 4 , the step size of each iteration of policy update K = 10 , the learning rate l r = 3 × 1 0 4 , the discount rate γ = 0.98 , and the clipping parameter ϵ = 0.2 . The policy loss coefficients, the entropy coefficients as well as the critics’ loss coefficients correlate to 2 , 0.01 , and 1 . Regarding the GAT itself, the number of attention layers L = 2 , and the operation attention network and the machine attention network are both set up with four attention heads per layer each, while ELU is used as the activation function σ . The sizes of the MLPs involved are uniformly 64 . The model with its parameter settings has been applied in practical engineering deployed in the server of the OE manufacturing enterprise with the DT system, which has been packaged as a module and constitutes one of the crucial functions in the application service layer. The entire test is done in a test computer with an Intel i9-12900H CPU and NVIDIA RTX 3070Ti GPU to verify that the model has efficient computational performance and generalizability under the initial conditions, ignoring the influence of the parameters that have been trained in the actual project.
The benchmark analyzes the gap in the optimal solution, stability, and speed against GAT-DRL, with simultaneous PDRs [11] and Genetic Algorithms (GA) [45] solving the makespan of scheduling instances as well as the computation time. In particular, the PDRs are evaluated against four rules, namely, First-in-First-out (FIFO), Shortest Processing Time First (SPT), Longest Processing Time First (LPT), and Most Work Remaining (MWKR), which have the best overall performance. The mathematical model of the comparison algorithm is subject to Section 4.1.
The training curves of GAT-DRL on 15 × 15 , 20 × 15 , 20 × 20 and 30 × 20 instances are illustrated in Figure 13, which reveals that the model accommodates different sizes of datasets and converges rapidly, verifying it acclimates to varying sizes of scheduling problems and obtains high-quality solutions. In addition, with the support of IAM, the converged mean validated makespan is stable with minor fluctuations.
For the trained GAT-DRL model, multiscale performance tests have been conducted in this paper based on the TA dataset and a set of synthetic datasets with equivalent actual computational sizes in the workshop. The tests are executed for a total of eight sizes, corresponding to solving small-scale ( 15 × 15 & 20 × 15 ), medium-scale ( 30 × 15 , 20 × 20 & 30 × 20 ), and large-scale ( 50 × 20 , 100 × 20 & 100 × 12 ) scheduling problems. Each algorithm in each scale carries out 100 group tests, records the makespan minimum in each group, and statistics the average computation time along with the error fluctuation gap Δ = c m a x / c m a x * 1 × 100 % .
Table 3 shows that GAT-DRL has excellent solving ability and the optimal or suboptimal solution obtained in each size, which indicates that the model trained based on small and medium-sized datasets has superior generalization ability to adaptively deal with complex actual working conditions, whereby the model outputs the optimal results when the number of jobs and the number of machines change dynamically. In comparison with the proposed method in this paper, the four PDRs have the best computational speed, which is more than 50%, yet the solution results are not satisfactory, and the randomness of acquiring the minimum value is considerable. In terms of stability of results, the genetic algorithm, as a representative of heuristic algorithms, has prominent performance in the process of calculating workshop scale instances ( 100 × 12 ). Nevertheless, restricted by the high requirements of GA on data size, the performance has enormous constraints in calculating the standard test dataset, which demands targeted improvement. In addition, the computation time of GA is substantially higher than that of GAT-DRL and PDRs, thus it is suitable for pursuing a highly customized scheduling system with great reliability. Overall, GAT-DRL is the optimal generalized scheduling solution with high accuracy, high performance, and high reliability suitable for DT systems. It should be supplemented that the action selection in this model takes a random sampling approach, and the convergence speed may be further improved by switching to a greedy strategy with a fixed number of machines. The gap analysis graph for the eight sets of comparative computation results is shown in Figure 14.

6.2. Application of the Digital Twin System in Workshop

For testing and validation, the proposed digital twin system architecture in this paper is implemented at a Chinese ocean engineering manufacturer. Each business module in the system may function both independently and efficiently together to assist in the fulfillment of the digital twin service via the system’s adoption of a micro-service architecture. The service middleware and management backend use Java and Oracle, the system front-end uses Vue.js technology, and the visualization board is finished using Unity 3, and other open-source board technology. As indicated in Figure 15, it completes the creation of 5 modules and 33 functions. The system function module is designed to complete data management in phases of the ocean engineering construction process, integrate corresponding business data according to design, manufacturing, and basic data, provide prediction and optimization services, and eventually provide a visualization board to fulfill decision support.
By contrasting the DT system with the in-service MES in the block assembly and welding workshop, system validation of multiple project construction scheduling has been carried out. The test results are listed in Table 4. According to the findings, the DT system’s scheduling function compared to the MES can be completed in 5.08% less time for the total duration, and calculation speed can be increased by 16.30%. The visual interface of this system not only makes it convenient to monitor the job plan and progress in the workshop, but it also emphasizes the optimization of the data-driven job execution process and makes use of the five-dimensional logic model in production management.

7. Conclusions and Future Work

This study proposes a five-dimensional architecture of the digital twin system for the ocean engineering intelligent workshop and concentrates on introducing a graph neural network in the service-driven layer to transform the workshop disjunctive graph model into multi-dimensional data, and relying on the attention mechanism, analyze the operation and equipment information to complete node embedding and realize feature extraction. The PPO algorithm training is performed to establish an end-to-end learning framework for solving FJSP, and the GAT network parameters are optimized so that the planning model has excellent generalization after the training of small-sized data, which resolves the problems of long computation time and poor optimization effect in the current workshop planning management practice. With the support of the DT system, a large amount of data input ensures that the model is adequately trained and systematically robust in the face of complex conditions in the shop floor scheduling environment. The numerical results show that the model proposed in this paper can complete the output of workshop planning, and the output results and computation time are significantly better than the traditional heuristic methods.
In future research work, the DT system must fulfill the functional iterations following the continuous upgrading of the intelligent workshop and transform itself from the current “real-time status feedback and decision optimization in parallel” mode to the “prediction data-based virtual-real co-drive” mode to materialize the workshop production process that enables pre-awareness, advance decision-making, and rapid optimization. In addition, the GNN-based planning model is capable of handling production conflicts quickly, i.e., optimizing the model response speed in the dynamic scheduling procedure, further exploring offline reinforcement learning methods, reducing training costs, and improving the generalization ability of the model for online applications.

Author Contributions

Conceptualization, J.L. and W.Y.; methodology, W.Y.; software, B.Y.; validation, W.Y., B.Y., L.C. and H.Y.; formal analysis, W.Y.; investigation, Y.C. and H.Y.; resources, J.L. and L.C.; data curation, B.Y.; writing—original draft preparation, W.Y.; writing—review and editing, W.Y. and B.Y.; visualization, R.D. and H.Y.; supervision, J.L.; project administration, J.L., B.Y. and L.C.; funding acquisition, J.L. and L.C. All authors have read and agreed to the published version of the manuscript.

Funding

This research program is funded by the projects of Research on Intelligent Manufacturing Solutions and Key Technologies for the Upper Module of Offshore Oil and Gas Production Platforms [Grant number 2018473] and Research on Collaborative Design Technology of High-Tech Ocean-going Passenger Ships [Grant number 2019331].

Institutional Review Board Statement

Not applicable.

Informed Consent Statement

Not applicable.

Data Availability Statement

Not applicable.

Acknowledgments

The authors are responsible for the contents of this publication. In addition, the authors would like to thank lab classmates for their contribution to the writing quality.

Conflicts of Interest

The authors declare no conflict of interest.

References

  1. Tao, F.; Qi, Q. Make more digital twins. Nature 2019, 573, 490–491. [Google Scholar] [CrossRef] [PubMed]
  2. Tao, F.; Zhang, H.; Liu, A.; Nee, A. Digital twin in industry: State-of-the-art. IEEE Trans. Ind. Inform. 2018, 15, 2405–2415. [Google Scholar] [CrossRef]
  3. Bangsow, S. Tecnomatix Plant Simulation; Springer: Berlin/Heidelberg, Germany, 2020; pp. 103–180. [Google Scholar]
  4. Fourgeau, E.; Gomez, E.; Adli, H.; Fernandes, C.; Hagege, M. System Engineering Workbench for Multi-views Systems Methodology with 3DEXPERIENCE Platform. In Proceedings of the Second Asia-Pacific Conference on Complex Systems Design & Management, CSD&M Asia 2016, Singapore University of Technology, Singapore, 24–26 February 2016. [Google Scholar]
  5. Tao, F.; Liu, W.; Zhang, M.; Hu, T.; Qi, Q.; Zhang, H.; Sui, F.; Wang, T.; Xu, H.; Huang, Z.; et al. Five-dimension digital twin model and its ten applications. Comput. Integr. Manuf. Syst. 2019, 25, 1–18. [Google Scholar]
  6. Wei, Y.; Guo, L.; Chen, L.; Zhang, H.; Hu, X.; Zhou, H.; Li, G. Research and implementation of digital twin workshop based on real-time data driven. Comput. Integr. Manuf. Syst. 2021, 27, 352–363. [Google Scholar]
  7. Kong, T.; Hu, T.; Zhou, T.; Ye, Y. Data construction method for the applications of workshop digital twin system. J. Manuf. Syst. 2021, 58, 323–328. [Google Scholar] [CrossRef]
  8. Leng, J.; Zhang, H.; Yan, D.; Liu, Q.; Chen, X.; Zhang, D. Digital twin-driven manufacturing cyber-physical system for parallel controlling of smart workshop. J. Ambient Intell. Humaniz. Comput. 2019, 10, 1155–1166. [Google Scholar] [CrossRef]
  9. Zheng, Y.; Yang, S.; Cheng, H. An application framework of digital twin and its case study. J. Ambient Intell. Humaniz. Comput. 2019, 10, 1141–1153. [Google Scholar] [CrossRef]
  10. Yuan, E.; Cheng, S.; Wang, L.; Song, S.; Wu, F. Solving job shop scheduling problems via deep reinforcement learning. Appl. Soft Comput. 2023, 143, 110436. [Google Scholar] [CrossRef]
  11. Song, W.; Chen, X.; Li, Q.; Cao, Z. Flexible Job-Shop Scheduling via Graph Neural Network and Deep Reinforcement Learning. IEEE Trans. Ind. Inform. 2022, 19, 1600–1610. [Google Scholar] [CrossRef]
  12. Park, J.; Chun, J.; Kim, S.; Kim, Y.; Park, J. Learning to schedule job-shop problems: Representation and policy learning using graph neural network and reinforcement learning. Int. J. Prod. Res. 2021, 59, 3360–3377. [Google Scholar] [CrossRef]
  13. Lei, K.; Guo, P.; Zhao, W.; Wang, Y.; Qian, L.; Meng, X.; Tang, L. A multi-action deep reinforcement learning framework for flexible Job-shop scheduling problem. Expert Syst. Appl. 2022, 205, 117796. [Google Scholar] [CrossRef]
  14. Lei, K.; Guo, P.; Wang, Y.; Xiong, J.; Zhao, W. An End-to-end Hierarchical Reinforcement Learning Framework for Large-scale Dynamic Flexible Job-shop Scheduling Problem. In Proceedings of the 2022 International Joint Conference on Neural Networks (IJCNN), Padua, Italy, 18–23 July 2022. [Google Scholar]
  15. Chen, R.; Li, W.; Yang, H. A Deep Reinforcement Learning Framework Based on an Attention Mechanism and Disjunctive Graph Embedding for the Job-Shop Scheduling Problem. IEEE Trans. Ind. Inform. 2022, 19, 1322–1331. [Google Scholar] [CrossRef]
  16. Han, B.-A.; Yang, J.-J. Research on adaptive job shop scheduling problems based on dueling double DQN. IEEE Access 2020, 8, 186474–186495. [Google Scholar] [CrossRef]
  17. Grieves, M.W. PLM--beyond lean manufacturing. Manuf. Eng. 2003, 130, 23. [Google Scholar]
  18. Glaessgen, E.; Stargel, D. The digital twin paradigm for future NASA and US Air Force vehicles. In Proceedings of the 53rd AIAA/ASME/ASCE/AHS/ASC Structures, Structural Dynamics and Materials Conference, Honolulu, HI, USA, 23–26 April 2012. [Google Scholar]
  19. Liu, X.; Furrer, D.; Kosters, J.; Holmes, J. Vision 2040: A Roadmap for Integrated, Multiscale Modeling and Simulation of Materials and Systems; No. E-19477; NASA: Washington, DC, USA, 2018; pp. 1–168. [Google Scholar]
  20. Tao, F.; Xiao, B.; Qi, Q.; Cheng, J.; Ji, P. Digital twin modeling. J. Manuf. Syst. 2022, 64, 372–389. [Google Scholar] [CrossRef]
  21. Tao, F.; Zhang, M. Digital twin shop-floor: A new shop-floor paradigm towards smart manufacturing. IEEE Access 2017, 5, 20418–20427. [Google Scholar] [CrossRef]
  22. Guo, J.; Zhao, N.; Sun, L.; Zhang, S. Modular based flexible digital twin for factory design. J. Ambient Intell. Humaniz. Comput. 2019, 10, 1189–1200. [Google Scholar] [CrossRef]
  23. Zhang, K.; Qu, T.; Zhou, D.; Jiang, H.; Lin, Y.; Li, P.; Guo, H.; Liu, Y.; Li, C.; Huang, G. Digital twin-based opti-state control method for a synchronized production operation system. Robot. Comput. Integr. Manuf. 2020, 63, 101892. [Google Scholar] [CrossRef]
  24. Lee, J.; Lapira, E.; Yang, S.; Kao, A. Predictive manufacturing system-Trends of next-generation production systems. Ifac Proc. Vol. 2013, 46, 150–156. [Google Scholar] [CrossRef]
  25. Schleich, B.; Anwer, N.; Mathieu, L.; Wartzack, S. Shaping the digital twin for design and production engineering. CIRP Ann. 2017, 66, 141–144. [Google Scholar] [CrossRef]
  26. Sun, X.; Bao, J.; Li, J.; Zhang, Y.; Liu, S.; Zhou, B. A digital twin-driven approach for the assembly-commissioning of high precision products. Robot. Comput.-Integr. Manuf. 2020, 61, 101839. [Google Scholar] [CrossRef]
  27. Zhou, J.; Cui, G.; Hu, S.; Zhang, Z.; Yang, C.; Liu, Z.; Wang, L.; Li, C.; Sun, M. Graph neural networks: A review of methods and applications. AI Open 2020, 1, 57–81. [Google Scholar] [CrossRef]
  28. Wu, Z.; Pan, S.; Chen, F.; Long, G.; Zhang, C.; Philip, S. A comprehensive survey on graph neural networks. IEEE Trans. Neural Netw. Learn. Syst. 2020, 32, 4–24. [Google Scholar] [CrossRef]
  29. Gori, M.; Monfardini, G.; Scarselli, F. A new model for learning in graph domains. In Proceedings of the 2005 IEEE International Joint Conference on Neural Networks, Montreal, QC, Canada, 31 July–4 August 2005. [Google Scholar]
  30. Bruna, J.; Zaremba, W.; Szlam, A.; LeCun, Y. Spectral networks and locally connected networks on graphs. arXiv 2013, arXiv:1312.6203. [Google Scholar]
  31. Defferrard, M.; Bresson, X.; Vandergheynst, P. Convolutional neural networks on graphs with fast localized spectral filtering. Adv. Neural Inf. Process. Syst. 2016, 29, 3844–3852. [Google Scholar]
  32. Kipf, T.N.; Welling, M. Semi-supervised classification with graph convolutional networks. arXiv 2016, arXiv:1609.02907. [Google Scholar]
  33. Li, Y.; Tarlow, D.; Brockschmidt, M.; Zemel, R. Gated graph sequence neural networks. arXiv 2015, arXiv:1511.05493. [Google Scholar]
  34. Veličković, P.; Cucurull, G.; Casanova, A.; Romero, A.; Liò, P.; Bengio, Y. Graph attention networks. arXiv 2017, arXiv:1710.10903. [Google Scholar]
  35. Hamilton, W.; Ying, Z.; Leskovec, J. Inductive representation learning on large graphs. Adv. Neural Inf. Process. Syst. 2017, 30, 1024–1034. [Google Scholar]
  36. Gilmer, J.; Schoenholz, S.; Riley, P.; Vinyals, O.; Dahl, G. Neural Message Passing for Quantum Chemistry. In Proceedings of the 34th International Conference on Machine Learning, Sydney, NSW, Australia, 6–11 August 2017. [Google Scholar]
  37. Zhu, J.; Wu, M.; Liu, C. Research on the Application Mode of Blockchain Technology in the Field of Shipbuilding. In Proceedings of the 2020 IEEE International Conference on Artificial Intelligence and Computer Applications (ICAICA), Dalian, China, 27–29 June 2020. [Google Scholar]
  38. Shi, J.; Liu, X.; Liu, T. Method of digital twin logic model oriented to production line simulation. Comput. Integr. Manuf. Syst. 2022, 28, 442–454. [Google Scholar]
  39. Rocha, M.; Simão, A.; Sousa, T. Model-based test case generation from UML sequence diagrams using extended finite state machines. Softw. Qual. J. 2021, 29, 597–627. [Google Scholar] [CrossRef]
  40. Wang, R.; Wang, G.; Sun, J.; Deng, F.; Chen, J. Flexible Job Shop Scheduling via Dual Attention Network Based Reinforcement Learning. arXiv 2023, arXiv:2305.05119. [Google Scholar]
  41. Schulman, J.; Wolski, F.; Dhariwal, P.; Radford, A.; Klimov, O. Proximal policy optimization algorithms. arXiv 2017, arXiv:1707.06347. [Google Scholar]
  42. Li, J.; M Sun, M.; Han, D.; Wang, J.; Mao, X.; Wu, X. A knowledge discovery and reuse method for time estimation in ship block manufacturing planning using DEA. Adv. Eng. Inform. 2019, 39, 25–40. [Google Scholar] [CrossRef]
  43. Su, X.; Lu, J.; Chen, C.; Yu, J.; Ji, W. Dynamic Bottleneck Identification of Manufacturing Resources in Complex Manufacturing System. Appl. Sci. 2022, 12, 4195. [Google Scholar] [CrossRef]
  44. Guo, H.; Li, J.; Yang, B.; Mao, X.; Zhou, Q. Green scheduling optimization of ship plane block flow line considering carbon emission and noise. Comput. Ind. Eng. 2020, 148, 106680. [Google Scholar] [CrossRef]
  45. Yang, B.; Yin, W.; Li, J.; Zhou, Q. A Multitime Window Parallel Scheduling System for Large-Scale Offshore Platform Project. Wirel. Commun. Mob. Comput. 2022, 2022, 2352651. [Google Scholar] [CrossRef]
  46. Li, J.; Yin, W.; Yang, B.; Zhou, Q. Research on Welding Quality Traceability Model of Offshore Platform Block Construction Process. CMES Comput. Model. Eng. Sci. 2023, 134, 699–730. [Google Scholar] [CrossRef]
Figure 1. Ocean engineering platform manufacturing process.
Applsci 13 10134 g001
Figure 2. Integrated manufacturing execution mode for “Humans–Machines–Materials–Rules–Environments”.
Applsci 13 10134 g002
Figure 3. Ocean engineering manufacturing DT workshop architecture.
Applsci 13 10134 g003
Figure 4. Jobs information and status transfer between DT and equipment.
Applsci 13 10134 g004
Figure 5. Real-time mapping of the physical workshop to DT.
Applsci 13 10134 g005
Figure 6. The planning framework based on the GAT and DRL.
Applsci 13 10134 g006
Figure 7. Multi-head attention mechanism.
Applsci 13 10134 g007
Figure 8. Work hours forecasting architecture.
Applsci 13 10134 g008
Figure 9. “Plan-Resource” management framework.
Applsci 13 10134 g009
Figure 10. Dynamic job shop scheduling example.
Applsci 13 10134 g010
Figure 11. Rescheduling process.
Applsci 13 10134 g011
Figure 12. Multi-station collaborative distribution schematic.
Applsci 13 10134 g012
Figure 13. Training curves of the GAT-DRL on four scheduling instances.
Applsci 13 10134 g013
Figure 14. Relative gaps of algorithm results for different size datasets.
Applsci 13 10134 g014
Figure 15. Application of the DT system for OE intelligent workshop.
Applsci 13 10134 g015
Table 1. The definitions and descriptions of the symbols in the mathematical models.
SymbolsDefinitionDescription
N Total number of workpieces { 1,2 , , i , , N }
i Workpiece number i [ 1 , N ]
j Process number j [ 1 , P i l ]
k Equipment number k [ 1 , M ]
M Total number of equipment { m 1 , m 2 , , m k , m M }
G i Number of all process routes for i G i = { O , C , M }
l Flexible process route number l [ 1 , G i ]
P i l Total number of processes planning for the process plan l of i P i l G i
o i j l The operation j of the process plan l for i o i j l P i l
s i j l k Workpiece manufacturing start timeTime
c i Workpiece delivery timeTime
c i , Workpiece completion timeTime
t i j l k Workpiece processing time t i j k l = [ s i j l k , c i , ]
X i l Process route selection decision variable X i l = 1   i f   i   s e l e c t   p r o c e s s   p l a n   l 0   e l s e
Z i j l k Equipment selection decision variable Z i j l k = 1   i f   o i j l   s e l e c t   e q u i p m e n t   k 0   e l s e
Table 2. Comparison of the Graph Neural Network structures.
Network StructureGNN [12]GIN [10]HGNN [11]GAT
CharacteristicsThe GNN is constructed by stacking k embedding layers, and the embedding graph with node features and its domain is computed from the input graph after k embedding iterations.By encoding the dis-junction graph using GIN with discriminative ability, the preprocessing of receiving data is performed, and utilizing “add arc scheme” which ignores the un-directed arc to reduce the computational complexity.Adopting a heterogeneous graph structure, preserving the traditional set of operation node set and conjunctive arcs, adding machine nodes, and replacing the disjunction arc set with the “operation–machine” arc set.Based on the attention mechanism, neighbor node aggregation is implemented to select high-priority “operation–machine” combinations based on adaptive weights to solve FJSP instances of different scales.
ContributionsBy learning general JSP properties, the GNN scheduler delivers better computational performance in the arbitrary instances.Defining strategies to predict the probability distributions of operations and machines through the encoder-decoder component.Efficient integration of operational and machine information with superior graph density and computational efficiency.Explicit exploration of operation scheduling and machine competition relationships in disjunction graphs is attempted.
Training methodProximal Policy Optimization (PPO)
Table 3. Comparison of models’ performance in different scale data.
Size
( n × m )
GAT-DRLFIFOSPTLPTMWKRGA
c m a x 15 × 15 144815131546154714891433
Time1.110.600.740.710.7146.17
Gap3.14%5.58%7.89%7.98%4.31%0.56%
c m a x 20 × 15 164617781814177516771702
Time1.460.810.990.930.9660.66
Gap2.52%8.00%10.31%7.82%3.55%3.37%
c m a x 30 × 15 218923302419237922162275
Time2.311.481.871.791.7896.20
Gap3.60%7.55%10.83%9.12%3.69%3.91%
c m a x 20 × 20 193320652067212820052012
Time1.981.091.311.181.2682.29
Gap2.17%6.80%6.93%10.09%3.94%4.06%
c m a x 30 × 20 240325492619260424792580
Time3.571.972.462.312.34148.80
Gap3.70%6.09%8.99%8.36%4.61%7.34%
c m a x 50 × 20 333835043571350133683754
Time9.093.144.233.863.89378.77
Gap4.58%6.32%7.02%5.25%4.00%12.46%
c m a x 100 × 20 584560526139609358406374
Time43.4213.2021.1419.1419.971808.81
Gap3.04%4.81%5.12%4.82%2.95%9.14%
c m a x 100 × 12 678269347117700468116845
Time25.767.9312.6611.5212.041073.09
Gap6.75%7.72%9.20%6.09%5.88%1.56%
Table 4. Comparison of the DT system performance with the existing MES.
ProjectTotal Project Duration (Days)Calculation Time (s)
DTMESDTMES
A246261783.28905.45
B242254780.10903.89
C239251757.61967.77
Data collection in the system export results. Commercially sensitive information is not shown, and only system-exported test data are provided.
Disclaimer/Publisher’s Note: The statements, opinions and data contained in all publications are solely those of the individual author(s) and contributor(s) and not of MDPI and/or the editor(s). MDPI and/or the editor(s) disclaim responsibility for any injury to people or property resulting from any ideas, methods, instructions or products referred to in the content.

