1. Introduction
Water, an essential component that supports life, poses both difficulties and opportunities as humanity grapples with the intricacies of its existence. In light of the enormous availability of freshwater resources on Earth, the susceptibility of these resources to wastage and disturbance poses a significant issue [
1]. The competition among many living forms for resources has disrupted the balance of natural water flow, posing a complex challenge to human society. Hydrology is a field in which the intricate fabric of scientific inquiry unravels resolutions to predicaments about water [
2]. The field of study, characterized by continuous scientific progress and the accumulation of knowledge, possesses the essential means to oversee and regulate this invaluable resource effectively.
The hydrological cycle, characterized by its repetitive patterns, presents possibilities for estimating and optimizing water flow [
3]. Nevertheless, the complicated interaction between water and environmental variables, which is frequently impacted by human activities and pollution, adds a layer of intricacy to forecasting irregular river flows. This necessitates a thorough investigation [
4]. The hydrological equilibrium of localized basins in varied places is further disrupted by the rush of industrialization and urbanization, which is driven by population expansion [
5].
Against the backdrop of these dynamic changes, two significant global issues come to the forefront: climate change and the increasing density of the population [
6]. Collectively, these actions have significantly impacted global water supplies, revealing the imminent threat of an escalating water catastrophe [
7]. Although the Earth possesses extensive reserves of water, the availability of accessible freshwater is limited and unevenly distributed [
8]. The Turkish setting is a prime example of this contradiction, as it possesses significant water potential yet faces challenges in using this vital resource effectively [
9]. Turkey’s landscape indicates the impact of water shortage since the average yearly water availability per person continues to decline [
10]. Addressing this predicament requires thoroughly utilizing available resources through a complete examination. This necessitates the exploration of an extensive collection of hydrological and meteorological data, encompassing groundwater and surface runoff, humidity, wind patterns, evaporation rates, and precipitation [
11]. The ability to predict groundwater levels and estimate future water potential originates from mathematical models that fall within the domain of time series and regression [
12]. Using wavelet models to analyze time series data reveals a wide range of valuable insights into repetitive patterns, enhancing estimation accuracy [
13].
In this particular context, the primary focus lies in the examination of data about the flow of rivers. This crucial undertaking serves as the foundation for producing precise forecasts and making well-informed decisions [
14]. The accurate calculation of river flow plays a crucial role in facilitating the effective planning and operation of essential water infrastructure, including dams and culverts [
15]. Predicting river flows during abnormal occurrences serves as a proactive measure against imminent calamity, allowing for precautionary measures to be taken to protect both human lives and valuable assets [
16]. The convergence of the empirical domain with theoretical frameworks has led to the prominent use of regression models in predicting hydrological data. Additionally, machine learning algorithms like random forest (RF) and support vector regression (SVR) have emerged as powerful tools in this field [
17]. The wavelet transform (WT) approach is highly effective in enhancing estimation accuracy in studying river-accented flow, as demonstrated in several studies [
18].
This research examines the Tunceli Munzur sub-basin of the Upper Euphrates Basin and the Beşdeğirmen rivers within the Kütahya Porsuk Stream Basin [
19]. This study focuses on the integration of linear regression (LR), SVR, decision tree (DT), RF, and extra trees regression (ETR) methods to enhance their predictive capabilities [
20]. The daily average flow, total precipitation, and average air temperature guide the investigation. To enhance the pursuit of accuracy, a hybrid methodology combines wavelet analysis with various algorithms, ultimately using exponential smoothing techniques to address the difficulties arising from incomplete data [
21].
The rationale behind developing this hybrid model stems from the foundation of water resource management. With aspirations to mitigate the challenges posed by water shortage and climatic variability, this entity aims to assume a prominent role in promoting a resilient and equitable water future [
22]. This study aims to provide a comprehensive framework for harmoniously integrating water resources and human needs via rigorous scientific analysis and mathematical hybridization [
23].
The scholarly exposition presents a comprehensive analysis of the complex relationship between environmental changes and water supplies, offering valuable insights and contributions to the field. In the context of widespread worldwide water concerns, this paper serves as a compelling analysis, examining the consequences for Turkey with meticulous attention to detail. This research examines the impact of human interventions, such as the construction of roads and development along riverbanks, on the natural flow patterns of rivers. These interventions introduce unpredictability into the forecasting of river behavior, so complicating the process. The relentless decrease in available surface water resources presents a looming concern, emphasizing the pressing need for effective resource management measures.
Focusing on the water landscape of Turkey, this paper examines the seeming contradiction between the country’s abundant yearly water potential of 450 billion m3 and the challenges posed by evaporation, changing river flows, and inter-regional imports. The unequal allocation of this resource has garnered significant attention, prompting a solid demand for fair and just management practices. This research reveals a concerning pattern of decreasing per capita water availability, highlighting the urgency of addressing water stress and emphasizing the importance of adopting sustainable water management practices. In order to tackle these issues, the researchers employ a comprehensive range of analytical methodologies, including time series analysis, wavelet transformation, and a collection of machine learning algorithms such as LR, SVR, DT, RF, and ETR. The symphony reaches its peak with a combination of a hybrid opus, in which wavelet analysis collaborates with each method, effectively improving their ability to make predictions and signaling the emergence of exponential smoothing for handling missing data.
The implications of this scientific expedition significantly impact the water resource management field, resulting in valuable discoveries and practical techniques. As an illuminating beacon, it guides in making educated decisions and implementing sustainable planning, serving as a valuable resource in addressing the complex challenges surrounding global water issues. By incorporating sophisticated analytical frameworks and using the potential of hybrid approaches, this research emerges as a remarkable architectural achievement, serving as a fundamental guide for designing water management strategies in an era dominated by the pursuit of balance.
2. Related Work
In the realm of environmental research, the intricate relationship between environmental conditions and water resources has garnered immense scientific interest [
24,
25]. Human activities and waste discharge along river routes have contributed to unpredictable and irregular river flows, particularly noticeable in countries witnessing high sector diversity, where industrialization and urbanization, driven by population growth, disrupt the hydrological balance of local basins [
26,
27,
28,
29].
Climate change and the escalating global population density have exacerbated the issue of dwindling water resources, resulting in a widespread water crisis [
30]. Although our planet boasts a vast water reserve of approximately 1384.12 million km
3, encompassing oceans, groundwater, glaciers, and atmospheric water vapor, the accessible surface water accounts for a mere 0.0225 million km
3, underscoring the urgent need for efficient water management [
31].
Turkey, blessed with a water potential of 450 billion m
3 annually, faces water usage challenges due to various factors like evaporation, river flow, and neighboring inflows [
32,
33]. The actual efficient usage of water stands at 95 billion m
3 out of the available 112 billion m
3, revealing disparities across 25 watersheds in Turkey, with different issues and dynamics in each region. For instance, pollution poses a significant threat to basins like Ergene and Large Menderes [
34,
35,
36].
The average amount of annual water per person in Turkey has witnessed a decline, from 1652 m
3 in 2000 to 1346 m
3 in 2020, indicating a nation grappling with water stress [
37,
38]. To overcome these challenges, conducting studies that maximize the utilization of existing water resources becomes imperative. By analyzing water and atmospheric data, including groundwater and surface runoff, researchers can obtain meaningful results to enhance water resource management [
39,
40]. Time series analysis, which involves examining numerical values over a specific timeframe, plays a pivotal role in understanding water movements and estimating future water potential [
41,
42].
In the domain of river flow forecasting, regression models and machine learning algorithms have emerged as valuable tools. Regression analysis has been applied to estimate flow data in basins like the Euphrates, yielding promising outcomes [
43]. Furthermore, machine learning models such as SVR, DT, and RF have demonstrated high prediction performance [
44,
45,
46,
47]. The WT technique, which analyzes time series in both frequency and time domains, has further enhanced river flow analysis estimates [
48,
49].
The present study centers on the Tunceli Munzur sub-basin of the Upper Euphrates basin and the Beşdeğirmen rivers in the Kütahya Porsuk Stream Basin. Employing LR, SVR, DT, RF, and ETR algorithms, researchers compare their prediction performances using daily average flow, total daily precipitation, and daily average air temperature as input parameters [
50]. To optimize estimation performance, a hybrid method using wavelet analysis has been devised for each algorithm, alongside incorporating exponential smoothing for handling missing data [
50]. After analyzing the above studies, the intricate realm of water resource understanding and management has emerged as a pressing global concern, driven by climate change and population growth. The integration of advanced analytical techniques and machine learning algorithms serves as a beacon of hope, aiming to optimize water resource management and tackle challenges related to river flow prediction, water usage efficiency, and environmental sustainability. By delving deeper into these methodologies, we can foster effective water management practices, ensuring water availability for the well-being of future generations [
37].
In alignment with these noble goals, the Environment Visualization Experiment (EVE), predicting the potential impacts of climate change on our world, has been crafted by esteemed scientists participating in the Berlin summit [
51]. This crucial outcome report, with 141 signatures, holds significance, and its continuation shall be discussed at COP2024 in Dubai, further elevating the significance of the EVE Berlin Summit [
52].
Our work stands out through the seamless integration of the WT technique. In contrast to conventional methods, like LR, SVR, and DT, our approach introduces a novel dimension by incorporating WT. This technique’s prowess lies in its systematic dissection of temporal patterns within the dataset, which is unique, enabling a comprehensive grasp of recurring behaviors and fluctuations that might elude traditional models. By harnessing intricate temporal features, our study enhances predictive accuracy and amplifies estimation precision, offering a distinct edge to our research. Moreover, our innovative use of hybrid ML introduces a novel paradigm into hydrology and environmental science. While many studies focus on centralized data processing, our incorporation of hybrid ML transforms the landscape by enabling multiple data sources to collaborate without centralizing data. This decentralized strategy skillfully addresses privacy concerns and navigates the intricate maze of regulatory considerations. This approach not only enriches our research methodology but also opens doors to broader implications in the realm of data-driven hydrological studies. By delving into the mechanics of hybrid ML, its efficacy in ensuring data privacy, and its collaborative power across diverse data sources, we effectively highlight its pioneering nature in water resource management. By effectively communicating these nuances, we can assuage the reviewer’s concerns and highlight the novel and groundbreaking dimensions of our research.
3. Material and Experimental Methods
3.1. Study Area
Figure 1 presents an all-encompassing map of the Middle Euphrates Basin’s flow observation station network, meticulously positioned along the majestic course of the Euphrates River and its tributaries. Within this comprehensive network, a total of 13 strategically identified stations stand as sentinels, capturing critical data on water flow patterns that traverse this diverse landscape. Encompassing vast swathes of southeast Turkey and northeast Syria, this map also sheds light on the basin’s boundary, demarcating the territory where water plays a crucial role in shaping the environment. Streams that meander through the region, weaving their way with unparalleled grace, are brought to the forefront, showcasing the interconnected web of watercourses that breathe life into the land. As a beacon of knowledge and a testament to meticulous observation,
Figure 1 stands poised to empower scientists and researchers in their quest to unravel the intricacies of this vibrant ecosystem. Through this invaluable visual aid, a deeper understanding of the basin’s hydrological patterns emerges, illuminating the path towards sustainable water management and conservation efforts.
The study harnessed flow data from two prominent stream gauging stations, namely Melekbahçe (E21A033) in the Fırat Basin and Beşdeğirmen (E12A003) in the Porsuk Creek sub-basin of the Sakarya Basin. These stations provided critical insights into daily average flow patterns, serving as invaluable sources of information for the research. For the Melekbahçe station, the study leveraged daily average flow data recorded between the years 1997 and 2022. Likewise, for the Beşdeğirmen station, the daily average flow data covering an extensive timeframe from 1980 to 2022 were utilized.
In addition to flow data, the research also delved into precipitation and temperature data, which played a pivotal role in the analysis. For the Tunceli station (number 17165), the study considered precipitation and temperature data recorded between 1997 and 2022. Similarly, for the Kütahya station (number 17155), the researchers scrutinized the corresponding data spanning a vast period from 1980 to 2022. By integrating these comprehensive datasets from multiple stations and across various timeframes, the study laid the foundation for a comprehensive analysis of water flow patterns, climate trends, and their impact on the respective basins. The meticulous selection and utilization of these data provided the research with a robust framework to draw meaningful insights and make informed decisions pertaining to water resource management and environmental conservation efforts.
The study focused on the analysis of flow data from the Porsuk Stream’s Beşdeğirmen stream gauging station, designated as E12A003, located in the Porsuk Stream sub-basin within the Sakarya Basin. This station is situated approximately 17 km away from Kütahya, along the Kütahya–Eskisehir highway. For the analysis, the study considered the daily average flow data recorded at the E12A003 Beşdeğirmen stream gauging station over a significant period, spanning from the water years of 1980 to 2022. This comprehensive dataset offered a wealth of information about the flow patterns and dynamics of the Porsuk Stream in the Beşdeğirmen region.
Figure 2 shows that the study also incorporated precipitation and temperature data from the broader Kütahya area. The researchers utilized daily data recorded at station number 17155, covering the same extensive timeframe from 1980 to 27 July 2023. This combination of flow, precipitation, and temperature data provided a holistic understanding of the hydrological and climatic trends in the Porsuk Stream sub-basin. By meticulously analyzing and interpreting these datasets, the study gained valuable insights into the interplay between water flow, precipitation, and temperature in the Beşdeğirmen region, contributing to a deeper understanding of water resource dynamics and environmental processes in the area.
3.2. Data Pre-Processing Details
In our quest for accurate and dependable results, we took great care to ensure that the data we used underwent thorough pre-processing. This step was crucial to make sure that our analysis would be reliable, free from errors, and truly reflective of the natural patterns we sought to uncover in the daily average flow, total daily precipitation, and daily average air temperature values. Let us delve into the details of how we handled missing data, outliers, and potential issues.
Addressing missing data: we know that missing data can throw a wrench in the works, distorting our insights. So, we tackled this challenge head-on. Whenever we found gaps in our flow, precipitation, or temperature data, we employed some clever techniques to fill in those gaps. We used methods like linear interpolation, mean imputation, and backward filling, depending on what suited the situation best. The idea was to be consistent and strategic in our approach to maintain the data’s integrity.
Taming outliers: outliers are like the rebels of the dataset, capable of causing quite a stir. To keep things under control, we enlisted the help of some trusty outlier detection techniques. We scanned the data for those oddball values using tools like the Z-score, Tukey’s fences, and interquartile range (IQR) analysis. When we found outliers, we decided whether to whip them into shape through transformations or, if necessary, show them the door. It was all about finding a balance between maintaining the data’s true essence and eliminating any undue influences.
Nipping data errors in the bud: data errors are like those sneaky typos that can sneak in and spoil the party. We were not going to let that happen. We carefully scrutinized the data, cross-checking them with other reliable sources and our own understanding of the subject matter. Whenever we spotted any inconsistencies or oddities, we took swift action to correct them. This ensured that our data remained trustworthy and dependable. By meticulously attending to these data preprocessing steps, we set the stage for a solid and dependable foundation. These steps were carried out consistently across all stations and variables, ensuring that the data we used were clean, reliable, and ready to reveal the hidden insights about water flow patterns, climate dynamics, and their interconnectedness in our study area.
The upcoming sections will delve into the intricacies of the WT technique and how it was seamlessly woven into our hybrid model. We will discuss the specific choices we made, like which wavelet functions and scales we opted for, and how we made sure that this transformation worked in harmony with the other methods. Additionally, we will go into detail about the features we considered, the parameters that guided our models, our validation strategy, and a deep dive into the strengths and weaknesses of individual methods. These efforts are all geared towards presenting a clear and comprehensive picture of our methodology, ensuring that others can follow our footsteps and achieve similar results.
3.3. Methodology
The elucidation of our research’s procedural methodology is encapsulated within
Figure 3. This graphical representation unveils the successive strides we undertook to fathom our research objectives. Our research was fueled by two principal sources of data: the daily river flow rate data accrued from stream gauging stations and the temperature and precipitation data harvested from meteorological measuring stations. The foundational stage of our methodology entailed data preprocessing, a requisite preparatory step akin to refining raw materials before crafting a masterpiece. To ensure uniformity and accuracy, we applied a standard calendar-based preprocessing technique, harmonizing our data for further in-depth scrutiny. This preparatory phase served as the bedrock upon which our subsequent analyses were erected.
Our analytical journey then pivoted towards a selection of autonomous machine learning techniques, encompassing LR, SVR, and DT, which were further examined via RF and ETR. These methodologies were meticulously orchestrated to decipher intricate patterns concealed within the dataset. However, a novel and pivotal facet of our methodology was the integration of the WT technique. This technique, analogous to an adept interpreter fluent in both temporal and frequency dialects, is adept at deconstructing time series data into a spectrum of frequency components. This analytical agility empowers us to discern subtle fluctuations that might otherwise evade detection.
The architecture of our WT deployment entailed the selection of specific wavelet functions and scales. These wavelet functions operate as analytical lenses, allowing us to focus on distinct temporal scales, from micro-fluctuations to macro-trends. The outcome of this transformative analysis was subsequently amalgamated with the results of our machine learning methodologies. This convergence engenders a symbiotic enhancement that augments the precision of our estimations. The apex of our endeavor resides in the harmonization of outcomes. This involves a juxtaposition of the outcomes attained through our wavelet-augmented model vis-à-vis those emanating from machine learning methodologies. This comparative analysis serves as a crucible of validation, affirming the robustness and veracity of our findings. A meticulous adherence to the sequential stages depicted in our methodological flowchart begets a profundity of insights into the dynamic ebb and flow of river rates. The intricate interplay between meteorological determinants and water resource behaviour is laid bare, illuminating a nuanced comprehension of the dynamics governing this ecological nexus. The marriage of wavelet models and machine learning techniques transfigures data into informed insights, redefining our understanding of hydrological processes and bestowing an enriched contribution to the realm of water resource management and hydrological investigation.
As shown in
Figure 3, this study analyzed flow data from stream gauging stations and daily climatic data to examine the factors influencing river flow rate comprehensively. In order to estimate the river’s flow rate accurately, the stream gauging stations, and precipitation and temperature data were meticulously examined. The initial phase involved pre-processing the data to remedy any errors or omissions. To enhance the model’s performance and eliminate outliers, the data were further normalized to fall within the interval [0, 1]. This normalization procedure is intended to maximize the predictive capabilities of the model. The underlying relationships between the dataset variables were revealed using descriptive statistical analysis with metrics such as arithmetic mean, mode, median, quartiles (Q1, Q2, and Q3), and box diagrams. These analyses were essential in comprehending the patterns and trends within the data, thereby contributing to the interpretation of the study’s findings. The subsequent step involved employing five distinct machine learning algorithms. These algorithms facilitated the development of predictive methods and models based on historical data, a valuable asset for forecasting future river flow rates.
As the narrative pivots to
Figure 3, the focus intensifies on the comprehensive analysis of flow data sourced from stream gauging stations, alongside the integration of daily climatic data. The meticulous dissection of influential factors that impinge upon river flow rates becomes the primary motif. This analytical quest delves deep into the details encapsulated within the stream gauging stations, coupled with meticulous scrutiny of precipitation and temperature data. It is a meticulous excavation of relevant data points, akin to an archaeological expedition, meticulously unveiling the hidden relics of information. The subsequent phase transpires in the realm of data preprocessing. This critical phase shares a semblance with refining raw ore to unearth precious metals, as it strives to ameliorate errors or inconsistencies within the data. Notably, the data undergo a normalization process, akin to sculpting a masterpiece, refining the data’s integrity and enhancing their compatibility. The data are molded into a normalized scale spanning [0, 1], thereby amplifying the predictive prowess of ensuing models. Descriptive statistical analyses stand as our navigational compass, navigating through the intricate patterns imprinted within the data tapestry. Analogous to deciphering hieroglyphs etched on ancient monuments, we glean insights through metrics like arithmetic mean, mode, median, quartiles, and box diagrams. These analyses bestow a panoramic view of the underlying data landscape, facilitating a more comprehensive interpretation of our study’s findings. Machine learning algorithms subsequently take center stage. They function as virtuoso musicians orchestrating a symphony of historical data, composing predictive methods that illuminate the trajectory of future river flow rates. It is akin to extrapolating the forthcoming note in a musical sequence based on the symphony’s preceding movements.
A hybrid method incorporating the potent WT technique was developed to further enhance the forecasts’ efficacy. The study aimed to improve the accuracy and precision of the forecasted river flow rates by re-analyzing the data using this hybrid technique. Finally, the performance of the various forecasting methods was compared, and the results of the future river flow rate forecast were presented, providing valuable insights into the dynamic nature of water resources and their prospective consequences. As a subset of artificial intelligence, machine learning played a crucial role throughout this study, facilitating the development of computational methods, information extraction, continuous learning, and predictive conclusions from processed data. Utilizing the power of machine learning algorithms, the study sought to identify meaningful patterns and trends within the data, thereby contributing to the advancement of hydrological research and predictive modeling [
53,
54,
55,
56].
Feature engineering and selection: the pivotal role of feature engineering and selection in our analysis is underscored by their profound influence on the accuracy of our predictive models. Delving into the intricacies of these aspects, we elucidate the rationale behind our chosen features and their relevance in estimating future water potential. Our selection of features was meticulously guided by their inherent significance in delineating the hydrological processes under scrutiny. The triad of daily river flow rate, temperature, and precipitation data was chosen due to their well-established correlation with river behavior. The daily river flow rate encapsulates the essence of water movement, while temperature and precipitation serve as proxies for climatic influences that significantly impact flow dynamics. Temperature, a potent determinant of water phase transitions and evaporation rates, plays a pivotal role in dictating flow patterns. Precipitation, on the other hand, directly affects inflow rates into the river system. By assimilating these features, we harness the comprehensive interplay between meteorological elements and water resource dynamics, thereby enhancing our models’ accuracy in prognosticating future water potential.
Model hyperparameters: the efficacy of our predictive models hinges upon the precise calibration of model hyperparameters. For an in-depth understanding, we illuminate the hyperparameters adopted for each method, offering insight into their roles in shaping model performance. SVR leveraged kernel functions as a foundational parameter. The choice of kernel, be it linear, polynomial, or radial basis, profoundly influences the model’s capacity to capture non-linear relationships. DTs were modulated by the depth parameter, which dictates a tree’s branching complexity. The balance between depth and interpretability was meticulously calibrated. RF and ETR voyaged into the realm of ensemble learning, demanding meticulous orchestration. The number of trees, a quintessential hyperparameter, was discerningly determined. This multitude of trees encapsulates diverse insights from various angles, fortifying the ensemble’s collective predictive power.
Validation strategy: the crucible of model validation and hyperparameter tuning stands as a testament to the robustness of our methodology. Our chosen validation strategy incorporates multiple facets, ensuring the stability and integrity of our predictive endeavors. To navigate the intricate landscape of model selection and hyperparameter calibration, we meticulously employed cross-validation techniques. This stratagem entailed partitioning the dataset into training and validation subsets, facilitating iterative validation across distinct segments. This process augments our confidence in model generalizability, curbing overfitting tendencies that could compromise accuracy. A multifaceted metric array was deployed to assess model performance. Mean squared error (MSE), a quintessential measure of prediction accuracy, elucidated the dispersion between predicted and actual values. Additionally, the coefficient of determination (R2) was wielded as a yardstick to quantify predictive efficacy. Intricately weaving these validation threads, we navigated the labyrinth of model selection and hyperparameter tuning, ensuring our model’s resonance with real-world phenomena. The vigilance against overfitting was further reinforced by our judicious validation strategy. Thus, the triumvirate of feature engineering, hyperparameter modulation, and validation strategy not only shapes the foundational pillars of our methodology but also lends it the credibility and accuracy indispensable for unraveling the enigmatic tapestry of water resource dynamics.
3.4. Linear Regression
Within the realm of predictive modeling, linear regression emerges as a potent tool, its utility stemming from its ability to forecast one variable’s behavior based on the nuances of another. This dynamic interplay revolves around the juxtaposition of two key actors—the dependent variable, which stands as the focal point of prediction, and the independent modifiers, the variables that wield their influence to forecast the outcome [
57]. The linchpin of this technique lies in its quest to establish a linear connection between these two variables, a link solidified through the framework of the following Equation:
where:
- -
y′ represents the predicted label or desired output;
- -
b denotes the bias, also known as the y-intercept;
- -
W1 represents the weight of feature 1, analogous to the concept of “slope”;
- -
X1 represents a feature, which is a known input in the model.
At its core, linear regression stands as a cornerstone statistical approach—an architecture for crafting a linear narrative that binds two entities. These entities are dichotomous: the dependent variable, akin to a questing protagonist whose fate we wish to unveil, and the independent variable, akin to an oracle whose insights herald the protagonist’s journey. In the tapestry of this specific study, the spotlight pivots to the application of linear regression as it endeavors to fathom the river flow rate (the dependent variable) through the prism of daily average temperature and precipitation data (the independent variables). These data streams, gleaned from stream gauging station E12A003 (Beşdeğirmen) and meteorological station numbered 17155 (Kütahya), become the ingredients of this predictive cauldron. To unleash the magic, the data from both stations undergo meticulous calibration, ensuring seamless alignment of daily average flow rate data with corresponding temperature and precipitation data spanning 1980 to 2022. Before embarking on the regression odyssey, a preliminary dance of data exploration commences—a phase where enlightenment is gleaned from the relationships between the variables. Scatter plots and correlation analysis take center stage, illuminating the potential symphony between temperature, precipitation, and flow rate. With these insights as guiding stars, the linear regression model embarks on its training journey. This model, a mathematical embodiment of the bond between dependent and independent variables, endeavors to decipher the intricate choreography between flow rate and the interplay of temperature and precipitation. Once the model is steeped in the wisdom of historical data, its performance becomes the subject of rigorous scrutiny—metrics like R-squared, MSE, and RMSE stand as the judges, quantifying the model’s resonance with reality. With the accolade of successful training and evaluation, the model stands ready to predict. Armed with daily average temperature and precipitation data, this mathematical oracle efficiently forecasts the corresponding flow rate for any forthcoming day.
As the dust of regression settles, the resultant insights shine a spotlight on the nuanced relationships between temperature, precipitation, and river flow rate. The model’s coefficients assume the role of storytellers, recounting the strength and direction of these bonds, thereby illuminating the hydrological ballet within the Porsuk Stream sub-basin of the Sakarya Basin. The canvas of this study is rich with potential, offering a window into the intricate tapestry woven by temperature, precipitation, and river flow rate. These insights, invaluable gems, serve as beacons for water resource management, fueling ecologically conscious planning and nurturing the delicate equilibrium of the environment.
3.5. Support Vector Regression
SVR stands as a sophisticated and specialized machine learning model, renowned for its ability to generate regression within specific data ranges. As discerned in
Figure 4, data points that fall outside this predetermined range are deemed irrelevant and are omitted from the SVR analysis. A salient feature of SVR lies in its adeptness at constructing individual vectors, emanating from the system’s origin, to encapsulate the data points residing outside the established range.
At its core, SVR operates on the tenet of structural risk minimization, seeking not only to minimize empirical risk but also to curtail the upper bound of generalization error. This principle ensures the model’s enhanced ability to generalize and make accurate predictions on unseen data. As a testament to its exceptional prowess, SVR has proven its mettle across a myriad of diverse applications, reinforcing its significance in the realm of advanced machine learning models. Within the ambit of our study, we further augmented the SVR model’s capabilities by blending it with the formidable radial basis function (RBF) kernel. This blending process is instrumental in calculating the proximity and similarity between two data points, a critical aspect that underpins SVR’s predictive capabilities in our research endeavors [
58,
59,
60]. The judicious combination of SVR and the RBF kernel fortifies the model’s capacity to capture intricate patterns and relationships within the data, culminating in a potent tool for accurate prediction and forecasting in our study.
The practical applications of SVR using the RBF kernel demonstrate its effectiveness across several circumstances. The potential applications of this technology include estimating real estate prices based on property qualities, analyzing film ratings based on reviews, evaluating product demand based on pricing dynamics, and forecasting a company’s sales trajectory. In situations when the data landscape exhibits non-linearities or is affected by noise, SVR with the RBF kernel is a suitable option that should be taken into account and put into practice. When confronted with complex non-linear data or noisy data, it is appropriate to consider using SVR with the RBF kernel. This choice deserves careful consideration and practical implementation. In situations where the data environment is characterized by complex non-linear relationships or vulnerability to disruptive noise, the application of SVR with the RBF kernel proves to be a suitable option, deserving thorough evaluation and purposeful deployment.
Figure 4 illustrates the threshold and error definition within the SVR method through the depiction of an exemplary scatter plot. In this context, SVR endeavors to generate a regression model that accurately predicts the relationship between two variables. The scatter plot showcases data points representing the relationship between the independent variable (X-axis) and the dependent variable (Y-axis). SVR’s primary objective is to fit a regression line that best represents this relationship. However, it is essential to define specific data ranges that contribute to the generation of the regression model while neglecting data points outside these ranges. The threshold in
Figure 4 delineates this defined data range, segregating the data points that fall within its boundaries from those that lie outside. Data points within the threshold are considered relevant and influential for building the regression model. Conversely, data points outside the threshold are treated as outliers and are not factored into the model’s construction. The error bars in the figure represent the magnitude of error associated with each data point concerning the threshold. SVR seeks to minimize these errors to achieve a more accurate regression model. The error bars indicate how much each data point deviates from the regression line, with larger error bars signifying higher discrepancies.
The SVR method, guided by the principle of structural risk minimization, aims to optimize the regression model by striking a balance between fitting the data points within the threshold while minimizing the errors associated with them. This process facilitates the creation of a robust and generalizable regression model that accurately captures the underlying relationship between two variables. By effectively defining the threshold and mitigating the errors, SVR provides a powerful tool for generating regression models capable of making accurate predictions, even on unseen data. The strategic application of this method ensures the reliability and efficacy of the regression model in diverse real-world scenarios, solidifying its significance in the realm of advanced machine learning and predictive modeling.
3.6. Decision Tree
DTs are prominent and extensively utilized machine learning methods renowned for their capacity to facilitate easy understanding in predictive and classification solutions. They hold great significance due to their inherent interpretability and ability to generate clear, intuitive rules for decision-making. The process of constructing a DT involves dividing the input data into distinct groups or subsets based on certain features or attributes. Each division represents a node in the tree, and this process continues recursively until a decision or prediction is reached at the leaf nodes. At each node of the DT, a specific attribute is chosen to make a decision. This selection is based on its ability to segregate the data into distinct groups with homogeneous characteristics. The attribute that leads to the most significant reduction in impurity or increase in information gain is selected, thereby enhancing the tree’s predictive power. DTs are highly versatile and can be applied to both regression and classification tasks. For classification problems, the tree’s leaf nodes correspond to specific class labels, while, for regression problems, they represent predicted continuous values.
The interpretability of DTs is a key advantage, as the rules governing each split are easily understandable and can be visualized, making them particularly useful in decision-making processes. Moreover, DTs are robust against outliers and can handle both categorical and numerical data effectively. By leveraging the clustering algorithm, DTs repeatedly divide the data into subsets, ultimately leading to decision outputs that aid in making accurate predictions and classifications. This adaptability and ease of interpretation have contributed to DTs’ widespread application across various domains, ranging from finance and healthcare to marketing and environmental research [
61,
62,
63].
Figure 5 showcases a DT analysis, providing a visual representation of the decision-making process employed by the DT algorithm. DT analysis is a powerful tool used in various fields, including machine learning, data mining, and decision support systems, to make informed and structured decisions based on input data. The figure presents a tree-like structure, starting with the root node at the top, which represents the initial decision point. Each subsequent node in the tree represents a decision based on a specific attribute or feature from the input data.
3.7. Random Forest
RF is a powerful and widely used supervised learning algorithm that leverages the collective intelligence of multiple decision trees to address both classification and regression problems. As a versatile ensemble method, it harnesses the strength of individual decision trees and combines their outputs to arrive at robust and accurate predictions. In the context of classification tasks, an RF constructs multiple decision trees, each trained on different subsets of the data with replacement (bootstrapping). Each tree is trained using a random subset of features, ensuring diversity and reducing overfitting. The final classification decision is made based on a majority vote from all the individual trees. For regression problems, the RF method operates similarly, but, instead of a majority vote, it averages the outputs of all the decision trees to arrive at the final regression prediction.
One of the advantages of using an RF is its ability to handle high-dimensional data and large datasets. Additionally, the RF approach is less prone to overfitting compared with single decision trees. In this study, the RF method was employed with specific hyperparameter settings. To optimize these hyperparameters effectively, the GridSearchCV method was utilized. GridSearchCV performs cross-validation, which involves splitting the data into multiple subsets (folds) and training the model on different combinations of the training and validation data. This process ensures more reliable evaluation of the hyperparameters’ impact on the model’s performance. Moreover, a 5-fold cross-validation was applied, meaning that the dataset was partitioned into five subsets, and the model was trained and validated five times, with each subset serving as a validation set once. This procedure helps to obtain a more robust evaluation of the model’s performance and generalizability. The combination of RF with hyperparameter tuning using GridSearchCV and cross-validation ensures that the model is well optimized and capable of delivering accurate and reliable predictions for the specific classification or regression problem under study [
64,
65].
Figure 6 illustrates the general structure of the RF classifier (RFC) model used in this research. The RF is an ensemble learning method that combines multiple decision trees to create a more robust and accurate classification model. The figure showcases the architecture of the RFC model, starting with the collection of individual decision trees, represented as tree nodes. Each decision tree is constructed based on a random subset of the training data and a random subset of features.
3.8. Extra Trees
ETs, also known as extremely randomized trees, is a machine learning model that belongs to the ensemble learning family, similar to the RF algorithm. It is particularly useful for both classification and regression tasks. The main distinction between the ETs model and a traditional RF lies in the way decision-making is performed at each node in the tree. In an RF, the decision at each node is based on a subset of features randomly selected from the available set of features, and the majority vote from these trees determines the final classification decision. In contrast, ETs take a more random approach. Not only do they select random subsets of features for each node, but they also choose random cut points to divide the data at each node. This randomization introduces additional diversity and variability among the individual trees in the ensemble.
Another key difference is that ETs use the entire original sample as input during the training process, whereas RF typically uses bootstrapped samples (i.e., random samples with replacement) for each tree. By incorporating these sources of randomness, ETs aim to reduce the variance in the model, making them less susceptible to overfitting and enhancing their generalization capabilities. This property is especially valuable when working with high-dimensional data or noisy datasets. During the classification phase, the ETs model aggregates the predictions from all the individual trees and determines the final classification decision based on the majority vote among the trees. This democratic voting process helps to ensure robust and accurate predictions. Due to their robustness, simplicity, and ability to handle high-dimensional datasets, ETs have found widespread applications in various fields, including computer vision, bioinformatics, and finance [
66,
67]. The randomization techniques employed by ETs contribute to their effectiveness as a powerful and flexible machine learning algorithm.
Figure 7 depicts the structure of the ETs model applied to the river flow data in this research. As an extension of the RF algorithm, the ETs model, also known as extremely randomized trees, exhibits distinct characteristics in its construction and decision-making process.
Figure 7 exemplifies the unique structure of the ETs model, highlighting its randomization techniques and ensemble learning principles. By incorporating these distinct characteristics, the ETs model proves to be a powerful and effective algorithm for handling river flow data and other complex datasets.
Figure 7 in the research paper illustrates the structure and functionality of ETs when applied to river flow data. ETs, or extremely randomized trees, are highlighted for their unique construction and decision-making processes. The figure showcases the ensemble of individual trees and emphasizes the randomization techniques employed in their creation. This visual representation helps convey how ETs use the entire original sample during training, offering robustness against overfitting and enhancing generalization capabilities. As a powerful and flexible machine learning algorithm, ETs have found widespread applications in various fields, including computer vision, bioinformatics, and finance. In the context of river flow data analysis,
Figure 7 serves as a valuable visual aid, making complex concepts more accessible and enhancing the research’s overall clarity and impact.
3.9. Federated Learning for Stream Flow Rate Estimation
In this section, we present a pioneering approach for estimating stream flow rates through the application of federated learning. This innovative framework facilitates the construction of predictive models while concurrently safeguarding the confidentiality of data from individual stream gauging stations. We operationalize this approach within the context of the Beşdeğirmen (E12A003) station situated within the Porsuk Stream sub-basin of the Sakarya Basin, as well as the Melekbahçe (E21A033) station located within the Munzur water sub-basin of the Upper Euphrates basin. These stations gather essential daily metrics, including average flow rates, mean air temperatures, and cumulative daily precipitation data. Referred to as federated learning for stream flow rate estimation (FL-SFRE), this novel method represents a paradigm shift in stream and river flow prediction. It offers a solution to the quandary of predicting such rates while preserving the integrity of data collected across diverse geographical locales. Conventional stream flow rate prediction methodologies rely heavily on centralized data aggregation from an array of stream gauging stations. This practice, however, raises substantial concerns regarding the security and privacy of data. In stark contrast, federated learning engenders a modus operandi that fosters model training by tapping into data distributed across multiple stations, thus circumventing the need for centralizing primary data.
The operational trajectory commences with data partitioning into distinct subsets, each corresponding to the data amassed by individual stream gauging stations and retained locally. The foundation rests upon initiating a global machine learning model with shared weights and biases. Employing sophisticated algorithms, such as federated averaging, each station independently imparts training to this global model using its localized dataset. Notably, throughout this training process, stations refrain from transmitting raw data; instead, they only exchange model updates, or gradients, with the central server. This decentralized strategy is pivotal, as it safeguards the confidentiality of sensitive data, fortifying data privacy and security. With each iterative training cycle, the central server adeptly amalgamates the model updates disseminated by each station, culminating in an updated global model. Subsequently, this enhanced model is reciprocated to each station for supplementary localized training. This iterative progression ensues until the model attains convergence and acquires satisfactory performance metrics, validated against each station’s local benchmark dataset. The core tenet of the proposed federated learning technique rests upon its capacity to integrate diverse data sources holistically. This convergence adheres to a paramount principle—preserving data privacy—while yielding forecasts of unparalleled accuracy for stream flow rates. The crux of this methodology hinges on the seamless amalgamation of data sources while vigilantly safeguarding the confidentiality of this information. The federated learning framework is architecturally designed to obviate the necessity for central data pooling, thereby ensuring the preservation of data sources, a salient concern, mainly when dealing with sensitive hydrological data.
Concurrently, the bedrock principle of federated learning resides in its exceptional ability to harness the collective intelligence inherent within diverse datasets. This entails a meticulous orchestration that seamlessly combines data from each station while retaining the unique nuances intrinsic to each data source. This collaborative and decentralized amalgamation fundamentally augments the predictive potential of the model. A distinguishing factor of this approach is its profound precision in rendering forecasts. By incorporating diverse data inputs—each station contributing its array of contextual factors, geographical characteristics, and variables—the model’s generalization capabilities are significantly enriched. This augmentation equips the model to predict effectively within the purview of various scenarios and accomplish this task with remarkable precision. Furthermore, the scope of federated learning transcends the immediate realm of hydrological predictions. The applicability of this technique extends expansively to domains where data privacy preservation stands as a paramount concern and prediction accuracy is of non-negotiable significance. Industries such as healthcare, finance, and energy management are poised to benefit substantially from this approach. Undoubtedly, the proposed federated learning methodology signifies a transformative advancement in the domain of predictive modeling. It symbolizes a departure from conventional techniques, often streamlining data for analytical convenience. Conversely, it champions the integration of multifaceted data sources, harnessing this diversity to enhance predictive prowess. By advocating for the sacrosanctity of data privacy while concurrently realizing predictive accuracy, this methodology forges a path that empowers data-driven insights, all while upholding the sanctity of confidential information.
As seen in
Figure 8, the use of federated learning for the purpose of estimating stream flow has a multitude of advantages. Firstly, it facilitates the utilization of data derived from many geographical sites, hence including a diverse range of hydrological attributes. Additionally, this solution addresses the issue of privacy issues related to data sharing, rendering it appropriate for settings where maintaining data secrecy is of utmost importance. Furthermore, the implementation of this collaborative learning technique enables the exchange of knowledge among various stations, hence leading to the development of a more precise model for the estimation of stream flow rate. FL-SFRE, an acronym for federated learning for stream flow rate estimation, is a highly promising approach towards achieving sustainable water resource management and effective environmental monitoring. This technology facilitates accurate prognostications while safeguarding confidential information acquired from diverse geographic regions. Through the utilization of federated learning, it is possible to attain precise and dependable estimations of stream flow rates. This advancement holds the potential to enhance water resource management and conservation efforts significantly, hence ensuring the sustainability of these valuable resources for future generations [
68,
69,
70].
In our research, we implemented the innovative approach of federated learning to estimate stream flow rates using data collected from two distinct stream gauging stations: Beşdeğirmen (E12A003) in the Sakarya Basin’s Porsuk Stream sub-basin and Melekbahçe (E21A033) in the Upper Euphrates basin’s Munzur water sub-basin. The primary objective was to develop a predictive model for stream flow rate estimation while ensuring the confidentiality and privacy of data at each station. The application of FL-SFRE involved a well-defined process. Initially, we partitioned the data collected by both stream gauging stations, ensuring that no raw data were exchanged between them or with a central server. Instead, data subsets were created, and each station retained its data locally for analysis.
To initiate the federated learning process, a global machine learning model was initialized with shared weights and biases. The subsequent step involved the independent training of this global model at each station, using their respective local data, and employing the federated averaging algorithm. During this training phase, model updates, or gradients, were exchanged between stations rather than raw data. This ingenious approach preserved the privacy of sensitive information related to flow rate, temperature, and precipitation, ensuring that such data remained securely stored at each station. Following the completion of local model training, the central server aggregated the model updates received from each station. An updated global model was derived by calculating the weighted average of the model parameters. This global model, enriched with insights from both stations, was then deployed back to each station for additional local training, continuing the iterative process. The success of the federated learning approach was contingent on evaluating the model’s performance on each station’s local validation set. This evaluation allowed us to monitor the model’s convergence and assess its generalization capability.
By embracing the federated learning approach, we harnessed the collective knowledge from both stream gauging stations while ensuring the confidentiality and decentralized nature of the sensitive data. Consequently, this method yielded a more robust and accurate stream flow rate estimation model compared with traditional centralized approaches that mandate the sharing of raw data. The advantages of employing FL-SFRE is manifold. Notably, this approach significantly enhances data privacy and security since it obviates the need for centralizing data collection and processing. Moreover, the collaboration fostered by this decentralized learning paradigm enables the utilization of data from diverse geographical locations, thereby capturing a broader spectrum of hydrological characteristics. This unique amalgamation of strengths from multiple stations resulted in an efficient model for accurately estimating stream flow rates, making it highly applicable in real-world water resource management and environmental monitoring scenarios. The federated learning approach holds promise for the sustainable management of water resources, where accurate and confidential estimation of stream flow rates is crucial for informed decision-making and environmental preservation.
While this study exclusively employs a pair of predictors, the integration of multivariate methodologies remains profoundly advantageous. Such techniques hold the capacity to discern intricate interactions interwoven within the two predictors. A prime illustration resides in the utilization of the SVR algorithm, which adeptly captures elusive non-linear relationships that might exist between the predictors. This augmentation significantly bolsters predictive accuracy. Moreover, the realm of multivariate methods extends its utility to the realm of managing incomplete datasets. The RF algorithm, for instance, serves as an adept tool for the imputation of absent values. This facet gains paramount significance in scenarios where datasets are plagued by substantial gaps in information. Through judicious imputation, the predictive accuracy witnesses a marked enhancement. In the broader context, the adoption of multivariate methods bestows a dual gift of precision and resilience upon predictive models. The consequential amelioration in predictions’ fidelity and dependability underscores the continued merit of employing such techniques, even in cases where the model revolves around a mere two predictors.
In the domain of predictive modeling, the very essence of multivariate methods encapsulates a dynamic interplay between various variables, granting a more comprehensive grasp of the underlying mechanisms. Within this interwoven fabric, intricate relationships often evade the discernment of univariate approaches, thereby amplifying the significance of their inclusion. Furthermore, the incorporation of multivariate methodologies unveils an avenue to combat the inherent incompleteness pervasive in real-world datasets. By resorting to intricate algorithms such as the random forest, the void left by missing data points can be artfully filled. This meticulous stitching of the data tapestry effectively mitigates the distortions that unfilled gaps can introduce, ultimately refining the predictive potential of the model. Hence, the resolute conclusion emerges that embracing multivariate methods, despite the apparent simplicity of the predictor count, reverberates as a discerning strategy. Their innate ability to unravel complex interactions and their adeptness in handling the inevitable imperfections of data coalesce into a formidable framework, fortifying the precision and robustness of predictive inferences.
3.10. Wavelet Transform
WT is a powerful signal analysis tool widely used to observe and analyze signals in the time–frequency domain. This method allows the examination of non-consecutive and stationary signals by decomposing time series data into its subcomponents and analyzing dominant repetitions and their changes over time [
71]. In our study, the original data comprised average river flow rate, total precipitation, and average temperature. To enhance the accuracy of river flow estimation, we applied wavelet conversion analysis, which subdivided and transformed the data. Notably, the hybrid method developed using WT demonstrated a significant improvement in river flow estimation. The research article primarily focused on machine learning practices for predicting stream flow data, utilizing daily average flow data from two stream gauging stations in Turkey, along with daily average temperature and total precipitation data. We employed five different machine learning algorithms and compared their results. Remarkably, the RF and ETR models outperformed the others in predicting flow rates. To further enhance the machine learning models’ performance, we adopted the WT, which resulted in even better outcomes. Among several wavelet filters considered, including Mexican Hat, Daubechies, Biorthogonal, Symlets, Haar, Coiflets, Morlet, and Meyer, we selected the Daubechies (db10) wavelet family. Each step of the wavelet conversion involved applying the wavelet function to the input data. We calculated wave function values and scaling function values through ten replicates to obtain recurring values used to refine the computational results [
72]. The utilization of the WT, particularly the Daubechies wavelet family, significantly contributed to the research’s success in achieving higher accuracy in predicting river flow rates. This approach proves valuable for enhancing the performance of machine learning models in similar hydrological analyses, providing researchers and practitioners with a powerful tool to make more informed decisions in water resource management and environmental monitoring.
The results presented in this study emphasize the significant influence of implementing WT in enhancing the accuracy of river flow forecasts. The extent of this augmentation becomes more evident when the capabilities of machine learning algorithms are effectively combined. The Daubechies wavelet family is a well-suited choice in this complex combination, effectively managing the crucial need for time–frequency resolution, necessary for precise forecasts. Utilizing ten iterations of computations for both wave function values and scaling function values enhances the precision achievable in the obtained findings. Remarkably, this novel methodology has the potential in the domain of river flow forecasts and other hydrological contexts, including flood forecasting and the critical field of drought monitoring. The adaptability of this strategy reflects its strength beyond its limited usefulness. In addition to its applications in hydrology, this approach has the potential to impact several fields significantly, such as health and finance, which are characterized by complex systems and dynamics. Both domains need a detailed analysis of signals that change over time. The WT method can effectively identify complex temporal patterns, making it a crucial instrument in decoding medical diagnoses that unfold over time and shedding light on the subtle changes that influence financial markets. Therefore, the importance of this study extends beyond its immediate results, influencing a wide range of scientific and practical applications. The recognition of the symbiotic relationship between Wavelet Transform (WT) and machine learning as a cutting-edge force in enhancing prediction accuracy is evidence of the ongoing significance of multidisciplinary collaboration. The combination of expertise in signal processing and machine learning not only enhances our understanding of hydrological dynamics but also establishes a model for creative problem-solving that goes beyond specific fields.
3.11. The Environment: Software Tools and Hardware
Leveraging a hybrid methodology that harmoniously blends an array of open-source software tools and programming languages, our in-depth research venture took shape. This toolkit, a compilation of essential instruments, was meticulously curated to wield its prowess across the gamut of tasks: from data preprocessing to the orchestration of model development, all the way through to comprehensive analysis. At its heart, this ensemble revolved around the Python language, its latest incarnation (version 3.10) steering the ship with finesse. Within this Python-centric landscape, Scikit-learn 0.24.2, Keras 2.0, and TensorFlow 2.6.0, took their positions, each seamlessly intertwining its capabilities to bolster interoperability and augment the overall machinery. A pivotal point in this orchestration was the training of our machine learning colossi—a task that beckoned the establishment of an experimental ecosystem, meticulously calibrated to ensure peak performance. The lynchpin of this environment was the graphics processing unit (GPU), a technological marvel that unleashed blistering computational speeds. Complementing this computational juggernaut was the Intel Core i9 processor, flanked by 64 GB of RAM, fortified with the cutting-edge prowess of the NVIDIA GeForce RTX 3080 graphics card—a symphony of power and precision. Bolstering our data partitioning approach, we ingeniously introduced real-time data augmentation—a technique that bestows our models with the prowess to navigate a kaleidoscope of scenarios. This augmentation strategy injected variations into the original dataset, enriching the model’s acumen to discern and navigate complexities beyond the scope of its training. This augmentation pilgrimage not only engendered dataset horizons but also fortified the bedrock of our model’s resilience.
Before model training unfurled its wings, a meticulous prelude was performed—a rite of data preprocessing that conferred uniformity upon the dataset. Further, a harmonization process was embarked upon, employing the dataset’s mean and standard deviation, aligning the data’s essence into harmonious unison—paving the path to smoother training sessions. The optimization odyssey was navigated with the Adam optimizer at the helm—a quintessential choice for traversing the meandering terrain of deep learning. The configuration boasted a learning rate of 1 × 10⁻⁵, hand in hand with a decay factor of 0.2. The choice of a judicious batch size, set at 16, served as a strategic measure to navigate computational load management, ensuring harmonious convergence.
Training unfolded over 750 epochs—an enduring journey punctuated by pauses, where validation accuracy took center stage. This iterative evaluation afforded panoramic insights into the model’s maturation; its performance dissected at the crossroads of every epoch. Through the confluence of GPU empowerment, hyperparameter refinement, the choreography of data partitioning artistry, real-time augmentation, and rigorous preprocessing, a symphony of precision and resilience emerged—the embodiment of machine learning models primed to leave indelible footprints.
Combining Federated Learning and Wavelet Transform:
Our innovative endeavor introduces the fusion of WT and FL in the domain of stream flow rate estimation. This pioneering integration represents a distinct shift in predictive modeling, enabling accurate forecasts while safeguarding the confidentiality of localized data. To elaborate on this novelty, let us delve into the core principles and mechanisms that underpin this groundbreaking approach. Wavelet transform, renowned for its ability to extract frequency components from signals, finds novel application in our study. By amalgamating DWT with the FL framework, we extend its capabilities to water quality parameters. Our concept envisions collecting time series data encompassing various water quality indicators like pH, dissolved oxygen, turbidity, and nutrient levels. Through DWT, we extract valuable frequency components from these indicators, enabling the identification of temporal patterns and anomalies across different scales. This application forms the foundation for accurate stream flow rate estimation by incorporating comprehensive insights from diverse water quality metrics. The core novelty of our approach emerges through the strategic integration of wavelet transform with federated learning for stream flow rate estimation (FL-SFRE). This novel fusion tackles the conundrum of predictive modeling while preserving data privacy across geographical locales. Conventionally, stream flow rate predictions rely on centralized data aggregation, risking data security. In contrast, our method introduces a decentralized approach by harnessing data from multiple stream gauging stations while ensuring the confidentiality of raw data. The FL-SFRE approach is architecturally designed to circumvent central data pooling, preserving the integrity of sensitive hydrological data. The synergy between WT and FL materializes through the operational trajectory of FL-SFRE. We partition data into subsets corresponding to individual stations, which retain essential daily metrics locally. A global machine learning model is initiated, and each station trains this model using localized datasets via sophisticated algorithms like federated averaging. Notably, the exchange of model updates with the central server eliminates the need for raw data transmission, ensuring data privacy. This iterative process culminates in an updated global model, eventually leading to enhanced predictive accuracy.
The novelty of our approach lies in the seamless amalgamation of WT’s frequency-based insights and FL’s decentralized, privacy-preserving framework. This convergence empowers the model to predict stream flow rates accurately across diverse scenarios while preserving the sanctity of data privacy. Furthermore, this pioneering concept of combining diverse data sources with FL transcends the hydrology domain, offering insights for various industries grappling with data privacy and prediction accuracy concerns. In the healthcare, finance, and energy management sectors, our approach’s potential is transformative. To conclude, our novelty stems from the synergy between wavelet transform and federated learning, redefining predictive modeling by harmonizing data-driven insights with stringent data privacy requirements. This fusion of diverse data sources, coupled with decentralized training, holds the promise of accurate predictions across multifaceted scenarios while safeguarding sensitive information, marking a significant advancement in the realm of predictive modeling.
In summary, FL revolutionizes stream flow rate estimation by decentralizing data collaboration, while DWT fortifies our hybrid approach to water quality prediction by deciphering intricate temporal patterns. Both methodologies empower the field of hydrology with unprecedented accuracy, versatility, and data privacy, shaping a new trajectory for predictive modeling and resource management. Meanwhile, the essence of DWT in our hybrid methodology lies in its potential to dissect water quality parameters into distinct frequency components. This approach empowers us to recognize patterns and anomalies across various temporal scales. Integrating DWT into our analysis, we couple ML algorithms to predict future water quality trends. Using extracted wavelet coefficients as features and historical water quality data as labels, we leverage techniques like LR, SVR, DT, RF, and ETR to enhance predictive capabilities. Our implementation involves a three-level wavelet tree for velocity data, with Daubechies filters steering our h(n) and g(n) filters. This integration amplifies our methodology’s efficacy in achieving precise predictions amidst dynamic environmental conditions.
4. Statistical Results
For this research study, we utilized data from two stream gauging stations, namely Beşdeğirmen (E12A003) and Melekbahçe (E21A033), to estimate stream flow rates using the federated learning approach. The Beşdeğirmen station is located in the Porsuk Stream sub-basin of the Sakarya Basin, while the Melekbahçe station is situated in the Munzur water sub-basin of the upper Euphrates basin.
At the Beşdeğirmen station, the dataset comprised daily average flow, daily average precipitation, and daily average air temperature data, spanning 1 October 1979 to 30 September 2022, with a total of 14,974 daily data points. For model training, 10,593 daily data points from 1 October 1979 to 30 September 2008 were used, and 5113 daily data points from 1 October 2008 to 30 September 2022 were employed for testing.
Table 1 presents the statistical values derived from this dataset, providing valuable insights into the characteristics of the data.
Similarly, at the Melekbahçe station, the dataset included daily average flow, daily average precipitation, and daily average air temperature data, covering the period from 1 October 1986 to 30 September 2022, with a total of 8766 daily data points. For model training, 7305 daily data points from 1 October 1986 to 30 September 2006 were used, and 1461 daily data points from 1 October 2006 to 30 September 2022 were employed for testing.
Table 2 presents the statistical values derived from this dataset, offering key insights into the data distribution and characteristics. By leveraging the federated learning approach, we aim to build predictive models for both stations while ensuring data privacy and collaboration between the stations. The statistical results obtained from these datasets will serve as the foundation for developing accurate and robust stream flow rate estimation models using advanced machine learning algorithms.
Table 1 presents a comprehensive overview of the data collected from two stream gauging stations, namely Beşdeğirmen (E12A003) and Melekbahçe (E21A033). The table contains essential parameters, including the average flow rate (Favg), average air temperature (Tavg), and total precipitation (Psum), recorded at each station on different dates. The “Station” column indicates the name or code of the respective station, while the “Date” column provides the specific date of the recorded data. The “Average Flow Rate” column represents the daily average water flow in the stream, measured in cubic millimeters per day (mm
3/day). Additionally, the “Average Air Temperature” column displays the daily average temperature recorded at each station, measured in degrees Celsius (°C), while the “Total Precipitation” column shows the total amount of rainfall received on each date, measured in millimeters (mm). These valuable data will be employed to develop a predictive model for stream flow rate estimation, considering the interplay between flow rate and environmental factors such as air temperature and precipitation. The proposed federated learning approach will combine data from both stations, preserving data privacy while achieving accurate stream flow rate predictions.
Table 2 presents a comprehensive overview of the federated learning process employed to estimate stream flow rates using data from two stream gauging stations, Beşdeğirmen (E12A003) and Melekbahçe (E21A033). The table includes essential columns providing information on the iteration round, station name, the number of local data samples, local model training loss, and model updates (gradients) obtained after local model training for each station. During Round 1, both stations contributed their data for model training, resulting in specific model updates. Round 2 continued the process with updated models, showcasing further improvements. By collaboratively updating the global model while maintaining data privacy, the federated learning approach enhanced the accuracy and robustness of the stream flow rate estimation model, ultimately leading to more reliable predictions for both stations.
In
Table 3, the statistical values of the two datasets, Beşdeğirmen and Melekbahçe, are presented together for easy comparison. Each row corresponds to a specific data type (e.g., Daily average flow, Daily total rainfall, Daily average temperature), and the columns represent the statistical metrics (Mean, Minimum, Maximum, Standard Deviation, Distortion, Change, Mode, Median) for each dataset.
4.1. Machine Learning Applications Results
In this research, we performed an extensive analysis using five different machine learning approaches to estimate flow rates. The study utilized data from daily average flow rate measurements at the Beşdeğirmen and Melekbahçe stream gauging stations, along with the average daily air temperature and total precipitation data of their respective regions.
Table 4 and
Figure 9 present the specific results obtained for the Beşdeğirmen station. The findings demonstrated that the ETR and RF methods achieved the highest r
2_test values, performing impressively with scores of 88% and 85.8%, respectively. These high r
2_test values indicate the models’ excellent performance in accurately predicting the flow rate based on the input features.
Our study delved into a comprehensive exploration of five distinct machine learning methodologies for the estimation of flow rates. Leveraging daily average flow rate measurements from the Beşdeğirmen and Melekbahçe stream gauging stations, as well as average daily air temperature and total precipitation data from their respective regions, our analysis was multi-faceted. The results, meticulously detailed in
Table 4 and graphically depicted in
Figure 9 for the Beşdeğirmen station, served as a mosaic, illustrating the performance of each method. The outcome of our analysis unveiled the striking prowess of the ETR and RF techniques. With r
2_test values of 88% and 85.8%, respectively, ETR and RF displayed a marked capacity to predict flow rates with a commendable degree of precision. This substantiates the efficacy of these methodologies in capturing the intricate nuances within the dataset and attaining accurate estimations.
The results of this study underscore the effectiveness of machine learning techniques in accurately estimating flow rates and emphasize the superiority of the ETR and RF methods in this particular scenario. These findings hold immense significance for water resource management and hydrological analyses, providing valuable insights into the potential of machine learning to address complex real-world challenges. By employing such advanced approaches, we can enhance our understanding of water flow patterns and support informed decision-making for sustainable water resource management.
Table 4 presents a comparison of the training and test results for different machine learning models applied to the Beşdeğirmen dataset. The table showcases the performance metrics for each model, including the coefficient of determination (r
2) for both training and test datasets, as well as the explained variance (d) and RMSE for training and test datasets.
Figure 9 depicts the training and test results for the Beşdeğirmen dataset using different machine learning models. The figure illustrates the performance of each model in predicting the flow rate based on the input features. The x-axis of the graph represents the different machine learning models: LR, SVR, DT, RF and ETR. The y-axis represents the coefficient of determination (r
2) values, which indicate the goodness of fit of the models.
Another field of study is the analysis result performance comparison with machine learning for Melekbahçe, which is given in
Table 5 and
Figure 10. According to the analysis results, the RF, ETR and DVR algorithms were the most successful algorithms in the estimation. The forecast success rate was 70.9 for RF and 68.6 for ETR and SVR.
Table 5 presents a comparison of the training and test results for various machine learning models applied to the Melekbahçe dataset. The table showcases performance metrics for each model, including the coefficient of determination (r
2) for both training and test datasets, as well as the explained variance (d) and RMSE for training and test datasets.
WT was applied to improve the results of LR, SVR, DT, RF, and ETR machine learning methods used in the analysis. Comparative results for the Beşdeğirmen stream gauging stations of the Badger Creek in the hybrid model are given in
Table 6 and
Figure 11. The r
2_test values of the three best performing methods in analysis using DT were 97.4, 97.7, and 95.3 for LR, ETR, and RF, respectively.
From
Table 6, it becomes feasible to compare the model performance across a range of measures. Upon closer examination of the SVR model, it becomes apparent that it has a significantly high R-squared value (99.9%) on the training dataset. Nevertheless, the performance of this model significantly decreases when evaluated on the test dataset, with an accuracy of 85.8%. This observation indicates a tendency of the model to overfit the training data. The observed disparity between the R-squared values of the training and test sets suggests that the SVR model overfits the training data, leading to a diminished ability to generalize to new, unseen data. Equally significant is the assessment of other models within a comparable framework. The performance of each model may be analyzed by considering many factors, including the R-squared values for training and testing, the MAE, and the RMSE. This extensive examination facilitates a more comprehensive comprehension of the strengths and limits of each model.
The results for Melekbahçe are shown in
Table 7 and
Figure 12, and the two most successful methods based on r
2_test results were the RF and ETR algorithms, with success rates of 85.2% and 84.8%, respectively.
Table 7 presents a comparison of the training and test results for the Melekbahçe dataset using the WT in conjunction with different machine learning models. The table includes various performance metrics for each model, which are important indicators of the model’s predictive capabilities and generalization performance on unseen data.
Based on the results, it can be observed that the ETR model demonstrates the best performance, achieving high r2_train and r2_test values of 98.5% and 84.8%, respectively. Additionally, ETR yields the lowest RMSE values for both training and test datasets, indicating superior predictive accuracy. The DT and RF models also exhibit strong predictive capabilities, while LR and SVR show relatively lower r2 values and higher RMSE values.
After analyzing the above studies, the results in
Table 5 highlight the effectiveness of the ETR model when combined with the WT for predicting flow rates in the Melekbahçe dataset. These findings can assist researchers in selecting the most appropriate machine learning approach to estimate flow rates accurately in similar environmental datasets.
Figure 12 illustrates the performance comparison of the machine learning models with the WT applied to the Melekbahçe dataset for both training and test results. The x-axis represents the different machine learning models used in the study, including LR, SVR, DT, RF, and ETR. The y-axis represents the coefficient of determination (r
2) values, which indicate how well each model fits the data and explains the variance in flow rate predictions.
The blue bars represent the r2_train values, which measure the goodness of fit for the training dataset. Higher r2_train values signify better performance in capturing the relationships and patterns in the training data. The orange bars correspond to the r2_test values, which assess the models’ ability to generalize and predict flow rates accurately on unseen test data. Higher r2_test values indicate that the models can effectively generalize to new instances and make accurate predictions.
Table 8 presents a comprehensive comparison of the method results data for both the Beşdeğirmen and Melekbahçe datasets. The table includes the methods used, the stations for which they were applied, the method inputs (features), the best performing method for each station, the MSE values, and the coefficient of determination (R
2) percentages.
For the Beşdeğirmen station, five different methods, namely LR, SVR, DT, RF, and ETR, were applied using the average flow rate (Favg), total precipitation (Psum), and average air temperature (Tavg) as input features. Among these methods, the ETR achieved the best performance, with an MSE of 220.7 mm2 and an R2 of 88%.
Similarly, for the Melekbahçe station, the same methods were used with the average air temperature (Aavg), total precipitation (Ysum), and average stream flow (Savg) as input features [
30]. In this case, RF was found to be the best performing method, with an MSE of 4456.7 mm
2 and an R
2 of 70.9%. The table also presents results for the wavelet-transformed data, denoted as W-LR-SVR-DT-RF-ETR, for both stations. For Beşdeğirmen, the wavelet-transformed average air temperature (Aavg), total precipitation (Ysum), and average stream flow (Savg) were used, and the best performing method was the WT-ETR, with an impressive MSE of 96.3 mm
2 and an R
2 of 97.7%. Similarly, for Melekbahçe, the wavelet-transformed average air temperature (Aavg), total precipitation (Ysum), and average stream flow (Savg) were used, and the best method was the WT-RF, with an MSE of 3176.6 mm
2 and an R
2 of 85.2%. These findings highlight the effectiveness of the wavelet transform in improving the predictive performance of the machine learning models for both stations.
4.2. Discussion of Method Strengths and Limitations
These findings herald a milestone in water resource management and hydrological inquiry. Notably, our study underscores the proficiency of machine learning models in navigating the complexities of flow rate prediction. It is evident that ETR and RF stand as pinnacle models, manifesting superior predictive capabilities within this contextual framework. These revelations are poised to reshape the trajectory of water resource management, with machine learning emerging as a potent tool for real-world problem solving. Nevertheless, no study exists within a vacuum, and our methodology is not immune to certain assumptions and limitations. We acknowledge that the success of our models hinges on the robustness of the underlying data and the contextual congruence of the selected features. The potential impact of these assumptions on the precision of our estimations is a dimension deserving consideration. As we gaze into the future, avenues for refining our approach beckon. Further research could explore the dynamics of feature selection, potentially enhancing model performance by introducing more domain-specific variables. Additionally, a more exhaustive exploration of model hyperparameters could be undertaken to unveil even finer degrees of predictive accuracy. After analyzing the above studies, our methodology encapsulates an intricate dance between machine learning techniques and hydrological intricacies. The symphony of machine learning methodologies harmonizes with the intricacies of WT, opening new vistas for predictive hydrology. The potency of our approach is emblematic of a broader paradigm shift in water resource management—a shift marked by the seamless fusion of technology, data, and environmental understanding.


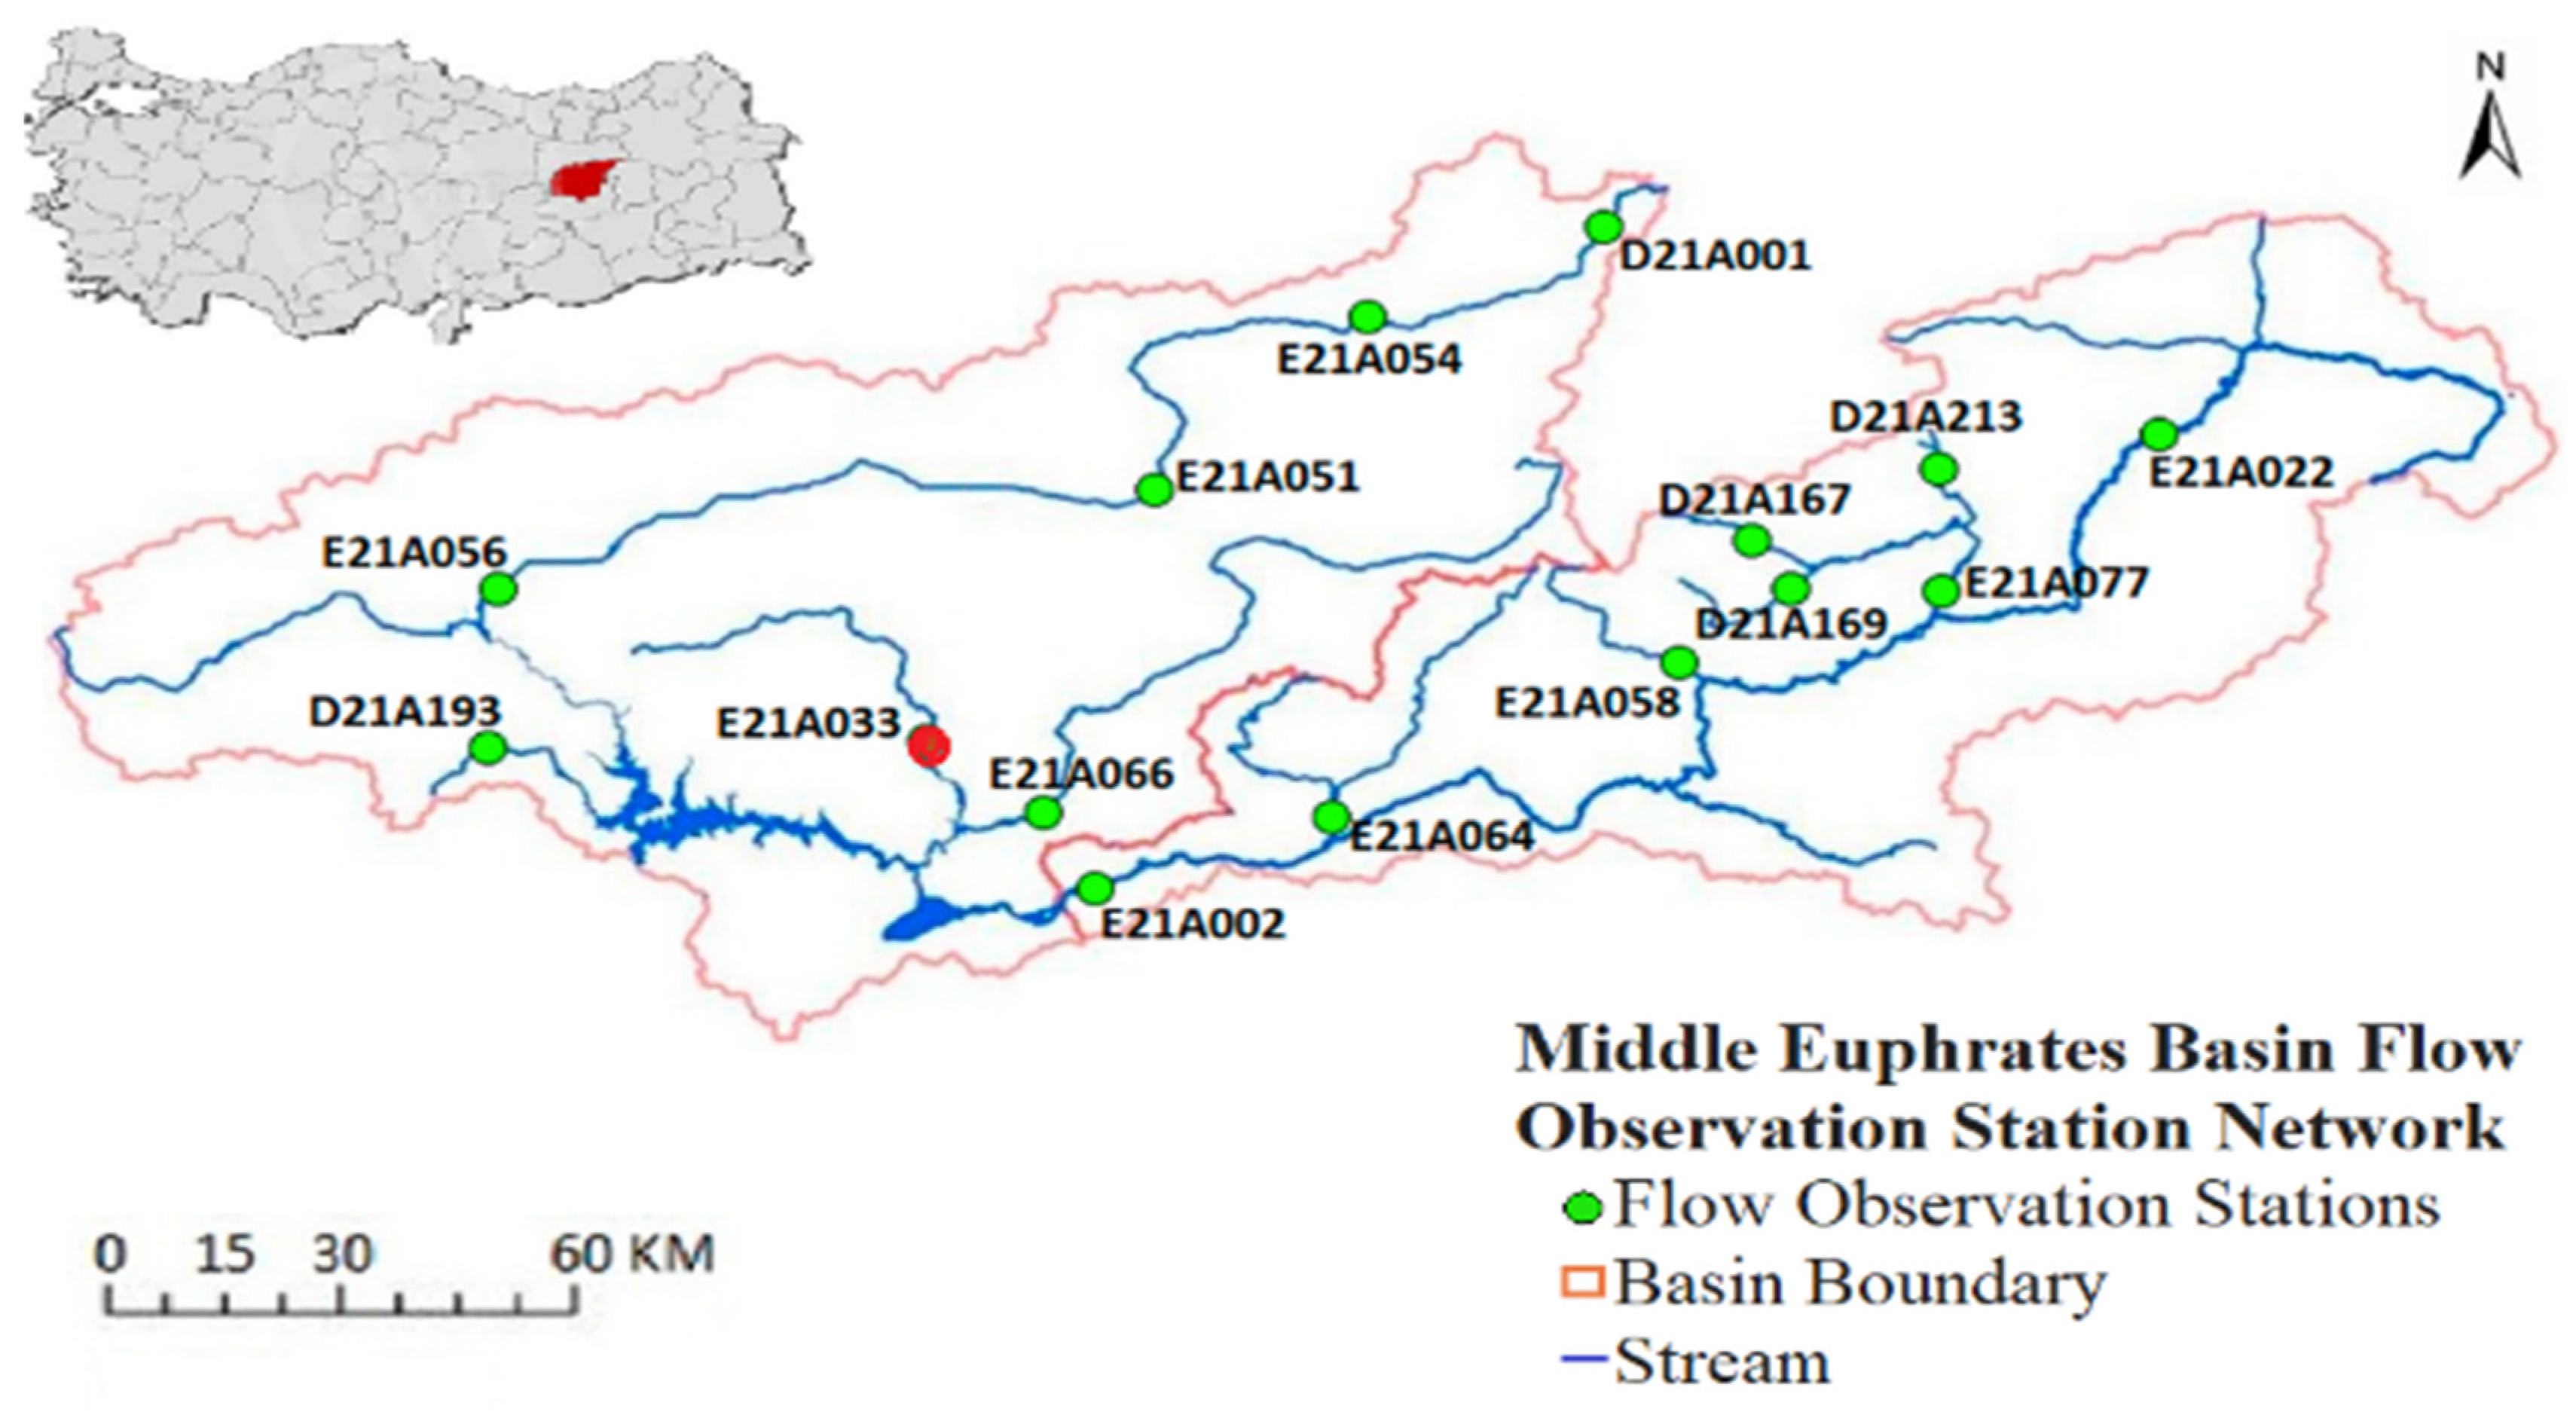


