
Suitability Assessment of Multilayer Urban Underground Space Based on Entropy and CRITIC Combined Weighting Method: A Case Study in Xiong’an New Area, China

Abstract
:1. Introduction
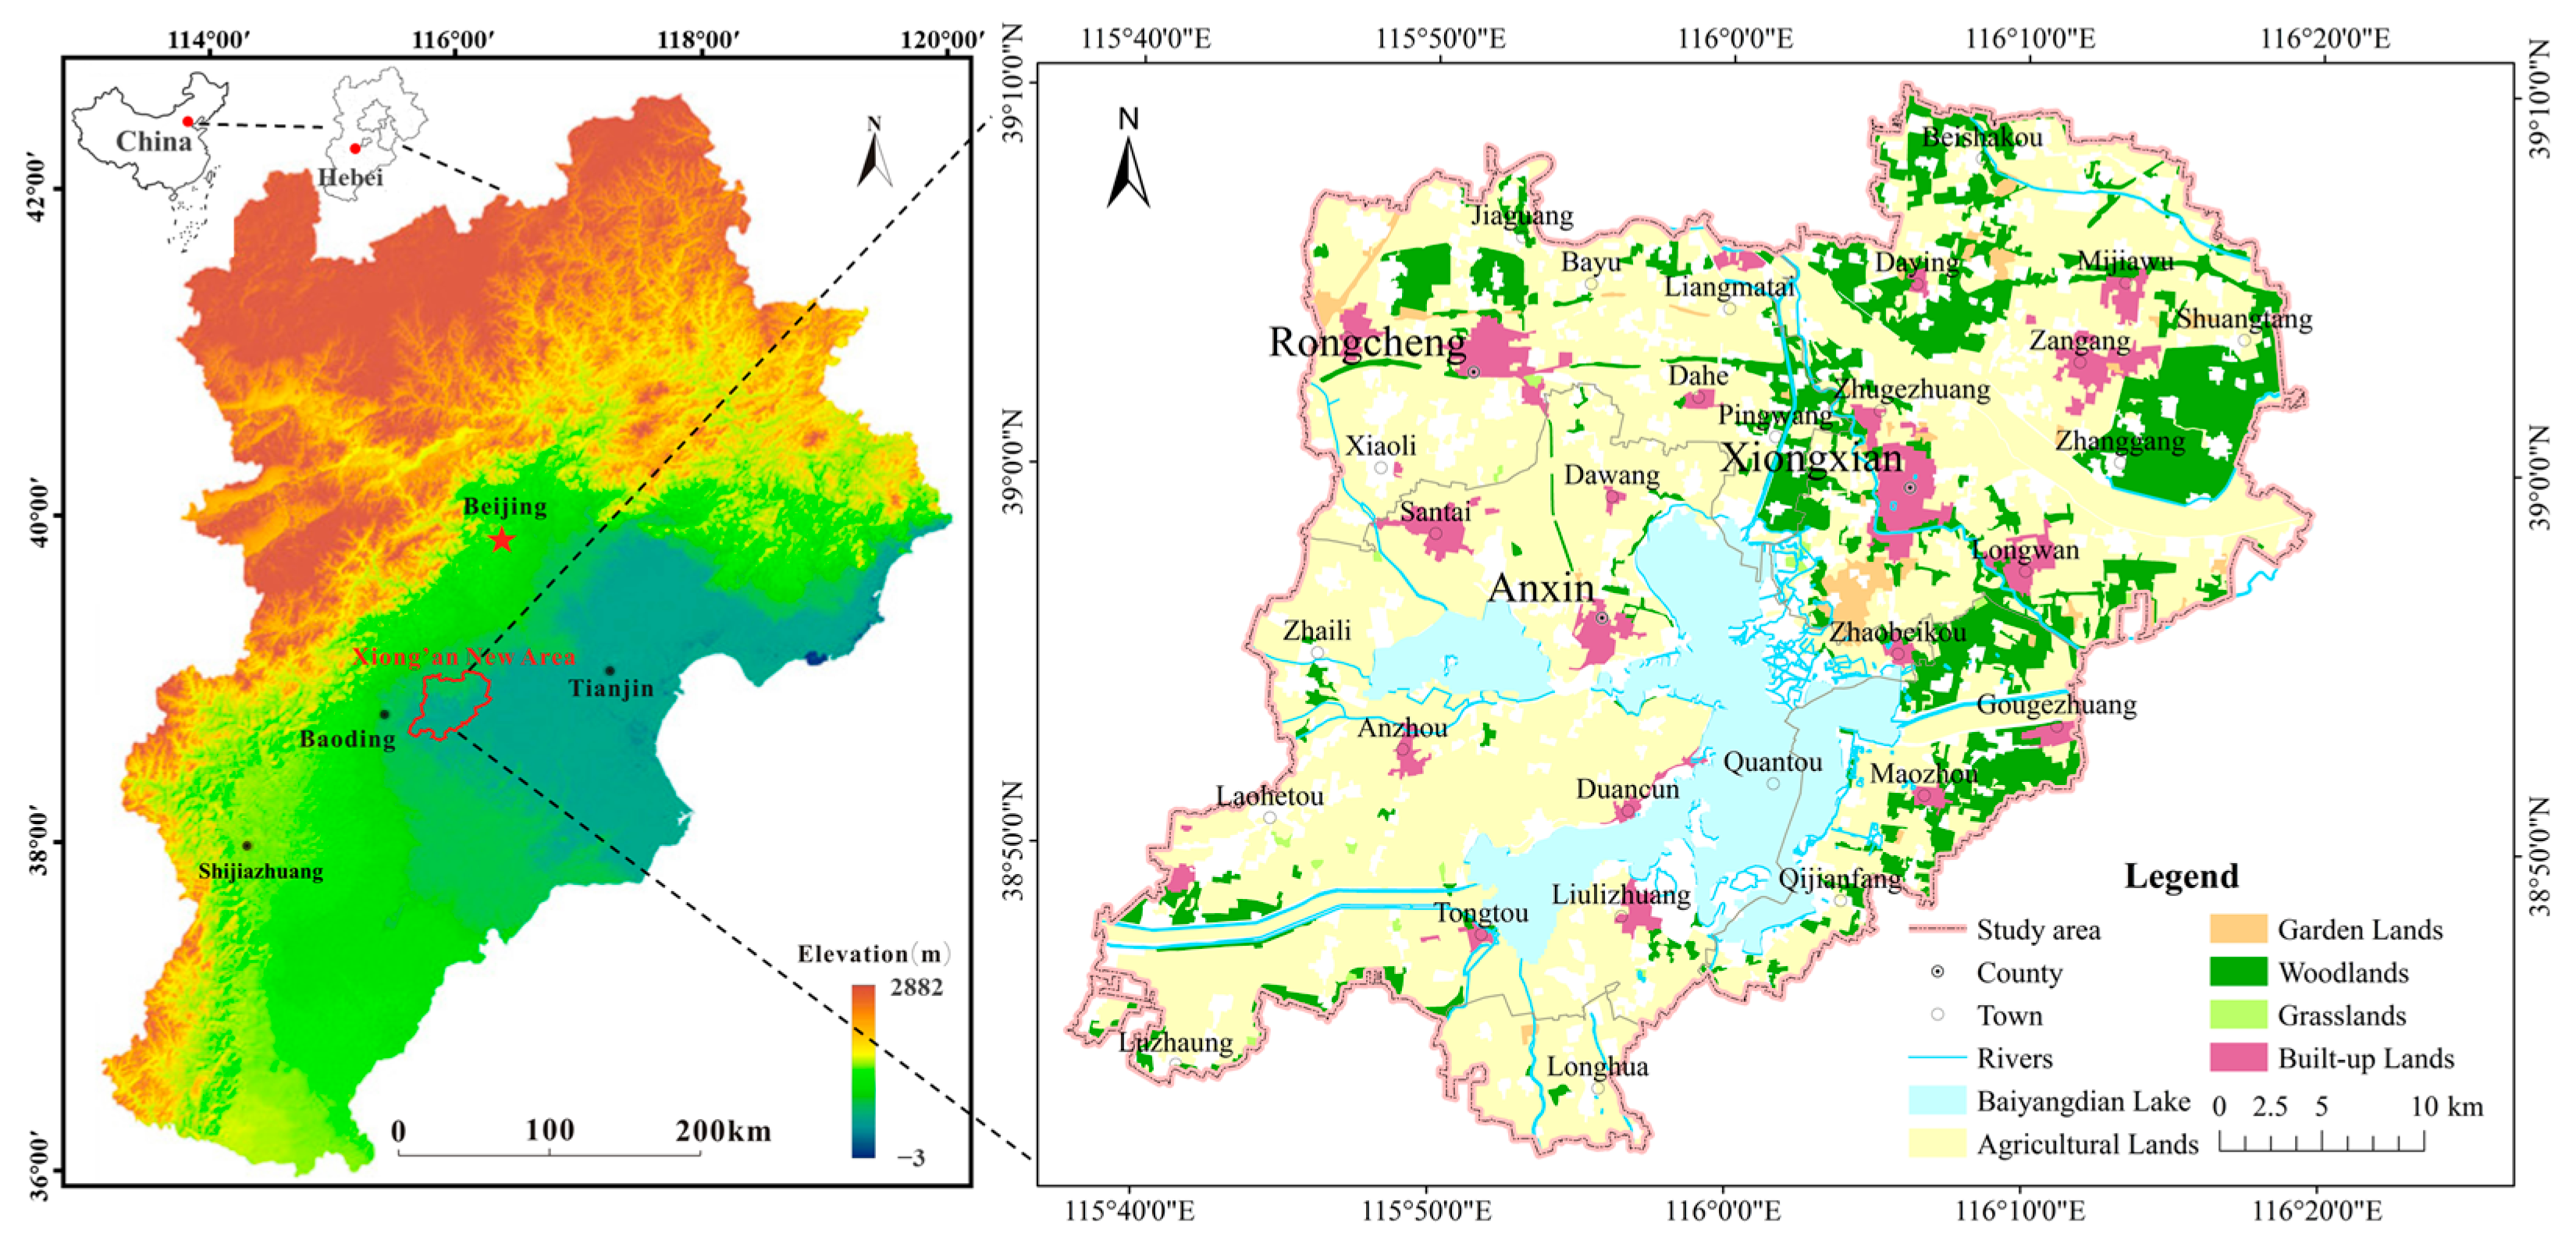
2. Study Area
3. Materials and Methods
3.1. Establishment of Suitability Assessment Frame
3.2. Establishment of Assessment Model
3.3. Calculation of the Entropy-CRITIC Combined Weights
3.3.1. Entropy Weighting
- (1)
- Establish an initial assessment indicators matrix, X.where m is the number of evaluating objects, n is the number of indicators, i is the i-th object, and j is the j-th indicator.X = (Xij)m×n
- (2)
- Construct a normalization matrix, .where ij satisfies the following Equations (3) or (4):
- (3)
- Calculate the contribution of the i-th object to the j-th indicator, Pij.
- (4)
- Calculate the entropy value of the j-th indicator, Ej.where k = 1/lnm.
- (5)
- Calculate the otherness coefficient of the j-th indicator, Gj.Gj = 1 − Ej
- (6)
- Calculate the entropy weight coefficient of the j-th indicator, vj.
3.3.2. CRITIC Weighting
- (1)
- Based on Equation (2), the standard deviation of the j-th indicator, Sj, is calculated.
- (2)
- Based on Equation (2), the correlation coefficient between the b-th and j-th indicators, rbj, is calculated.
- (3)
- Calculate the conflicting characteristic between the b-th and j-th indicators, Aj.
- (4)
- Calculate the quantity of information contained in j-th indicator, Cj.Cj = Sj Aj
- (5)
- Calculate the weight coefficient of the j-th indicator, uj.
3.3.3. Combined Weighting
4. Results
4.1. Assessment Indicator System
4.2. Characteristics of Geological Indicators
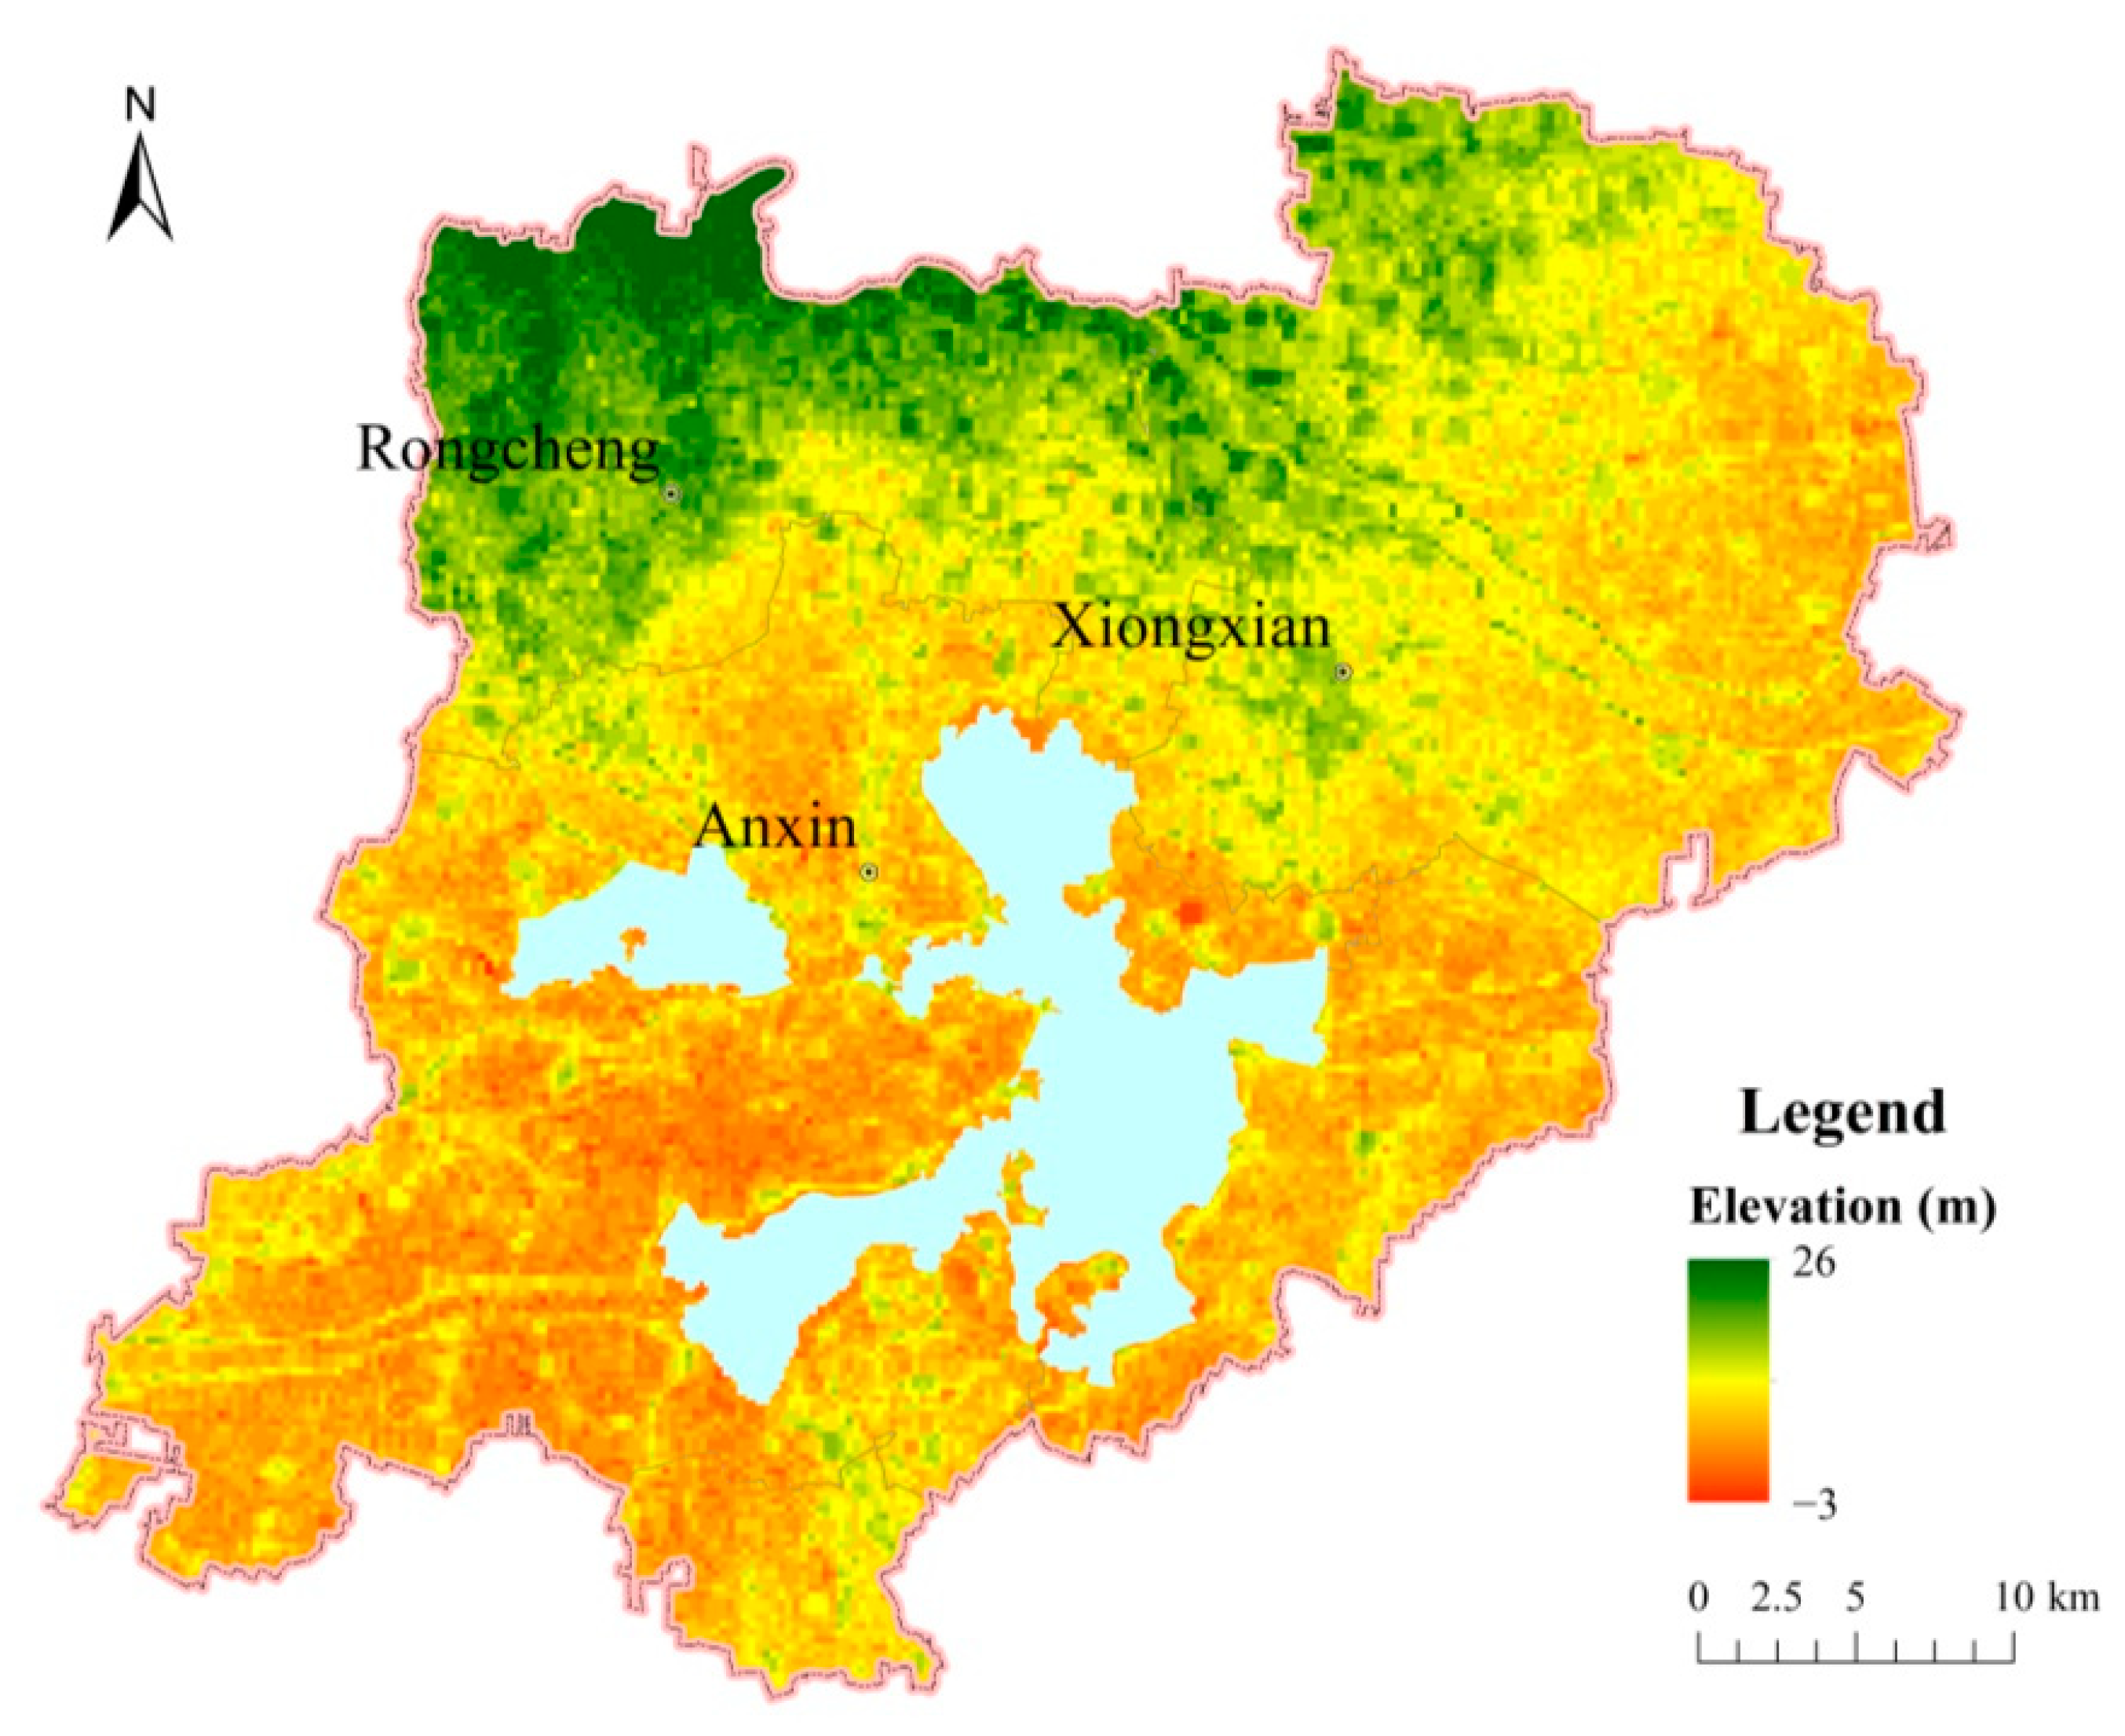
4.2.1. Topography
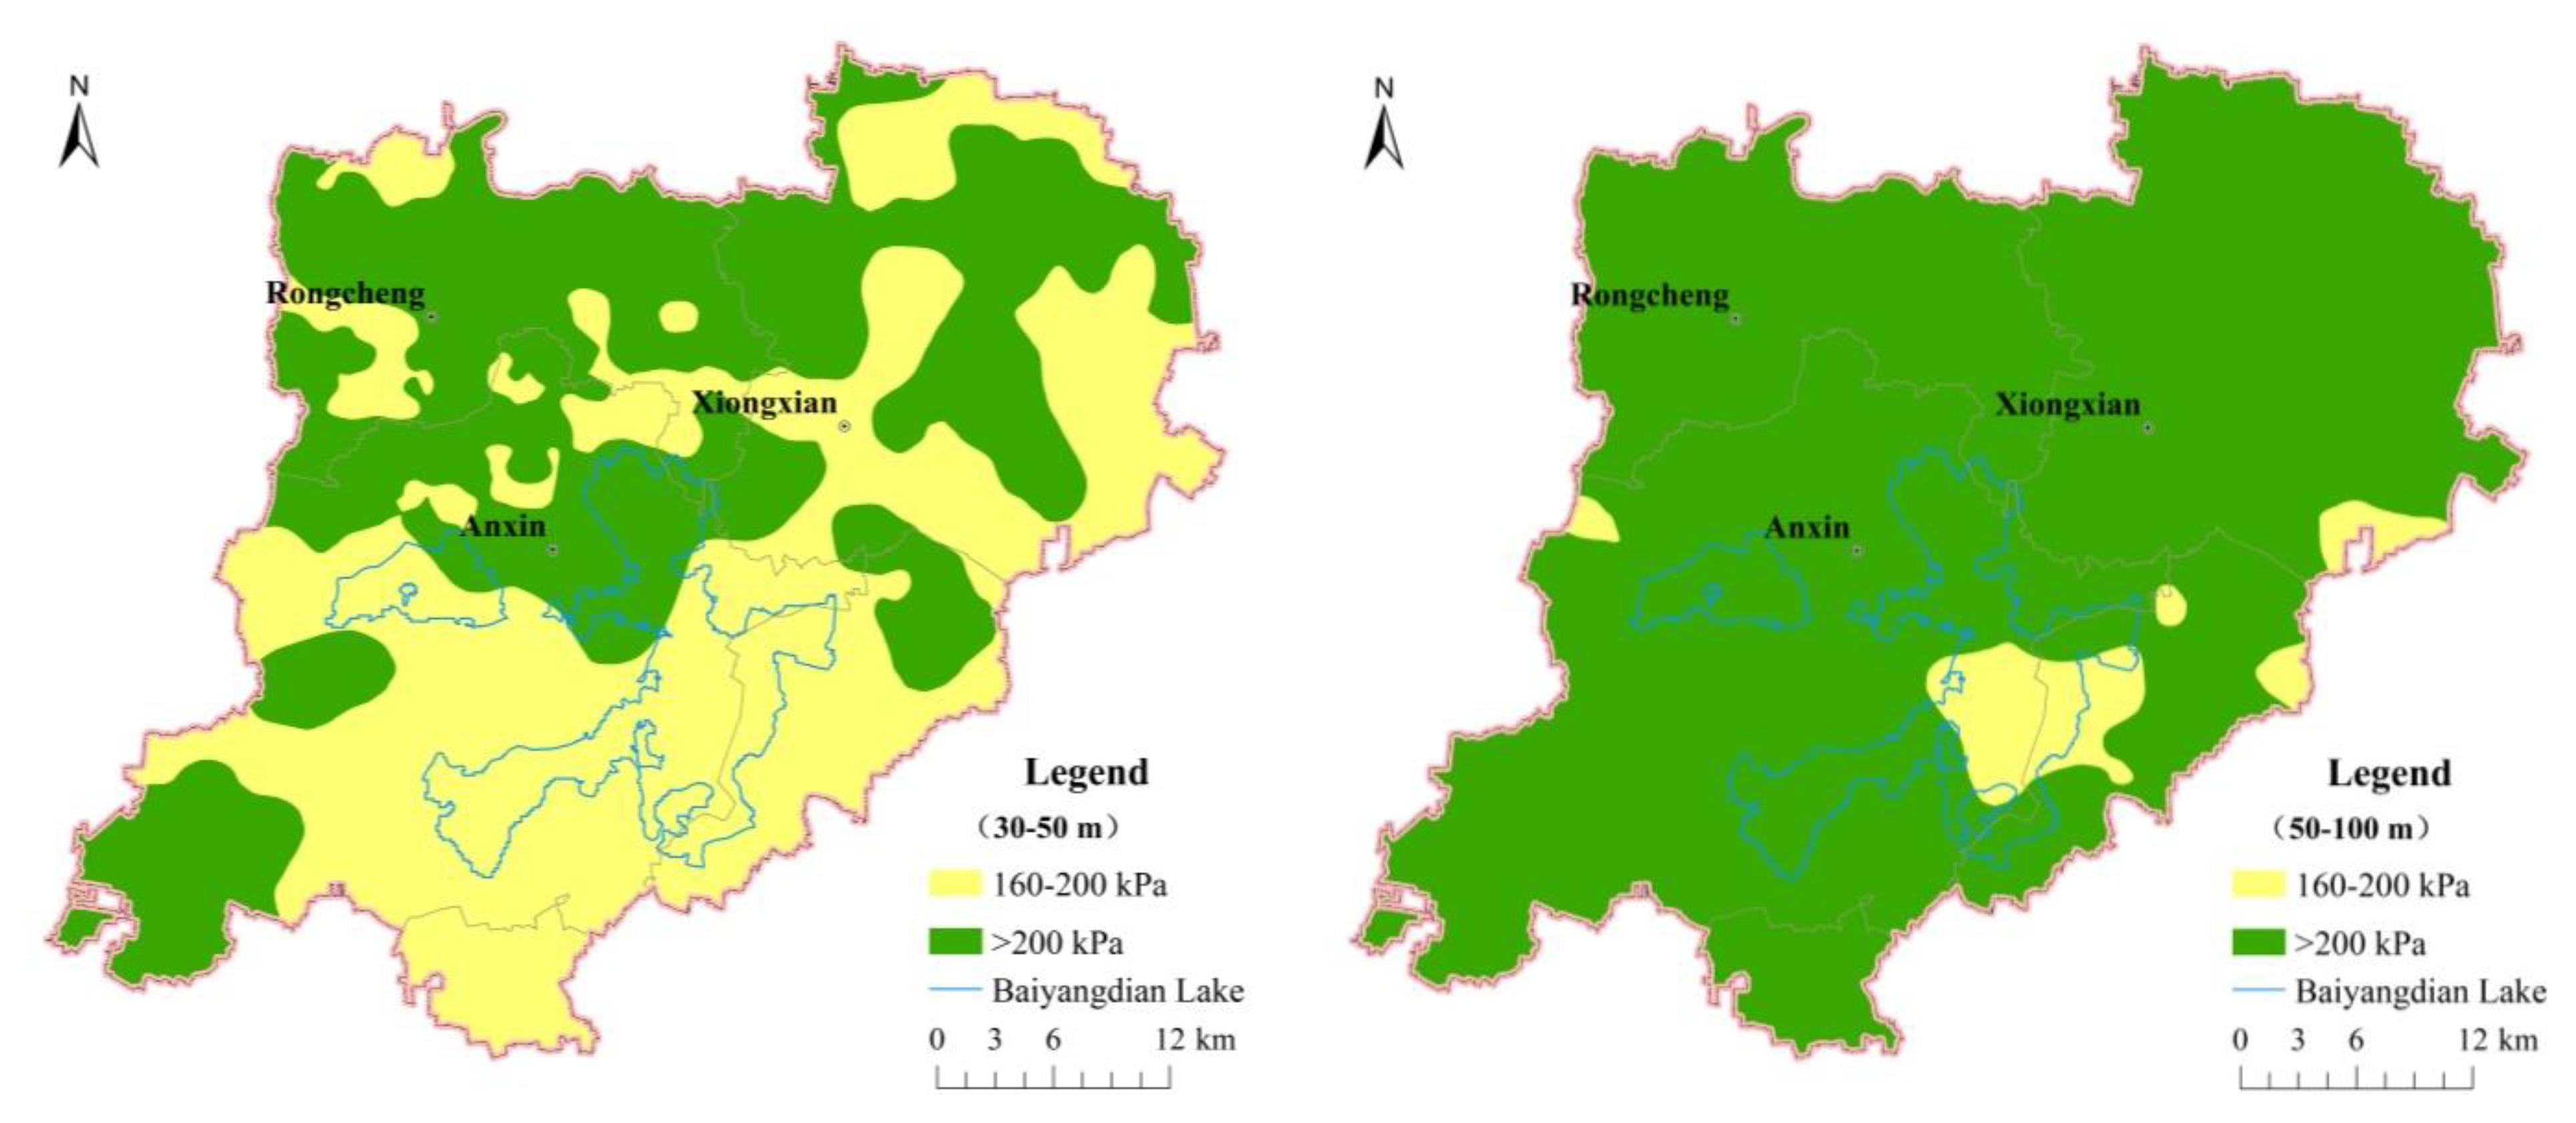
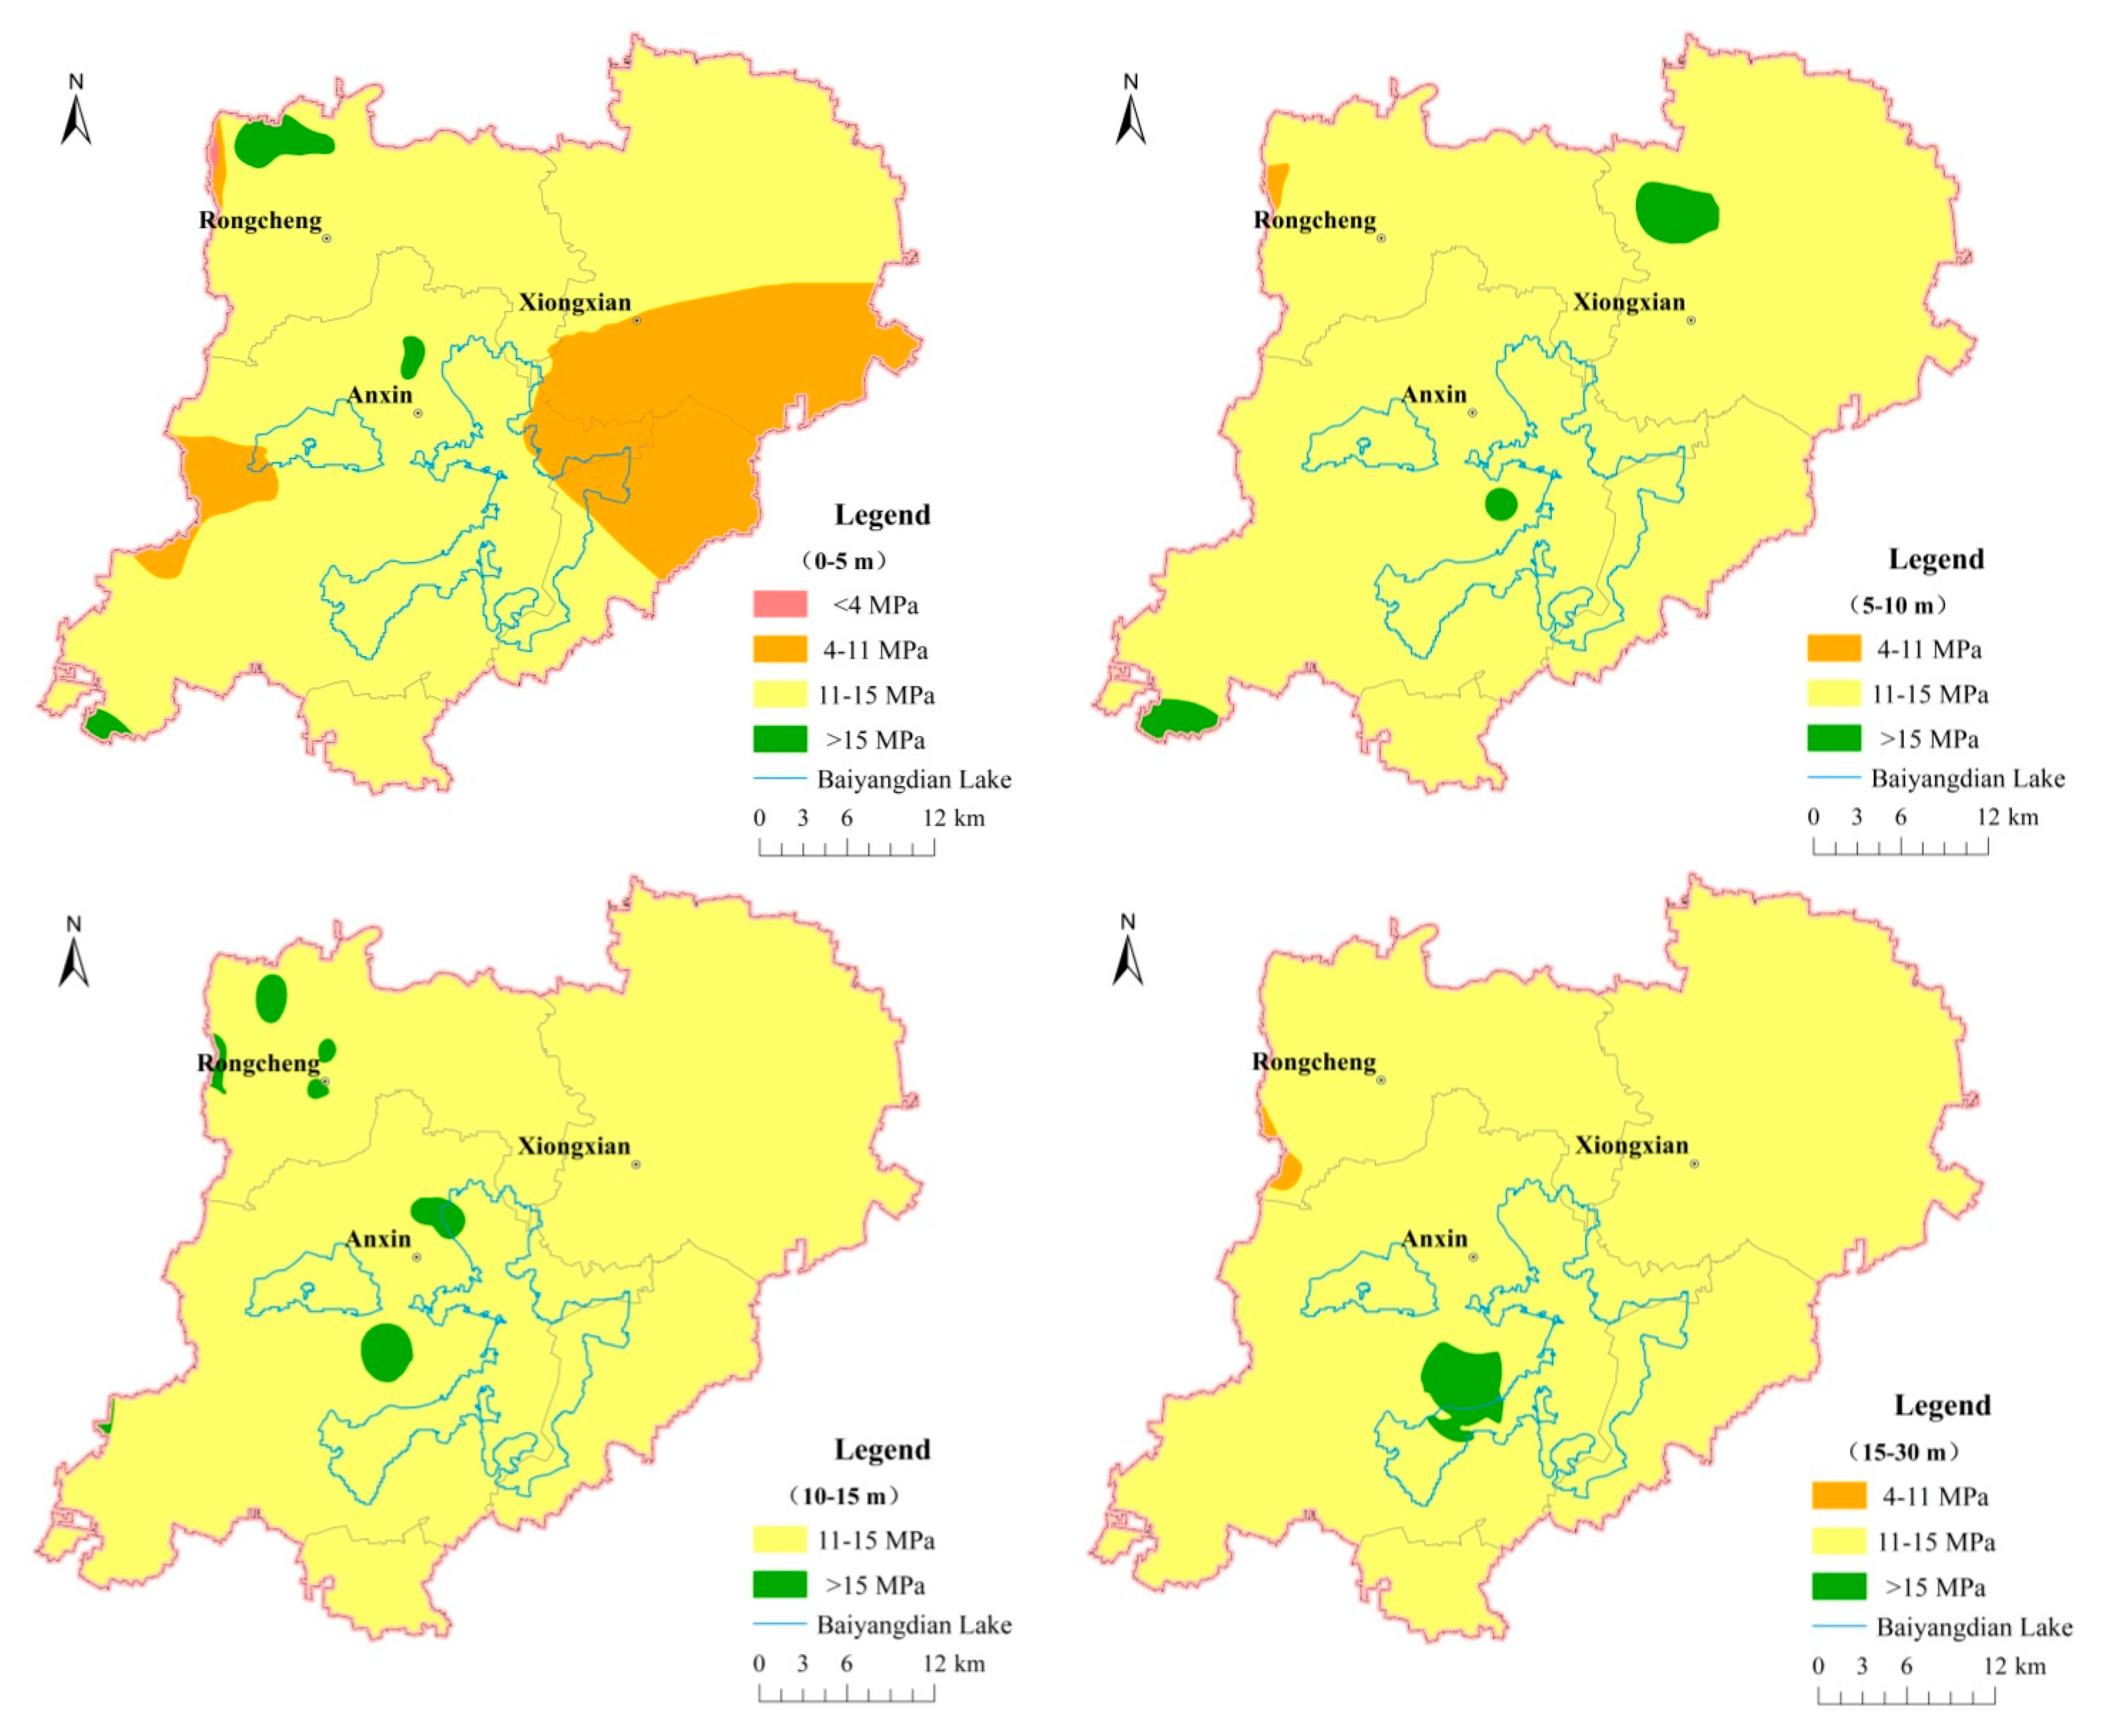
4.2.2. Geotechnical Characteristics
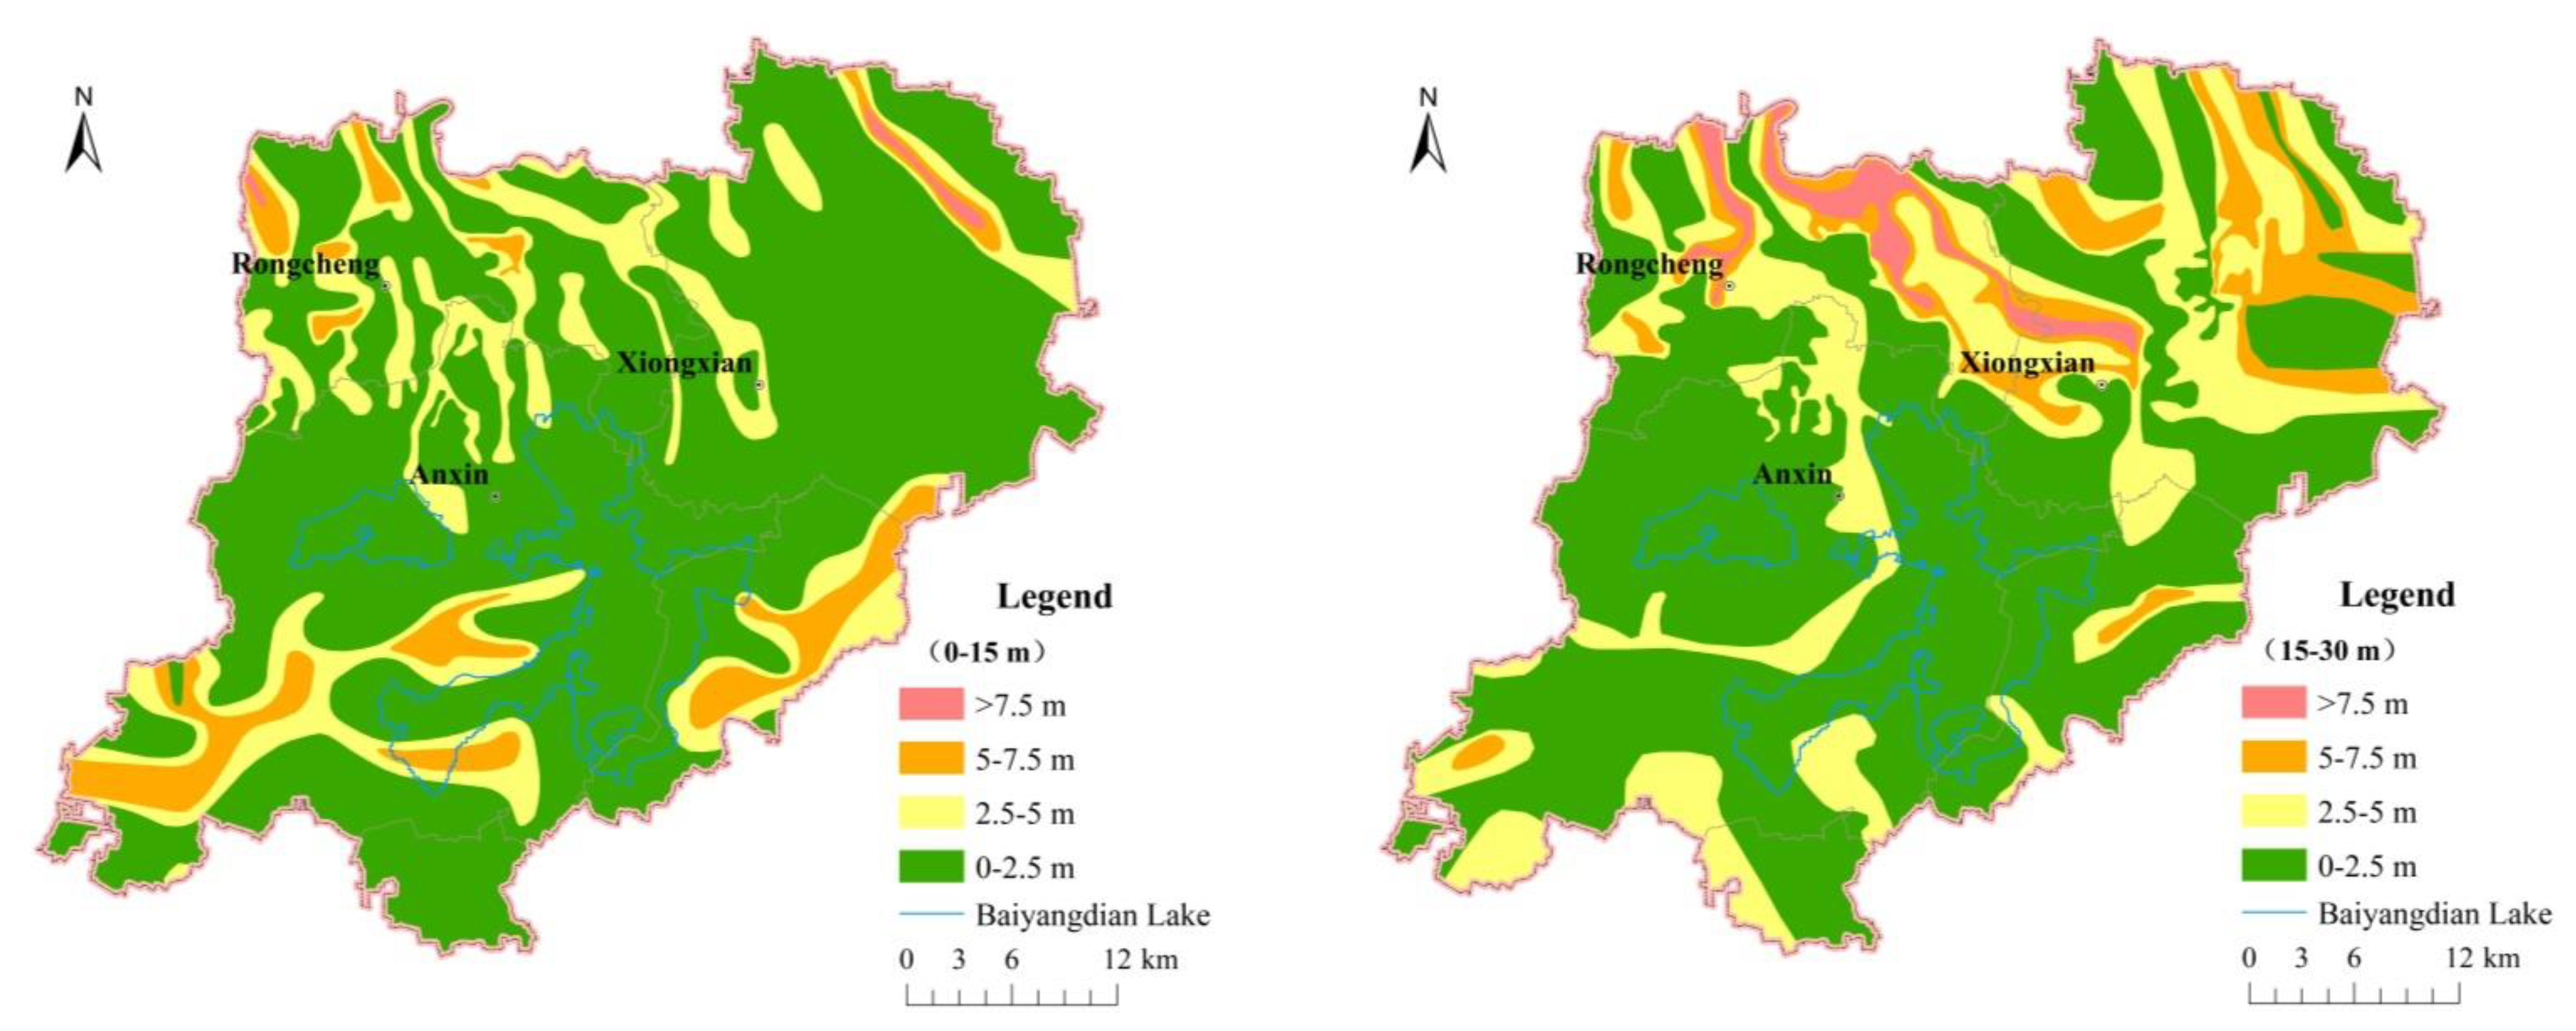
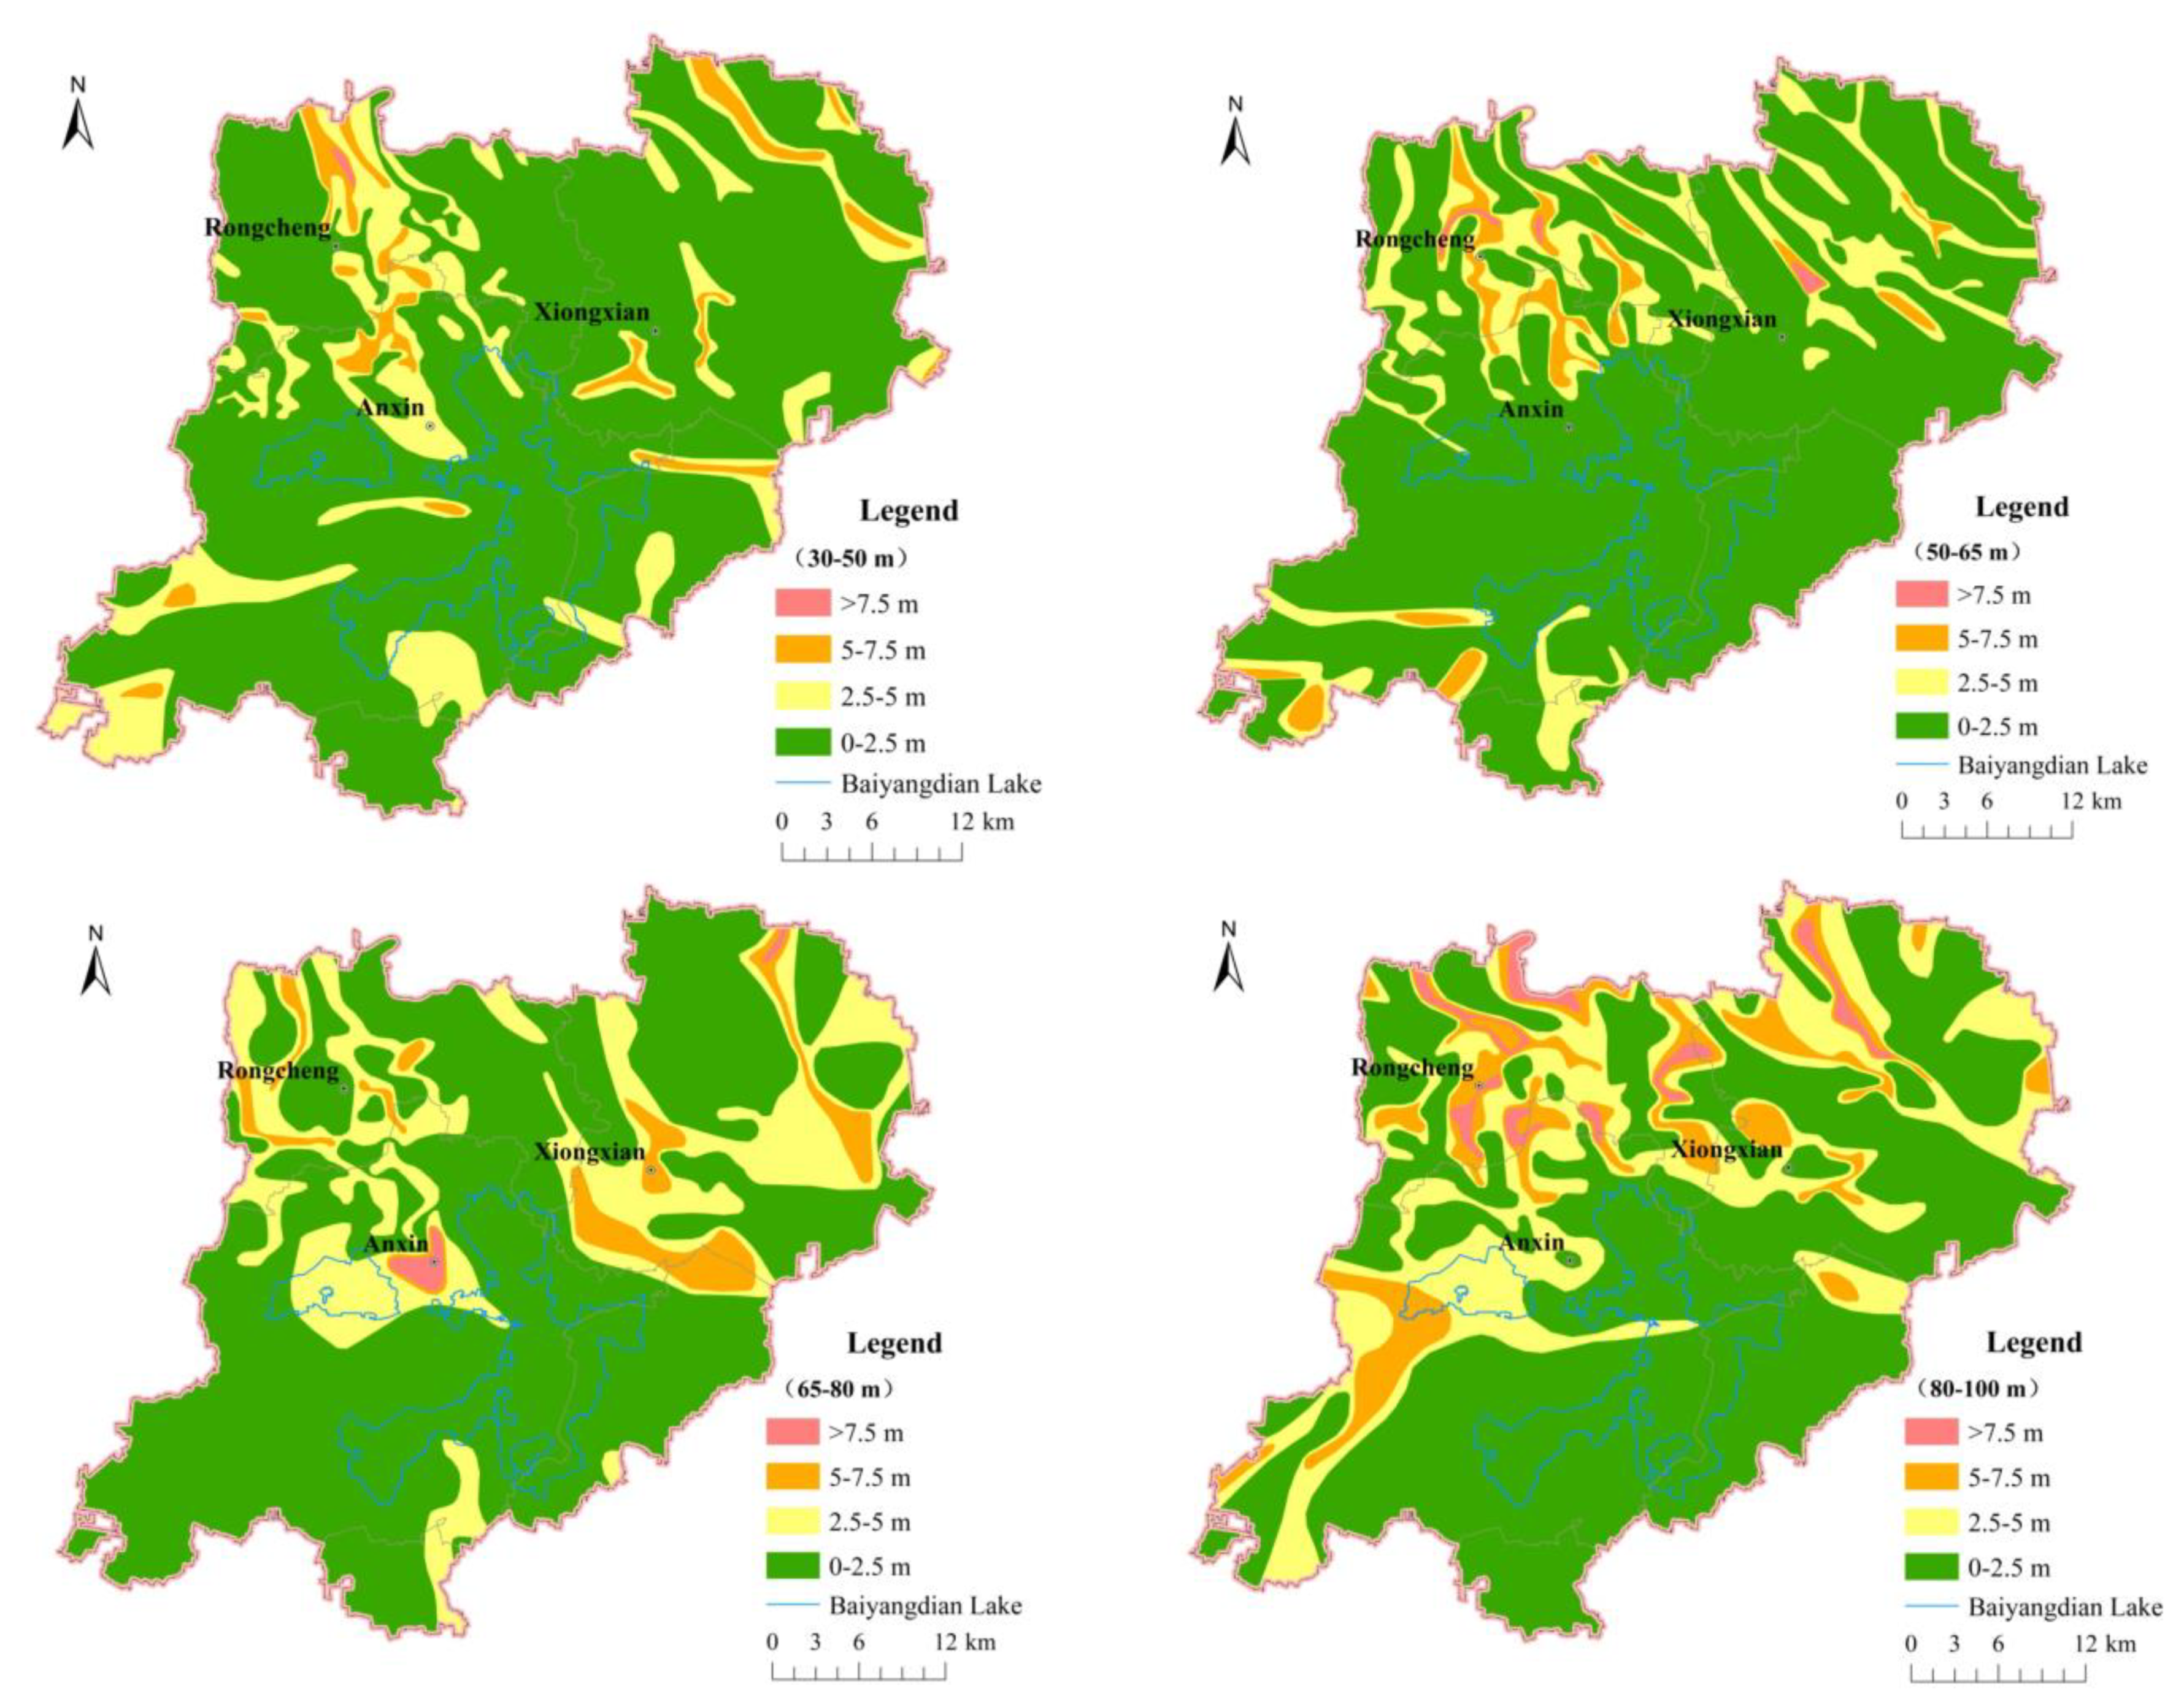
4.2.3. Hydrogeological Conditions
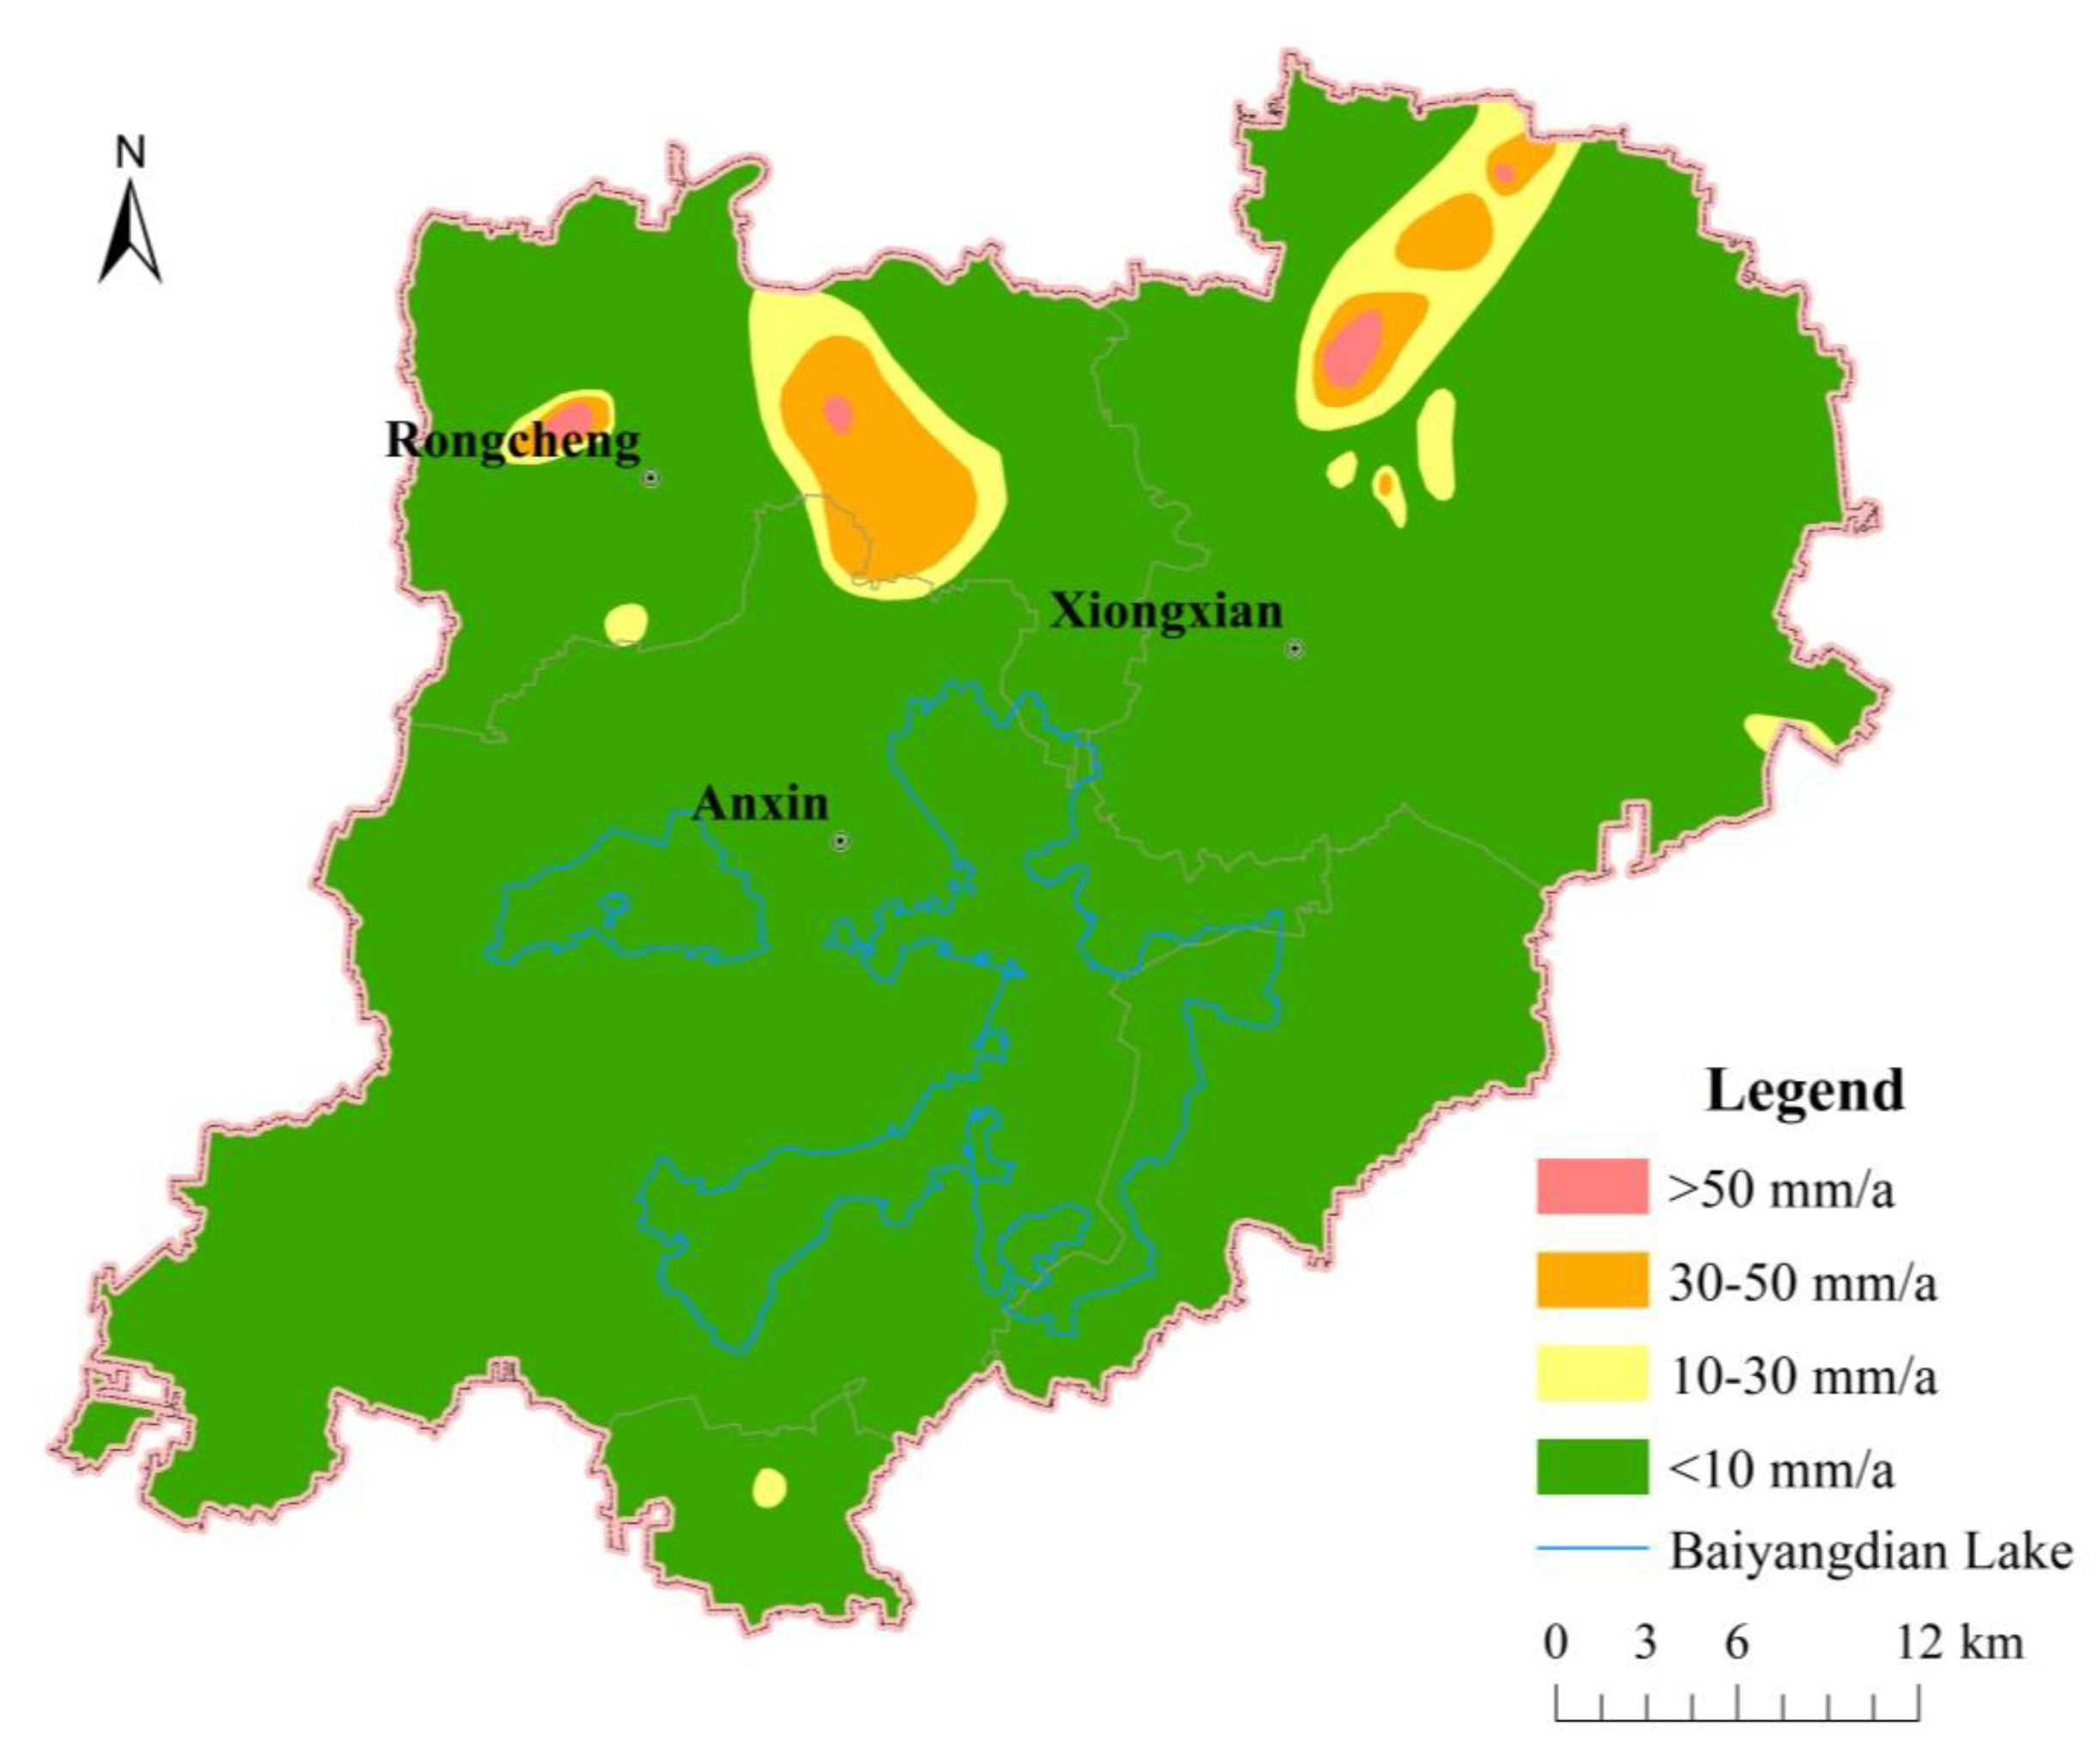
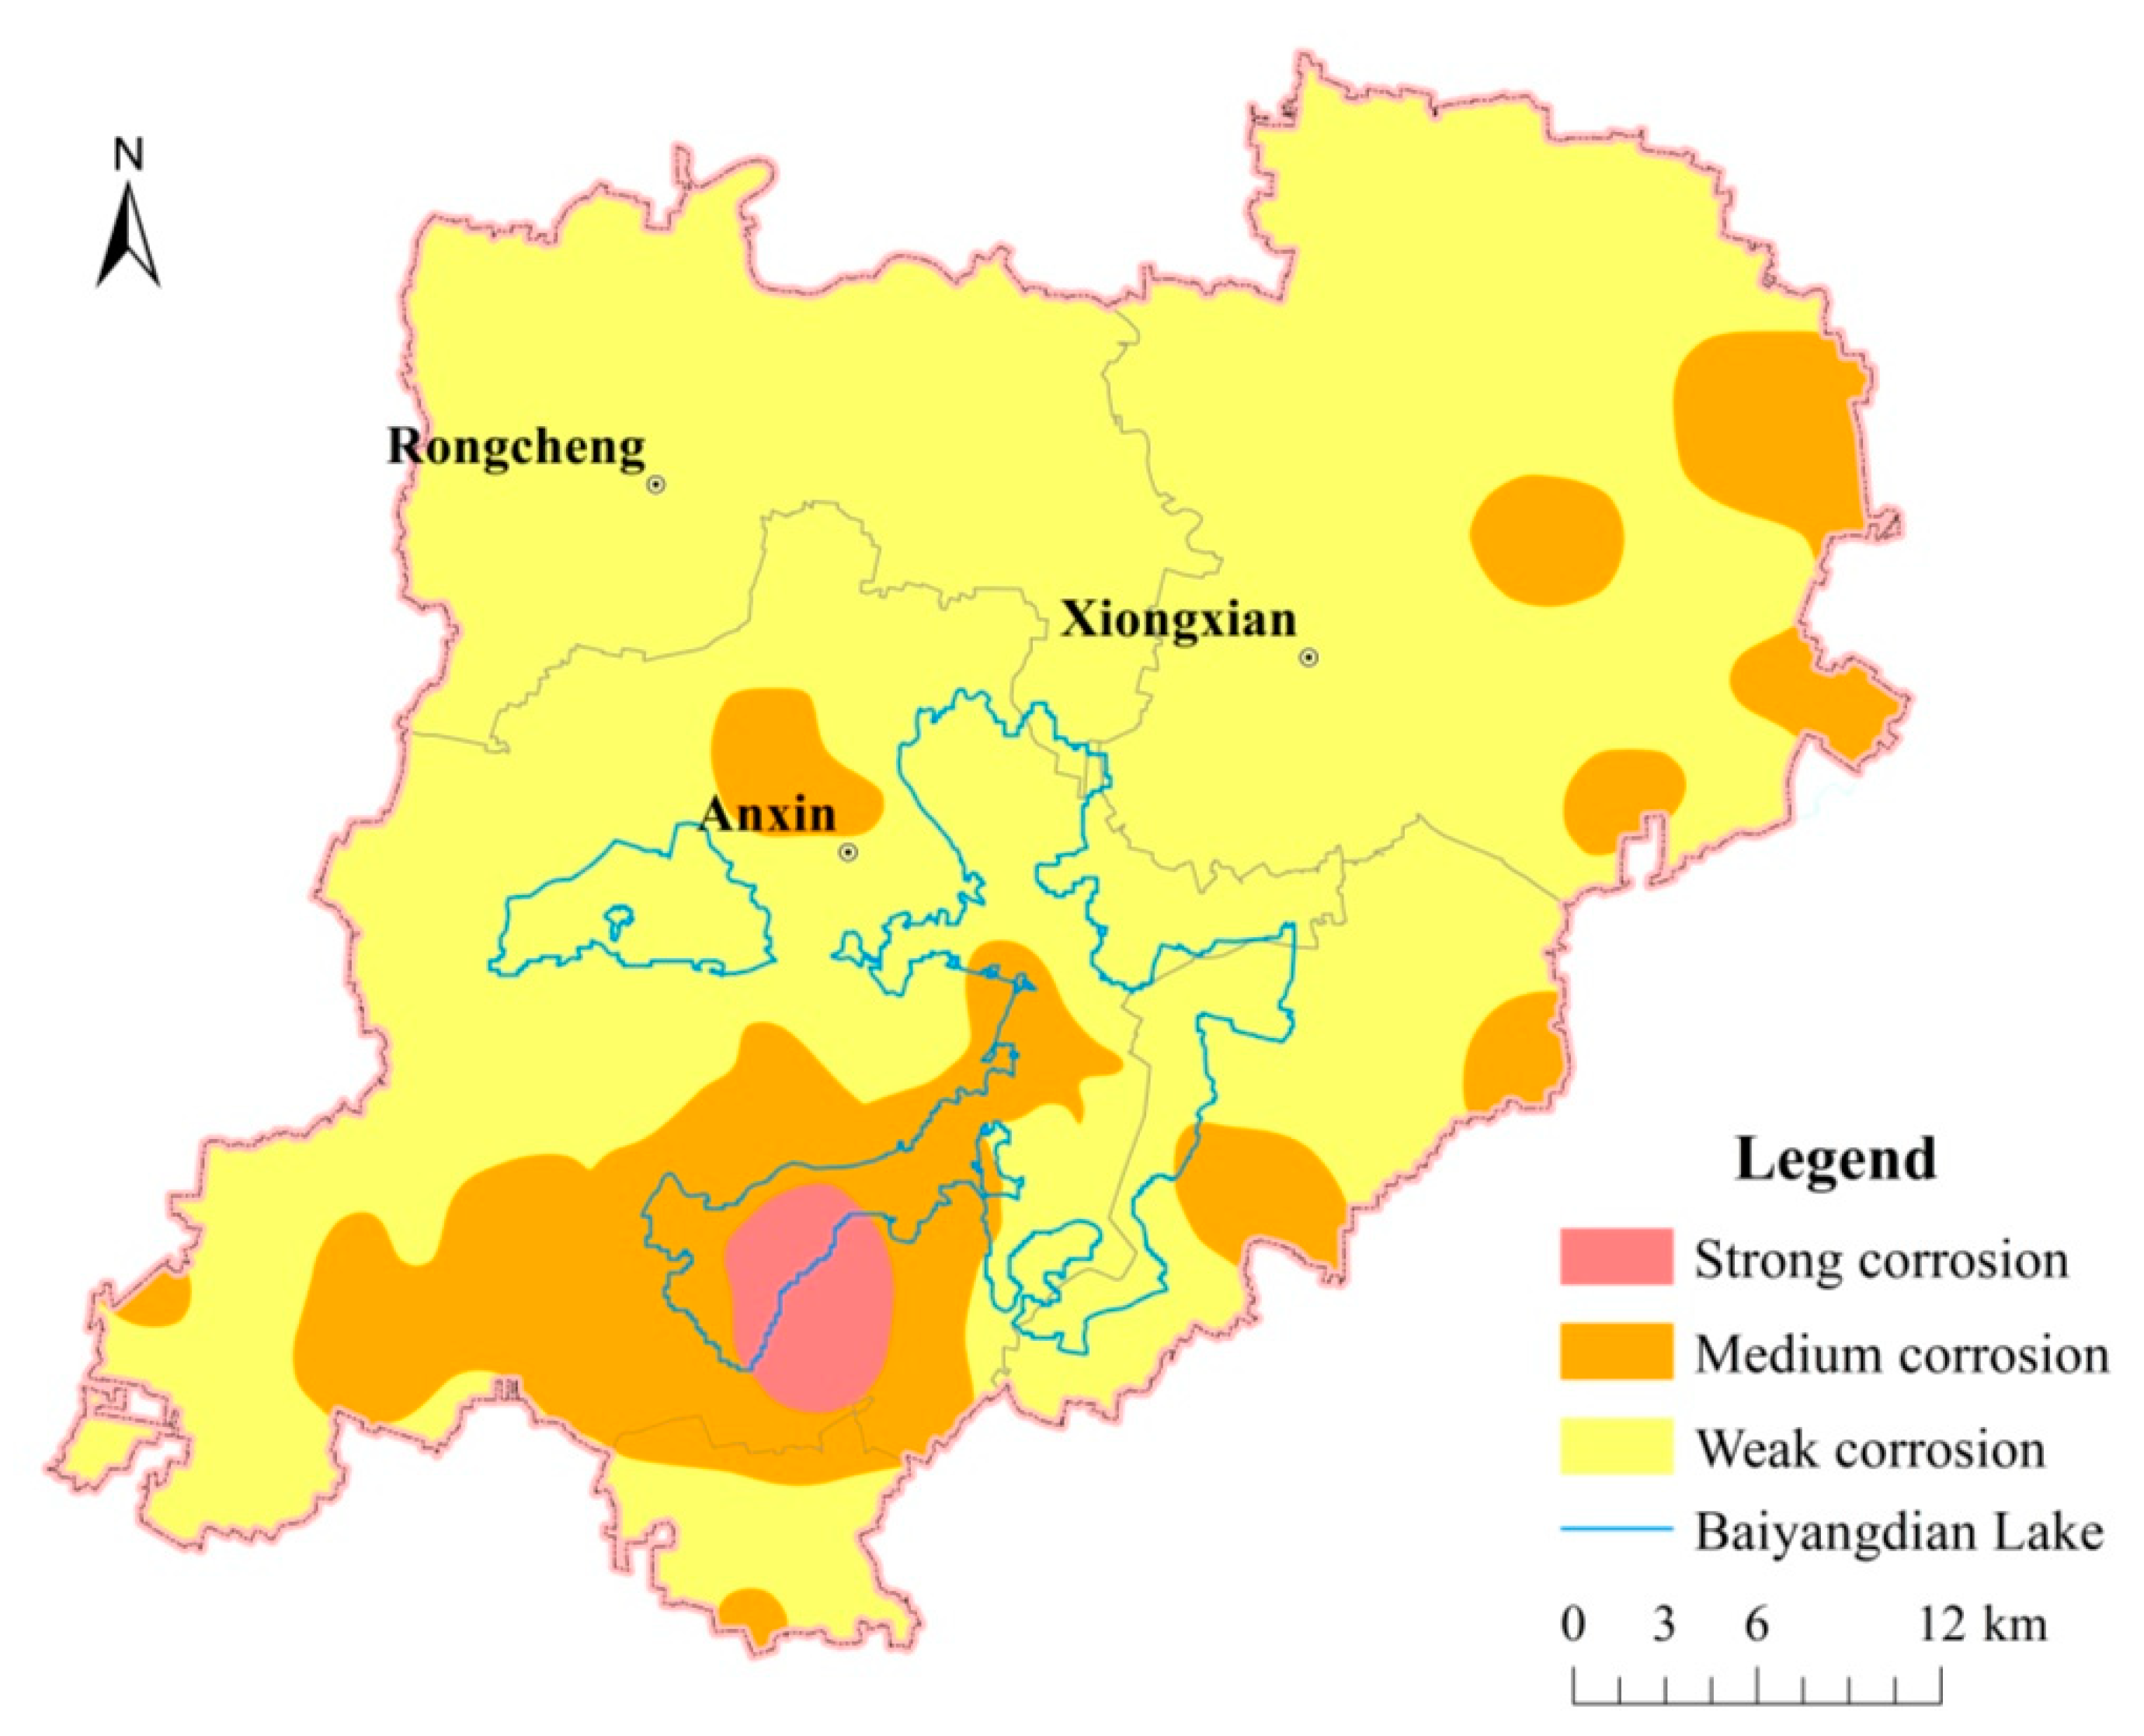
4.2.4. Adverse Geological Phenomena
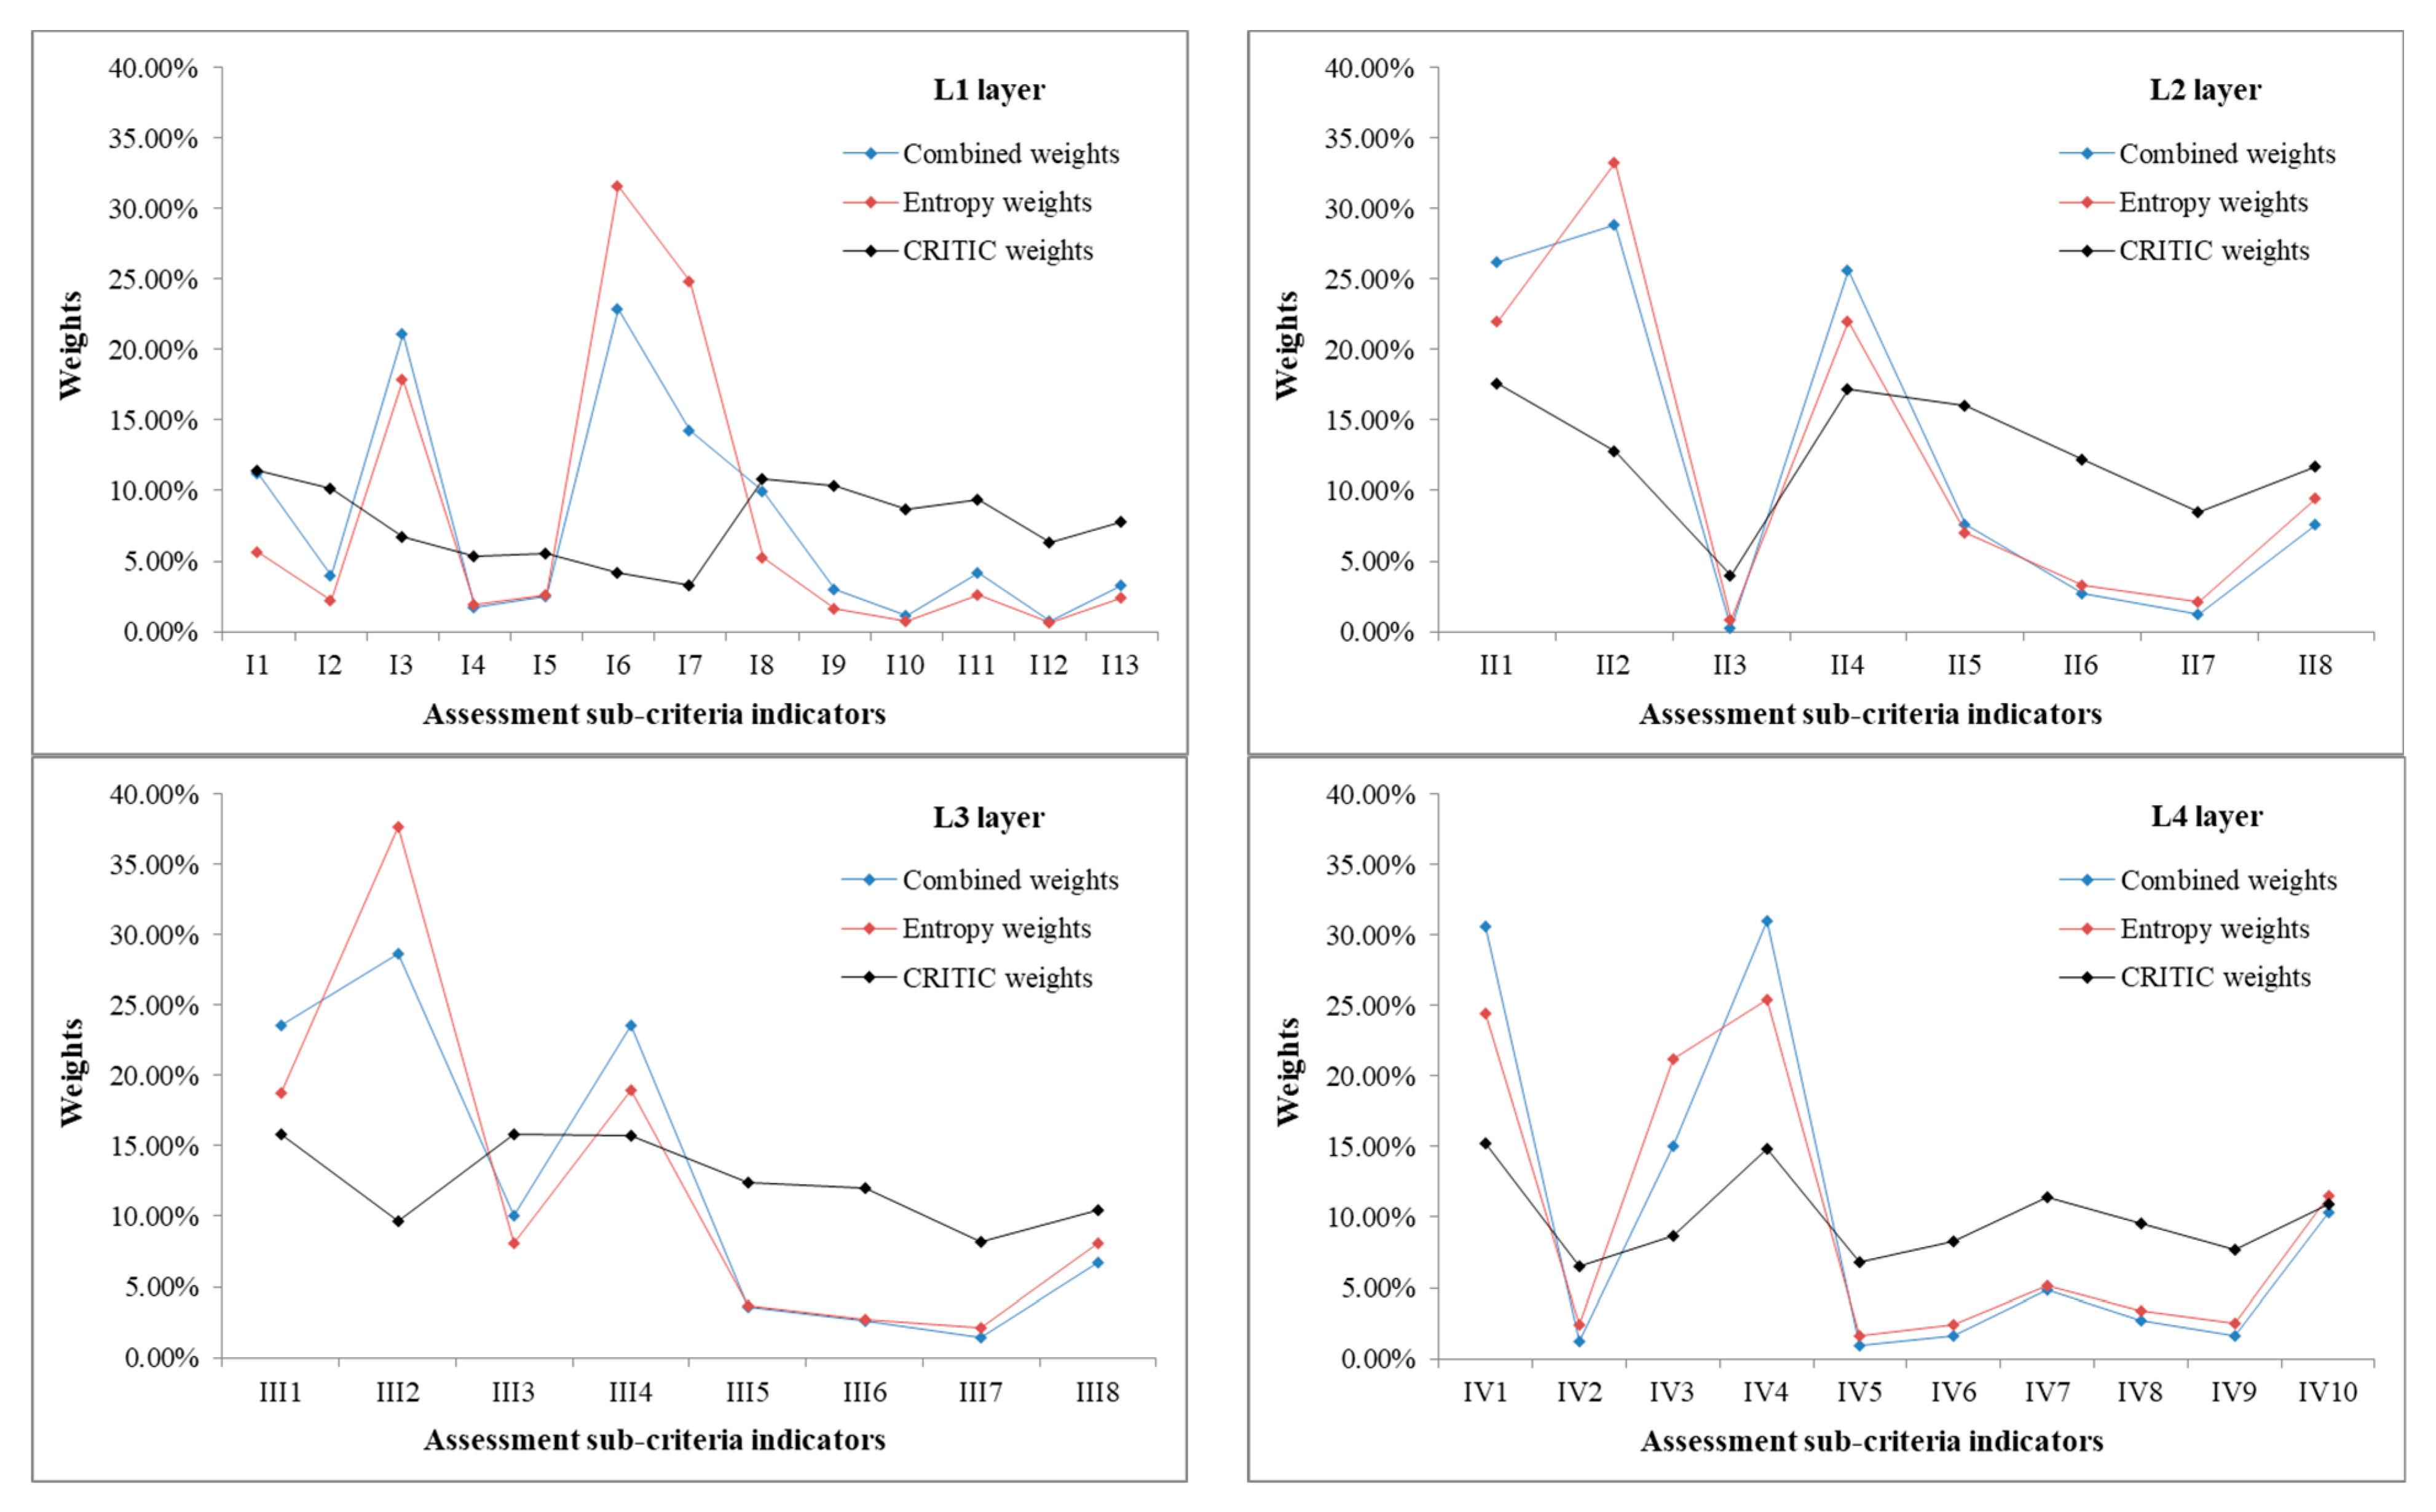
4.3. Weights of Indicators
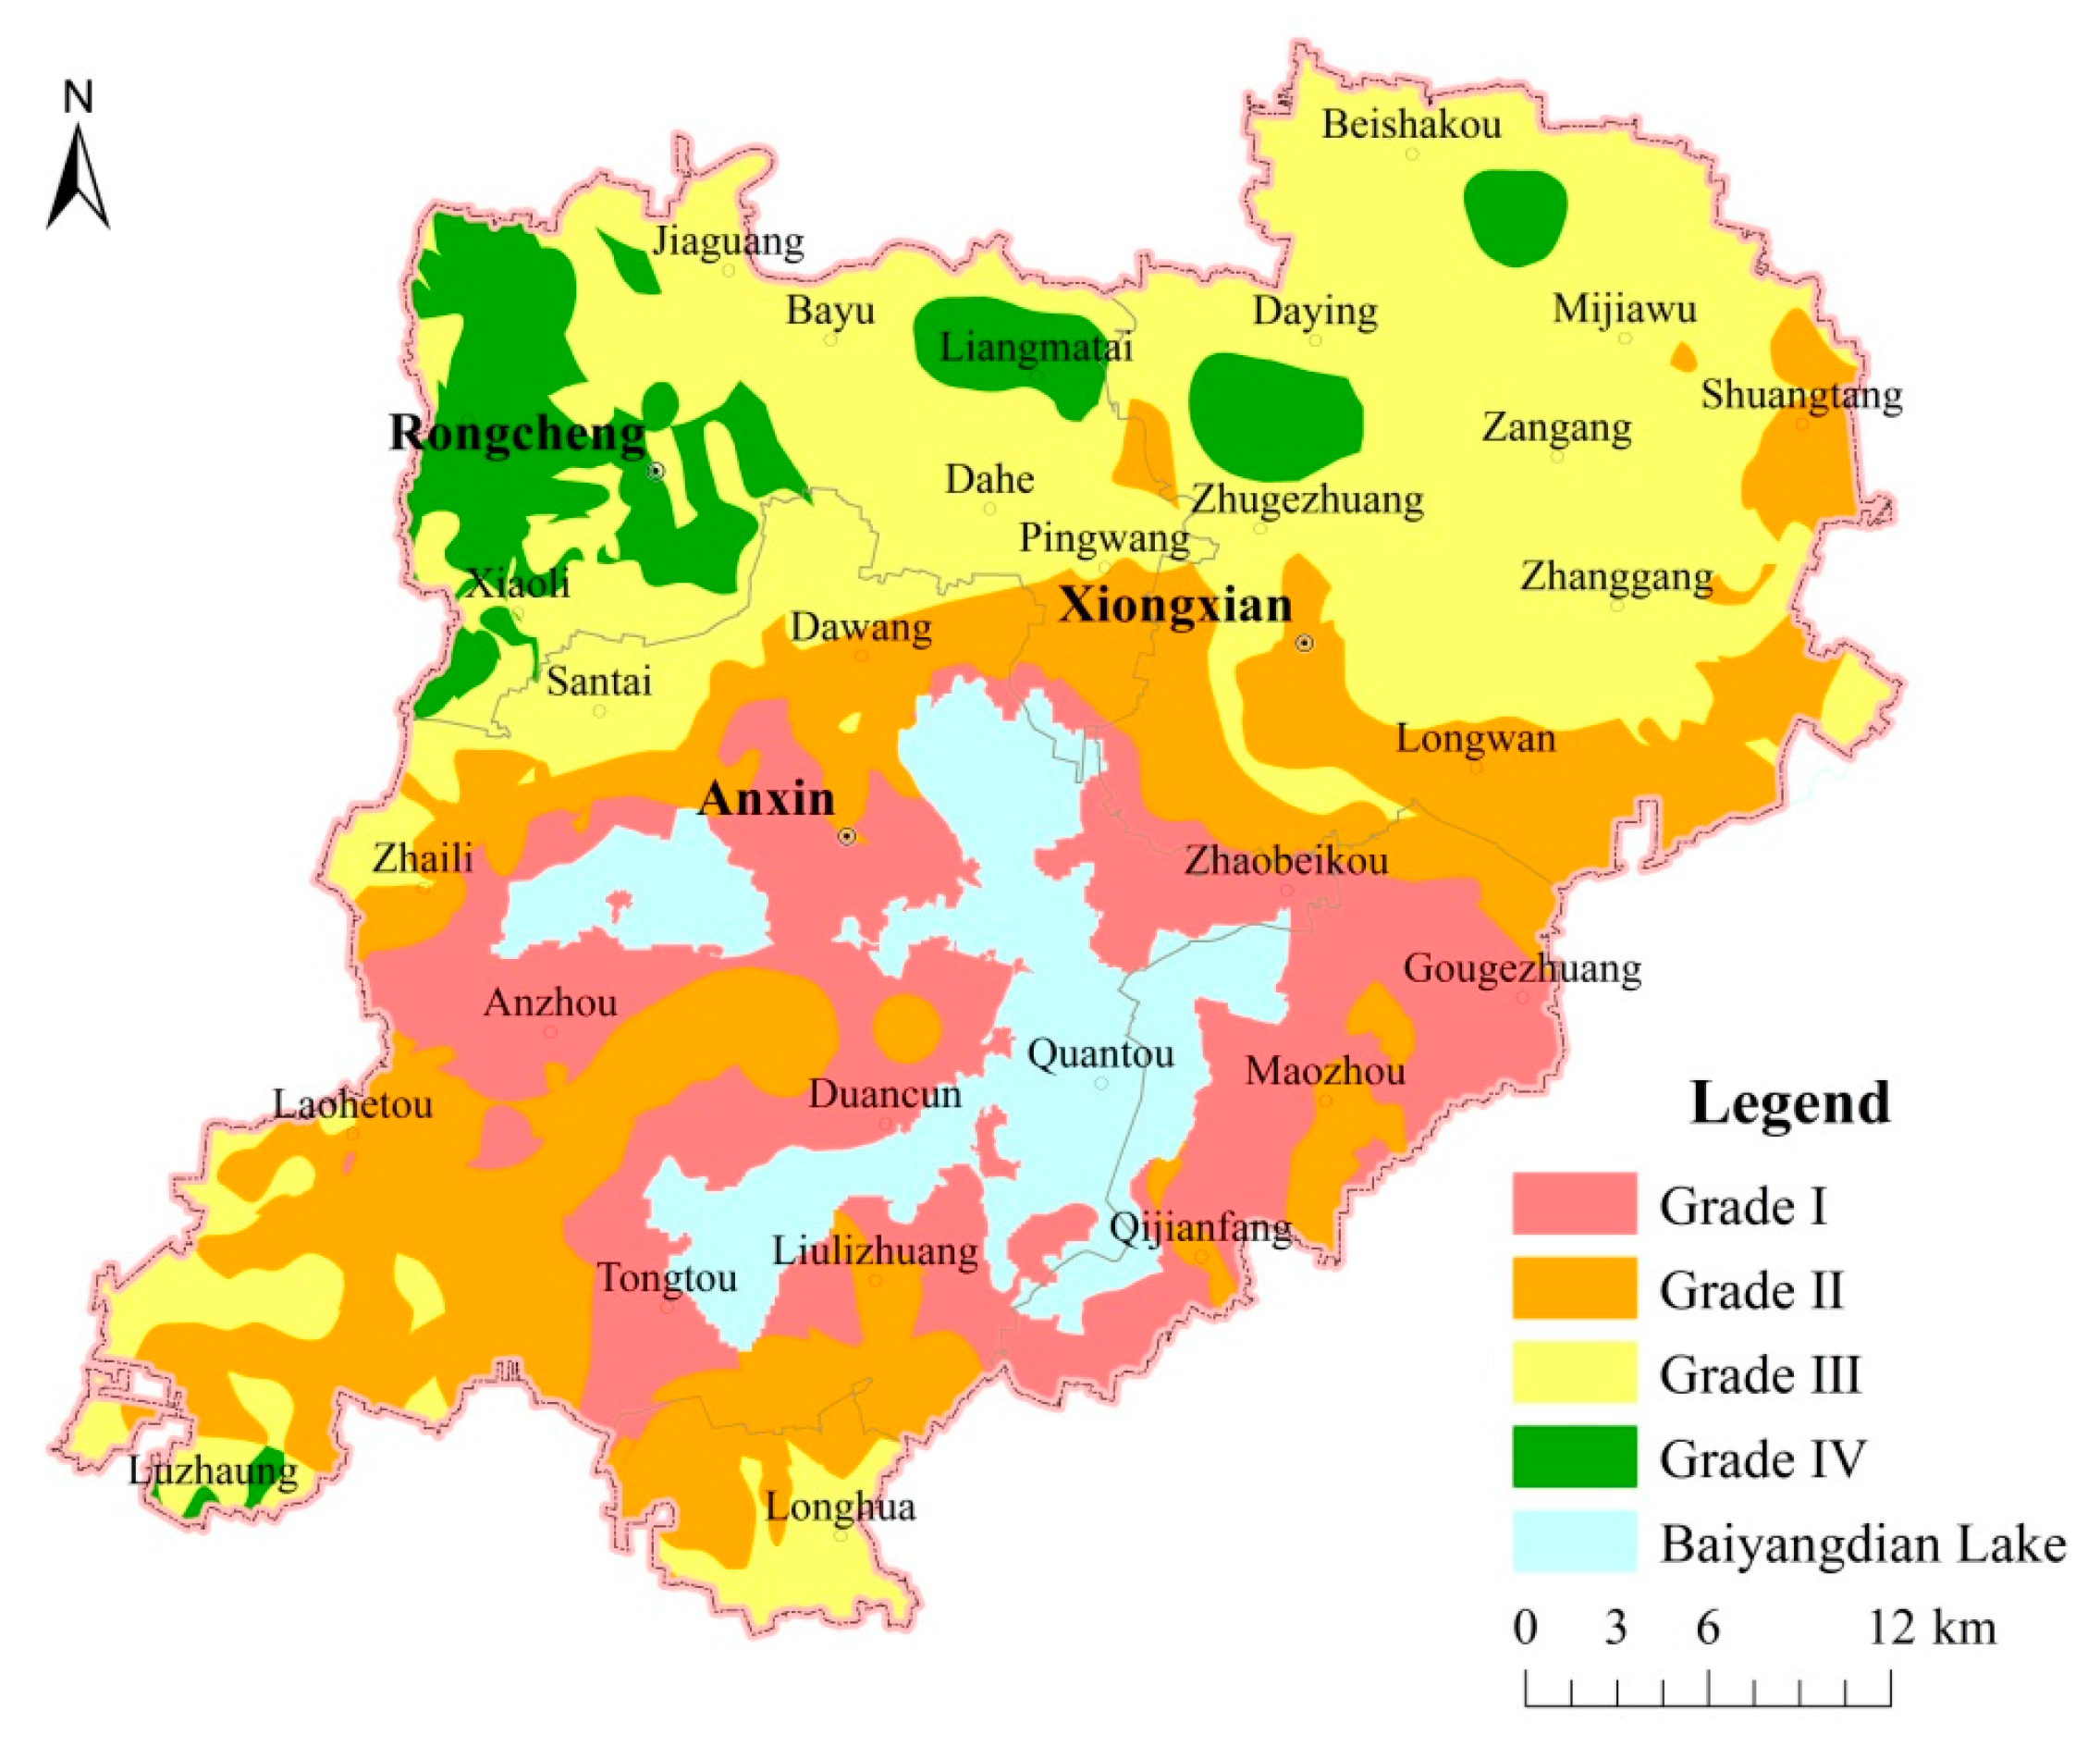
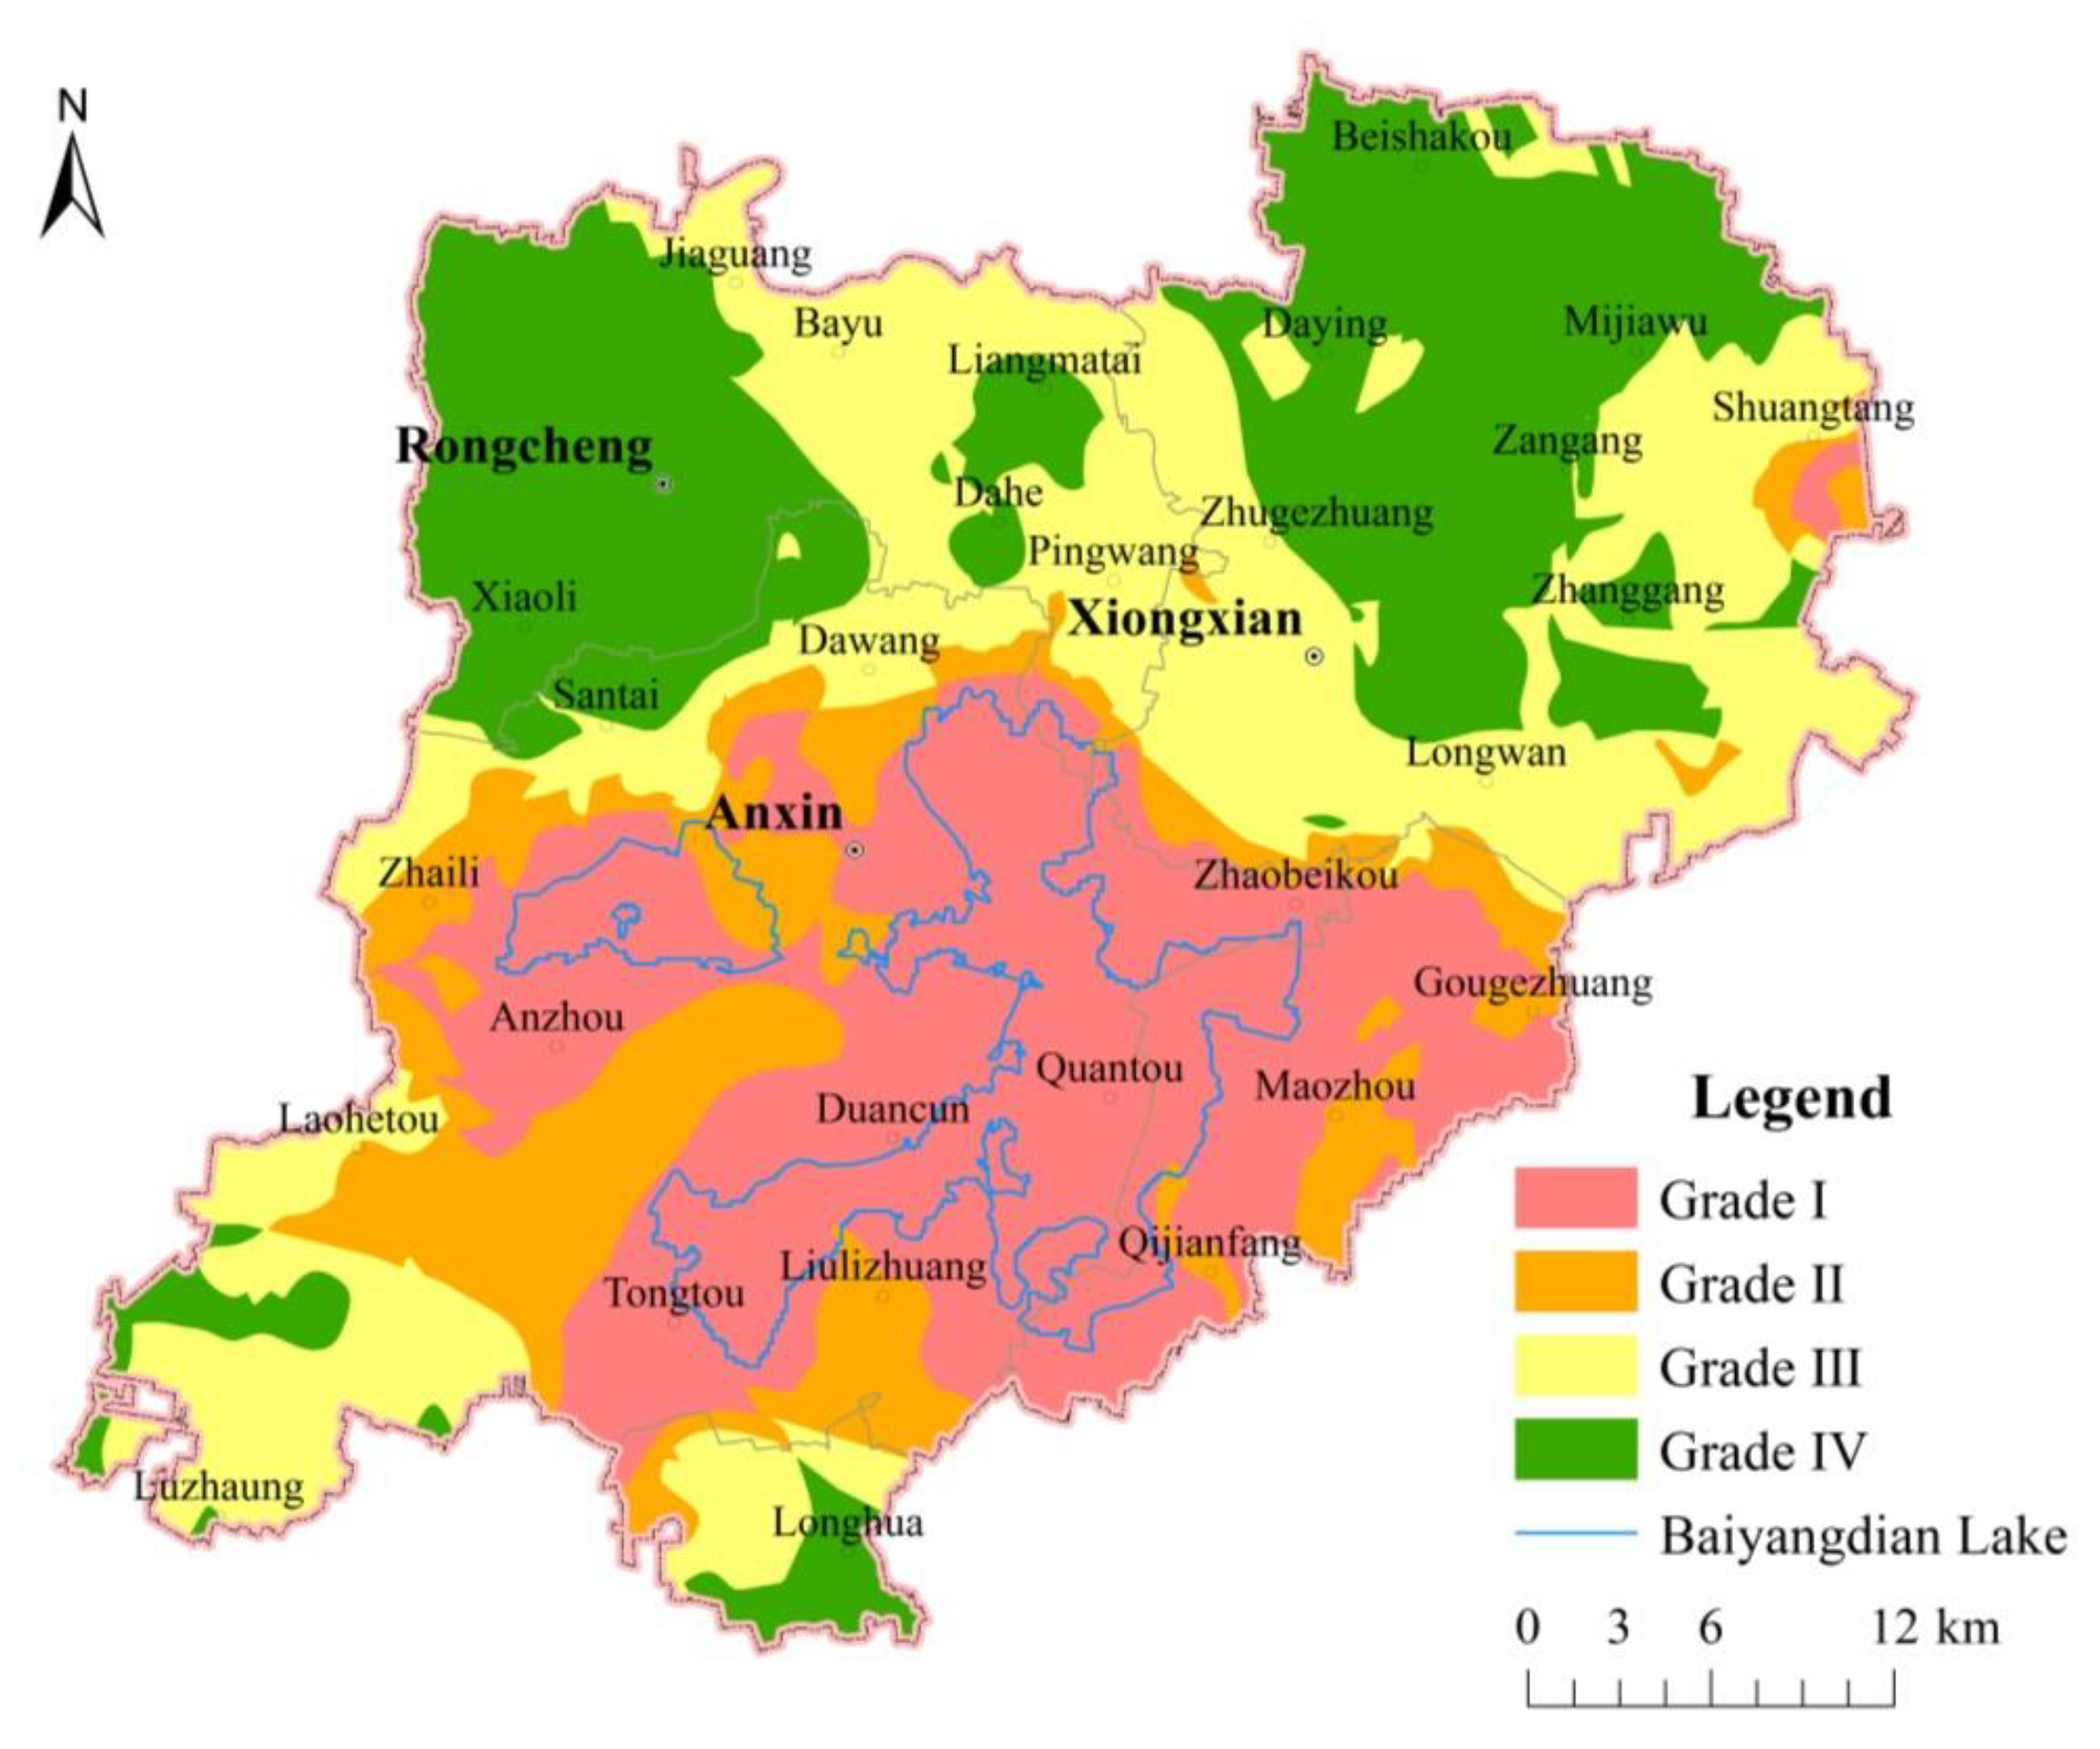
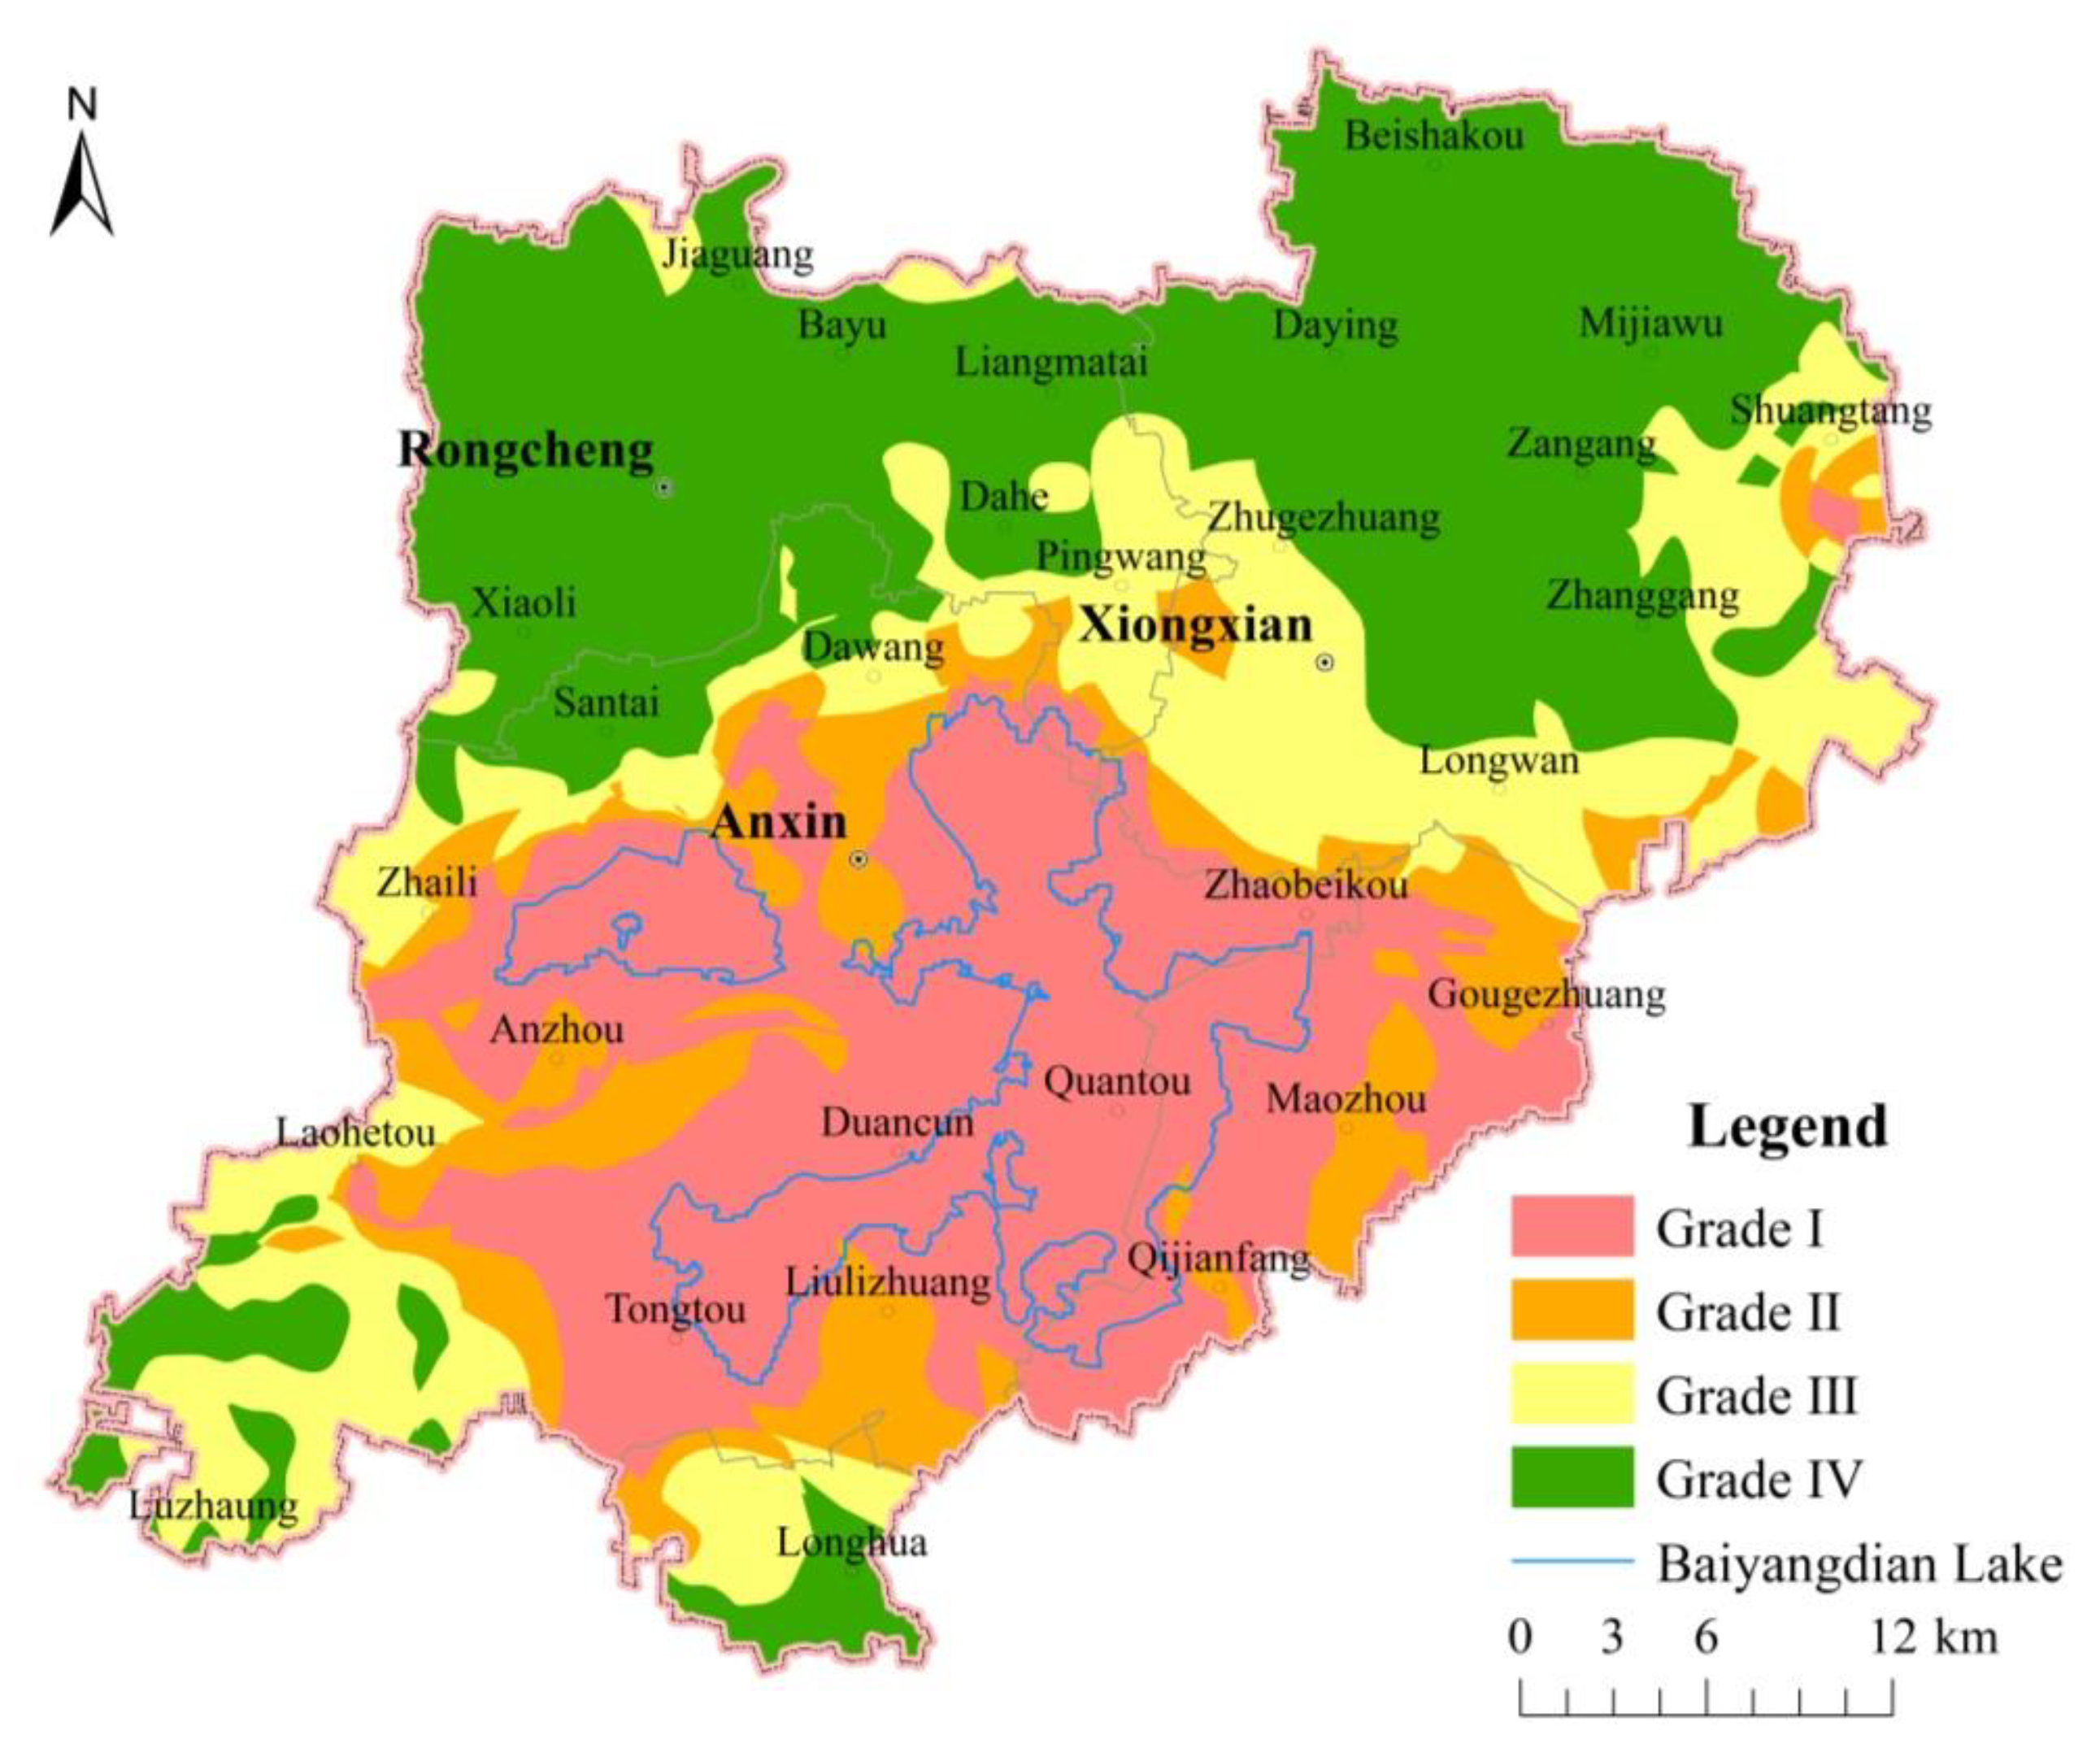
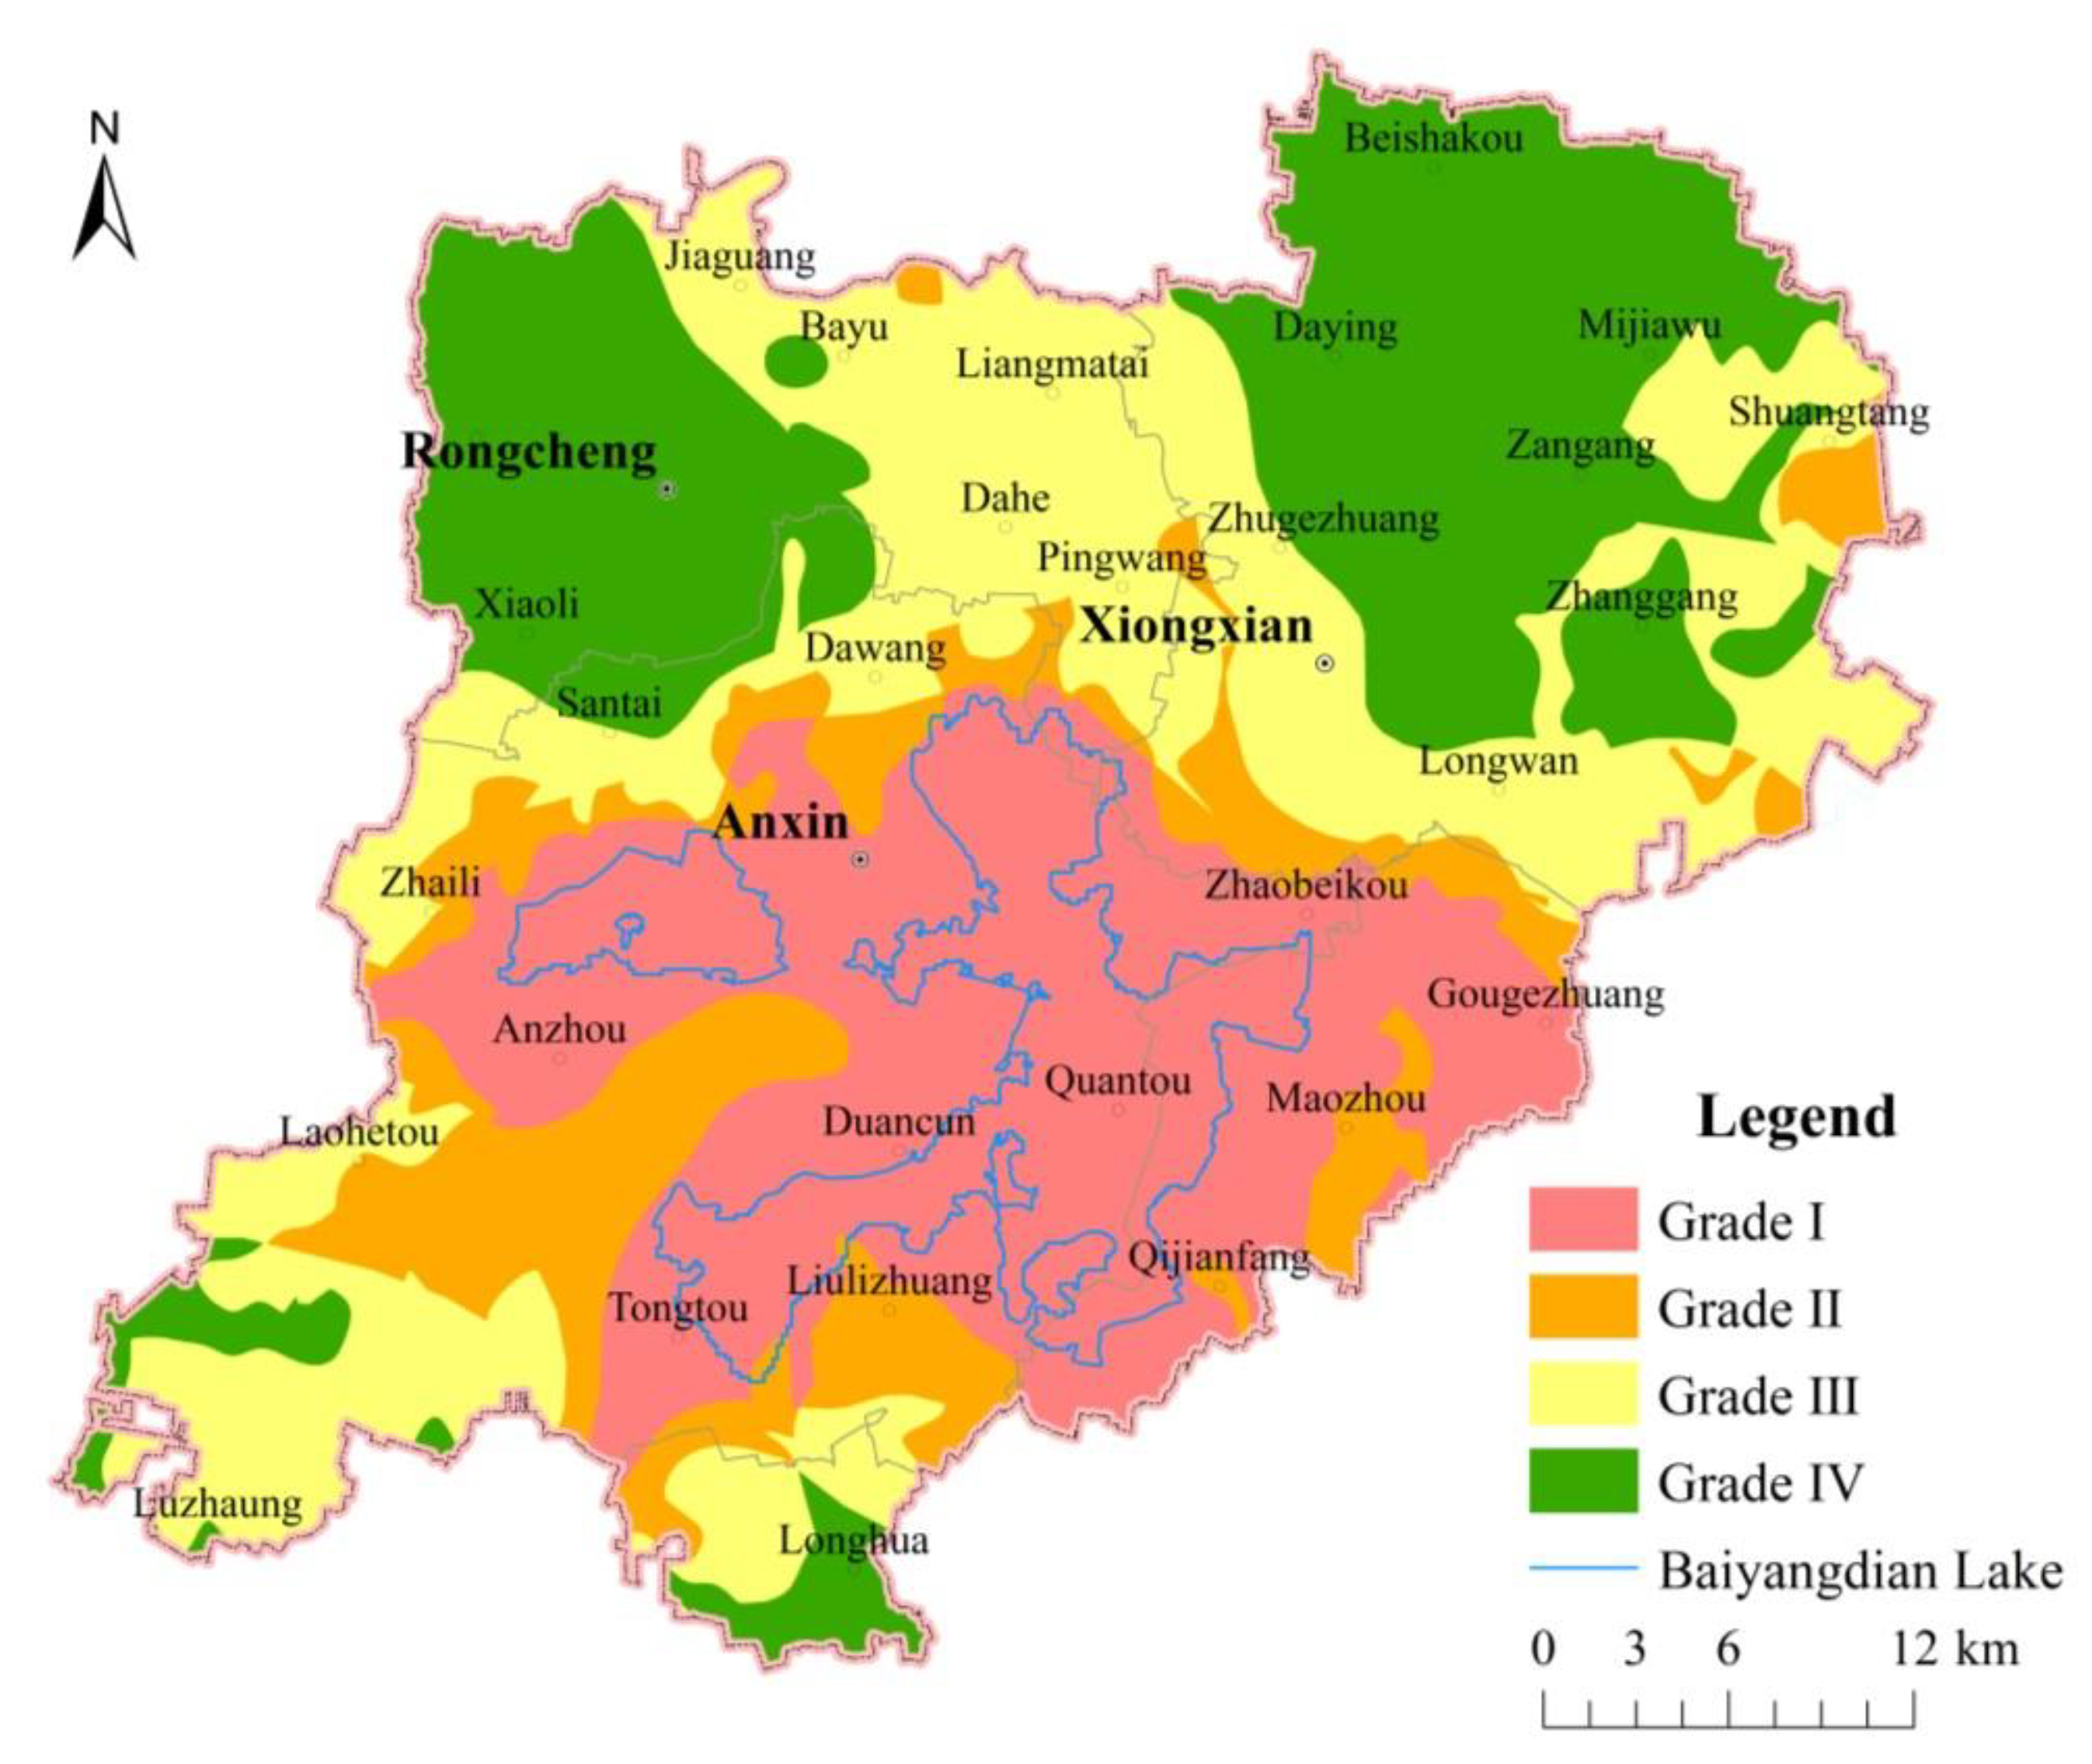
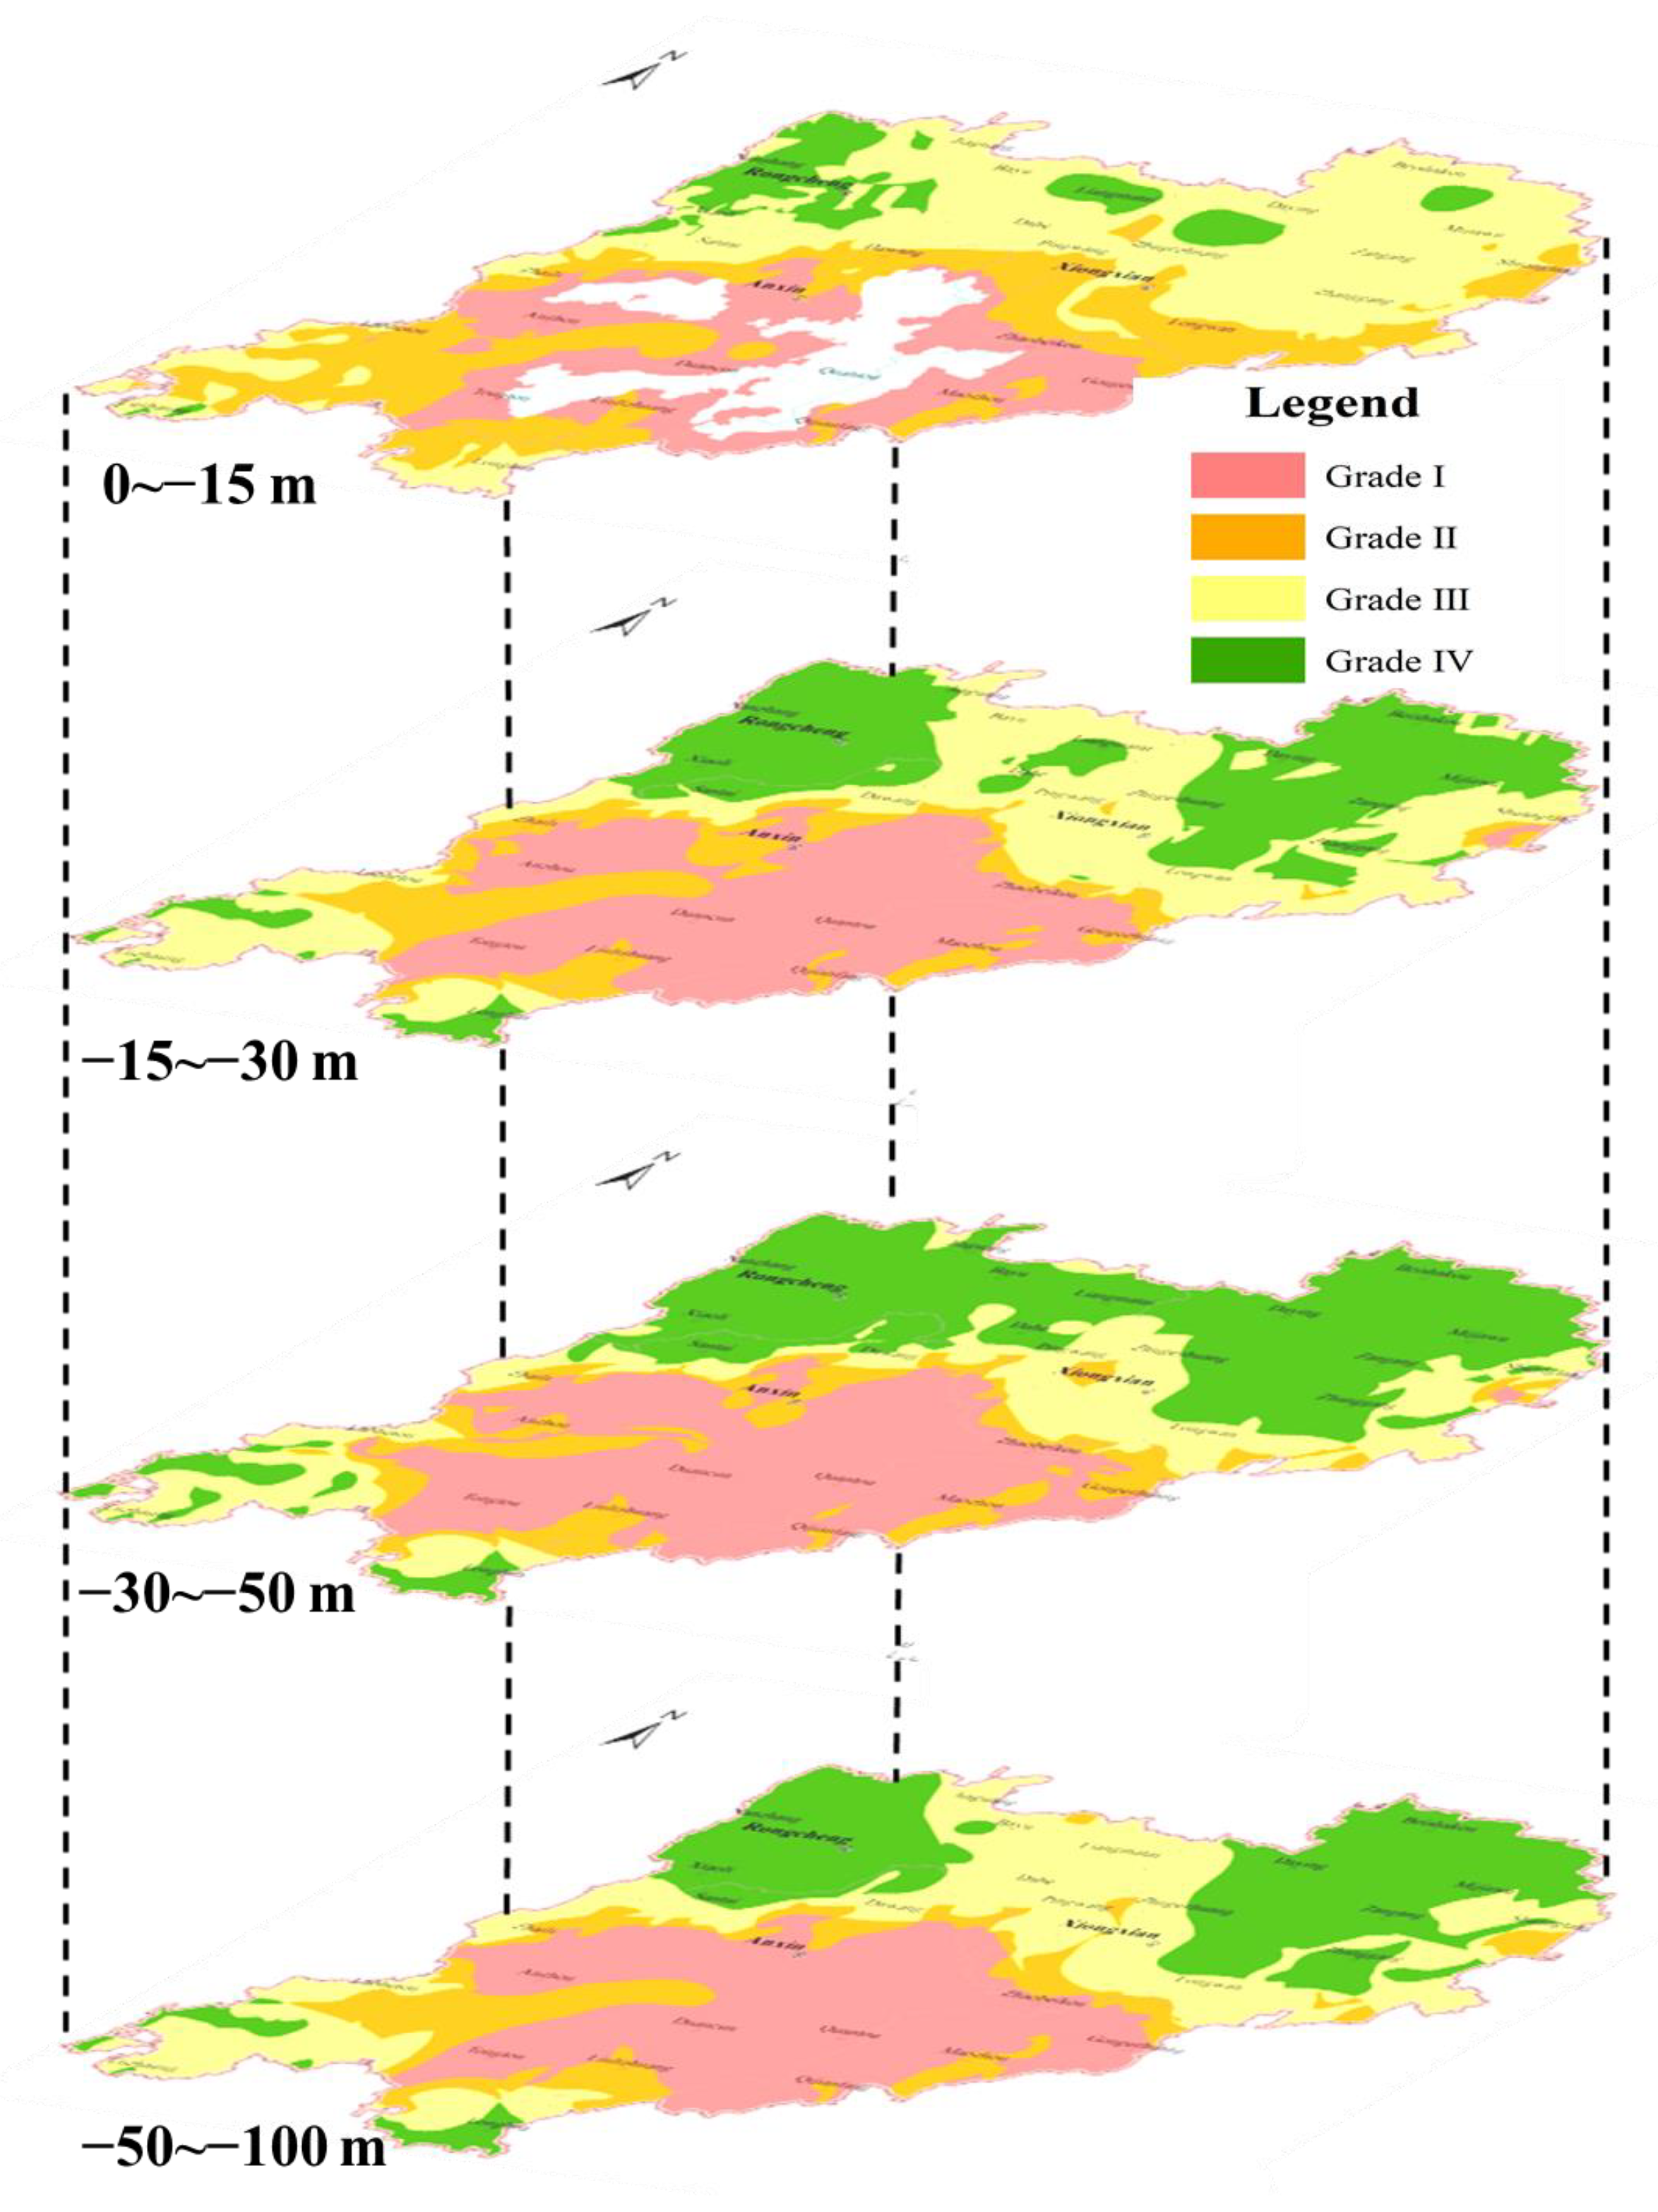
4.4. Assessment Results
5. Discussion
6. Conclusions
- (1)
- A process was proposed to assess the suitability of multilayer UUS based on the impacts of geological environments. The case study of Xiong’an New Area was used to establish an assessment indicator system, including four types of criteria indicators: topography, geotechnical characteristics, hydrogeological conditions, and adverse geological phenomena. The suitability of four vertical layers within a depth of 100 m was identified, providing guidance for urban planners and constructors. To ensure an objective and rational assessment, the entropy and CRITIC combined method was employed to determine the weights of sub-criteria indicators, considering the discreteness, correlation, and comparative intensity of data. Compared with previously used combination by other researcher, this paper demonstrated a better method. This combined weighting method can be applied to similar regions for the suitability assessment of UUS.
- (2)
- The evaluation results indicated that the suitability of UUS in Xiong’an New Area varied depending on the depth of strata. Deeper layers showed better suitability, while shallower layers showed relatively worse suitability. The proportions of acreage with good and moderate suitability were as follows: 45.31% for shallow layer, 57.94% for sub-shallow layer, 58.31% for sub-deep layer, and 57.97% for deep layer. When considering the plane distribution state, the good and moderate suitable zones were predominantly located in the north, south, and southwest of the study area. Conversely, the inferior and worse suitable zones were mainly found around Baiyangdian Lake. Although the factors influencing the suitability of the four layers differed, the main indicators were the bearing capacity of soils, compression modulus of soils, groundwater buried depth, and ground elevation, which carried higher weights. Groundwater buried depth was significantly affected by artificial exploitation of groundwater, while the other three indicators are primarily influenced by the sedimentary process of strata.
- (3)
- The paper focused on the geological indicators affecting the utilization of UUS in Xiong’an New Area. However, it did not include socioeconomic factors and excavation types of underground facilities. Although the UUS utilization in Xiong’an New Area is still in the initial stage, future studies should consider socioeconomic progress, existing underground infrastructures, and the difficulty of excavation based on the evaluation results.
Author Contributions
Funding
Institutional Review Board Statement
Informed Consent Statement
Data Availability Statement
Acknowledgments
Conflicts of Interest
References
- Romano, B.; Zullo, F.; Fiorini, L.; Marucci, A.; Ciabò, S. Land transformation of Italy due to half a century of urbanization. Land Use Policy 2017, 67, 387–400. [Google Scholar] [CrossRef]
- Zhang, Y.H.; Zhu, J.B.; Liao, Z.Y.; Guo, J.; Xie, H.P.; Peng, Q. An intelligent planning model for the development and utilization of urban underground space with an application to the Luohu District in Shenzhen. Tunn. Undergr. Space Technol. 2021, 112, 103933. [Google Scholar] [CrossRef]
- Bobylev, N.; Sterling, R. Urban underground space: A growing imperative. Perspectives and current research in planning and design for underground space use. Tunn. Undergr. Space Technol. 2016, 55, 1–4. [Google Scholar] [CrossRef]
- Chen, Z.L.; Chen, J.Y.; Liu, H.; Zhang, Z.F. Present status and development trends of underground space in Chinese cities: Evaluation and analysis. Tunn. Undergr. Space Technol. 2018, 71, 253–270. [Google Scholar] [CrossRef]
- Tann, L.; Ritter, S.; Hale, S.; Langford, J.; Salazar, S. From urban underground space (UUS) to sustainable underground urbanism (SUU): Shifting the focus in urban underground scholarship. Land Use Policy 2021, 109, 105650. [Google Scholar] [CrossRef]
- Admiraal, H.; Cornaro, A. Underground Spaces Unveiled: Planning and Creating the Cities for the Future; ICE Publishing: London, UK, 2018. [Google Scholar]
- Cui, J.Q.; Broere, W.; Lin, D. Underground space utilisation for urban renewal. Tunn. Undergr. Space Technol. 2021, 108, 103726. [Google Scholar] [CrossRef]
- Li, X.Z.; Li, C.C.; Parriaux, A.; Wu, W.B.; Li, H.Q.; Sun, L.P.; Liu, C. Multiple resources and their sustainable development in Urban Underground Space. Tunn. Undergr. Space Technol. 2016, 55, 59–66. [Google Scholar] [CrossRef]
- Lin, D.; Broere, W.; Cui, J.Q. Underground space utilisation and new town development: Experiences, lessons and implications. Tunn. Undergr. Space Technol. 2022, 119, 104204. [Google Scholar] [CrossRef]
- Admiraal, H.; Cornaro, A. Future cities, resilient cities-The role of underground space in achieving urban resilience. Undergr. Space 2020, 5, 223–228. [Google Scholar] [CrossRef]
- Tan, F.; Wang, J.; Jiao, Y.Y.; Ma, B.; He, L. Suitability evaluation of underground space based on finite interval cloud model and genetic algorithm combination weighting. Tunn. Undergr. Space Technol. 2021, 108, 103743. [Google Scholar] [CrossRef]
- Šipetić, N.; Kuzmić, P. Design the Future Urban Plan of the Underground Construction from the Aspect of Geological and Geotechnical Features of Belgrade’s Inner City Area. Procedia Eng. 2016, 165, 641–648. [Google Scholar] [CrossRef]
- Tong, D.; Tan, F.; Ma, B.; Jiao, Y.Y.; Wang, J. A Suitability Evaluation Method of Urban Underground Space Based on Rough Set Theory and Conditional Entropy: A Case Study in Wuhan Changjiang New Town. Appl. Sci. 2022, 12, 1347. [Google Scholar] [CrossRef]
- Peng, Z.L.; Zhang, Y.; Tan, F.; Lv, J.H.; Li, L.H. Variable-Weight Suitability Evaluation of Underground Space Development Considering Socioeconomic Factors. Sustainability 2023, 15, 3574. [Google Scholar] [CrossRef]
- Hou, W.; Yang, L.; Deng, D.C.; Ye, J.; Clarke, K.; Yang, Z.J.; Zhuang, W.; Liu, J.X.; Huang, J.C. Assessing quality of urban underground spaces by coupling 3D geological models: The case study of Foshan city, South China. Comput. Geosci. 2016, 89, 1–11. [Google Scholar] [CrossRef]
- Lu, Z.L.; Wu, L.; Zhuang, X.Y.; Rabczuk, T. Quantitative assessment of engineering geological suitability for multilayer Urban Underground Space. Tunn. Undergr. Space Technol. 2016, 59, 65–76. [Google Scholar] [CrossRef]
- Zhang, M.S.; Wang, H.Q.; Dong, Y.; Li, L.; Sun, P.P.; Zhang, G. Evaluation of urban underground space resources using a negative list method: Taking Xi’an City as an example in China. China Geol. 2020, 3, 124–136. [Google Scholar] [CrossRef]
- Deng, F.; Pu, J.; Huang, Y.; Han, Q.D. 3D geological suitability evaluation for underground space based on the AHP-cloud model. Undergr. Space 2023, 8, 109–122. [Google Scholar] [CrossRef]
- Youssef, A.M.; Pradhan, B.; Tarabees, E. Integrated evaluation of urban development suitability based on remote sensing and GIS techniques: Contribution from the analytic hierarchy process. Arab. J. Geosci. 2011, 4, 463–473. [Google Scholar] [CrossRef]
- Zhang, X.B.; Wang, C.S.; Fan, J.; Wang, H.J.; Li, H.L. Optimizing the analytic hierarchy process through a suitability evaluation of underground space development in Tonghu District, Huizhou City. Energies 2020, 13, 742. [Google Scholar] [CrossRef]
- Duan, Y.; Xie, Z.; Zhao, F.; Zeng, H.; Lin, M.; Chen, H.; Zuo, X.; He, J.; Hou, Z. Suitability of underground space development in plateau cities based on geological environment analysis: Case study in Kunming, China. J. Urban Plan. Dev. 2021, 147, 05021014. [Google Scholar] [CrossRef]
- Dai, S.; Niu, D. Comprehensive evaluation of the sustainable development of power grid enterprises based on the model of fuzzy group ideal point method and combination weighting method with improved group order relation method and entropy weight method. Sustainability 2017, 9, 1900. [Google Scholar] [CrossRef]
- Guo, J.H.; Liu, K.; Deng, Y.F.; Yu, C.H. Geological evaluation of underground space resources based on the entropy weight optimization method. Geol. Bull. China 2023, 42, 385–396. [Google Scholar]
- Zhang, Y.B.; Xie, Z.Q.; Jiang, F.S.; Xu, T.; Yang, S.Q.; Yin, S.Q.; Zhao, F.; He, J.L.; Chen, Y.B.; Hou, Z.Q.; et al. Evaluating the Socioeconomic Value of Urban Underground Space in Kunming, China, Using the Entropy Method and Exponential Smoothing Prediction. J. Urban Plan. Dev. 2023, 149, 05023001. [Google Scholar] [CrossRef]
- Durmisevic, S.; Sariyildiz, S. A systematic quality assessment of underground spaces–public transport stations. Cities 2001, 18, 13–23. [Google Scholar] [CrossRef]
- Xu, K.; Kong, C.; Li, J.; Zhang, L.; Wu, C. Suitability evaluation of urban construction land based on geo-environmental factors of Hangzhou, China. Comput. Geosci. 2011, 37, 992–1002. [Google Scholar] [CrossRef]
- Bobylev, N. Sustainability and vulnerability analysis of critical underground infrastructure. In Managing Critical Infrastructure Risks: Decision Tools and Applications for Port Security; Springer: Berlin/Heidelberg, Germany, 2007; pp. 445–469. [Google Scholar]
- Costa, A.N.; Polivanov, H.; Alves, M.G.; Ramos, D.P. Multicriterial analysis in the investigation of favorable areas for edifications with shallow and deep foundations in the Municipality of Campos dos Goytacazes-Rio de Janeiro, Brazil. Eng. Geol. 2011, 123, 149–165. [Google Scholar] [CrossRef]
- Zhou, C.A.; Ren, H.; Liu, G.; Chen, C. Comprehensive evaluation and case study of urban underground space development under multiple constraints. J. Bulg. Chem. Commun. 2017, 49, 90–97. [Google Scholar]
- Dou, F.F.; Xing, H.X.; Li, X.H.; Yuan, F.; Lu, Z.T.; Li, X.L.; Ge, W.Y. 3D Geological suitability evaluation for urban underground space development based on combined weighting and improved TOPSIS. Nat. Resour. Res. 2022, 31, 693–711. [Google Scholar] [CrossRef]
- Cao, X.T.; Wei, C.F.; Xie, D.T. Evaluation of scale management suitability based on the entropy-TOPSIS method. Land 2021, 10, 416. [Google Scholar] [CrossRef]
- Sałabun, W.; Wątróbski, J.; Shekhovtsov, A. Are MCDA methods benchmarkable? A comparative study of TOPSIS, VIKOR, COPRAS, and PROMETHEE II methods. Symmetry 2020, 12, 1549. [Google Scholar] [CrossRef]
- Chen, P.Y. Effects of normalization on the entropy-based TOPSIS method. Expert Syst. Appl. 2019, 136, 33–41. [Google Scholar] [CrossRef]
- Mahmoud, P.H.A.; Morteza, N.H.; Behnam, M.I.; Heresh, S. A hybrid genetic particle swarm optimization for distributed generation allocation in power distribution networks. Energy 2020, 209, 118218. [Google Scholar]
- Zeleny, M.; Cochrane, J.L. Multiple Criteria Decision Making; McGraw-Hill: New York, NY, USA, 1982; p. 34. [Google Scholar]
- Shannon, C.E. A mathematical theory of communication. Bell Syst. Technol. J. 1948, 27, 379–423. [Google Scholar] [CrossRef]
- Aomar, R.A. A combined ahp-entropy method for deriving subjective and objective criteria weights. Int. J. Ind. Eng. 2010, 17, 12–24. [Google Scholar]
- Diakoulaki, D.; Mavrotas, G.; Papayannakis, L. Determining objective weights in multiple criteria problems: The critic method. Comput. Oper. Res. 1995, 22, 763–770. [Google Scholar] [CrossRef]
- Madić, M.; Radovanović, M. Ranking of some most commonly used nontraditional machining processes using ROV and CRITIC methods. UPB Sci. Bull. Ser. D 2015, 77, 193–204. [Google Scholar]
- Anath, R.K.; Maznah, M.K.; Hamid, R.; Mohd, F.G. A modified CRITIC method to estimate the objective weights of decision criteria. Symmetry 2021, 13, 973. [Google Scholar]
- Cao, Y.C.; Yang, J.; Chen, X.L.; Yang, X.J. A Beacon of Space and Time: Detailed Depiction of Human Space in the Xiong’an New Area Guided by Material Cultural Heritages. Discret. Dyn. Nat. Soc. 2021, 2021, 7746556. [Google Scholar] [CrossRef]
- Liu, K.M.; Xu, Q.M.; Duan, L.F.; Niu, W.C.; Teng, F.; Wang, X.D.; Zhang, W.; Dong, J. Quaternary stratigraphic architecture and sedimentary evolution from borehole GB014 in the western Xiong’an New Area. Sci. China Press 2020, 65, 2145–2160. [Google Scholar]
- He, D.F.; Shan, S.Q.; Zhang, Y.Y.; Lu, R.Q.; Zhang, R.F.; Cui, Y.Q. 3-D geologic architecture of Xiong’an New Area: Constraints from seismic reflection data. Sci. China 2018, 61, 1007–1022. [Google Scholar] [CrossRef]
- Zhao, K.; Qi, J.X.; Chen, Y.; Ma, B.H.; Yi, L.; Guo, H.M.; Wang, X.Z.; Wang, L.Y.; Li, H.T. Hydrogeochemical characteristics of groundwater and pore-water and the paleoenvironmental evolution in the past 3.10 Ma in the Xiong’an New Area, North China. China Geol. 2021, 4, 476–486. [Google Scholar] [CrossRef]
- Gao, Y.H.; Shen, J.H.; Chen, L.; Li, X.; Jin, S.; Ma, Z.; Meng, Q.H. Influence of underground space development mode on the groundwater flow field in Xiong’an new area. J. Groundw. Sci. Eng. 2023, 11, 68–80. [Google Scholar] [CrossRef]
- Wang, Y.J.; Song, L.C.; Han, Z.Y.; Liao, Y.M.; Xu, H.M.; Zhai, J.Q.; Zhu, R. Climate-related risks in the construction of Xiongan New Area, China. Theor. Appl. Clim. 2020, 141, 1301–1311. [Google Scholar] [CrossRef]
- Gao, Y.H. Study on Engineering Geological Environment and Construction Suitability of Xiong’an New Area. Ph.D. Dissertation, Chengdu University of Technology, Chengdu, China, 2023. [Google Scholar]
- Xia, Y.B.; Li, H.T.; Wang, B.; Ma, Z.; Guo, X.; Zhao, K.; Zhao, C.R. Characterization of Shallow Groundwater Circulation Based on Chemical Kinetics: A Case Study of Xiong’an New Area, China. Water 2022, 14, 1880. [Google Scholar] [CrossRef]
- Li, H.T.; Feng, W.; Wang, K.L.; Zhao, K.; Li, G.; Zhang, Y.; Li, M.Z.; Sun, L.; Chen, Y.C.; You, B. Groundwater resources in Xiong’an New Area and its exploitation potential. Geol. China 2021, 4, 1112–1126. [Google Scholar]
- Shang, S.J.; Feng, C.J.; Tan, C.X.; Qi, B.S.; Zhang, P.; Meng, J.; Wang, M.M.; Sun, M.Q.; Wan, J.W.; Wang, H.J.; et al. Quaternary activity study of major buried faults near Xiongan New Area. Acta Geosci. Sin. 2019, 40, 836–846. [Google Scholar]
- Yue, G.F.; Wang, G.L.; Ma, F.; Zhu, X.; Zhang, H.X.; Zhou, J.W.; Na, J. Fracture Characteristics and Reservoir Inhomogeneity Prediction of the Gaoyuzhuang Formation in the Xiong’an New Area: Insights From a 3D Discrete Fracture Network Model. Front. Earth Sci. 2022, 10, 849361. [Google Scholar] [CrossRef]
- Ma, Z.; Huang, Q.B.; Lin, L.J.; Zhang, X.; Han, B.; Xia, Y.B.; Guo, X. Practice and application of multi-factor urban geological survey in Xiong’an New Area. North China Geol. 2022, 45, 58–68. [Google Scholar]
- Liu, H.W.; Wang, G.M.; Ma, C.M.; Gao, M.D.; Bai, Y.N.; Zhang, J.; Du, D. Study on evaluation index system of suitability for development and utilization of underground space in sedimentary plain: A Case Study of Tongzhou District in Beijing and Langfang north three counties in Hebei Province. North China Geol. 2022, 45, 68–78. [Google Scholar]
- Zou, Y.H.; Zhao, W.X. Making a new area in Xiong’an: Incentives and challenges of China’s “Millennium Plan”. Geoforum 2018, 88, 45–48. [Google Scholar] [CrossRef]


| Criteria Indicators | Sub-Criteria Indicators (Unit) | Grading Criteria of Suitability | Application Layer | |||
|---|---|---|---|---|---|---|
| Grade I | Grade II | Grade III | Grade IV | |||
| Topography | Ground elevation (m) | <8 | 8~8.5 | 8.5~9 | >9 | L1~L4 |
| Geotechnical characteristics | Bearing capacity of soils (0~−5 m) (kPa) | <80 | 80~100 | 100~130 | >130 | L1 |
| Bearing capacity of soils (−5~−10 m) (kPa) | <100 | 100~130 | 130~160 | >160 | L1 | |
| Bearing capacity of soils (−10~−15 m) (kPa) | <110 | 110~130 | 130~170 | >170 | L1 | |
| Bearing capacity of soils (−15~−30 m) (kPa) | <130 | 130~160 | 160~200 | >200 | L2 | |
| Bearing capacity of soils (−30~−50 m) (kPa) | <130 | 130~160 | 160~200 | >200 | L3 | |
| Bearing capacity of soils (−50~−100 m) (kPa) | <130 | 130~160 | 160~200 | >200 | L4 | |
| Compression modulus of soils (0~−5 m) (MPa) | <4 | 4~11 | 11~15 | >15 | L1 | |
| Compression modulus of soils (−5~−10 m) (MPa) | <4 | 4~11 | 11~15 | >15 | L1 | |
| Compression modulus of soils (−10~−15 m) (MPa) | <4 | 4~11 | 11~15 | >15 | L1 | |
| Compression modulus of soils (−15~−30 m) (MPa) | <4 | 4~11 | 11~15 | >15 | L2 | |
| Compression modulus of soils (−30~−50 m) (MPa) | <4 | 4~11 | 11~15 | >15 | L3 | |
| Compression modulus of soils (−50~−100 m) (MPa) | <4 | 4~11 | 11~15 | >15 | L4 | |
| Hydrogeological conditions | Groundwater buried depth (m) | <5 | 5~10 | 10~15 | >15 | L1~L4 |
| Aquifer thickness (0~−15 m) (m) | >7.5 | 5~7.5 | 2.5~5 | <2.5 | L1 | |
| Aquifer thickness (−15~−30 m) (m) | >7.5 | 5~7.5 | 2.5~5 | <2.5 | L2 | |
| Aquifer thickness (−30~−50 m) (m) | >7.5 | 5~7.5 | 2.5~5 | <2.5 | L3 | |
| Aquifer thickness (−50~−65 m) (m) | >7.5 | 5~7.5 | 2.5~5 | <2.5 | L4 | |
| Aquifer thickness (−65~−80 m) (m) | >7.5 | 5~7.5 | 2.5~5 | <2.5 | L4 | |
| Aquifer thickness (−80~−100 m) (m) | >7.5 | 5~7.5 | 2.5~5 | <2.5 | L4 | |
| Adverse geological phenomena | Land subsidence rate (mm/a) | >50 | 30~50 | 10~30 | <10 | L1~L4 |
| Sands liquefaction index | >18 | 6~18 | <6 | 0 | L1 | |
| Chemical corrosion of groundwater | Strong | Medium | Weak | Micro | L1~L4 | |
| Chemical corrosion of soils | Strong | Medium | Weak | Micro | L1~L4 | |
| Criteria Indicators | Sub-Criteria Indicators | Entropy Values, E | Otherness Coefficients, G | Entropy Weights, v |
|---|---|---|---|---|
| Topography | Ground elevation, I1 | 0.9281 | 0.0719 | 5.61% |
| Geotechnical characteristics | Bearing capacity of soils (0~−5 m), I2 | 0.9710 | 0.0290 | 2.26% |
| Bearing capacity of soils (−5~−10 m), I3 | 0.7707 | 0.2293 | 17.90% | |
| Bearing capacity of soils (−10~−15 m), I4 | 0.9759 | 0.0241 | 1.88% | |
| Compression modulus of soils (0~−5 m), I5 | 0.9660 | 0.0340 | 2.65% | |
| Compression modulus of soils (−5~−10 m), I6 | 0.5948 | 0.4052 | 31.62% | |
| Compression modulus of soils (−10~−15 m), I7 | 0.6823 | 0.3177 | 24.80% | |
| Hydrogeological conditions | Groundwater buried depth, I8 | 0.9330 | 0.0670 | 5.23% |
| Aquifer thickness (0~−15 m), I9 | 0.9788 | 0.0212 | 1.65% | |
| Adverse geological phenomena | Land subsidence rate, I10 | 0.9903 | 0.0097 | 0.76% |
| Sands liquefaction index, I11 | 0.9671 | 0.0329 | 2.57% | |
| Chemical corrosion of groundwater, I12 | 0.9913 | 0.0087 | 0.68% | |
| Chemical corrosion of soils, I13 | 0.9694 | 0.0306 | 2.39% |
| Criteria Indicators | Sub-Criteria Indicators | Deviation Values, S | Conflicting Values, A | Quantity of Information, C | CRITIC Weights, u |
|---|---|---|---|---|---|
| Topography | Ground elevation, I1 | 0.439 | 9.508 | 4.173 | 11.45% |
| Geotechnical characteristics | Bearing capacity of soils (0~−5 m), I2 | 0.345 | 10.747 | 3.711 | 10.18% |
| Bearing capacity of soils (−5~−10 m), I3 | 0.255 | 9.640 | 2.459 | 6.75% | |
| Bearing capacity of soils (−10~−15 m), I4 | 0.191 | 10.258 | 1.963 | 5.39% | |
| Compression modulus of soils (0~−5 m), I5 | 0.192 | 10.464 | 2.013 | 5.52% | |
| Compression modulus of soils (−5~−10 m), I6 | 0.129 | 11.674 | 1.507 | 4.14% | |
| Compression modulus of soils (−10~−15 m), I7 | 0.092 | 13.087 | 1.200 | 3.29% | |
| Hydrogeological conditions | Groundwater buried depth, I8 | 0.415 | 9.535 | 3.957 | 10.86% |
| Aquifer thickness (0~−15 m), I9 | 0.304 | 12.356 | 3.761 | 10.32% | |
| Adverse geological phenomena | Land subsidence rate, I10 | 0.228 | 13.771 | 3.145 | 8.63% |
| Sands liquefaction index, I11 | 0.350 | 9.728 | 3.403 | 9.34% | |
| Chemical corrosion of groundwater, I12 | 0.225 | 10.259 | 2.305 | 6.32% | |
| Chemical corrosion of soils, I13 | 0.298 | 9.557 | 2.846 | 7.81% |
Disclaimer/Publisher’s Note: The statements, opinions and data contained in all publications are solely those of the individual author(s) and contributor(s) and not of MDPI and/or the editor(s). MDPI and/or the editor(s) disclaim responsibility for any injury to people or property resulting from any ideas, methods, instructions or products referred to in the content. |
© 2023 by the authors. Licensee MDPI, Basel, Switzerland. This article is an open access article distributed under the terms and conditions of the Creative Commons Attribution (CC BY) license (https://creativecommons.org/licenses/by/4.0/).
Share and Cite
Liu, H.; Li, Z.; He, Q. Suitability Assessment of Multilayer Urban Underground Space Based on Entropy and CRITIC Combined Weighting Method: A Case Study in Xiong’an New Area, China. Appl. Sci. 2023, 13, 10231. https://doi.org/10.3390/app131810231
Liu H, Li Z, He Q. Suitability Assessment of Multilayer Urban Underground Space Based on Entropy and CRITIC Combined Weighting Method: A Case Study in Xiong’an New Area, China. Applied Sciences. 2023; 13(18):10231. https://doi.org/10.3390/app131810231
Chicago/Turabian StyleLiu, Hongwei, Zhuang Li, and Qingcheng He. 2023. "Suitability Assessment of Multilayer Urban Underground Space Based on Entropy and CRITIC Combined Weighting Method: A Case Study in Xiong’an New Area, China" Applied Sciences 13, no. 18: 10231. https://doi.org/10.3390/app131810231
APA StyleLiu, H., Li, Z., & He, Q. (2023). Suitability Assessment of Multilayer Urban Underground Space Based on Entropy and CRITIC Combined Weighting Method: A Case Study in Xiong’an New Area, China. Applied Sciences, 13(18), 10231. https://doi.org/10.3390/app131810231