
Enhancing Railway Network Safety by Reproducing Wheel–Rail Electrical Contact on a Laboratory Scale

 ,
,
Abstract
:1. Introduction
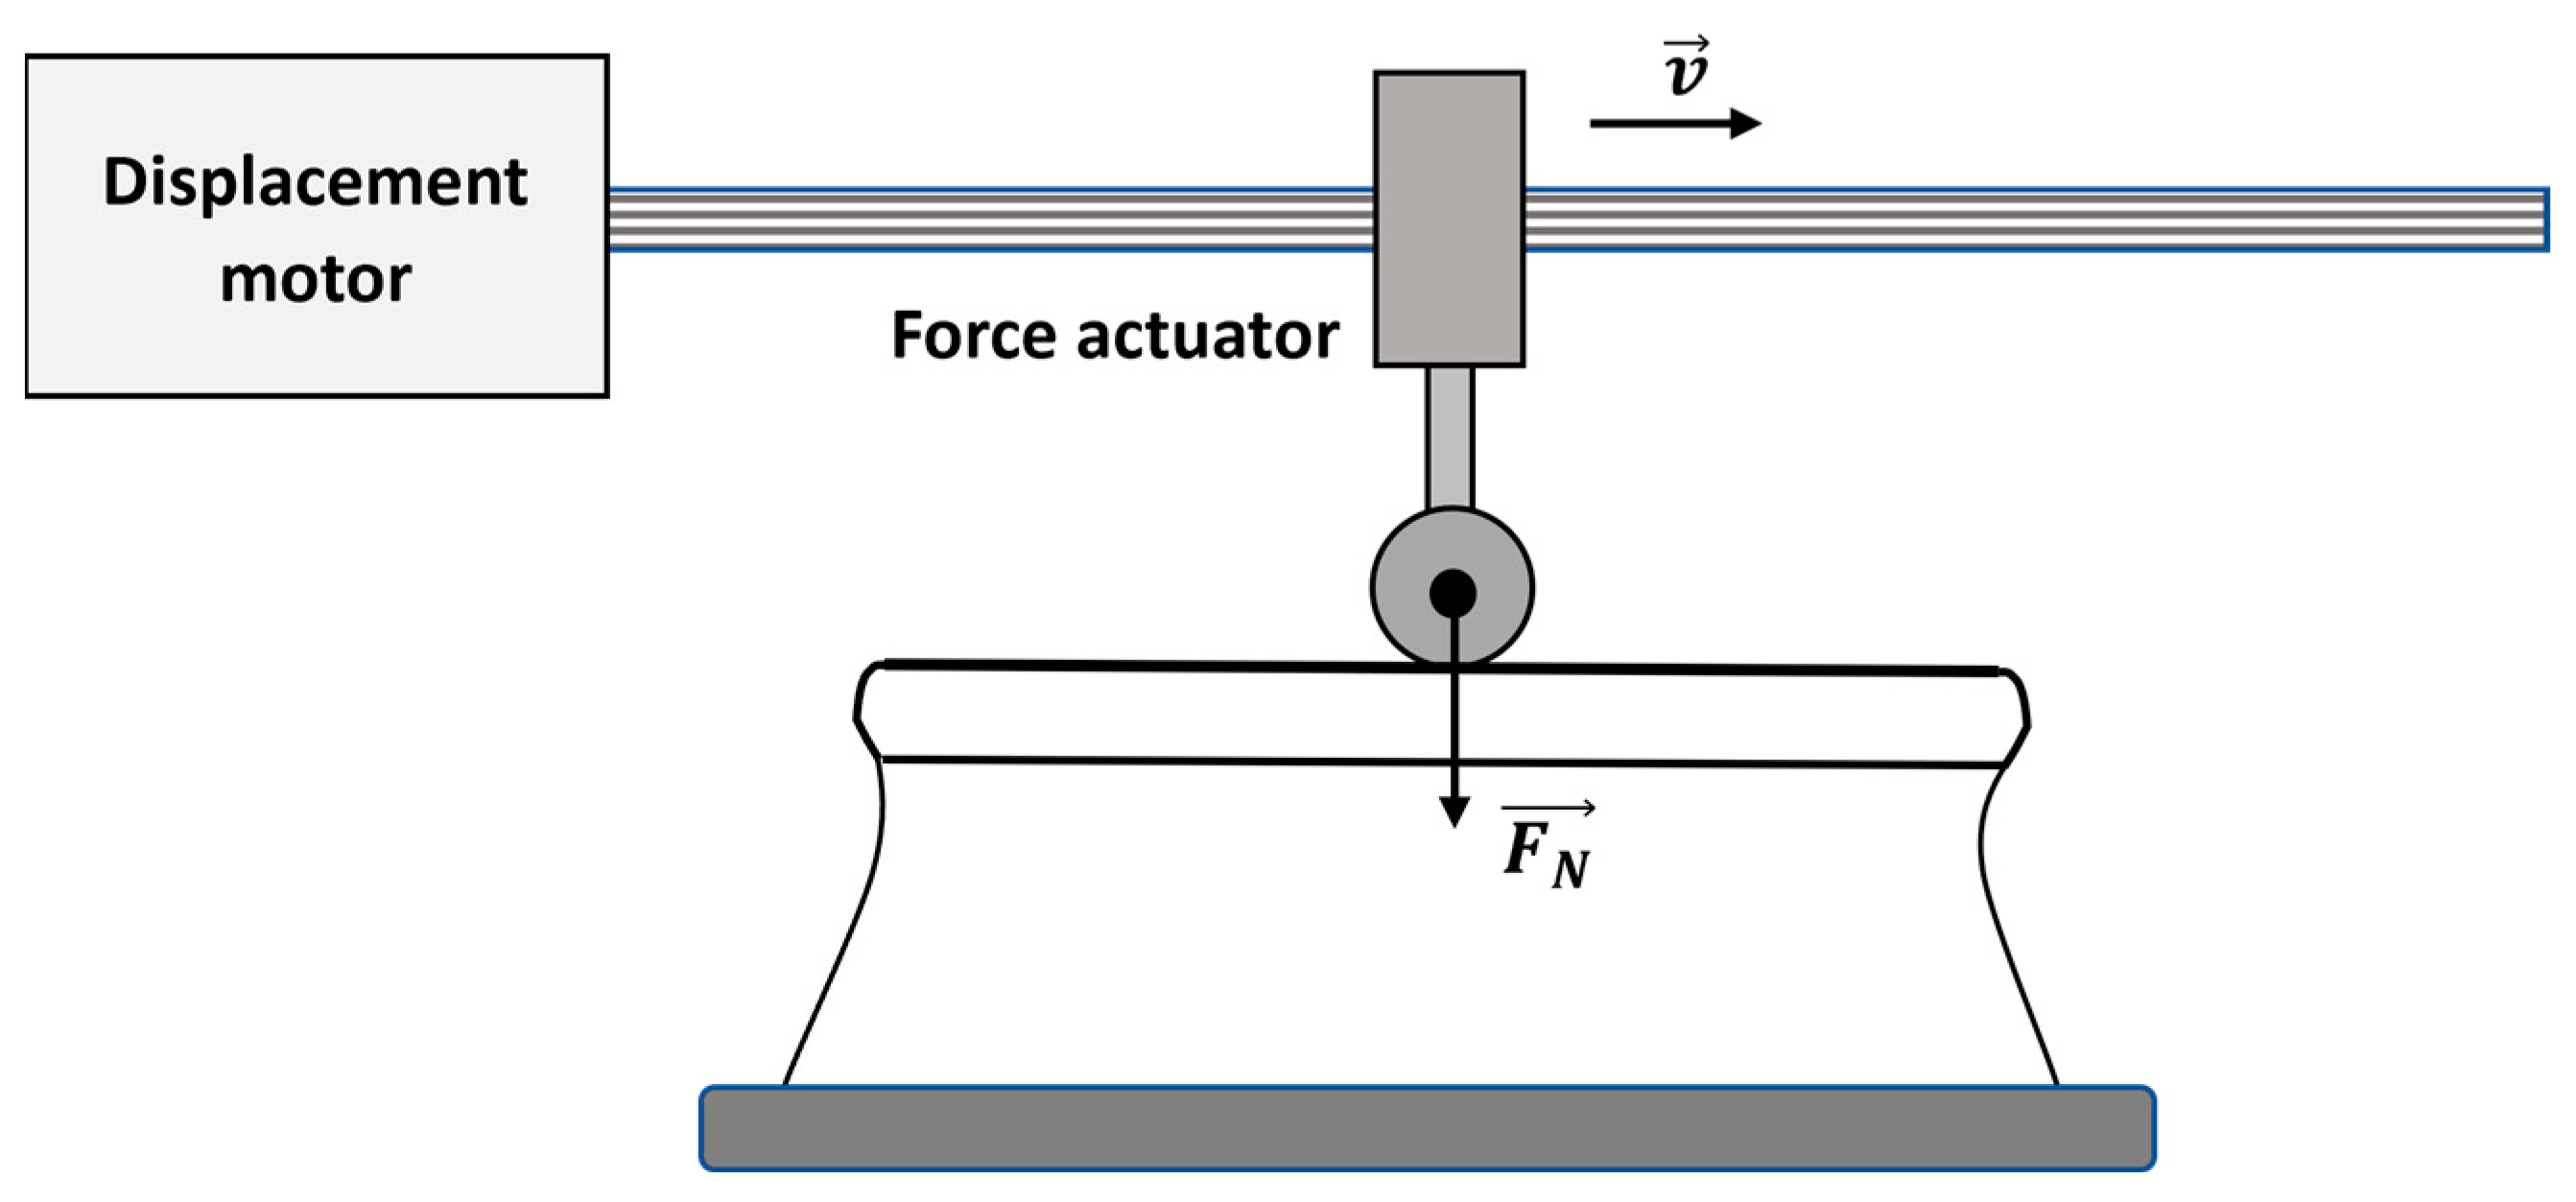
2. Bench Conception
2.1. General Principle
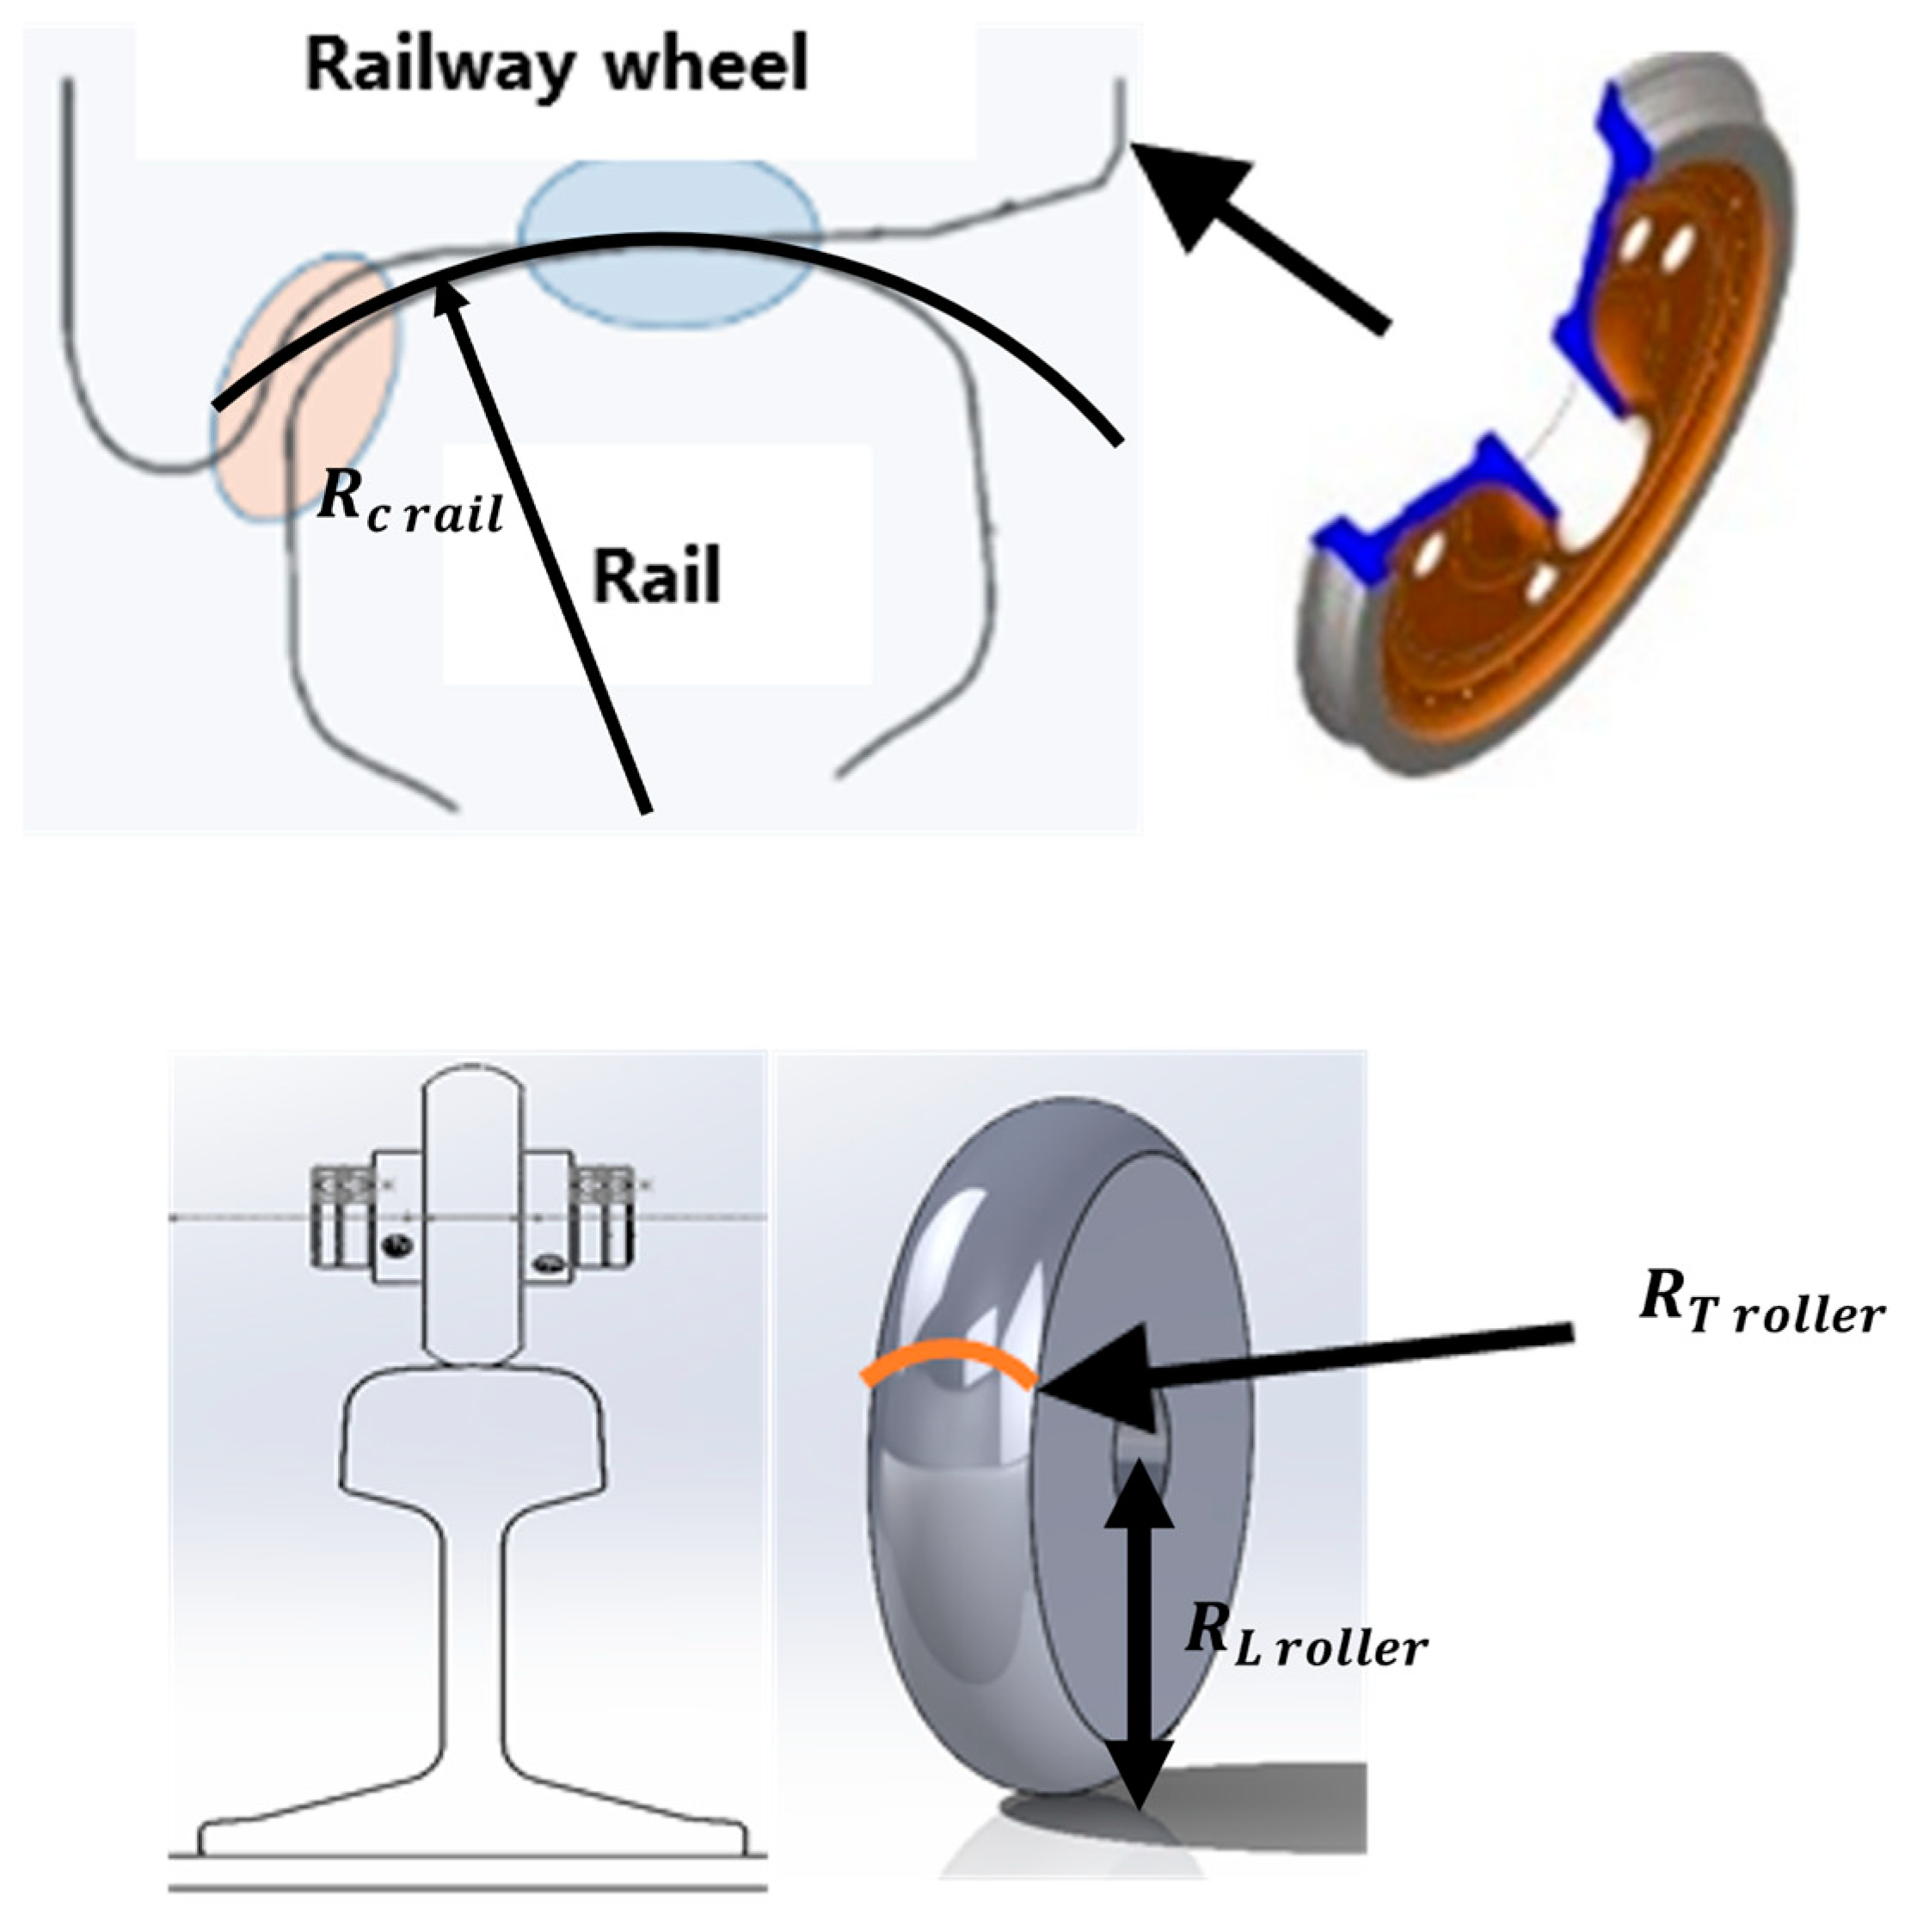
2.2. Dimensioning Methodology
- Same aspect ratio of the contact surface at both scales.
- Same average contact pressure at both scales.
- Same fraction of contact surface renewed at both scales during a track circuit signal period.
2.2.1. Choice of the Roller
- Perfectly elastic and homogeneous bodies in contact with isotropic mechanical properties.
- Smooth contact surfaces.
- Semi-infinite bodies with contact dimensions very small compared to body dimensions and radii of curvature.
- E and v: Young’s modulus and Poisson’s ratio of the steel.
- A and B: combined longitudinal and transverse curvatures.
2.2.2. Choice of Force Actuator
2.2.3. Speed Scaling
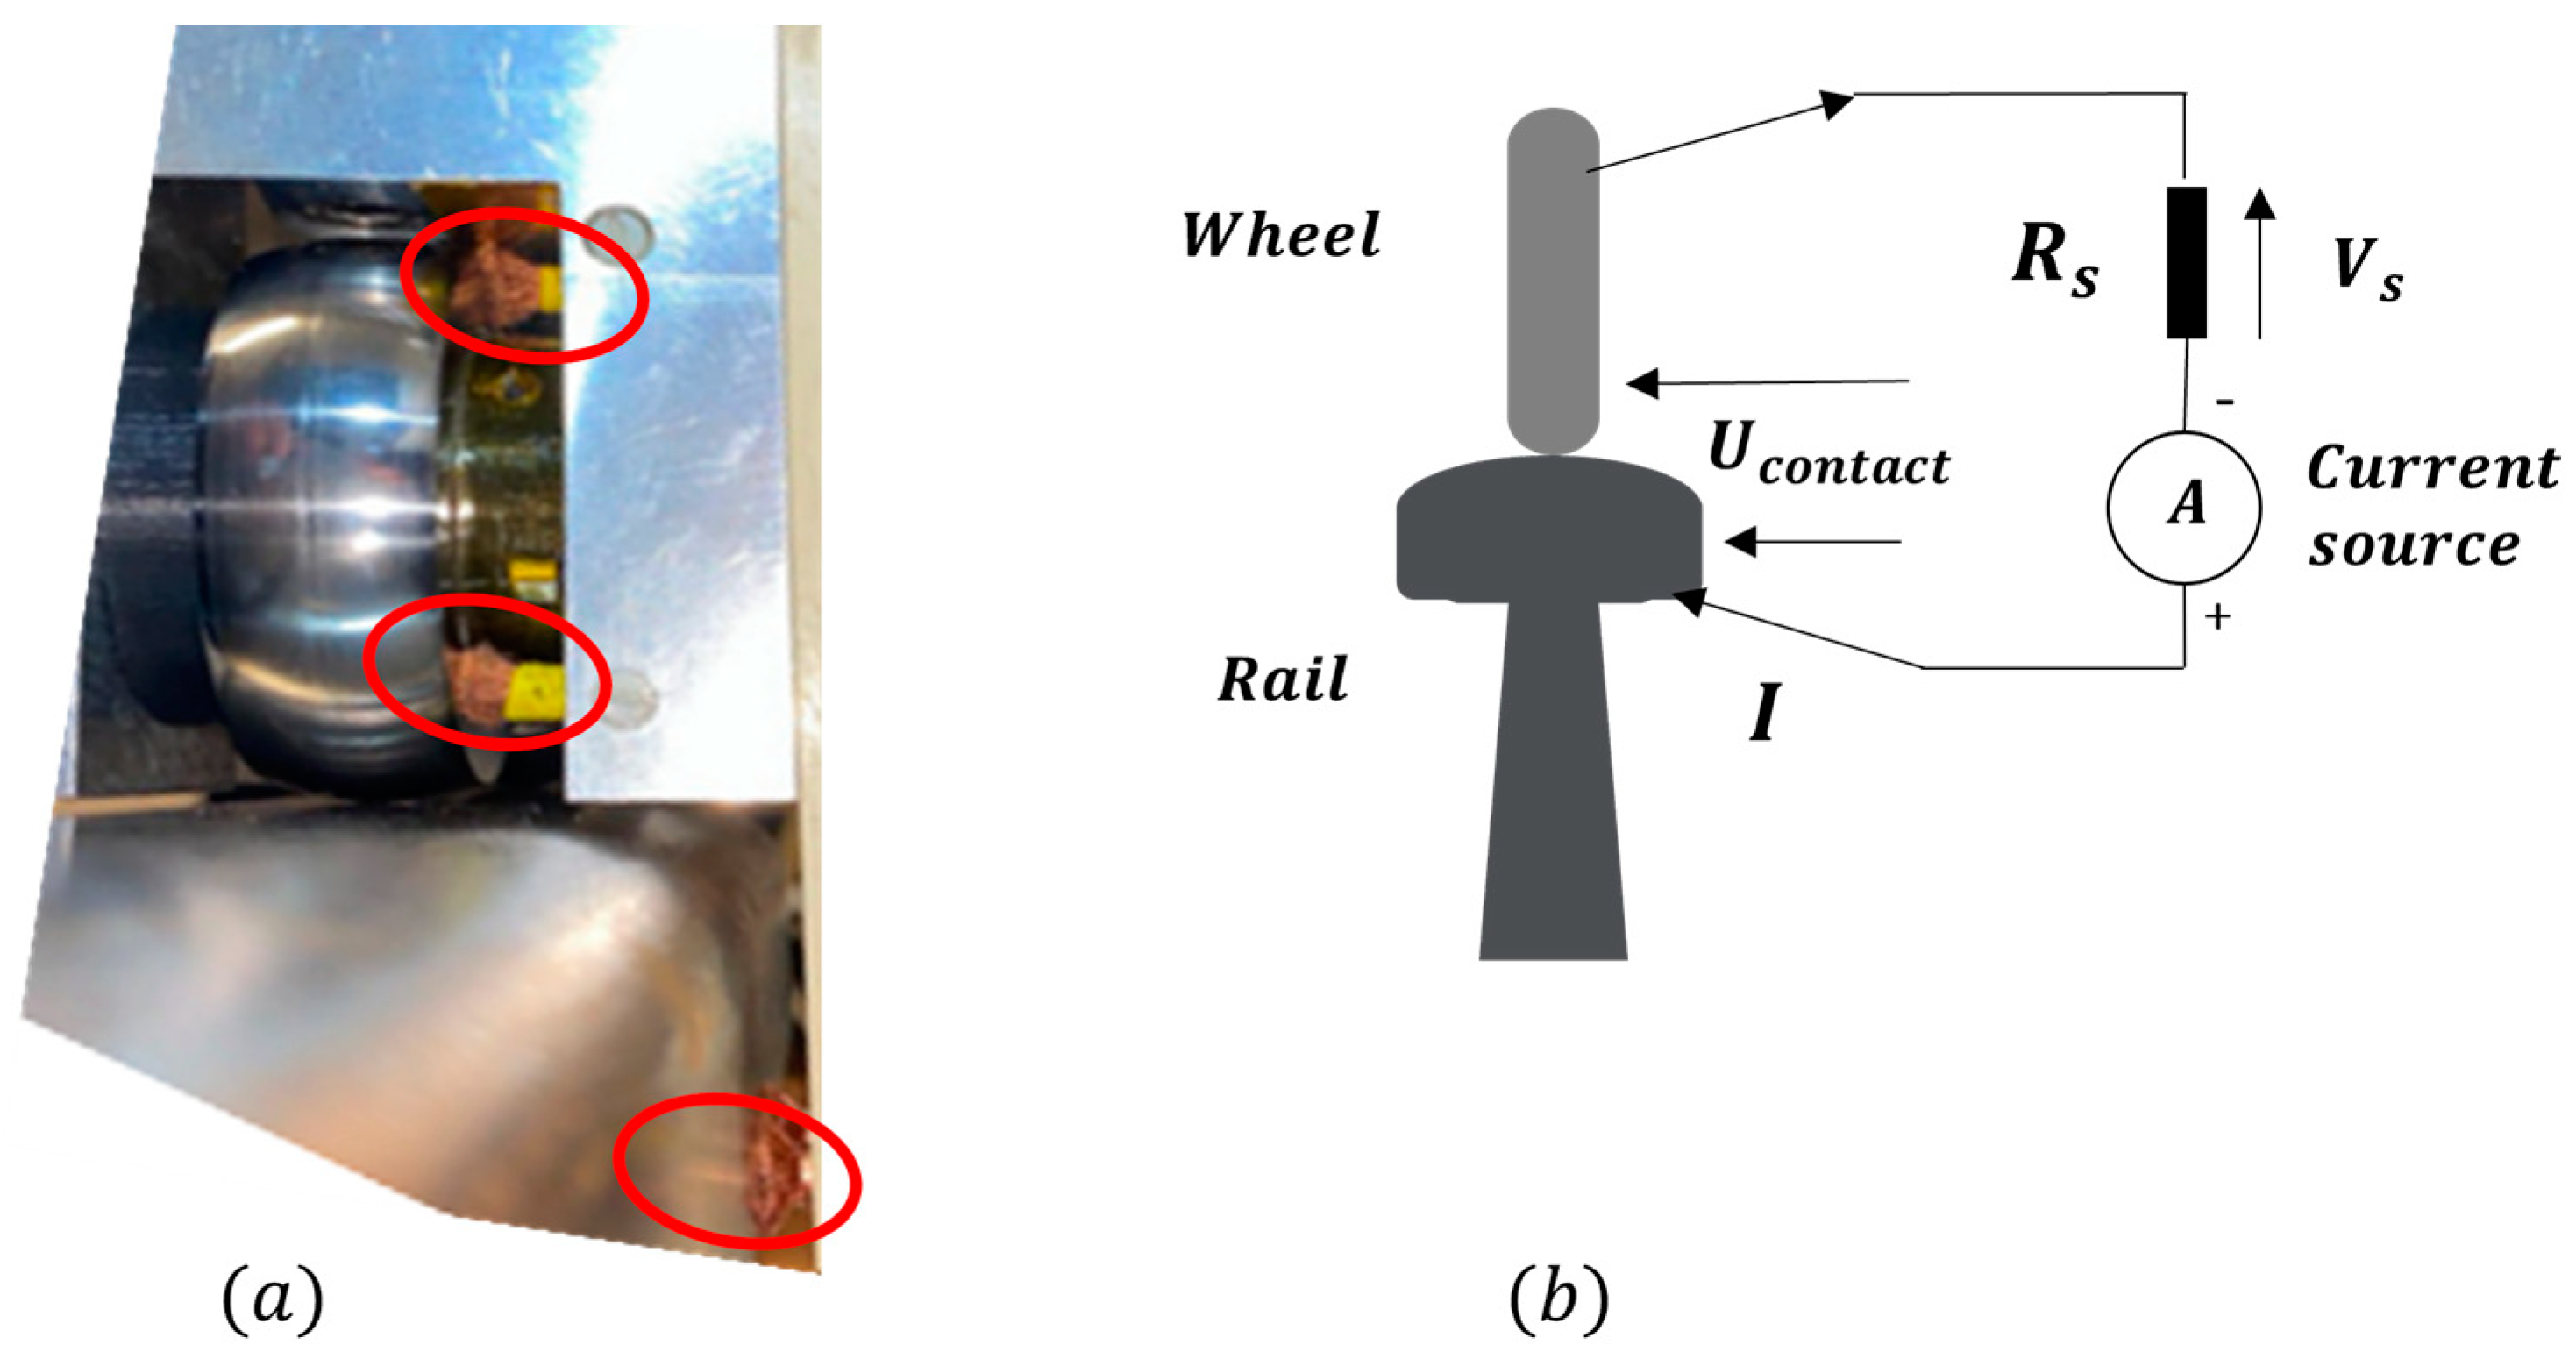
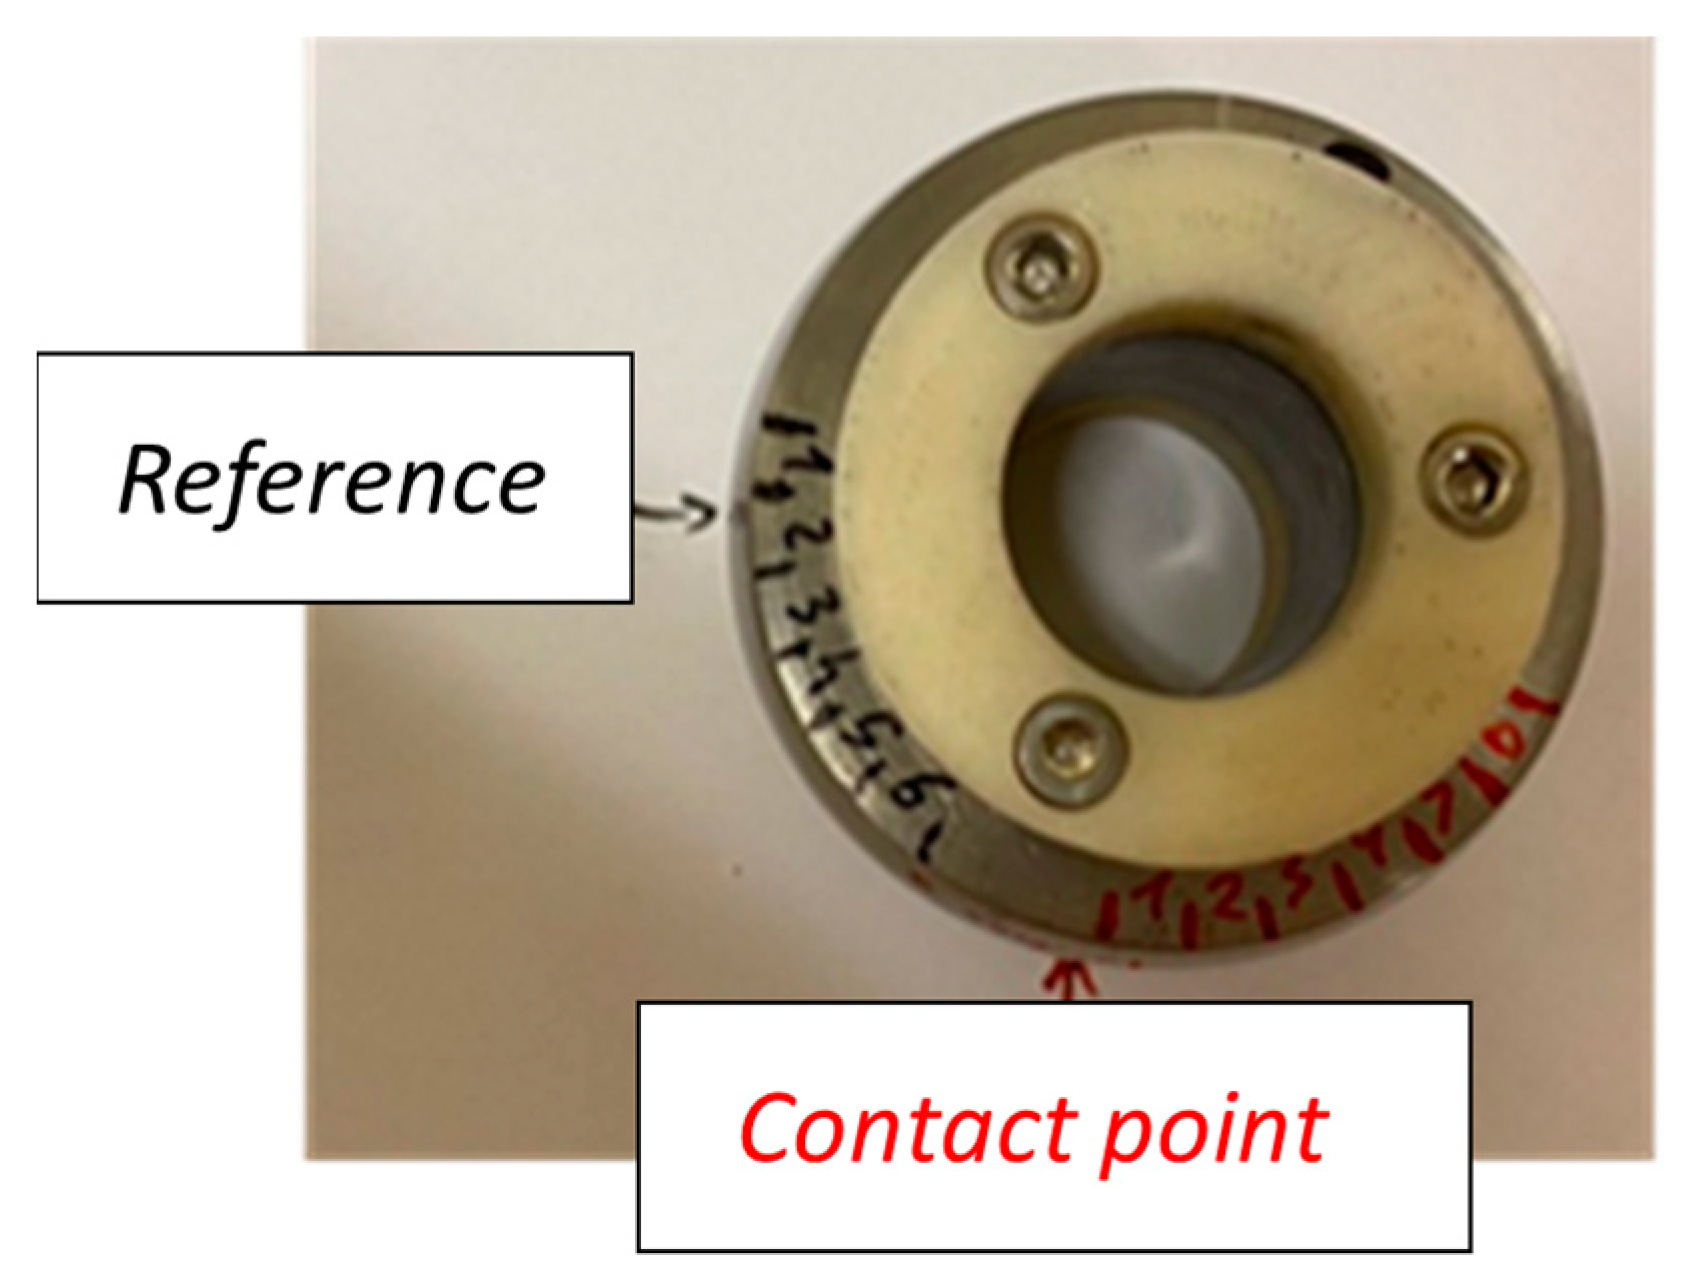
2.3. Four-Point Electrical Measurements
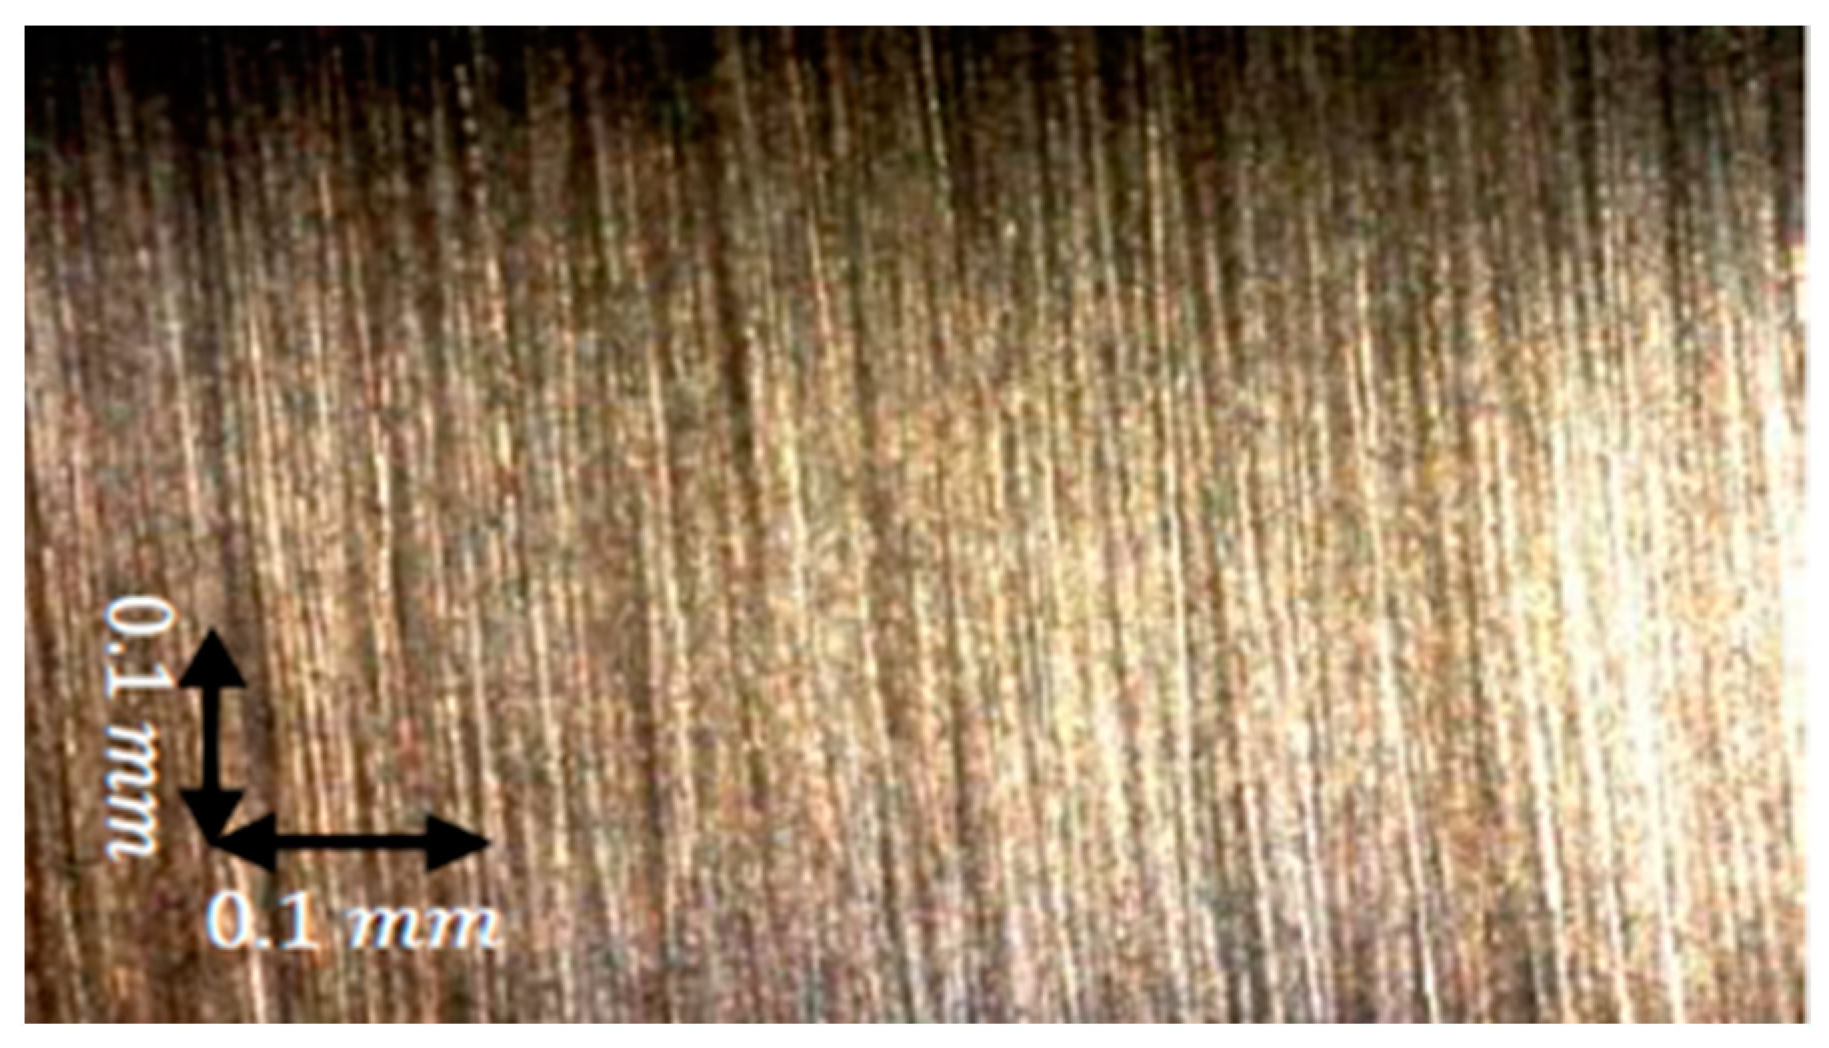
2.4. Surfaces Preparation
2.4.1. Reference Surfaces
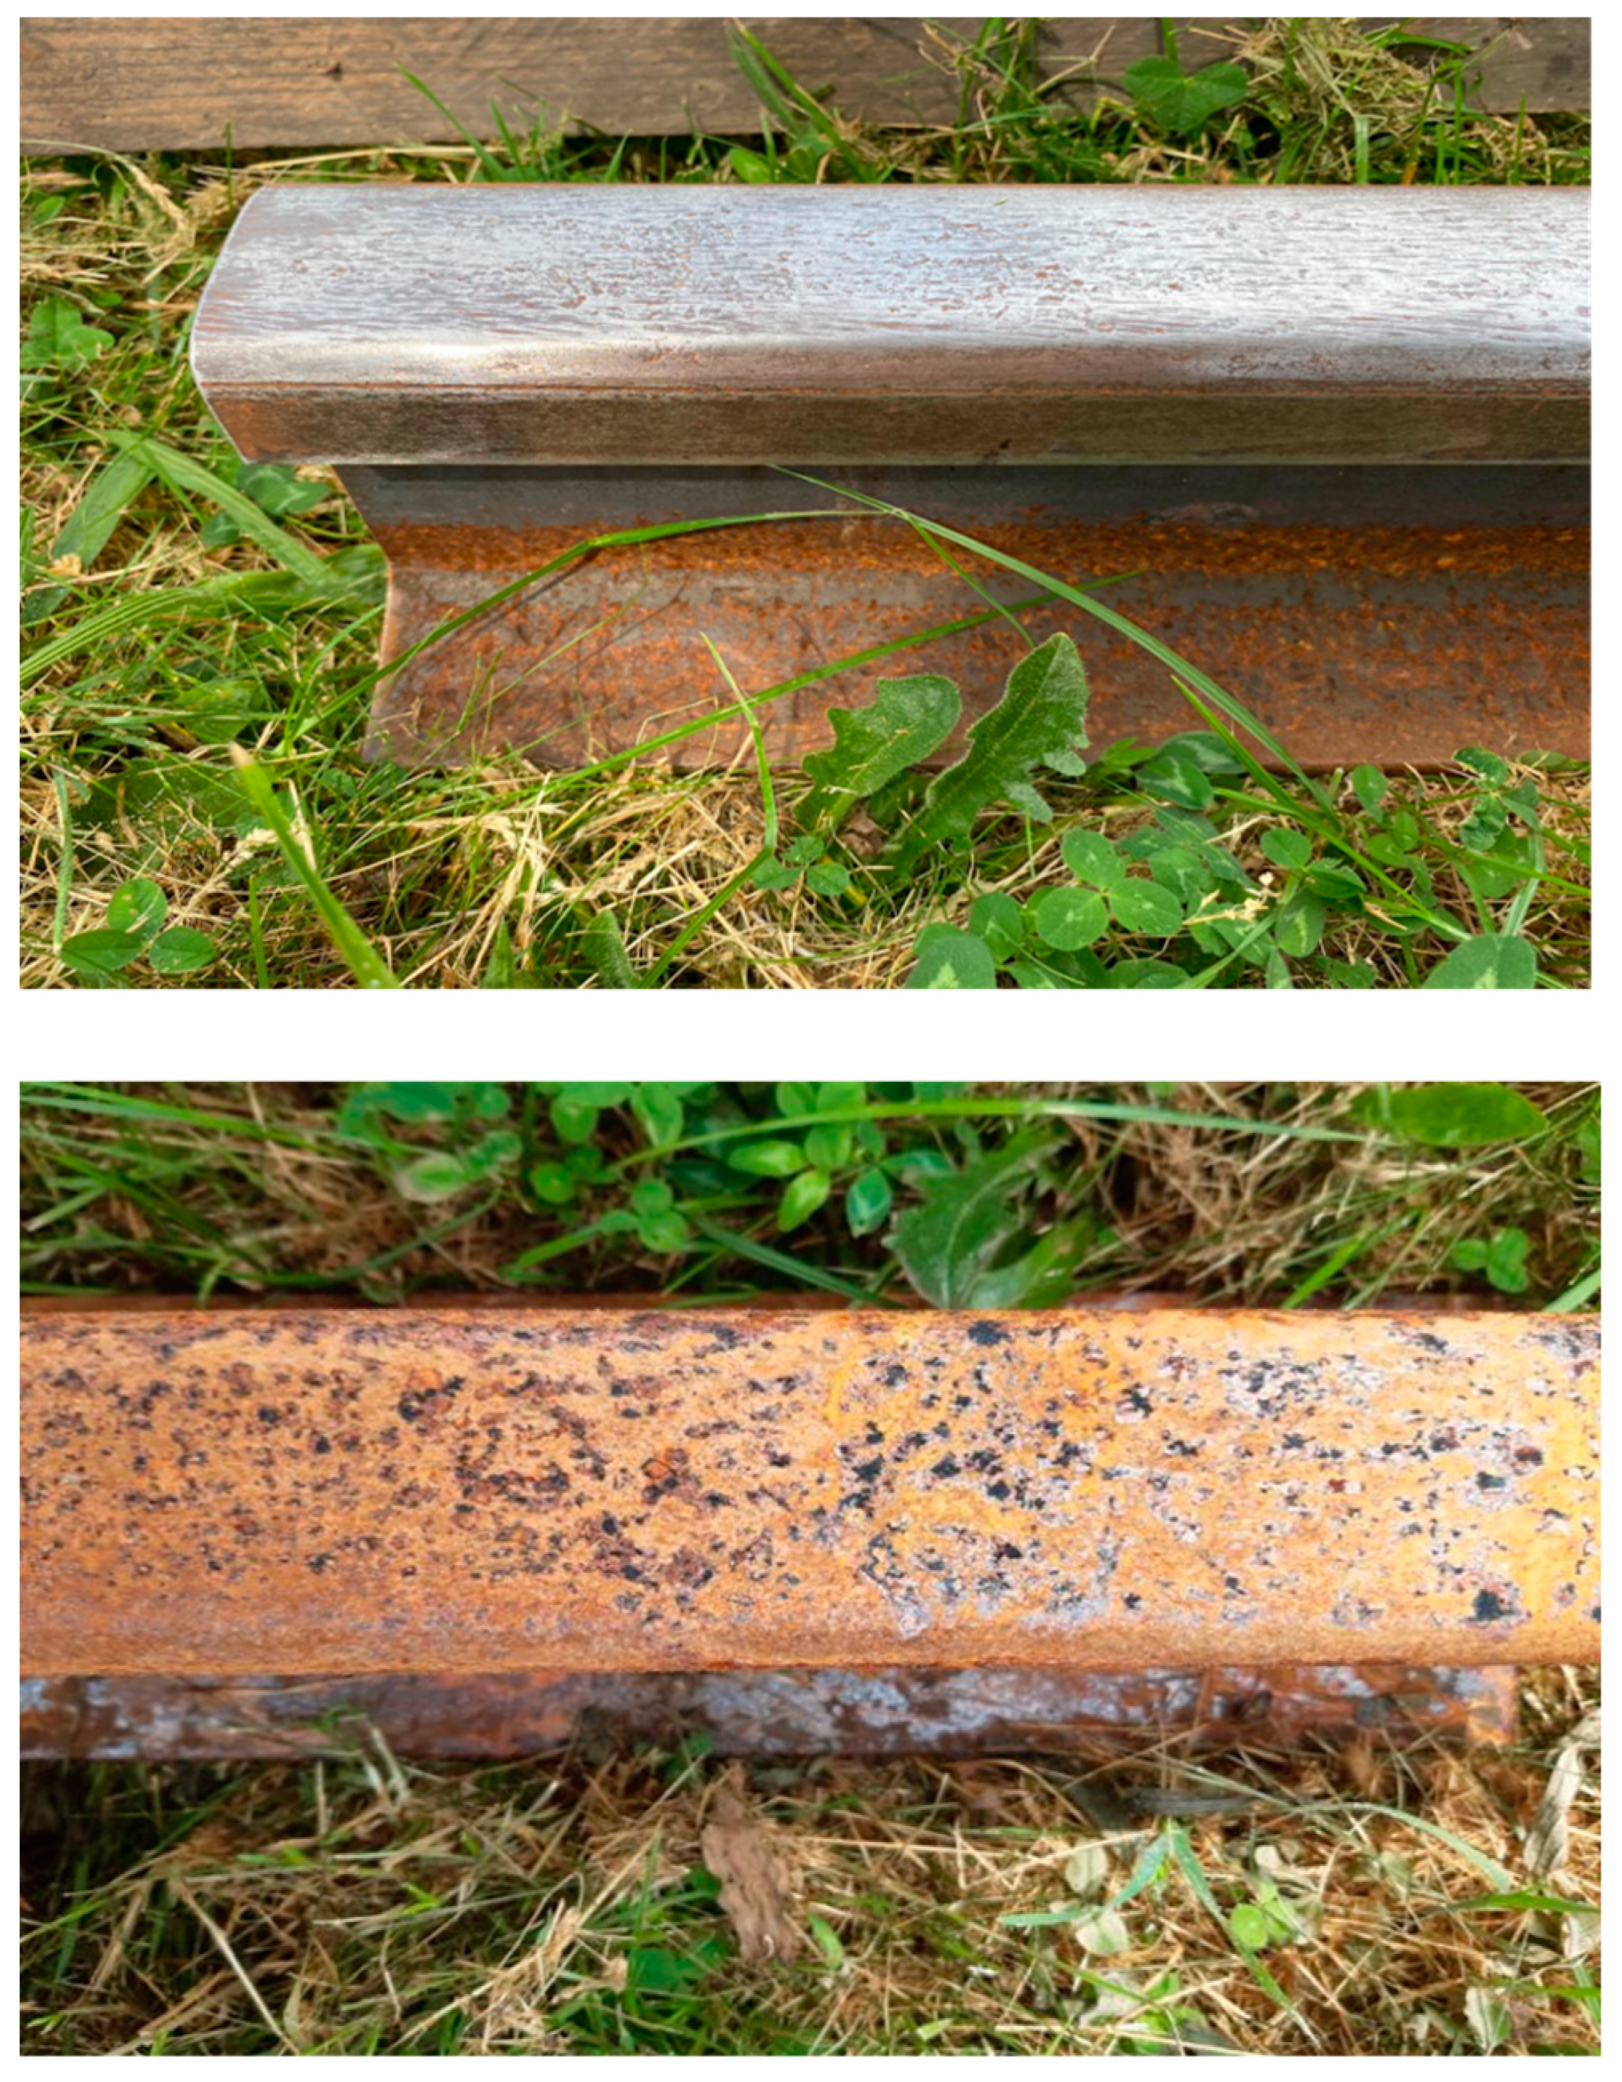
2.4.2. Oxidation Protocol
3. Results
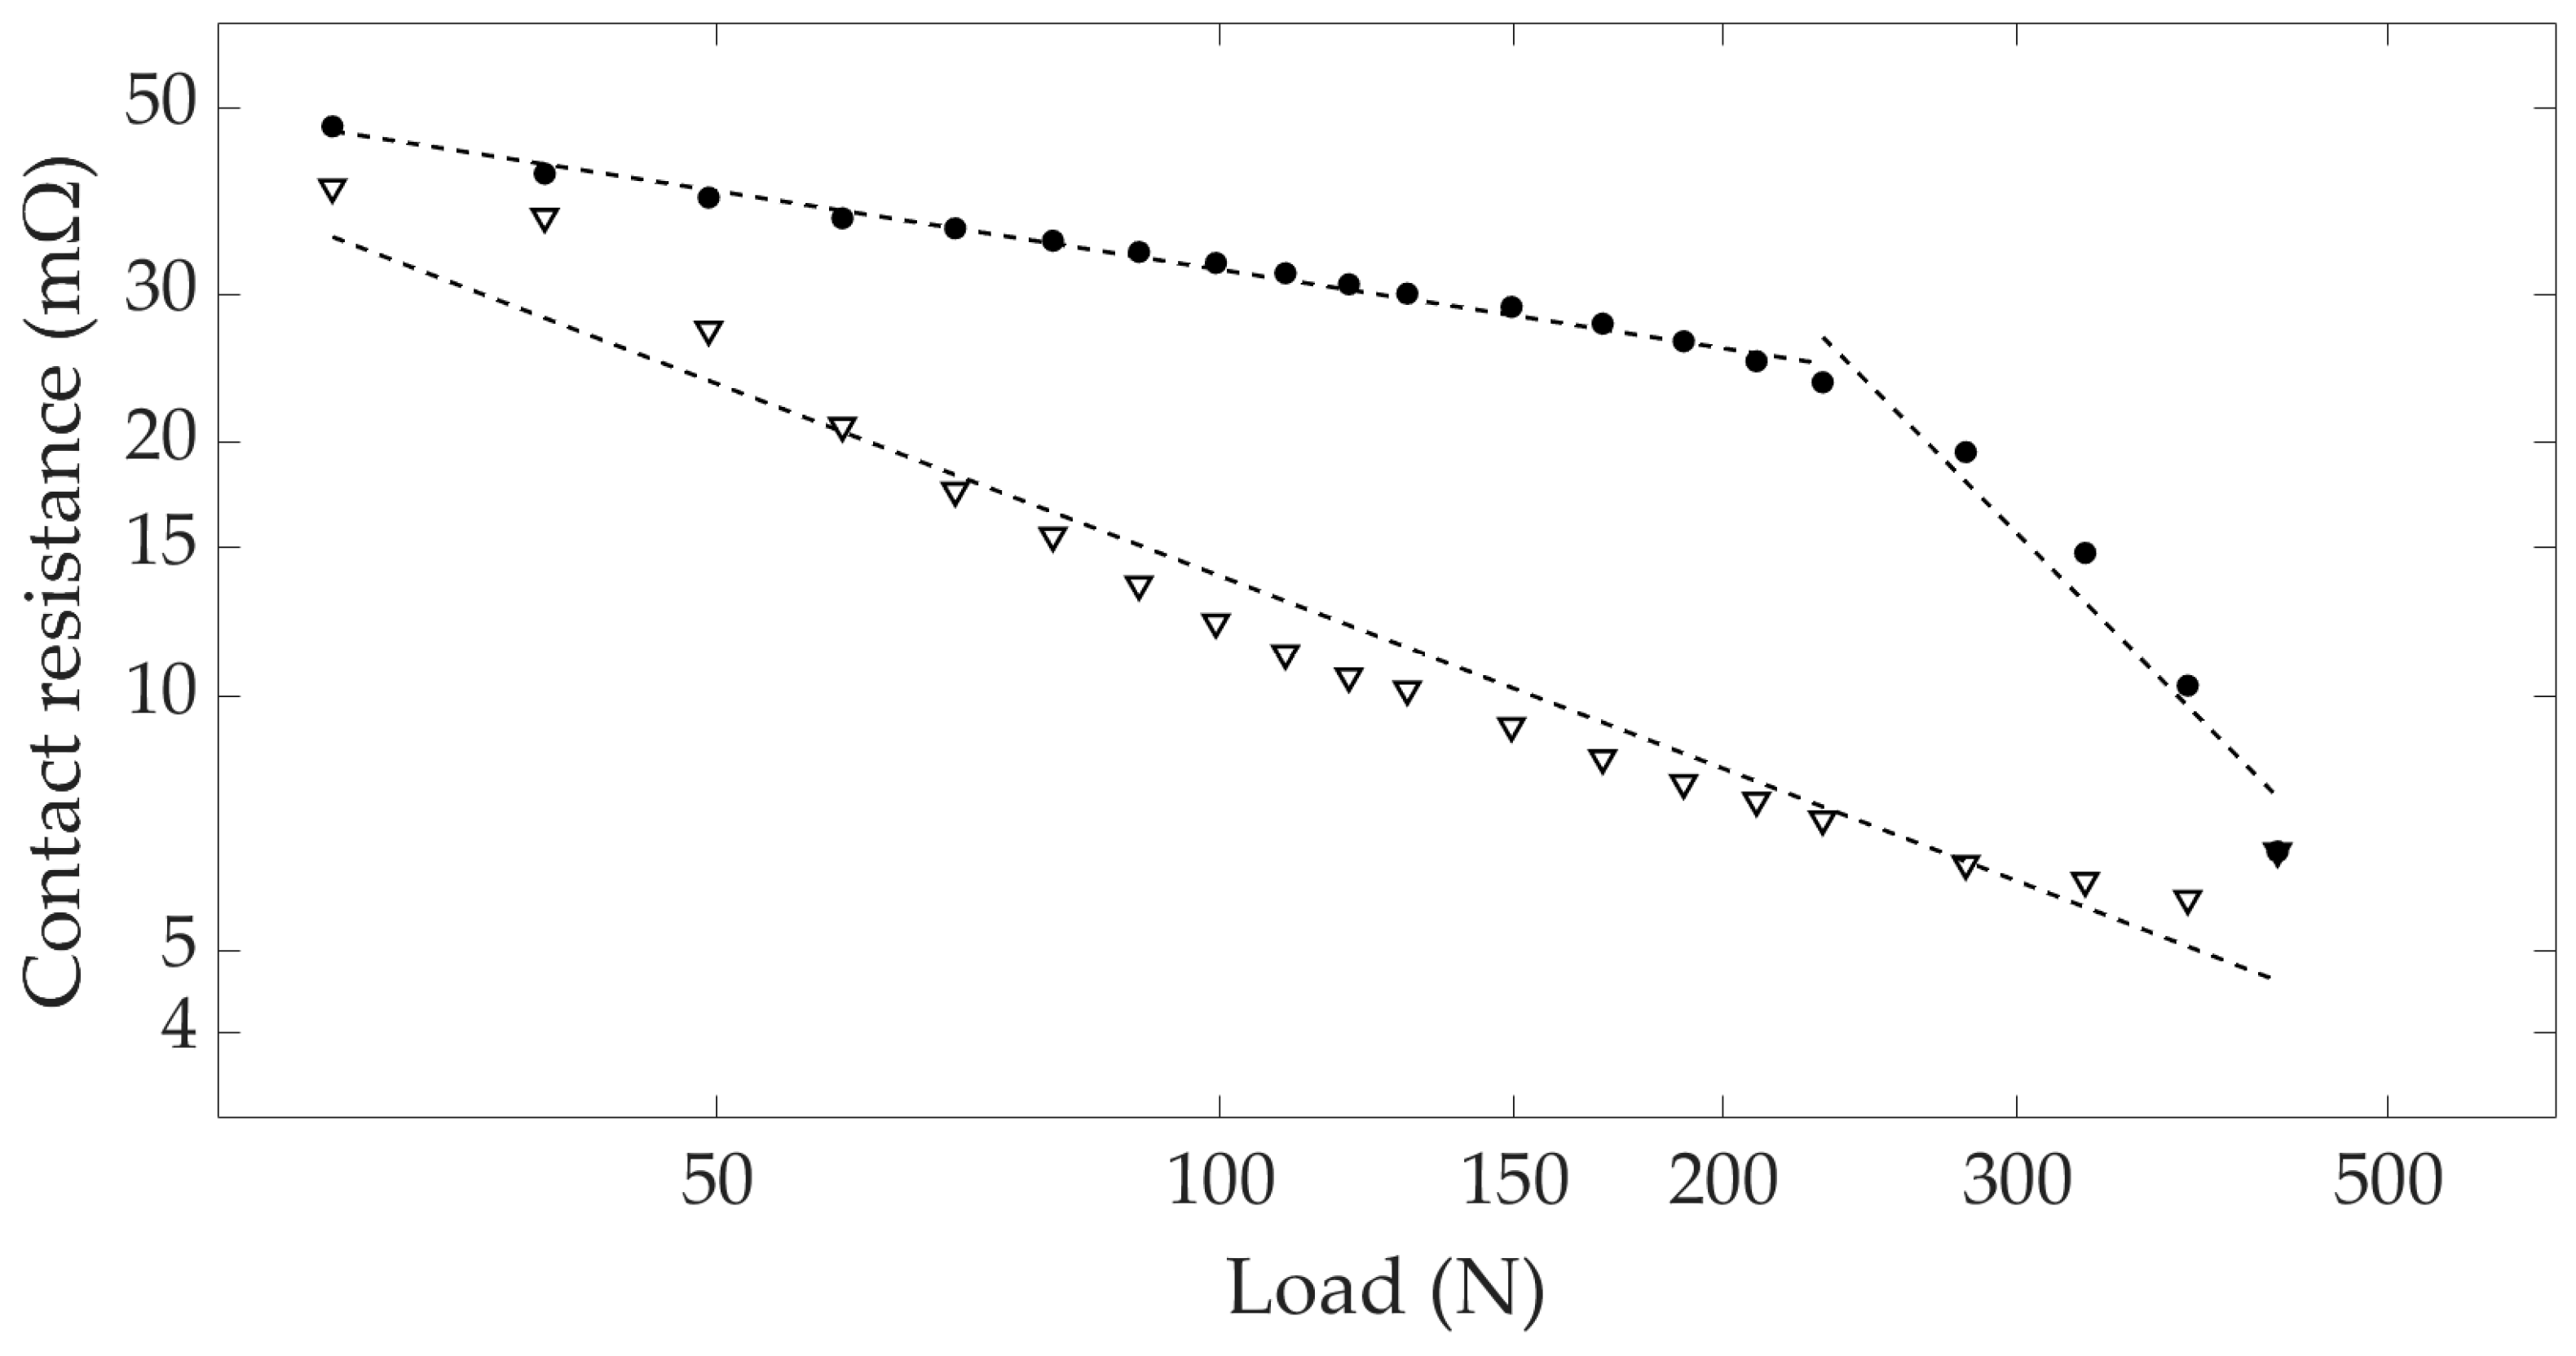
3.1. Dependence of the Resistance on the Applied Force
3.2. Dependence of the Resistance on the Applied Current
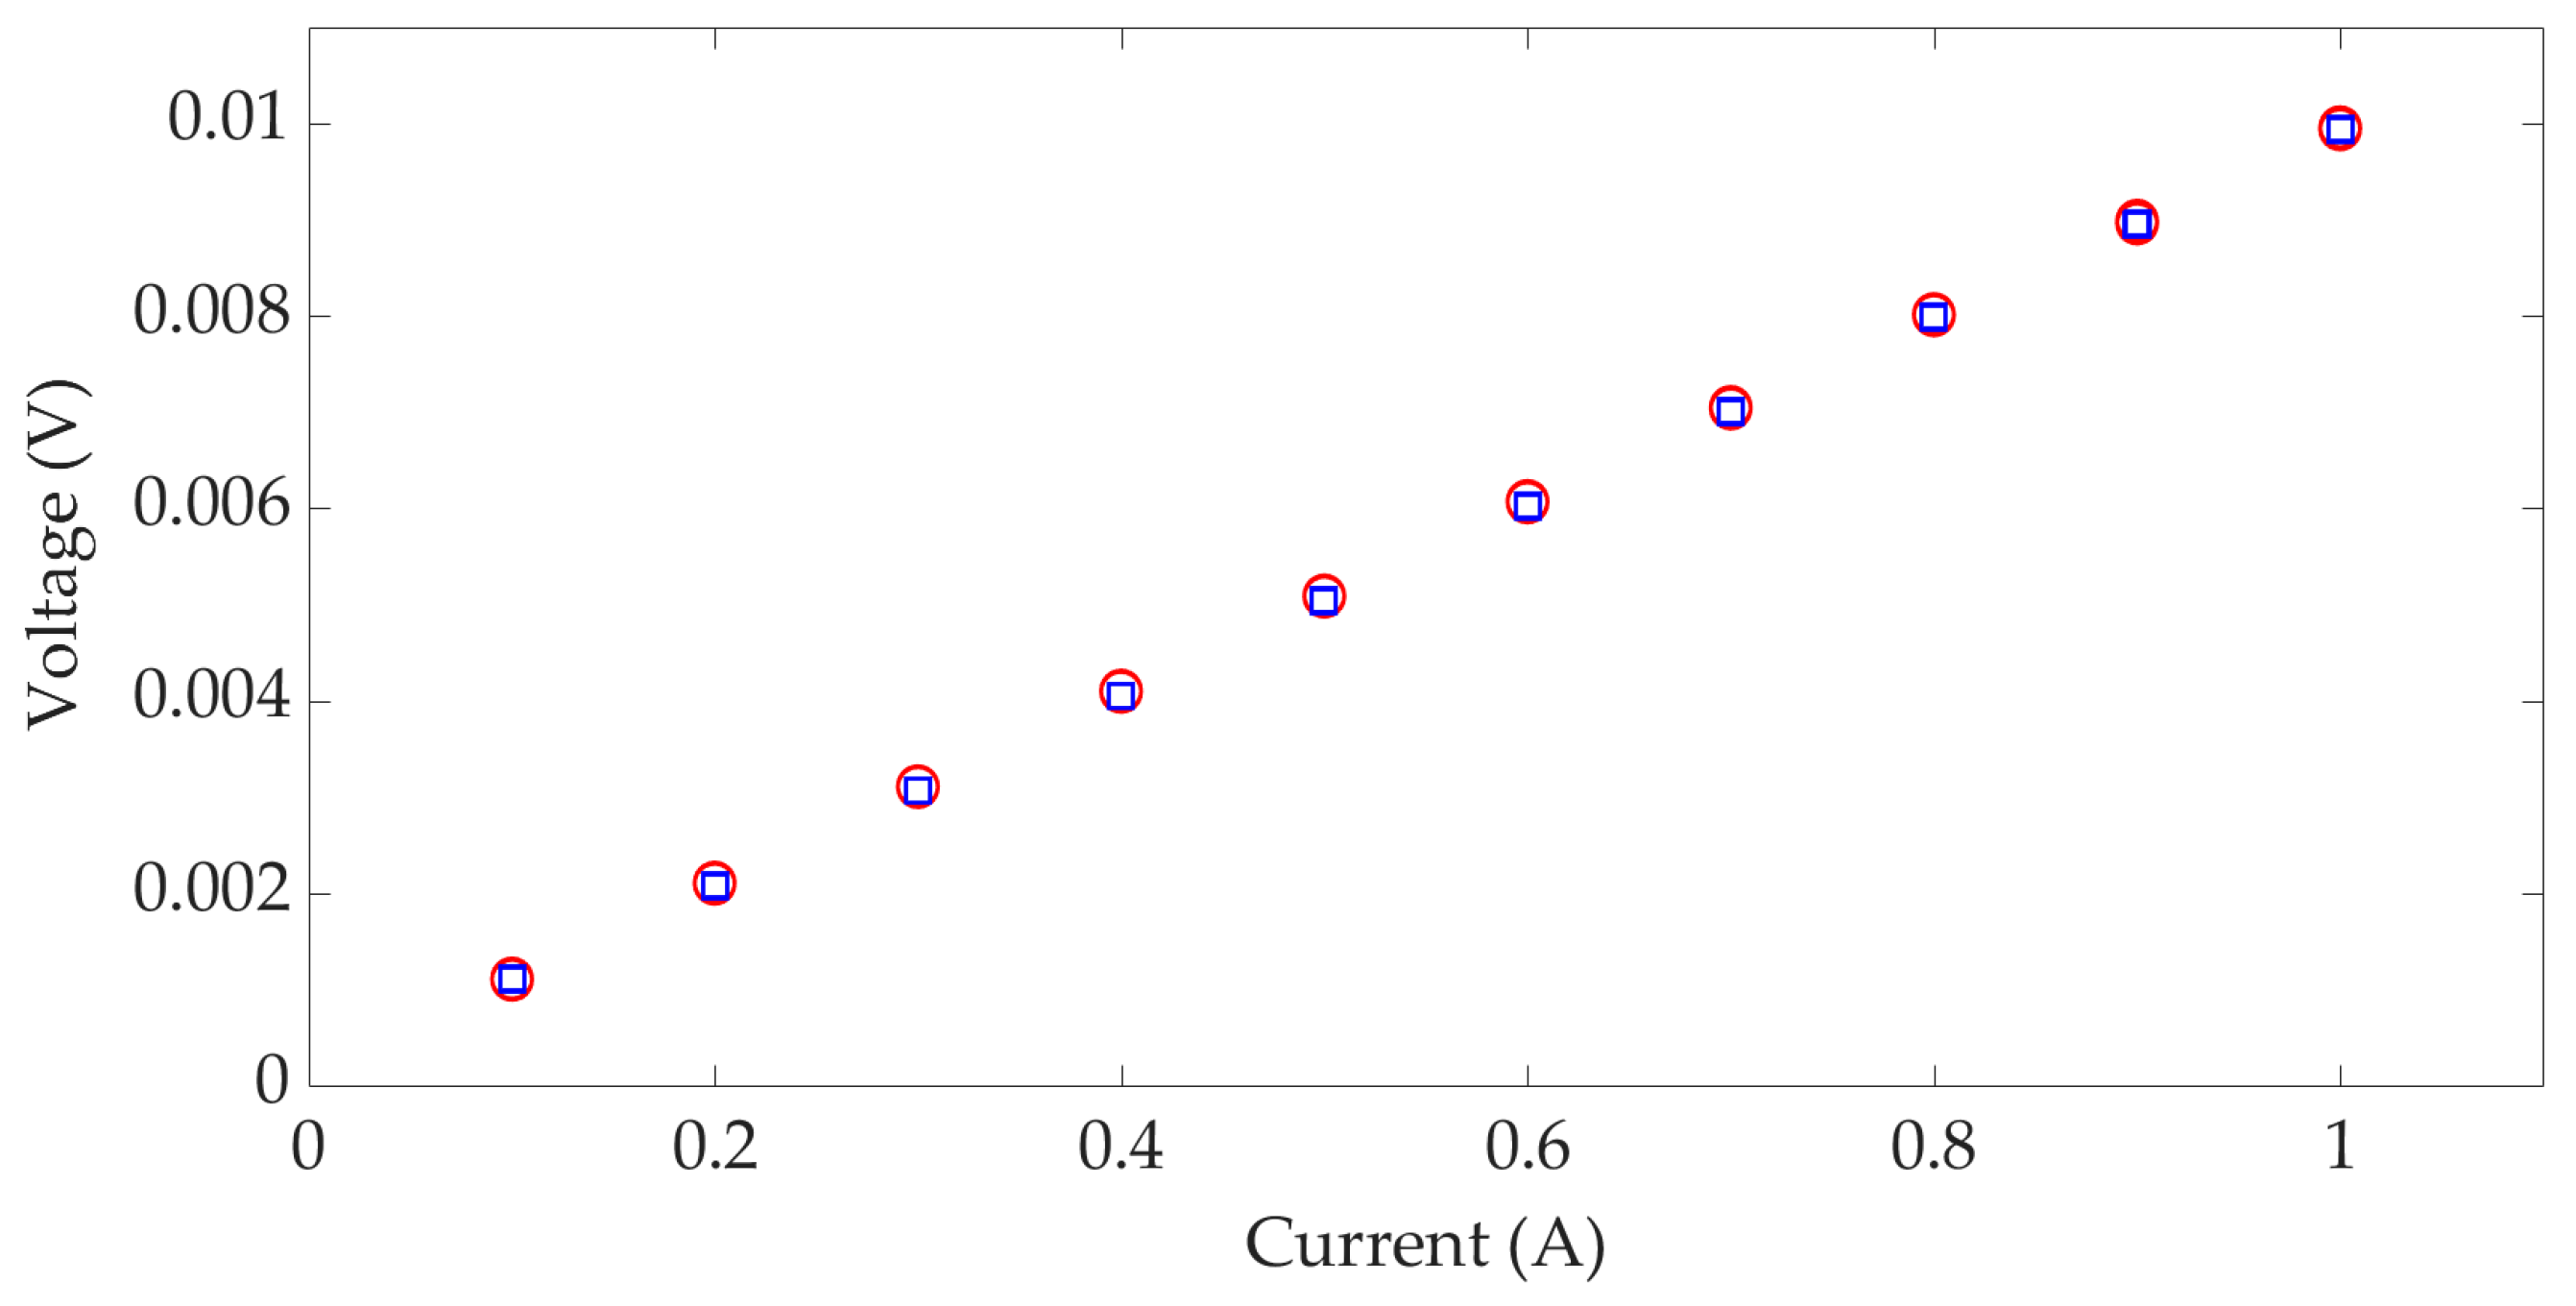
3.2.1. Clean Contact:
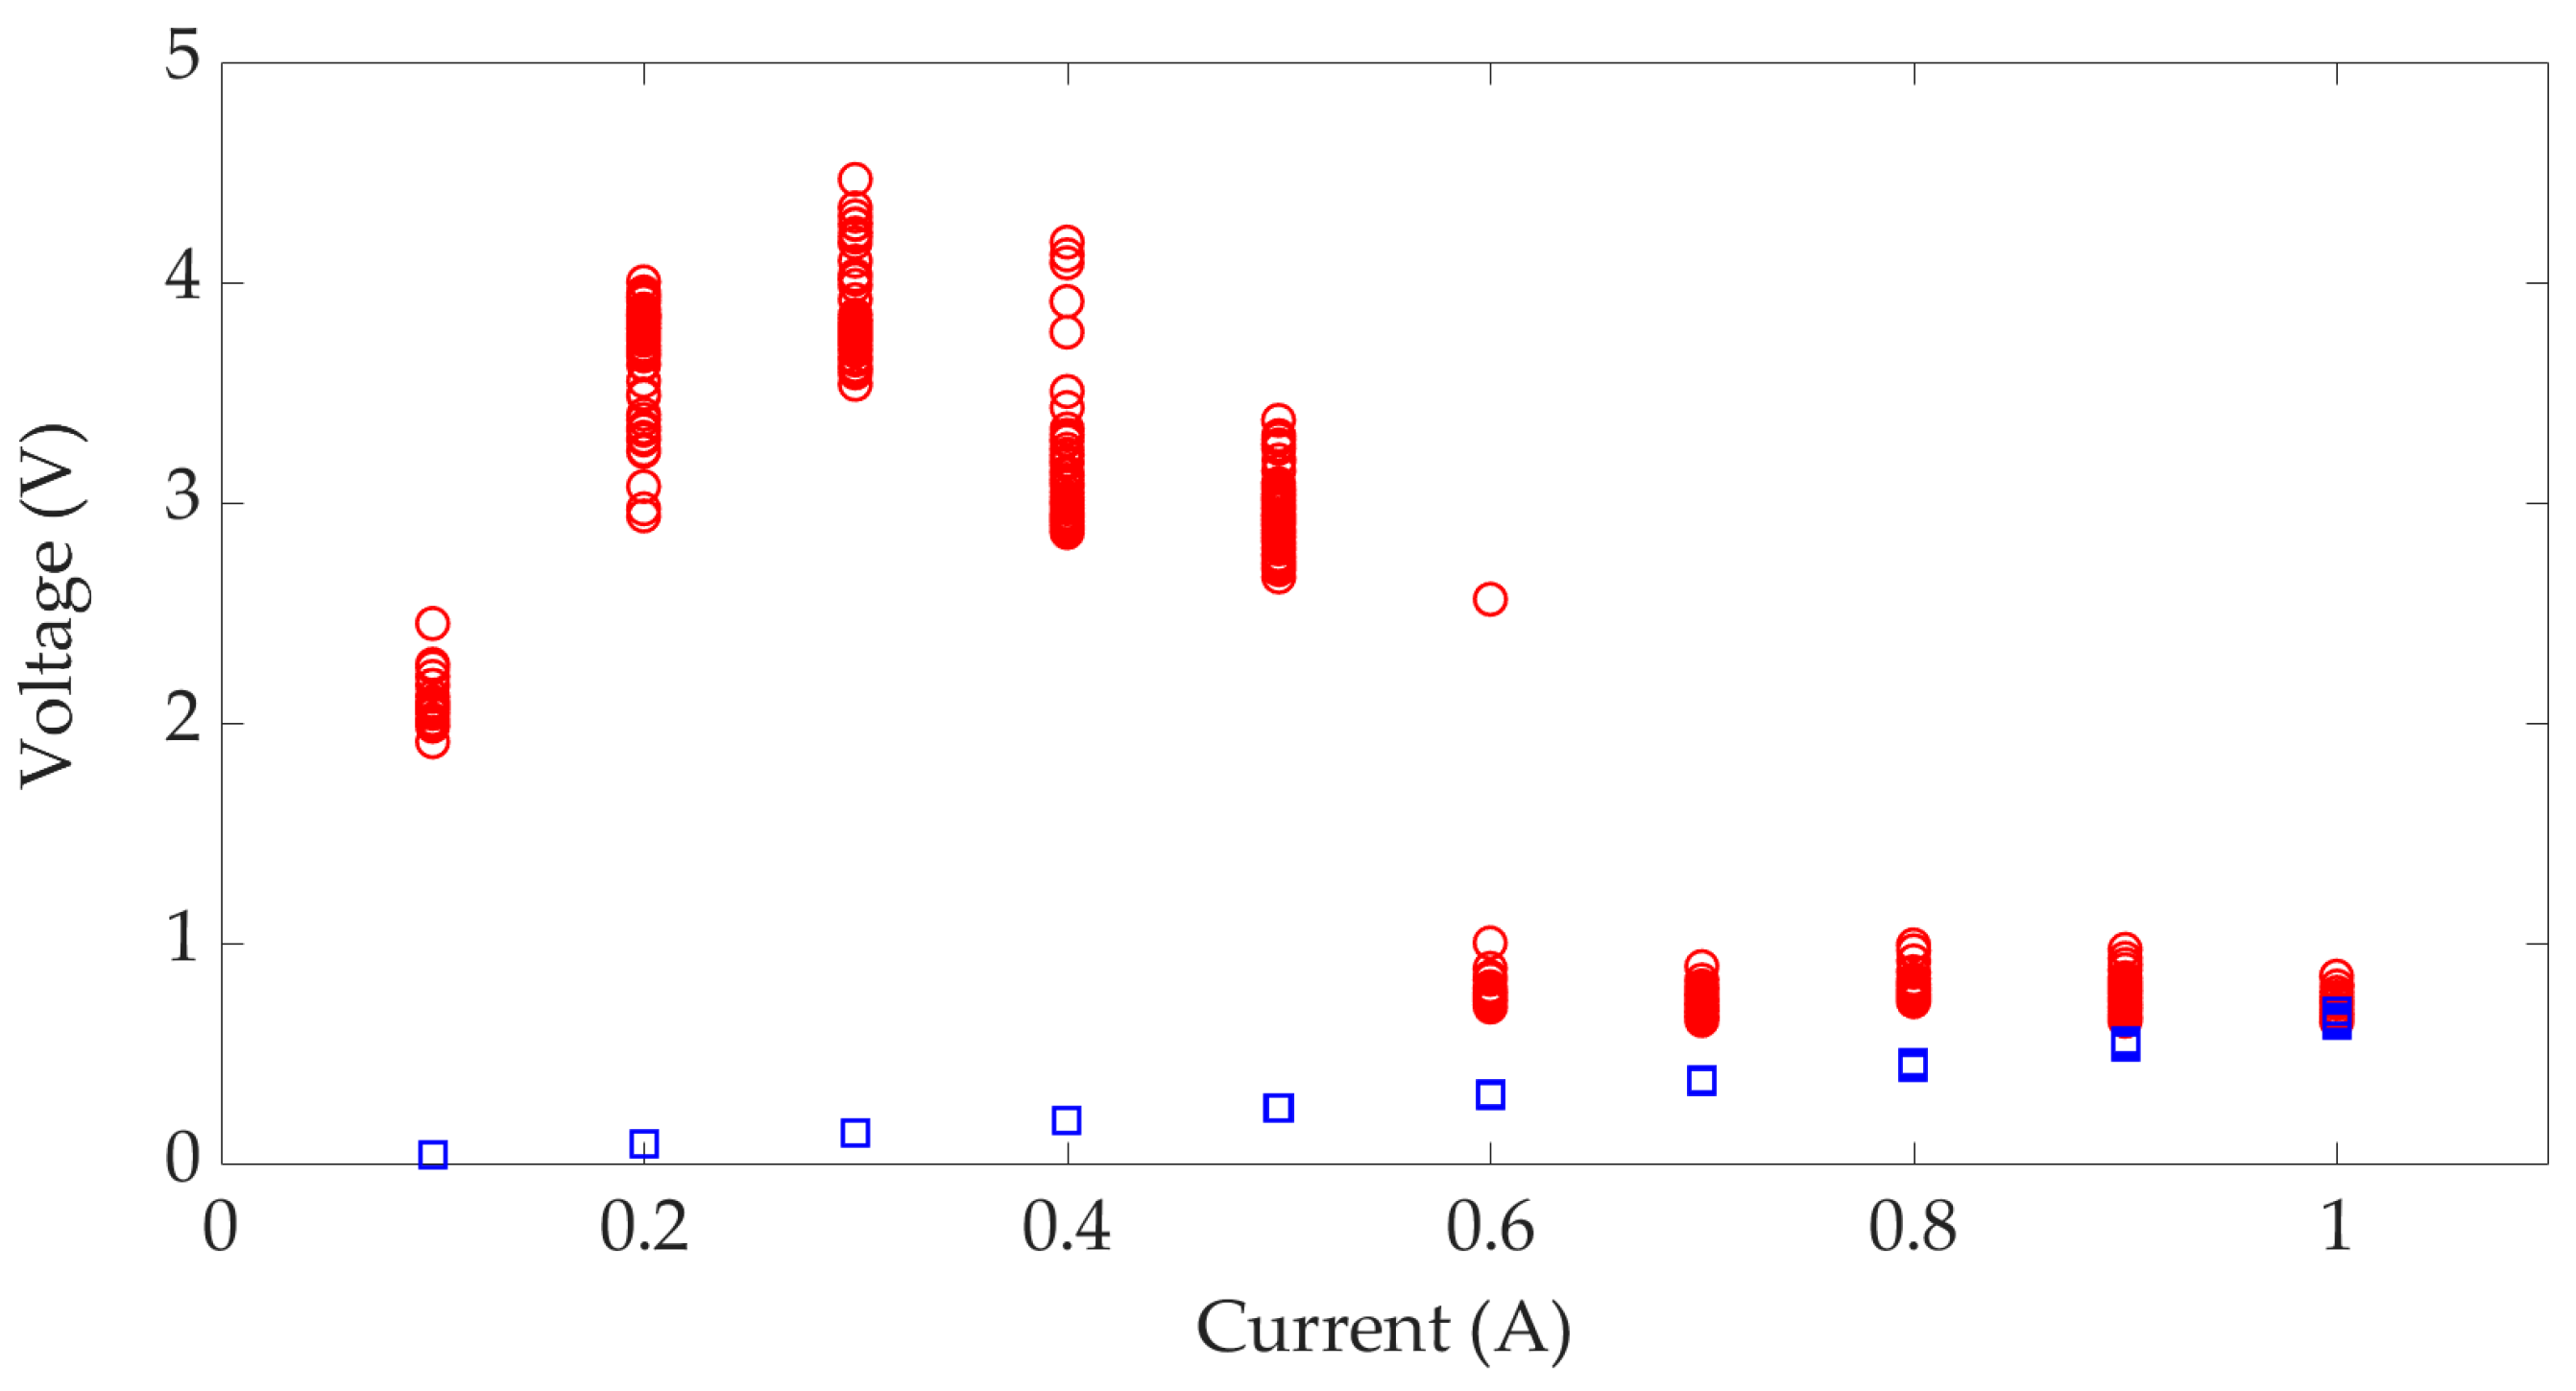
3.2.2. Oxidized Contact:
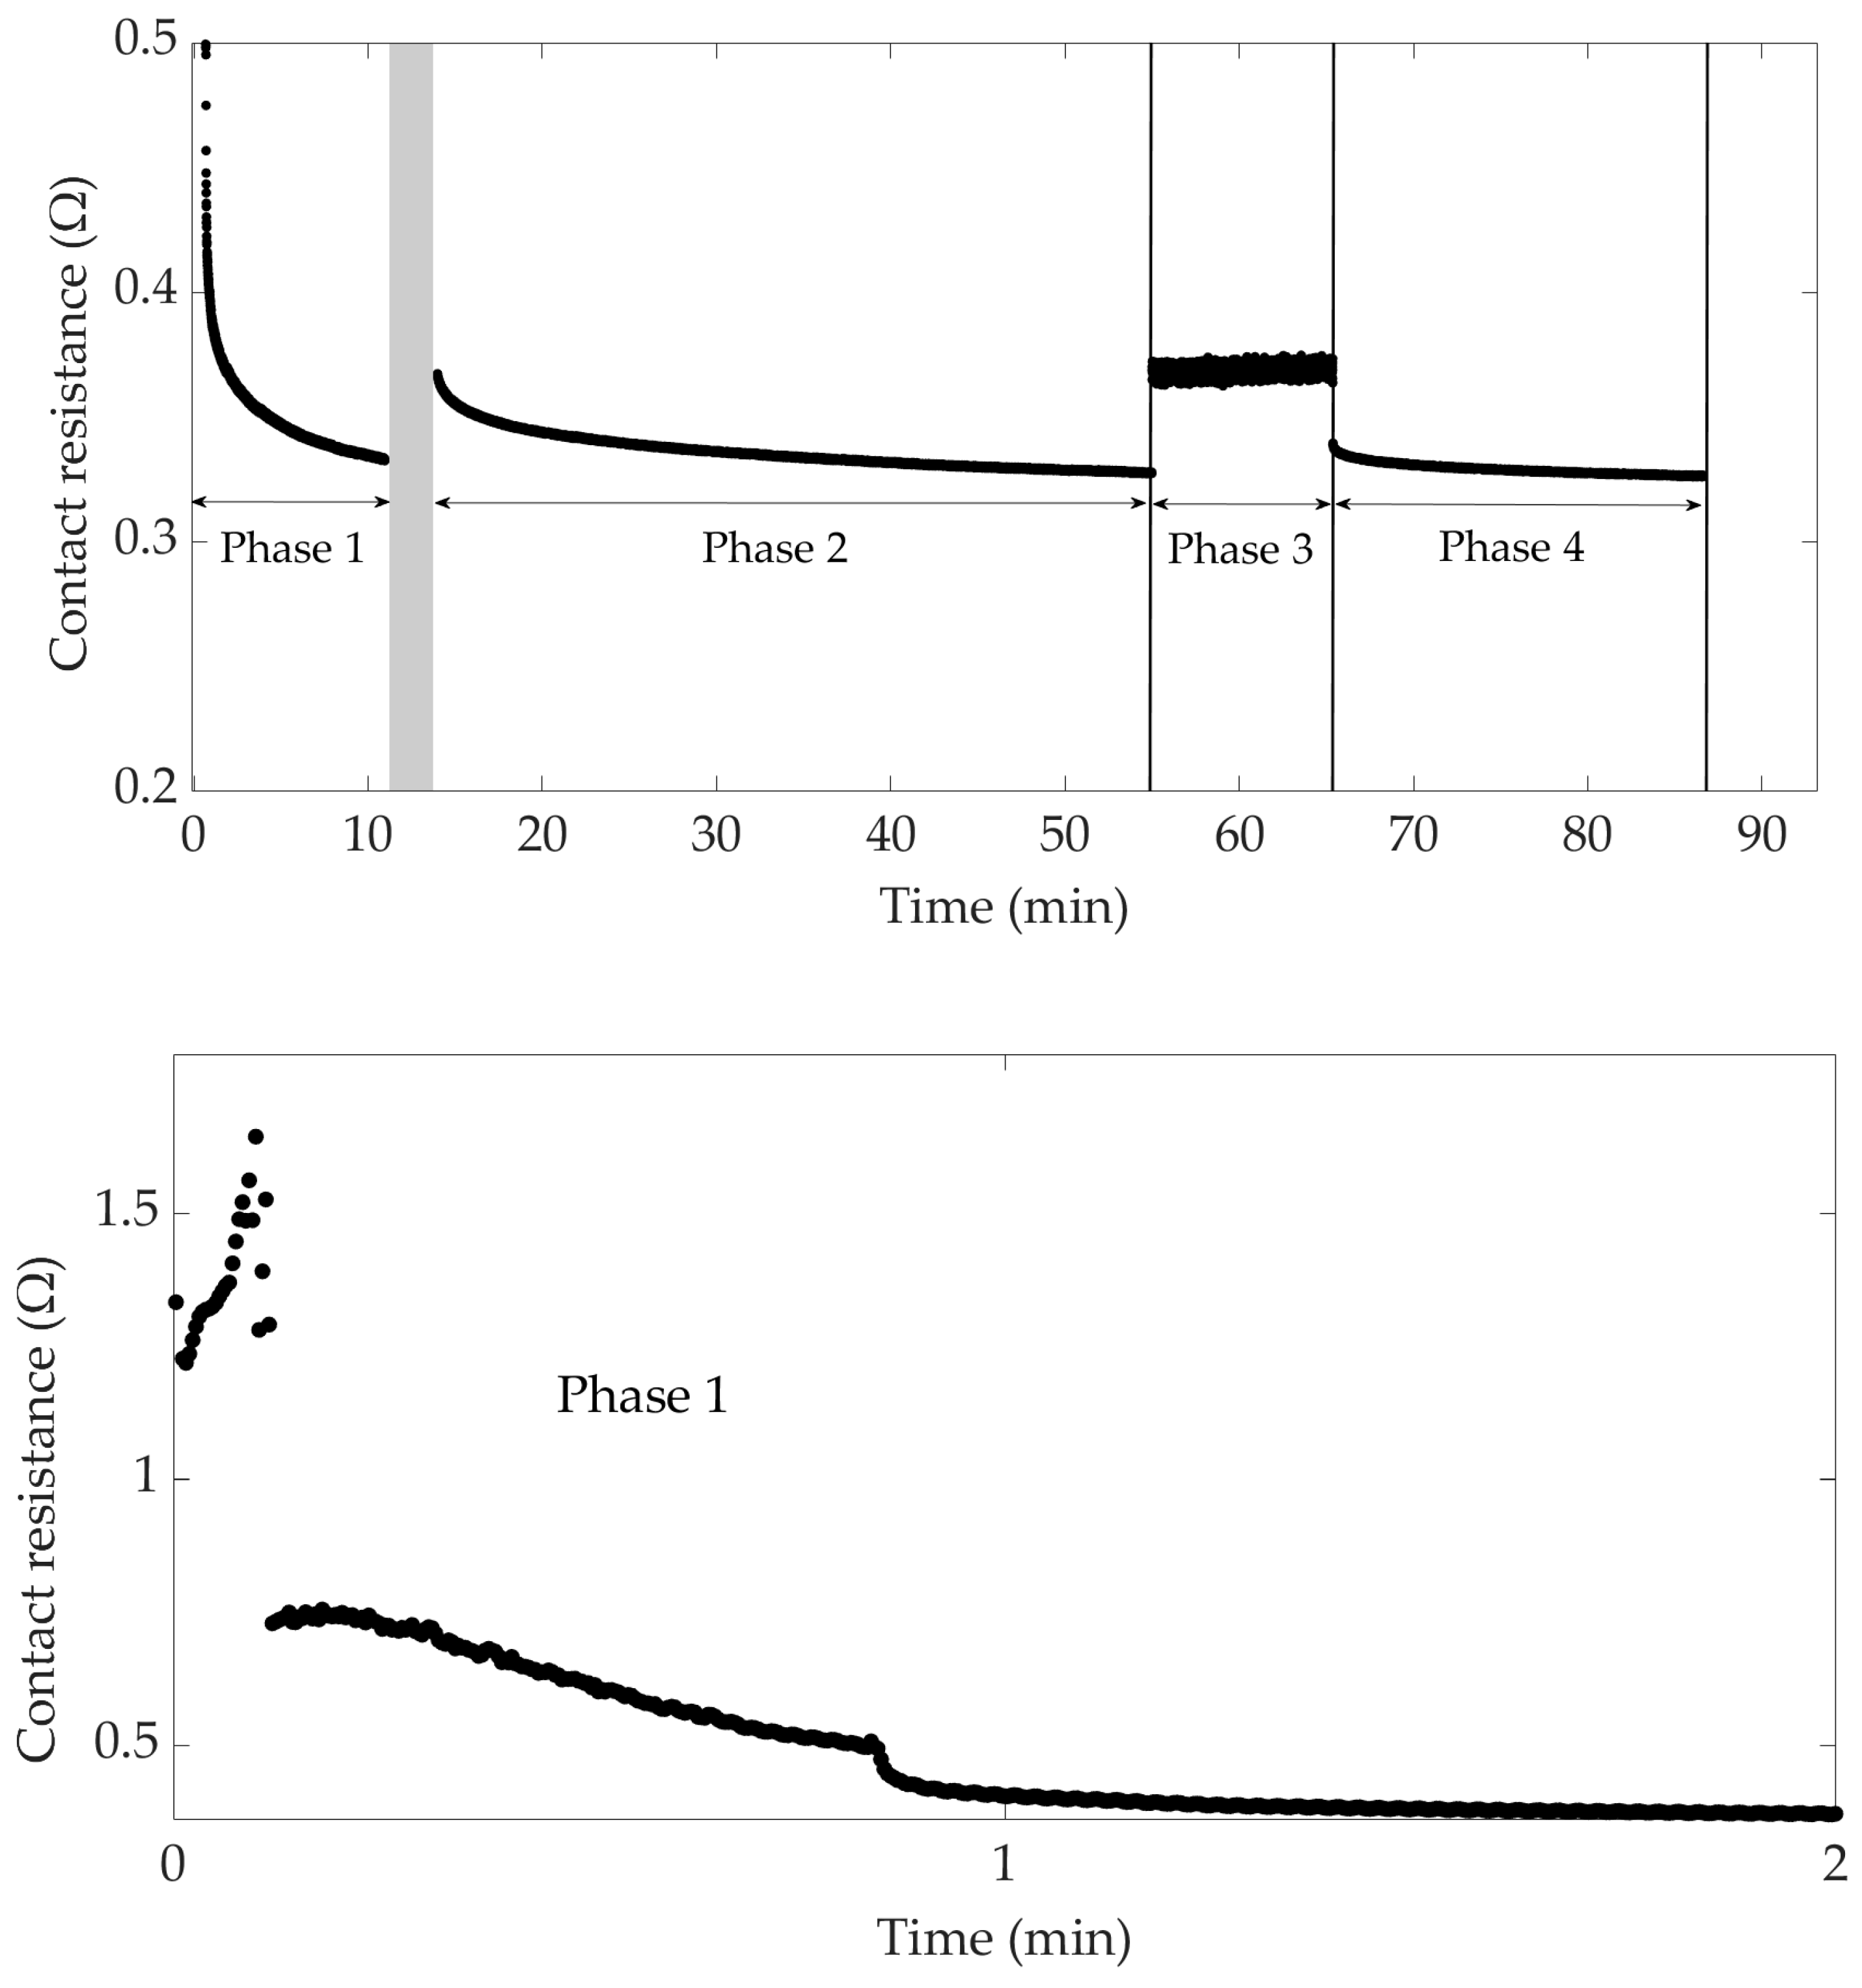
3.3. Evolution of the Contact Resistance at Constant Current over a Long Period
- Phase 1: applied for 10 min. The current injection and the measurements were interrupted for a few minutes to see if the contact would return to its initial electrical state.
- Phase 2: applied for 40 min.
- Phase 3: applied for 10 min.
- Phase 4: applied for 20 min.
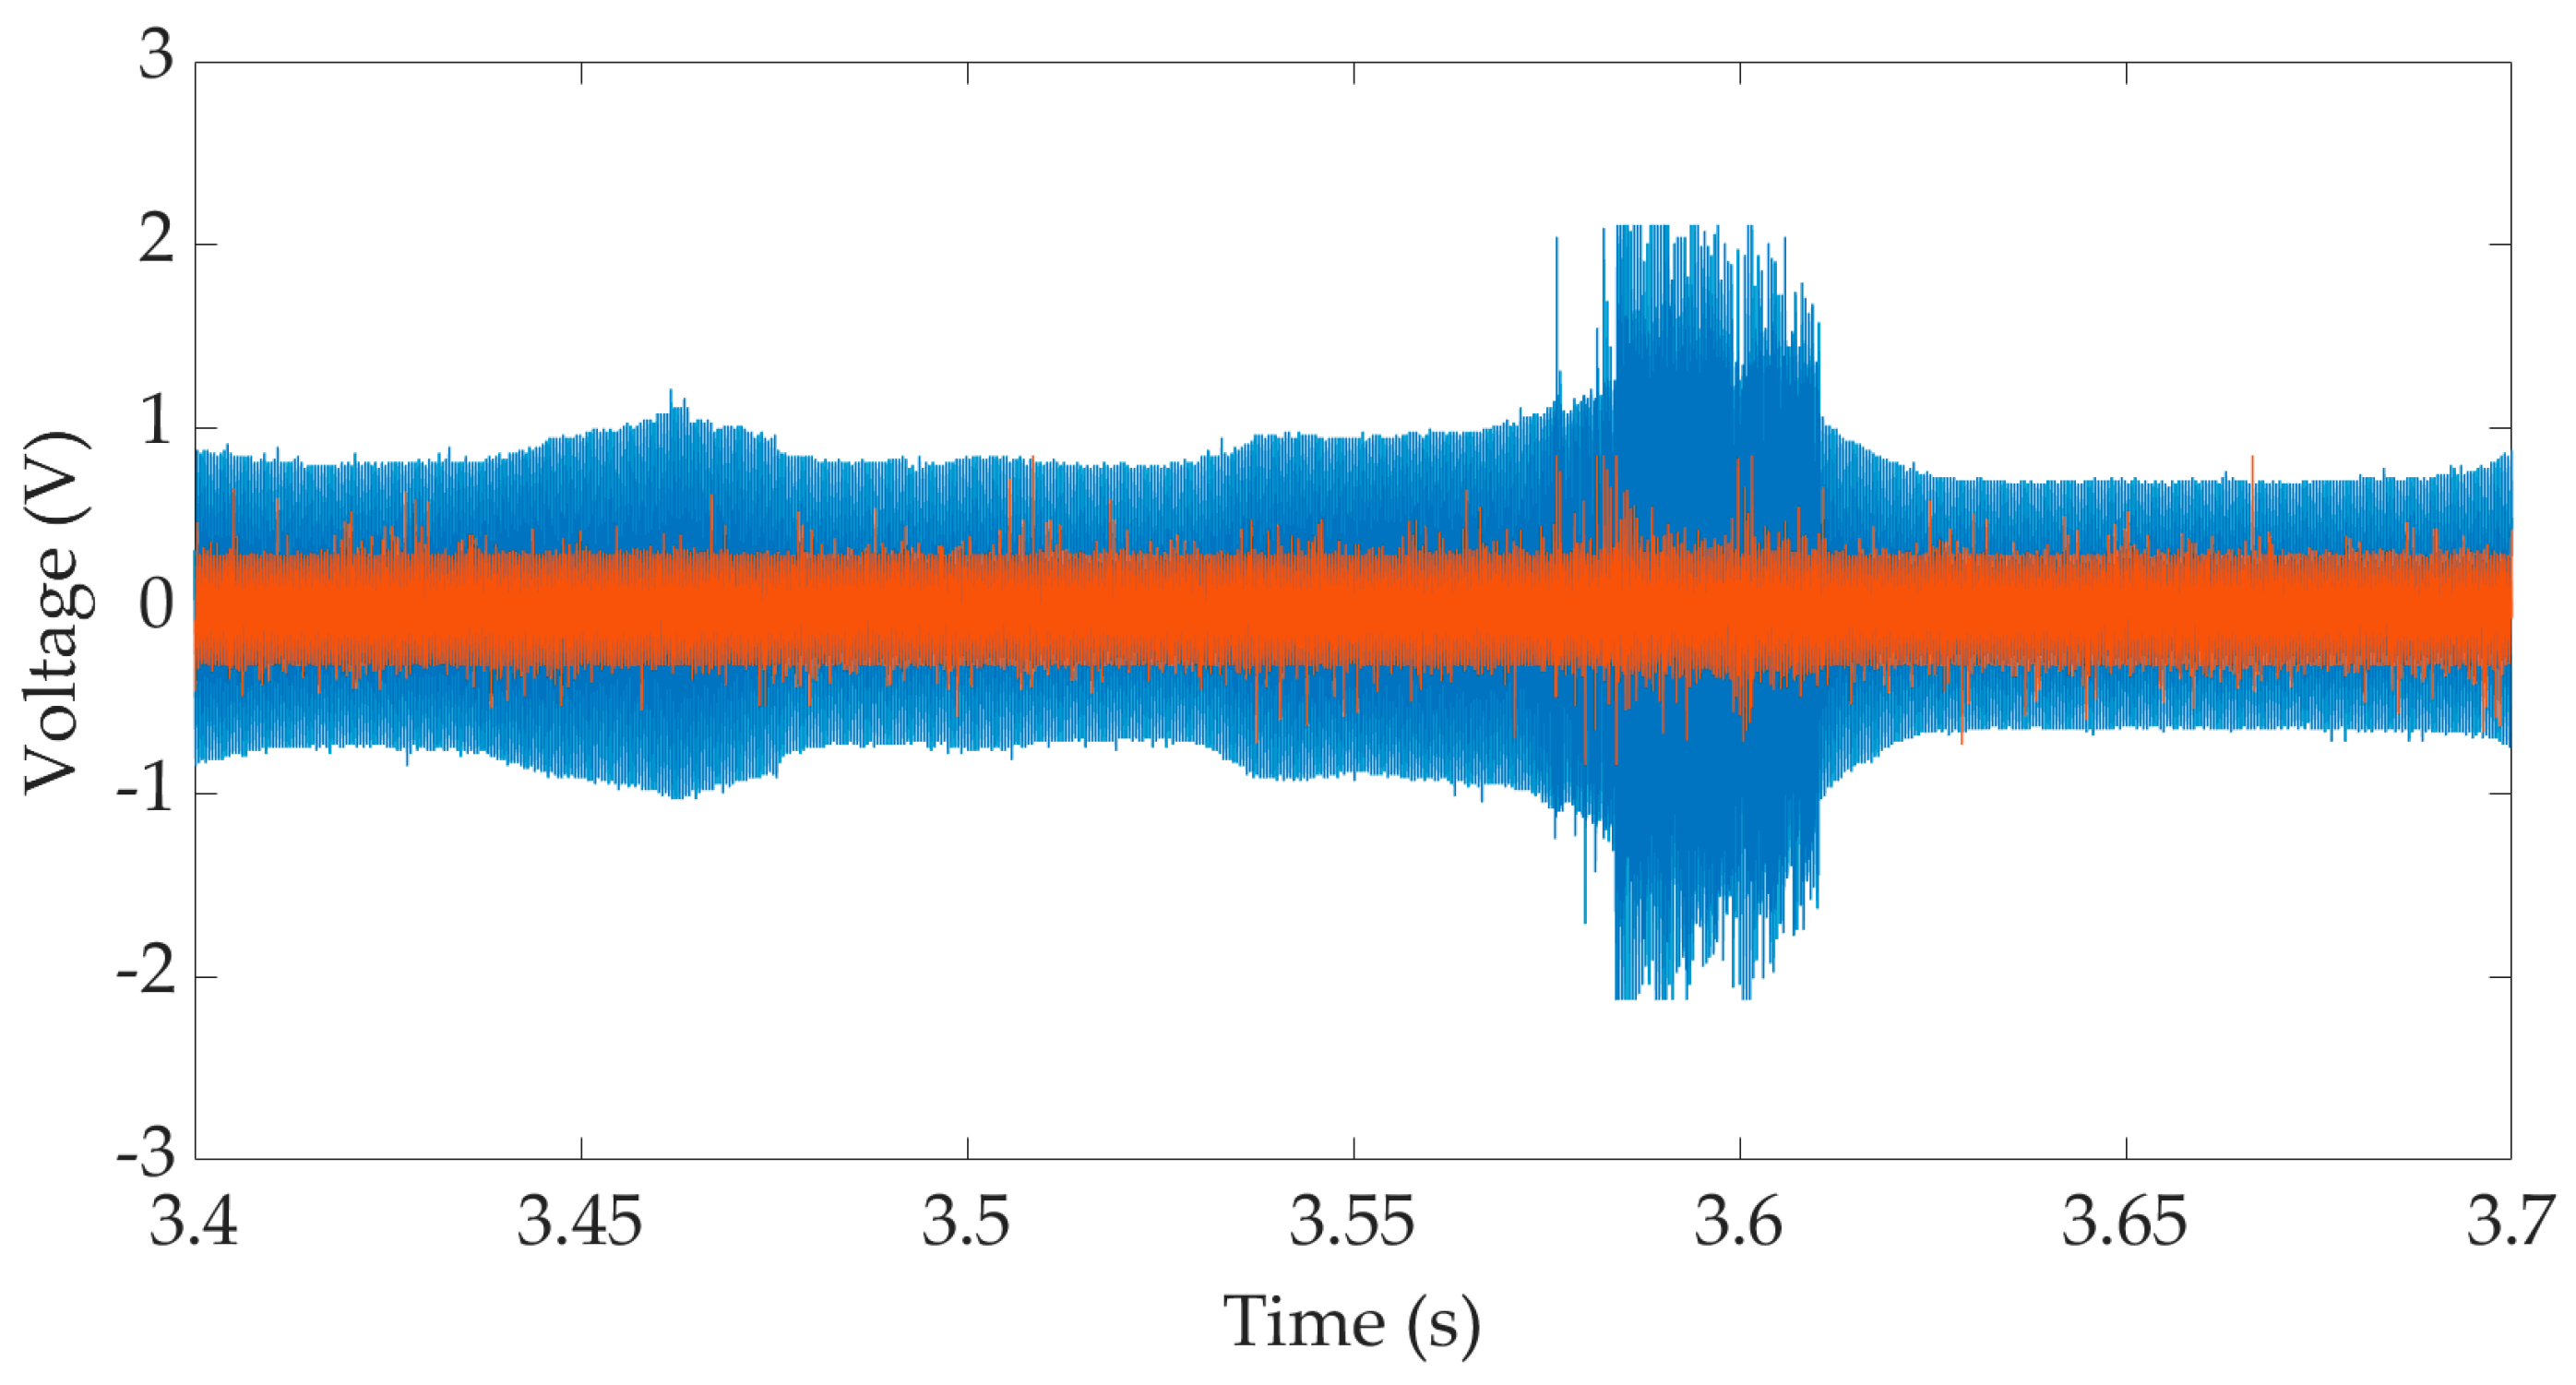
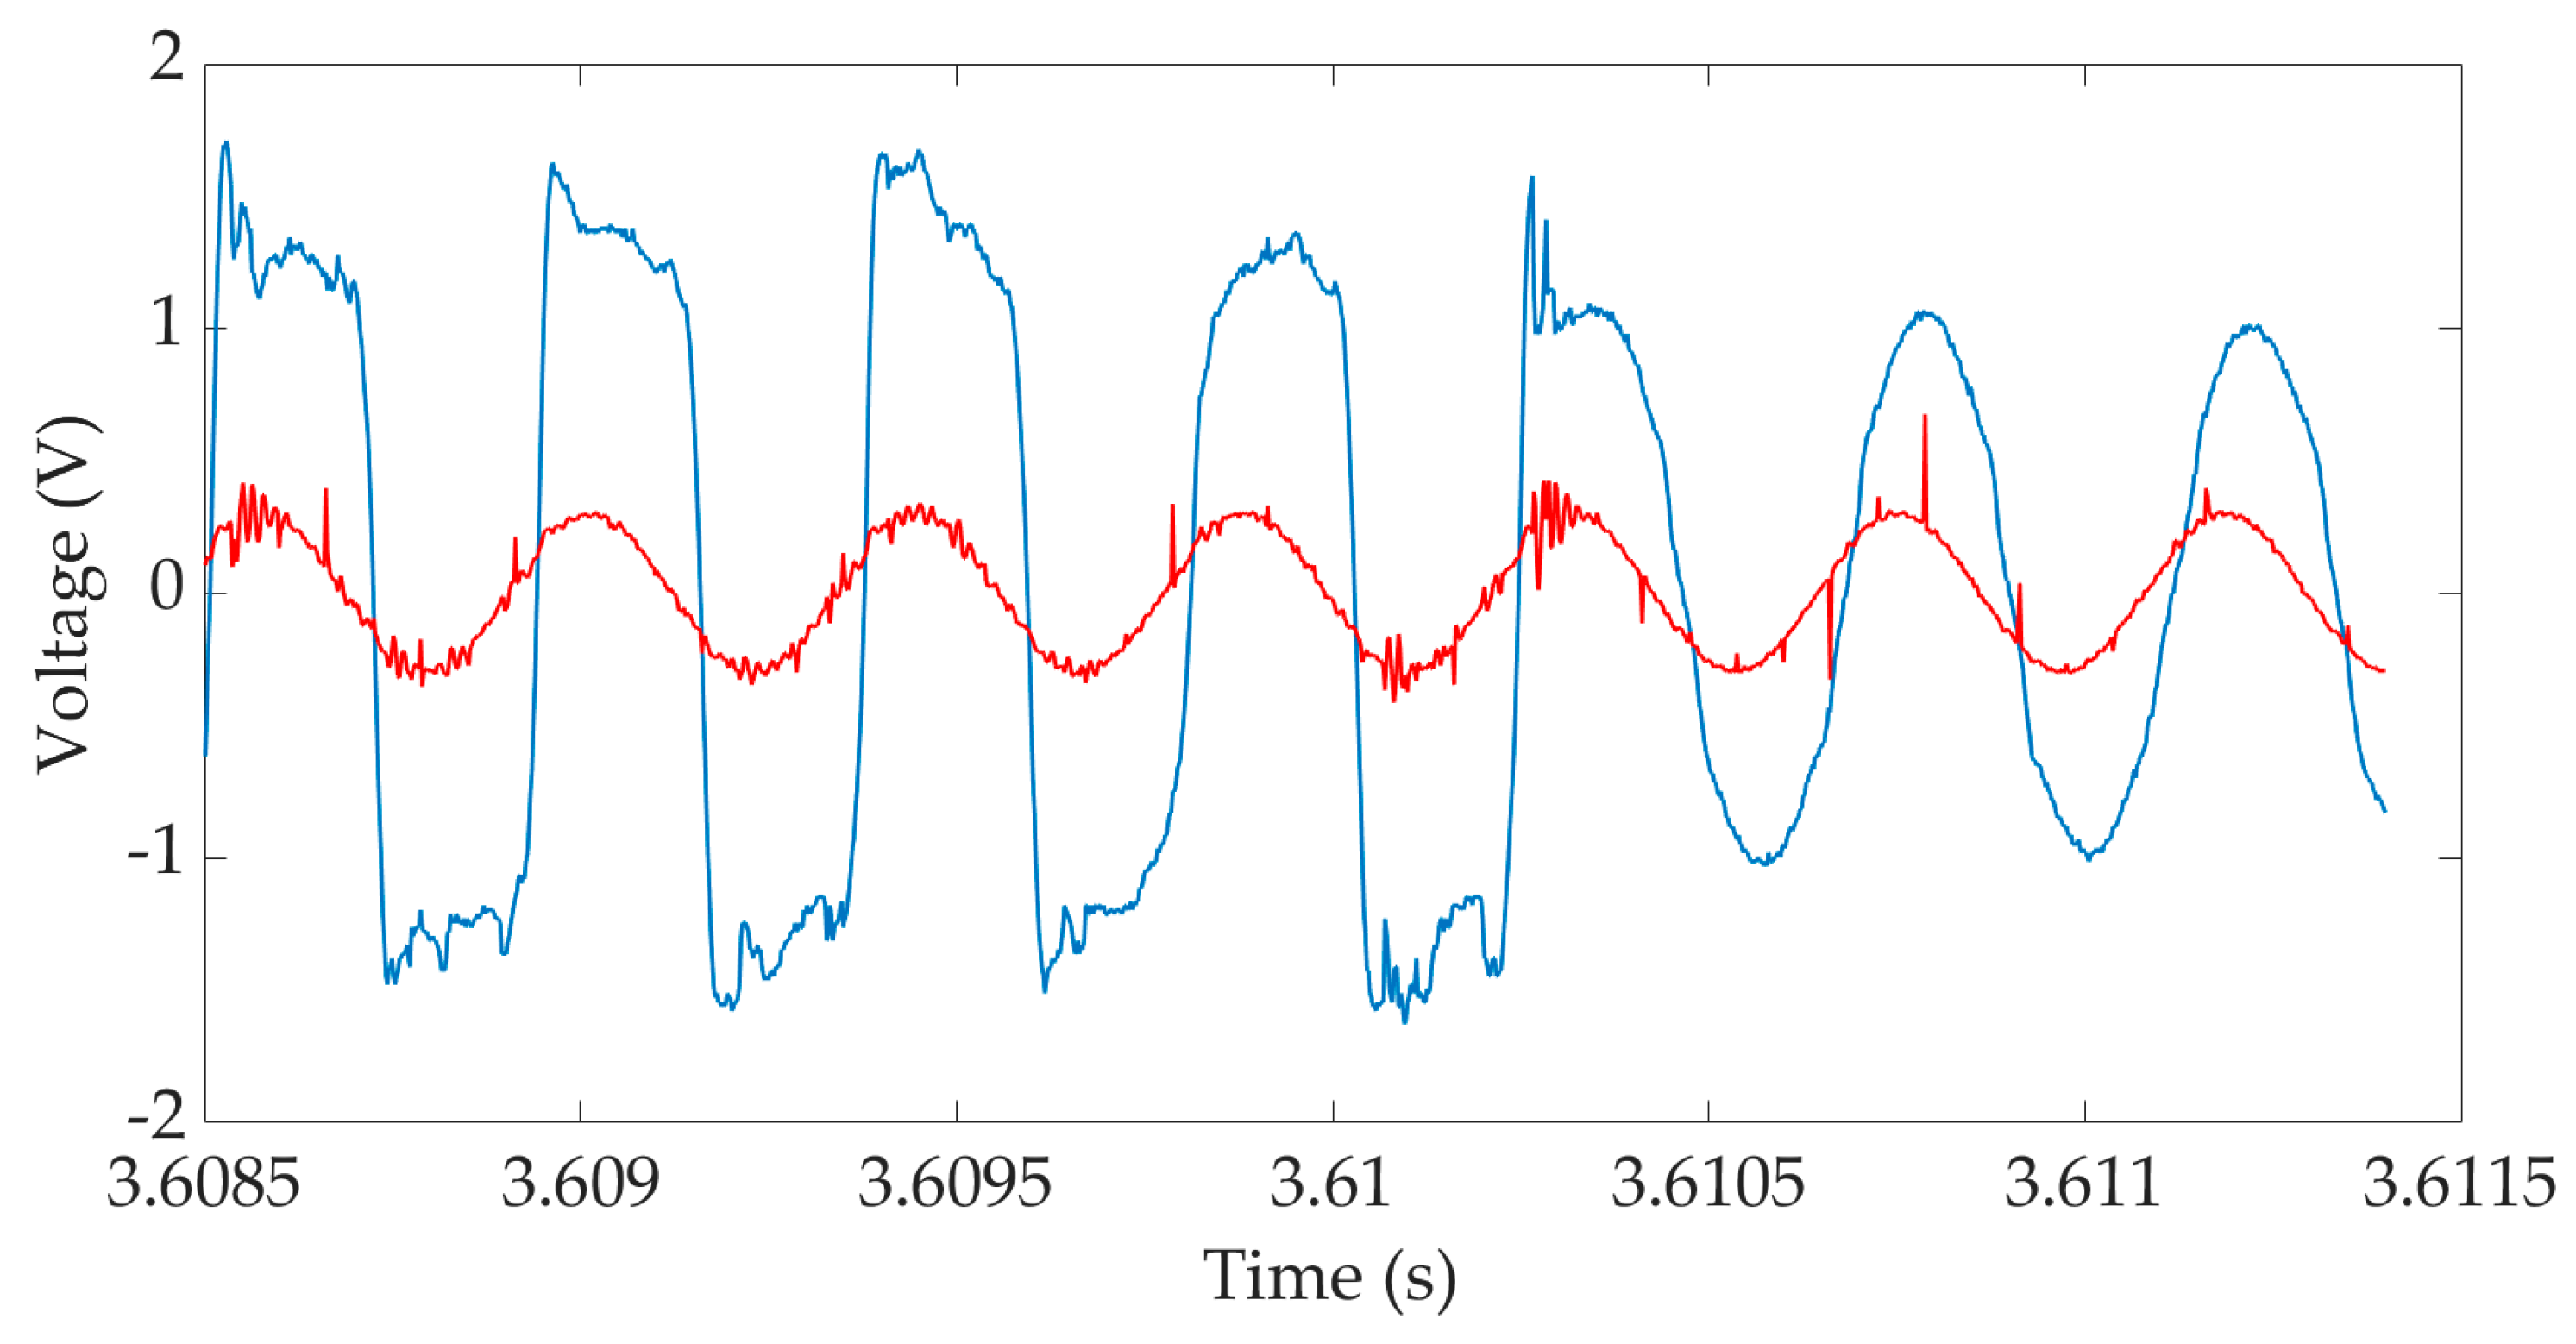
3.4. Measurements during Rolling Contact on Rusted Rail
4. Conclusions
Author Contributions
Funding
Institutional Review Board Statement
Informed Consent Statement
Data Availability Statement
Conflicts of Interest
Appendix A
Appendix A.1. Area of an Elliptical Sector

Appendix A.2. Calculation of

References
- Wybo, J.L. Track circuit reliability assessment for preventing railway accidents. Saf. Sci. 2018, 110 Pt B, 268–275. [Google Scholar] [CrossRef]
- Mosleh, A.; Montenegro, P.A.; Costa, P.A.; Calçada, R. Railway Vehicle Wheel Flat Detection with Multiple Records Using Spectral Kurtosis Analysis. Appl. Sci. 2021, 11, 4002. [Google Scholar] [CrossRef]
- Mosleh, A.; Montenegro, P.; Alves Costa, P.; Calçada, R. An approach for wheel flat detection of railway train wheels using envelope spectrum analysis. Struct. Infrastruct. Eng. 2021, 17, 1710–1729. [Google Scholar] [CrossRef]
- Descartes, S.; Desrayaud, C.; Niccolini, E.; Berthier, Y. Presence and role of the third body in a wheel–rail contact. Wear 2005, 258, 1081–1090. [Google Scholar] [CrossRef]
- Suzumura, J.; Sone, Y.; Ishizaki, A.; Yamashita, D.; Nakajima, Y.; Ishida, M. In situ X-ray analytical study on the alteration process of iron oxide layers at the railhead surface while under railway traffic. Wear 2011, 271, 47–53. [Google Scholar] [CrossRef]
- Nakahara, T.; Baek, K.S.; Chen, H.; Ishida, M. Relationship between surface oxide layer and transient traction characteristics for two steel rollers under unlubricated and water lubricated conditions. In Proceedings of the 8th International Conference on Contact Mechanics and Wear of Rail/Wheel Systems (CM2009), Firenze, Italia, 15–18 September 2009. [Google Scholar]
- Descartes, S.; Renouf, M.; Fillot, N.; Gautier, B.; Descamps, A.; Berthier, Y.; Demanche, P. A new mechanical-electrical approach to the wheel-rail contact. Wear 2008, 265, 1408–1416. [Google Scholar] [CrossRef]
- Fukuda, M.; Terada, N.; Ban, T. Study of quantifying and reducing electrical resistance between wheels and rails. Q. Rep. RTRI 2008, 49, 158–162. [Google Scholar] [CrossRef]
- Chollet, H.; Houzé, F.; Testé, P.; Loete, F.; Lorang, X.; Debucquoi, S. Observation of Branly’s effect during shunting experiments on scaled wheel-rail contacts. In Proceedings of the 9th International Conference on Contact Mechanics and Wear of Rail/Wheel Systems (CM2012), Chengdu, China, 27–30 August 2012; pp. 111–114. [Google Scholar]
- Houzé, F.; Chollet, H.; Testé, P.; Lorang, X.; Loëte, F.; Andlauer, R.; Debucquoi, S.; Lerdu, F.; Antoni, M. Electrical behaviour of the wheel-rail contact. In Proceedings of the 26th Inernational Conference on Electrical Contacts (ICEC-ICREPEC2012), Beijing, China, 14–17 May 2012; pp. 67–72. [Google Scholar]
- Johnson, K.L. Contact Mechanics; Cambridge University Press: Cambridge, UK, 1985. [Google Scholar]
- Toumi, M. Modélisation Numérique du Contact Roue-Rail pour l’Étude des Paramètres Influençant les Coefficients de Kalker: Application à la Dynamique Ferroviaire. Ph.D. Thesis, Université Paris-Est, Paris, France, 2016. [Google Scholar]
- Nicodeme, C. Evaluation de l’Adhérence au Contact Roue-Rail par Analyse d’Images Spectrales. Ph.D. Thesis, Université Paris Sciences et Lettres, Paris, France, 2018. [Google Scholar]
- Creyssels, M.; Falcon, E.; Castaing, B. Experiments and theory of the electrical conductivity of a compressed granular metal. AIP Conf. Proc. 2009, 1145, 123–126. [Google Scholar]
- Timsit, R. Electrical Contact Resistance: Properties of Stationary Interfaces. IEEE Trans. Compon. Packag. Technol. 1999, 22, 1–19. [Google Scholar] [CrossRef]


| Scale 1 | Reduced Scale | |
|---|---|---|
| 420 mm | 30 mm | |
| ∞ | 15.4 mm | |
| Normal force | 76.9 kN | 392 N |
| Contact surface | 85.1 mm2 | 0.43 mm2 |
| a | 6.6 mm | 0.47 mm |
| b | 4 mm | 0.29 mm |
| Average pressure | 903 MPa | 903 MPa |
Disclaimer/Publisher’s Note: The statements, opinions and data contained in all publications are solely those of the individual author(s) and contributor(s) and not of MDPI and/or the editor(s). MDPI and/or the editor(s) disclaim responsibility for any injury to people or property resulting from any ideas, methods, instructions or products referred to in the content. |
© 2023 by the authors. Licensee MDPI, Basel, Switzerland. This article is an open access article distributed under the terms and conditions of the Creative Commons Attribution (CC BY) license (https://creativecommons.org/licenses/by/4.0/).
Share and Cite
Haydar, L.; Loete, F.; Houzé, F.; Choupin, T.; Guiche, F.; Testé, P. Enhancing Railway Network Safety by Reproducing Wheel–Rail Electrical Contact on a Laboratory Scale. Appl. Sci. 2023, 13, 10253. https://doi.org/10.3390/app131810253
Haydar L, Loete F, Houzé F, Choupin T, Guiche F, Testé P. Enhancing Railway Network Safety by Reproducing Wheel–Rail Electrical Contact on a Laboratory Scale. Applied Sciences. 2023; 13(18):10253. https://doi.org/10.3390/app131810253
Chicago/Turabian StyleHaydar, Luna, Florent Loete, Frédéric Houzé, Tanguy Choupin, Fabien Guiche, and Philippe Testé. 2023. "Enhancing Railway Network Safety by Reproducing Wheel–Rail Electrical Contact on a Laboratory Scale" Applied Sciences 13, no. 18: 10253. https://doi.org/10.3390/app131810253
APA StyleHaydar, L., Loete, F., Houzé, F., Choupin, T., Guiche, F., & Testé, P. (2023). Enhancing Railway Network Safety by Reproducing Wheel–Rail Electrical Contact on a Laboratory Scale. Applied Sciences, 13(18), 10253. https://doi.org/10.3390/app131810253