Article

Extended High Frequency Thresholds and Their Relationship to Distortion Product Otoacoustic Emissions, Hearing Acuity, Age, Gender, Presence of Spontaneous Otoacoustic Emissions, and Side of Measurement

by
W. Wiktor Jedrzejczak
1,2,*,
Edyta Pilka
1,2,
Malgorzata Pastucha
1,2,
Krzysztof Kochanek
1,2 and
Henryk Skarzynski
1,2
1
Institute of Physiology and Pathology of Hearing, Ul. Mochnackiego 10, 02-042 Warsaw, Poland
2
World Hearing Center, Ul. Mokra 17, 05-830 Kajetany, Poland
*
Author to whom correspondence should be addressed.
Appl. Sci. 2023, 13(18), 10311; https://doi.org/10.3390/app131810311
Submission received: 16 August 2023 / Revised: 11 September 2023 / Accepted: 12 September 2023 / Published: 14 September 2023
(This article belongs to the Section Applied Biosciences and Bioengineering)

Abstract

:
Hearing is normally evaluated up to 8 kHz, even though testing can easily be performed at higher frequencies (up to 16 or 20 kHz). The range beyond 8 kHz is often referred to as the extended high frequency (EHF) range. This study aimed to explore the relationship between EHF hearing thresholds (HTs) and distortion product otoacoustic emissions (DPOAEs) in adult subjects. Also of interest were the effects of the presence of spontaneous otoacoustic emissions (SOAEs), gender, ear side, and age. The main finding was that DPOAEs, both within the standard frequency (SF) range (0.125–8 kHz) and the EHF range (10–16 kHz), decrease as thresholds deteriorate. For both ranges, DPOAEs and HTs depend on age, even for those with normal hearing, although EHFs seem to be especially affected by age. The presence of SOAEs was the only other factor that significantly influenced DPOAE level. For both DPOAEs and HTs, only minor and non-significant effects were related to gender and ear side. It was concluded that DPOAEs in the EHF range appear to be good predictors of EHF HTs. Moreover, since DPOAEs and HTs in the EHF range both correlate with age, these two measures may be suitable markers for incipient presbycusis.

1. Introduction

Standard hearing evaluation is usually limited to 8 kHz. At the same time, it is known that hearing loss in most cases begins at the highest frequencies (e.g., review by [1]) irrespective of whether the loss is induced by aging, disease, the ingestion of ototoxic drugs, or exposure to noise. This means that losses in the so-called extended high frequency (EHF) range, i.e., above 8 kHz—might be an early sign of hearing damage and therefore useful for hearing loss diagnosis or monitoring.
Hearing tests that detect and measure otoacoustic emissions (OAEs) [2,3] are often considered more sensitive than those that measure hearing thresholds (HTs) directly. Several studies have shown that OAEs can be used as an early warning sign of hearing deterioration [4,5,6,7]. There are two main types of OAEs used clinically: transiently evoked OAEs (TEOAEs) and distortion product OAEs (DPOAEs). The difference between these depends on the mode of stimulation and the method of data acquisition. Both OAE types generally give similar information about hearing status, but there are some differences. TEOAEs differentiate normal hearing best in the 1–4 kHz range, whereas DPOAEs do better at higher frequencies, i.e., 2–6 kHz (e.g., [8]). This distinction is related to different stimulation types. If hearing at low frequencies (i.e., ≤1 kHz) is of interest, it is better to test using tone-burst-evoked OAEs (e.g., [9,10]).
In the present study, the main focus is on high frequency hearing. Thus, of all the various types of OAEs, DPOAEs are the preferred test technique. In this context, it is worth noting that subjects with better EHF thresholds tend to have higher DPOAEs at frequencies below 8 kHz [11]. In other words, DPOAEs can be used as indicators of preclinical changes in hearing [12,13]. Related studies have shown that in both adults and children, DPOAEs in the standard frequency (SF) range (up to 6 kHz) correlate with EHF HTs [14,15], i.e., the lower the threshold, the higher the amplitude of DPOAEs. On the other hand, some previous works indicate that DPOAEs correlate only with EHF thresholds and not with SF thresholds when HTs are within normal limits [16,17]. There is another study which has shown that DPOAEs in the SF range (up to 6 kHz) correlate with HTs in the SF and EHF ranges [18], but this needs to be contrasted with another, earlier study, which indicated that EHF hearing is not associated with DPOAE measures recorded below 4 kHz [19].
A large fraction of subjects will also have spontaneous OAEs (SOAEs), which are measurable without stimulation [20]. The prevalence of these ranges from about 35 to 80% depending on the experimental set-up [21,22,23]. However, in general, the presence of SOAEs is taken to be a mark of good overall hearing. Across many studies, ears with SOAEs have been shown to produce higher levels of TEOAEs and DPOAEs (e.g., [16,24,25,26]). However, when looking for an association with HTs, there are few studies and the results are mixed. Comparing ears with SOAEs to those without, one study found lower thresholds for hearing below 8 kHz [27], but another found no difference [16]. Interestingly, however, Schmuziger and colleagues did find a significant difference in the 8–16 kHz threshold between ears depending on whether they had SOAEs. Even more puzzling, Baiduc and co-workers found no difference in EHF thresholds between ears with and without SOAEs, even though there were significant differences detected at 0.125, 0.25, and 0.5 kHz [28].
A relatively recent advance in clinical OAE equipment has provided the option to acquire responses in the EHF range (i.e., >8 kHz), reflecting early experimental work by Dreisbach and Siegel [29] and Hecker et al. [30] for DPOAEs and by Keefe et al. [31] for TEOAEs.
The rationale for this study is that the relationship between EHF HTs and EHF DPOAEs has not been sufficiently researched. Considering the importance of better diagnosis, there are only a very small number of studies on this topic, and the results are inconclusive [16,17,18,19]. Although the relation between EHF HTs and DPOAEs in the SF range has been reasonably well studied, the amount of data on EHF DPOAEs is much smaller. Furthermore, the present study uses a commercially available system, in contrast to previous work based on custom systems where the results cannot be directly applied in a clinic [29,32,33]. Finally, the current protocol takes into account the presence of SOAEs and expands the study of Schmuziger and colleagues [16] (based on subjects 16–19 years old) to focus on groups of adults of differing ages.
The aim of the present work was to search for a relationship between EHF HTs and DPOAEs, with our hypothesis being that DPOAEs might be an early marker of a decline in EHF hearing. Also of interest were the possible effects of SOAE presence, gender, ear side, and age.

2. Materials and Methods

2.1. Participants

A total of 95 adults participated in the study. Their ages ranged from 21 to 77 years, with an average of 42 ± 14. There were 55 women, comprising 58% of the whole group. All subjects had normal middle ear function verified by 226 Hz tympanometry. None had any known history of otologic disease. The study was conducted according to the guidelines of the Declaration of Helsinki, and approved by the Ethics Committee of the Institute of Physiology and Pathology of Hearing, Poland (approval no. IFPS:KB/13/2014).

2.2. Procedures

All procedures were similar to those used in Jedrzejczak et al. [34]. The status of both ears of each subject was assessed using otoscopy (visual inspection of the ear, particularly the tympanic membrane) together with pure tone audiometry, tympanometry, and DPOAEs (Figure 1). Otoscopic examinations did not reveal any abnormalities.
Pure tone HTs were assessed using a Madsen Astera clinical audiometer (GN Otometrics, Taastrup, Denmark). Air conduction HTs were determined for frequencies from 0.125 to 16 kHz using Sennheiser HDA-200 headphones (tested frequencies: 0.125, 0.25, 0.5, 0.75, 1, 1.5, 2, 3, 4, 6, 8, 10, 12.5, 14, and 16 kHz). For normal hearing, a criterion of better than or equal to 25 dB Hearing Level (HL) was used.
Tympanometry measurements were made in both ears using a Madsen Zodiac 901 impedance bridge (GN Otometrics). A standard test tone of 226 Hz was used (tympanometric peak pressure between −100 and +100 daPa and peak compensated static acoustic admittance of 0.3–1.3 mmhos).
DPOAE tests were conducted using the HearID system (Mimosa Acoustics Inc., Champaign, IL, USA) with an ER-10C probe (Etymotic Research, Elk Grove Village, IL, USA). DPOAEs were evoked by two tones at frequencies of F1 and F2, and responses were measured at a frequency of 2F1–F2. DPOAEs were measured at 9 selected frequencies for F2 of 1, 1.5, 2, 4, 6, 8, 10, 12, and 16 kHz; the F2/F1 ratio was 1.2, and the stimulus levels were 65 and 55 dB sound pressure level (SPL). The equipment settings used were the default of the HearID system, with the only change being the extension of frequencies up to 16 kHz. Only ears which gave a signal-to-noise ratio (SNR) greater than 6 dB and a response level greater than −20 dB SPL at 3 or more of the 7 frequencies from the range of 1, 1.5, 2, 3, 4, 6 and 8 kHz were analysed.
Synchronized SOAEs (SSOAEs) were acquired using the in-built routine (SOAE50) provided by the HearID system. This routine applies linear click stimuli of 50 dB SPL and records OAEs in a 40 ms window. The first 20 ms of each averaged response (containing largely the evoked part) was discarded. The spectra of responses from the last 20 ms were analysed in a search for SOAE peaks. SOAEs were considered to be present when at least one peak was found in the 1–6 kHz range that exceeded the noise floor by at least 6 dB.

2.3. Statistical Analysis

All analyses were made in Matlab (v. 2018b, MathWorks, Natick, MA, USA). All datasets were tested for normality of distribution using a Shapiro–Wilk test. If this test was passed, a t-test was used; otherwise, a non-parametric Mann–Whitney U-test was used. As a criterion of significance, a 95% confidence level (p < 0.05) was chosen. For some analyses, Pearson correlations were also calculated. The correlation coefficients were classified as weak (0–0.3), moderate (0.3–0.7), or strong (0.7–1.0), e.g., [35]. When conducting multiple comparisons, p-values were adjusted using the Benjamini and Hochberg [36] procedure to control for false discovery rates.

3. Results

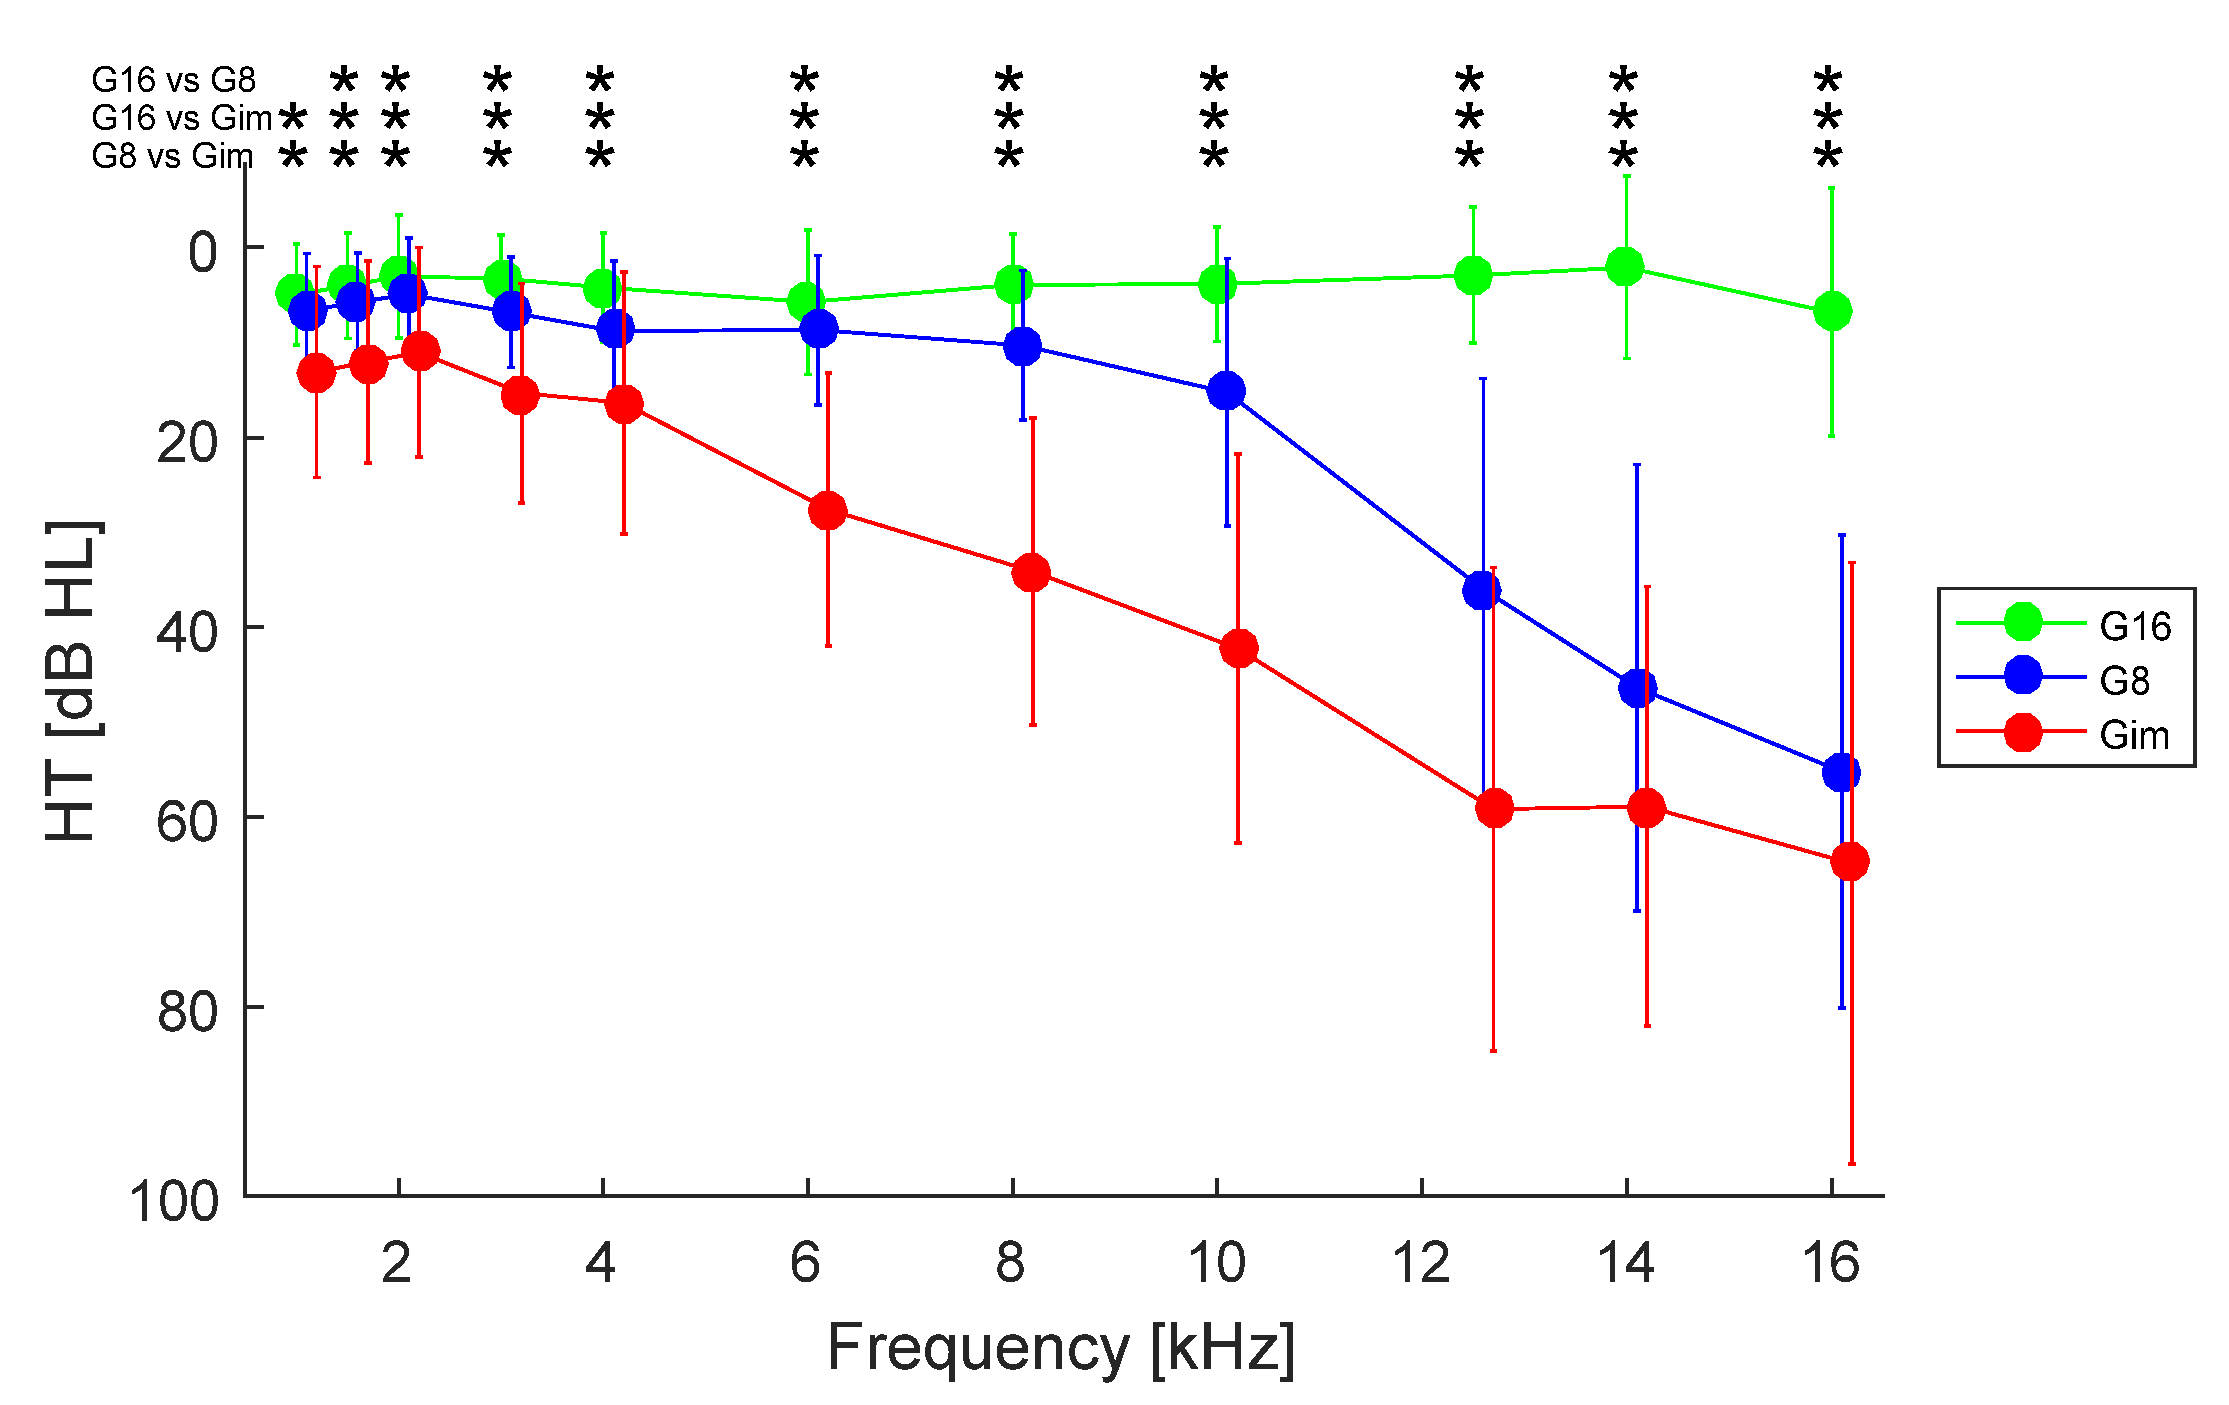
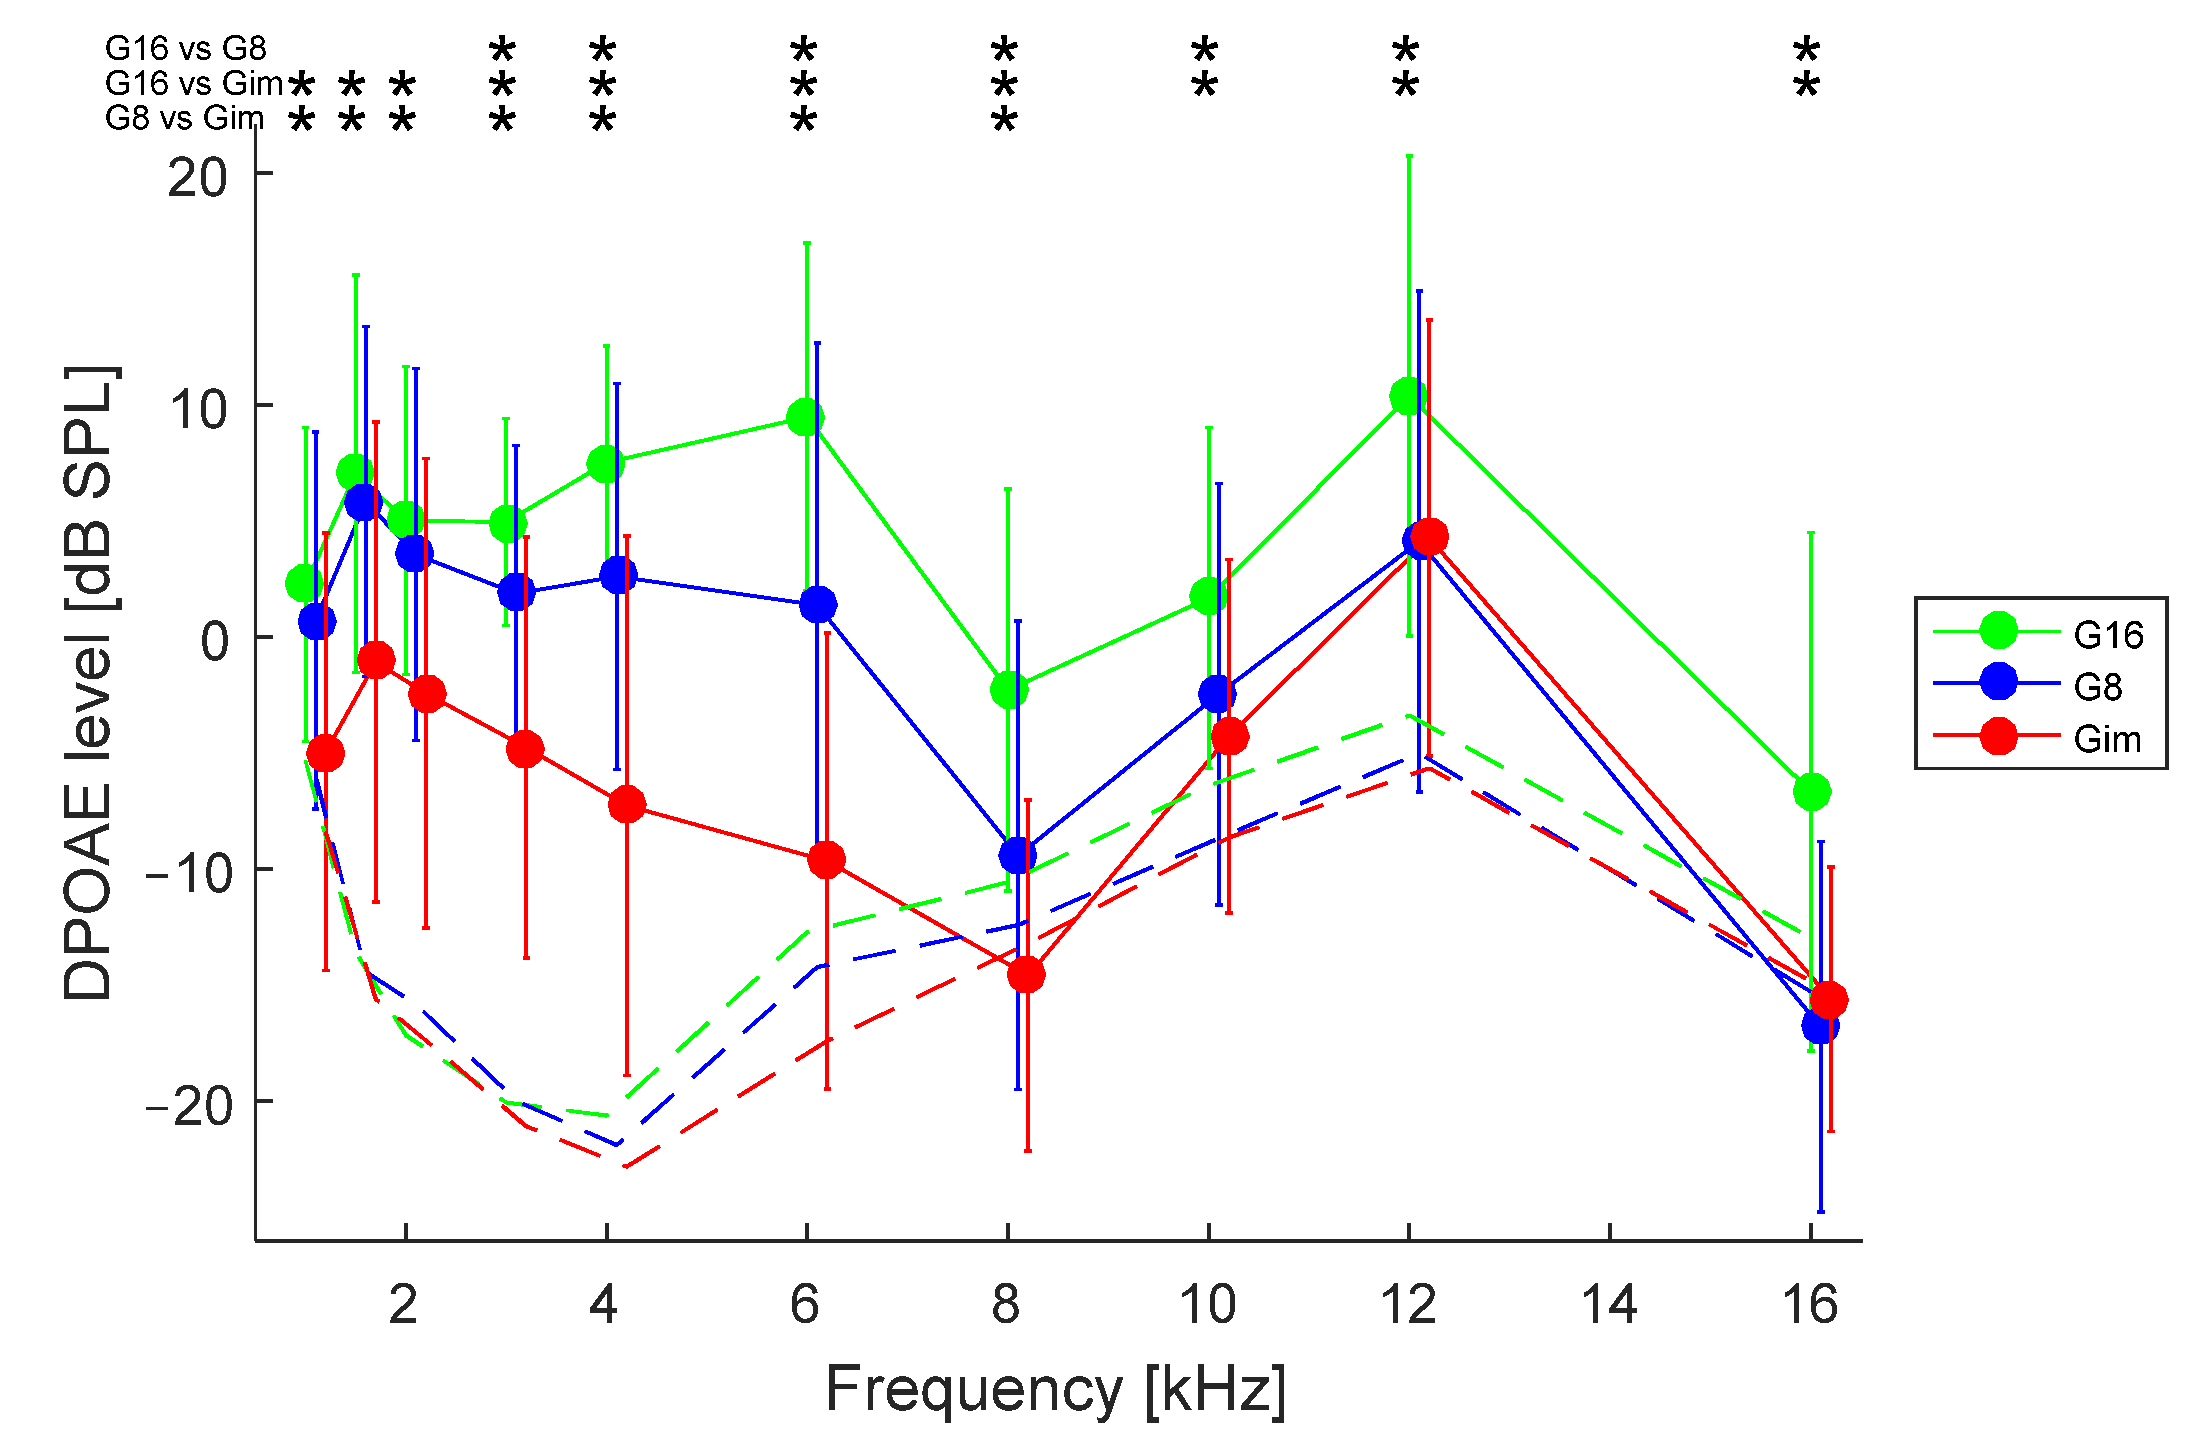
3.1. Effect of Hearing Loss
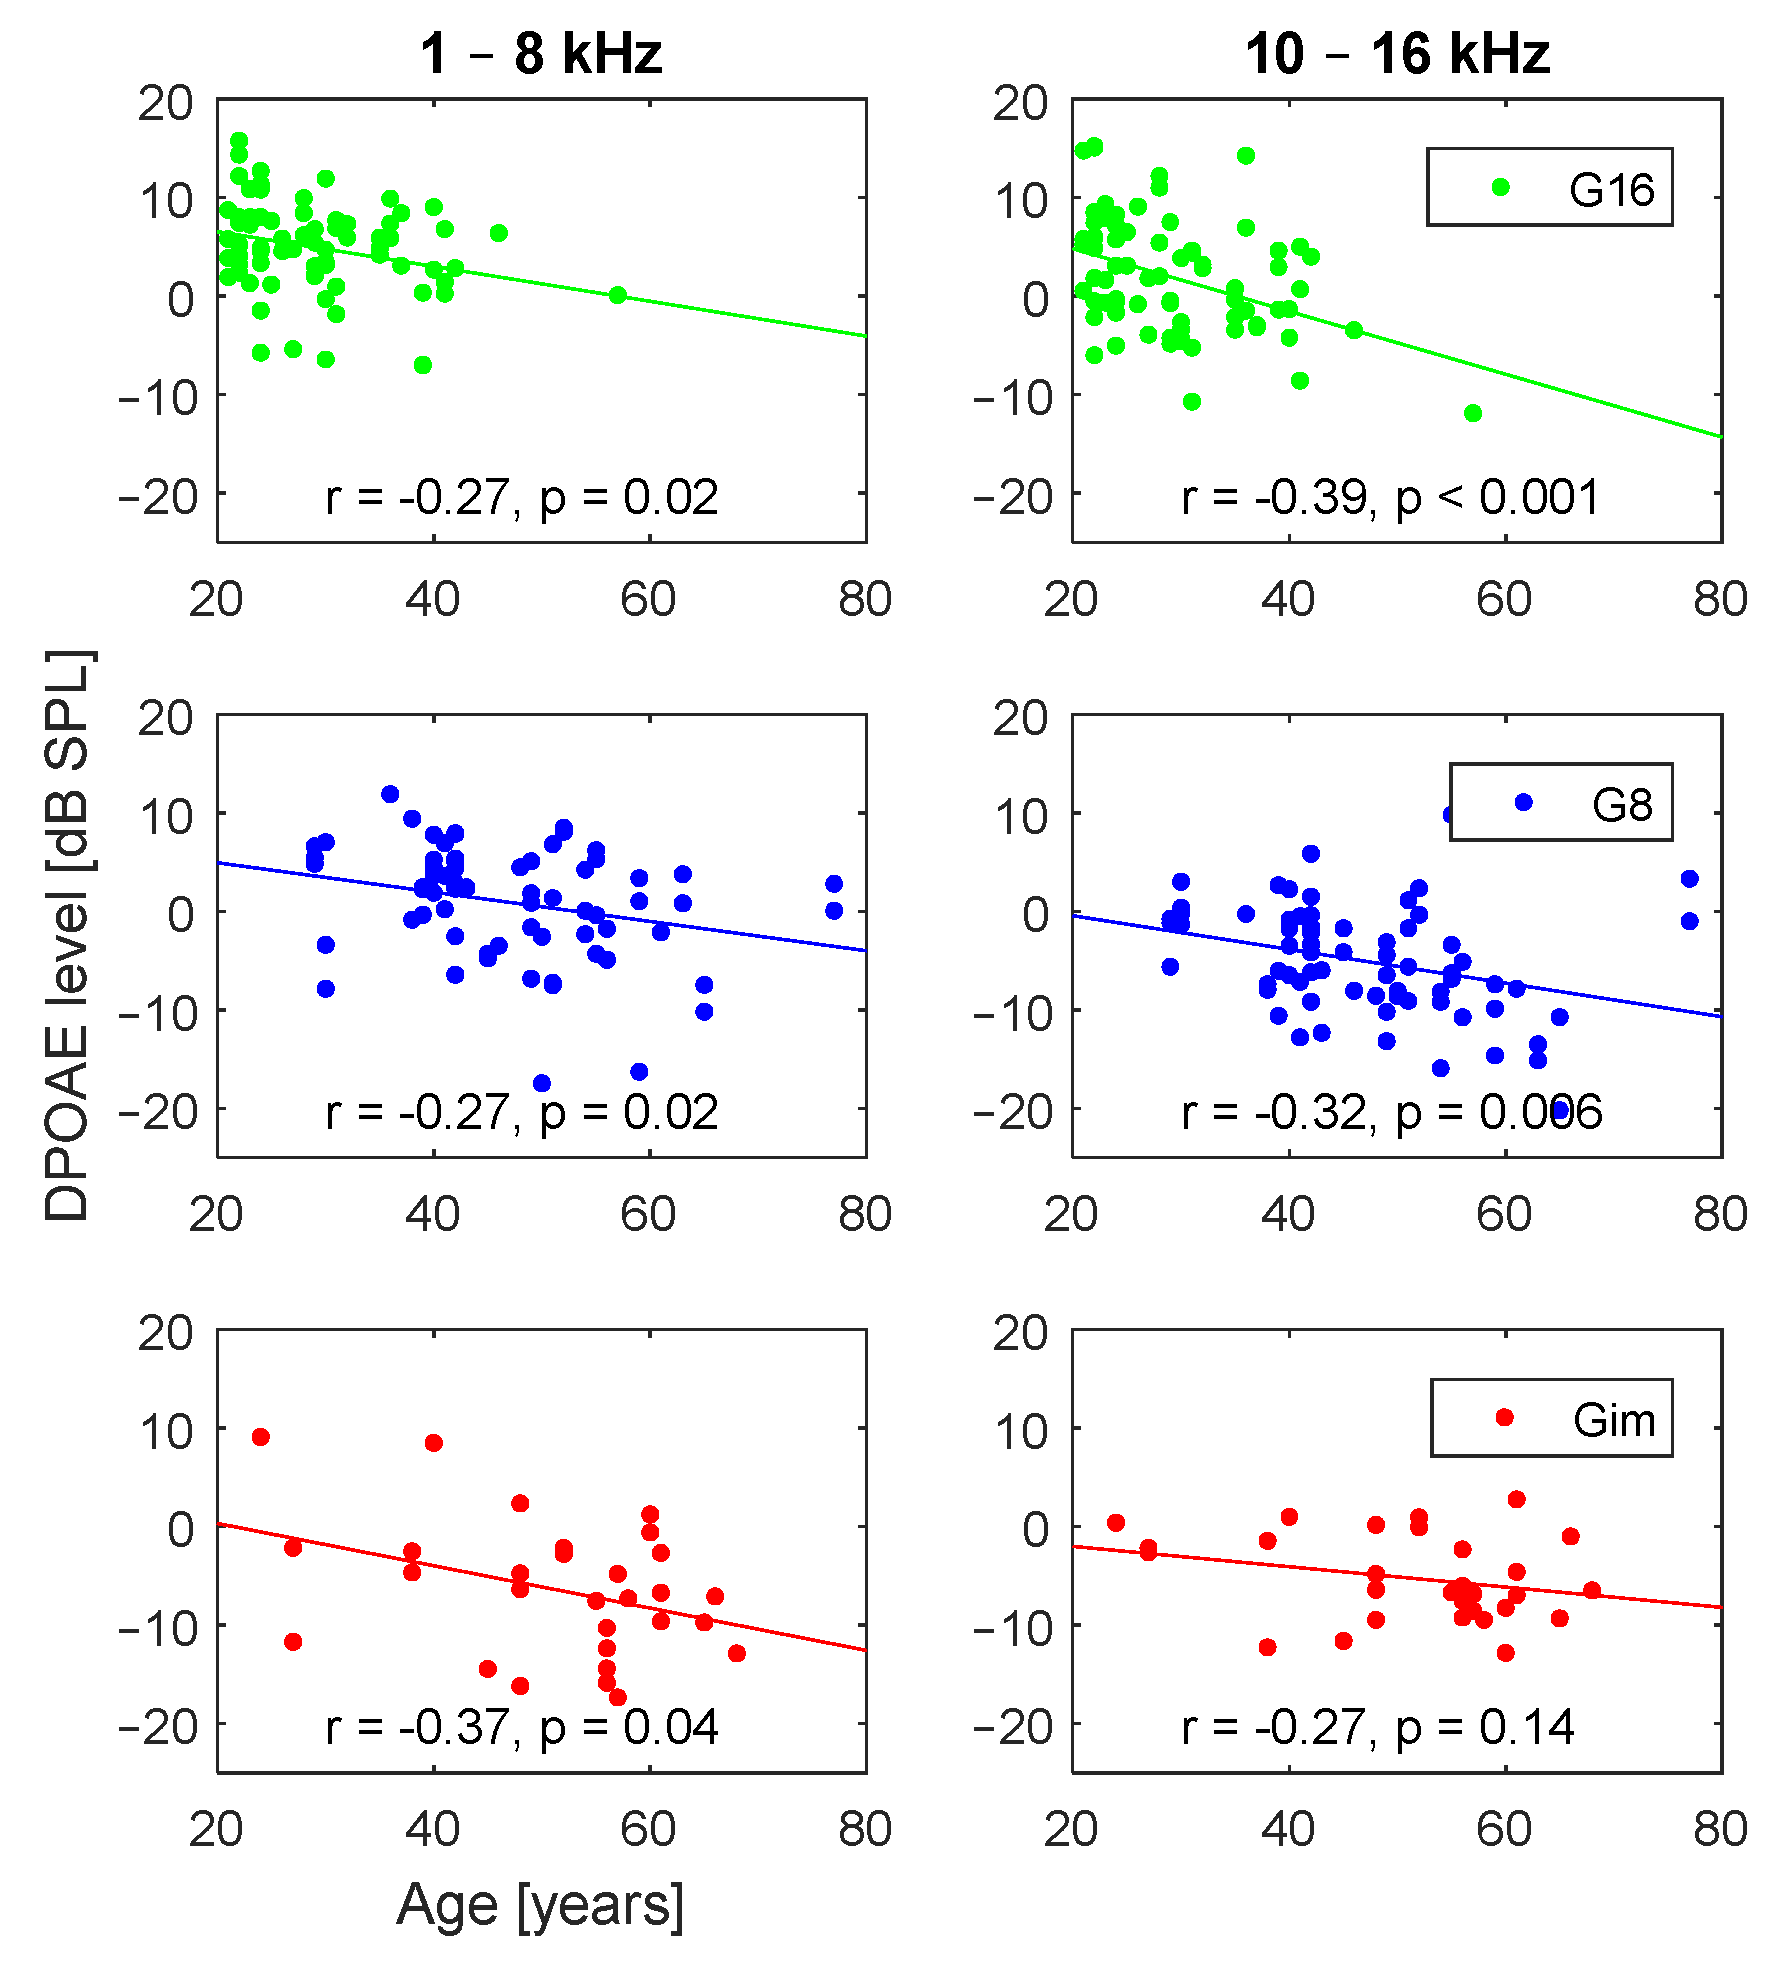
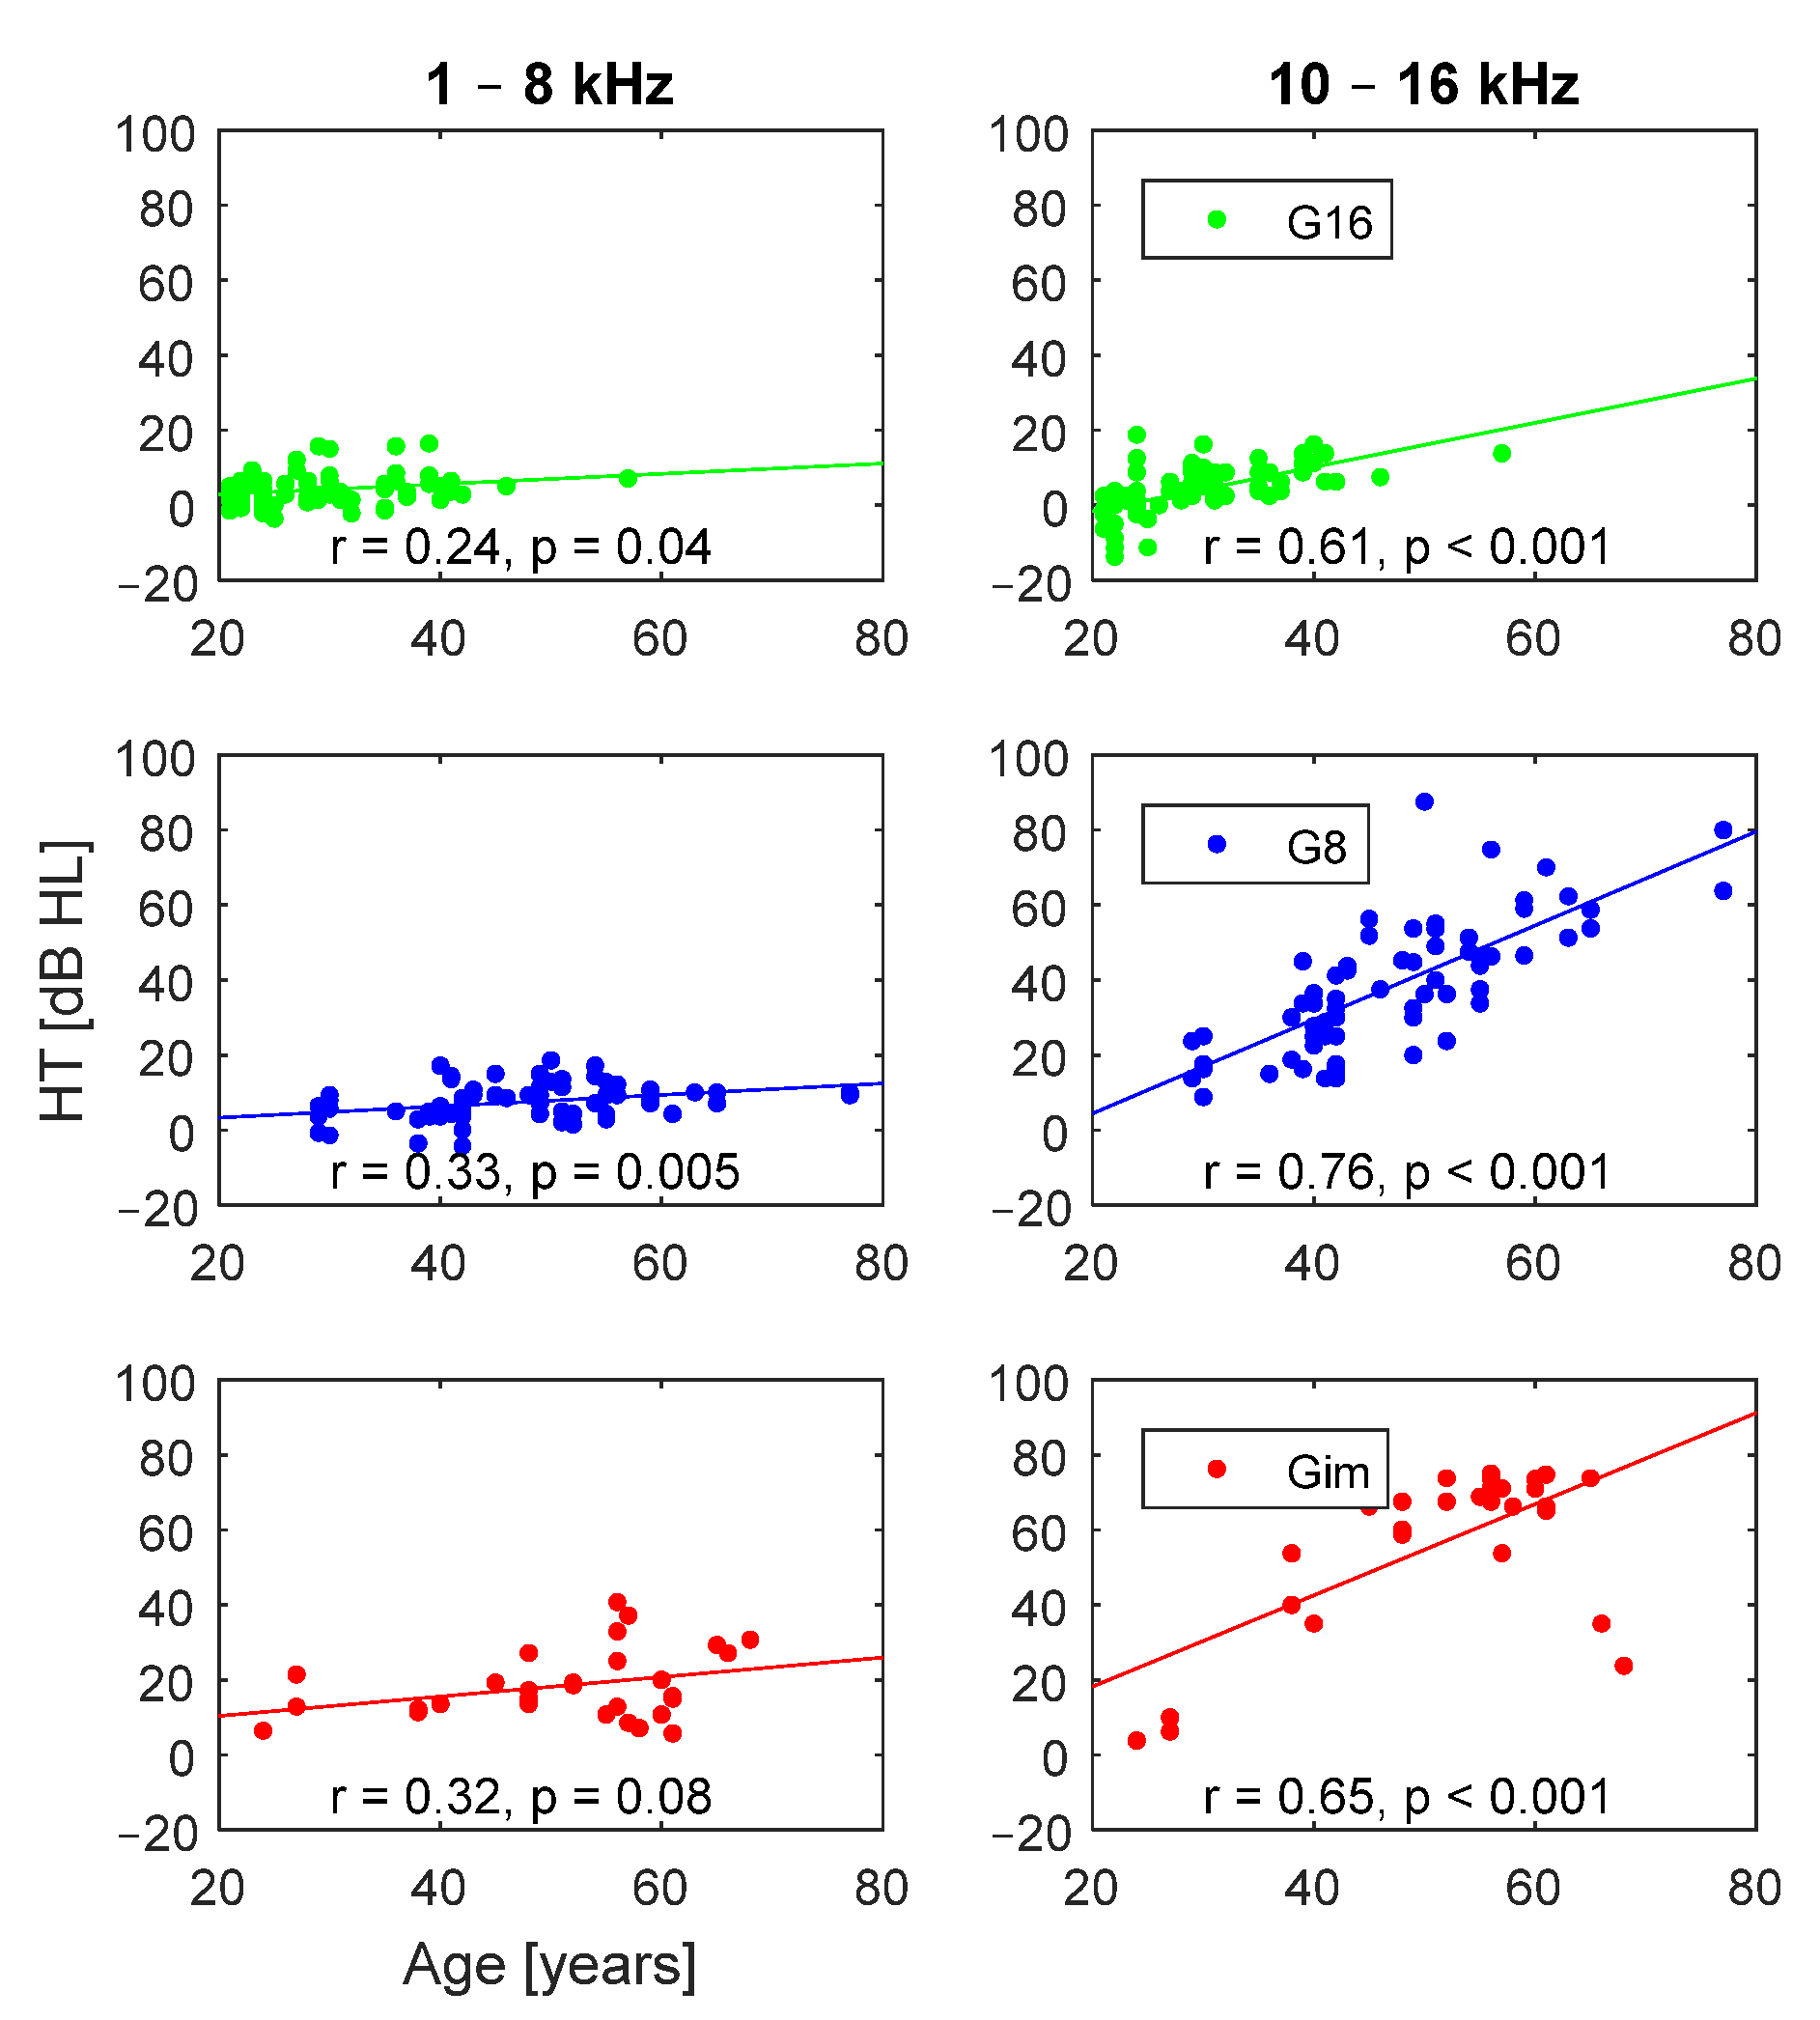
As the main focus of this study is the association between HTs and DPOAEs, the following analyses deal with ears rather than participants. Figure 2 presents average HTs for the three groups divided according to HL: G16, with HTs equal to or better than 25 dB HL over the whole frequency range up to 16 kHz (74 ears, age 29 ± 7); G8, with HTs equal to or better than 25 dB HL up to 8 kHz (69 ears, age 47 ± 10); and Gim, with at least one HT worse than 25 dB HL at frequencies below 8 kHz (29 ears, age 51 ± 11). As standard tests of hearing cover the range up to 8 kHz, groups G16 and G8 can be considered as having normal hearing, with the G16 group having ‘exceptionally good’ hearing. Gim, on the other hand, includes ears that have some elevation in threshold, signifying a degree of hearing impairment. Pairwise comparisons for HTs showed significant differences between G16 and G8 for frequencies of 1.5–16 kHz, between G16 and Gim at all tested frequencies from 1 to 16 kHz, and between G8 and Gim for all frequencies (marked by asterisks in Figure 2).
Figure 3 presents average DPOAE response levels for the three groups. Pairwise comparisons for response levels at different frequencies showed significant differences between G16 and G8 for frequencies of 3–16 kHz, between G16 and Gim at all tested frequencies 1–16 kHz, and between G8 and Gim for frequencies of 1–8 kHz. All of these are marked by asterisks in Figure 3. It can be seen that DPOAE amplitudes for G16 surpassed the noise floor for all frequencies. In the case of G8, amplitudes in the 8–16 kHz range approached the noise floor. For group Gim, DPOAE levels were still above the noise over the 1.5–4 kHz range. Somewhat curiously, however, there was a sharp rise in DPOAE level at 12 kHz, a frequency where HTs were in fact worse, and this apparent contradiction suggests caution in interpreting data at this frequency. In general, the decrease in DPOAE levels with hearing loss in the EHF range is smaller than might be expected (especially in comparison with the much more evident decrease in DPOAEs in the SF range).

3.2. Effect of Age

In subsequent analyses, DPOAE levels and HTs were analysed in terms of average values over the SF range (1–8 kHz) and over the EHF range (10–16 kHz).
For each group, DPOAE response levels were correlated negatively with age, as can be seen in Figure 4. The correlations were weak to moderate. Even for the G16 group, the DPOAE response level decreased with age, despite the fact that hearing levels were within normal limits up to 16 kHz, and all ears presented generally high levels of DPOAEs. The effect of age was stronger for DPOAEs in the 10–16 kHz range compared to the 1–8 kHz range, with correlation coefficients of −0.37 and −0.27, respectively. Only for the Gim group in the 10–16 kHz range was there no significant correlation between DPOAEs and age (p = 0.14); nevertheless, the tendency for DPOAEs in that range to decline with age remained (r = −0.27).
Similarly, HTs also increased with age, as shown in Figure 5. The correlations between HT and age were significant for all groups for EHFs (10–16 kHz), and for groups G16 and G8 for SFs (1–8 kHz), with Gim close to significance and having a similar trend to the other groups. For SFs, the correlations were weak to moderate, while for EHFs correlations were moderate to strong. The effect was especially pronounced for G8, where the correlation coefficient for EHFs reached 0.76.
As both DPOAEs and HTs seem to be significantly influenced by age, correlation coefficients with adjustment for other variables were calculated, and the results are shown in Table 1. Here, the data for groups G16 and G8 were pooled together. HT in the SF range correlated significantly with DPOAEs in that range. However, there was no significant correlation with DPOAEs in the EHF range. HT in the EHF range correlated significantly with DPOAEs in the SF range, as well as with DPOAEs in the EHF range. HT in the EHF range correlated weakly with DPOAEs (−0.22, −0.17), but strongly with age (0.78).

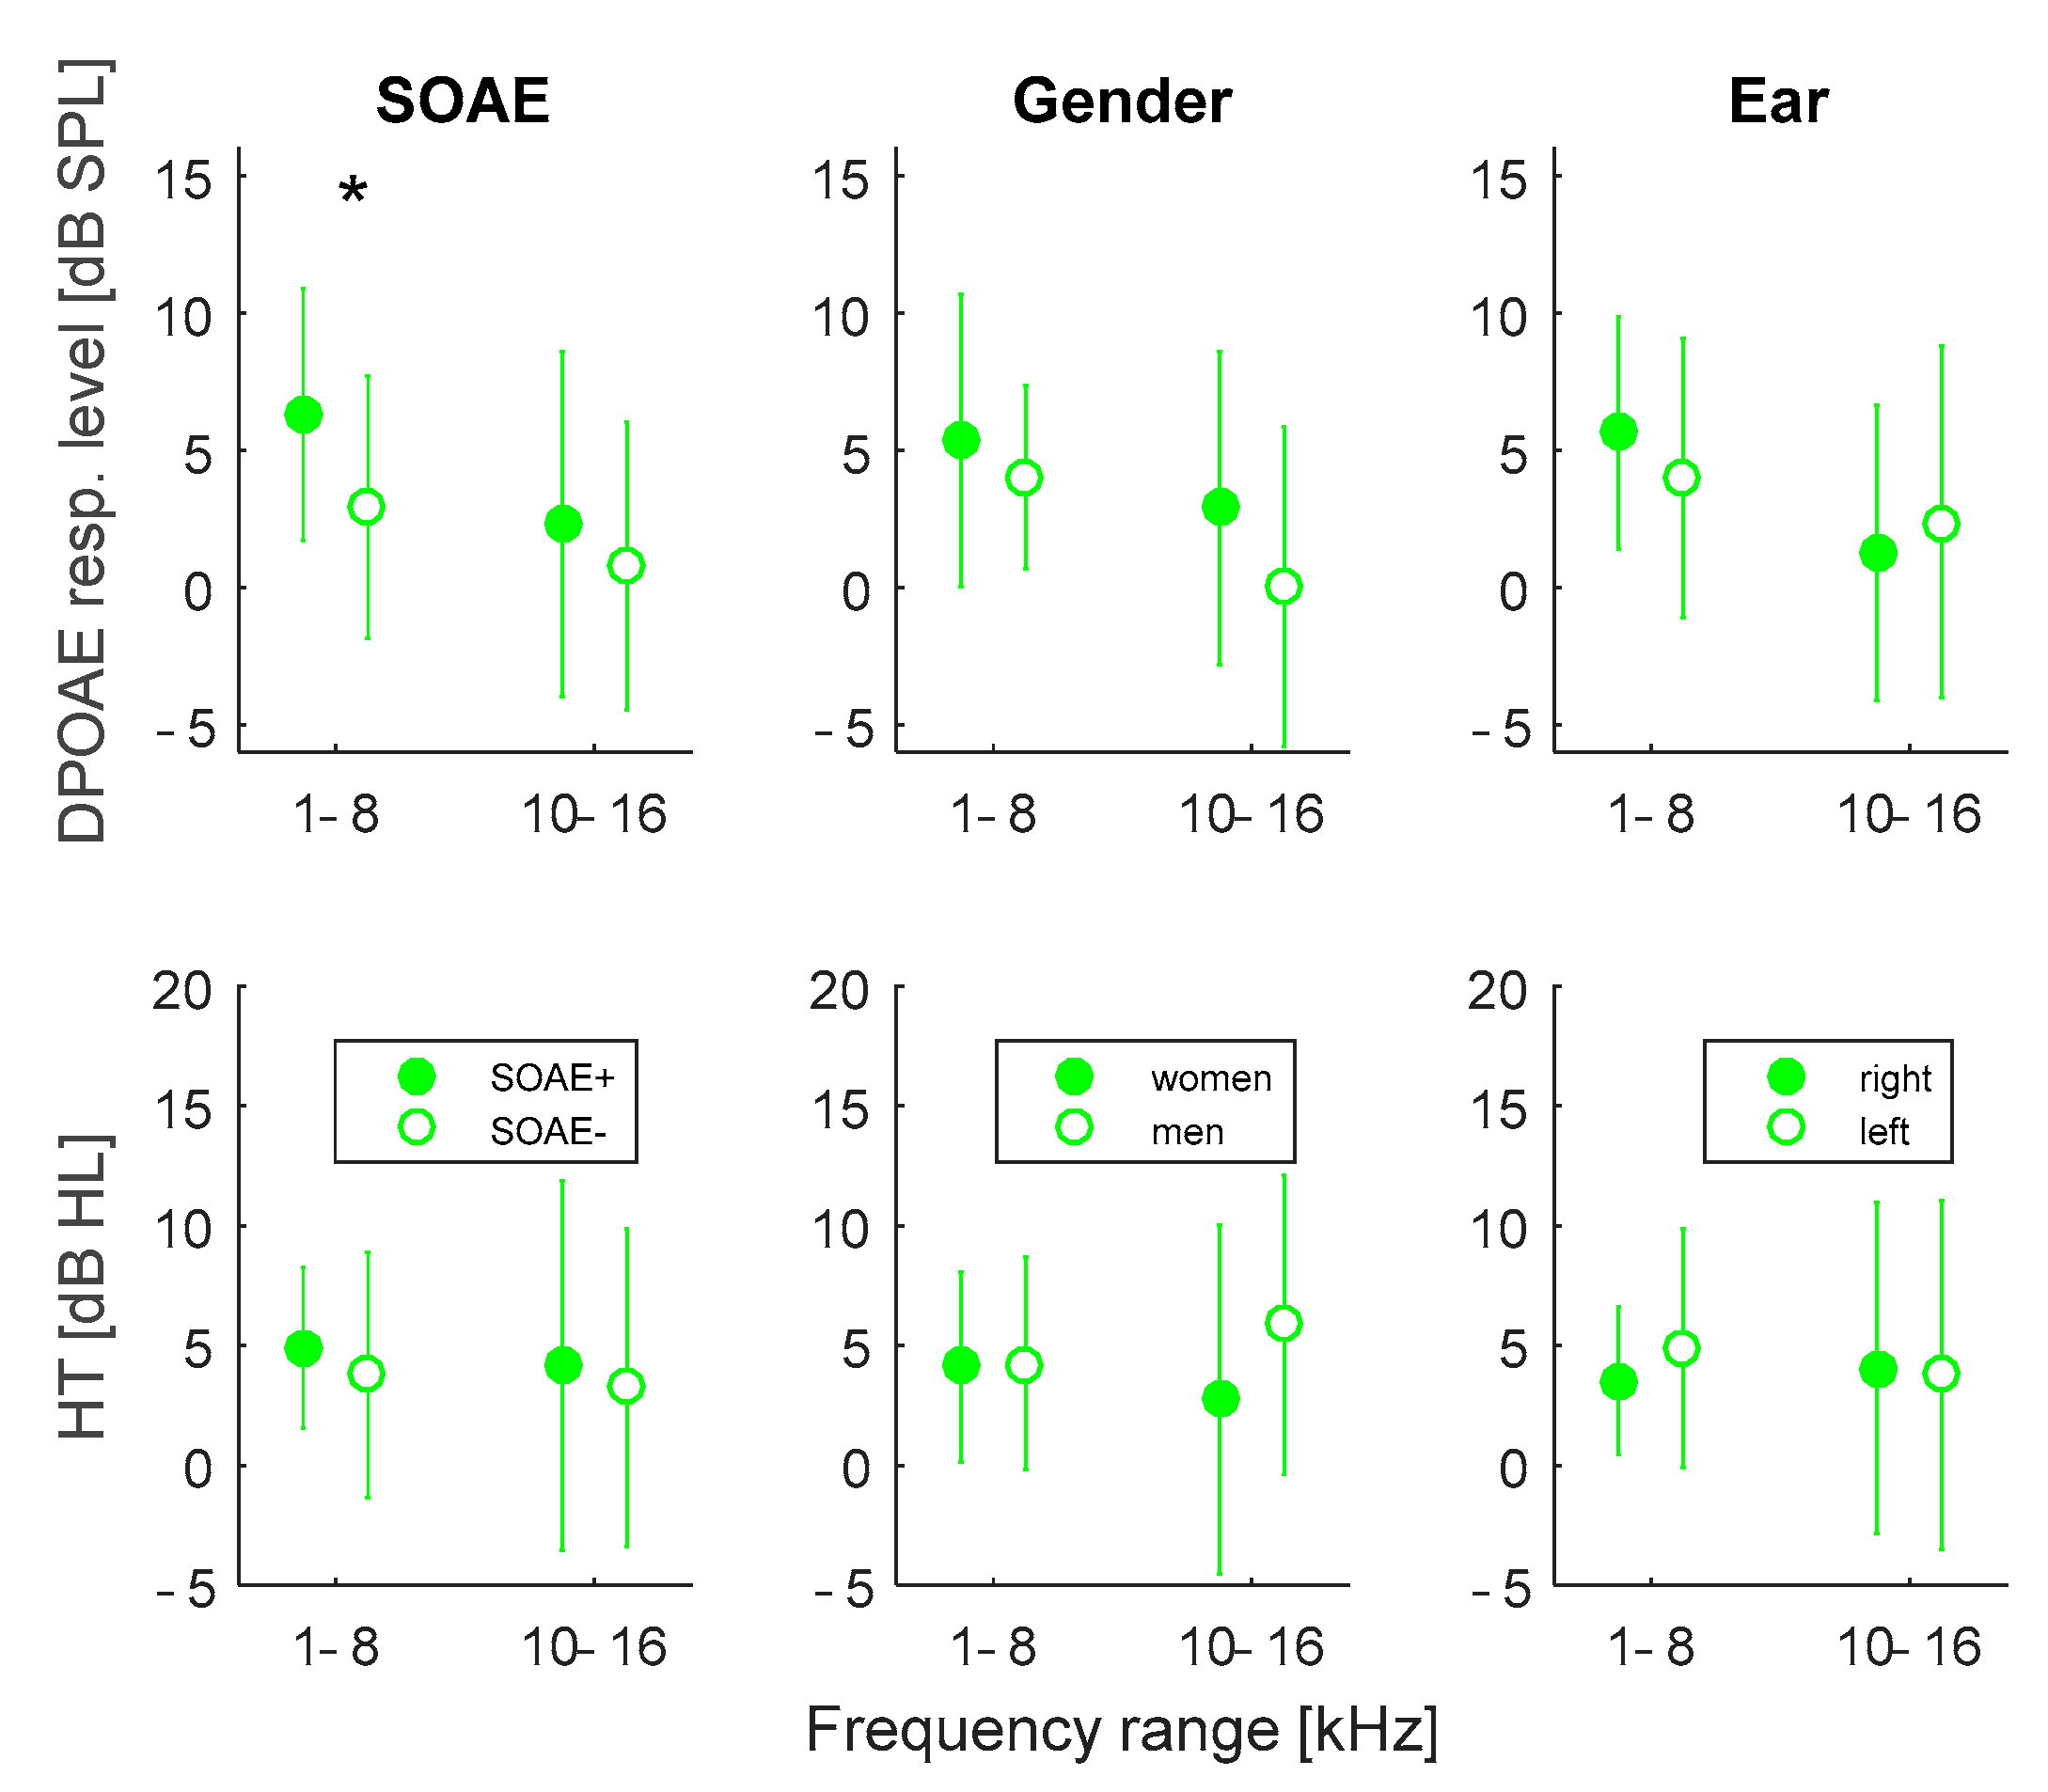
3.3. Effects of SOAE Presence, Gender, and Ear Side

Figure 6 shows a comparison of DPOAEs and HTs for different frequency ranges, when the data for group G16 were divided by ears with and without SOAEs, by gender, and by left and right ears. There were 40 ears with SOAEs (SOAE+) and 34 without SOAEs (SOAE−). There were 28 men and 46 women, and 39 right and 35 left ears. The only significant difference was for average DPOAE response level in the SF range (top left), where ears with SOAEs had higher levels in that range than ears without SOAEs (by about 3 dB). Figure 6 shows that women had slightly higher DPOAEs than men, and that there was also a slight but nonsignificant advantage in the right ear. These differences were around 1.5 dB for the SF range but were not significant. For HTs, there were no significant differences.
A similar picture emerged for groups G8 and Gim (not shown), where again response levels only depended significantly on SOAE presence.

4. Discussion

This work has revisited some basic properties of HT and DPOAEs, with a focus on EHF. The novel aspect is the acquisition of DPOAEs in the 10–16 kHz (EHF) range using a commercial device, as opposed to existing studies which have relied mostly on custom equipment [33,37]. The main finding here is that DPOAEs, for both the SF and EHF bands, decrease as thresholds become worse. In both bands, DPOAEs and HTs depend strongly on age, even for those subjects who are classed as having a normal SF audiogram. However, for the EHF band, responses seem to be especially affected by age. Finally, it was found that there seem to be only minor (and not significant) differences in HTs and DPOAEs in terms of either gender or left versus right ear, with the only significant factor affecting DPOAE response levels being the presence of SOAEs.
This study has reproduced the well-known relationship between DPOAE level and HL, i.e., that DPOAE levels decrease as hearing becomes worse (e.g., [8,34]). It has also shown that, even when hearing is within normal limits in the SF range, in the EHF range DPOAE levels shift downwards in parallel with poorer thresholds; for these subjects, a similar relationship holds in the SF range. Comparable findings have been seen in previous work (e.g., [11,17,18,38]).
In all our age groups, DPOAEs and HTs worsened with increasing age, a finding which is similar to previous studies (e.g., [39,40]). This was true even in the G16 group, who had normal HTs over the whole tested range. The EHF range seems to be particularly affected by age, both for HTs and DPOAEs, as the correlation coefficients were higher for that range. Our data do not indicate whether the decline with age depends on age alone or whether additional factors like lifetime noise exposure are at play, as this aspect was not investigated here. Nevertheless, both HTs and DPOAEs in the EHF range may be particularly useful when investigating presbycusis.
Previous studies have reported that there are significant differences in DPOAEs depending on ear and gender, i.e., higher levels for right ears and for women [41]. Although these tendencies can be seen in our dataset, they were not significant. They may be significant in a larger dataset, and they may be more pronounced with TEOAEs (e.g., [42]). In reporting gender differences, some older studies have described differences in DPOAEs for the SF range (e.g., [16,41,43]), whereas a more recent study reported no differences for the SF range but a significant difference for the EHF range [44]. The results obtained in the present work fall more or less in the middle. A difference between men and women was apparent for SF, and widened for EHF, but was still not significant. As mentioned earlier, a unifying hypothesis could be that there is indeed a gender effect on DPOAEs, but it is small, and can only be distinguished with either very large datasets or data of high quality (as in [44]).
We found that the effect of SOAEs on DPOAE response level was significant only for the SF range. This agrees with Schmuziger et al. [16]. In the EHF range, DPOAE response levels were slightly higher for ears with SOAEs than for those without, but the difference was not significant. Looking at HTs, there were no significant differences for either range between ears with or without SOAEs. Previous studies have shown some contradictory results in this area. Some have shown that in ears with SOAEs, HTs were better in the SF range than for ears without SOAEs but were no different in the EHF range [45]; other work has shown the opposite, i.e., better thresholds in the EHF range [16]. This discrepancy is hard to explain as the sizes of study groups were comparable between our work and the previously mentioned studies. Our results seem to be more closely aligned to those of Baiduc et al. [28], who also did not see any difference in HTs over the EHF range for ears with or without SOAEs.
In general, it seems that factors like ear side, gender, and SOAE presence exert only minor effects on both DPOAEs and HTs in the ST and EHF ranges. Such effects may be more detectable in bigger datasets. Nevertheless, it seems that these effects are probably not important when measuring routine DPOAEs and EHFs in clinical practice.
Some limitations of our study should be mentioned. Although the numbers in our study group were quite large compared to other OAE studies, a greater number of significant relations may emerge if the numbers were increased.
There is also the important issue of calibration, which becomes increasingly difficult for frequencies over 8 kHz due to the generation of standing waves in the ear canal. In our work, this seemed to be the case for EHF DPOAEs at 12 kHz, where DPOAEs appeared to be present even though the HT was around 60 dB HL—a level which should effectively rule out DPOAEs (since DPOAEs are usually present only for HTs better than around 40 dB HL). Therefore, the most likely explanation for recording DPOAE-like responses at 12 kHz is that standing waves are present at this frequency, caused by reflections within the ear canal. The side-effect is that it becomes difficult to tell whether the measurements represent true OAEs or artifacts (see [46]). This problem can be overcome with advanced methods, but these are beyond the capabilities of a commercial OAE system. Employing denser frequency points for DPOAEs may help, as here, in order to speed up measurements, fewer points were chosen. Nevertheless, Figure 3 does show that, at 12 kHz, the better the HL, the higher the DPOAEs—so despite some possible contamination by artifacts, it does seem that some real responses were detected. Furthermore, it seems that at 10 and 16 kHz DPOAEs were not contaminated by standing waves, as the responses declined in line with hearing loss. In Figure 3, the DPOAEs for G16 responses were well above the noise level, although for G8 and Gim they approached this level.
Finally, it should be mentioned that there are still unsolved standardization problems involving different OAE equipment and analysis methods, meaning that each may produce a different result (e.g., [47]). This may explain differences between our findings and those of other studies, which have looked at the effect of SOAEs on HTs and DPOAEs. Despite this note of uncertainty, our study confirms the results of earlier works that have shown that HTs and DPOAEs in the EHF band seem to show promise for identifying early signs of hearing loss [17,48,49].

5. Conclusions

Despite some identified technological limitations, DPOAEs in the EHF range seem to correlate with HTs in this range. It seems that impaired DPOAE levels, both in the SF and EHF bands, could be useful warning signs of incipient hearing decline. Additionally, it is clear that DPOAE and HT levels decline systematically with age, even for subjects with more or less normal hearing up to 16 kHz, and this effect is especially prominent for EHFs. In this way, EHFs may be especially suitable for investigating the onset of presbycusis. At the same time, when measuring DPOAEs, the effects of SOAE presence, gender, and ear side seem to be only minor factors.

Author Contributions

Conceptualization, W.W.J., K.K. and H.S.; methodology, W.W.J. and K.K.; formal analysis, W.W.J.; investigation, W.W.J., E.P., M.P., K.K. and H.S.; resources, E.P. and M.P.; data curation, E.P.; writing—original draft preparation, W.W.J. and M.P.; writing—review and editing, W.W.J., E.P., M.P., K.K. and H.S.; visualization, W.W.J.; supervision, K.K. and H.S.; project administration, K.K. and H.S. All authors have read and agreed to the published version of the manuscript.

Funding

This research received no external funding.

Institutional Review Board Statement

The study was conducted according to the guidelines of the Declaration of Helsinki and approved by the Ethics Committee of the Institute of Physiology and Pathology of Hearing, Poland (approval No. IFPS:KB/13/2014).

Informed Consent Statement

Informed consent was obtained from all subjects involved in the study.

Data Availability Statement

The data underlying this article will be shared on reasonable request to the corresponding authors.

Acknowledgments

The authors would like to thank Andrew Bell for stimulating discussions on earlier versions of the manuscript.

Conflicts of Interest

The authors declare no conflict of interest.

References

  1. Hunter, L.L.; Monson, B.B.; Moore, D.R.; Dhar, S.; Wright, B.A.; Munro, K.J.; Zadeh, L.M.; Blankenship, C.M.; Stiepan, S.M.; Siegel, J.H. Extended high frequency hearing and speech perception implications in adults and children. Hear. Res. 2020, 397, 107922. [Google Scholar] [CrossRef]
  2. Kemp, D.T. Stimulated acoustic emissions from within the human auditory system. J. Acoust. Soc. Am. 1978, 64, 1386–1391. [Google Scholar] [CrossRef]
  3. Kemp, D.T. Otoacoustic emissions, their origin in cochlear function, and use. Br. Med. Bull. 2002, 63, 223–241. [Google Scholar] [CrossRef]
  4. Job, A.; Raynal, M.; Kossowski, M.; Studler, M.; Ghernaouti, C.; Baffioni-venturi, A.; Roux, A.; Darolles, C.; Guelorget, A. Otoacoustic detection of risk of early hearing loss in ears with normal audiograms: A 3-year follow-up study. Hear. Res. 2009, 251, 10–16. [Google Scholar] [CrossRef]
  5. Hao, J.; Fu, X.; Zhang, C.; Zhang, X.; Zhao, S.; Li, Y. Early detection of hearing impairment in patients with diabetes mellitus with otoacoustic emission. A systematic review and meta-analysis. Acta Oto-Laryngol. 2016, 137, 179–185. [Google Scholar] [CrossRef]
  6. Glavin, C.C.; Siegel, J.; Dhar, S. Distortion Product Otoacoustic Emission (DPOAE) Growth in Aging Ears with Clinically Normal Behavioral Thresholds. J. Assoc. Res. Otolaryngol. 2021, 22, 659–680. [Google Scholar] [CrossRef]
  7. Paping, D.E.; van der Schroef, M.; Helleman, H.W.; Goedegebure, A.; Baatenburg de Jong, R.J.; Vroegop, J.L. Distortion Product Otoacoustic Emissions in Screening for Early Stages of High-frequency Hearing Loss in Adolescents. Noise Health 2022, 24, 20–26. [Google Scholar]
  8. Gorga, M.P.; Neely, S.T.; Bergman, B.M.; Beauchaine, K.L.; Kaminski, J.R.; Peters, J.; Schulte, L.; Jesteadt, W. A comparison of transient-evoked and distortion product otoacoustic emissions in normal-hearing and hearing-impaired subjects. J. Acoust. Soc. Am. 1993, 94, 2639–2648. [Google Scholar] [CrossRef]
  9. Jedrzejczak, W.W.; Kochanek, K.; Trzaskowski, B.; Pilka, E.; Skarzynski, P.H.; Skarzynski, H. Tone-Burst and Click-Evoked Otoacoustic Emissions in Subjects with Hearing Loss Above 0.25, 0.5, and 1 kHz. Ear Hear. 2012, 33, 757–767. [Google Scholar] [CrossRef]
  10. Zhang, V.W.; McPherson, B.; Shi, B.X.; Tang, J.L.; Wong, B.Y. Neonatal hearing screening: A combined click evoked and tone burst otoacoustic emission approach. Int. J. Pediatr. Otorhinolaryngol. 2008, 72, 351–360. [Google Scholar] [CrossRef]
  11. Arnold, D.J.; Lonsbury-Martin, B.L.; Martin, G.K. High-Frequency Hearing Influences Lower-Frequency Distortion-Product Otoacoustic Emissions. Arch. Otolaryngol. Neck Surg. 1999, 125, 215. [Google Scholar] [CrossRef] [PubMed]
  12. Marshall, L.; Lapsley Miller, J.A.; Heller, L.M. Distortion-Product Otoacoustic Emissions as a Screening Tool for Noise-Induced Hearing Loss. Noise Health 2001, 3, 43–60. [Google Scholar] [PubMed]
  13. Kapoor, N.; Mani, K.V.; Shukla, M. Distortion product oto-acoustic emission: A superior tool for hearing assessment than pure tone audiometry. Noise Health 2019, 21, 164–168. [Google Scholar]
  14. Mishra, S.K.; Saxena, U.; Rodrigo, H. Extended High-frequency Hearing Impairment Despite a Normal Audiogram: Relation to Early Aging, Speech-in-noise Perception, Cochlear Function, and Routine Earphone Use. Ear Hear. 2022, 43, 822–835. [Google Scholar] [CrossRef]
  15. Mishra, S.K.; Saxena, U.; Rodrigo, H. Hearing Impairment in the Extended High Frequencies in Children Despite Clinically Normal Hearing. Ear Hear. 2022, 43, 1653–1660. [Google Scholar] [CrossRef]
  16. Schmuziger, N.; Probst, R.; Smurzynski, J. Otoacoustic emissions and extended high-frequency hearing sensitivity in young adults Emisiones otoacústicas y sensibilidad extendida a frecuencias altas en adultos jóvenes. Int. J. Audiol. 2005, 44, 24–30. [Google Scholar] [CrossRef]
  17. Al-Malky, G.; Suri, R.; Dawson, S.J.; Sirimanna, T.; Kemp, D. Aminoglycoside antibiotics cochleotoxicity in paediatric cystic fibrosis (CF) patients: A study using extended high-frequency audiometry and distortion product otoacoustic emissions. Int. J. Audiol. 2011, 50, 112–122. [Google Scholar] [CrossRef]
  18. Mepani, A.M.; Kirk, S.A.; Hancock, K.E.; Bennett, K.; de Gruttola, V.; Liberman, M.C.; Maison, S.F. Middle Ear Muscle Reflex and Word Recognition in “Normal-Hearing” Adults. Ear Hear. 2020, 41, 25–38. [Google Scholar] [CrossRef]
  19. Gravel, J.S.; Roberts, J.E.; Roush, J.; Grose, J.; Besing, J.; Burchinal, M.; Neebe, E.; Wallace, I.F.; Zeisel, S. Early Otitis Media with Effusion, Hearing Loss, and Auditory Processes at School Age. Ear Hear. 2006, 27, 353–368. [Google Scholar] [CrossRef]
  20. Probst, R.; Lonsbury-Martin, B.L.; Martin, G.K. A review of otoacoustic emissions. J. Acoust. Soc. Am. 1991, 89, 2027–2067. [Google Scholar] [CrossRef]
  21. Kuroda, T. Clinical investigation on spontaneous otoacoustic emission (SOAE) in 447 ears. Auris Nasus Larynx 2007, 34, 29–38. [Google Scholar] [CrossRef]
  22. Penner, M.J.; Zhang, T. Prevalence of spontaneous otoacoustic emissions in adults revisited. Hear. Res. 1997, 103, 28–34. [Google Scholar] [CrossRef] [PubMed]
  23. Jedrzejczak, W.W.; Blinowska, K.J.; Kochanek, K.; Skarzynski, H. Synchronized spontaneous otoacoustic emissions analyzed in a time-frequency domain. J. Acoust. Soc. Am. 2008, 124, 3720–3729. [Google Scholar] [CrossRef]
  24. Kulawiec, J.T.; Orlando, M.S. The Contribution of Spontaneous Otoacoustic Emissions to the Click Evoked Otoacoustic Emissions. Ear Hear. 1995, 16, 515–520. [Google Scholar] [CrossRef]
  25. Jedrzejczak, W.W.; Koziel, M.; Kochanek, K.; Skarzynski, H. Otoacoustic Emissions in Smoking and Nonsmoking Young Adults. Clin. Exp. Otorhinolaryngol. 2015, 8, 303. [Google Scholar] [CrossRef]
  26. Kuroda, T.; Fukuda, S.; Chida, E.; Kashiwamura, M.; Matsumura, M.; Ohwatari, R.; Inuyama, Y. Effects of spontaneous otoacoustic emis-sions on distortion product otoacoustic emission. Auris Nasus Larynx. 2001, 28, 33–38. [Google Scholar] [CrossRef]
  27. McFadden, D.; Mishra, R. On the relation between hearing sensitivity and otoacoustic emissions. Hear. Res. 1993, 71, 208–213. [Google Scholar] [CrossRef]
  28. Baiduc, R.R.; Lee, J.; Dhar, S. Spontaneous otoacoustic emissions, threshold microstructure, and psychophysical tuning over a wide frequency range in humans. J. Acoust. Soc. Am. 2014, 135, 300–314. [Google Scholar] [CrossRef]
  29. Dreisbach, L.E.; Siegel, J.H. Distortion-product otoacoustic emissions measured at high frequencies in humans. J. Acoust. Soc. Am. 2001, 110, 2456–2469. [Google Scholar] [CrossRef]
  30. Hecker, D.J.; Lohscheller, J.; Bader, C.A.; Delb, W.; Schick, B.; Dlugaiczyk, J. A new method to analyze distortion product otoacoustic emissions (DPOAEs) in the high-frequency range up to 18 kHz using windowed periodograms. IEEE Trans. Biomed. Eng. 2011, 58, 2369–2377. [Google Scholar] [CrossRef]
  31. Keefe, D.H.; Goodman, S.S.; Ellison, J.C.; Fitzpatrick, D.F.; Gorga, M.P. Detecting high-frequency hearing loss with click-evoked otoacoustic emissions. J. Acoust. Soc. Am. 2011, 129, 245–261. [Google Scholar] [CrossRef]
  32. Poling, G.L.; Siegel, J.H.; Lee, J.; Lee, J.; Dhar, S. Characteristics of the 2f1-f2 distortion product otoacoustic emission in a normal hearing population. J. Acoust. Soc. Am. 2014, 135, 287–299. [Google Scholar] [CrossRef]
  33. Poling, G.L.; Vlosich, B.; Dreisbach, L.E. Emerging Distortion Product Otoacoustic Emission Techniques to Identify Preclinical Warning Signs of Basal Cochlear Dysfunction Due to Ototoxicity. Appl. Sci. 2019, 9, 3132. [Google Scholar] [CrossRef]
  34. Jedrzejczak, W.W.; Pilka, E.; Ganc, M.; Kochanek, K.; Skarzynski, H. Ultra-High Frequency Distortion Product Otoacoustic Emissions for Detection of Hearing Loss and Tinnitus. Int. J. Environ. Res. Public Health 2022, 19, 2123. [Google Scholar] [CrossRef]
  35. Ratner, B. The correlation coefficient: Its values range between +1/−1, or do they? J. Target. Meas. Anal. Mark. 2009, 17, 139–142. [Google Scholar] [CrossRef]
  36. Benjamini, Y.; Hochberg, Y. Controlling the False Discovery Rate: A Practical and Powerful Approach to Multiple Testing. J. R. Stat. Soc. 1995, 57, 289–300. [Google Scholar] [CrossRef]
  37. Bramhall, N.F.; McMillan, G.P.; Mashburn, A.N. Subclinical Auditory Dysfunction: Relationship Between Distortion Product Otoacoustic Emissions and the Audiogram. Am. J. Audiol. 2021, 30, 854–869. [Google Scholar] [CrossRef]
  38. Dreisbach, L.E.; Torre III, P.; Kramer, S.J.; Kopke, R.; Jackson, R.; Balough, B. Influence of Ultrahigh-Frequency Hearing Thresholds on Distortion-Product Otoacoustic Emission Levels at Conventional Frequencies. J. Am. Acad. Audiol. 2008, 19, 325–336. [Google Scholar] [CrossRef]
  39. Yeend, I.; Beach, E.F.; Sharma, M.; Dillon, H. The effects of noise exposure and musical training on suprathreshold auditory processing and speech perception in noise. Hear. Res. 2017, 353, 224–236. [Google Scholar] [CrossRef]
  40. Aziz, A.; Md Daud, M.K.; Nik Othman, N.A.; Abd Rahman, N. Early Detection of High-frequency Presbycusis Among Normal Hearing Individuals. Otol. Neurotol. 2020, 41, e989–e992. [Google Scholar] [CrossRef]
  41. Engdahl, B. Otoacoustic Emissions in the General Adult Population of Nord-Trondelag, Norway: I. Distributions by Age, Gender, and Ear Side. Int. J. Audiol. 2002, 41, 64–77. [Google Scholar] [CrossRef]
  42. Robinette, M.S. Clinical Observations with Evoked Otoacoustic Emissions at Mayo Clinic. J. Am. Acad. Audiol. 2003, 14, 213–224. [Google Scholar] [CrossRef]
  43. Cacace, A.T.; McClelland, W.A.; Weiner, J.; McFarland, D.J. Individual differences and the reliability of 2F1-F2 distortion-product otoacoustic emissions: Effects of time-of-day, stimulus variables, and gender. J. Speech Hear. Res. 1996, 39, 1138–1148. [Google Scholar] [CrossRef]
  44. Dunckley, K.T.; Dreisbach, L.E. Gender effects on high frequency distortion product otoacoustic emissions in humans. Ear Hear. 2004, 25, 554–564. [Google Scholar] [CrossRef]
  45. Avan, P.; Elbez, M.; Bonfils, P. Click-evoked otoacoustic emissions and the influence of high-frequency hearing losses in humans. J. Acoust. Soc. Am. 1997, 101, 2771–2777. [Google Scholar] [CrossRef]
  46. Souza, N.N.; Dhar, S.; Neely, S.T.; Siegel, J.H. Comparison of nine methods to estimate ear-canal stimulus levels. J. Acoust. Soc. Am. 2014, 136, 1768–1787. [Google Scholar] [CrossRef]
  47. Jedrzejczak, W.W.; Gos, E.; Pilka, E.; Skarzynski, P.H.; Skarzynski, H.; Hatzopoulos, S. Pitfalls in the Detection of Hearing Loss via Otoacoustic Emissions. Appl. Sci. 2021, 11, 2184. [Google Scholar] [CrossRef]
  48. Trzaskowski, B.; Jędrzejczak, W.W.; Piłka, E.; Cieślicka, M.; Skarżyński, H. Otoacoustic Emissions before and after Listening to Music on a Personal Player. Med. Sci. Monit. 2014, 20, 1426–1431. [Google Scholar] [CrossRef]
  49. Dudarewicz, A.; Zamojska-Daniszewska, M.; Zaborowski, K.; Pawlaczyk-Łuszczyńska, M. Hearing status of people occupationally exposed to ultrasonic noise. Int. J. Occup. Med. Environ. Health 2022, 35, 309–325. [Google Scholar] [CrossRef]
Figure 1. Flowchart of examinations performed.
Applsci 13 10311 g001
Figure 2. Average pure tone hearing thresholds (HTs) in test subjects divided into three groups according to hearing acuity: G16—thresholds equal to or better than 25 dB HL for all frequencies up to 16 kHz (green); G8—thresholds equal to or better than 25 dB HL up to 8 kHz (blue); and Gim—impaired, thresholds worse than 25 dB HL at one or more frequencies (red). Whiskers indicate standard deviations. Asterisks mark significant differences between groups.
Applsci 13 10311 g002
Figure 3. Average DPOAE response levels for all tested frequencies for the three groups—G16, G8, and Gim (as described in Figure 2). Dashed lines represent average noise levels for each group. Whiskers indicate standard deviations. Asterisks mark significant differences between groups.
Applsci 13 10311 g003
Figure 4. Average DPOAE response levels for 1–8 kHz and 10–16 kHz as a function of age for all three groups (G16, G8, and Gim). Linear fits to the data are shown (lines), along with correlation coefficients (r) and significance (p).
Applsci 13 10311 g004
Figure 5. Average hearing thresholds (HTs) for 1–8 kHz and 10–16 kHz as a function of age for all three groups (G16, G8, and Gim). Linear fits to the data are shown (lines), along with correlation coefficients (r) and significance (p).
Applsci 13 10311 g005
Figure 6. DPOAE response level and hearing threshold (HT) in group G16 when the group is split according to SOAE presence (SOAE+/SOAE–), gender (women/men), and ear side (right/left). Asterisk indicates a significant difference (p < 0.05).
Applsci 13 10311 g006
Table 1. Calculated correlation coefficients (with adjustment for other variables) between average DPOAEs and hearing thresholds (HTs).
DPOAE 1–8 kHzDPOAE 10–16 kHzAge
HT 1–8 kHz−0.31 ***−0.050.24 **
HT 10–16 kHz−0.22 **−0.17 *0.78 ***
* p < 0.05; ** p < 0.01; *** p < 0.001.
Disclaimer/Publisher’s Note: The statements, opinions and data contained in all publications are solely those of the individual author(s) and contributor(s) and not of MDPI and/or the editor(s). MDPI and/or the editor(s) disclaim responsibility for any injury to people or property resulting from any ideas, methods, instructions or products referred to in the content.

