Article

Study of the Failure Mechanism of Soft Rock Mining Roadways Based on Limit Analysis Theory

1
School of Energy, Xi’an University of Science and Technology, Xi’an 710054, China
2
Key Laboratory of Mine Mining and Disaster Prevention in West China, Ministry of Education, Xi’an University of Science and Technology, Xi’an 710054, China
*
Author to whom correspondence should be addressed.
Appl. Sci. 2023, 13(18), 10323; https://doi.org/10.3390/app131810323
Submission received: 23 August 2023 / Revised: 10 September 2023 / Accepted: 12 September 2023 / Published: 14 September 2023

Abstract

:
To study the deformation and failure mechanisms of soft rock mining roadways, the 1506 return airway of Anyang Coal Mine is taken as the engineering background. Based on limit analysis theory, a failure model based on a rigid slider system is constructed to assess the failure of the soft rock surrounding a roadway. The formulas for calculating the self-weight power of the slider in the velocity discontinuity line of the rock surrounding the roadway, the work power of the surrounding rock pressure, and the energy dissipation rate of the velocity discontinuity line are derived, and the upper limit objective function of the velocity discontinuity line height is obtained. The failure characteristics and fracture evolution process of the surrounding rock under different mining stresses are analyzed by means of physical similarity simulations. The simulation results show that shear failure occurs first on the roadway side due to stress concentration. The fissures expand along the bottom angle of the roadway to the blind support area and the low-intensity support area. The cracks weaken the support strength of the angled anchor cable and bolt in the roadway shoulder. Under the action of roof pressure, the status of the rock mass inside and outside the shear slip zone changes from static to dynamic. This causes deformation and failure of the roadway roof, side, and floor.

1. Introduction

This study focuses on the complex engineering geological conditions of soft rock roadways. It is very important to maintain the stability and smoothness of soft rock mining roadways for the safe operation of mines [1,2]. Therefore, it is of great significance to study the failure mechanism of soft rock mining roadways. Many scholars in China have carried out in-depth research on the deformation and failure mechanisms and control technology of roadway-adjacent rock. Yuan Liang et al. [3,4] stated that the deformation and failure of roadways are related to many factors, which can be summarized into geological factors and external factors.
The physical and mechanical properties of weakly cemented strata are the most basic factors affecting the stability of rock surrounding a roadway [5,6]. Due to the different mineral compositions and structures of rock masses, the physical and mechanical properties of different rocks are very different [7]. Especially for expansive soft rock roadways [8], a high expansion stress will be generated during the water absorption process of hydrophilic minerals, which is unfavorable for the stability of roadway-adjacent rock. Chen, S. et al. [9] believed that the deformation of soft rock roadways is mainly due to the low strength of the roadway-adjacent rock and the high composition of argillaceous minerals, which leads to a mismatch between the surrounding rock and the supporting body under the action of groundwater. The influence of groundwater on the surrounding rock in the failure zone is mainly manifested in two aspects: one is the formation of hydrostatic pressure, and the other is the generation of hydrodynamic pressure. Under the condition of high ground stress, the rock mass is broken and joints and cracks develop. Under the action of groundwater, the groundwater flows along the cracks to the rock surrounding the roadway, which reduces the strength of the rock mass. With a change in hydrodynamic pressure, the deformation of the roadway is accelerated, which leads to the phenomena of roof fall and rib spalling in the surrounding rock and finally makes the roadway unstable. An increase in pore water pressure in rock can reduce the effective normal stress of rock, thus reducing the shear strength of the rock mass [10,11].
Du, B. et al. [12,13] believed that a high ground stress is the main reason for the deformation and failure of surrounding rock in deep soft rock roadways. Deep rock masses feature complex stress fields, mainly including the interaction of self-weight stress and tectonic stress generated by the overlying strata. With increasing excavation depths, the self-weight stress generated by the overlying strata also increases, and the stress in the rock surrounding the roadway is larger. Damage to the roadway support always begins at the weakest point. In most cases, the tectonic stress is larger than the self-weight stress and is highly variable. The tectonic stress is also very different in time and space, and its existence directly determines the stability of the roadway. Rheology is an important aspect of soft rock [14,15], and the deformation of roadways occurs over time. Soft rock is a kind of material with an obviously weak rheology. The rheological properties of such rocks mainly include creep and shrinkage. The soft rock mass not only has a fast rheological speed and large deformation but also obviously shows three stages of creep deformation. There is no obvious elastic stage in the stress–strain curve of a soft rock mass, and only a plastic rheological stage is observed.
The control theory of roadway-adjacent rock has achieved fruitful results, and the forms of support have also undergone major changes. The concept of support has changed from passive to active. The support of roadways has transformed from traditional shed supports to bolt supports [16,17,18]. Sun Xiaoming et al. proposed bolt–mesh–cable coupled support technology [19,20], the active pressure relief method [21,22], subregional and phased dynamic control technology [23,24], and prestressed truss anchor cable control technology from multiple perspectives [25] and realized the effective control of the deformation of the rock surrounding soft rock roadways. For the study of soft rock roadway support, we focus on soft rock, clarify the mechanical deformation mechanism and nonlinear deformation behavior of soft rock, identify the key aspects of support technology [26,27], and implement effective roadway support design to fundamentally solve the deformation problem of soft rock roadways.
From the above analysis, it can be seen that there are still many key problems to be solved urgently in the stability analysis of roadway-adjacent rock. It is necessary to carry out systematic and in-depth research on the failure model, scope and evolution law of roadways to establish a roadway stability analysis model more in line with engineering practice and put forward a scientific and reasonable solution method which provides a theoretical basis for the stability analysis of and control measures for roadways. The deformation and failure of roadway-adjacent rock is mainly due to the generation and expansion of cracks [28,29,30,31,32,33]. The energy principle is one of the most reliable analysis methods in geotechnical engineering and can well explain the failure process of roadway-adjacent rock [34]. The failure of the rock surrounding a roadway is essentially due to the energy flow and conversion within the rock unit. The energy dissipation is closely related to the damage state and failure mode of the rock [35,36]. Soft rock is inevitably accompanied by energy conversion in the process of load failure and crack propagation [37].
The limit analysis method studies the problem from the perspective of energy dissipation. Its theoretical model is simple and clear, and it is widely used in the analysis of practical engineering problems. The rigid slider model based on the assumption of the limit analysis method can conveniently analyze and consider the influence of various complex factors on the stability of roadway-adjacent rock. Therefore, this paper constructs a failure model of soft-rock-roadway-adjacent rock through the limit analysis theory in plastic mechanics and derives calculation formulas for the self-weight power of the slider in the velocity discontinuity line of the roadway-adjacent rock, the work power of the surrounding rock pressure and the energy dissipation rate of the velocity discontinuity line to obtain the upper limit objective function of the height of the velocity discontinuity line of the surrounding rock. Based on a soft rock mining roadway in the Anyang Coal Mine, the failure model, range and evolution pattern of the roadway are analyzed, and its evolution characteristics are verified by physical simulation tests to reveal the instability mechanism of the soft rock mining roadway.

2. Analysis of the Deformation and Failure of a Soft Rock Mining Roadway

2.1. Limit Analysis Theory

2.1.1. Upper Bound Limit Analysis Method

The upper bound limit analysis method is based on the principle of virtual work and the variational extremum theorem. It analyzes the problem from the perspective of the failure mode and energy dissipation of the loaded system and does not pay attention to whether the stress distribution of the system satisfies the static equilibrium condition. Its biggest feature is the establishment of a correct failure mode for the loaded system and a corresponding velocity field before solving the upper bound solution. The failure mode is mainly composed of a rigid slider and a velocity discontinuity line, where the rigid slider is separated by the velocity discontinuity line. In the plastic flow area, the velocity of the particle changes in size and direction along a line, which is called the velocity discontinuity line. It can also be considered as the boundary between the rigid zone (elastic zone) and the plastic zone. When failure occurs, the entire rigid slider motion system needs to meet the plastic flow and velocity compatibility conditions required by limit analysis theory and should also meet the strain–velocity compatibility conditions and velocity boundary conditions. According to the principle of virtual work, the power of the slider in the velocity discontinuity line by the external force is equal to the internal energy dissipation rate on the velocity discontinuity line. Its expression is
V σ ij ε ij d V = S T i v i d s + V X i v i d V
In this formula, σij is the stress tensor in the velocity field; εij is the strain rate in the velocity field; Ti is the surface force acting on boundary S; Xi is the body force vector acting in region V; and vi is the velocity vector on the velocity discontinuity line.

2.1.2. Basic Assumptions

When limit analysis theory is used to analyze and calculate the failure of soft rock mining roadways, the following assumptions need to be made first. The axis of the roadway is infinitely long and the research can be simplified into a two-dimensional plane strain problem. The rock surrounding the roadway is a Mohr-Coulomb material with a certain cohesion c and internal friction angle φ. The rock mass is an ideal elastic-plastic material and obeys the associated flow rule. The slider is a rigid block, and the volume remains unchanged during the failure process; that is, the volume strain is 0, so the energy dissipation is only generated on the velocity discontinuity line. The energy dissipation rate inside the rock surrounding the roadway is neglected. The shape of the roadway section is an equivalent rectangular section.

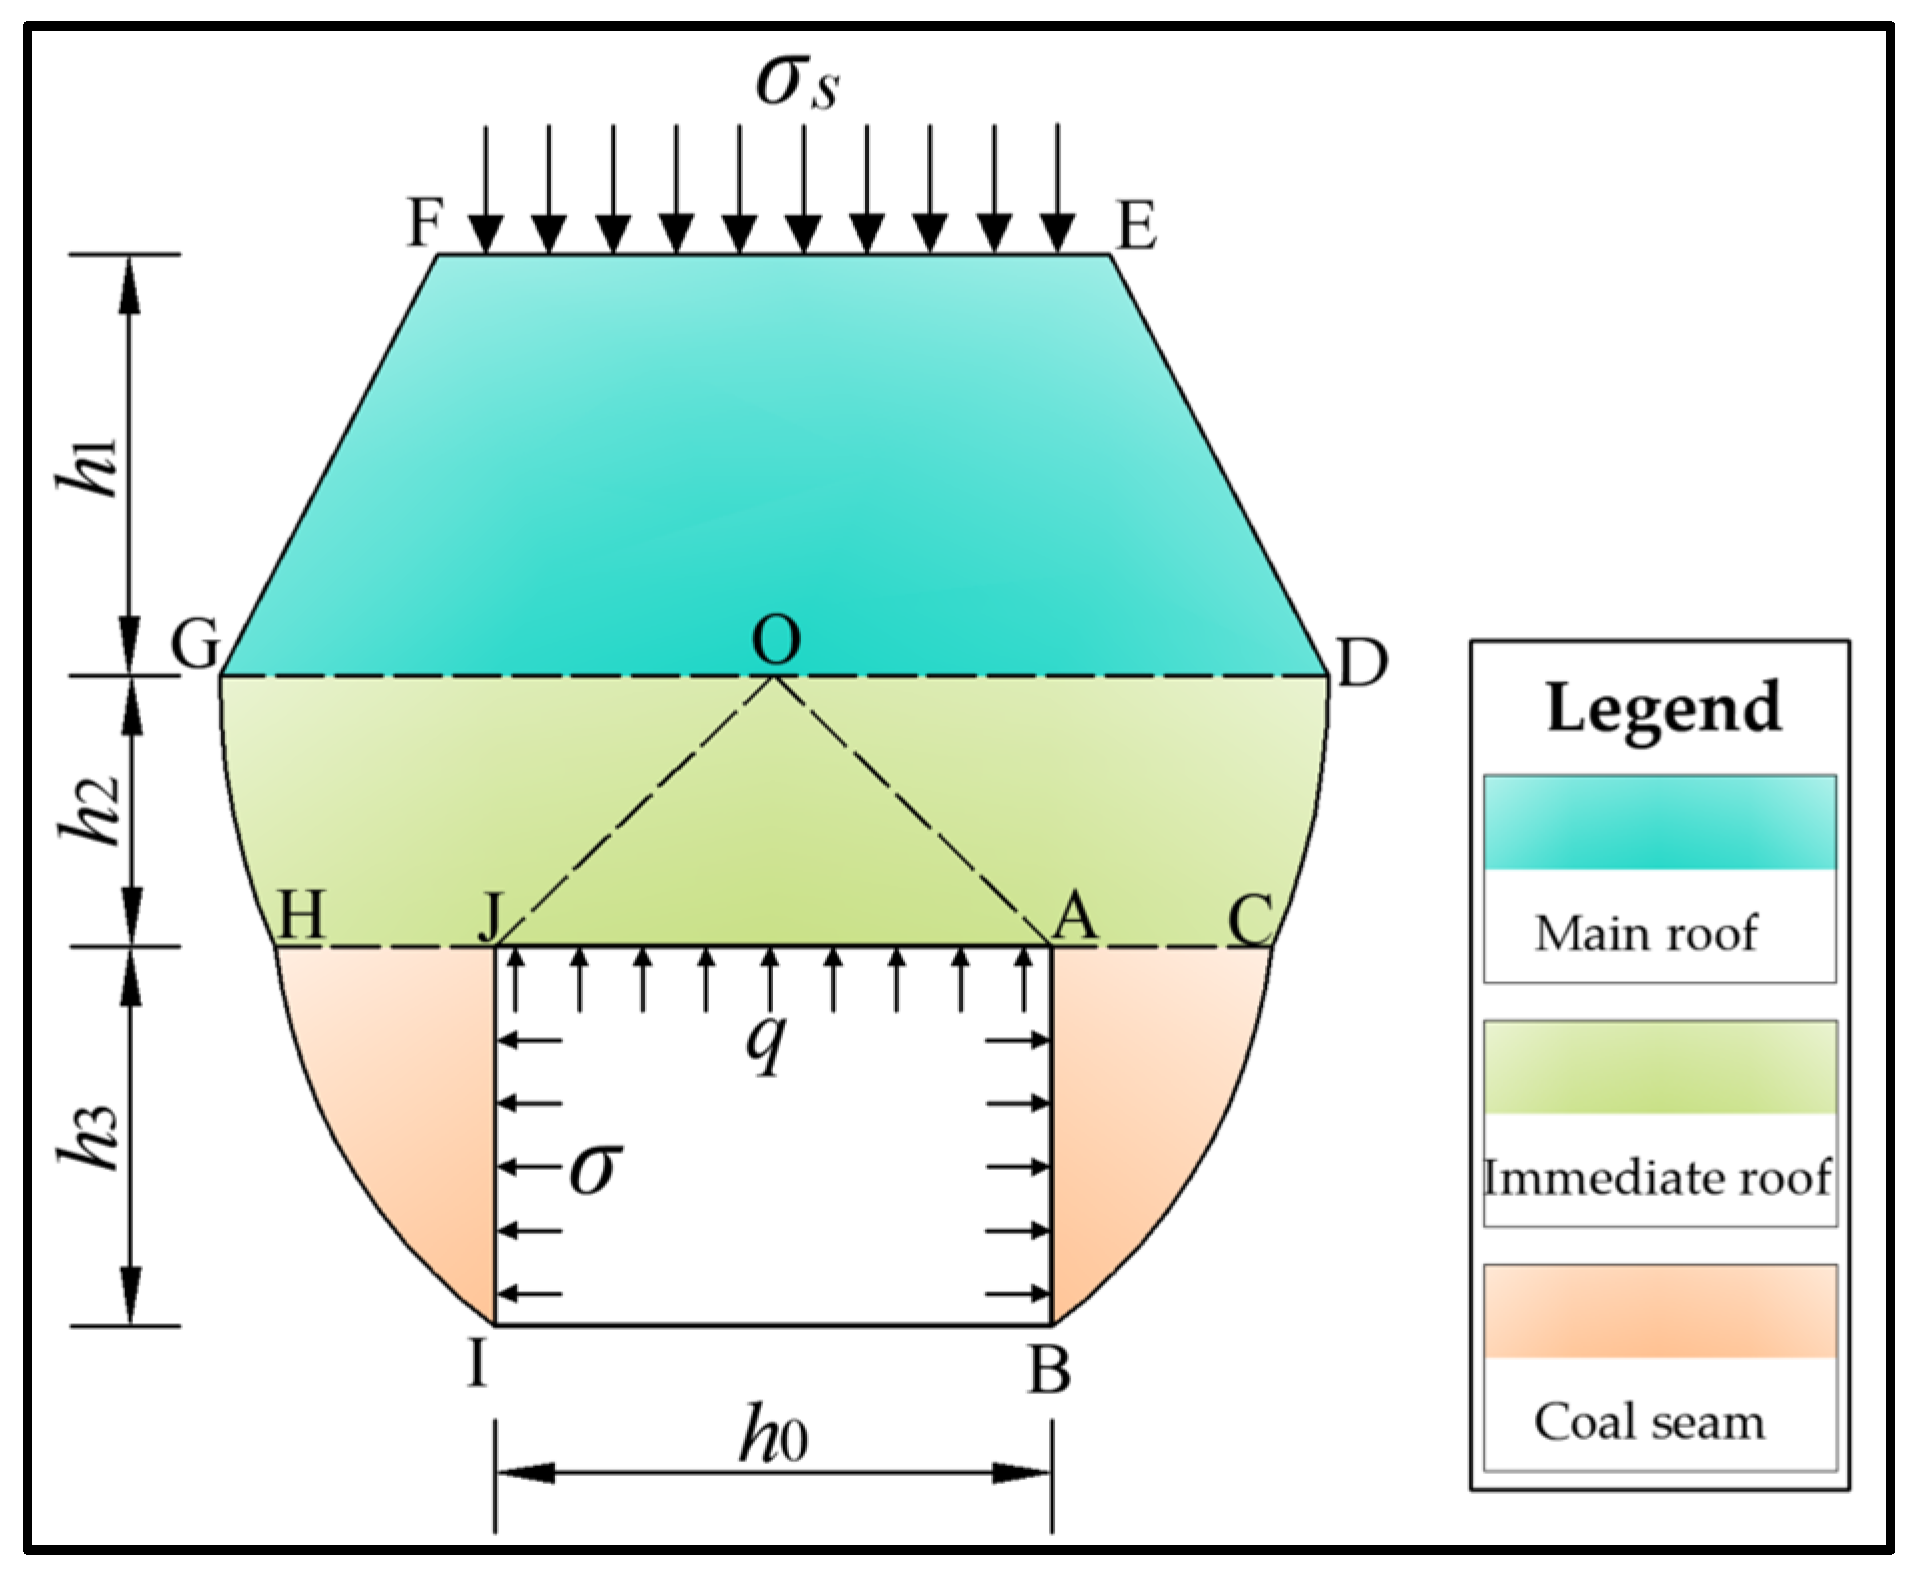
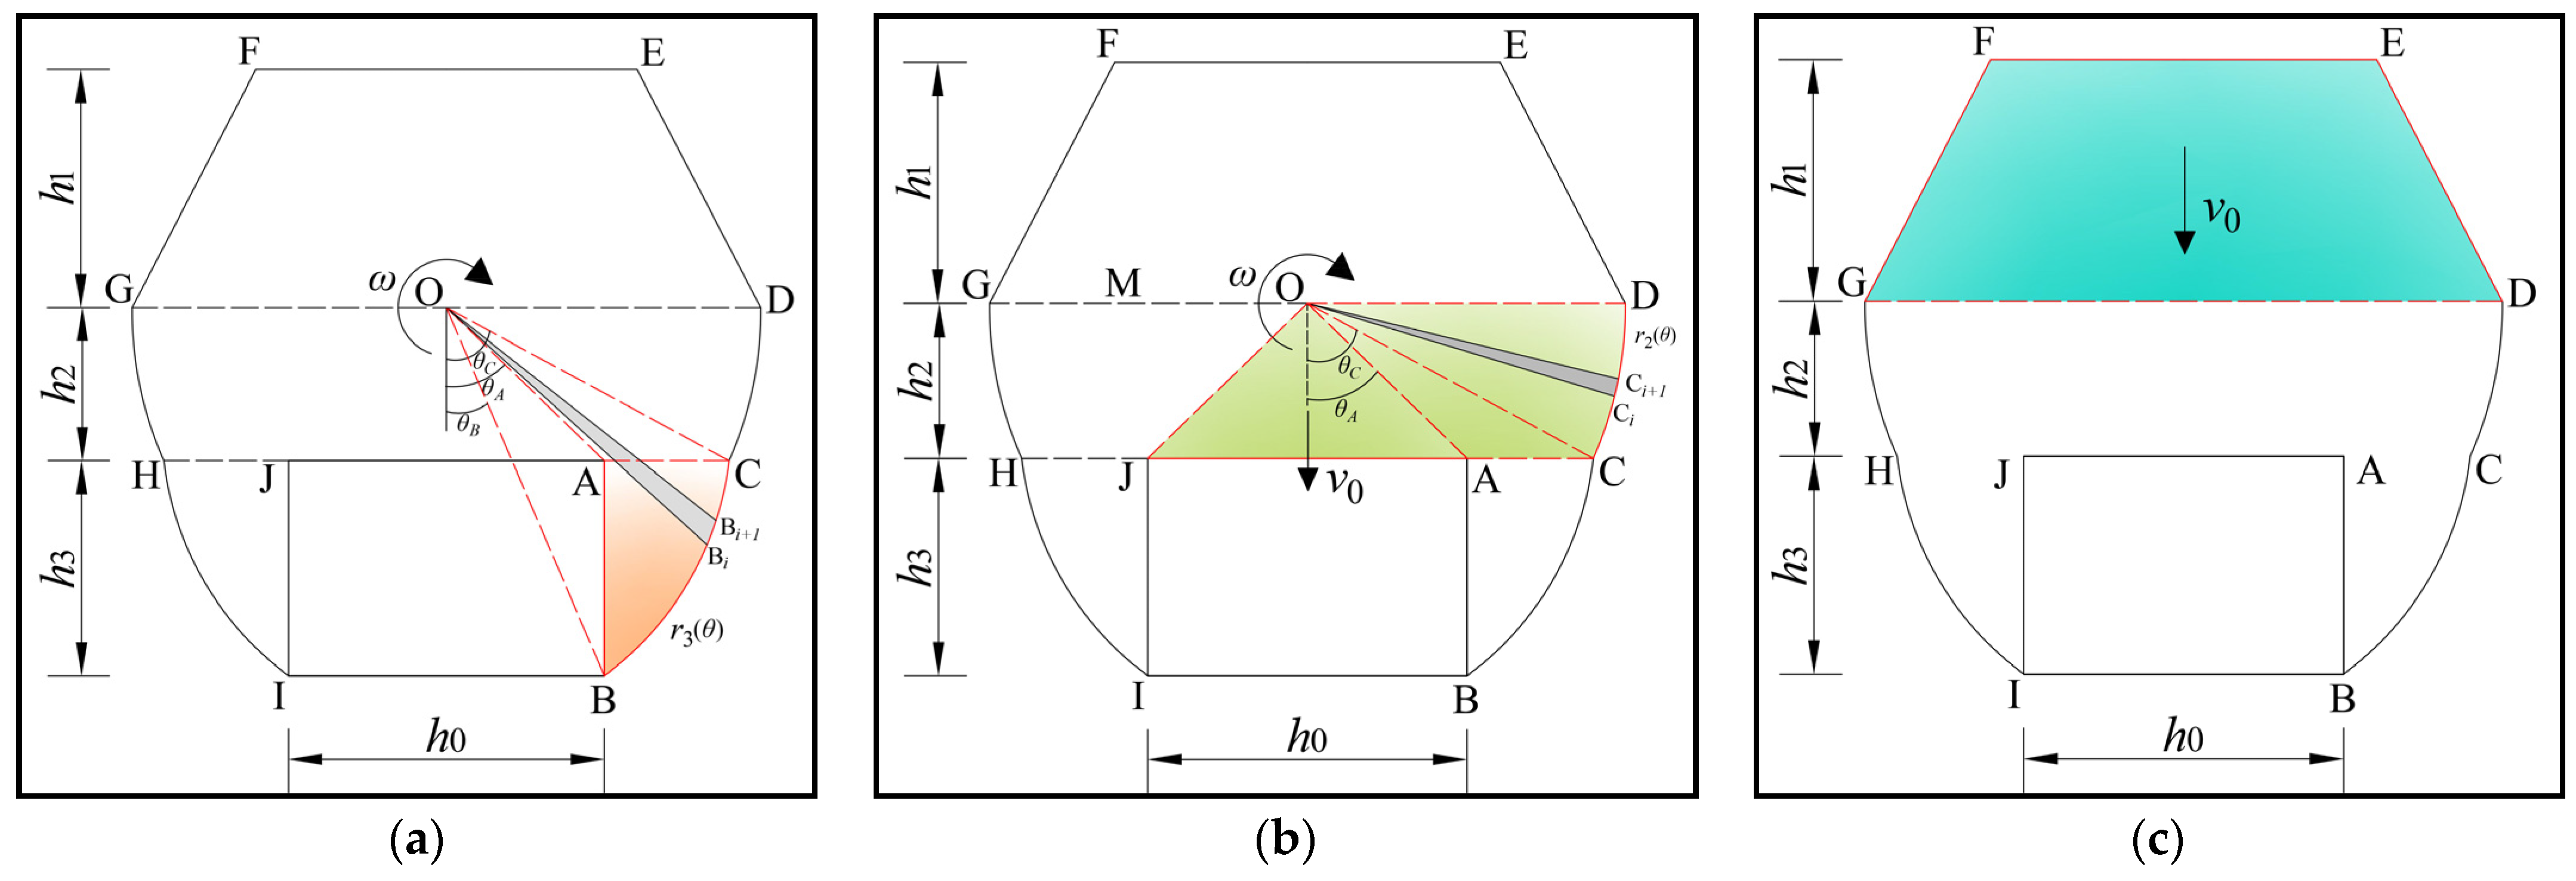
2.2. Construction of the Surrounding Rock Failure Mode of the Roadway

Using the upper bound limit analysis method, it is necessary to establish an accurate failure mode and the corresponding velocity field. The failure mode is composed of a series of rigid sliders. The absolute velocity and relative velocity of the rigid slider are obtained by using the velocity compatibility condition and the plastic flow equation. The failure mode reflects the essential characteristics of the surrounding rock when the roadway is under load, and its specific geometric shape is determined by a series of geometric parameters.
When the support strength of the roadway side is insufficient or the strength of the surrounding rock is small, a shear failure zone appears beside the roadway. The shear failure zone gradually extends upward with increasing confining pressure until the shear zone forms a stable pressure arch effect above the roadway. According to the failure characteristics of the rock surrounding the roadway, a calculation model of the failure mode of the rock surrounding the soft rock mining roadway is proposed, as shown in Figure 1. For the immediate roof and two sides with poor mechanical properties, the logarithmic spiral line is used to simulate the shear failure zone. For the basic roof with good mechanical properties, a straight line is used to simulate the shear failure zone. The two sides are composed of logarithmic spiral rigid sliders, and the velocity discontinuity line of the sliders on the roadway side is composed of two logarithmic spiral lines BC and HI. The velocity discontinuity line of the immediate top slider consists of two logarithmic spiral lines (CD and GH) and two straight lines (OA and OJ). Under the limit condition, the spiral slider rotates rigidly with angular velocity ω around point O, and relative motion occurs with the surrounding rock mass. The velocity vector of the slider velocity discontinuity line is not the same. The velocity discontinuity line of the main roof is composed of DE, EF, and FG. The velocity is v0 and the direction is vertical downward.
In the figure, h3 is the height of the roadway, h2 is the height of the direct roof of the roadway, and h1 is the height of the main roof failure. σ is the uniform support strength acting on the roadway side and σs is the load of the overlying strata. q is the support strength of the roadway roof. The shear strength parameters of the immediate roof and roadway side are c2, φ2 and c3, φ3. It follows that the logarithmic spiral CD expression r2(θ) and the BC expression r3(θ) are [38,39]:
{ r 2 ( θ ) = r OC e ( θ θ C ) tan φ 2 r 3 ( θ ) = r OB e ( θ θ B ) tan φ 3
In this formula, rOC is the length of polar OC, m; rOB is the length of the polar radius OB, m; θC is the angle between OC and the vertical direction, °; θB is the angle between OB and the vertical direction, °; θ is the variable polar angle, °; φ2 is the internal friction angle of the immediate roof, °; and φ3 is the internal friction angle of the coal side, °.

2.3. Energy Consumption Analysis of Roadway-Adjacent Rock

After the failure model is constructed, according to the upper bound theorem of limit analysis, an energy consumption balance equation is established by calculating the work power of the external force and the internal energy dissipation rate, and the upper bound solution of the height of the velocity discontinuity line is solved. The external forces discussed in this paper include the gravity γ of the coal and rock mass, the supporting forces q and σ of the surrounding rock, and the load of the σs overlying strata. The energy consumption balance equation is established as shown in Formula (3).
P γ + P q + P σ + P σ s = D
In this formula, Pγ is the gravity power of the slider in the velocity discontinuity line; Pq is the power of the roadway roof support pressure; Pσ is the power of the support pressure of the roadway side; Pσs is the power of the overlying strata load; and D is the energy dissipation rate on the velocity discontinuity line.

2.3.1. Calculation of the Gravity Power of the Slider in the Velocity Discontinuity Line

The gravity power of coal and rock sliders in the discontinuous line is calculated. First, the model is discretized, as shown in Figure 2. The gravity power Pγ can be obtained by adding the gravity power PABC, PCDGH, and PDEFG, as shown in Formula (4).
P γ = 2 P ABC + P CDGH + P DEFG
In this formula, Pγ is the total gravity power of the coal and rock mass in the velocity discontinuity line; PABC is the gravity power of the coal in the ABC of the roadway slider block; PCDGH is the gravity power of the direct top slider CDGH; and PDEFG is the gravity power of the basic top slider DEFG.
(1)
ABC gravity power PABC of the spiral slider on the roadway side
OA and AC divide the block OBC into three parts: OAC, OAB, and ABC. Therefore, the gravity power PABC of the spiral slider ABC can be obtained by POBC, POAC, and POAB, which can be expressed as:
P ABC = P OBC P OAC P OAB
In this formula, POBC is the gravity power of coal in sliding block OBC; POAC is the gravity power of coal in slider OAC; and POAB is the gravity power of coal in slider OAB.
The power POBC of the gravity of coal in the OBC slider is
P OBC = 1 3 γ 3 ω r OB 3 θ B θ C [ e ( θ θ B ) tan φ 3 ] 3 sin θ d θ = 1 3 γ 3 ω r OB 3 f 1
The powers POAC and POAB of coal gravity in the OAC and OAB sliders are solved similarly. The specific expressions can be expressed as
P OAC = 1 3 γ 3 ω h 2 3 θ A θ C sin θ co s 3 θ d θ = 1 3 γ 3 ω h 2 3 f 2
P OAB = 1 3 γ 3 ω h 0 3 θ B θ A 1 8 si n 2 θ d θ = 1 3 γ 3 ω h 0 3 f 3
In this formula, γ3 is the bulk density of coal, ω is the angular velocity, and f1, f2, and f3 are the coefficients.
f 1 = 1 1 + 9 ta n 2 φ 3 [ ( cos θ B 3 sin θ B tan φ 3 ) e 3 ( θ C θ B ) tan φ 3 ( cos θ C 3 sin θ C tan φ 3 ) ]
f 2 = ta n 2 θ C ta n 2 θ A 2
f 3 = cot θ B cot θ A 8
where θC can be obtained according to Formula (12).
{ r OC = r OB e ( θ C θ B ) tan φ 3 r OC = r OA cos θ A / cos θ C
(2)
Gravity power PCDGH of the direct roof slider CDGH of the roadway
The direct roof slider CDGH is divided into three parts: OCD, OAC, and AOJ. Therefore, the gravity power PCDGH of the direct roof slider CDGH can be obtained by calculating POCD, POAC, and PAOJ, which can be expressed as
P CDGH = 2 ( P OCD + P OAC ) + P AOJ
In this formula, PCDGH is the power of gravity of the direct roof slider CDGH; POCD is the power of gravity of the direct roof slider OCD; POAC is the power of gravity of the direct roof slider OAC; and PAOJ is the power of gravity of the direct roof slider AOJ.
The gravity power POCD of the direct roof slider OCD is
P OCD = 1 3 γ 2 ω r OC 3 θ C θ D [ e ( θ θ C ) tan φ 2 ] 3 sin θ d θ = 1 3 γ 2 ω r OC 3 f 4
Similarly, the power POAC for the gravity of the direct roof slider OAC is
P OAC = 1 3 γ 2 ω h 2 3 θ A θ C sin θ co s 3 θ d θ = 1 3 γ 2 ω h 2 3 f 5
P AOJ = 1 2 γ 2 h 0 h 2 v 0
In this formula, γ2 is the bulk density of the immediate roof, ω is the angular velocity, and f4 and f5 are the coefficients.
f 4 = 1 1 + 9 ta n 2 φ 2 [ ( cos θ C 3 sin θ C tan φ 2 ) e 3 ( θ D θ C ) tan φ 2 ( cos θ D 3 sin θ D tan φ 2 ) ]
f 5 = ta n 2 θ C ta n 2 θ A 2
(3)
DEFG gravity power PDEFG of the roadway main roof slider
The basic top slider area SDEFG can be calculated by Formula (19).
S DEFG = 1 2 h 1 ( 4 r OC e ( θ D θ C ) tan φ 2 h 1 tan φ 1 )
The calculation formula of the gravity power PDEFG of the basic top slider DEFG is as follows:
P DEFG = 1 2 γ 1 v 0 h 1 ( 4 r OC e ( θ D θ C ) tan φ 2 h 1 tan φ 1 )

2.3.2. Roadway Support Pressure and Overlying Strata Load Work Power

The calculation diagram of the support pressure and the working power of the overlying strata load is shown in Figure 3. The working power of the support pressure σ of the roadway side is
P σ = θ B θ A σ h 0 2 cos θ 4 si n 2 θ ω d θ = ω σ h 0 2 4 ( 1 sin θ A 1 sin θ B )
The working power of the direct roof support pressure q is
P q = q h 0 v 0
The expression of the work power of the overlying strata load σs is
P σ s = σ s v 0 ( 2 r OC e ( θ D θ C ) tan φ 2 h 1 tan φ 1 )

2.3.3. Energy Dissipation Rate on the Velocity Discontinuity Line

The velocity discontinuity lines of the basic roof, immediate roof, and roadway side are divided into three parts: D1, D2, and D3. Therefore, the energy dissipation rate D of the whole velocity discontinuity line can be obtained by adding D1, D2, and D3, which can be expressed as
D = D 1 + D 2 + D 3
In this formula, D is the total energy dissipation rate on the velocity discontinuity line; D1 is the energy dissipation rate on the basic vertex velocity discontinuity line; D2 is the energy dissipation rate on the direct roof velocity discontinuity line; and D3 is the total energy dissipation rate on the velocity discontinuity line of the roadway side.
(1)
Internal energy dissipation rate of the velocity discontinuity line in the roadway sidewall
The internal energy dissipation rate of discontinuity line BC is
D BC = θ B θ C c 3 ω r OB 2 e 2 [ ( θ θ B ) tan φ 3 ] d θ = c 3 ω r OB 2 2 tan φ 3 g 1
And the internal energy dissipation rate of the discontinuous line AC is obtained similarly.
D AC = c 3 ω θ A θ C ( h 2 cos θ ) 2 d θ = c 3 ω h 2 2 ( tan θ C tan θ A )
where the expression of g1 is
g 1 = e 2 ( θ C θ B ) tan φ 3 1
The total energy dissipation rate within the velocity discontinuity line of the roadway side is
D 3 = 2 ( c 3 ω h 2 2 ( tan θ C tan θ A ) + c 3 ω r OB 2 2 tan φ 3 ( e 2 ( θ C θ B ) tan φ 3 1 ) )
(2)
Internal energy dissipation rate of the direct roof velocity discontinuity line
The internal energy dissipation rate generated on the logarithmic spiral CD is equal to the integral value of its tangential velocity and cohesion to the entire logarithmic spiral discontinuity. The internal energy dissipation rate on CD can be obtained as
D CD = θ C θ D c 2 ω r OC 2 e 2 [ ( θ θ C ) tan φ 2 ] d θ = c 2 ω r OC 2 2 tan φ 2 g 2
In this formula, g2 is expressed as
g 2 = e 2 ( θ D θ C ) tan φ 2 1
The energy dissipation rate of discontinuous line OA is
D OA = c 2 v 0 h 2 2 + h 0 2 / 4
Then, the total energy dissipation rate of the direct roof velocity discontinuity is
D 2 = 2 ( c 2 ω r OC 2 2 tan φ 2 g 2 + c 2 v 0 h 2 2 + h 0 2 / 4 )
(3)
Internal energy dissipation rate of the main roof velocity discontinuity line
D 1 = c 1 v 0 ( h 1 cos φ 1 + 4 r OC e ( θ D θ C ) tan φ 2 h 1 tan φ 1 )

2.4. Velocity Discontinuity Line Height Solution

According to the upper bound theorem of limit analysis, the total external force power in the constructed failure model is equal to the internal energy dissipation power. Substituting Formulas (4) and (21)–(24) into Formula (3), the upper bound objective function of the height of the velocity discontinuity line of the roadway-adjacent rock can be obtained.
2 3 γ 3 ω ( r OB 3 f 1 h 2 3 f 2 h 0 3 f 3 ) + 2 3 γ 2 ω ( r OC 3 f 4 + h 2 3 f 5 ) + 1 2 γ 2 h 0 h 2 v 0 + 1 2 γ 1 v 0 h 1 ( 4 r OC e ( θ D θ C ) tan φ 2 h 1 tan φ 1 ) ω σ h 0 2 4 ( 1 sin θ A 1 sin θ B ) q h 0 v 0 + σ s v 0 ( 2 r OC e ( θ D θ C ) tan φ 2 h 1 tan φ 1 ) = 2 ( c 3 ω h 2 2 ( tan θ C tan θ A ) + c 3 ω r OB 2 2 tan φ 3 ( e 2 ( θ C θ B ) tan φ 3 1 ) ) + 2 ( c 2 ω r OC 2 2 tan φ 2 g 2 + c 2 v 0 h 2 2 + h 0 2 / 4 ) + c 1 v 0 ( h 1 cos φ 1 + 4 r OC e ( θ D θ C ) tan φ 2 h 1 tan φ 1 )
In the limit state, the upper bound solution of the height of the velocity discontinuity line of the roadway-adjacent rock is the maximum value determined by the objective function (34) of the height of the velocity discontinuity line. Factor (34) contains multiple variables, and the variables are nonlinear. It is difficult to obtain the maximum value of the height of the velocity discontinuity line directly by means of derivation. Therefore, in this paper, we first use Origin C language to write the objective function (34) and then compile it through the custom fitting function manager in Origin [40]. The objective function (34) under multivariate constraints is solved, and the local maximum value of the objective function is obtained. That is, the maximum value of h(σs) is the upper bound solution of the height of the velocity discontinuity line.

3. Example Calculation and Simulation Experiment Verification Analysis

3.1. Example Calculation

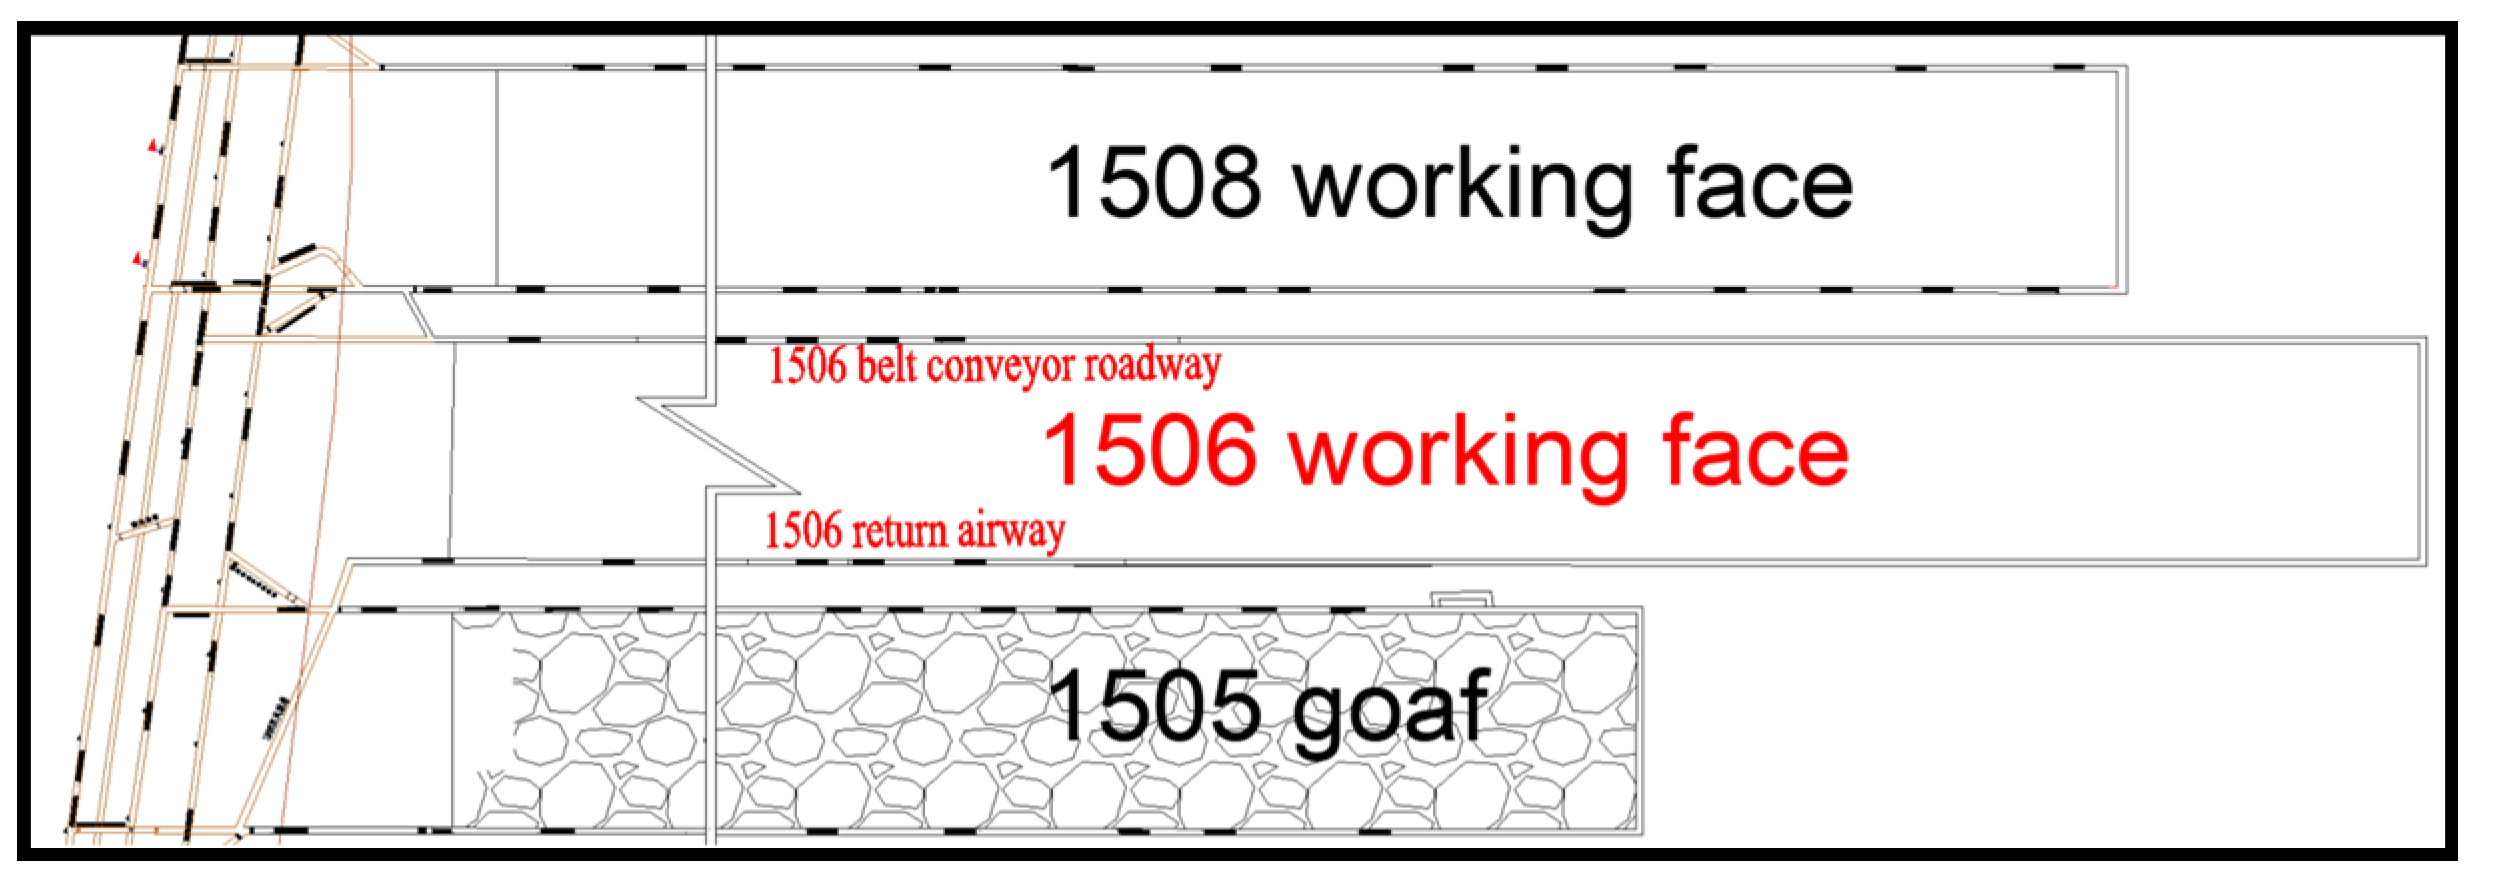
3.1.1. Engineering Overview

The Anyang Mine is located in the southeast of the Loess Plateau in northern Weinan. The whole area is covered by loess, and the terrain is relatively flat. The highest point is located in the northeast with an elevation of 725 m, and the lowest point is located in Jinshui Gou with an elevation of 598 m, yielding a height difference of 127 m. The mine mainly exploits the No. 5 coal seam, with an average depth of 366 m. The thickness of the seam ranges from 2.35 m to 6.49 m, with an average of 4.42 m. The average inclination angle is 5°.
The No. 1506 working face is located in the middle of the No. 1 mining area of the No. 5 seam, with the 1508 working face to the west and the 1505 working face to the east. The elevation of the bottom plate of the coal seam is +318~+350 m, the length of the working face is 1903 m, the length of the incline is 150 m, the area of the working face is 277,697 m2, and the recoverable reserve is 1.52 Mt. With adoption of the methods of long-wall integrated mining and low-level roof coal release, the height of the coal cutting is 2.5 m, the height of the coal release is 1.92 m, and the ratio of mining to coal release is 1:0.768. The layout of the working face is shown in Figure 4.

3.1.2. Results and Discussion

To verify the reliability of the formula derived in this paper, the soft rock return airway of the 1506 working face in the Anyang Coal Mine is adopted as an engineering example, and the results are compared with the results of the physical similarity simulation test. Therefore, it is necessary to solve objective Function (34) under multivariate constraints, and the maximum value of the objective function is obtained. That is, the maximum value of h (σs) is the upper bound solution of the height of the velocity discontinuity line. The constraint conditions for solving the height of the velocity discontinuity line are shown in Table 1.
According to the upper limit objective function (34) of the height of the velocity discontinuity line and the constraint conditions (Table 1) of the height of the velocity discontinuity line, the curve of the failure height of the velocity discontinuity line of the 1506 return airway with the load of the overlying strata can be drawn, as shown in Figure 5.
According to the upper limit solution of the height of the velocity discontinuity line (Figure 5) and the constraint conditions of the height of the velocity discontinuity line (Table 1), the evolution characteristic diagram of the failure mode of the 1506 return airway can be drawn, as shown in Figure 6. From the diagram, it can be seen that when the overburden load σs is less than 3.5 MPa, the velocity discontinuity line is mainly distributed on the coal side. When 3.5 MPa < σs < 3.77 MPa, the velocity discontinuity line extends from the coal side to the direct roof. When the overburden load σs is equal to 3.77 MPa, the velocity discontinuity line penetrates the interface between the direct roof and the basic roof. As σs continues to increase, the velocity discontinuity line continues to extend upward. When σs is equal to 9.0 MPa, the two velocity discontinuity lines intersect. At this time, the height of the velocity discontinuity line in the basic roof is 11.32 m.

3.2. Physical Similarity Simulation Experiment Verification

With the 1506 return airway of the Anyang Coal Mine as the research object, a physical simulation experiment was carried out. Through the loading system, different confining pressures were applied to the model to simulate different mining stress boundary conditions, and the bearing capacity and deformation evolution patterns of the surrounding rock under different mining stresses were analyzed. The model construction size was 1000 mm (length) × 200 mm (width) × 80 mm (height).

3.2.1. Similarity Ratio and Selection of Similar Materials

The aggregate of the simulation material is river sand, and the cementing materials are calcium carbonate and gypsum. The above materials were prepared in a certain proportion with water. The layered material is mica powder. According to the similarity theory of the simulation experiment, the geometric similarity constant was set to 20, the bulk density similarity constant was 1.6, and the strength similarity constant was 32. The similar material model parameters and material ratios are shown in Table 2.
According to the parameters of the original bolt and anchor cable, the geometric parameters and physical and mechanical parameters of the bolt and anchor cable in the physical simulation model were calculated. A pull-out test machine was used to carry out a pull-out test of the simulated materials of the bolt and anchor cable, and reasonable simulated materials of the bolt and anchor cable were determined according to the breaking load and similarity ratio. Finally, it was determined that the simulated bolt should be aluminum wire with a diameter of 1 mm and a length of 125 mm and that the anchor cable should be iron wire with a diameter of 1 mm and a length of 310 mm.

3.2.2. Loading Scheme Design of the Model

This experiment was carried out by step-by-step loading. The loading system was composed of two hydraulic jacks, a manual pressure pump, and a loading plate. Pressure was applied to the loading steel plate by the jack to simulate the uniform load formed by the overlying strata. The actual surrounding rock stress of the return airway of the 1506 working face is 9.0 MPa. According to the stress and strength similarity conditions, the load applied by the model was calculated and the load was applied in six loading steps (step 1~step 6). After the completion of the initial rock stress loading of the roadway, the influence of the roadway on the dynamic pressure of the working face was simulated. The roadway was loaded again, and the maximum stress concentration coefficient of this experiment was set to 1.50. According to the stress and strength similarity conditions, the vertical load was calculated. Loading was divided into three steps (step 7~step 9). The step-by-step loading scheme of the experimental model is described in Table 3.

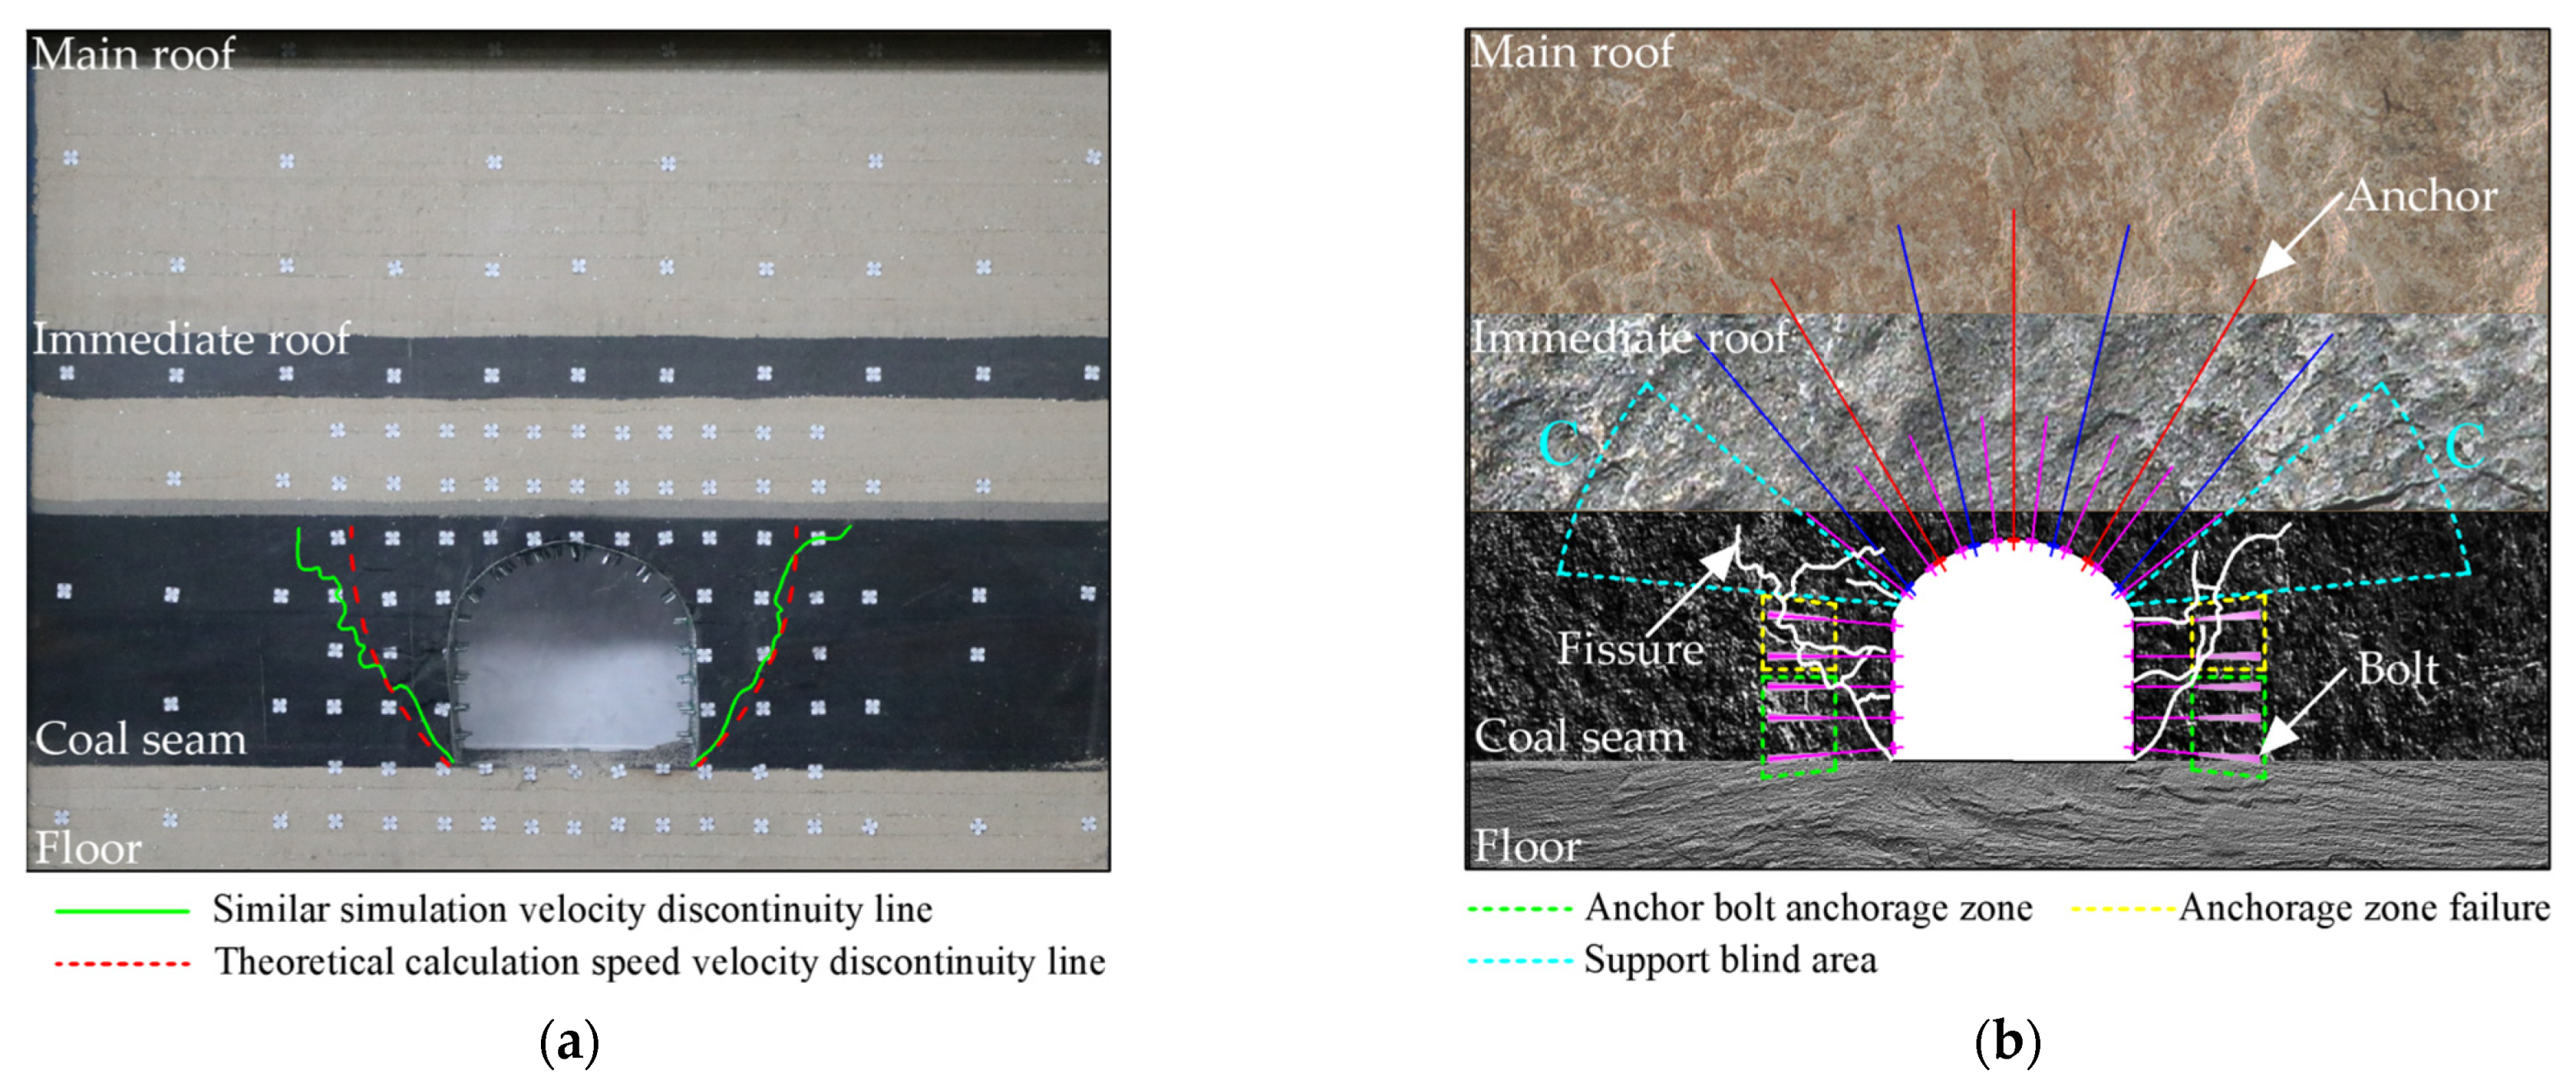
3.2.3. Results and Discussion

The failure characteristics of the rock surrounding the roadway under different confining pressures during the loading process are shown in Figure 7, Figure 8 and Figure 9. The failure evolution process of the model can be divided into three stages: the first stage is the crack initiation stage (step 1~step 3); the second stage is the development stage of surrounding rock deformation (step 4~step 6); and the third stage is the violent development stage of surrounding rock deformation (step 7~step 9).
From Figure 7, it can be seen that when the overburden load σs = 3.0 MPa (step 2), the shear failure of the weak coal on the roadway side is first caused by the stress concentration on the roadway side. Fissures are first generated at the bottom corner of the roadway and expand with increasing surrounding rock pressure to the blind support area (area C) above the syncline. Finally, inclined shear cracks form inside the roadway side, and the fracture development area is distributed in an “arc” shape. This is basically consistent with the theoretical calculation of the velocity discontinuity line shape. Due to the large damage depth of the middle and upper coal on the two sides of the roadway, the middle and upper bolts are in a failure state, and the maximum damage depth of the roadway side is 2.8 m. There is no obvious deformation and no crack propagation in the roof and floor.
With the increase in surrounding rock pressure, when the overburden load σs = 4.5 MPa (step 3), the cracks in the roadway side continue to extend to the blind support area in the direct roof (area C) and the low-strength support area (area B) above the slope. The mechanical properties of the direct roof and coal are the same; thus, they are both weak rock masses. As a result, there is no change in the failure mode of the direct roof, the morphology of the fracture development zone, or the roadway side. The failure mode is shear slip failure, and the morphology of the fracture development zone is an “arc” distribution. However, the scope and damage degree are significantly higher in the direct roof than in the roadway side. The anchor cable anchorage section of the two shoulder angles of the roadway is located in the weak direct roof (B area); thus, the support strength is low. The expansion of the fissure leads to the failure of the anchor cable at the shoulder angle of the roadway, which increases the direct roof failure range. The maximum damage range of the direct roof is 15.8 m. The theoretically calculated value of the roof failure height is the same as the simulation results, both of which are approximately 7.27 m. For the high strength support area (area A), because the anchoring section of the anchor cable in area A is mostly in the hard basic roof, the direct roof anchored by the anchor cable in area A has no deformation and no crack expansion. The floor has no obvious deformation and no crack propagation. Through the control imposed by the bolt and anchor cable system in the surrounding rock and the strength of the surrounding rock itself, the roadway remains stable, as shown in Figure 8.
When the overburden load σs = 7.5 MPa (step 5), there is no obvious change in the shear failure range of the roadway side. However, due to the subsidence of the roof, the coal on the roadway side is squeezed along the slip line, increasing the opening degree of the macroscopic cracks on both sides of the roadway, resulting in a significant increase in the displacement of the roadway side. The cracks in the blind support area (area C) and the low-strength support area (area B) continue to extend deeper, and the cracks exist outside the high-strength anchorage zone of the anchor cable. When the fracture penetrates the interface between the direct roof and the basic roof, the fracture extension direction changes significantly. The main reason for this is that the mechanical properties of the basic roof rock are different than those of the direct roof, and the failure mode of the fracture changes from slip shear failure to tensile failure. The fracture development zone (zone E) in the basic roof is roughly symmetrically distributed about the D zone. Under the influence of the surrounding rock stress, the roadway floor bends and deforms toward the free face, and tensile cracks are generated in the floor surface. Due to the different deflections of each layer, separation cracks are generated between the layers, and the floor crushing range gradually expands downward, with a maximum failure depth of 1.25 m, as shown in Figure 9.
With increasing surrounding rock pressure, the original microcracks extend and connect with each other and finally transform into macroscopic shear slip surfaces. Multiple slip surfaces combine to form a shear slip band (zone E). Under the action of self-weight and roof pressure, the status of the rock mass in the shear slip zone (zone E) and its inner anchored rock mass (zone D) changes from static to dynamic. Gradual shear slip movement occurs at the free surface inside the roadway. On the roadway side, the more complete coal exhibits shear along the slip surfaces, resulting in the slip of the anchor body on the roadway side. The three bolts in the upper part of the roadway are separated from the anchor body; thus, the movement of the upper and lower sides is inconsistent, resulting in the coal protruding from the roadway side. Once the side block of the roadway slips, the roof slip block sinks as a whole. With an increase in confining pressure, the width and length of the shear slip zone show increasing trends. At this time, the crack has extended to the anchor cable anchorage zone (zone D). The anchor cable anchorage zone is separated from the basic roof rock layer as a whole, resulting in the risk of failure of the anchorage system. At this time, the anchor cable plays the role of only suspending the anchor bolt anchorage zone, and the bearing capacity is small. In addition, the density of vertical cracks in the surrounding rock is further increased, and there is a risk of overall collapse. The roof strata of the roadway have a large area of subsidence along the shear slip zone (zone E), and this type of failure of the roof is categorized as an overall subsidence type. The deformation and failure of the floor are severe, the floor heave increases, and the area of the roadway section gradually decreases. When the overburden load σs = 13.5 MPa (step 9), the distribution range of cracks reaches the maximum. The distribution pattern of the velocity discontinuity line obtained by a similar simulation is basically consistent with the distribution pattern of the theoretical calculation, as shown in Figure 10.

3.2.4. Analysis of the Failure Mechanism of the Rock Surrounding Soft Rock Mining Roadways
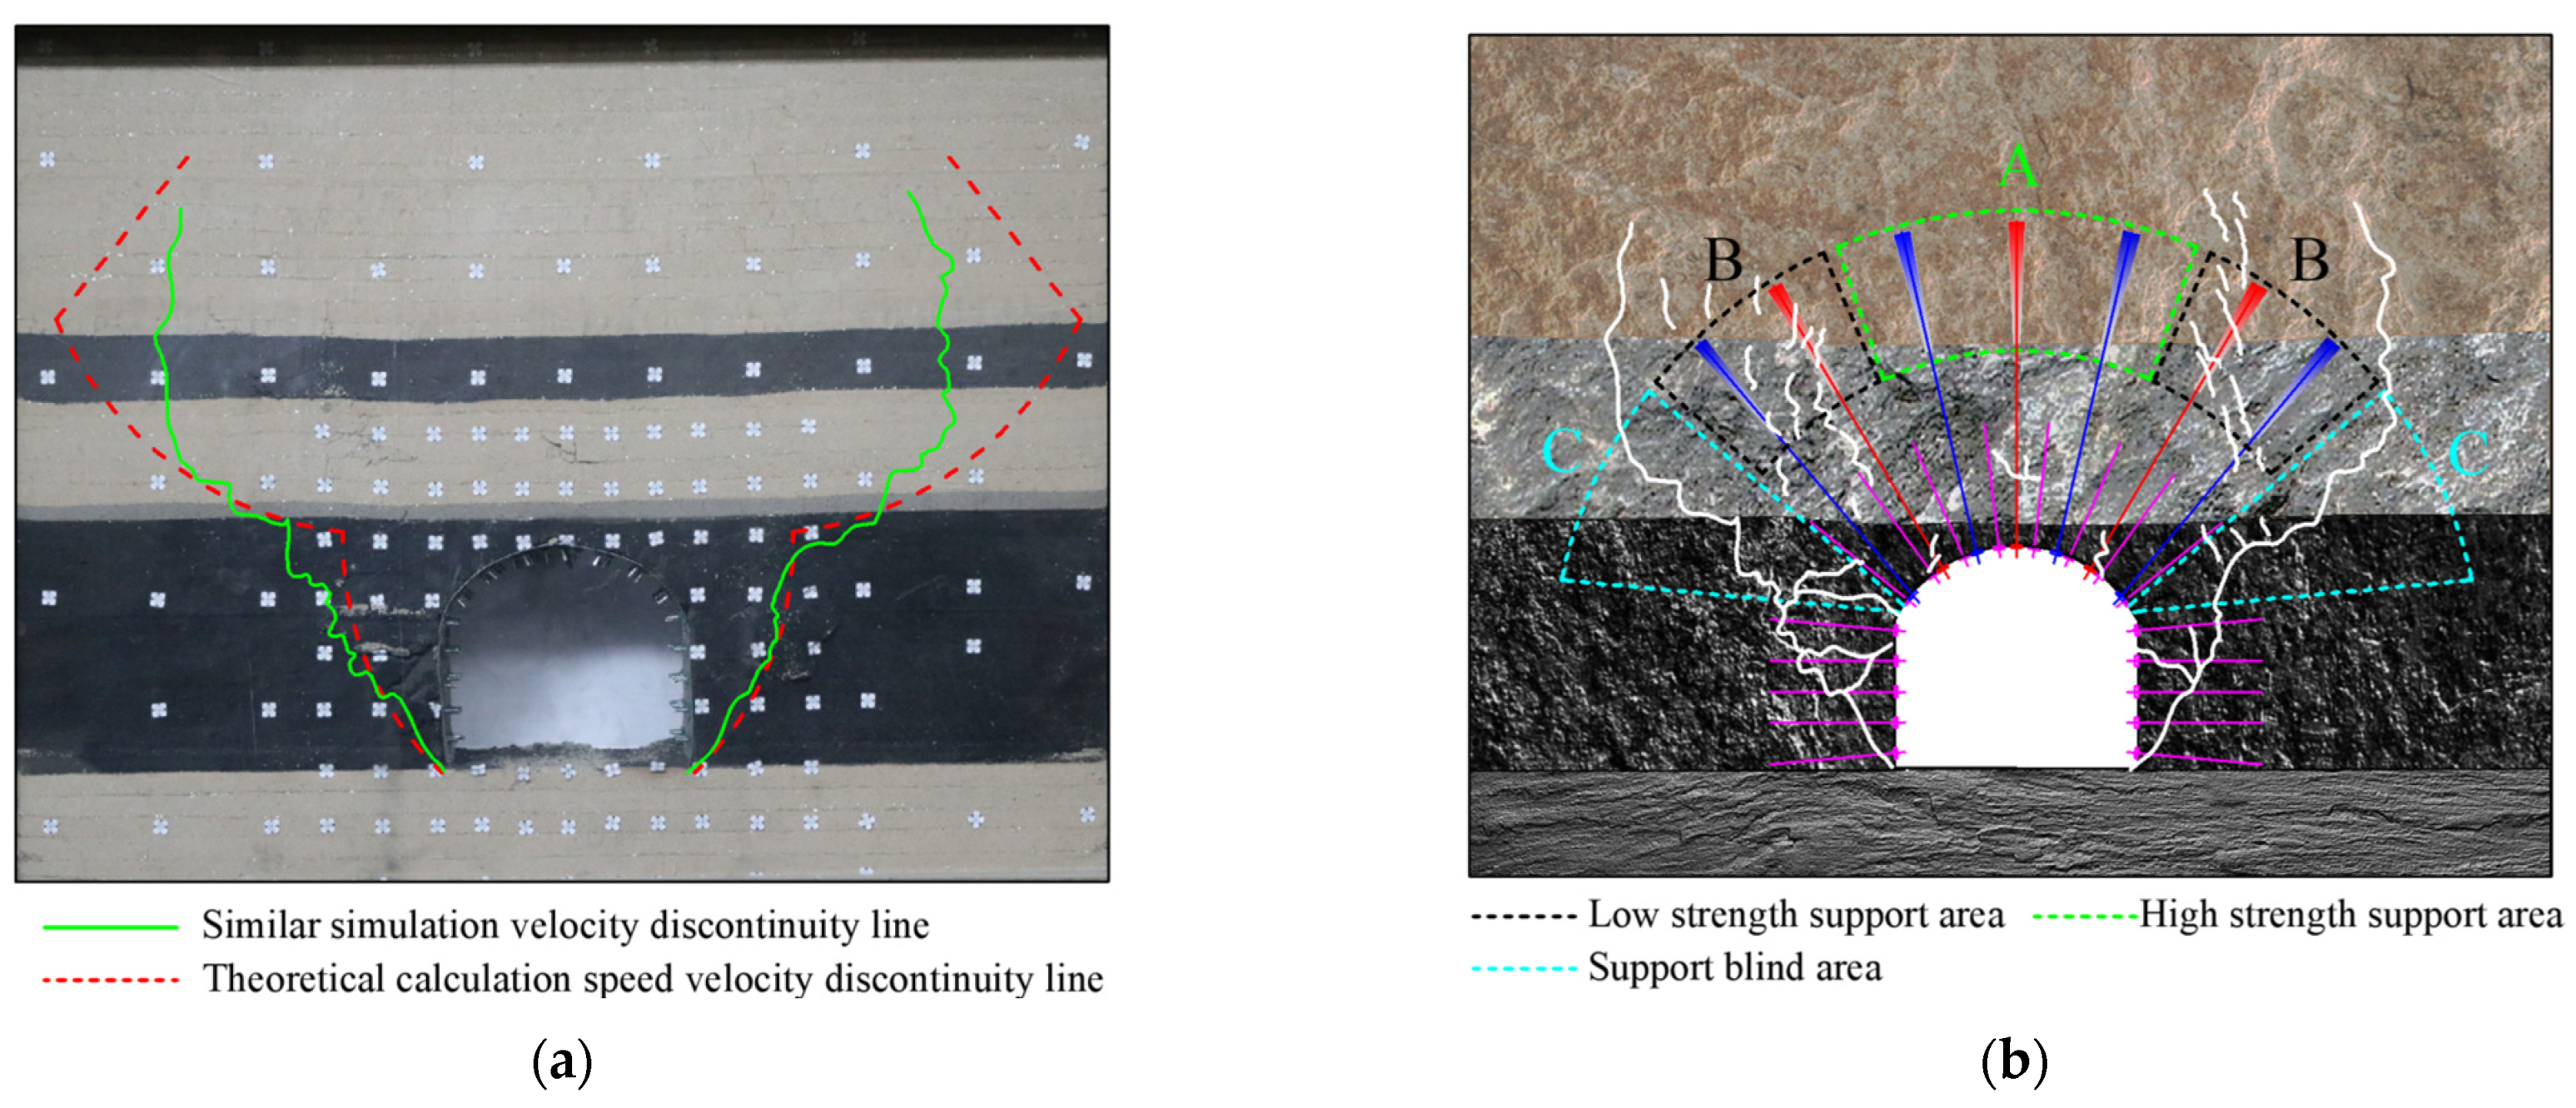
(1)
Due to stress concentration, shear failure occurs first in the sidewall of the roadway. The crack extends along the blind support area (area C) above the bottom angle of the roadway. Finally, an arc-shaped shear slip fracture is formed inside the two sides of the roadway, resulting in the failure of the middle and upper bolts.
(2)
With the increase in surrounding rock pressure, the fracture in the roadway side continues to expand to the blind support area of the direct roof (area C) and low-strength support area (area B) above the slope. The formation of arc-shaped shear slip cracks occurs. Crack propagation further weakens the support strength of the angled anchor cable in the roadway shoulder, which increases the direct roof failure range.
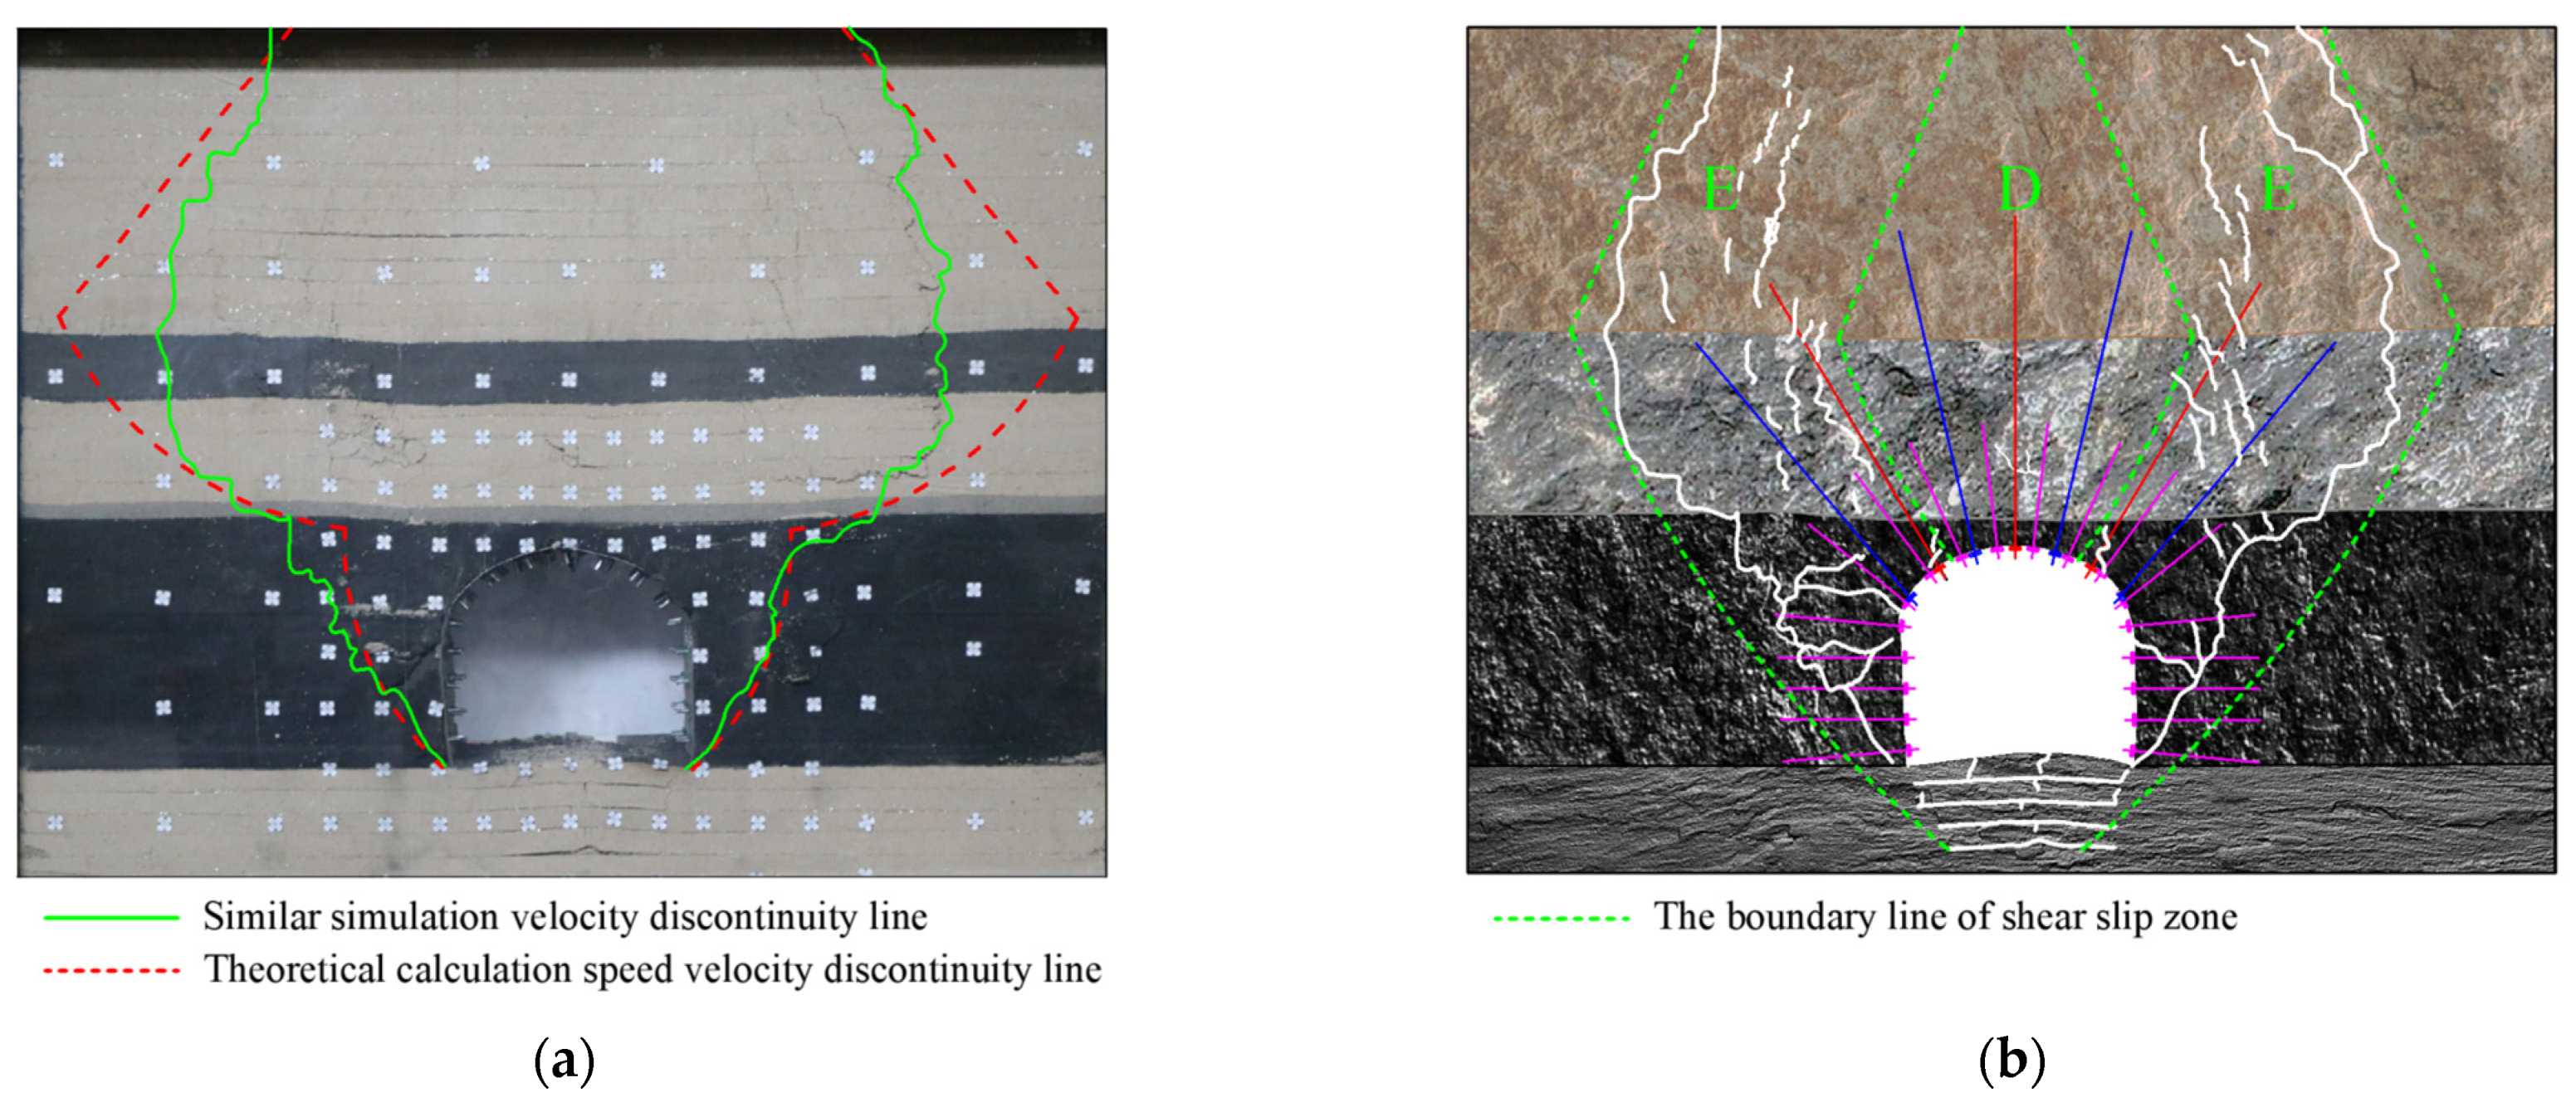
(3)
When the crack penetrates the interface between the direct roof and the main roof, the extension direction of the crack changes notably. The failure mode of the crack also changes from slip shear failure to tensile failure, and the cracks in the basic roof expand in zone E. The opening degree of the macroscopic cracks on the two sides of the roadway increases, and the displacement shows a significant increasing trend. The floor of the roadway bends and deforms toward the free surface, tensile cracks are generated on the surface of the floor, separation cracks are generated between the layers, and the range of fracturing in the floor gradually extends downward.
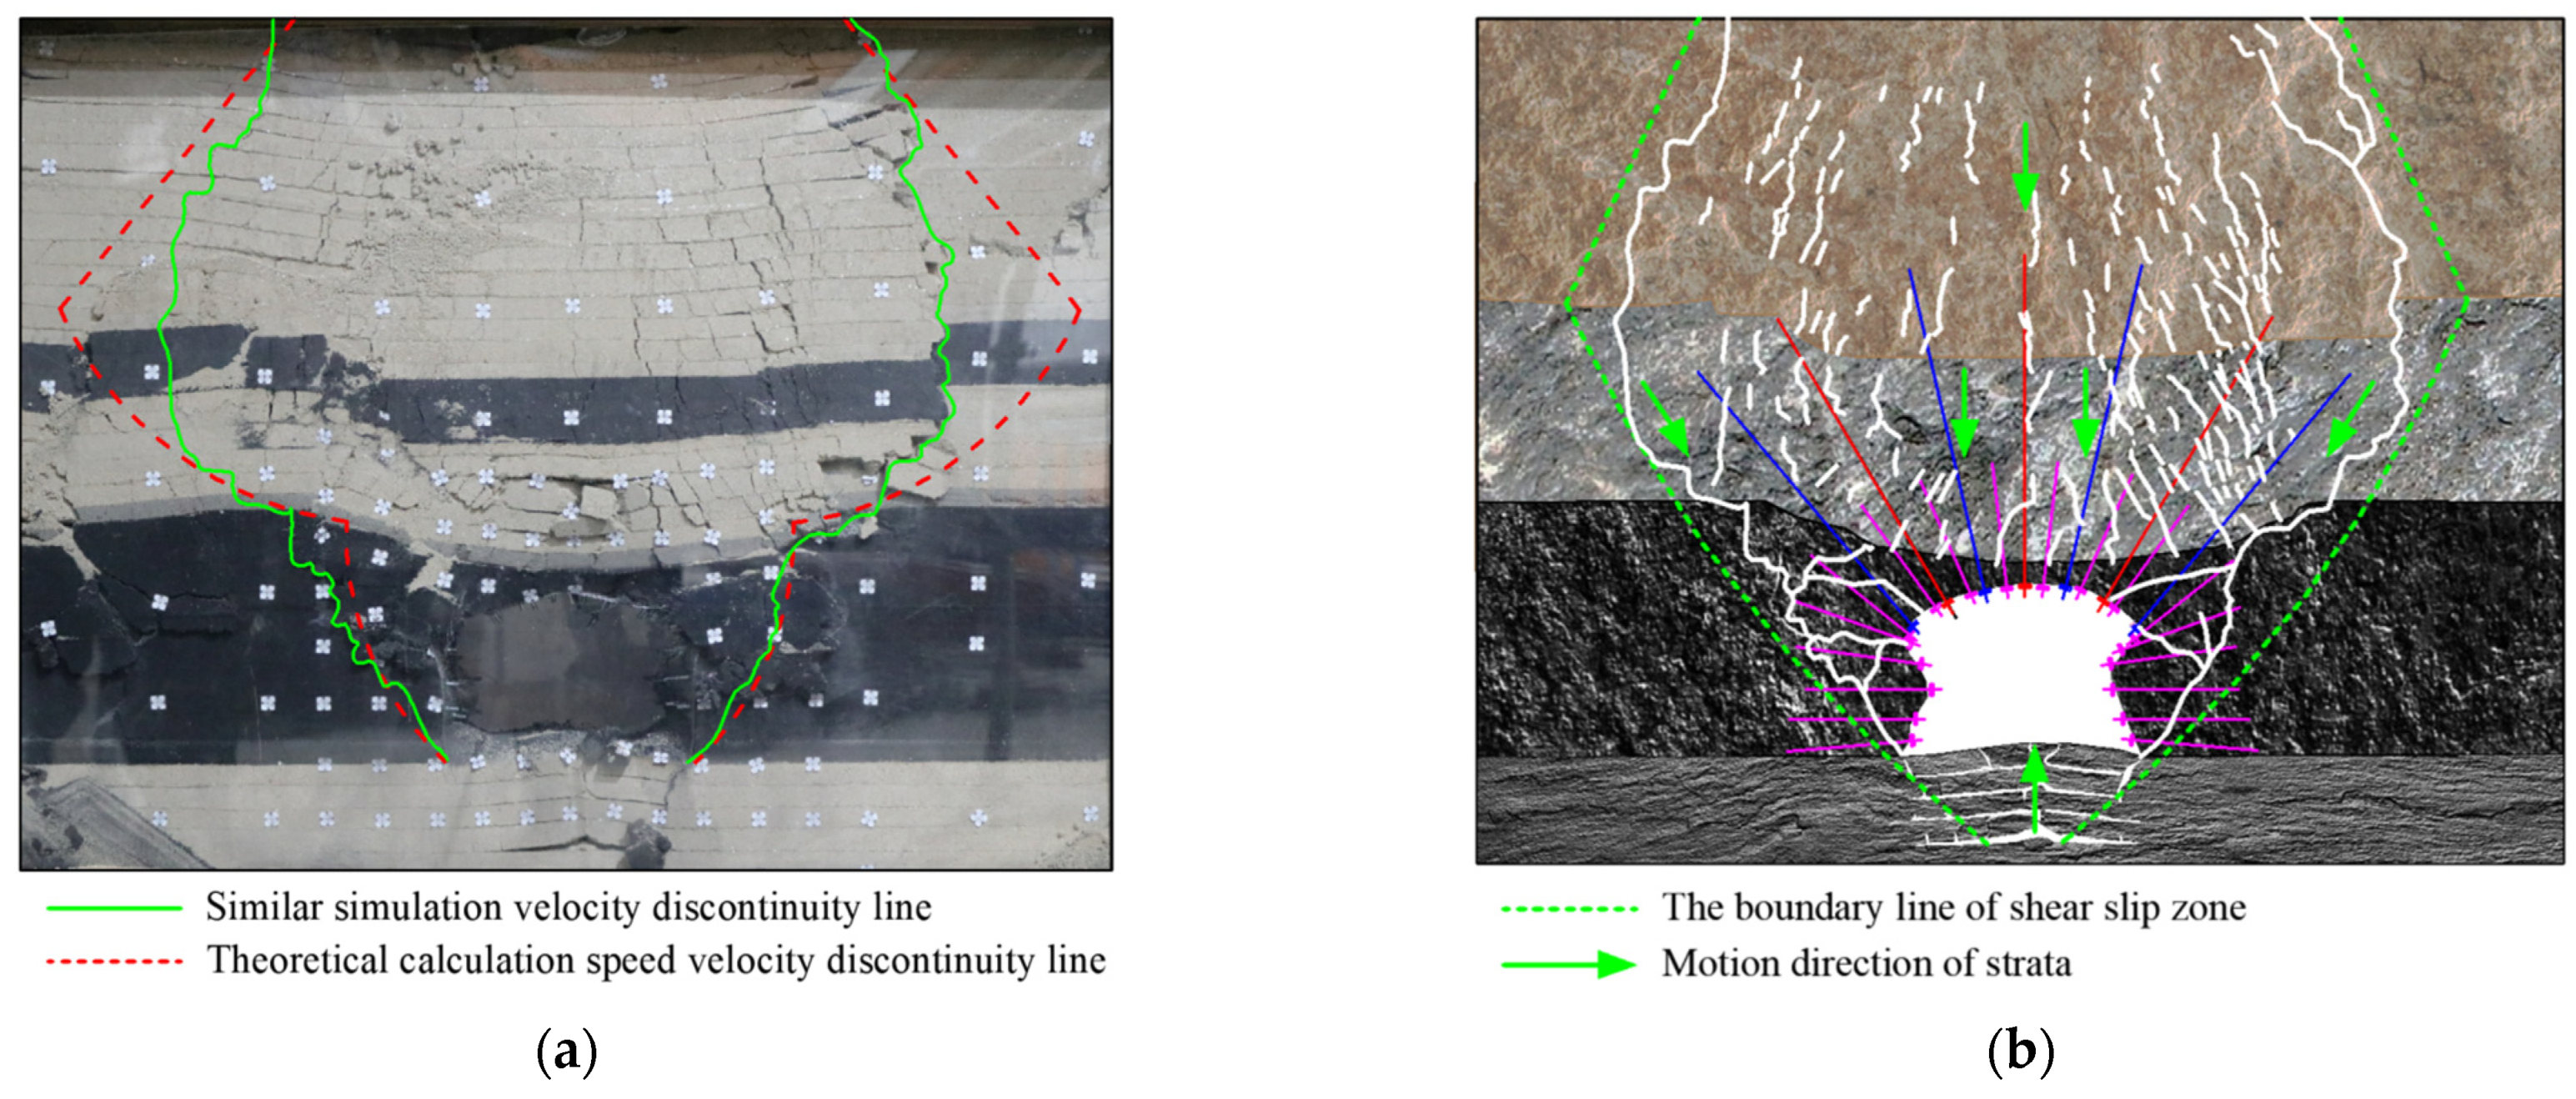
(4)
With increasing surrounding rock pressure, the original microcracks extend and connect with each other and finally transform into macroscopic shear slip surfaces. Multiple slip surfaces combine to form a shear slip band (zone E). Under the action of the self-weight of the block in the slip plane (zone D) and the roof pressure, the status of the rock mass in the shear slip zone (zone E) and its inner anchored rock mass (zone D) changes from static to dynamic. At the same time, the width of the shear slip zone shows an increasing trend, and the cracks expand into the anchorage zone (zone D) of the anchor cable. This causes the risk of failure of the anchorage system. The roof movement causes the anchor body of the roadway side to slip, resulting in the coal bulging from the roadway side. Additionally, the sliding of the roadway side block also drives the overall subsidence of the roof sliding block, the deformation and failure of the floor, and the contraction of the roadway section.
This paper takes the 1506 return airway of Anyang Coal Mine as the research object and discusses its damage mode and damage range. This work represents a powerful supplement to the existing research on the damage problem of soft rock mining roadways and makes up for the shortcomings in existing research to a certain extent. Additionally, it can also provide the necessary reference basis for research on soft rock roadways. The results of this study mainly reveal two findings. One is that the damage mode of soft rock mining roadways consists of a series of rigid sliders. The second is that the damage range of soft rock mining roadways is related to several factors. Consequently, we should not only pay attention to the selection of the damage mode but also consider the influence of various factors on the damage range of the roadway to ensure the accuracy of roadway damage research. Compared with existing research results, the insights presented in this paper have both similarities and differences. In terms of commonalities, the choice of the damage mode of the roadway perimeter rock to carry out research on the roadway gang part and roof partition is still based on certain assumptions. From the point of view of differences, roadway damage research is mainly based on elastic-plastic theory for mechanical analysis; but this paper differs in that other studies focus on whether the stress distribution of the system meets the static equilibrium conditions, while this paper analyses the problem only from the point of view of the energy dissipation of the damage in the roadway-adjacent rock.
Of course, there are some defects in this study, mainly including the following: When calculating the damage range of the tunnel-adjacent rock, the damage range is related to a number of factors and the reliability of the data seriously affects the accuracy of the results, which leads to a certain degree of deviation between the calculation results and the actual situation. Therefore, a reasonable way to solve this problem is to obtain the required calculation parameters through a large number of mechanical experiments. Due to the limited space of this paper, only the method of physical similarity simulation has been verified. In the future, it is necessary to study the problem through numerical simulations and field measurements to ensure that the analysis results are more objective and reasonable.

4. Conclusions

(1)
Based on the limit analysis theory of plastic mechanics, a rigid sliding block system model of the failure of the rock surrounding a soft rock roadway under dynamic pressure is constructed. The formulas for calculating the self-weight power of the slider in the velocity discontinuity line of the rock surrounding the roadway, the power of the surrounding rock pressure, and the energy dissipation rate of the velocity discontinuity line are derived, and the upper limit objective function of the height of the velocity discontinuity line is obtained.
(2)
With adoption of the return airway of the 1506 working face in Anyang Coal Mine as the engineering background, the failure height h of the roadway roof under different overburden loads σs is calculated in Origin. The results show that when the overburden load σs < 3.54 MPa, the velocity discontinuity line is mainly distributed in the coal wall. When 3.54 MPa < σs < 3.77 MPa, the velocity discontinuity line extends from the coal side to the direct roof and the maximum failure height is 4.3 m. When the overburden load σs > 3.77 MPa, the velocity discontinuity line penetrates the interface between the direct roof and the basic roof and extends upward. When σs = 9.0 MPa, the failure height is 15.62 m.
(3)
By building a physical similarity model of the 1506 return airway, the failure mode of the roadway and the failure height of the roof are obtained by applying different overburden loads σs. The results show that the failure mode of the roadway and the failure height of the roof in the physical similarity simulation are basically consistent with the theoretical analysis. Shear failure first occurs on the side of the roadway. The fractures expand along the blind support area and low-strength support area above the syncline of the roadway bottom angle. Finally, arc-shaped shear slip cracks are formed. At the same time, the support strength of the angled anchor cable and bolt in the roadway shoulder is weakened. When the fracture passes through the interface between the direct roof and the basic roof, a shear slip zone is formed. Under the action of self-weight and roof pressure, the rock mass in the shear slip zone is unstable and deforms.

Author Contributions

Methodology, S.G. and T.Y.; data curation, Y.H. and J.W.; manuscript writing, S.G.; similar simulation experiments S.G., Y.H. and H.W.; writing—review and correction, J.Z. All authors have read and agreed to the published version of the manuscript.

Funding

This study was supported by the National Natural Science Foundation of China project (51774229, 52004200), the order of sponsors is Jie Zhang, Tao Yang. Thank you very much for the support of the National Natural Science Foundation project.

Institutional Review Board Statement

Not applicable.

Informed Consent Statement

Not applicable.

Data Availability Statement

The relevant data in this manuscript were obtained from field measurement and tests, which are real and effective.

Acknowledgments

Thank you to Jianchen Zhang from Shaanxi Branch of China United Network Communications Co., Ltd.; Bing Peng from Shaanxi Mineral Resources Survey and Evaluation Center; Tong Li from China Coal Xi’an Design Engineering Co., Ltd.; and Anyang Coal Mine, for their convenience and support in writing this manuscript.

Conflicts of Interest

The authors declare that there are no conflicts of interest in the publication of this paper.

References

  1. Kang, H.; Fan, M.; Gao, F.; Zhang, H. Deformation and support of rock roadway at depth more than 1000 meters. Chin. J. Rock Mech. Eng. 2015, 34, 2227–2241. [Google Scholar] [CrossRef]
  2. He, M. Progress and challenges of soft rock engineering in depth. J. China Coal Soc. 2014, 39, 1409–1417. [Google Scholar] [CrossRef]
  3. Yuan, L.; Xue, J.; Liu, Q.; Liu, B. Surrounding rock stability control theory and support technique in deep rock roadway for coal mine. J. China Coal Soc. 2011, 36, 535–543. [Google Scholar] [CrossRef]
  4. Aghababaei, S.; Saeedi, G.; Jalalifar, H. Risk analysis and prediction of floor failure mechanisms at longwall face in parvadeh-I coal mine using rock engineering system (RES). Rock Mech. Rock Eng. 2016, 49, 1889–1901. [Google Scholar] [CrossRef]
  5. Cai, J.; Tu, M.; Zhang, H. Deformation and instability mechanism and control technology of mining gateway for jurassic weak-cemented soft rock roadways. J. Min. Saf. Eng. 2020, 37, 1114–1122. [Google Scholar] [CrossRef]
  6. Sun, L.; Ji, H.; Yang, B. Physical and mechanical characteristic of rocks with weakly cemented strata in western representative mining area. J. China Coal Soc. 2019, 44, 865–873. [Google Scholar] [CrossRef]
  7. Fazio, N.L.; Leo, M.; Perrotti, M.; Lollino, P. Analysis of the displacement field of soft rock samples during UCS tests by means of a computer vision technique. Rock Mech. Rock Eng. 2019, 52, 3609–3626. [Google Scholar] [CrossRef]
  8. Qiao, W.; Meng, Q.; Lin, D.; Wei, L. Research on bolt-grouting support technology and simulation test for deep swelling soft-rock roadway under high stress. Min. Metall. Eng. 2011, 31, 24–28. [Google Scholar]
  9. Li, G.; Liang, B.; Zhang, G. Deformation features of roadway in highly stressed soft rock and design of supporting parameters. J. Min. Saf. Eng. 2009, 26, 183–186. [Google Scholar]
  10. Chen, S.; Wu, A.; Wang, S.; Chen, X.; Wang, Y. Deformation mechanism and repair control technology of soft surrounding rock roadway. J. China Univ. Min. Technol. 2018, 47, 830–837. [Google Scholar] [CrossRef]
  11. Li, G.; Shen, J.; Li, G.; Dai, L. Numerical simulation for deformation behavior of soft rock roadway under the condition of water-rock interaction. J. Saf. Environ. 2020, 37, 1114–1122. [Google Scholar] [CrossRef]
  12. Du, B.; Liu, C.; Wu, F.; Yang, J. Deformation mechanism and control technology of roadway in deep mine with high stress and weak surrounding rock. J. Min. Saf. Eng. 2020, 37, 1123–1132. [Google Scholar] [CrossRef]
  13. Zhang, J.; Zhai, J.; Lv, Z. Study on mechanism analysis and control technology of deformation occurred in mine watery soft rock roadway. Coal. Eng. 2014, 46, 53–55. [Google Scholar]
  14. Jing, W.; Guo, R.; Yang, R.; Jing, L.; Xue, W. A theoretical analysis of surrounding rock deformation of deep soft rock roadway based on rock rheology and strain softening. J. Min. Saf. Eng. 2021, 38, 538–546. [Google Scholar] [CrossRef]
  15. Gao, Y.; Qu, Z.; Niu, X.; Wang, B.; Fan, Q.; Gao, Z. Rheological law for soft rock tunnel and evolution law for stress field in deep mine. J. China Coal Soc. 2007, 32, 1244–1252. [Google Scholar]
  16. Wang, X.; Bai, J.; Li, L.; Han, Z. Deformation failure mechanism and control technology of mining-induced roadway near a fault. J. Min. Saf. Eng. 2014, 31, 674–680. [Google Scholar] [CrossRef]
  17. Xie, Z.; Zhang, N.; Yuan, Y.; Xu, G.; Wei, Q. Study on safety control of composite roof in deep roadway based on energy balance Theory. Sustainability 2019, 11, 3688. [Google Scholar] [CrossRef]
  18. Xiang, Z.; Zhang, N.; Xie, Z.; Guo, F.; Zhang, C. Cooperative control mechanism of long flexible bolts and blasting pressure relief in hard roof roadways of extra-thick coal seams: A case study. Appl. Sci. 2021, 11, 4125. [Google Scholar] [CrossRef]
  19. Shen, B. Coal mine roadway stability in soft rock: A case study. Rock Mech. Rock Eng. 2014, 47, 2225–2238. [Google Scholar] [CrossRef]
  20. Xiang, Z.; Zhang, N.; Qian, D.; Xie, Z.; Zhang, C.; Guo, F.; Wang, S. Failure characteristics and stability control of bolt support in thick-coal-seam roadway of three typical coal mines in China. Shock Vib. 2021, 2021, 5589085. [Google Scholar] [CrossRef]
  21. Bai, J.; Wang, X.; Jia, M.; Hou, C. Theory and application of supporting in deep soft roadways. Chin. J. Geotech. Eng. 2008, 30, 632–635. [Google Scholar]
  22. Wang, X.; Bai, J.; Hu, Z. Research on the mechanism of pressure relief based on the analysis of compressive stress deformation. China Univ. Min. Technol. 2010, 39, 313–317. [Google Scholar] [CrossRef]
  23. Zhang, W.; He, Z.; Zhang, D.; Qi, D.; Zhang, W. Surrounding rock deformation control of asymmetrical roadway in deep three-soft coal seam: A case study. J. Geophys. Eng. 2018, 15, 1917–1928. [Google Scholar] [CrossRef]
  24. Sakhno, I.; Sakhno, S.; Skyrda, A.; Popova, O. Numerical modeling of controlling a floor heave of coal mine roadways with a method of reinforcing in wet soft rock. Geofluids 2022, 2022, 3855799. [Google Scholar] [CrossRef]
  25. Yang, S.; Chen, M.; Jing, H.; Chen, K.; Meng, B. A case study on large deformation failure mechanism of deep soft rock roadway in Xin’An coal mine. China. Eng. Geol. 2017, 217, 89–101. [Google Scholar] [CrossRef]
  26. Yu, W.; Yuan, Y.; Wang, W. Deformation mechanism of roadway surrounding rock with large deformation and control technology under difficult conditions. Coal Sci. Technol. 2015, 43, 15–20. [Google Scholar] [CrossRef]
  27. Yang, X.; Wang, E.; Wang, Y.; Gao, Y.; Wang, P. A study of the large deformation mechanism and control techniques for deep soft rock roadways. Sustainability 2018, 10, 1100. [Google Scholar] [CrossRef]
  28. Sih, G.C. Strain-energy-density factor applied to mixed mode crack problems. Int. J. Fract. 1974, 10, 305–321. [Google Scholar] [CrossRef]
  29. Sih, G.C. From monoscale to multiscale modeling of fatigue crack growth: Stress and energy density factor. Sci. China Phys. Mech. Astron. 2014, 57, 39–50. [Google Scholar] [CrossRef]
  30. Zhang, Y.; Feng, X.; Zhang, X.; Wang, Z.; Sharifzadeh, M.; Yang, C. A novel application of strain energy for fracturing process analysis of hard rock under true triaxial compression. Rock Mech. Rock Eng. 2019, 52, 4257–4272. [Google Scholar] [CrossRef]
  31. Murali, A.K.; Tran, K.M.; Haque, A.; Bui, H.H. Experimental and numerical investigation of the load-bearing mechanisms of piles socketed in soft rocks. Rock Mech. Rock Eng. 2022, 55, 5555–5576. [Google Scholar] [CrossRef]
  32. Aubertin, J.D.; Hashemi, A.S.; Diederichs, M.; Hutchinson, J. Elliptical blast cratering in low porosity soft rock due to emitted and reflected pressure waves interaction. Rock Mech. Rock Eng. 2021, 54, 5517–5532. [Google Scholar] [CrossRef]
  33. Nguyen, N.H.T.; Bui, H.H.; Nguyen, G.D.; Kodikara, J. A cohesive damage-plasticity model for DEM and its application for numerical investigation of soft rock fracture properties. Int. J. Plast. 2017, 98, 175–196. [Google Scholar] [CrossRef]
  34. Lollino, P.; Andriani, G.F. Role of brittle behaviour of soft calcarenites under low confinement: Laboratory observations and numerical investigation. Rock Mech. Rock Eng. 2017, 50, 1863–1882. [Google Scholar] [CrossRef]
  35. Li, D.; Sun, Z.; Xie, T.; Li, X.; Ranjith, P. Energy evolution characteristics of hard rock during triaxial failure with different loading and unloading paths. Eng. Geol. 2017, 228, 270–281. [Google Scholar] [CrossRef]
  36. Xie, H.; Li, L.; Peng, R.; Ju, Y. Energy analysis and criteria for structural failure of rocks. J. Rock Mech. Geotech. Eng. 2009, 1, 11–20. [Google Scholar] [CrossRef]
  37. Li, W.; Zhang, C. Face stability analysis for a shield tunnel in anisotropic sands. Int. J. Geomech. 2020, 20, 04020043. [Google Scholar] [CrossRef]
  38. Raziperchikolaee, S.; Alvarado, V.; Yin, S. Quantitative acoustic emissions source mechanisms analysis of soft and competent rocks through micromechanics-seismicity coupled modeling. Int. J. Geomech. 2021, 21, 04020269. [Google Scholar] [CrossRef]
  39. Kang, H.; Jiang, P.; Feng, Y.; Zhao, K. Destressing technology for rock around coal mine roadways and its applications. Coal Sci. Technol. 2022, 50, 1–15. [Google Scholar] [CrossRef]
  40. Zhou, J. Proficient in Origin 7.0; University of Aeronautics and Astronautics Press: Beijing, China, 2005. [Google Scholar]
Figure 1. Calculation model of surrounding rock failure in a soft rock mining roadway.
Applsci 13 10323 g001
Figure 2. Gravity power calculation diagram. (a) Roadway side; (b) immediate roof; (c) main roof.
Applsci 13 10323 g002
Figure 3. Support pressure and overlying strata load power calculation diagram. (a) Roadway side support pressure σ; (b) immediate roof support pressure q; (c) overburden rock load σs.
Applsci 13 10323 g003
Figure 4. Plan layout of the working face.
Applsci 13 10323 g004
Figure 5. Upper bound solution of velocity discontinuity height of the rock surrounding the 1506 return airway in Anyang Coal Mine. (a) Immediate roof; (b) main roof.
Applsci 13 10323 g005
Figure 6. Evolution characteristics of the velocity discontinuity line in the rock surrounding the 1506 return airway in Anyang Coal Mine.
Applsci 13 10323 g006
Figure 7. Failure characteristics of roadway-adjacent rock (σs = 3.0 MPa). (a) Experiment photograph; (b) sketch.
Applsci 13 10323 g007
Figure 8. Failure characteristics of roadway-adjacent rock (σs = 4.5 MPa). (a) Experiment photograph; (b) sketch.
Applsci 13 10323 g008
Figure 9. Failure characteristics of roadway-adjacent rock (σs = 7.5 MPa). (a) Experiment photograph; (b) sketch.
Applsci 13 10323 g009
Figure 10. Failure characteristics of roadway-adjacent rock (σs = 13.5 MPa). (a) Experiment photograph; (b) sketch.
Applsci 13 10323 g010
Table 1. Constraint conditions for solving the height of the velocity discontinuity line.
Density (kg·m−3)Polar Angle (°)Angle of
Internal
Friction (°)
Cohesion (MPa)Polar
Radius (m)
Pressure (MPa)
γ1γ2γ3θAθBθCφ1φ2φ3C1C2C3rOBrOCqσ
24502060135027154638343112.210.880.218.596.20.30.1
Table 2. Similar material ratios and mechanical parameters.
NumberLithologyDensity (kg·m−3)Ratio Number Thickness (cm)Compressive Strength (MPa)
1Siltstone17228:3:76.00.68
2Sandy mudstone15698:2:84.00.50
3No. 5 coal seam84720:20:1:522.00.13
4Carbon mudstone16598:2:82.50.43
5fine sandstone16897:2:86.50.44
6Siltstone17198:3:73.00.45
7No. 4 coal seam85020:20:1:56.00.13
8Mudstone16647:2:81.50.45
9Siltstone17238:3:726.00.88
10Medium grained sandstone16598:4:62.50.86
Table 3. Stepwise loading table of the experimental model.
Loading SequenceStress in the Surrounding Rock (MPa)Applied Vertical (kN)
Step 11.59.38
Step 23.018.75
Step 34.528.13
Step 46.037.50
Step 57.546.88
Step 69.056.25
Step 710.5 (K = 1.17)65.63
Step 812.0 (K = 1.33)75.00
Step 913.5 (K = 1.50)84.38
Disclaimer/Publisher’s Note: The statements, opinions and data contained in all publications are solely those of the individual author(s) and contributor(s) and not of MDPI and/or the editor(s). MDPI and/or the editor(s) disclaim responsibility for any injury to people or property resulting from any ideas, methods, instructions or products referred to in the content.

