Article

Epicardial Adipose Tissue Changes during Statin Administration in Relation to the Body Mass Index: A Longitudinal Cardiac CT Study

1
Department of Biomedicine, Neuroscience and Advanced Diagnostics (BiND), AOUP Paolo Giaccone, University of Palermo, 90127 Palermo, Italy
2
Department of Health Promotion, Mother and Child Care, Internal Medicine and Medical Specialties (ProMISE), AOUP Paolo Giaccone, University of Palermo, 90127 Palermo, Italy
3
Department of Radiology, The Institute for Hospitalization and Healthcare (IRCCS) SYNLAB SDN, 80143 Naples, Italy
4
Institute for High-Performance Computing and Networking, National Research Council (ICAR-CNR), 90146 Palermo, Italy
5
Department of Information and Electrical Engineering and Applied Mathematics (DIEM), University of Salerno, 84084 Fisciano, Italy
6
Department of Radiology, Fondazione Monasterio/CNR, 56124 Pisa, Italy
7
Department of Radiology, University of Cagliari, 09124 Cagliari, Italy
8
Department of Public Health, University of Naples “Federico II”, 80131 Naples, Italy
*
Author to whom correspondence should be addressed.
These authors contributed equally to this work.
Appl. Sci. 2023, 13(19), 10709; https://doi.org/10.3390/app131910709
Submission received: 19 July 2023 / Revised: 8 September 2023 / Accepted: 14 September 2023 / Published: 26 September 2023

Abstract

:

Featured Application

This study proposes an epicardial adipose tissue (EAT) analysis using an advanced computer-assisted approach in a population of patients undergoing Cardiac CT (CCT) during statin administration, in relation to the body mass index (BMI).

Abstract

The epicardial adipose tissue (EAT) is the visceral fat located between the myocardium and the pericardium. We aimed to perform a longitudinal evaluation of the epicardial adipose tissue using an advanced computer-assisted approach in a population of patients undergoing Cardiac CT (CCT) during statin administration, in relation to their body mass index (BMI). We retrospectively enrolled 95 patients [mean age 62 ± 10 years; 68 males (72%) and 27 females (28%)] undergoing CCT for suspected coronary artery disease during statin administration. CCT was performed at two subsequent time points. At the second CCT, EAT showed a mean density increase (−75.59 ± 7.0 HU vs. −78.18 ± 5.3 HU, p < 0.001) and a volume decrease (130 ± 54.3 cm3 vs.142.79 ± 56.9 cm3, p < 0.001). Concerning coronary artery EAT thickness, a reduction was found at the origin of the right coronary artery (13.26 ± 5.2 mm vs. 14.94 ± 5.8, p = 0.001) and interventricular artery (8.22 ± 3.7 mm vs. 9.13 ± 3.9 mm, p = 0.001). The quartile (Q) attenuation percentage (%) distribution of EAT changed at the second CCT. The EAT % distribution changed by the BMI in Q1 (p = 0.015), Q3 (p = 0.001) and Q4 (p = 0.043) at the second CCT, but the normal-BMI and overweight/obese patients showed a similar response to statin therapy in terms of quartile distribution changes. In conclusion, statins may determine significant changes in EAT quantitative and qualitative characteristics detected by CCT; the BMI influences the EAT composition, but statins determine a similar response in quartile distribution’s variation, irrespective of the BMI.

1. Introduction

Epicardial adipose tissue (EAT) represents a deposit of visceral fat located between the external surface of the myocardium and the internal surface of the pericardium [1]. EAT plays an important role of mechanical support; furthermore, it is reported to have complex endocrine functions. EAT can also contribute to the development of coronary atherosclerosis, due to the local production of pro-inflammatory cytokines, through autocrine–paracrine effects [2,3,4,5,6,7,8]. Therefore, EAT may be considered a novel cardiovascular risk factor [7].
Obesity is a known risk factor associated with reduced life expectancy and higher cardiovascular morbidity and mortality [9]; obesity seems to be independent of other cardiovascular risk factors, contributing directly to dyslipidemia, diabetes and high blood pressure [10].
In the last decades, great advances have been achieved in the pharmacological field in the treatment of cardiac and cerebrovascular diseases. In this regard, a prominent role is played by statins, which have become a first-line treatment, both for primary and for secondary cardiovascular prevention. Statins (or 3-hydroxy-methylglutaryl coenzyme A-HMG-CoA reductase inhibitors) prevent the synthesis of cholesterol, but at the same time inhibit the synthesis of essential isoprenoid intermediates. In addition to their low-density lipoprotein cholesterol-lowering effect, statins are reported to have anti-inflammatory, antioxidant, anti-proliferative properties with immunomodulatory implications [11].
Cardiac CT (CCT) is a reliable tool for the quantification of EAT, both in calcium score and in post-contrast image datasets [12,13].
The aim of our study was to perform an analysis of EAT density, thickness and volume using an advanced computer-assisted approach in a population of patients undergoing CCT during statin administration, in relation to their body mass index (BMI).

2. Materials and Methods

2.1. Study Population

We retrospectively enrolled 95 patients [mean age 62 ± 10 years; 68 males (72%) and 27 females (28%)] undergoing CCT for suspected coronary artery disease during statin administration. Institutional review board approval was obtained, and informed consent was waived, since this was a retrospective study. CCT was performed at two subsequent time points. Twenty-nine patients (31%) assumed statins prior to the first CCT. The patients’ characteristics are indicated in Table 1.
The exclusion criteria were the following: renal failure, pregnancy, respiratory failure, and statin discontinuation between the first and the second CCT.

2.2. Cardiac CT Scanning Protocol

Examinations were performed with a dual-source CT scanner (Definition FLASH, Siemens Healthcare, Forchheim, Germany) with standard parameters [14,15]; retrospective electrocardiogram gating with prospective modulation of the dose was used.
The angiography scan was performed with the following parameters: number of slices per rotation, 62 × 2 × 2; slice thickness, 0.6 mm; gantry rotation time, 280 ms; temporal resolution, 75 ms; tube voltage, 100–120 kV, tube current, 320–370 mAs, effective slice thickness, 0.6–0.75 mm; reconstruction increment, 0.4 mm; FOV 150–160 mm [14].
A bolus of 80 mL of non-ionic iodinated contrast agent (Iomeprol, Iomeron 400, Bracco, Milan, Italy) was administered at an injection rate of 5 mL/s using a dual-head power automatic injector (Stellant®; MedRAD®, Pittsburgh, PA, USA) connected to an 18-gauge needle cannula placed in the right antecubital vein.

2.3. Image Analysis

EAT was detected and analyzed with a semi-automatic approach, exploited to implement a custom tool—provided with a user-friendly Graphical User Interface (GUI)—able to support the radiologists in the procedure of EAT segmentation and quantification. The tool takes the CCT series as input and with few simple steps yields the EAT and automatically performs the quantification of the fat quartiles and their distribution around the heart. The whole semi-automatic procedure significantly minimizes user intervention [13].
With more details [13], the evaluation of the clinical value of statin administration was performed by segmenting two CCT series at subsequent time points and quantifying the difference in terms of EAT volume, density, and quartile distribution. Figure 1 shows the overall flow diagram of the computer-assisted approach with the processing pipeline.
In the processing chain, the main steps are related to:
  • ROI Selection: after loading the CCT series, the operator selects the regions containing the heart trough free hand or polygonal lasso strategies, this procedure was implemented and ameliorated by receiving clinician’s feedback.
  • ROI Interpolation: after reference ROIs are selected by the operator, the system interpolates the missing ROIs in the other slices included in the volume of interest. This procedure made it possible to reduce manual effort of the operator.
  • ROI Refinement: This option allowed the operator to refine one or more interpolated ROIs. After a single slice refinement, the modification was propagated to the ROIs next to the selected slice with a further automatic interpolation. This step ensured shape and spatial continuity among refined and unrefined ROIs.
  • Epicardial Adipose Tissue Segmentation: Segmentation was applied only to the volume inside the ROI using an efficient double-threshold algorithm, analyzing the voxels having HU values in the selected range. In general, this range is kept fixed, but it can be modified according to the different CT scanners or acquisition thickness protocols.
  • Quartiles and Volume Computation: the fat quartiles were computed considering the range of interest in terms of Hounsfield Units (HU) and volume. In addition, the mean HU value, the percentage, and the volume (overall and of each quartile) were calculated.
The output provided the overall EAT volume (in cm3) as well as the area/volume for each single image. The voxels representing EAT were used for calculation only when they had HU values within a pre-specified range [16]. The HU range of interest was set between −175 HU and −15 HU, and the quartiles (Q) of attenuation (i.e., Q1, Q2, Q3, Q4) considering the selected interval of density, were computed accordingly [12,13]. In addition, the mean HU value, and the percentages of distribution with respect to the whole EAT volume were calculated. Figure 2 shows an example of segmented fat with the corresponding quartiles, which are represented in different colors and overlapped on the native CCT image.
The attenuation values (HU) were also measured in the antero-superior mediastinum, near the coronary arteries (proximal right coronary artery, left main trunk, left descending coronary artery, circumflex artery), and in the posterior mediastinum, both in the first and in the second CCT. The epicardial and subcutaneous thoracic fat thicknesses were also measured.

2.4. Statistical Analysis

The continuous variables are expressed as mean ± standard deviation (SD), the categorical variables as absolute numbers and percentages. All quantitative variables were tested for normality by means of a skewness and kurtosis test and presented as mean (±SD). The body mass index (BMI) was classified into four categories: normal (BMI ≤ 24.9), overweight (BMI between 25 and 29.9), obese group I (BMI between 30 and 34.9) and obese group II (BMI ≥ 35), according to the severity of obesity.
The paired Student’s t test was used to assess statistically significant differences between the first and the second CCT for quantitative variables.
EAT distribution into quartiles at the two CCT examinations in relation to the BMI was assessed through either ANOVA or the non-parametric equality of medians test, as appropriate. The Bartlett’s test was used to assess the homoscedasticity assumption before performing a parametric ANOVA test. Multivariate multiple linear regression was performed to assess EAT distribution into quartiles at the second CCT related to the distribution into quartiles at the first CCT. The individual coefficients and standard errors produced were identical to those that would be produced by estimating each equation separately. Multivariate regression also estimated the between-equation covariances. The analysis was stratified by BMI, so that two separate models were fitted for 30 normal BMI and 65 overweight/obese patients, respectively. The results are presented as regression coefficients (RC) and 95% confidence intervals and are expressed as the variation in each quartile at the second CCT that could be observed for a unitary variation in each quartile at the first CCT and other covariates. As the multivariate linear regression was not normally distributed in the Q4 at the second CCT, a sensitivity analysis was performed by deleting four observations reporting an extreme fat % (>45%). A 0.05 cut-off was used to assess statistically significant results. Stata IC/15.1 was used for statistical analysis.

3. Results

The mean time interval between the first and the second CCT during statin assumption was 890 ± 583 days (range 91–2802 days). The mean age of the patients who underwent the first CCT was 62 ± 10 years, while the average age of the patients who underwent the second CCT after statin administration was 64 ± 10 years. According to the BMI, the population included 30 normal-weight (32%), 41 overweight (43%), 17 obese I (18%) and 7 obese II (7%) patients. Overall, EAT mean density significantly increased between the first and the second CCT (−78.18 ± 5.3 HU vs. −75.59 ± 7.0 HU, p < 0.001), and no significant regional density values differences were observed (Table 2).
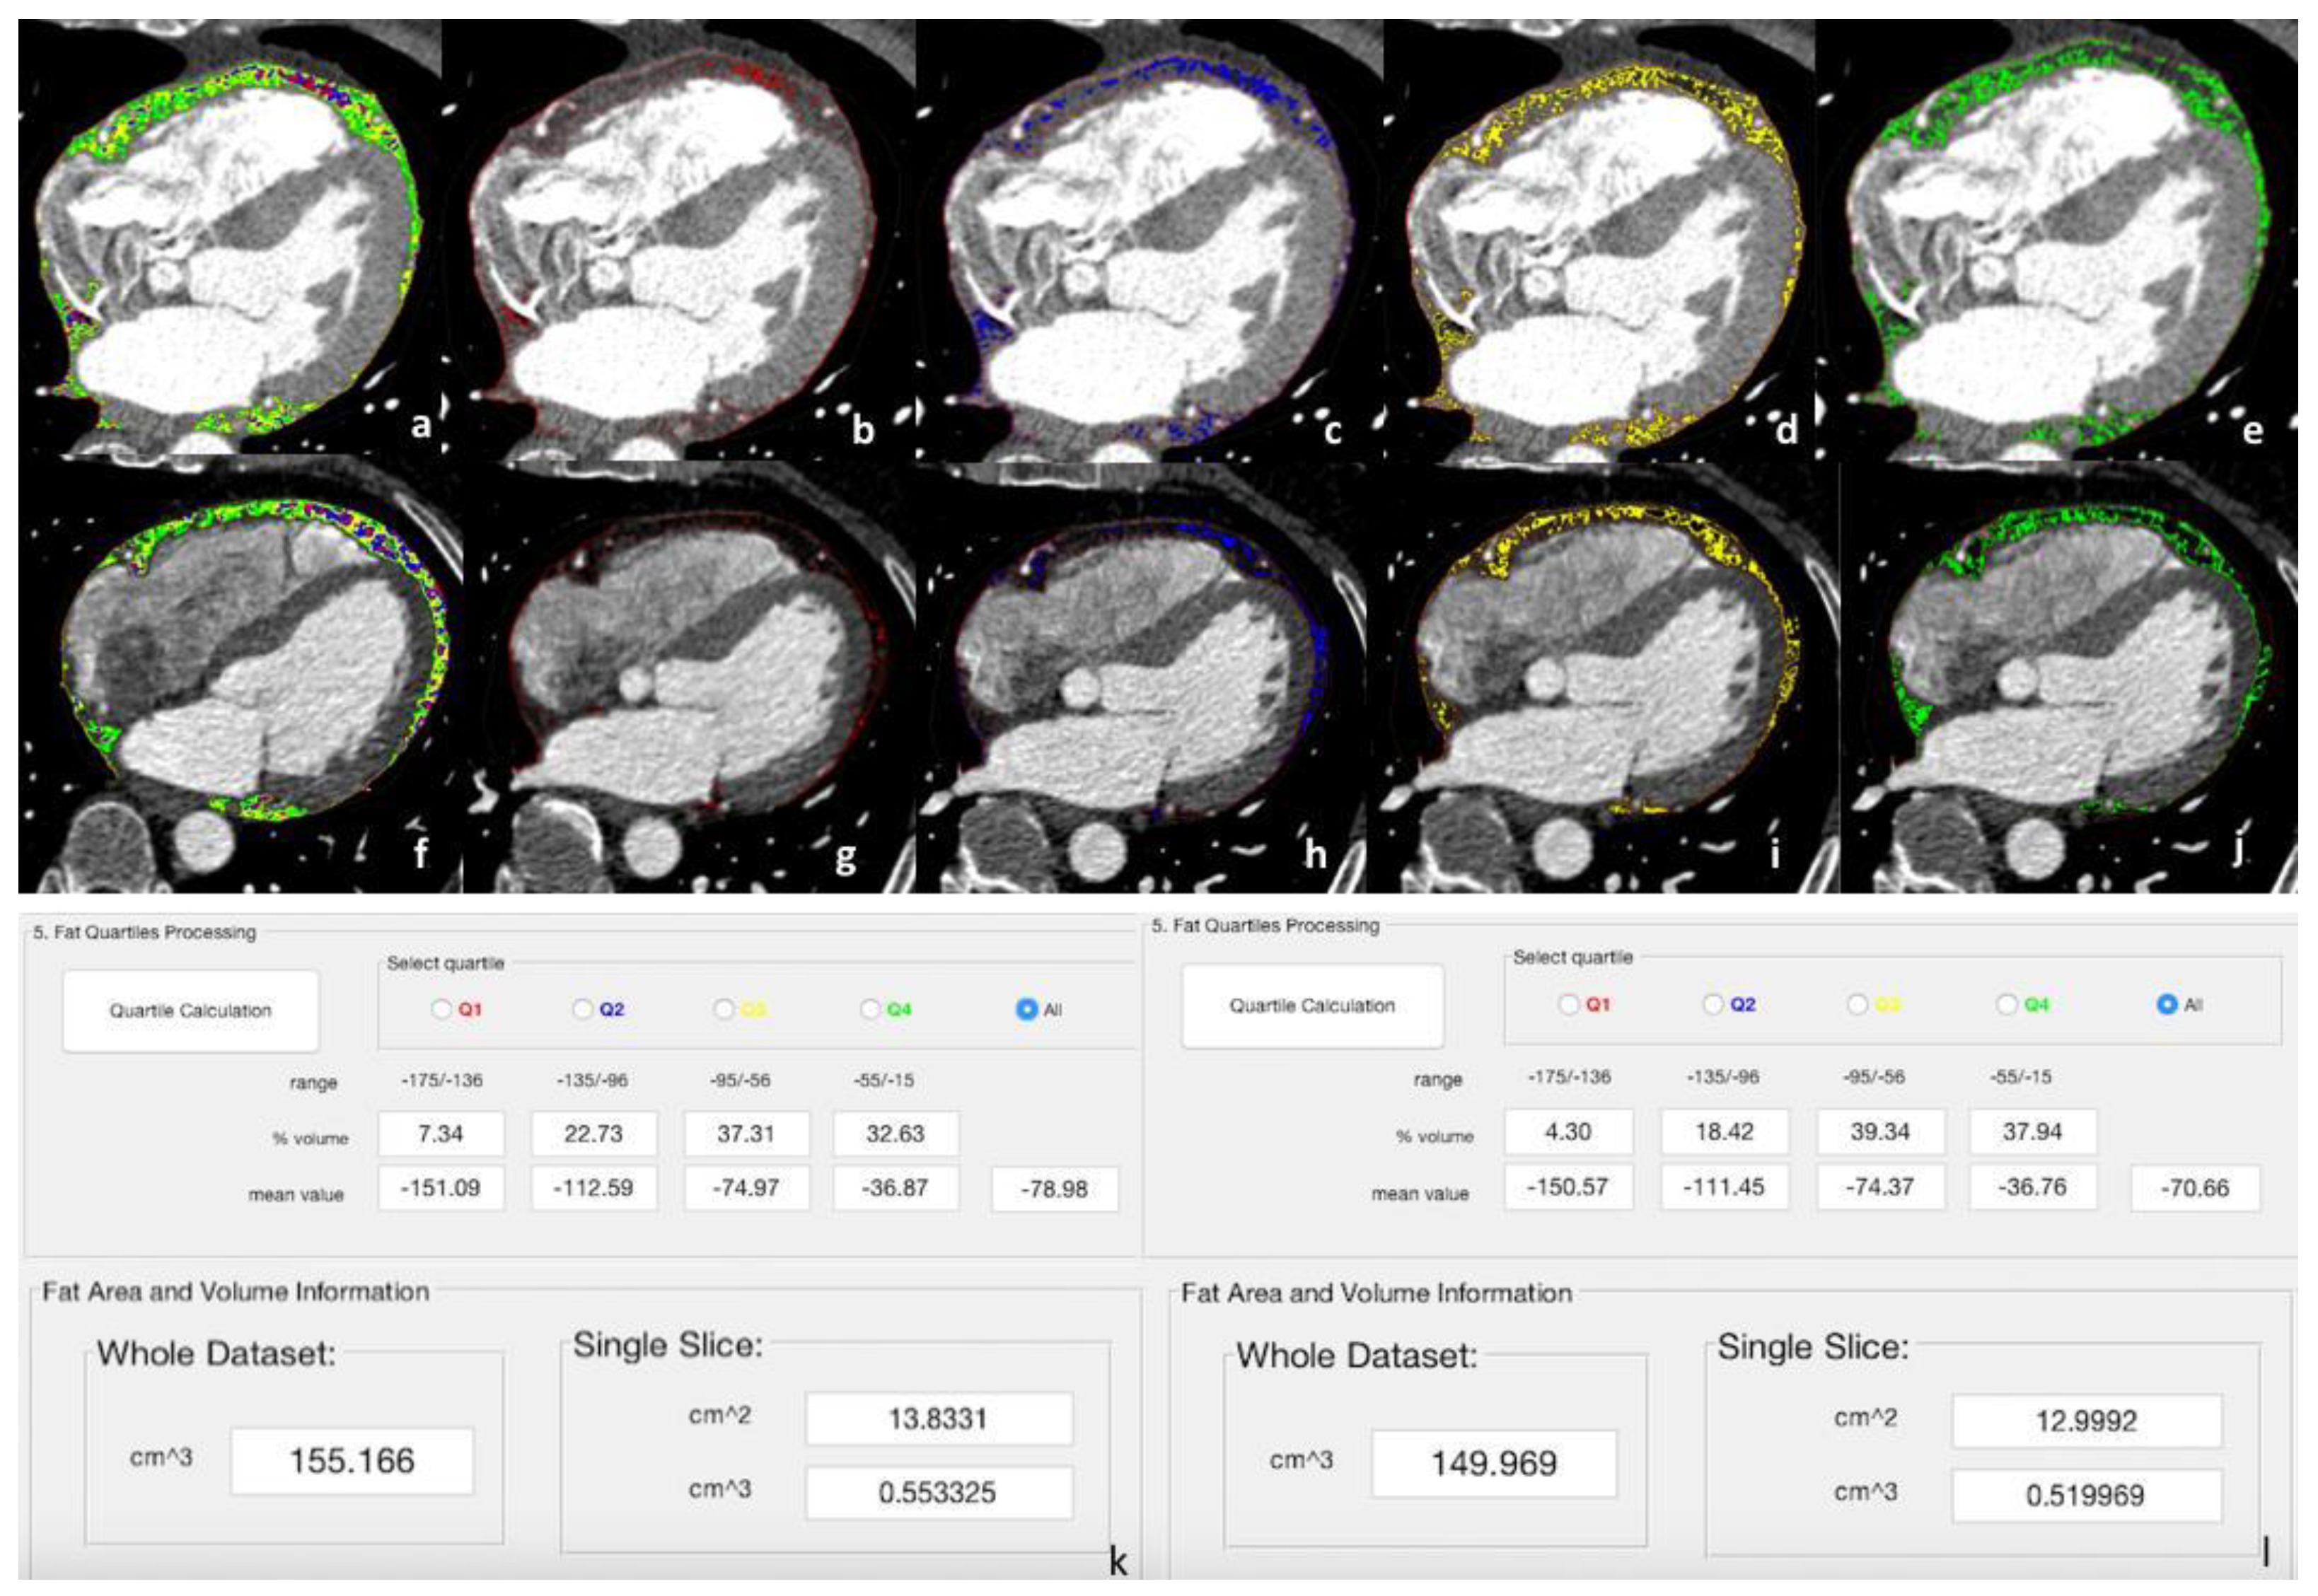
EAT volume decreased at the second CCT (mean value 130 ± 54.3 cm3 vs. 142.79 ± 56.9 cm3, p < 0.001) (Figure 3) in 79 patients (83%); 10 patients (11%) showed a similar volume, and 6 patients (6%) presented an increased volume.
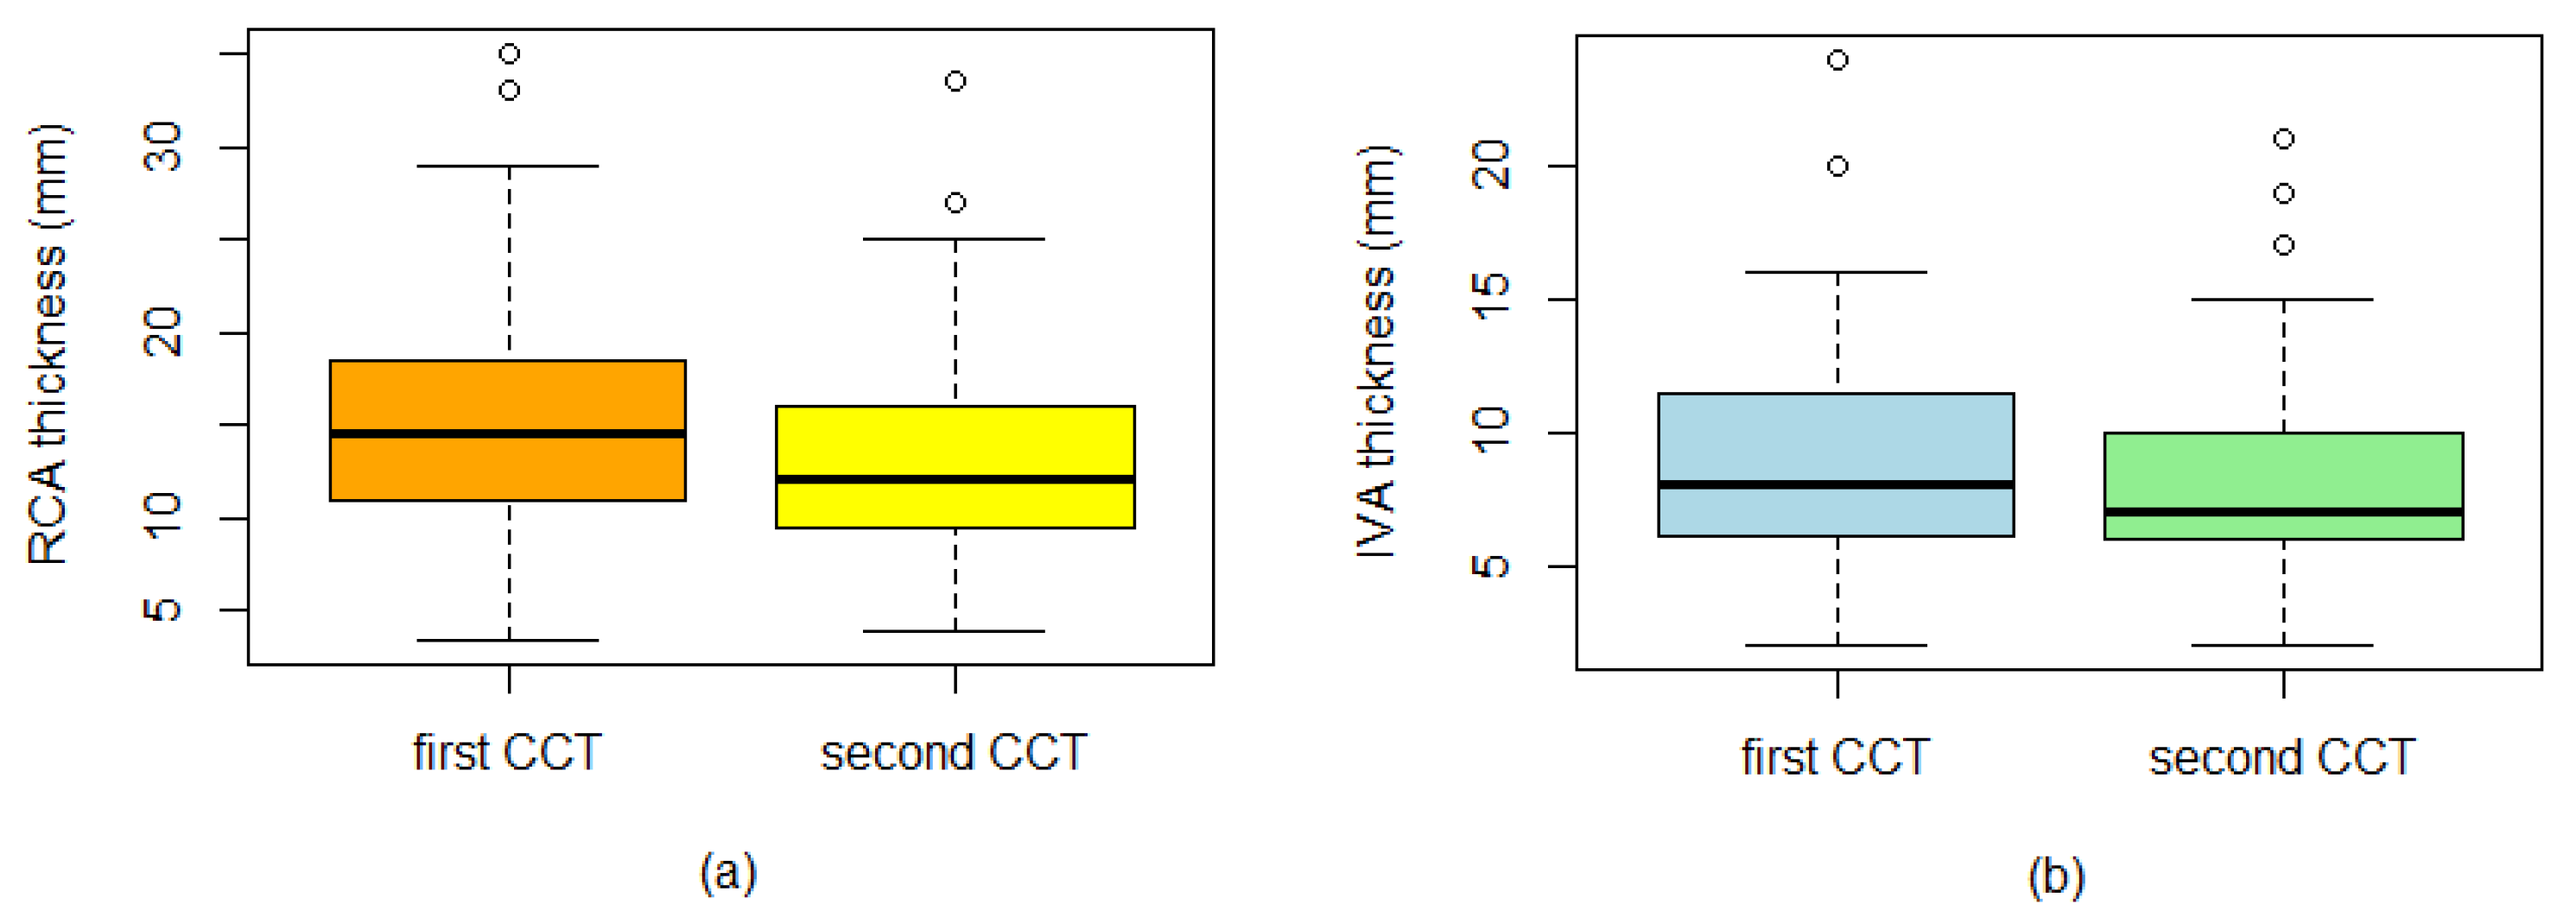
Concerning coronary arteries EAT thickness, a significant reduction was found for the right coronary artery (13.26 ± 5.2 mm vs. 14.94 ± 5.8 mm, p = 0.001) and the interventricular artery (8.22 ± 3.7 mm vs. 9.13 ± 3.9 mm, p = 0.001) following statin therapy (Figure 4). The epicardial and subcutaneous fat thickness values are shown in Table 3.
A variation of density after statin assumption at the second CCT was observed in terms of quartile percentage (%) distribution. A significant variation in terms of EAT % distribution after statin administration was found in Q1 (range −175/−136 HU; 6% vs. 7%, p < 0.05), Q2 (range −135/−96 HU; 21% vs. 23%, p < 0.05) and Q4 (range −55/−15 HU; 35% vs. 32%, p < 0.05). Only the Q3 (range −95/−56 HU) did not show a significant % variation (38% vs. 36%, p > 0.05).
The EAT % distribution by quartile both in the first and in the second CCT could be assumed normal, except for the Q4 (p = 0.048). The EAT % distribution changed with the BMI in Q1 (p = 0.015), Q3 (p = 0.001) and Q4 (p = 0.043) at the second CCT (Table 4).
Among thirty patients with normal BMI, a unitary increase in EAT % in the Q1 at the first CCT predicted an increase in the Q1 (RC = 1.12, 95% CI = [0.26; 1.98]) and a decrease in the Q3 (RC = −1.09, 95% CI = [−1.97; −0.21]) at the second CCT. Among sixty-five overweight and obese patients, a unitary increase in EAT % in the Q1 at the first CCT predicted an increase in the Q1 (RC = 0.67, 95% CI = [0.11; 1.24]) and a decrease in the Q3 (RC = −0.83, 95% CI = [−1.56; −0.09]) at the second CCT. Moreover, these patients also showed an increment in EAT % in the Q4 (RC = 2.03; 95%CI = [−0.19; 4.24]), which was the fat quartile with a more positive density.
One of the four patients reporting >45% fat in the Q4 at the second CCT was normal-weight, while the other three were overweight/obese. These observations were excluded, and multivariate multiple linear regression analysis was repeated on two reduced patient groups. A sensitivity analysis confirmed the results in the normal BMI group. A unitary increase in EAT % in the Q1 at the first CCT confirmed an increase in the Q1 (RC = 1.08, 95% CI = [0.17; 1.99], p = 0.023) and a decrease in the Q3 (RC = −1.21, 95% CI = [−2.10; −0.31], p = 0.011) at the second CCT. Similarly, the results for the overweight/obese group were confirmed. A unitary increase in EAT % in the Q1 in the first CCT predicted an increase in the Q1 (RC = 0.68, 95% CI = [0.10; 1.25], p = 0.022) and a decrease in the Q3 (RC = −0.82, 95% CI = [−1.56; −0.09], p = 0.029) at the second CCT.

4. Discussion

The peculiarity of EAT lies both in its specific anatomic site and, especially, in its histological, biochemical and functional properties [3,4,5,6]. According to the literature, there is a close correlation between EAT amount and increased cardiovascular risk [5,7,8,17]. Cytokines, such as IL-6 and TNF-α, promote a series of negative cascade effects including the onset of insulin resistance, inhibiting the functions performed by insulin and increasing lipolysis and lipogenesis. Epicardial fat is a metabolically active organ, being a fount not only of pro-inflammatory adipokines but also of anti-inflammatory mediators such as adiponectin [18].
Echocardiography, cardiac magnetic resonance and CCT can be used to quantify EAT distribution and volume [7,18]. Due to its high spatial resolution, dedicated software and post-processing techniques, CCT is the method of choice [19]. In the literature, the attenuation thresholds for post-contrast CCT epicardial fat identification are variable and usually range from −250/−190 HU, as regards the lower limit, to −50/−5 HU for the upper threshold, with intermediate values between the limit values [20,21,22].
A modified range between −175 and −15 HU for CCT images was proposed, due to the relative contrast enhancement of EAT [12].
We already tested the segmentation accuracy of our software by calculating the Dice Similarity Coefficient (DSC) (92.48%) and the Mean Absolute Distance (MAD) (2.87) in the CCT datasets; we also calculated the correlation between the ground-truth epicardial fat volume and the corresponding automated measurement with the Pearson and Spearman coefficients, obtaining 0.9591 and 0.9490 for the calcium score and 0.9513 and 0.9319 for the CCT datasets, respectively [13].
Statins represent the targeted treatment for both the primary and the secondary prevention of cardiovascular diseases. Statins are not just hypocholesterolemic drugs, thanks to their pleiotropic effect, they also act at a systemic level, reducing the risk of morbidity and mortality of cardiac and cerebrovascular diseases, by decreasing endothelial dysfunction [23].
So, in addition to their use for the treatment of hyperlipidemia and dyslipidemia, statins have a broad spectrum of clinical indications and are administered, for example, for the primary and secondary prevention of atherosclerotic cardiovascular disease and atherosclerosis [24].
The analysis of epicardial fat through a computer application could allow a more detailed global analysis of cardiovascular risk in selected patients. Several epidemiological studies showed that cardiovascular risk factors are linked to endothelial dysfunction [23,25]. Clinically, the improvement of the endothelial function may explain the reduction of ischemic episodes in patients treated with statins. Statins promote a reduction in the inflammatory status, decreasing the TNF-α and IL-6 levels and inhibiting the NF-kB protein pathway [26]. Recently, EAT has become a pharmacological target of statin therapy.
Park et al. [27] demonstrated that the thickness of EAT decreased more in patients treated with atorvastatin than in the controls treated with the simvastatin–ezetimibe combination. Alexopoulos et al. [28] demonstrated an EAT volume reduction at CCT in post-menopausal women with dyslipidemia treated with atorvastatin. At the end of the follow-up, there was a significant reduction in the volume of EAT in the atorvastatin group compared to the pravastatin group. The effect of atorvastatin on EAT was independent of the blood cholesterol levels and the progression of coronary artery disease. Parisi et al. [29], in a population of patients with aortic stenosis, demonstrated that patients treated with statins had lower epicardial fat thickness. Our study showed that statin administration caused significant quantitative (i.e., volume and thickness reduction) and qualitative (i.e., overall density and quartiles attenuation distribution) EAT changes.
Obesity is a known risk factor associated with reduced life expectancy, higher cardiovascular morbidity and mortality [10].
The presence of a great amount of fat cells, as in obese patients, is associated with a chronic state of inflammation. The immune cells of the adipose tissue, whose number increases as obesity progresses, are the main actors of obesity-induced systemic inflammation [30].
Obesity, together with other risk factors, such as diabetes, is associated with an alteration of EAT with a pro-inflammatory state also through a genomic effect [31].
Our population showed a mean density increase between the first and the second CCT. The literature results are controversial about an effect on EAT density after statin administration. According to the study of Raggi et al. [32], statins induced a decrease in EAT density over time in a population of 420 postmenopausal women who underwent chest computed tomographic scans; however, in this study, EAT density was measured near the proximal right coronary artery and far from any area of coronary artery calcium within the selected region of interest; instead, in our study, we evaluated the mean global density with a dedicated semiautomated software, so analysis techniques may affect the results.
Anyway, apart from the different analysis technique, our cohort was rather smaller, was mainly composed of male patients (72%), and we did not analyze the differences between males and females that could influence fat composition and therapy response.
Nerlekar et al. [33] analyzed the epicardial adipose tissue in a population of 90 patients with non-obstructive CAD at a baseline CCT, undergoing a second CCT. The authors showed a mean epicardial adipose tissue volume increase at the follow-up CCT, with a decrease in mean density. Regarding patients assuming statins at the baseline CCT, no differences were found. In our population, only 31% of the patients was on statin therapy at the baseline CCT, and all patients assumed statins at the second CCT. Our population showed an EAT mean density increase and a volume decrease.
Furthermore, EAT presents regional density variations, which can be more accurately displayed by quartile analysis, as shown in our study. The distribution of EAT quartile % changed at the second CCT and by BMI. However, a similar response to statin administration was observed in normal-BMI and in overweight/obese patients. A variation in fat quality during statin therapy could in part explain statins’ pleiotropic effects; in the future, advanced texture analyses [34] and radiomic-based applications [35,36] customized for EAT analysis could better investigate such effects.
A prospective study with a more homogeneous cohort, a standard interval between the two CCT and an analysis considering the whole pharmacological therapy administered to the studied patients could provide more detailed information.
Concerning the Body Mass Index and its role in epicardial fat response to statin therapy, the EAT % distribution changed by BMI in Q1 (p = 0.015), Q3 (p = 0.001) and Q4 (p = 0.043) at the second CCT, but the normal-BMI and overweight/obese patients showed a similar response to statin therapy in terms of quartile distribution changes. So, we can assume that the BMI influences the epicardial fat composition, but the response to statins is not affected by the BMI.
Furthermore, EAT seems to be a unique and independent cardiovascular risk marker [33].

Limitations of the Study

Our study has some limitations. First, the size of the sample examined was rather small and the population was composed of 72% of male patients. Therefore, it would be desirable in the future to further expand the study population. Second, we did not analyze the effects of the statin type and the dose influence on EAT changes nor the possible influence of other therapies. Finally, the time interval between the first and the second CCT was not constant, which caused variability. Twenty-nine patients (31%) assumed statins prior to the first CCT, and no statin discontinuation occurred between the first and the second CCT.

5. Conclusions

Our study showed that statins may determine significant changes on EAT quantitative and qualitative characteristics detected by CCT. The BMI influences the epicardial fat composition, but statins determine a similar response in quartile distribution’s variation, irrespective of the BMI. The non-invasive quantification of EAT should be performed in a larger population for the assessment of individual preventive and therapeutic strategies for coronary artery disease.

Author Contributions

Conceptualization, L.L.G., P.T., E.M., F.C., C.C., L.S., E.B. and R.L.; methodology, L.L.G. and P.T.; software, C.M, L.R. and S.V.; validation, C.M., P.T. and L.L.G.; formal analysis, C.F. and D.M.; investigation, C.F.; resources, S.V., C.M, L.R., F.C. and B.P.; data curation, C.F.; writing—original draft preparation, P.T. and L.L.G.; writing—review and editing, P.T., L.L.G. and F.C.; visualization, P.T. and L.L.G.; supervision, F.C., P.T., L.L.G., M.G. and M.M. All authors have read and agreed to the published version of the manuscript.

Funding

This research received no external funding.

Institutional Review Board Statement

The study was approved by the Ethics Committee of the Province of Parma (protocol AACT002, 21 September 2010).

Informed Consent Statement

Informed consent was waived since this was a retrospective study.

Data Availability Statement

Data sharing not applicable.

Conflicts of Interest

The authors declare no conflict of interest.

References

  1. Sacks, H.S.; Fain, J.N. Human Epicardial Adipose Tissue: A Review. Am. Heart J. 2007, 153, 907–917. [Google Scholar] [CrossRef]
  2. Iacobellis, G.; Corradi, D.; Sharma, A.M. Epicardial Adipose Tissue: Anatomic, Biomolecular and Clinical Relationships with the Heart. Nat. Clin. Pract. Cardiovasc. Med. 2005, 2, 536–543. [Google Scholar] [CrossRef]
  3. Chen, X.; Jiao, Z.; Wang, L.; Sun, Z.; Wei, Y.; Wang, X.; Xia, D. Roles of Human Epicardial Adipose Tissue in Coronary Artery Atherosclerosis. J. Huazhong Univ. Sci. Technolog. Med. Sci. 2010, 30, 589–593. [Google Scholar] [CrossRef]
  4. Fain, J.N.; Sacks, H.S.; Bahouth, S.W.; Tichansky, D.S.; Madan, A.K.; Cheema, P.S. Human Epicardial Adipokine Messenger RNAs: Comparisons of Their Expression in Substernal, Subcutaneous, and Omental Fat. Metabolism 2010, 59, 1379–1386. [Google Scholar] [CrossRef]
  5. Karastergiou, K.; Evans, I.; Ogston, N.; Miheisi, N.; Nair, D.; Kaski, J.-C.; Jahangiri, M.; Mohamed-Ali, V. Epicardial Adipokines in Obesity and Coronary Artery Disease Induce Atherogenic Changes in Monocytes and Endothelial Cells. Arterioscler. Thromb. Vasc. Biol. 2010, 30, 1340–1346. [Google Scholar] [CrossRef]
  6. Yudkin, J.S.; Eringa, E.; Stehouwer, C.D.A. “Vasocrine” Signalling from Perivascular Fat: A Mechanism Linking Insulin Resistance to Vascular Disease. Lancet 2005, 365, 1817–1820. [Google Scholar] [CrossRef]
  7. Iacobellis, G.; Ribaudo, M.C.; Assael, F.; Vecci, E.; Tiberti, C.; Zappaterreno, A.; Di Mario, U.; Leonetti, F. Echocardiographic Epicardial Adipose Tissue Is Related to Anthropometric and Clinical Parameters of Metabolic Syndrome: A New Indicator of Cardiovascular Risk. J. Clin. Endocrinol. Metab. 2003, 88, 5163–5168. [Google Scholar] [CrossRef]
  8. Mazurek, T.; Zhang, L.; Zalewski, A.; Mannion, J.D.; Diehl, J.T.; Arafat, H.; Sarov-Blat, L.; O’Brien, S.; Keiper, E.A.; Johnson, A.G.; et al. Human Epicardial Adipose Tissue Is a Source of Inflammatory Mediators. Circulation 2003, 108, 2460–2466. [Google Scholar] [CrossRef]
  9. Khan, S.S.; Ning, H.; Wilkins, J.T.; Allen, N.; Carnethon, M.; Berry, J.D.; Sweis, R.N.; Lloyd-Jones, D.M. Association of Body Mass Index With Lifetime Risk of Cardiovascular Disease and Compression of Morbidity. JAMA Cardiol. 2018, 3, 280–287. [Google Scholar] [CrossRef]
  10. Powell-Wiley, T.M.; Poirier, P.; Burke, L.E.; Després, J.-P.; Gordon-Larsen, P.; Lavie, C.J.; Lear, S.A.; Ndumele, C.E.; Neeland, I.J.; Sanders, P.; et al. Obesity and Cardiovascular Disease: A Scientific Statement from the American Heart Association. Circulation 2021, 143, e984–e1010. [Google Scholar] [CrossRef]
  11. Kavalipati, N.; Shah, J.; Ramakrishan, A.; Vasnawala, H. Pleiotropic Effects of Statins. Indian J. Endocrinol. Metab. 2015, 19, 554–562. [Google Scholar]
  12. La Grutta, L.; Toia, P.; Farruggia, A.; Albano, D.; Grassedonio, E.; Palmeri, A.; Maffei, E.; Galia, M.; Vitabile, S.; Cademartiri, F.; et al. Quantification of Epicardial Adipose Tissue in Coronary Calcium Score and CT Coronary Angiography Image Data Sets: Comparison of Attenuation Values, Thickness and Volumes. Br. J. Radiol. 2016, 89, 20150773. [Google Scholar] [CrossRef]
  13. Militello, C.; Rundo, L.; Toia, P.; Conti, V.; Russo, G.; Filorizzo, C.; Maffei, E.; Cademartiri, F.; La Grutta, L.; Midiri, M.; et al. A Semi-Automatic Approach for Epicardial Adipose Tissue Segmentation and Quantification on Cardiac CT Scans. Comput. Biol. Med. 2019, 114, 103424. [Google Scholar] [CrossRef]
  14. Maffei, E.; Martini, C.; Rossi, A.; Mollet, N.; Lario, C.; Castiglione Morelli, M.; Clemente, A.; Gentile, G.; Arcadi, T.; Seitun, S.; et al. Diagnostic Accuracy of Second-Generation Dual-Source Computed Tomography Coronary Angiography with Iterative Reconstructions: A Real-World Experience. Radiol. Med. 2012, 117, 725–738. [Google Scholar] [CrossRef]
  15. Acquisition and Reconstruction Techniques for Coronary CT Angiography. Siemens Healthineers Scanner Platforms. Available online: https://cdn-corpweb.heartflow.com/assets/docs/Siemens-Cardiac-CCTA-Protocol_042617/Siemens-Cardiac-CCTA-Protocol_042617.html (accessed on 7 September 2023).
  16. Yoshizumi, T.; Nakamura, T.; Yamane, M.; Islam, A.H.; Menju, M.; Yamasaki, K.; Arai, T.; Kotani, K.; Funahashi, T.; Yamashita, S.; et al. Abdominal Fat: Standardized Technique for Measurement at CT. Radiology 1999, 211, 283–286. [Google Scholar] [CrossRef]
  17. Christensen, R.H.; von Scholten, B.J.; Hansen, C.S.; Jensen, M.T.; Vilsbøll, T.; Rossing, P.; Jørgensen, P.G. Epicardial Adipose Tissue Predicts Incident Cardiovascular Disease and Mortality in Patients with Type 2 Diabetes. Cardiovasc. Diabetol. 2019, 18, 114. [Google Scholar] [CrossRef]
  18. Iacobellis, G.; Barbaro, G. The Double Role of Epicardial Adipose Tissue as pro- and Anti-Inflammatory Organ. Horm. Metab. Res. 2008, 40, 442–445. [Google Scholar] [CrossRef]
  19. Marwan, M.; Achenbach, S. Quantification of Epicardial Fat by Computed Tomography: Why, When and How? J. Cardiovasc. Comput. Tomogr. 2013, 7, 3–10. [Google Scholar] [CrossRef]
  20. Milanese, G.; Silva, M.; Bruno, L.; Goldoni, M.; Benedetti, G.; Rossi, E.; Ferrari, C.; Grutta, L.L.; Maffei, E.; Toia, P.; et al. Quantification of Epicardial Fat with Cardiac CT Angiography and Association with Cardiovascular Risk Factors in Symptomatic Patients: From the ALTER-BIO (Alternative Cardiovascular Bio-Imaging Markers) Registry. Diagn. Interv. Radiol. 2019, 25, 35–41. [Google Scholar] [CrossRef]
  21. Taha, D.A.; El Shafey, R.A.A.; Hamesa, M.F.; Abu-Dewan, K.A.E.-W.; Nagy, H.A. Relationship between Epicardial Fat Volume Measured by Multi-Detector Computed Tomography and Coronary Artery Disease. Egypt J. Radiol. Nucl. Med. 2021, 52, 235. [Google Scholar] [CrossRef]
  22. Ueno, K.; Anzai, T.; Jinzaki, M.; Yamada, M.; Jo, Y.; Maekawa, Y.; Kawamura, A.; Yoshikawa, T.; Tanami, Y.; Sato, K.; et al. Increased Epicardial Fat Volume Quantified by 64-Multidetector Computed Tomography Is Associated with Coronary Atherosclerosis and Totally Occlusive Lesions. Circ. J. 2009, 73, 1927–1933. [Google Scholar] [CrossRef]
  23. Förstermann, U.; Li, H. Therapeutic Effect of Enhancing Endothelial Nitric Oxide Synthase (eNOS) Expression and Preventing eNOS Uncoupling. Br. J. Pharmacol. 2011, 164, 213–223. [Google Scholar] [CrossRef]
  24. Sizar, O.; Khare, S.; Jamil, R.T.; Talati, R. Statin Medications. In StatPearls; StatPearls Publishing: St. Petersburg, FL, USA, 2023. [Google Scholar]
  25. Grassi, D.; Desideri, G.; Ferri, C. Cardiovascular Risk and Endothelial Dysfunction: The Preferential Route for Atherosclerosis. Curr. Pharm. Biotechnol. 2011, 12, 1343–1353. [Google Scholar] [CrossRef]
  26. Bedi, O.; Dhawan, V.; Sharma, P.L.; Kumar, P. Pleiotropic Effects of Statins: New Therapeutic Targets in Drug Design. Naunyn. Schmiedebergs. Arch. Pharmacol. 2016, 389, 695–712. [Google Scholar] [CrossRef]
  27. Park, J.-H.; Park, Y.S.; Kim, Y.J.; Lee, I.S.; Kim, J.H.; Lee, J.-H.; Choi, S.W.; Jeong, J.-O.; Seong, I.-W. Effects of Statins on the Epicardial Fat Thickness in Patients with Coronary Artery Stenosis Underwent Percutaneous Coronary Intervention: Comparison of Atorvastatin with Simvastatin/ezetimibe. J. Cardiovasc. Ultrasound 2010, 18, 121–126. [Google Scholar] [CrossRef]
  28. Alexopoulos, N.; Melek, B.H.; Arepalli, C.D.; Hartlage, G.-R.; Chen, Z.; Kim, S.; Stillman, A.E.; Raggi, P. Effect of Intensive versus Moderate Lipid-Lowering Therapy on Epicardial Adipose Tissue in Hyperlipidemic Post-Menopausal Women: A Substudy of the BELLES Trial (Beyond Endorsed Lipid Lowering with EBT Scanning). J. Am. Coll. Cardiol. 2013, 61, 1956–1961. [Google Scholar] [CrossRef]
  29. Parisi, V.; Petraglia, L.; D’Esposito, V.; Cabaro, S.; Rengo, G.; Caruso, A.; Grimaldi, M.G.; Baldascino, F.; De Bellis, A.; Vitale, D.; et al. Statin Therapy Modulates Thickness and Inflammatory Profile of Human Epicardial Adipose Tissue. Int. J. Cardiol. 2019, 274, 326–330. [Google Scholar] [CrossRef]
  30. Ghigliotti, G.; Barisione, C.; Garibaldi, S.; Fabbi, P.; Brunelli, C.; Spallarossa, P.; Altieri, P.; Rosa, G.; Spinella, G.; Palombo, D.; et al. Adipose Tissue Immune Response: Novel Triggers and Consequences for Chronic Inflammatory Conditions. Inflammation 2014, 37, 1337–1353. [Google Scholar] [CrossRef]
  31. Vyas, V.; Blythe, H.; Wood, E.G.; Sandhar, B.; Sarker, S.-J.; Balmforth, D.; Ambekar, S.G.; Yap, J.; Edmondson, S.J.; Di Salvo, C.; et al. Obesity and Diabetes Are Major Risk Factors for Epicardial Adipose Tissue Inflammation. JCI Insight 2021, 6, 145495. [Google Scholar] [CrossRef]
  32. Raggi, P.; Gadiyaram, V.; Zhang, C.; Chen, Z.; Lopaschuk, G.; Stillman, A.E. Statins Reduce Epicardial Adipose Tissue Attenuation Independent of Lipid Lowering: A Potential Pleiotropic Effect. J. Am. Heart Assoc. 2019, 8, e013104. [Google Scholar] [CrossRef]
  33. Nerlekar, N.; Thakur, U.; Lin, A.; Koh, J.Q.S.; Potter, E.; Liu, D.; Muthalaly, R.G.; Rashid, H.N.; Cameron, J.D.; Dey, D.; et al. The Natural History of Epicardial Adipose Tissue Volume and Attenuation: A Long-Term Prospective Cohort Follow-up Study. Sci. Rep. 2020, 10, 7109. [Google Scholar] [CrossRef]
  34. Agnese, M.; Toia, P.; Sollami, G.; Militello, C.; Rundo, L.; Vitabile, S.; Maffei, E.; Agnello, F.; Gagliardo, C.; Grassedonio, E.; et al. Epicardial and Thoracic Subcutaneous Fat Texture Analysis in Patients Undergoing Cardiac CT. Heliyon 2023, 9, e15984. [Google Scholar] [CrossRef]
  35. Liu, Z.; Deng, Y.; Wang, X.; Liu, X.; Zheng, X.; Sun, G.; Zhen, Y.; Liu, M.; Ye, Z.; Wen, J.; et al. Radiomics Signature of Epicardial Adipose Tissue for Predicting Postoperative Atrial Fibrillation after Pulmonary Endarterectomy. Front. Cardiovasc. Med. 2022, 9, 1046931. [Google Scholar] [CrossRef]
  36. Kolossváry, M.; Karády, J.; Kikuchi, Y.; Ivanov, A.; Schlett, C.L.; Lu, M.T.; Foldyna, B.; Merkely, B.; Aerts, H.J.; Hoffmann, U.; et al. Radiomics versus Visual and Histogram-Based Assessment to Identify Atheromatous Lesions at Coronary CT Angiography: An Ex Vivo Study. Radiology 2019, 293, 89–96. [Google Scholar] [CrossRef]
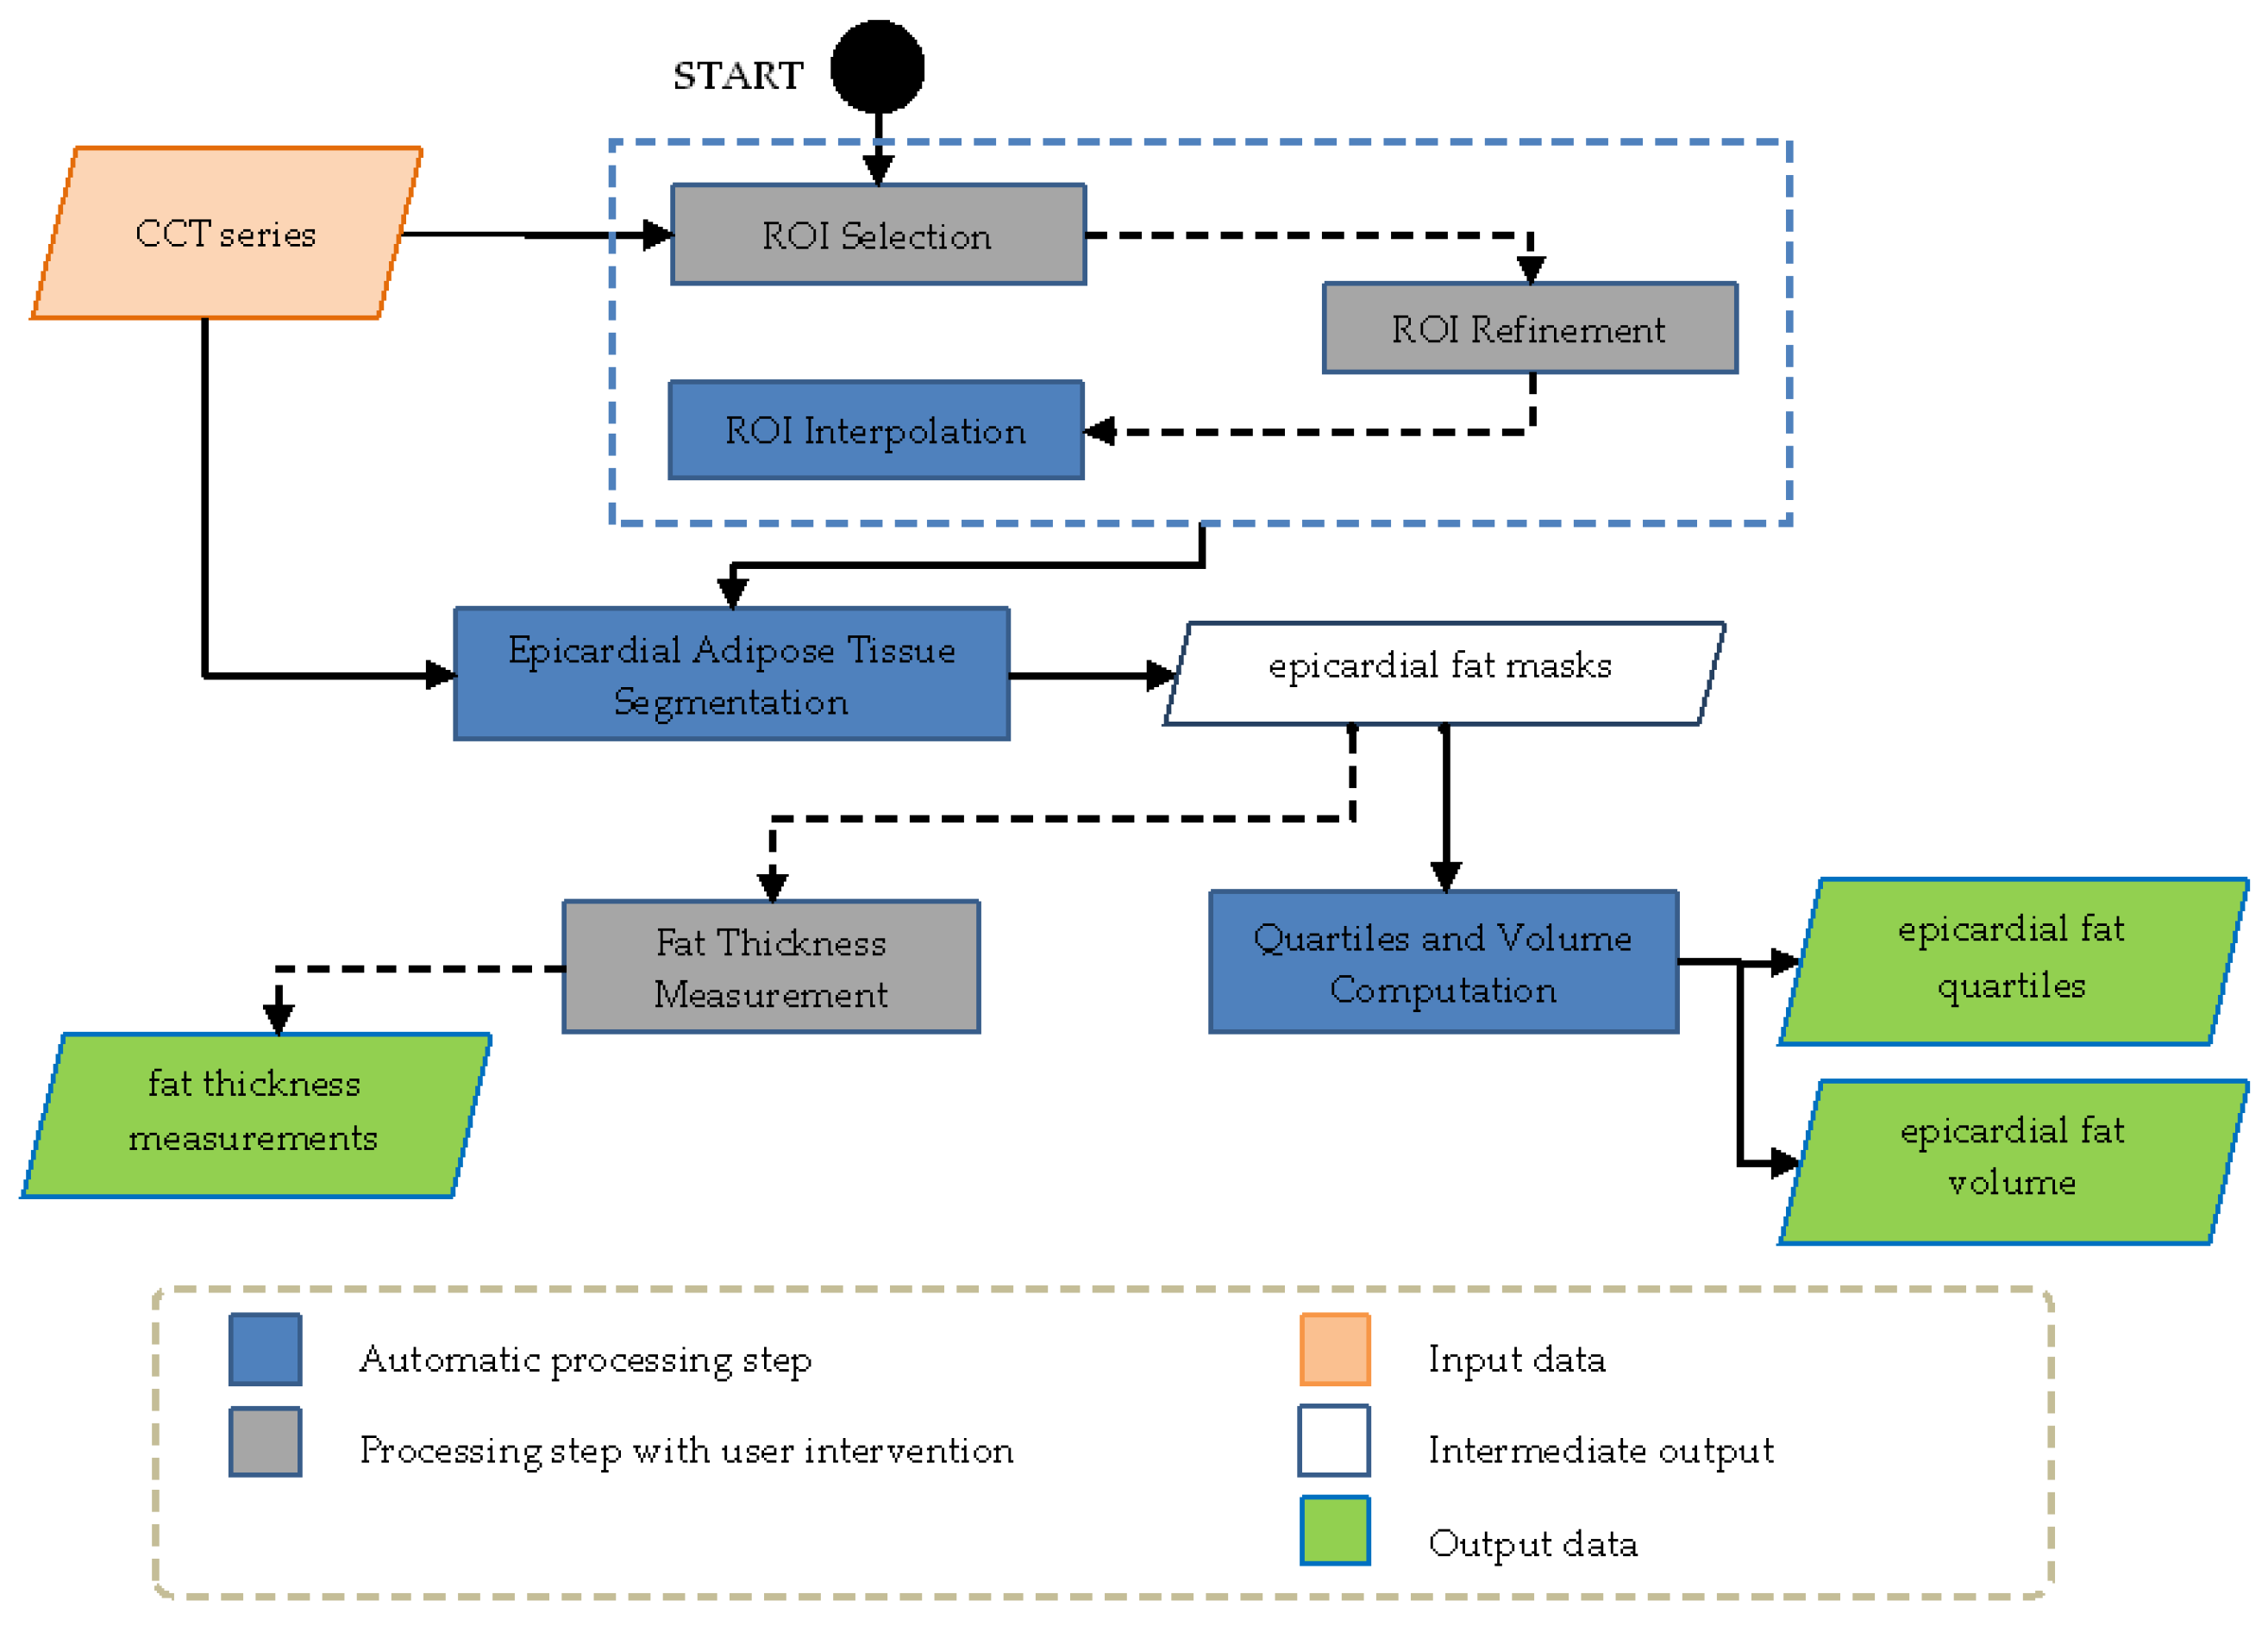
Figure 1. Overall flow diagram of the proposed semi-automatic computer-assisted approach for epicardial adipose tissue segmentation.
Applsci 13 10709 g001
Figure 2. Epicardial adipose tissue segmentation (a) and magnification (b): the epicardial adipose tissue quartiles (Q1, Q2, Q3, and Q4) are denoted in red, blue, yellow and green colors, respectively.
Applsci 13 10709 g002
Figure 3. Example of quartile distribution changes and volume reduction for epicardial adipose tissue. The first row displays epicardial adipose tissue extraction at the first CCT; representations of all quartiles (a), Q1 (b), Q2 (c), Q3 (d) and Q4 (e). The second row displays epicardial adipose tissue extraction at the second CCT; representations of all quartiles (f), Q1 (g), Q2 (h), Q3 (i) and Q4 (j). Quartile distribution and quantification of epicardial fat volume before statin administration (k). Quartile distribution and quantification of fat volume after statin administration (l).
Applsci 13 10709 g003
Figure 4. Box plot showing a significant thickness reduction (in millimeters) of epicardial adipose tissue at the right coronary artery (RCA) level (a) and interventricular artery (IVA) level (b) following statin administration.
Applsci 13 10709 g004
Table 1. Population characteristics.
ParameterValue
Age (years) (mean ± SD)62 ± 10
Male (%) 68 (72%)
Family history (%) 51 (54%)
Smoking habit (%) 43 (45%)
Hypertension (%) 63 (66%)
Dyslipidemia (%) 62 (65%)
Diabetes (%) 13 (14%)
Obesity (BMI > 30) (%) 24 (25%)
SD = Standard deviation; BMI = Body Mass Index.
Table 2. Comparison of the attenuation values of EAT and other anatomical landmarks at first and second CCT.
Anatomical LandmarksAttenuation Values (HU)
First CCTSecond CCTp-Value §
Antero-superior mediastinum−96.20 ± 24.4−93.39 ± 26.90.240
Proximal RCA−65.41 ± 28.5−61.64 ± 20.6 0.249
Left main −57.50 ± 32.6−60.66 ± 31.30.354
Interventricular artery−66.72 ± 31.5−68.59 ± 31.20.599
Circumflex artery−60.97 ± 28.4−58.6 ± 28.50.382
Posterior mediastinum −92.74 ± 31.5−84.99 ± 31.40.054
Overall EAT−78.18 ± 5.3−75.59 ± 7.0<0.001
Liver64.43 ± 16.761.85 ± 23.30.323
Spleen97.32 ± 44.8100.13 ± 53.80.686
Thorax subcutaneous adipose tissue−104.13 ± 30.3−107.14 ± 14.60.369
Abdomen subcutaneous adipose tissue−99.40 ± 21.0−100.22 ± 15.90.744
Intercostal muscle39.58 ± 26.041.02 ± 22.50.643
Intra-abdominal fat−103.94 ± 24.6−100.05 ± 31.30.350
§ Paired Student’s t test was used for statistical analysis. RCA = right coronary artery; EAT = epicardial adipose tissue; HU = Hounsfield unit.
Table 3. Epicardial and subcutaneous fat thickness.
Anatomical LandmarksThickness Values (mm)
First CCTSecond CCTp-Value §
Interventricular artery9.13 ± 3.98.22 ± 3.70.001
Circumflex artery4.84 ± 2.64.76 ± 3.0 0.711
Right coronary artery 14.94 ± 5.813.26 ± 5.20.001
Superior interventricular groove7.33 ± 2.96.58 ± 2.6<0.001
Inferior interventricular groove1.86 ± 0.61.81 ± 1.20.663
Right ventricular free wall basal tract 4.05 ± 1.73.88 ± 2.00.195
Right ventricular free wall medium tract 5.01 ± 2.04.54 ± 2.00.002
Right ventricular free wall apical tract 3.09 ± 1.82.66 ± 1.70.001
Posterior epicardial fat2.92 ±1.42.62 ± 1.20.002
Subcutaneous thoracic fat thickness12.44 ± 5.111.0 ± 4.90.002
§ Paired Student’s t test was used for statistical analysis. mm: millimeters.
Table 4. Fat distribution by quartile and BMI at first and second CCT.
First CCTFat %
Mean (SD)
p-Value
Second CCTFat %
Mean (SD)
p-Value
Q1 Q1
Normal weight (BMI ≤ 24.9)
Overweight (BMI 25–29.9)
Obese I (BMI 30–34.9)
Obese II (BMI ≥ 35)
6.68 (1.8)
6.88 (1.8)
7.66 (1.8)
10.29 (2.8)
Normal weight (BMI ≤ 24.9)
Overweight (BMI 25–29.9)
Obese I (BMI 30–34.9)
Obese II (BMI ≥ 35)
5.97 (2.6)
6.01 (2.9)
7.28 (2.3)
9.14 (2.1)
<0.001 § 0.015 §
Q2 Q2
Normal weight (BMI ≤ 24.9)
Overweight (BMI 25–29.9)
Obese I (BMI 30–34.9)
Obese II (BMI ≥ 35)
22.02 (3.4)
23.47 (3.3)
23.75 (3.9)
24.0 (2.9)
Normal weight (BMI ≤ 24.9)
Overweight (BMI 25–29.9)
Obese I (BMI 30–34.9)
Obese II (BMI ≥ 35)
19.88 (3.9)
21.66 (4.2)
22.57 (3.4)
22.14 (4.3)
0.214 § 0.110 §
Q3 Q3
Normal weight (BMI ≤ 24.9)
Overweight (BMI 25–29.9)
Obese I (BMI 30–34.9)
Obese II (BMI ≥ 35)
33.73 (20.7)
37.96 (2.03)
37.0 (1.17)
33.3 (4.0)
Normal weight (BMI ≤ 24.9)
Overweight (BMI 25–29.9)
Obese I (BMI 30–34.9)
Obese II (BMI ≥ 35)
37.57 (3.0)
38.88 (2.9)
36.62 (3.2)
34.57 (1.9)
0.440 § 0.001 §
Q4 Q4
Normal weight (BMI ≤ 24.9)
Overweight (BMI 25–29.9)
Obese I (BMI 30–34.9)
Obese II (BMI ≥ 35)
31.37 (13.7)
31.62 (4.4)
31.78 (5.4)
30.86 (4.9)
Normal weight (BMI ≤ 24.9)
Overweight (BMI 25–29.9)
Obese I (BMI 30–34.9)
Obese II (BMI ≥ 35)
36.62 (5.0)
33.97 (5.1)
36.38 (16.6)
34.14 (6.5)
0.995 § 0.043 §§
§ p-value calculated from parametric ANOVA test §§ p-value calculated from non-parametric equality of medians test. Legend: Q1 = first quartile; Q2 = second quartile; Q3 = third quartile; Q4 = fourth quartile.
Disclaimer/Publisher’s Note: The statements, opinions and data contained in all publications are solely those of the individual author(s) and contributor(s) and not of MDPI and/or the editor(s). MDPI and/or the editor(s) disclaim responsibility for any injury to people or property resulting from any ideas, methods, instructions or products referred to in the content.