Abstract
Higher-level autonomous driving necessitates the best possible execution of important moves under all conditions. Most of the accidents in recent years caused by the AVs launched by leading automobile manufacturers are due to inadequate decision-making, which is a result of their poor perceivance of environmental information. In today’s technology-bound scenarios, versatile sensors are used by AVs to collect environmental information. Due to various technical and natural calamities, the environmental information acquired by the sensors may not be complete and clear, due to which the AVs may misinterpret the information in a different context, leading to inadequate decision-making, which may then lead to fatal accidents. To overcome this drawback, effective preprocessing of raw sensory data is a mandatory task. Pre-processing the sensory data involves two vital tasks, namely data cleaning and data fusion. Since the raw sensory data are complex and exhibit multimodal characteristics, more emphasis is given to data preprocessing. Since more innovative models have been proposed for data cleaning, this study focused on data fusion. In particular, this study proposed a generic data fusion engine, which classifies different formats of sensory data and fuses them accordingly to improve accuracy. This study proposed a generic framework to fuse the text, image, and audio data. In the first stage of this research, an innovative hybrid model was proposed to fuse multispectral image and video data. Simple and efficient models to extract the salient image features were also proposed. The hybrid image fusion model that was proposed did not yield satisfactory outcomes when combining 3D point cloud data, and its performance declined when evaluating large datasets. To address this issue, the study expanded by introducing an advanced generative adversarial network (GAN) to transform the hybrid image fusion model into a machine learning model capable of handling substantial datasets. Additionally, customized kernel functions were suggested to fuse 3D point cloud data effectively. The performance of the proposed models was assessed using standard metrics and datasets, comparing them with existing popular models. The results revealed that the proposed image fusion model outperformed the other models.
1. Introduction
Autonomous cars have the ability to cut traffic accidents significantly. This hypothesis is based on the fact that autonomous cars reduce the influence of a human component on the likelihood of a traffic collision. Autonomous vehicles are being tested in real-life traffic circumstances all around the world []. According to [], if AVs become accessible in 2025, the market in the United States of America might reach 8 million in ten years. The widespread deployment of autonomous vehicles is intended to minimize collisions, relieve traffic congestion, increase fuel efficiency, reduce parking demands, and provide mobility to individuals who are unable to drive []. The same survey predicted that by 2040 about 33 million autonomous vehicles will be on the road. This just means that people will have to become acclimated to self-driving automobiles. This is supported by facts and data, yet further testing is needed to ensure everyone’s safety.
In order to avoid accidents caused by the AVs, the decisions taken by the AVs to overcome roadside events must be instant and accurate []. For accurate decision-making, the environmental data perceived by the AVs must be clear and accurate. Perception systems must be exact in order to provide a precise comprehension of the world. They must be able to work in adverse conditions and even when particular sensors are broken or defective. In order to collect environmental data, as well as data relating to autonomous vehicle characteristics, sensor systems must be functional. However, data received from a variety of devices, including sensors, thermal cameras, radars, and so on, have heterogeneous multimodal features, making it difficult to achieve the correct perception. In order to enhance the situation awareness of the AV, there has to be more emphasis on the data preprocessing tasks of the AVs. Data preprocessing involves data cleaning and multimodal fusion. The upcoming paragraphs highlight the relationship between situation awareness and data preprocessing.
According to [], situation awareness (SA) is defined as “the perception of the elements in the environment within a volume of time and space, the comprehension of their meaning, and the projection of their status in the near future”. SA bridges the gap between what is known about the environment and what is occurring in it, and what could happen in the future. To establish the situation awareness of their perceived environment, AVs collect the environmental data using external and internal sensors, namely LiDAR, radar, and ultrasonic, followed by stereo and thermal cameras. The vehicular information collected can exist in different formats, such as textual, image, video, and audio, and also exhibit many discrepancies. The discrepancies exhibited by the vehicular data might be in the form of irrelevant data, missing data, outliers, and duplicate data. In addition, images may contain missing data in the form of blurred images and audio data that contains noisy irrelevant data. Hence, preprocessing the sensory data is essential to improve the accuracy. Since data cleaning has been well studied, this proposal focuses on the second task of data preprocessing, namely data fusion. The sensory data exhibit multimodal characteristics, hence an effective data fusion model is mandatory to convert the heterogeneous data into a unique format and also to enhance their accuracy for further effective processing.
Most of the studies fail to propose a generic multimodal fusion methodology to handle the diversity existing among different datasets. The relevant research literature also does not clearly explain key operations such as feature selection and dimensionality reduction of multimodal data, the mechanisms for 2D to 3D multimodal data transformation and storage, and the methodology for converting multimodal data to a single unique data format. Further very few contributions have been carried out to fuse multispectral environment data collected from sensors and satellites. Versatile fusion models with advanced image processing and machine learning techniques are required to fuse the multispectral high-resolution data. The accuracy level reached by most of the referred decision-making frameworks and models is around 85%. This statement proves that more emphasis must be given to preprocessing, especially in data fusion tasks to improve the data accuracy, which has an impact on enhancing the situation awareness of AVs to improve their accuracy of decision-making. The studies related to data fusion are elaborated on in the related work section.
In light of the mentioned limitations, this study suggests a hybrid fusion model that combines traditional data fusion methods with modern technology in order to merge high-spectral and high-resolution images. The study introduces simple and versatile models for extracting significant image features such as color, edge, height, and width. However, the proposed hybrid image fusion model had its own drawbacks. It encountered challenges in managing large volumes of image data and particularly struggled with fusing 3D point cloud data. To address these issues, this study has expanded the research by introducing a GAN model along with customized kernel functions. This transformation converts the proposed hybrid image fusion model into a machine learning model, capable of effectively handling vast amounts of image data, including both 2D images and point cloud data. The proposed GAN model successfully accomplishes tasks such as separating images into spatial and temporal data, extracting features from the separated data, and merging them using customized kernel functions to enhance the accuracy of the image data. To evaluate the proposed models, the nuScenes and GeoTiles datasets were employed.
The rest of the paper is organized as follows: Section 2 covers the basics of sensor technology, gives an overview, and discusses the importance of data fusion to improve the accuracy of the data. Section 3 discusses the existing literature and its pitfalls that motivated us to pursue this proposal. Section 4 elaborates on the development of the proposed fusion and feature extraction models. Evaluation of the proposed models along with the outcomes is discussed in Section 5. The overall summary, outcomes, and future directions of this paper are enclosed in Section 6.
2. Background and Motivation
2.1. Overview about Sensors
Figure 1 depicts the overall architecture of the autonomous driving (AD) system, and Figure 2 illustrates the functionality of the AD system.
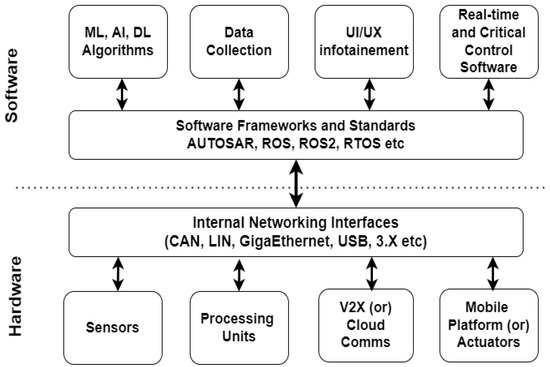
Figure 1.
Architecture of an autonomous driving (AD) system.
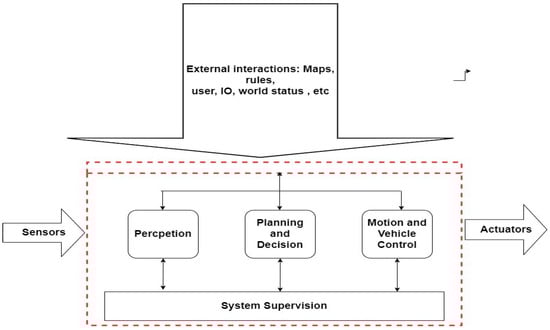
Figure 2.
A functional perspective that describes four main functional blocks.
Further, this section discusses the basics of sensor technology, how AVs perceive their environment data using the sensors, various types of sensors, and a brief introduction to data fusion. While AV systems differ slightly from one another, they are usually complex systems with several sub-components. The layout of an AV model may be divided into two stages, according to several perspectives: the hardware and software tools in the initial step, and the functional perspective required for the AD system’s operating units in the second stage. From a technical perspective, the two main tiers are hardware and software, with individual components representing various facets of the entire AV platform in each layer. Communication infrastructure is provided by a number of AD sub-components that operate between the hardware and software levels. Clarification, agility, automobile controller, system tracking, organization, and policy-making are the main operational components of AVs. These operational units’ duties center on information flow from perceived data to vehicle control, data collection, and data analysis.
As discussed in the introduction the AVs’ surrounding environment data are collected using advanced sensors such as LiDAR and radar also using thermal and stereo cameras. This section highlights the functioning and characteristics of sensors and cameras. Sensors convert events or changes in the environment into mathematical computations that may be processed later. Sensors are classified into two major categories based on their functionality. The first category denotes internal state sensors, also known as proprioceptive sensors, which store and detect the states of a mobile system, such as force, angular rate, wheel load, battery voltage, and other variables. Inertial measurement units (IMUs), encoders, inertial sensors (gyroscopes and magnetometers), and position sensors (global navigation satellite system (GNSS) receivers) are examples of proprioceptive sensors. Complete localization refers to the vehicle’s location with respect to a global reference frame, whereas relative localization addresses the vehicle’s coordinates that align with the surrounding landmarks (world). The external sensors detect information about the external world that is relevant to the AVs. For precise and accurate object detection and to conduct dependable and safe operations, individual and relative sensor orientation is critical. In general, getting enough data from a single reputable source in AD is challenging. The internal health state of the components, as well as the exterior surrounding information of the AVs, are critical for successful decision-making to ensure safety.
2.1.1. Sensor Characteristics
It is important to first establish the general characteristics of these sensors before exploring the specifics of the many sensors utilized in AVs. The selection of sensors in fused and other techniques is critically influenced by the following technical characteristics []:
- Accuracy: the difference between the actual and measured values, recorded by the sensor. Inadequate data and improper environmental information acquired by the sensors will affect the accuracy of evaluations.
- Resolution: The negligible dissimilarity between two measured values is far less accurate than the sensor’s actual accuracy.
- Sensitivity: the nominal value that is recognized and calculated. The slope of the output response curve or, more generally, the minimal input of a parameter that will result in a discernible output change is used to characterize a sensor’s sensitivity.
- Dynamic range: the least and highest values attained from the sensors, obtainable with precision.
- Perspective: The term “field of view” is frequently used to describe this (FoV).
- Active and passive: an inert sensor trusts ambient conditions to distribute statistics, whereas a dynamic sensor releases energy to observe an AV’s surroundings.
- Time scale: the pace of the sensor’s frame rate and measuring range rate over time.
- Output interface: the sensor’s output, which might take the form of a cognate energy, automated signal, direct data flow, or data broadcast movement.
LiDar: LiDAR, or light detection and ranging, was first developed and launched in the 1960s and has since become widely employed in the alignment of aeronautical and aerospace topography. Laser scanner manufacturers produced and sold the first commercial LiDARs with 2000 to 25,000 pulses per second (PPS) for topographic mapping applications in the mid-1990s. LiDAR technology has advanced at an astonishing rate in recent years, and it is now one of the most important sensing technologies for autonomous driving. LiDAR is a distant sensing technique that scatters ray from target objects using infrared/laser beam impulses.
RADAR: RADAR stands for radio detection and ranging technology, and is a device that uses radio waves to detect things within a certain range. The surface of an object scatters waves back to the RADAR antenna when waves traveling across it (FoV) collide with it during transmission. The RADAR then picks up the backscattered signal (echo) from the object
Ultrasonic Sensors: In industrial surroundings, ultrasonic sensors are extensively used for various identification errands. They are able to find particles that are hard, fluid, grainy, or crushed. For industrial applications, the sensors generate sonic waves in the 40 kHz to 70 kHz range using sound transducers. Humans may safely hear frequencies in this range since they are above their hearing threshold. A car’s parking system may produce sound pressure levels of above 100 dB to assure clear reception, which is identical to the acoustic signal pressure generated by a jet engine. Most ultrasonic sensors detect the time of flight (ToF) of sonic waves between transmission and reception [].
Cameras: One of the most extensively utilized devices for monitoring the environment is a camera. A camera detects lights emitted by the surroundings on a photosensitive surface (image plane) through a camera lens to produce clear pictures of the surroundings (placed in front of the sensor). With the right software, affordable cameras can snap high-resolution pictures related to their surrounding environment as well as recognize mobile and immovable impediments in their range of view. These characteristics enable the vehicle’s vision system to recognize various objects in off-road vehicles in addition to road signs, traffic signals, road lane markings, and obstacles in on-road vehicles. One of our articles [] provides a comprehensive analysis of various sensors, outlining their distinct characteristics. Figure 3 illustrates the overview of sensors fixed in AVs.
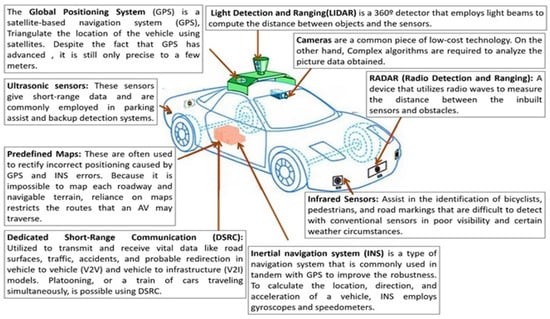
Figure 3.
Different types of external sensors.
2.1.2. Introduction to Data Fusion
Sensory data fusion (SDF) is the act of combining various data sources to provide information that is more consistent, reliable, and relevant than any single data source. Data fusion improves the accuracy of raw sensory input gathered from many internal and external sensors, hence enhancing the AVs’ conceptual awareness. Sensor data often exhibit multimodal characteristics. Multimodal data are difficult to process, and hence they must be fused and converted into a unique data format that simplifies further processing. Due to the complexity prevailing in data fusion, advanced mathematical models are used for transformations and calculations.
Figure 4 illustrates the process of data fusion. There are different modules, performing different activities. The first phase is the data acquisition stage, where different formats of heterogeneous data are collected from various sensors. The second phase is the data preprocessing stage, where various discrepancies existing in the data are identified and treated further using robust data-cleaning models. This task is followed by the feature extraction process, where the mandatory features are extracted from the data to minimize the fusion process. The next stage is data fusion. There are two types of fusion: (i) early fusion, where data are fused with partial preprocessed data, and (ii) high-level fusion, where strongly preprocessed data are used for fusion. The next phase is the situation refinement task, where the context of the perceived environment data is created for the AVs using the enhanced fused data. The information related to sensors, data objects, and conceptual awareness is represented and stored using advanced data structures, and appropriate models are used to process the data. The main advantage of data fusion is that it combines data from a variety of sensors and sources to create something more intelligent, decisive, reasonable, and precise. The data from each sensor may not make much sense on their own. Computing the (N) independent observations offers a statistical benefit of fusion; the data should be integrated as efficiently as feasible.
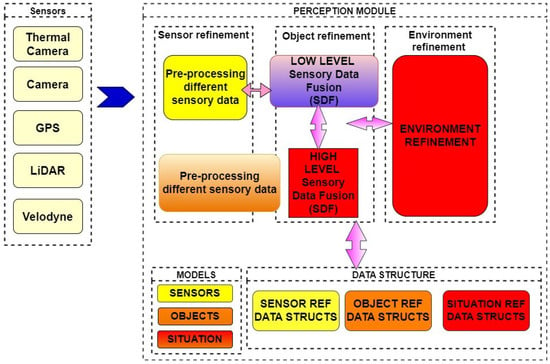
Figure 4.
Overall architecture of data fusion.
Making extremely low-power sensors that do not require battery replacements during their lifetime is a crucial requirement in IoT, and this has increased demand for energy-efficient sensors. High-precision sensors are well-recognized for using a lot of energy. A collection of low-accuracy sensors with low power consumption can be used to solve this challenge. Data fusion enables the generation of exceptionally precise data. Another important advantage of data fusion is that it assists in the concealing of critical data or semantics that are responsible for the fused results.
Based on the mathematical approaches used, data fusion strategies can be divided into three categories:
- Artificial intelligence (AI)-based approaches such as classical machine learning, fuzzy logic, artificial neural networks (ANN), and genetic assessment.
- Probability-based methods such as Bayesian analysis, statistics, and recursive operators.
- Evidence-based data fusion strategies based on theory
Among fusing different data formats, fusing image and audio data is more difficult. Normally, image data fusion is performed at three levels: (i) pixel level fusion, which provides extensive image detail information that cannot be obtained at any other level; (ii) feature level, which is the intermediate level and not only stores but also compresses information; and (iii) decision-level fusion, which is the highest level and most sophisticated, with a reduced demand for picture registration. Recursive approaches, multiplicative algorithms, principal component analysis, high PostFilter, the Brovey transform image fusion technique, the color rotated technique, and discrete wavelet transformation are some of the most often used image data fusion techniques. The key image features are color, corners, the SIFT, SURF, blobs, and edges. Table 1 illustrates the operation of the popular image fusion models along with their pros and cons. The next section elaborates on the existing literature.

Table 1.
Description of various popular image fusion models.
3. Related Work
An extensive survey is presented to explore different image, video, and audio data fusion techniques proposed by eminent scholars to identify their major contributions and existing gaps. The details gathered will be a stepping stone to progress this research further to reduce the existing gaps.
3.1. Hybrid Image Fusion Models
B. Shahian Jahromi et al. [] have proposed a novel hybrid multi-sensor fusion pipeline configuration for autonomous cars that handles environment perception tasks such as road segmentation, obstacle identification, and tracking. A suggested encoder–decoder-based fully convolutional neural network (FCNx) and a standard extended Kalman filter (EKF) nonlinear state estimator approach are used in this fusion framework. It also employs an optimal camera, LiDAR, and radar sensor configurations for each fusion approach. The purpose of this hybrid architecture is to create a fusion system that is cost-effective, lightweight, adaptable, and resilient (in the event of a sensor failure). It employs the FCNx algorithm, which improves road identification accuracy above benchmark models while preserving real-time efficiency in an embedded computer for autonomous vehicles. D. Jia et al. [] have presented a hybrid spatiotemporal fusion (STF) technique based on a deep learning model called the hybrid deep-learning-based spatiotemporal fusion model (HDLSFM). With a minimum amount of input, the method develops a hybrid framework for the reliable fusion of morphological and physiological data that explains the physical material at the surface of the earth. To handle radiation discrepancies across various types of satellite pictures, the suggested method combines a regressive deep-learning-based related radiometric normalization, a deep-learning-based super-resolution, and a linear-based fusion. Using Fit-FC as a benchmark, the HDLSFM’s propensity to predict phenological and land-cover change has been demonstrated. Meanwhile, HDLSFM is immune to changes in radiation across different types of satellite images as well as the time interval between the forecast and base dates, assuring its usefulness in the synthesis of fused time-series data.
Y. Wang et al. [] have proposed a hybrid fusion strategy that takes into consideration the geographical and semantic properties of sensor inputs concerning occurrences. To achieve this, the authors have used Cmage, an image-based representation for both physical and social sensor data that describes the situation of certain visual notions (e.g., “crowdedness” and “people marching”). The authors have proposed a fusion model that describes sparse sensor information using a Gaussian process based on the acquired Cmage representation, which combines multimodal event signals with a Bayesian method and integrates spatial links between the sensor and social data. A. V. Malawade et al. [] have proposed a selective sensor fusion framework, namely HydraFusion, which learns to recognize the present driving environment and then combines the appropriate mix of sensors to enhance robustness without sacrificing efficiency. HydraFusion is the first method to suggest dynamically shifting between early fusion, late fusion, and combinations in between, so modifying both how and when fusion is used. On the industry-standard Nvidia Drive PX2 AV hardware platform, the authors show that HydraFusion outperforms early and late fusion techniques by 13.66 percent and 14.54 percent, respectively, without increasing computing complexity or energy consumption. Both static- and deep-learning-based context identification algorithms are proposed and evaluated by the authors.
Y. Zhao et al. [] has proposed a hybrid spatial-temporal-spectral image fusion model (HSTSFM) for simultaneously generating synthetic satellite data with high spatial, temporal, and spectral resolution (STSR), which blends the high spatial resolution from the panchromatic image of the Landsat-8 Operational Land Imager (OLI), the high temporal resolution from the multispectral image of the Moderate Resolution Imaging Spectroradiometer (MODIS), and the high spectral resolution from the hyper-spectral image of Hyperion to produce high spatial–spectral image fusion, high spatial–temporal image fusion, and high temporal–spectral image fusion, which are the three fusion modules included in the proposed HSTSFM. To show the performance of the proposed technique, a set of test data containing both phenological and land cover type changes in Beijing suburbs, China, are used. B. Latreche et al. [] have suggested an effective hybrid image fusion approach based on the integer lifting wavelet transform (ILWT) and the discrete cosine transformer (DCT) that are suited for video streaming networks (VSNs). There are two phases in the proposed fusion algorithm. To begin, the ILWT approximation coefficients (low frequencies) are fused by using the variance as an activity level measure in the DCT domain. Second, the high-frequency detail coefficients are fused using the best-weighted average based on the correlation between coefficients in the ILWT domain. The suggested solution addresses information loss, computational complexity, time and energy consumption, and memory space due to integer operations in the ILWT domain. Extensive tests have been carried out to show that the suggested method outperforms other picture fusion algorithms in the literature, both intuitively and numerically.
X. Zhang et al. [] have proposed a multi-focus image fusion benchmark (MFIFB), that includes a test set of 105 picture pairings, a code library of 30 MFIF algorithms, and 20 evaluation measures. MFIFB is the first MFIF benchmark, providing a forum for the community to assess MFIF algorithms thoroughly. To understand the performance of these algorithms further, extensive tests have been carried out utilizing the suggested MFIFB. Effective MFIF algorithms are found by examining the experimental findings. More significantly, some remarks on the current state of the MFIF field are provided, which might aid in a better understanding of this topic. D. Kaimaris and A. Kandylas [] have suggested an innovative mechanism to obtain multispectral image data using UAVs and fuse them to improve the accuracy of the data. The photos from Parrot’s tiny multispectral (MS) camera Sequoia+ are examined at two ancient sites: a Byzantine wall (ground application) in Thessaloniki, Greece, and a mosaic floor (aerial application) at the archaeological site of Dion, Greece. The camera obtains RGB and MS pictures at the same time, which prevents image fusion, as is the case with the conventional use of panchromatic (PAN) and MS images in satellite passive systems. Using the image fusion methods of satellite PAN and MS pictures, this research shows that effective digital processing of the images (RGB and MS) of tiny MS cameras may result in a fused image with a high spatial resolution that maintains a considerable proportion of the original MS image’s spectral information. The great spectrum fidelity of the fused pictures allows for high-precision digital measurements in ancient sites, such as precise digital item separation, area measurements, and recovery of information not apparent with standard RGB sensors using MS and RGB data from tiny MS sensors. Reference [] have proposed a versatile hybrid fusion model to fuse infrared and visible image fusion models. They have used the combined concepts of visibility enhancement and multiscale decomposition to fuse the images. Initially, the authors proposed an effective preprocessing model followed by a decomposition model to decompose the information to the layers of their customized CNN model. Further, they have integrated the concepts of a visual saliency illumination map (VSIM) to retain the contrast information and enhance the fusion process. Reference [] have proposed a hybrid image fusion model to fuse medical images that exhibit multimodal characteristics. They have used the dual combination of nonsubsampled contourlet transform (NSCT) and discrete wavelet transform (DTCWT) approaches to fuse the images. The authors have used an advanced CNN model to create weight maps to monitor the pixel movement of the images. Further, the authors have included an advanced comparison-based method to convert the fusion mode to the appropriate coefficients required for the CNN model.
Since the study has extended its work by proposing a versatile GAN model to fuse all types of advanced image data, the research has explored the contributions of researchers in image fusion using GAN models. Reference [] have proposed a novel hybrid image fusion model using GAN techniques called as PAN-GAN. The author’s model is used to fuse panchromatic images. The PAN-GAN model uses a separate adversarial mechanism that establishes a bond with the discriminators to preserve the spectral and spatial information of the fused images. Similarly reference [] have proposed an innovative fusion model, namely GAN-FM, which uses the GAN principle to fuse infrared and visible images. The authors have designed a full-scale skip-connected generator along with discriminators based on Markovian principles for extracting features at different scales and to establish a link with the generators to retain the contrast of the fused images. In yet another interesting study, reference [] have proposed an innovative hybrid image fusion model, namely THFuse, which uses GAN approaches to fuse infrared and visible images. The authors have used advanced fusion strategies such as transformer and hybrid feature extraction concepts to process both global and local image information. Reference [] have proposed a versatile image fusion model called mask deep fusion network for visible and infrared image fusion (MDFN). The authors have proposed a novel mechanism to compute the weight score for every pixel to estimate the contributions of the two input source images. This operation transfers valuable information from source to fused images, helping them to retain their contrast. Reference [] have suggested a hybrid image fusion model, namely the pair feature difference guided network (FDGNet), to fuse multimodal medical images. The authors have proposed a weight-guided mechanism to extract the features from complex medical images efficiently. Further, the authors have introduced a factor, namely hybrid loss, composed of weight fidelity loss and feature difference loss to train the network effectively.
Since this study focuses on the feature extraction process, detailed literature related to some of the proposed image feature extraction methods is analyzed. This proposed study plans to extract four important image features, namely color, edge, height, and width. In their recent publication, Li et al. [] introduced a cutting-edge generative adversarial network named MSAt-GAN. This novel model incorporates multiscale feature extraction and deep attention techniques to merge infrared and visible images seamlessly. By utilizing three distinct fields for feature extraction, the model enhances the accuracy of data fusion. Moreover, the deep attention mechanism facilitates the extraction of multi-level features through spatial and channel attention, thus enabling effective data fusion. Reference [] in their work, have introduced a versatile fusion model called multi-exposure image fusion on generative adversarial networks (MEF-GAN) with the aim of effectively fusing image data. The proposed model consists of two components: a generator and a discriminator network, which are trained concurrently to form an adversarial network. The generator is responsible for producing synthesized fused images that resemble the source image, while the discriminator is trained to differentiate between the source image and the fake fused images generated by the generator. This adversarial relationship helps to preserve data integrity and prevents information loss in the fused image, ultimately leading to a fused image probability distribution that closely approximates reality.
In their recent study, reference [] proposed a robust fusion model called correlation driven feature decomposition fusion (CDDFuse) as an effective solution. The authors employed Restormer blocks to extract cross-modality image features and seamlessly integrate them with an advanced convolutional neural network (CNN) model. Additionally, Lite Transformer (LT) blocks were incorporated to extract low-level features. To establish the correlation between low-frequency and high-frequency features, the authors introduced a correlation-based loss factor. By leveraging the proposed LT model and invertible neural networks (INN), the authors successfully fused the low- and high-frequency features, resulting in the generation of the fused image. Reference [] in their recent publication, introduced a multi-focus image fusion model that combines the principles of Transformers and an advanced CNN model to fuse multimodal image data effectively. By incorporating both local information from the CNN model and global information from the transformers, the accuracy of fusion is significantly improved. Furthermore, the authors proposed a feedback mechanism that maximizes the utilization of features, thereby enhancing the performance of the networks in feature extraction.
3.2. Feature Extraction Models (Image Data)
P. Tiede et al. [] have proposed a novel universal image feature extraction approach called variational image domain analysis, which is used for a wide range of very long baseline interferometry (VLBI) image reconstructions. Variational image domain analysis, unlike earlier methods, may be used for any image reconstruction, independent of its structure. The authors’ approach gives clear ideas on how to extract salient image features such as color and edge. Y. Liu, H et al. [] have customized a CNN model to extract deep features of images related to food. The CNN model, when paired with nondestructive detection techniques and a computer vision system, has great potential for identifying and analyzing complex food matrices. CNN-based features outperform handmade or machine-learning-based features. N. Liang et al. [] have proposed a multi-view structural feature extraction approach to provide a thorough characterization of spectral–spatial structures of various objects, which consists mostly of the stages below. First, the original image’s spectral number is reduced using the minimum noise fraction (MNF) approach, and then the local structural feature is extracted from the dimension-reduced data using a relative total variation. The nonlocal structural characteristics from intra-view and inter-view are then produced using a superpixel segmentation approach that takes into account the intra- and inter-similarities of superpixels. The final picture characteristics for classification are formed by combining the local and nonlocal structural features. S. Barburiceanu et al. [] have presented a texture feature extraction approach with increased discriminating power for volumetric pictures. The technique is used to classify textured volumetric data. The authors employ feature vectors obtained from local binary patterns (LBP) and the gray-level co-occurrence matrix-based approach to combine two complementing types of information. R. Ahmed Bhuiyan et al. [] have provided a feature extraction methodology for human activity recognition that is both efficient and low in dimension. The enveloped power spectrum (EPS) is employed in this feature extraction approach to recover impulse components of the signal utilizing frequency domain analysis, which is more robust and noise intolerant. For human activity recognition, linear discriminant analysis (LDA) is utilized as a dimensionality reduction approach to extract the smallest amount of discriminant characteristics from the envelope spectrum, human activity recognition (HAR). A multi-class support vector machine (MCSVM) is used to recognize human activities using the derived characteristics. To extract robust features, Bo do et al. [] have used a stacked convolutional denoising autoencoder (SCDAE), which reduces susceptibility to partially damaged data, or inputs data that are partially missing. Trial-and-error experiments were used to optimize SCDAE parameters such as network depth, number of convolution layers, number of convolution kernels, and convolution kernel size.
The analysis identified some gaps in both the explored image fusion models and feature extraction models. Regarding image fusion, most of the referred image models do not produce better accuracy. A generic fusion model to fuse all formats of data is missing. Most referred studies use the minimum dataset to evaluate their models. Complicated operations such as image transformation (2D to 3D) and other image functionalities are not transparent in many studies. Moreover, there are minimum contributions related to multispectral image fusion. Most of the referred models are complex and require advanced algorithms and techniques. There is a need for developing computationally efficient fusion algorithms that can operate in real-time or near real-time scenarios without sacrificing the quality of the fused images. Exploring techniques such as model compression, hardware acceleration, and parallel processing can help bridge this gap.
Implementing and fine-tuning these models can be challenging, requiring significant computational resources and expertise. Image fusion is a subjective task, and the quality of the fused image can vary depending on individual preferences and application requirements. Most referred models involve multiple parameters and design choices, making it difficult to determine an optimal fusion result that satisfies everyone. There is still room for exploring more efficient and effective deep-learning architectures specifically designed for hybrid image fusion. Research should focus on developing novel network architectures, attention mechanisms, and loss functions that can capture complementary information from multiple input images and improve the fusion quality. Most models often lack interpretability and explainability. It is challenging to understand the decision-making process and the contribution of different input images in the fusion result. Further research is needed to develop techniques that can provide insights into the fusion process, visualize the information fusion at different stages, and offer explanations for the final fusion outcome.
Regarding the referred feature extraction models, most of the referred models are complicated and require high computational costs. Most models depend on CPU utilization time and memory. Further, the feature detection models depend on the experiences of the designer. Having the specified gaps as the point of motivation, this study proposes a generic data fusion engine to fuse all formats of data and also proposes innovative strategies to extract the salient features of image and audio data. Many feature extraction models are trained and optimized for specific datasets or domains. However, there is a need for models that can generalize well across different domains, such as medical imaging, natural images, satellite imagery, and more. Developing domain-agnostic feature extraction models that can capture and represent diverse types of data effectively remains a challenge. With the increasing demand for real-time and large-scale applications, there is a need for feature extraction models that are efficient and scalable. Developing lightweight architectures and techniques for efficient feature extraction, model compression, and hardware acceleration is an ongoing research direction to enable faster and more resource-efficient feature extraction.
To address the identified gaps, this study introduces effective models for feature extraction that can extract image features from all types of image data. Additionally, a hybrid image fusion model is proposed to fuse 2D and 3D multispectral image data. The study presents advanced projection and image transformation formulas to enhance the efficiency of the image fusion process. However, the performance of the proposed hybrid image fusion model is found to be unsatisfactory when applied to 3D point cloud data and when dealing with large image datasets. To overcome these limitations, the study expands its scope by proposing an innovative image fusion model that incorporates advanced concepts from the GAN (Generative Adversarial Network) model. This new model performs various tasks, including advanced feature extraction to capture both spatial and spectral information, as well as generator and discriminator modules to facilitate fusion tasks while preserving image quality. Customized kernel functions are introduced for the CNN (Convolutional Neural Network) layers to execute the specified tasks.
4. Proposed Study
4.1. Proposed Framework
Figure 5 illustrates the overall functioning of the proposed framework. At the initial stage, raw sensory data are collected from different sensors. The collected data are preprocessed in the next stage to remove the discrepancies such as irrelevant data, missing data, duplicate data, outliers, and noisy data. In the next stage, the data are classified based on two attributes, namely the file extension (or) the data type. In the subsequent stage, mandatory features are extracted using the proposed feature extraction model. Using the extracted features, the data are fused in the following stage. In the final stage, the fused data are used by the AVs to frame intelligent decision rules for effective decision-making. For textual data, a model for data preprocessing has already been proposed, which is discussed in the article []. Hence this paper focuses more on image fusion.
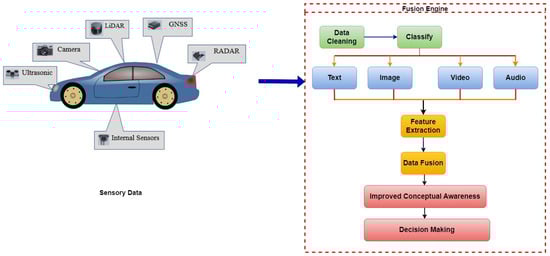
Figure 5.
Proposed Framework.
4.2. Proposed Feature Extraction Models
For image data, the study plans to extract four mandatory features, namely color, edge, height, and width, from the image data for effective fusion. Two innovative models have been proposed for edge detection and color identification.
4.2.1. Proposed Edge Detection Method
The study proposes an enhanced Sobel edge detection method. Sobel’s approach uses the below-listed matrices to detect the horizontal and vertical edges of an image.
However Sobel’s method has a major drawback in that, aside from horizontal and vertical directions, they never traverse the pixels that represent the edges from other directions []. Hence, for images with good texture, the accuracy of edge detection using Sobel’s method is not good. Hence, this research introduces new templates for edge detection that cover all dimensions of image pixels that are represented as two-dimensional matrices. It is a matrix represented as four templates, namely , and , denoting vertical, horizontal, and diagonal wise horizontal and vertical representations of pixel weights, respectively. The weight of each template position is ascertained by its distance from the center as well as its directions. The weight of the equidistant points is the same. The following are the derived templates:
In the proposed approach, the template that produces the largest value for the input image is selected for further processing. The pixel value that produces the maximum threshold value is considered an edge. Generally, there are three ways of threshold estimation: (i) overall threshold, (ii) local threshold, and (iii) dynamic threshold estimation techniques. This study follows the overall threshold estimation method. In the proposed approach, gene-mutation-based techniques are used to detect an edge, and hence an overall threshold estimation approach is followed in this research. In the first stage, the input image is either in 2D (or) 3D and is represented in the gray range, say . If the input images are in a 2D format then the study uses the same transformation mechanism followed in the proposed hybrid image fusion model to convert 2D to 3D images, else the study follows the following steps to detect the presence of an edge in the input image. Then, before initiating the edge detection, the entire image is divided into two categories of thresholds, namely and . For a gray image of (N) pixels, the probability, , of each gray level in a gray image is calculated using Equation (1)
Now the square error between the two classes is calculated using the below equation.
where (, , and ). denotes the pixels whose gray value is less than the threshold value, indicates the pixels whose gray value is greater than the threshold value, represents the mean gray value of pixels whose image gray value is less than the threshold value, and denotes the average gray values of the pixels whose image gray values are greater than the threshold value. The image gray values must be substituted in the four templates to estimate the best template that maximizes Equation (2). Any pixel value that has a value greater than or equal to the maximum threshold value is considered an edge.
Since it is a complicated task, this study proposes an innovative genetic algorithm, which minimizes the time and the steps involved in finding the best template and which uses the image pixel values to maximize Equation (2). The pixel value that represents a template that maximizes Equation (2) is considered an edge. However, all the templates do not maximize the threshold function; rather, a suitable template that maximizes the threshold function has to be selected. The proposed genetic algorithm selects the best template based on the crossover function represented in Equation (3). This research proposes an innovative cross-mutation function, which helps the genetic algorithm to switch efficiently between different templates. Any template that has a value greater than the crossover function will be the next template used by the image pixels to identify the presence of an edge.
where denotes the maximum fitness function, f represents the mean fitness function, and depicts the fitness function of an individual pixel.
Figure 6 illustrates the flow of the proposed genetic-algorithm-based edge detection model, and Algorithm 1 elaborates the overall functioning of the genetic algorithm. Equation (3) displays the proposed crossover function, whose value determines whether the genetic algorithm must switch between different templates to determine the maximum fitness function.
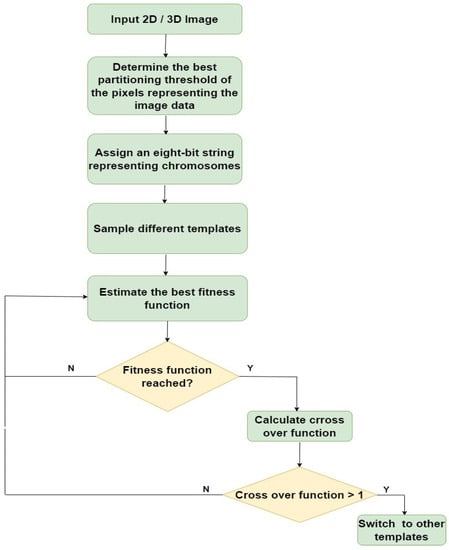
Figure 6.
Flow of proposed edge detection model.
4.2.2. Proposed Color Detection Method
Figure 7 illustrates the mechanism behind the proposed color detection method. The pixel colored in green signifies the pivot pixel, while the pixels colored in red denote its neighboring pixels. The pivot pixel whose color is to be examined is taken into consideration. Its corresponding neighboring pixel values are compared with the gradient value, which is computed using the equation specified in Algorithm 2. If the pivot element’s neighboring pixel value is greater than or equal to the gradient, then its original pixel value is replaced with the value of one, else a zero value is substituted with its original pixel value. Now, the binary bit patterns obtained from the sub-matrix give the actual color value of the pivot pixel since most of the RGB values of the color are between the numeric range of 0 and 255. The logic adapted in the proposed edge detection model is used to find the height and the width of the image. The first and last edge present in the column of the image matrix determines the height of the image while the first and last edge present in either of the row values of the image matrix represents the width of the image [,].
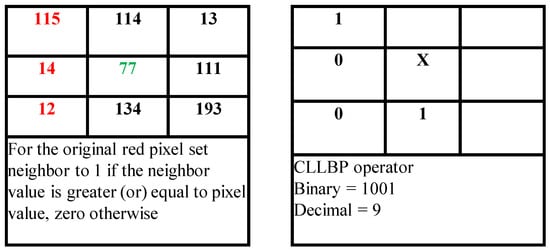
Figure 7.
Proposed color estimation technique.
4.2.3. Proposed Hybrid Fusion Model
Algorithm 2 explains how the color value of a pixel is examined in image data. Figure 8 illustrates the functionality of the proposed hybrid image fusion model. In the first stage, the sentinel 2D images are acquired from different sensors. Then the image is normalized using the weighted median filter method to convert 2D pixel intensity to 3D pixel intensity. After normalization, the mandatory features, namely color, edge, height, and width, are extracted from the images using the proposed edge and color detection models. In the third step, appropriate proposed projection and transformations are applied to convert 2D pixel and wavelength intensities to corresponding 3D information. The data obtained are successfully fused with a sample 3D image. This mechanism converts the acquired 2D image to a 3D image. The obtained multispectral 3D image lacks in its clarity related to the RGB colors. In order to improve the RGB color intensities, the obtained 3D image information from the suggested fusion model is integrated with the Brovey fusion method, which increases the RGB color intensity of the fused image to an appreciable extent [,]. As discussed in the above paragraph, the suggested hybrid fusion model involves key matrix and vector operations such as projection, transformation, and transposition.
| Algorithm 1: Proposed genetic-algorithm-based edge detection approach. |
|
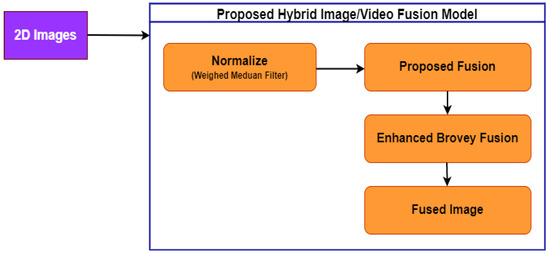
Figure 8.
Proposed hybrid fusion framework.
| Algorithm 2: Proposed color detection algorithm. |
|
Table 2 describes the mandatory parameters used in the proposed image fusion model. Figure 9 illustrates the flow of the proposed fusion model. Initially, the 2D sentinel model acquired is normalized using the weighted mean filter method. This process converts the 2D pixel to 3D pixel information. Later, to convert the 2D image to a 3D image, the study uses advanced vector projections and matrix transformations. Finally, to acquire the original 3D image the research uses the QR() decomposition method to obtain the inverse matrix information of the fused 3D image.
Table 2.
Notations used in proposed image fusion model.
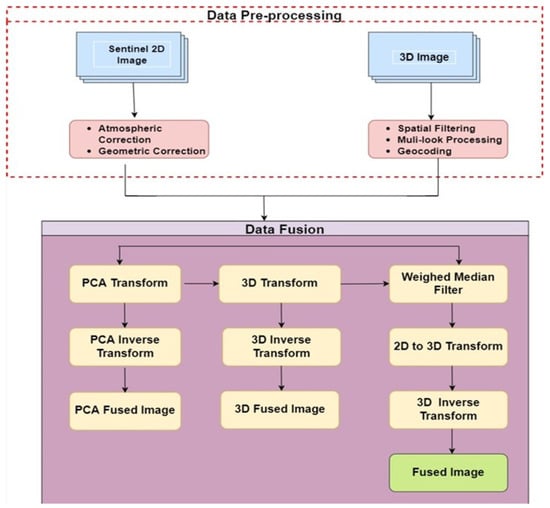
Figure 9.
Functioning of hybrid fusion model.
Before processing the fusion process initially, the intensity of each wavelength is subtracted from the values of both the 2D sentinel and 3D images. The mean intensity wavelength for both the 2D and the 3D images is calculated using the weighted mean filter method. In terms of mathematics, the weighted mean filter (WMF) is equivalent to global optimization. It can successfully filter images without causing significant edge blur. Within a local window, it is an operator that replaces the current pixel with the weighted median of nearby pixels. In processing pixel (p) in the image (I), only pixels inside the local window, R(p), of radius (r) centered at (p) are considered. WMF connects each pixel, , with a weight, , in the appropriate feature map (f), i.e.,
where and are features of pixels p and q, and g is a typical influence function between p and q.
The pixel intensity of the 2D image is multiplied by the weighted intensity values of the 3D image pixels using Equation (4). This task is carried out to convert the 2D pixel intensity values to their corresponding 3D pixel intensity values. Advanced matrix and vector operations that are used for the above-mentioned transformations are discussed in the following paragraphs.
Algorithm 3 describes the steps involved in the proposed hybrid image fusion algorithm. Before starting the main fusion operations, the wavelength intensities and the pixel intensities of the 2D sentinel images are represented as corresponding row and column items of the image matrix using the below-mentioned equation.
In the next stage, the multispectral 3D images are extracted from the 2D sentinel images by multiplying the wavelength frequencies A and B of panchromatic images with the pixels of the 2D images. This operation is carried out with the help of multiplying Equation (4) by the below-mentioned equation. By carrying out this operation, the pixel values of 2D sentinel images are normalized and converted to 3D image pixel values.
Using the new notations, Equation (4) can be rewritten as
where W is the line vector of size A and components of stand for the action of transposing the image matrix. Though the 2D image pixels are converted to 3D image pixels, the transformation only converts the values; advanced vector projections must be introduced to convert the 2D sentinel image to an actual 3D image. This task is accomplished using Equation (9).
| Algorithm 3: Proposed hybrid image fusion algorithm. |
|
The general projection of a vector, v, on vector u is performed using the equation
where is a column of vector B.
From a statistical point of view, the multispectral image obtained is a combination of any 3D image format along with the weights of the pixel intensities, which are correlated to the pixels of 2D sentinel images [,], thus using a projection operation on every pixel of a 2D image. This calculation with a single weight is really a projection onto a wavelength-specific picture, and the entire computation is identical to summing all projections onto all wavelengths. The operations are listed below in Equation (10)
where is a diagonal matrix whose diagonal components are and .
Now, we denote as the line vector of size B, which is equal to . Now, the 3D multispectral image can be defined as
By replacing the values of the first wavelength, , a modified 3D image is obtained, which is listed in the below equation. When compared with the previous operations, this image matrix is a three-dimensional matrix representing pixel wavelength values, intensity values, and the dimension of the image, respectively.
The next important stage is acquiring the original 3D image. To obtain the original 3D image, the inverse transformation of the new 3D image obtained using Equation (12) is decomposed using the QR() decomposition method, which postulates two important rules [].
- Q is an orthogonal matrix, = where is the identity matrix.
- R is an upper triangle matrix, having an upper triangle matrix inverse and
Now, the R inverse matrix obtained from the QR() decomposition is multiplied with the modified 3D image obtained using Equation (12) to obtain the original 3D fused image. The equations used to obtain the actual 3D image are discussed below.
An important property of QR() decomposition is that the first column of the matrix S is proportional to that of , and hence it can still be interpreted as a multispectral image. Now, the first column of the multispectral image obtained from Equation (13) is replaced with the modified 3D image matrix obtained using Equation (12), while all other columns are unchanged. The transformations are illustrated in the below final equations.
Since the first column of Equation (15) represents the pixel values of the 2D sentinel image and the other two columns represent the pixel values of 3D images, the final fusion equation can be represented as
4.2.4. Enhanced Brovey Image Fusion Method
Though the multispectral fused image obtained from the proposed fusion method helps to improve the accuracy of the acquired 2D images, it lacks in producing the actual color intensity. In order to improve the RGB color intensities of the fused 3D image, the pixel values of the fused images are integrated with the Brovey fusion model, which computes the mean of individual red, green, and blue intensity values. The obtained mean value is multiplied by the PAN (panchromatic matrix value). The results obtained are finally multiplied with Equation (9) to obtain the full-fledged 3D fused image with the actual RGB color intensities.
4.3. Proposed GAN Model
The proposed hybrid image fusion model did not achieve desirable results when integrating 3D point cloud data, and its performance deteriorated when evaluating extensive datasets. Hence, the study has extended its contribution by proposing a versatile GAN model that integrates the proposed feature selection and image fusion models. The proposed GAN model organizes and performs many activities such as organizing the incoming image frames, preprocessing them, and finally fusing them to improve the efficiency and accuracy of the perceived data, which in turn improves the accuracy of decision-making in the AVs.
Additionally, this study proposes optimized kernel functions to select the best-fused image for better decision-making. The new GAN model consists of two discriminators: one is the spatial discriminator and the other the spectral discriminator. After acquiring the images from the sensors, the proposed GAN separates the spatial and spectral information through the discriminators. Advanced Fourier transformation is used as a kernel function to extract the spatial and temporal image information.
After separating them, the GAN model uses two-fold image fusion. First, it uses the previously proposed image fusion model to perform the initial fusion. Then, using the proposed GAN model, additional projection functions are used to convert the fused images obtained from the hybrid image fusion Model to 3D point cloud data. The proposed GAN model uses attention-gate principles and compares the fused images with the source image information. If the difference is minimum then the 3D point cloud data generated in the first-fold fusion are further fused with the source images to obtain the final fused 3D point cloud information. Figure 10 illustrates the overall functionality of the proposed GAN model to convert 2D data to 3D data and fuse them accordingly.
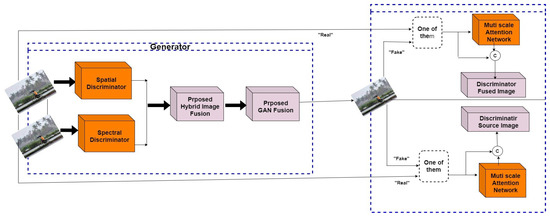
Figure 10.
Functioning of proposed GAN model to fuse 3D point cloud data.
The fusion image obtained from Equation (17) is represented in Cartesian coordinates, which have to be converted into 3D projection coordinates using Equation (18) listed below. An additional column for height is introduced and Equation (17) is multiplied with an identity matrix, which converts the 2D image format to pointed 3D projection data. In Equation (18), h, w, and f correspond to the width, height, and focal length of the sensing device, respectively.
The proposed GAN model has five layers. The first layer is used for the feature extraction process, the second to fuse the extracted features using the proposed hybrid fusion model, the third to convert the 2D fused image to 3D point cloud data using Equation (21), the fourth to perform the discriminator tasks, and the last layer to perform the final fusion. Spatial features are extracted using the kernel function (19), where is the image information existing in the spatial domain and the exponential term is the basis function corresponding to each pixel value of the image, and temporal features are extracted using the kernel function (20), where the exponential function is the basis of every temporal pixel value of the image information, and is an optimization factor. Following multiple iterations of the training phase, we fine-tuned the factor to an optimized value of 0.65.
The proposed GAN model is trained using Equation (21), where is the weight for the feature of of the s-th pooling scale.
5. Experimental Analysis
Table 3 highlights important software and tools used to implement and evaluate the proposed models. Different categories of comparisons are carried out to evaluate the proposed models, and Table 4 displays various key metrics used to evaluate the proposed and other popular image fusion models.
Table 3.
Various tools used for experimental analysis.
Table 4.
Key metrics used in the research to evaluate image fusion models.
5.1. Performance of Hybrid Image Fusion Model with Other Studies
The proposed model is compared with other studies [,] that use hybrid approaches to fuse image data. From the observations, the proposed hybrid image fusion model produces a more accurate fused image than the other studies. From the results portrayed in Figure 11 it is evident that the image clarity and resolution of the proposed image fusion are better than the referred hybrid fusion models.
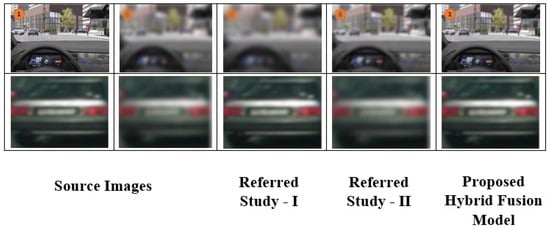
Figure 11.
Comparison with other referred models.
Further, the accuracy and efficiency of the proposed hybrid fusion model are compared with other standard fusion models [,]. The accuracy of the fused images derived from different models is calculated using Equation (22), and efficiency is estimated by the time taken by the fusion model to fuse the images. The results obtained are portrayed in the below Figure 12 and Figure 13. The results prove that the accuracy and efficiency of the proposed image/video fusion models are better than the other popular image/video fusion models. The proposed hybrid image/video fusion models achieve more than 94% accuracy after fusing the images with minimum resolution and clarity. Further, the proposed hybrid fusion models consume less CPU time to fuse the images over the other referred fusion models.
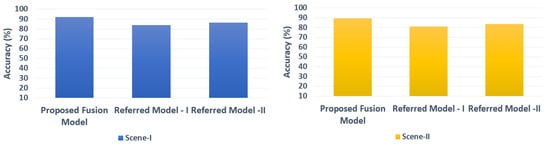
Figure 12.
Accuracy comparison with other models.
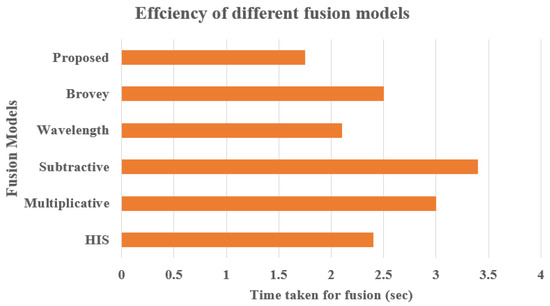
Figure 13.
Efficiency comparison.
The final fused images obtained using the proposed and other popular fusion models are evaluated using various metrics including standard deviation, average gradient, spatial frequency, peak signal-to-noise ratio, and correlation cofactor. A sample of three fused images obtained from different models is considered for evaluation. The proposed fusion models perform better than the other popular fusion models. Table 5 portrays the results obtained after evaluation. The impact of the metrics can be visually seen in Figure 14 and Figure 15. The study also evaluated the proposed edge-detection model with other popular edge-detecting models such as KFA (Kalman filter algorithm) and Sobel & Prewitt. Root mean square error (RMSE) values of the images obtained after edge detection are estimated. The lower the RMSE values are, the higher is the accuracy of the constructed image. The accuracy of the proposed edge detection model is better than the other popular edge detection models. RMSE is calculated using Equation (23), and Table 6 illustrates the RMSE values obtained from different edge detection models for different images. The results show that the proposed edge detection model provides a lower value of RMSE, which indicates the improved accuracy in image construction over the other popular edge detection models. Figure 14 illustrates the results obtained after implementing the proposed and other popular edge detection models. From the results, it is evident that the images constructed after implementing the proposed approach are better than other popular edge detection models.
Table 5.
Overall performance of proposed and other popular image fusion models for various key metrics.
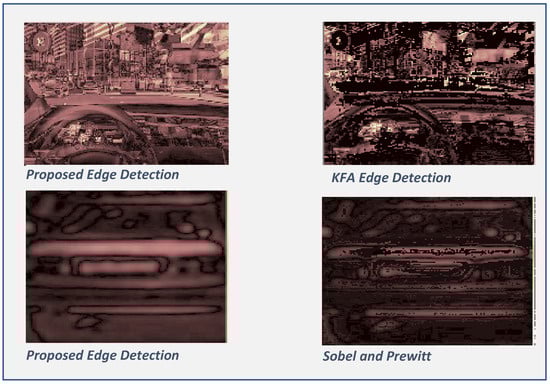
Figure 14.
Comparison between edge detection models.
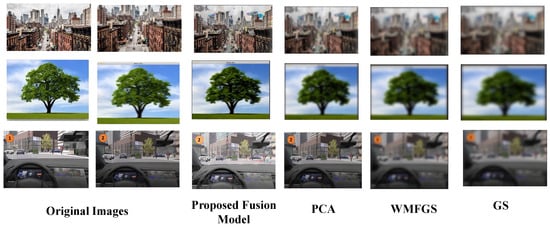
Figure 15.
Classification accuracy of different models.
Table 6.
RMSE scores of different edge detection models.
In another comparison, advanced machine learning models are used to compare the classification accuracy of the fused images obtained from different fusing models, namely principle component analysis (PCA), weighted median filter-based Gram–Schmidt transform (WMFGS) and Gram–Schmidt (GS). The visual differences between different classification results are portrayed in Figure 15. The CNN model using the random forest (RF) classification model is used to classify the fused images obtained from the four fusion models. The CNN model designed has three layers: one for preprocessing, the next layer for fusion, and the final layer for classification. The proposed feature extraction model and fusion models are converted into appropriate kernel functions and implemented in the first two layers. The random forest classification model is a combination of self-relying decision trees, and decision trees handle alphanumeric data easily when compared with other classification models. From the sample of a thousand fused images obtained from the four fusion models, seven hundred samples are used to train and three hundred samples for testing the RF model. The following steps are carried out to build the infrastructure of the CNN model. The first stage is data acquisition, followed by data preprocessing. Subsequently, the RF classification model using sklearn and NumPy python packages is implemented to train and test the sample fused images obtained by the four fusion models used in this study.
Confusion matrix techniques are used to determine the accuracy of classification. From the results obtained, it is evident that the RF model shows more accuracy when it is tested with the fused images obtained from the proposed hybrid image fusion model than with images from the other models. The results obtained are portrayed in Table 7.
Table 7.
Accuracy of different image fusion models.
5.2. Overall Analysis of Proposed GAN Fusion Model
In the extended work (this study), the proposed GAN model has been included to convert the proposed hybrid image fusion model into a machine learning model to handle huge volumes of image data, specifically point cloud data. The proposed GAN model is an advanced CNN model, which is designed as a single convolutional model layer that includes five main layers. The initial layer is utilized to carry out the process of extracting features, while the second layer is responsible for combining the extracted features using a proposed hybrid fusion model. The third layer converts the resulting 2D fused image into 3D point cloud data using the equation referred to in (21). Following that, the fourth layer is dedicated to performing the tasks of the discriminator. Finally, the last layer is responsible for executing the final fusion. Table 8 depicts the design implementation of the proposed GAN model. The 3D point cloud environment setup was carried out using the following steps. Initially, a vehicle perception system purchased from a third-party vendor was used, which helped to create an advanced 3D point cloud perception system. This cloud-based system was installed in the Ubuntu operating system using advanced Docker commands and Python scripting. Applications were developed using Python scripts and later integrated with the perception system to perform advanced analysis. Both real-time data collected from Velodyne sensors and 3D point cloud data obtained from the GeoTiles dataset were used to evaluate the performance of the proposed GAN and other popular fusion models such as FusionGAN, curvelet transform (CVT), dual-tree complex wavelength transform (DTCWT), Laplacian pyramid transform (LP), lowpass pyramid (LP) and multi-resolution singular value decomposition (MSVD). A sample of 20 images was selected from the GeoTiles dataset to train the GAN model, and a maximum of four images were used to test the GAN model initially.
Table 8.
Implementation details of proposed GAN model.
Figure 16 illustrates the performance of various fusion models for the metrics (MI, EN, SD, and PSNR). A sample of 30 point cloud scenes was taken, which analyzed the performance of various popular fusion models along with our extended GAN model for four metrics, namely MI, EN, SD, and PSNR. From the results, the proposed GAN outperformed other fusion models. Table 9 depicts the CPU time consumed by different fusion models to fuse 2D image data and 3D point cloud data. A sample of 10 images was collected from the nuScenes and GeoTiles dataset to evaluate the efficiency of the fusion models. Once again, the proposed fusion models performed better than the other fusion models. Again, a sample of three 3D point cloud data from the GeoTiles dataset along with their blurred images (since it was difficult to obtain blurred images from the dataset, online applications to blur the selected images were used) was taken to analyze the performance of different fusion models. From the analysis, it was observed that the fusion accuracy of the proposed GAN model was better than other fusion models. Figure 17 depicts the fusion results of various fusion models used to fuse 3D point cloud data sampled from the GeoTiles dataset.
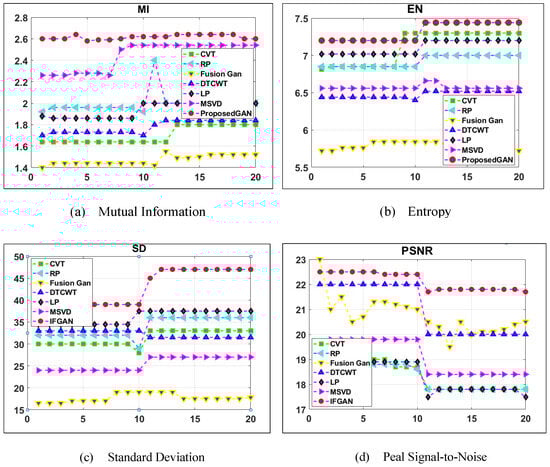
Figure 16.
Comparison between different fusion models for GeoTiles 3D point cloud data.
Table 9.
Run-time comparison between different fusion models.
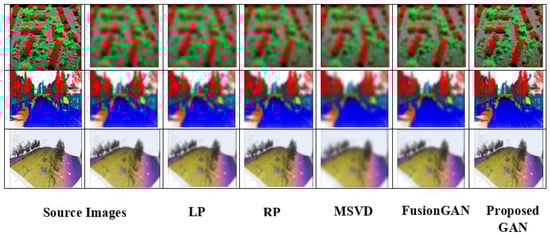
Figure 17.
Fusion results of various fusion models using GeoTiles 3D point cloud data.
5.3. Limitations of the Proposed Study
The study introduced two fusion models: one for merging 2D and 3D images and another for combining various image types, with a specific focus on 3D point cloud data. The initial hybrid image fusion model encountered significant challenges, including ineffective fusion of 3D point cloud data and difficulties in handling large datasets. These issues were addressed by the extended GAN model. However, the proposed GAN model has its own limitations, such as training instability, which necessitates separate training for generators and discriminators. While the assigned parameters for initializing GAN layers performed well with the GeoTiles dataset, further evaluations are needed to assess the model’s ability to fuse images from other datasets. Considerable time was dedicated to optimizing the hyperparameters employed for initializing the model. The study employed a minimal number of images for training and testing the model, and its performance with extensive datasets should be validated in future research.
6. Conclusions
Providing security to customers is a vital task for both AVs and manually driven vehicles. Most of the researchers who propose innovative solutions for AVs have their major focus on providing proper safety and security to the users. This proposal analyzed various reasons for the failure of full-fledged AVs in the current market, which are launched after many trials and research activities. The proposed study found that most of the recently launched AVs failed due to inaccurate and improper decision-making policies, due to their poor perception of their environmental information. Hence, much emphasis has to be given to data preprocessing, namely data cleaning and data fusion of AVs’ sensory data. This research suggests a generic data fusion engine to fuse different formats of data, such as text, images, video, and audio, which exhibit multimodal characteristics. The first stage of the research focused heavily on image fusion since most modern sensors, such as LiDAR and Velodyne, collect data in the form of image frames represented as point cloud data. To facilitate this scenario, this study proposed an innovative hybrid image fusion model, which integrates the concepts of the Brovey fusion model and Gram–Schmidt transformation. The suggested image fusion model is robust enough to handle multispectral image data, retain the RGB color intensity of the fused images, and perform image transformation more efficiently. The proposed hybrid image data fusion model was evaluated with the nuScenes dataset and its performance was compared using standard image metrics with other referred and popular data fusion models. The proposed image fusion model provides better results than the other standard image fusion models in terms of accuracy and efficiency.
Despite the proposed hybrid fusion model demonstrating proficiency in handling 2D and 3D data, it encountered difficulties when dealing with 3D point cloud data and managing large volumes of image data. To address these challenges, the study extended its research by introducing an innovative GAN model capable of handling diverse image data types. In addition to conventional metrics, new metrics such as mutual information and entropy were employed to evaluate the performance of the proposed GAN model. Evaluation of the GAN model utilized point cloud data extracted from the GeoTiles dataset. The performance of the proposed GAN model was compared with other popular fusion models that extensively utilize point cloud data. The results revealed that the proposed GAN model outperforms other fusion models. To enhance the proposed fusion model further, future work entails fine-tuning and evaluating it using different datasets to assess its improved performance. Additionally, plans are underway to enhance the GAN architecture by incorporating principles of multiscale attention and advanced discriminators to improve feature selection and data fusion accuracy. Furthermore, efforts will be made to design and develop advanced kernel functions for the various tasks performed by different layers of the GAN model. Further analysis is required to check whether the accuracy of the fused data enhances perception creation for accurate decision-making in AVs. Future work could look into incorporating the video and audio fusion models, which are currently underway, into the proposed framework.
Author Contributions
H.A.I.: Conceptualization, methodology, experimental analysis, original draft preparation, writing, review, editing, and proofreading. H.E.-S.: Conceptualization, supervision, fund acquisition, and proofreading. M.A.K.: Conceptualization, Methodology, Supervision. P.K.: Conceptualization, supervision, review, editing, and proofreading. All authors have read and agreed to the published version of the manuscript.
Funding
This paper was supported by the Emirates Center for Mobility Research of the United Arab Emirates University (grant 31R271) and ASPIRE Award for Research Excellence, Project Reference AARE20-368.
Institutional Review Board Statement
Not Applicable.
Informed Consent Statement
Not Applicable.
Data Availability Statement
This research exclusively uses existing datasets like nuScenes for vehicle scenarios and GeoTiles for 3D point cloud data. No new dataset has been created.
Acknowledgments
This paper was supported by the Emirates Center for Mobility Research of the United Arab Emirates University (grant 31R271) and ASPIRE Award for Research Excellence, Project Reference AARE20-368. Manzoor Khan was involved with this work during his employment with United Arab Emirates University. He has subsequently moved to Nokia Bell Labs.
Conflicts of Interest
The authors declare no conflict of interest. The funders had no role in the design of the study; in the collection, analyses, or interpretation of data; in the writing of the manuscript, or in the decision to publish the results.
References
- Litman, T. Autonomous Vehicle Implementation Predictions: Implications for Transport Planning; Victoria Transport Policy Institute: Victoria, BC, Canada, 2020. [Google Scholar]
- Fagnant, D.J.; Kockelman, K. Preparing a nation for autonomous vehicles: Opportunities, barriers and policy recommendations. Transp. Res. Part Policy Pract. 2015, 77, 167–181. [Google Scholar] [CrossRef]
- Mohapatra, H.; Rath, A.K.; Panda, N. IoT infrastructure for the accident avoidance: An approach of smart transportation. Int. J. Inf. Technol. 2022, 14, 761–768. [Google Scholar] [CrossRef]
- Endsley, M.R. Design and evaluation for situation awareness enhancement. In Proceedings of the Human Factors Society Annual Meeting, Anaheim, CA, USA, 1 October 1988; Sage Publications: Los Angeles, CA, USA, 1988; Volume 32, pp. 97–101. [Google Scholar]
- Ozguner, U.; Acarman, T.; Redmill, K.A. Autonomous Ground Vehicles; Artech House: Norwood, MA, USA, 2011. [Google Scholar]
- Terzic, J.; Terzic, E.; Nagarajah, R.; Alamgir, M. Ultrasonic sensing technology. In Ultrasonic Fluid Quantity Measurement in Dynamic Vehicular Applications; Springer: Cham, Switzerland, 2013; pp. 11–35. [Google Scholar]
- Ignatious, H.A.; Khan, M. An overview of sensors in Autonomous Vehicles. Procedia Comput. Sci. 2022, 198, 736–741. [Google Scholar] [CrossRef]
- Kaur, H.; Koundal, D.; Kadyan, V. Image fusion techniques: A survey. Arch. Comput. Methods Eng. 2021, 28, 4425–4447. [Google Scholar]
- Shahdoosti, H.R. MS and PAN image fusion by combining Brovey and wavelet methods. arXiv 2017, arXiv:1701.01996. [Google Scholar]
- Mahanti, N.K.; Pandiselvam, R.; Kothakota, A.; Chakraborty, S.K.; Kumar, M.; Cozzolino, D. Emerging non-destructive imaging techniques for fruit damage detection: Image processing and analysis. Trends Food Sci. Technol. 2022, 120, 418–438. [Google Scholar] [CrossRef]
- Son, D.M.; Kwon, H.J.; Lee, S.H. Visible and Near Infrared Image Fusion Using Base Tone Compression and Detail Transform Fusion. Chemosensors 2022, 10, 124. [Google Scholar]
- Alseelawi, N.; Hazim, H.T.; Salim ALRikabi, H.T. A Novel Method of Multimodal Medical Image Fusion Based on Hybrid Approach of NSCT and DTCWT. Int. J. Online Biomed. Eng. 2022, 18, 28011. [Google Scholar] [CrossRef]
- Chen, D.; Fei, X.; Wang, Z.; Gao, Y.; Shen, X.; Han, T.; Zhang, Y. Classifying Vegetation Types in Mountainous Areas with Fused High Spatial Resolution Images: The Case of Huaguo Mountain, Jiangsu, China. Sustainability 2022, 14, 13390. [Google Scholar] [CrossRef]
- Shahian Jahromi, B.; Tulabandhula, T.; Cetin, S. Real-time hybrid multi-sensor fusion framework for perception in autonomous vehicles. Sensors 2019, 19, 4357. [Google Scholar] [CrossRef]
- Jia, D.; Cheng, C.; Song, C.; Shen, S.; Ning, L.; Zhang, T. A hybrid deep learning-based spatiotemporal fusion method for combining satellite images with different resolutions. Remote Sens. 2021, 13, 645. [Google Scholar] [CrossRef]
- Wang, Y.; Von Der Weth, C.; Zhang, Y.; Low, K.H.; Singh, V.K.; Kankanhalli, M. Concept based hybrid fusion of multimodal event signals. In Proceedings of the 2016 IEEE International Symposium on Multimedia (ISM), San Jose, CA, USA, 11–13 December 2016; pp. 14–19. [Google Scholar]
- Malawade, A.V.; Mortlock, T.; Faruque, M.A.A. HydraFusion: Context-Aware Selective Sensor Fusion for Robust and Efficient Autonomous Vehicle Perception. arXiv 2022, arXiv:2201.06644. [Google Scholar]
- Zhao, Y.; Huang, B. A hybrid image fusion model for generating high spatial-temporal-spectral resolution data using OLI-MODIS-Hyperion satellite imagery. World Acad. Sci. Eng. Technol. Int. J. Environ. Chem. Ecol. Geol. Geophys. Eng. 2017, 11, 843–848. [Google Scholar]
- Latreche, B.; Saadi, S.; Kious, M.; Benziane, A. A novel hybrid image fusion method based on integer lifting wavelet and discrete cosine transformer for visual sensor networks. Multimed. Tools Appl. 2019, 78, 10865–10887. [Google Scholar] [CrossRef]
- Zhang, X. Multi-focus image fusion: A benchmark. arXiv 2020, arXiv:2005.01116. [Google Scholar]
- Kaimaris, D.; Kandylas, A. Small Multispectral UAV Sensor and Its Image Fusion Capability in Cultural Heritage Applications. Heritage 2020, 3, 1046–1062. [Google Scholar] [CrossRef]
- Luo, Y.; He, K.; Xu, D.; Yin, W.; Liu, W. Infrared and visible image fusion based on visibility enhancement and hybrid multiscale decomposition. Optik 2022, 258, 168914. [Google Scholar] [CrossRef]
- Ma, J.; Yu, W.; Chen, C.; Liang, P.; Guo, X.; Jiang, J. Pan-GAN: An unsupervised pan-sharpening method for remote sensing image fusion. Inf. Fusion 2020, 62, 110–120. [Google Scholar] [CrossRef]
- Zhang, H.; Yuan, J.; Tian, X.; Ma, J. GAN-FM: Infrared and visible image fusion using GAN with full-scale skip connection and dual Markovian discriminators. IEEE Trans. Comput. Imaging 2021, 7, 1134–1147. [Google Scholar] [CrossRef]
- Chen, J.; Ding, J.; Yu, Y.; Gong, W. THFuse: An Infrared and Visible Image Fusion Network using Transformer and Hybrid Feature Extractor. Neurocomputing 2023, 527, 71–82. [Google Scholar] [CrossRef]
- Guo, C.; Fan, D.; Jiang, Z.; Zhang, D. MDFN: Mask deep fusion network for visible and infrared image fusion without reference ground-truth. Expert Syst. Appl. 2023, 211, 118631. [Google Scholar] [CrossRef]
- Zhang, G.; Nie, R.; Cao, J.; Chen, L.; Zhu, Y. FDGNet: A pair feature difference guided network for multimodal medical image fusion. Biomed. Signal Process. Control. 2023, 81, 104545. [Google Scholar] [CrossRef]
- Li, J.; Li, B.; Jiang, Y.; Cai, W. MSAt-GAN: A generative adversarial network based on multi-scale and deep attention mechanism for infrared and visible light image fusion. Complex Intell. Syst. 2022, 8, 4753–4781. [Google Scholar] [CrossRef]
- Xu, H.; Ma, J.; Zhang, X.P. MEF-GAN: Multi-exposure image fusion via generative adversarial networks. IEEE Trans. Image Process. 2020, 29, 7203–7216. [Google Scholar] [CrossRef]
- Zhao, Z.; Bai, H.; Zhang, J.; Zhang, Y.; Xu, S.; Lin, Z.; Timofte, R.; Van Gool, L. Cddfuse: Correlation-driven dual-branch feature decomposition for multi-modality image fusion. In Proceedings of the IEEE/CVF Conference on Computer Vision and Pattern Recognition, Vancouver, BC, Canada, 24–31 January 2023; pp. 5906–5916. [Google Scholar]
- Wang, X.; Hua, Z.; Li, J. Multi-focus image fusion framework based on transformer and feedback mechanism. Ain Shams Eng. J. 2023, 14, 101978. [Google Scholar] [CrossRef]
- Tiede, P.; Broderick, A.E.; Palumbo, D.C. Variational Image Feature Extraction for the Event Horizon Telescope. Astrophys. J. 2022, 925, 122. [Google Scholar] [CrossRef]
- Liu, Y.; Pu, H.; Sun, D.W. Efficient extraction of deep image features using convolutional neural network (CNN) for applications in detecting and analysing complex food matrices. Trends Food Sci. Technol. 2021, 113, 193–204. [Google Scholar] [CrossRef]
- Liang, N.; Duan, P.; Xu, H.; Cui, L. Multi-View Structural Feature Extraction for Hyperspectral Image Classification. Remote Sens. 2022, 14, 1971. [Google Scholar] [CrossRef]
- Barburiceanu, S.; Terebes, R.; Meza, S. 3D texture feature extraction and classification using GLCM and LBP-based descriptors. Appl. Sci. 2021, 11, 2332. [Google Scholar] [CrossRef]
- Ahmed Bhuiyan, R.; Ahmed, N.; Amiruzzaman, M.; Islam, M.R. A robust feature extraction model for human activity characterization using 3-axis accelerometer and gyroscope data. Sensors 2020, 20, 6990. [Google Scholar] [CrossRef]
- Du, B.; Xiong, W.; Wu, J.; Zhang, L.; Zhang, L.; Tao, D. Stacked convolutional denoising auto-encoders for feature representation. IEEE Trans. Cybern. 2016, 47, 1017–1027. [Google Scholar] [CrossRef] [PubMed]
- El-Sayed, H.; Alexander, H.; Khan, M.A.; Kulkarni, P.; Bouktif, S. DyReT: A Dynamic Rule Framing Engine Equipped With Trust Management for Vehicular Networks. IEEE Access 2020, 8, 72757–72767. [Google Scholar] [CrossRef]
- Gomes, P.R.; Sabuj, H.H.; Uddin, M.A.; Reza, M.T.; Faiz, R.I.; Alam, M.A. A Deep Learning Approach for Reconstruction of Color Images in Different Lighting Conditions Based on Autoencoder Technique. In Proceedings of the IEEE 2021 International Conference on Electronics, Information, and Communication (ICEIC), Jeju, Korea, 31 January–3 February 2021; pp. 1–4. [Google Scholar]
- Gai, J.; Tang, L.; Steward, B.L. Automated crop plant detection based on the fusion of color and depth images for robotic weed control. J. Field Robot. 2020, 37, 35–52. [Google Scholar] [CrossRef]
- Kour, H. Analysis on image color model. Comput. Sci. 2015, 4, 233–235. [Google Scholar]
- Zhang, Y.; Liu, Y.; Sun, P.; Yan, H.; Zhao, X.; Zhang, L. IFCNN: A general image fusion framework based on convolutional neural network. Inf. Fusion 2020, 54, 99–118. [Google Scholar] [CrossRef]
- He, C.; Liu, Q.; Li, H.; Wang, H. Multimodal medical image fusion based on IHS and PCA. Procedia Eng. 2010, 7, 280–285. [Google Scholar] [CrossRef]
- Ranchin, T.; Aiazzi, B.; Alparone, L.; Baronti, S.; Wald, L. Image fusion—The ARSIS concept and some successful implementation schemes. ISPRS J. Photogramm. Remote. Sens. 2003, 58, 4–18. [Google Scholar] [CrossRef]
- Dian, R.; Li, S.; Sun, B.; Guo, A. Recent advances and new guidelines on hyperspectral and multispectral image fusion. Inf. Fusion 2021, 69, 40–51. [Google Scholar] [CrossRef]
- Yang, Z.; Diao, C.; Li, B. A robust hybrid deep learning model for spatiotemporal image fusion. Remote Sens. 2021, 13, 5005. [Google Scholar] [CrossRef]
- Metrics. Mterics Used for Evaluation. 2008. Available online: https://academic-accelerator.com/Manuscript-Generator/zh/Performance-Metrics (accessed on 19 July 2008).
- Jagalingam, P.; Hegde, A.V. A review of quality metrics for fused image. Aquat. Procedia 2015, 4, 133–142. [Google Scholar] [CrossRef]
- Islam, M.N.; Tahtali, M.; Pickering, M. Hybrid Fusion-Based Background Segmentation in Multispectral Polarimetric Imagery. Remote Sens. 2020, 12, 1776. [Google Scholar] [CrossRef]
- Barrero, O.; Perdomo, S.A. RGB and multispectral UAV image fusion for Gramineae weed detection in rice fields. Precis. Agric. 2018, 19, 809–822. [Google Scholar] [CrossRef]
- Talal, T.M.; Attiya, G.; Metwalli, M.R.; El-Samie, A.; Fathi, E.; Dessouky, M.I. Satellite image fusion based on modified central force optimization. Multimed. Tools Appl. 2020, 79, 21129–21154. [Google Scholar] [CrossRef]
Disclaimer/Publisher’s Note: The statements, opinions and data contained in all publications are solely those of the individual author(s) and contributor(s) and not of MDPI and/or the editor(s). MDPI and/or the editor(s) disclaim responsibility for any injury to people or property resulting from any ideas, methods, instructions or products referred to in the content. |
© 2023 by the authors. Licensee MDPI, Basel, Switzerland. This article is an open access article distributed under the terms and conditions of the Creative Commons Attribution (CC BY) license (https://creativecommons.org/licenses/by/4.0/).