Abstract
Acid gas injection operations function as the commercial equivalent of certain aspects within the realm of geological CO2 storage. Acid gas, composed of H2S and CO2, alongside minor quantities of hydrocarbon gases stemming from either petroleum production or processing, constitute the composition of acid gas. The primary aim of acid gas injection operations lies in the disposal of H2S. Nevertheless, substantial volumes of CO2 are concurrently injected due to the economic impracticality of segregating the two gases. This investigation delves into the comprehensive, step-by-step procedure that can be employed to determine the suitability of a field or formation for acid gas injection, utilizing all accessible data, including the literature and data from neighboring fields. This approach incorporates sensitivity analysis of various parameters to ascertain the feasibility of AGI while minimizing costs and time consumption. The focus of this study centers on evaluating the feasibility of Acid Gas Injection (AGI) in a saline aquifer offshore in Iran. The assessment encompasses the examination of reservoir properties, geomechanical aspects, caprock integrity, and gas plume dynamics. The Surmeh formation emerges as a promising candidate for AGI due to the presence of upper dolomite and lower carbonate within the rock formations. Geomechanical analysis reveals a pore pressure of 3800 psi and a fracture pressure of 6100 psi. Caprock integrity, particularly within the Hith formation, emerges as pivotal for both containment and long-term stability. Seismic mapping highlights variations in caprock thickness, influencing containment effectiveness. Capillary trapping emerges as a significant factor in short-term gas entrapment and plume distribution. Numerical simulations elucidate the impact of heterogeneous rock properties on capillary trapping and gas plume movement. The projection estimates approximately 2 TCF (Trillion Cubic Feet) of acid gas injection into the Surmeh formation. Based on the acid gas content and the gas in place at the source of injection, the recommended injection rate stands at 180 MMSCFD (million standard cubic feet per day). The formation’s inherent tightness limits injectivity, allowing for a maximum achievable rate of 7 MMSCFD with a permeability of 1 mD (millidarcy). However, a higher porosity (12%) and a permeability of 100 mD enable more efficient injection without fracturing the formation. To achieve this, it becomes imperative to implement two injection wells, each with a capacity of 90 MMSCFD.
1. Introduction
In accordance with the scenarios outlined by the Intergovernmental Panel on Climate Change (IPCC), to limit global warming to 1.5 °C, it is necessary to achieve global net-zero CO2 emissions by approximately 2050. This goal requires significant reductions in all human-caused emissions and balancing any remaining unavoidable anthropogenic emissions with equivalent carbon removal measures. The aim is to minimize emissions as much as possible and offset any residual emissions through effective carbon removal strategies [1].
Carbon capture and storage (CCS) represents a crucial technology with the aim of tackling greenhouse gas emissions and reducing the effects of climate change [2]. CCS technologies offer the means to achieve both carbon dioxide removal and emissions reduction. These technologies start by isolating carbon dioxide through a capture process. Subsequently, the captured carbon dioxide is conditioned, transported, and finally stored in geological formations. As a result, CCS technologies effectively reduce carbon dioxide emissions at specific sources or extract carbon dioxide directly from the atmosphere [3].
Acid gas injection operations serve as the commercial equivalent to some aspects of geological CO2 storage. Acid gas, comprising H2S and CO2, together with small amounts of hydrocarbon gases originating from petroleum production or processing, make up the acid gas composition [4]. The primary objective of acid gas injection operations is the disposal of H2S. However, substantial amounts of CO2 are injected simultaneously due to the economic impossibility of separating the two gases [5].
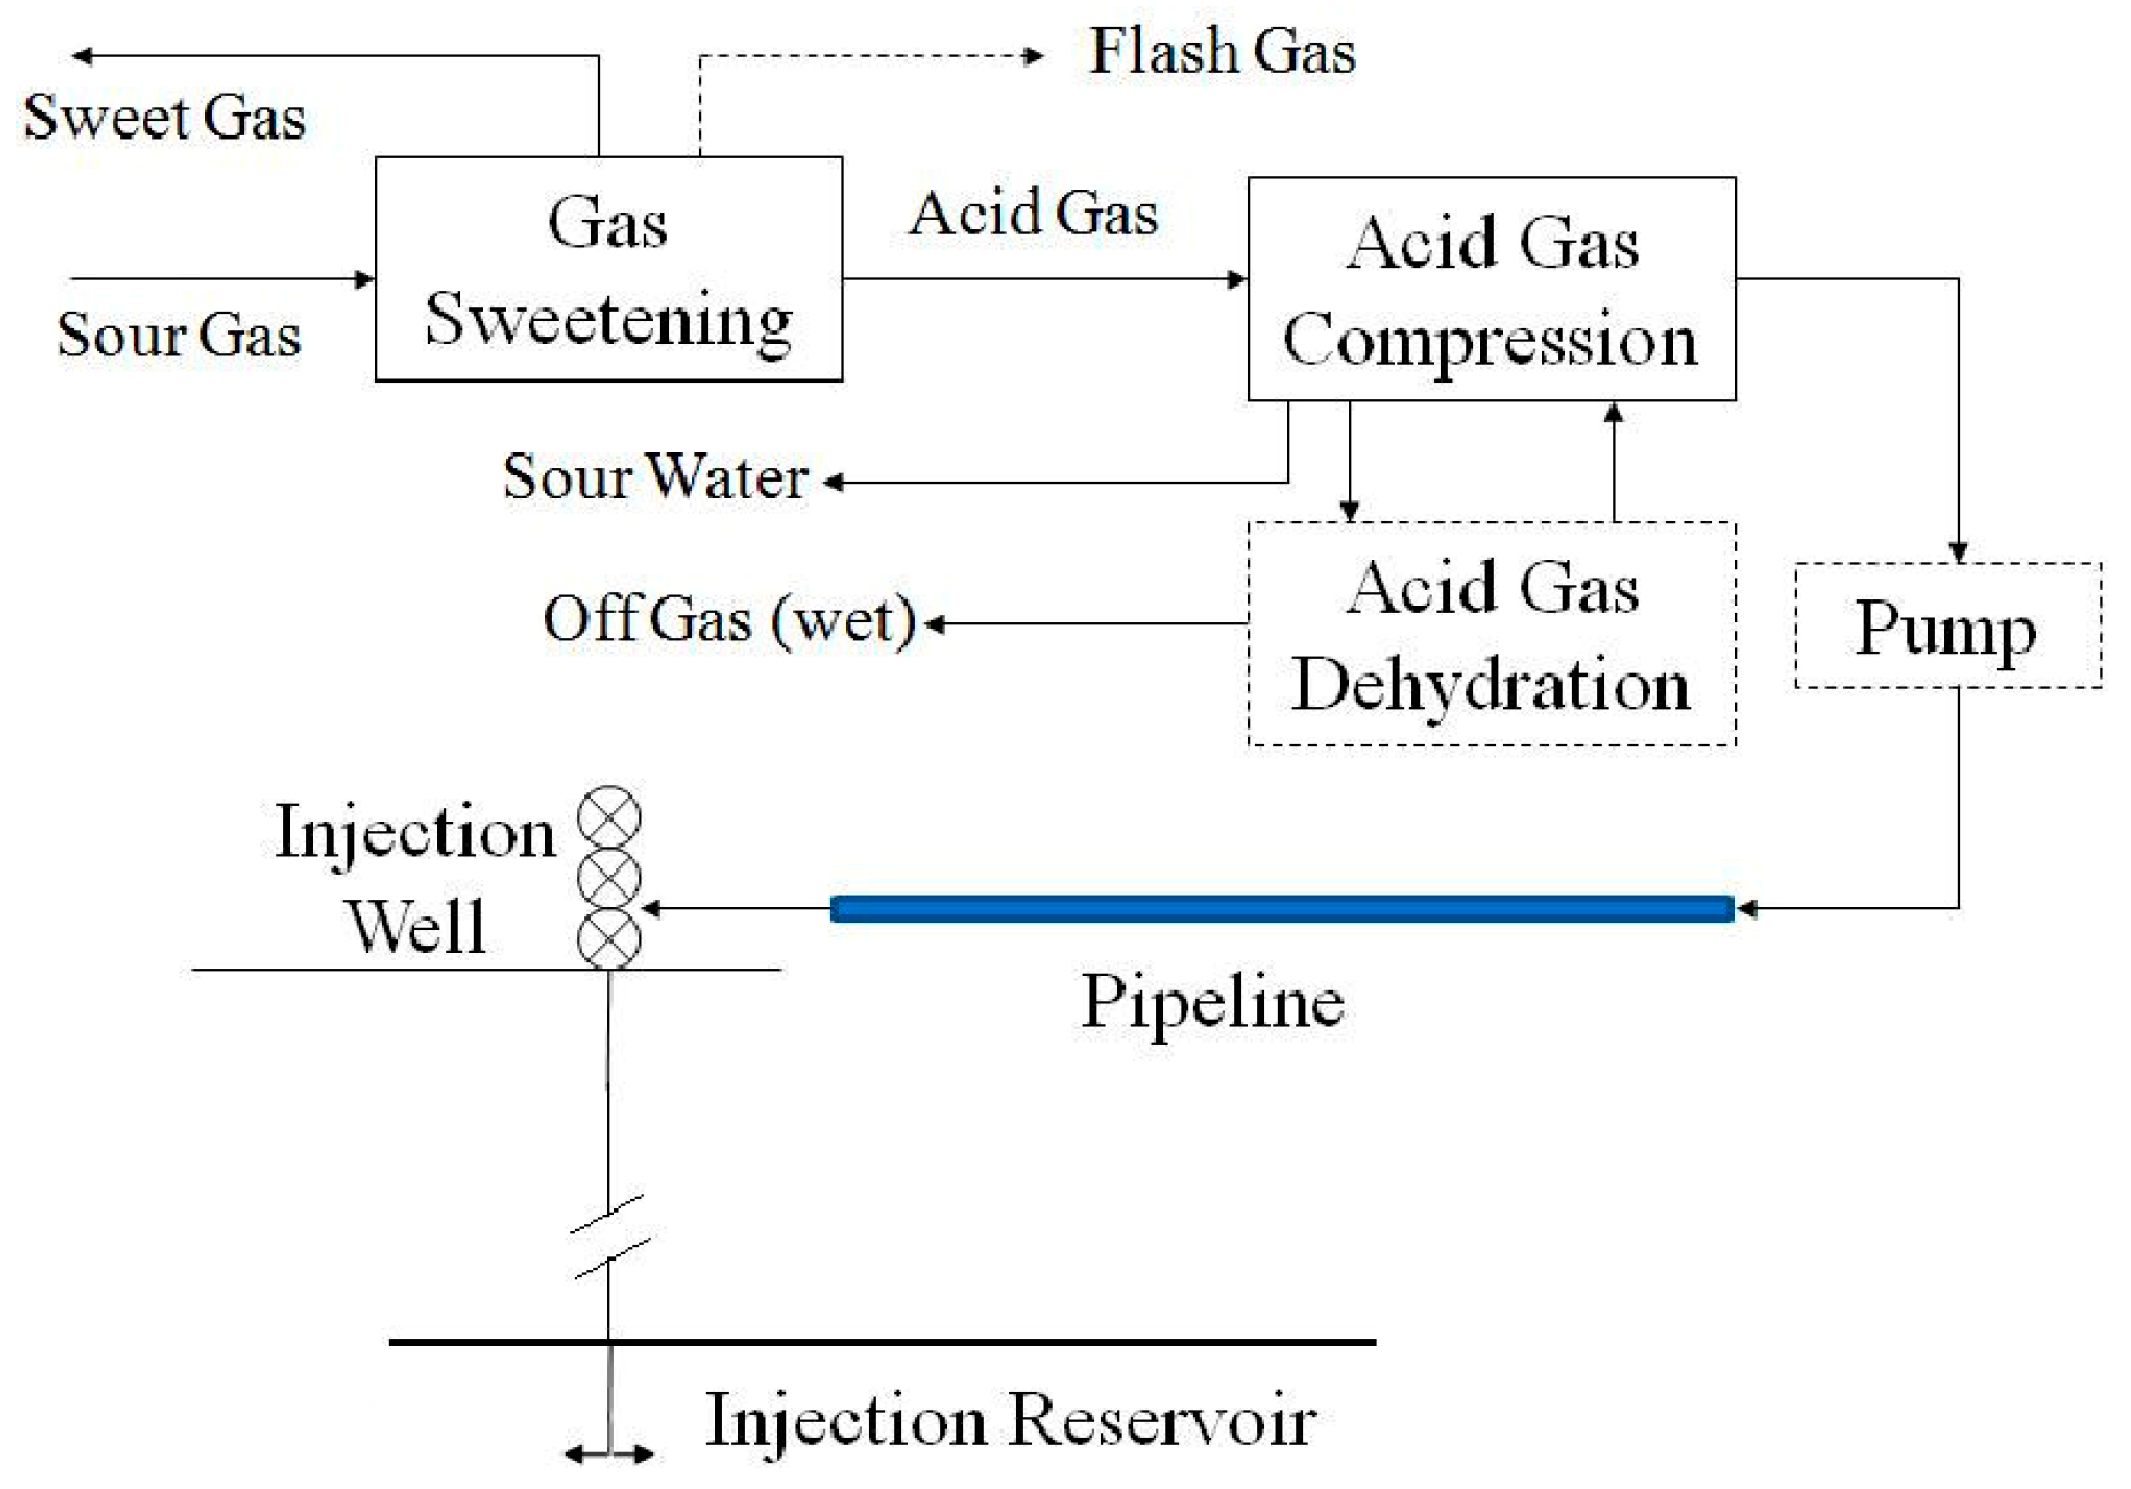
The primary method of acid gas injection involves the injection of a stream consisting mainly of H2S and CO2, obtained from the sweetening plant. This stream is compressed and piped to an injection well, where it is directed downward into a subsurface formation typically intended for disposal [2]. The general injection scheme, which includes the sweetening plant and associated processes, can be represented by a block diagram (Figure 1).
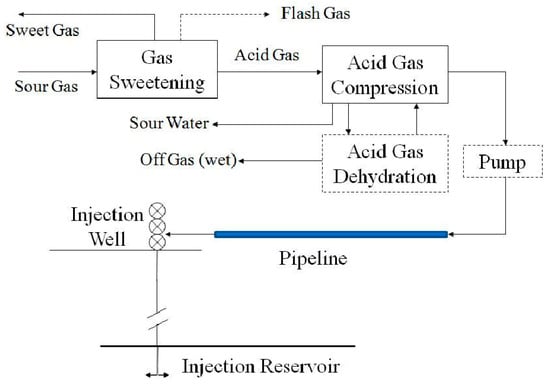
Figure 1.
Representation of AGI by a block diagram [6].
Regulatory agencies in Western Canada are currently granting approval for several parameters related to acid gas injection. These include the maximum allowed fraction of H2S, the maximum injection pressure and rate at the wellhead, as well as the maximum injection volume. Acid gas injection operations are currently conducted in 51 distinct formations, located at 44 different sites across the Alberta Basin in the provinces of Alberta and British Columbia. The injection of acid gas occurs in various types of formations at different sites. Specifically, it takes place in deep saline formations at 27 sites, depleted oil and/or gas reservoirs at 19 sites, and in the underlying water leg of depleted oil and gas reservoirs at 4 sites. These different types of formations act as places for the injection process. Of all the sites, 29 rely on carbonates as the primary reservoir formation for acid gas injection. Conversely, the remaining 21 sites predominantly use quartz-rich sandstones as the dominant reservoir formation. In most cases, shales act as caprocks, serving as an upper confining unit for injection zones. However, in the remaining injection zones, narrow limestones, evaporites, and anhydrites are responsible for the confinement of the injected substances and their effective containment [7].
Numerous sedimentary regions worldwide possess varying degrees of suitability for CO2 storage. In general, geological storage sites must have the following characteristics to be suitable for CO2 storage:
- Sufficient capacity and injectivity to accommodate the CO2 being injected.
- An effective sealing caprock, or confining unit, to prevent CO2 leakage.
- A geologically stable environment that ensures the long-term integrity of the storage site, minimizing the risk of any potential compromise [8].
Three geological formations have been extensively studied for the purpose of storing CO2: oil and gas reservoirs, deep saline formations, and non-mineable coal beds. In all three cases, the process of geological storage of CO2 involves its injection in dense form into a subsurface rock formation [9]. Rock formations that are porous and capable of holding, or that have previously held, fluids such as natural gas, oil, or brine, such as depleted oil and gas reservoirs, are considered suitable options for CO2 storage. Suitable storage formations for CO2 can be found in both onshore and offshore sedimentary basins. These basins are large-scale natural depressions in the earth’s crust that are filled with sediments [10].
A thorough site characterization of a deep saline aquifer is crucial to assess its safety and long-term viability for effective geological storage of CO2. Various techniques, including core analysis, well-logging analysis, and geological modeling, are employed to gather essential information and to form the basis for evaluation. Detailed analysis of sediment cores and interpretation of well-log data are valuable for understanding the vertical and lateral heterogeneity caused by changes in depositional environments within the framework of sequence stratigraphy [11]. However, these data primarily provide information about geology and petrology near the wells. To reduce uncertainties in site characterization, it is essential to effectively incorporate seismic data, which greatly assist in building a geological model describing the reservoir architecture away from the wells. Using seismic data, a more complete understanding of the site can be achieved, extending beyond the immediate vicinity of the wells [12].
In this study, the focus is on assessing the feasibility of AGI in saline aquifers located in an Iranian offshore reservoir. A comprehensive survey was carried out, incorporating geological data, drilling data, petrophysical and geophysical information, as well as geomechanical data. Next, a simulation study was conducted using commercial software (Petrel 2015) to determine optimal reservoir properties and the maximum injection rate while ensuring that the bottom-hole pressure (BHP) remained below the fracture pressure threshold. The primary objective is to maintain the integrity of the storage site and prevent any risks associated with exceeding the fracture pressure.
2. Case Study
The proposed concept involves injecting the sour gas into the reservoir with the produced gas, which has a high H2S content of around 40,000 ppm. To make the gas suitable for commercial use, a sweetening process is necessary to remove unwanted components. However, the gas containing H2S, CO2, and CH4, which is not economically viable, must be disposed of properly.
The disposal process ensures proper handling of gases that are not economically feasible for commercial use, while maintaining safety and environmental standards. Safety and environmental considerations for AGI encompass gas composition, adherence to safety standards, injection well integrity, environmental protection measures for emissions reduction and containment, compliance with varying regional regulations, continuous monitoring and reporting, closure planning, and public engagement when necessary. Specific references and standards can differ by region and may involve organizations such as the Environmental Protection Agency (EPA) (Washington, DC, USA), the International Organization for Standardization (ISO) (Geneva, Switzerland), and national/regional authorities.
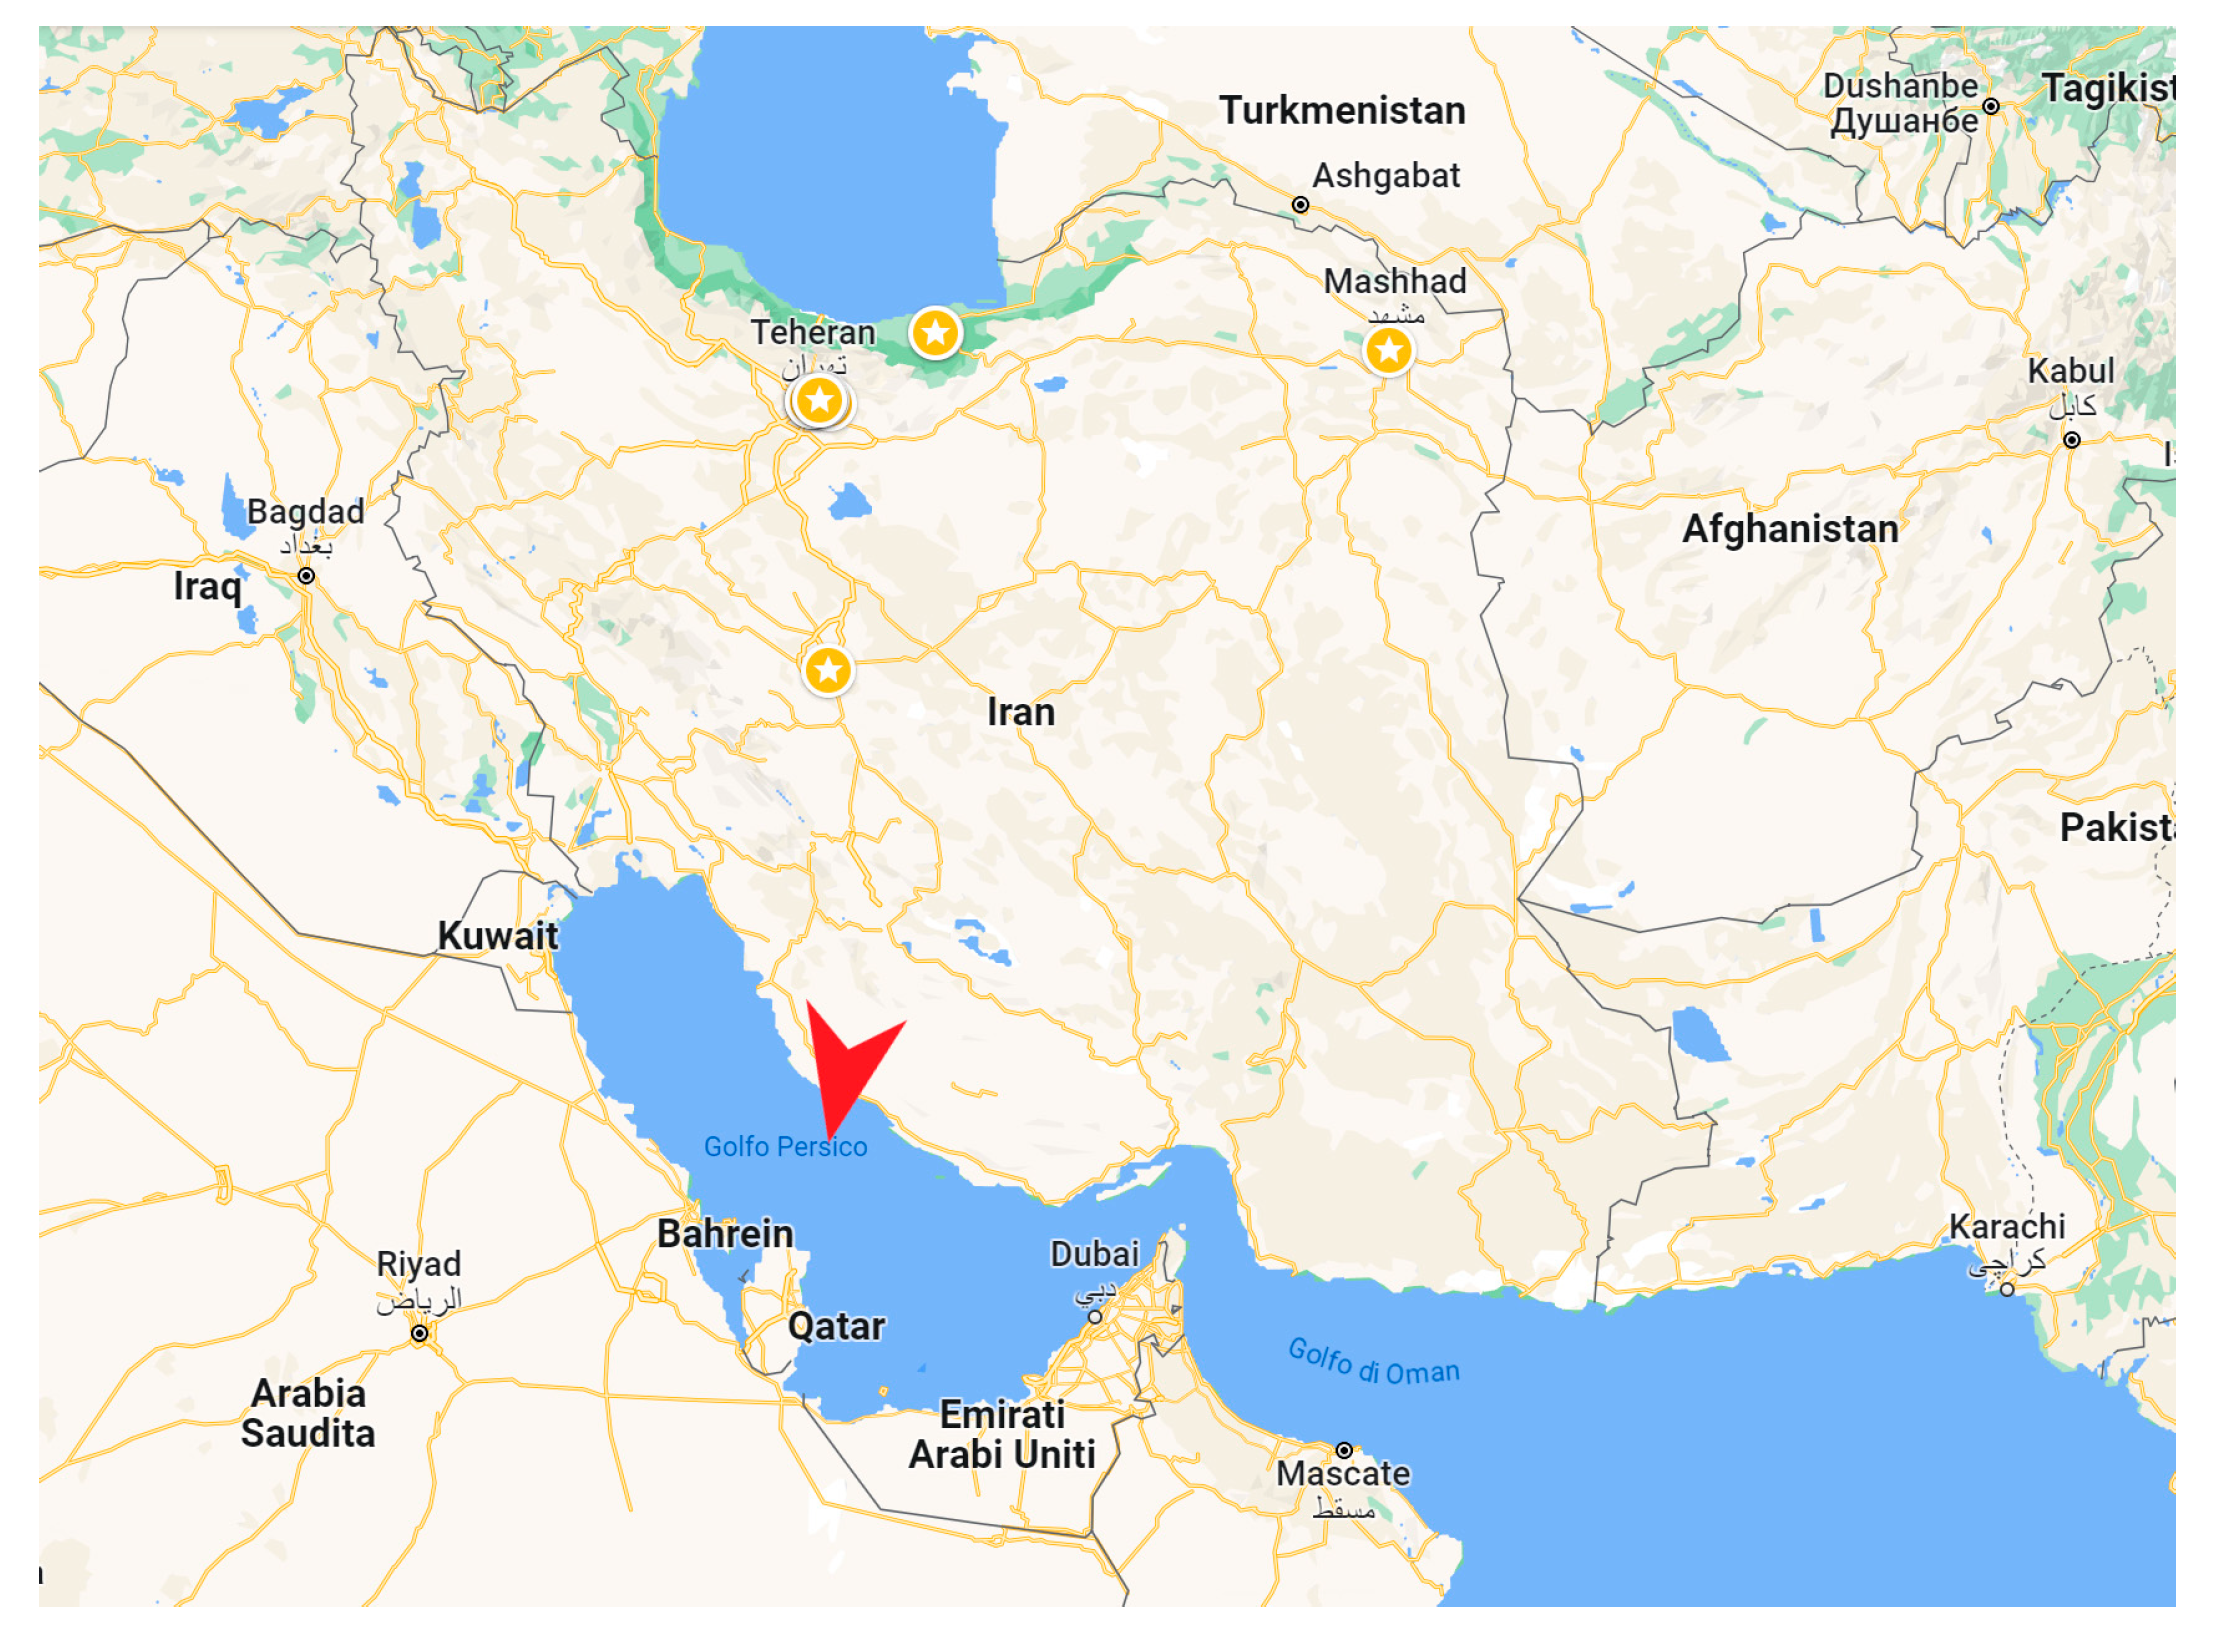
The study area selected for this research is located in the Persian Gulf, approximately 100 km from the Iranian shoreline and 120 km from the city of Bushehr. The geological features of this region include basal forces and salt diapirism, which have contributed to the formation of an asymmetrical dome structure with an east–west (E-W) trend [13] (see Figure 2). Figure 3 represents the stratigraphic column of the field.

Figure 2.
Injection site location near Bushehr, Iran (red arrow).
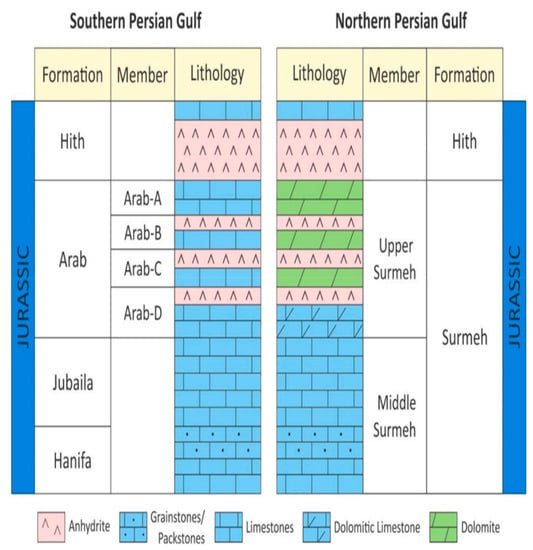
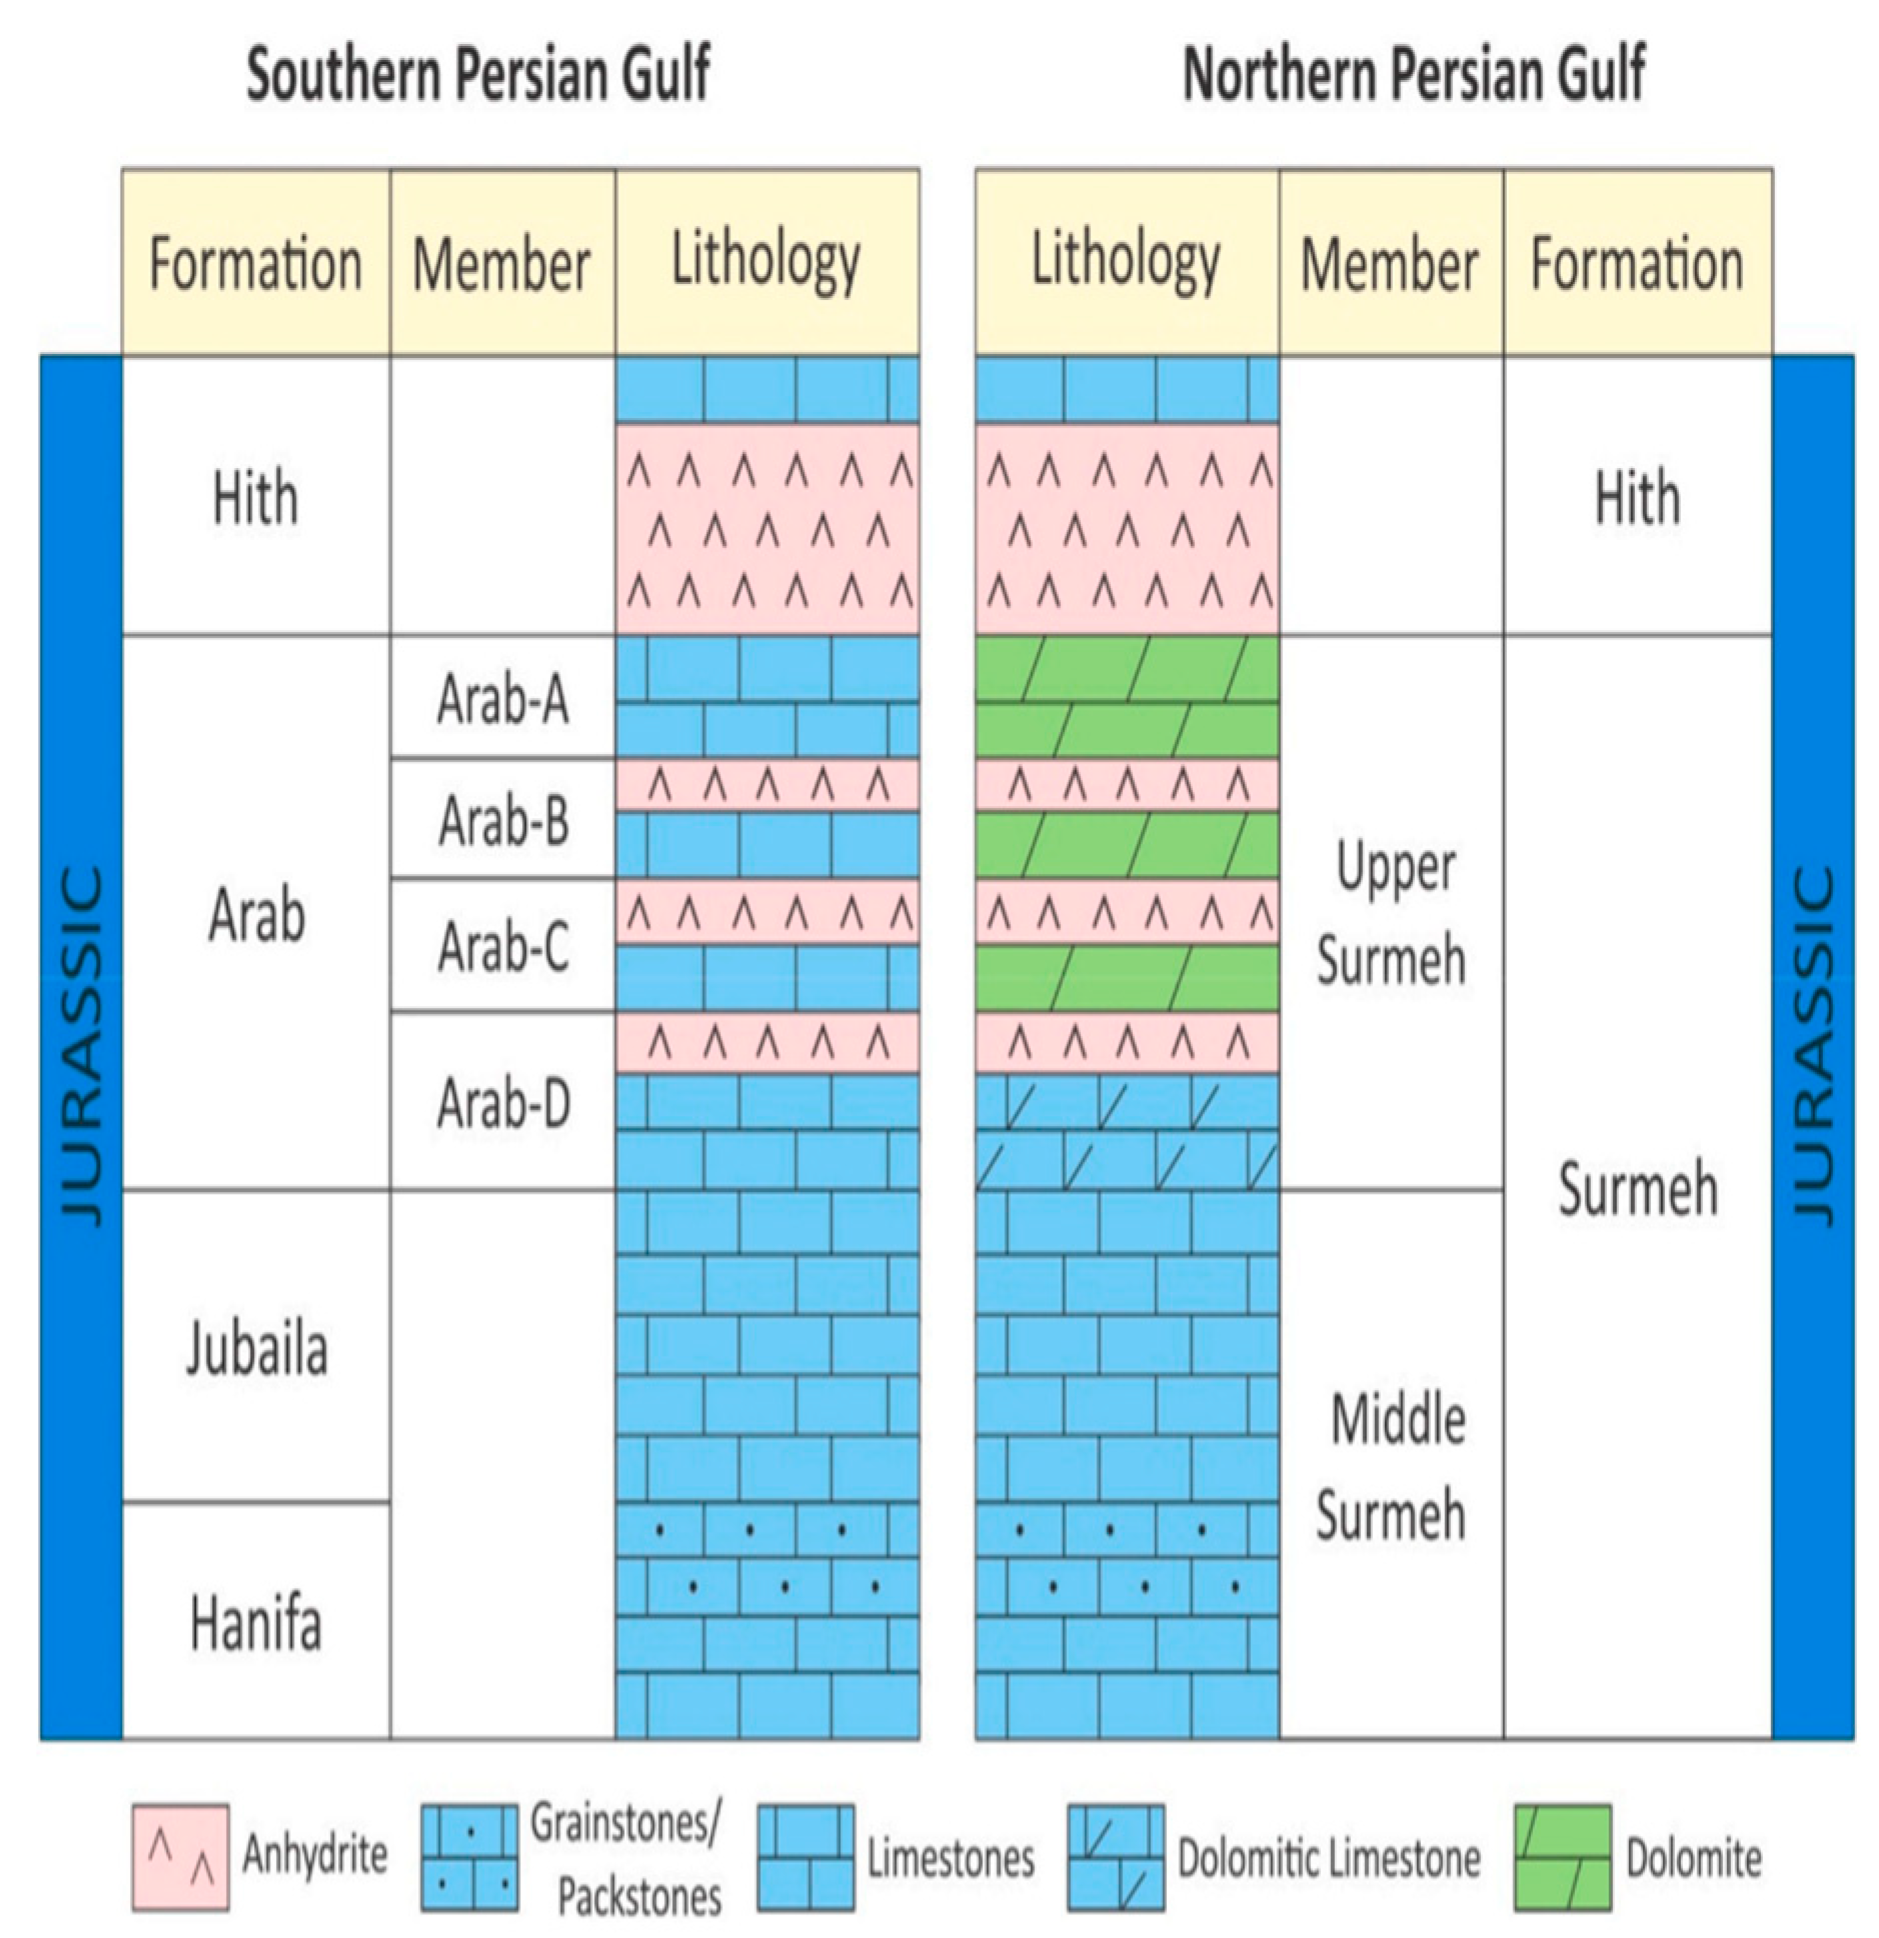
Figure 3.
Upper Jurassic stratigraphy of the Surmeh reservoir and its equivalent in the southern part of the Persian Gulf [14].
The Surmeh formation, as shown in Figure 3, was selected as a candidate for studying the feasibility of AGI. The upper part of the formation is primarily composed of dolomite, whereas the lower part consists mainly of carbonate rocks. The Surmeh formation has a total thickness of approximately 800 m, with both the upper and lower sections measuring around 400 m each. Based on the available log data (Figure 4), the porosity in the upper part of the formation is relatively higher (approximately 6%) and less permeable than the lower part (2.5%), where mud losses have been recorded due to the higher permeability.
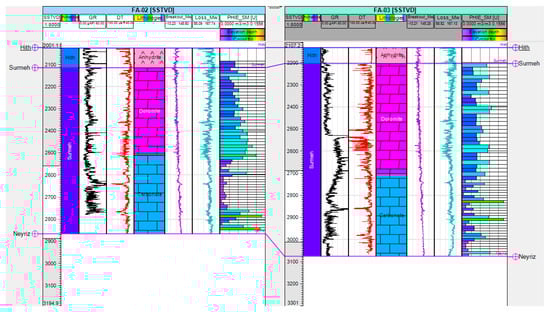
Figure 4.
Schematic representation of Surmeh formation in two wells (FA_02 and FA_03 of the injection field).
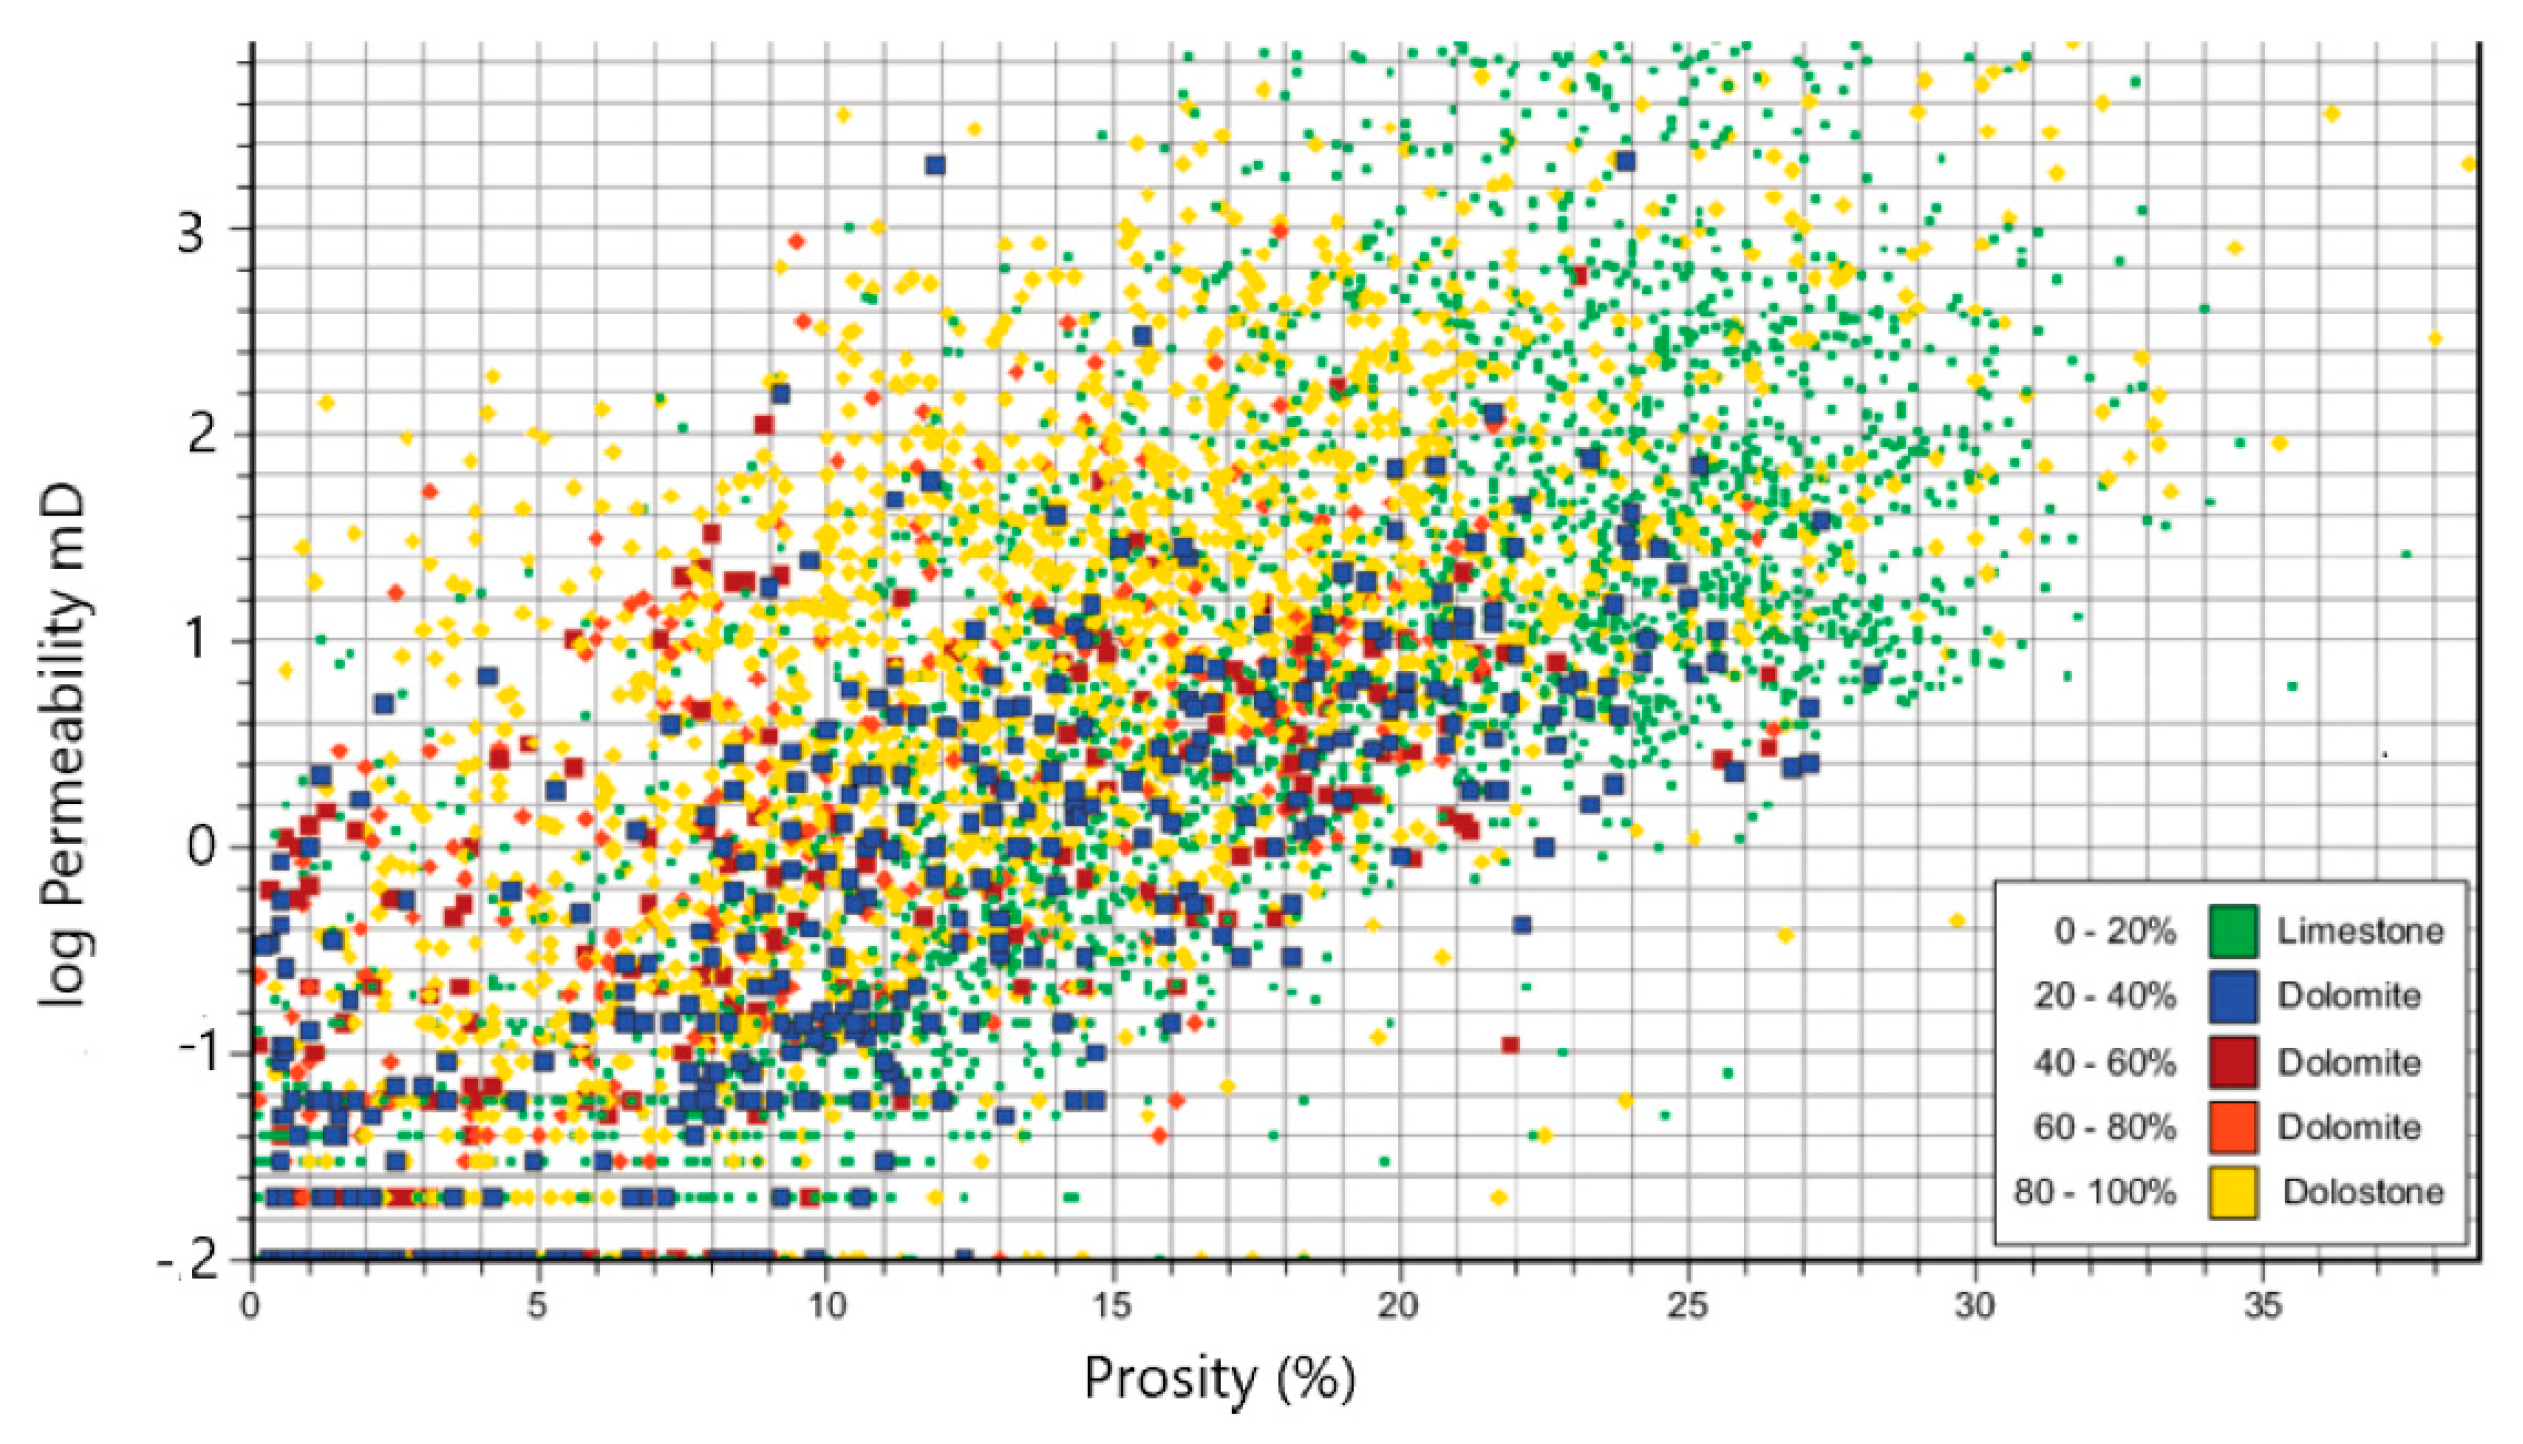
The conventional approach for determining the permeability coefficient has involved fitting data using the particle size gradient and soil porosity. Nevertheless, assessing soil porosity, obtaining samples at specific depths, and preserving the initial pressure during field sampling and laboratory testing present considerable challenges [15]. We present a graphical representation of porosity versus permeability, categorized into different groups based on varying degrees of dolomitization (replacive and cement types) within the carbonate rocks of the Arab Formation (depicted in Figure 5). The porosity–permeability relation for the Arab formation (Surmeh) [11] reveals that dolomitization exerts diverse influences on reservoir quality, resulting in considerable variations in both porosity and permeability. Additionally, this plot illustrates a notable positive correlation between porosity and permeability across the entire dataset.
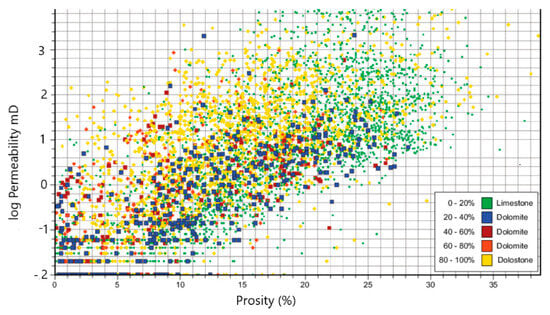
Figure 5.
Porosity–permeability relation for the Arab formation (Surmeh) [16].
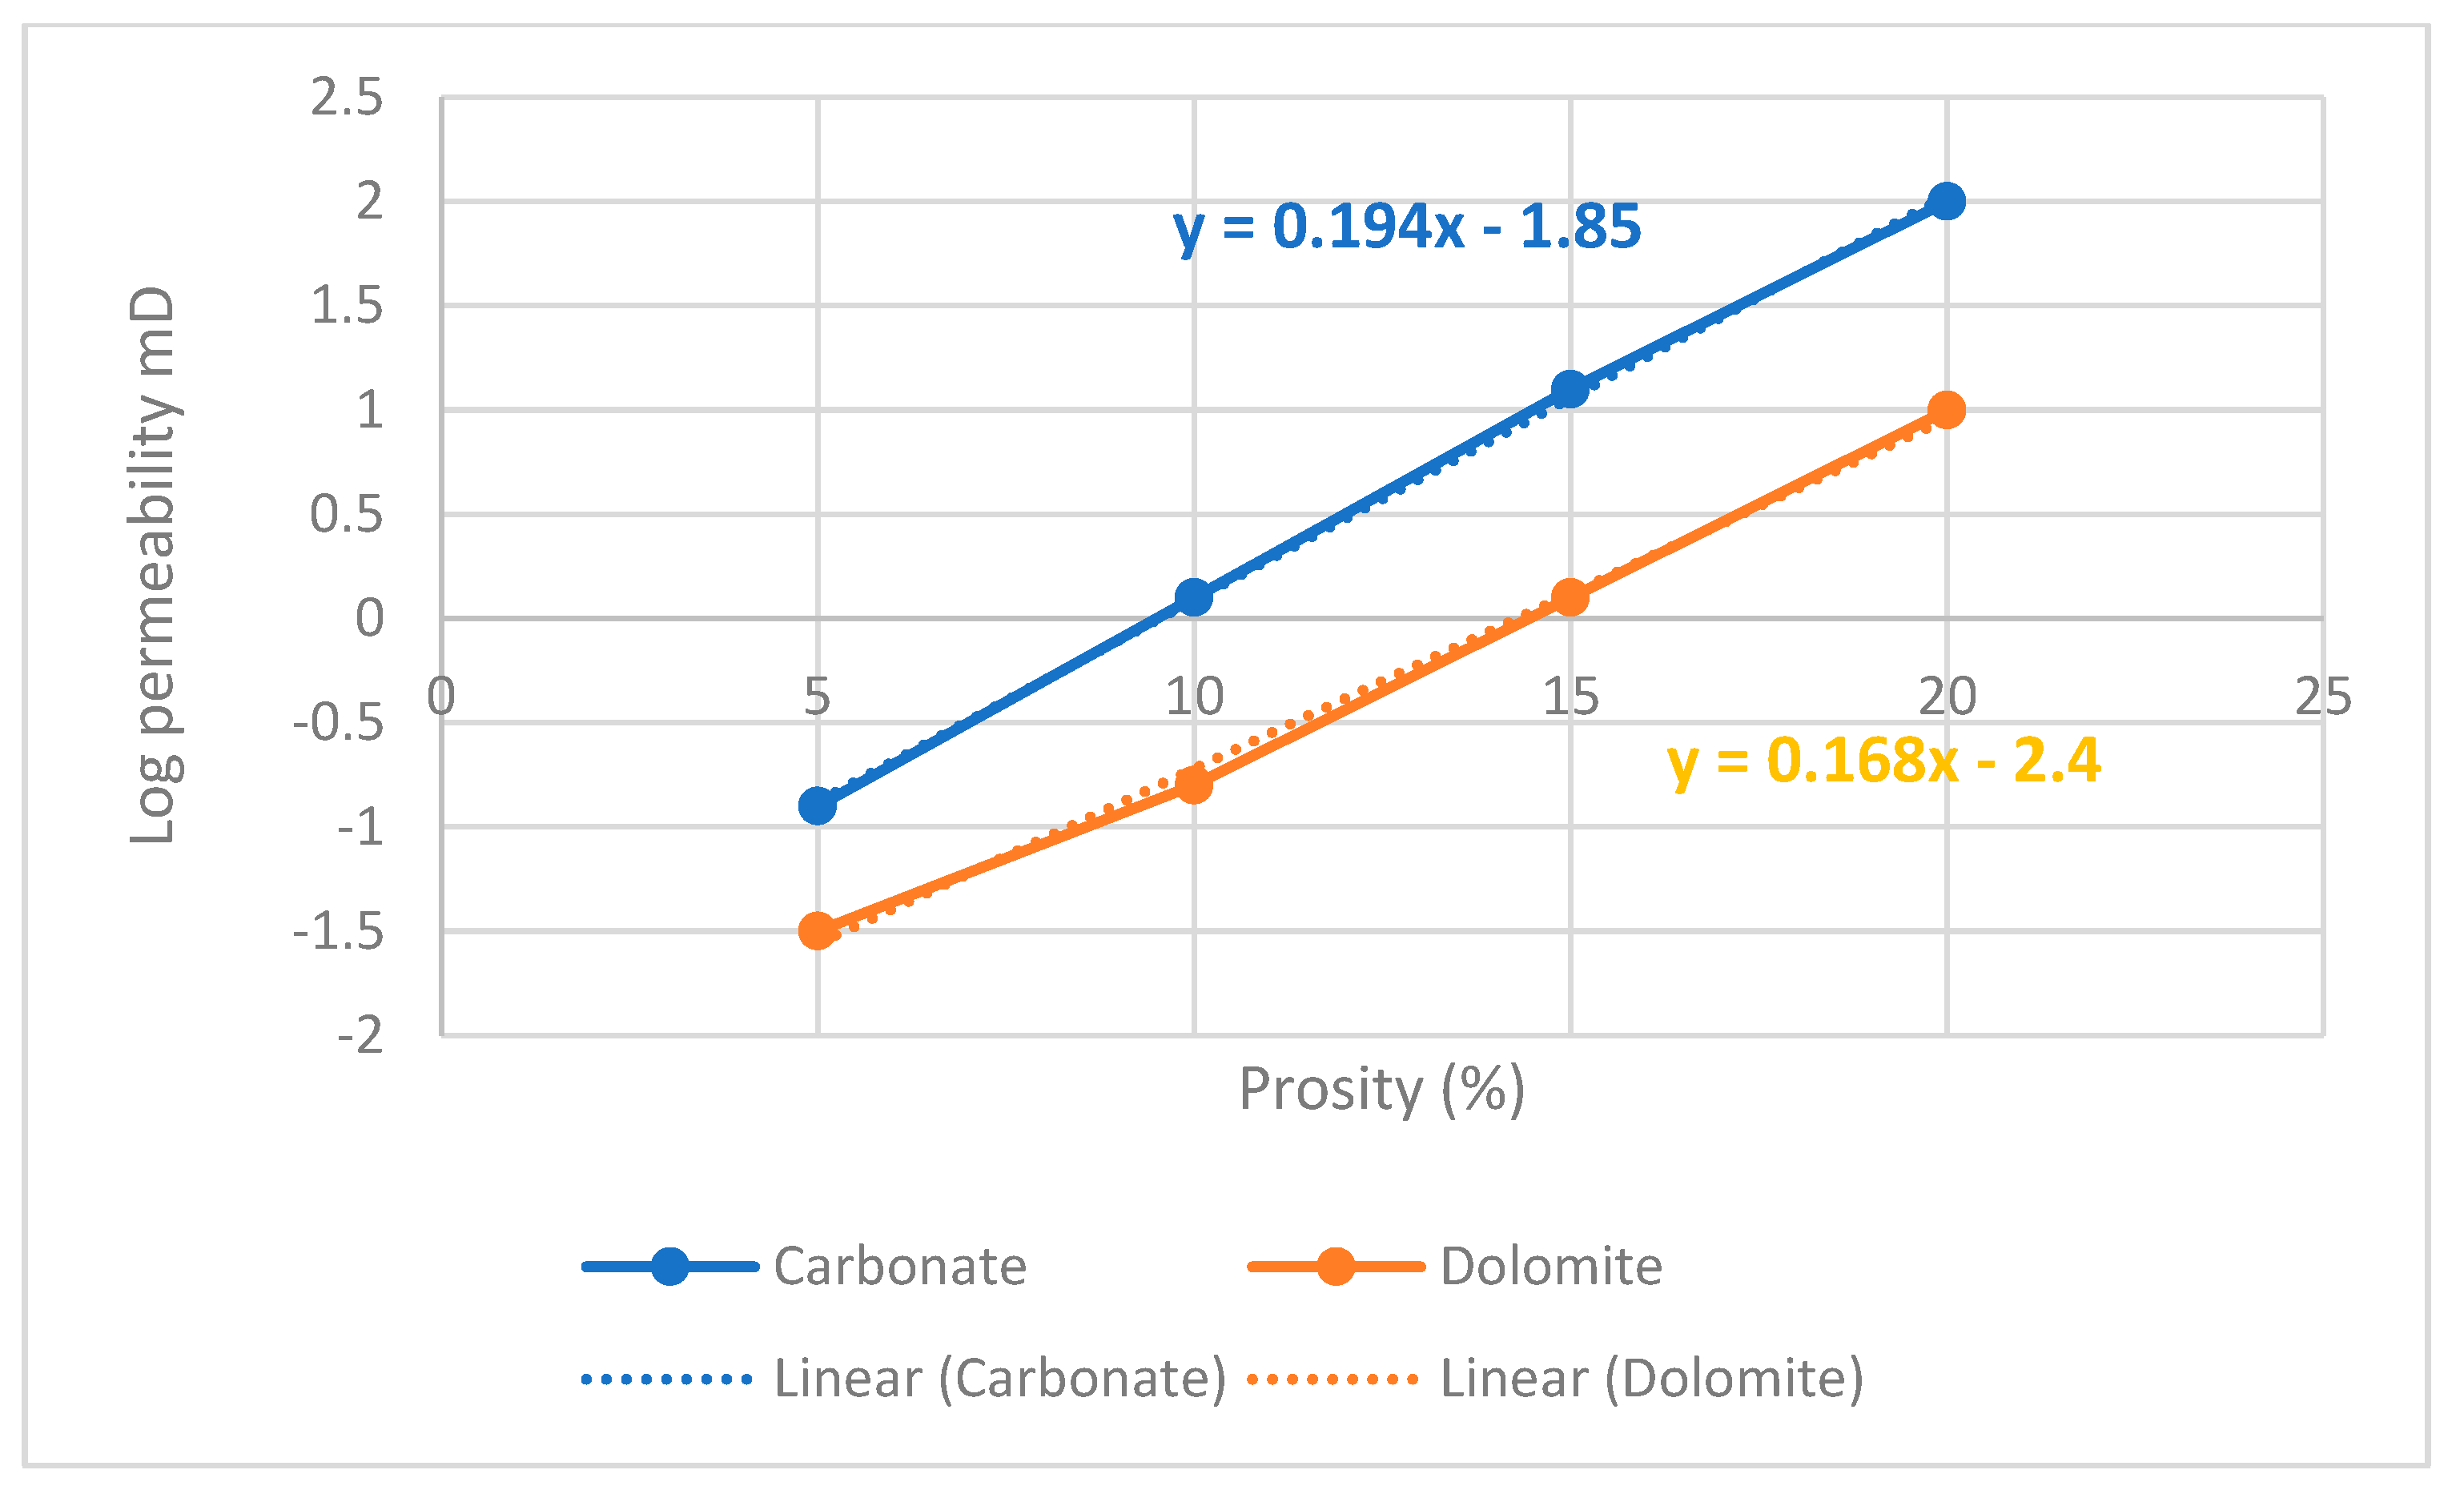
As previously mentioned, due to the lack of available permeability data, empirical correlation was used to incorporate permeability into the simulator for both carbonate and dolomite formations (Figure 6).
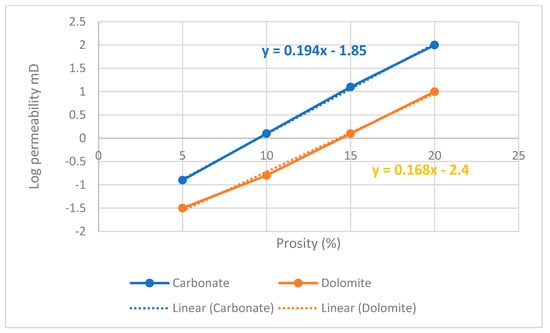
Figure 6.
Empirical correlation for permeability vs. porosity using the literature—blue for carbonate, red for Dolomite.
Based on this correlation, the average permeability for the upper part of the Surmeh formation was estimated to be approximately 0.1 mD. The Arab formation in the Iranian zone corresponds to the Surmeh formation. It is noteworthy that the Arab formation is fully saturated with water, commonly referred to as brine, which has a salinity level of 200,000 ppm. This high salinity is a feature of the formation’s water content.
During well logging in the Surmeh formation, recorded temperatures ranged from 75 to 100 °C. To validate these measurements, they were cross-checked with temperature survey data obtained from the Kangan-Upper Dalan reservoir, resulting in an estimated temperature in the Surmeh formation of approximately 80 °C. Figure 4 illustrates the potential use of the Surmeh formation as a storage reservoir. The positioning of the Hith formation as the caprock in this context is crucial to the study. The caprock acts as a barrier, preventing the migration and leakage of stored fluids, such as CO2, from the reservoir. This highlights the importance of the Hith formation in ensuring the integrity and containment of the Surmeh formation as a proper storage site.
3. Geomechanical Study
When CO2 is injected and stored in an underground geological structure, pore pressure buildup is inevitable. This change in pore pressure redistributes stress and induces a poroelastic response in both caprock and target formation. In some cases, this can lead to geomechanical hazards, such as leakage of the injected CO2, uplift of the surface, and induced seismic activity. These issues are significant environmental concerns during CCS projects. It is also important to consider the integrity of the well, as the injected CO2 could potentially leak through any well component intended to serve as the expected flow path. Uncontrolled release of the injected fluid can shorten well life and increase the risk of CO2 leaks. Therefore, establishing an optimal CCS design that takes into account geomechanical hazards is critical to ensure environmentally safe implementation of the design and to gain public acceptance.
A comprehensive geomechanical study has been conducted in the field using both 3D MEM (Mechanical Earth Modeling) calibrating with 1D MEM approaches, incorporating all available data. For 1D MEM construction, information such as formation tops, drilling and completion reports, location maps, graphic well logs, final geological reports, compressional and shear slowness data, open hole logs (including measurements such as gamma ray, density, neutron porosity, and resistivity), static formation pressure data from MDT/XPT (Modular Formation Dynamics Tester/Express Pressure Tool) tools, especially in the reservoir section, caliper logs, and core data. Afterward, the vertical stress was calculated based on the weight of overburden layers. In addition, a poroelastic horizontal strain model was used to estimate horizontal stresses’ magnitudes in an anisotropic medium. In addition, the maximum horizontal stress direction was detected using full waveform acoustic data and a formation micro imager (FMI) log through the wellbore path. After finding the properties by using a proper failure criterion, mud weight boundaries can be determined, in which a safe mud weight window would be between breakout and loss limits [13,17,18,19,20,21].
A 3D Seismic Cube is utilized to obtain volumetric data of subsurface properties, unveiling structural and stratigraphic details about the Earth’s subsurface. The pre-stack inversion technique is applied to estimate properties like acoustic impedance (AI) and density from seismic data, with calibration and validation using core data and conventional well logs from two wells. Vertical Seismic Profile (VSP) data validate the density and AI values near the wells. Subsequently, constructed 1D MEMs for each well serve as references for 3D MEM construction. Integration of 3D seismic cube data, pre-stack inversion results, and 1D MEMs results in a preliminary 3D MEM, refined iteratively to match observed seismic data. The final 3D MEM visually represents the subsurface, aiding in structural feature identification and drilling target assessment, while considering uncertainties to gauge model reliability [13,17,18,19,20,21].
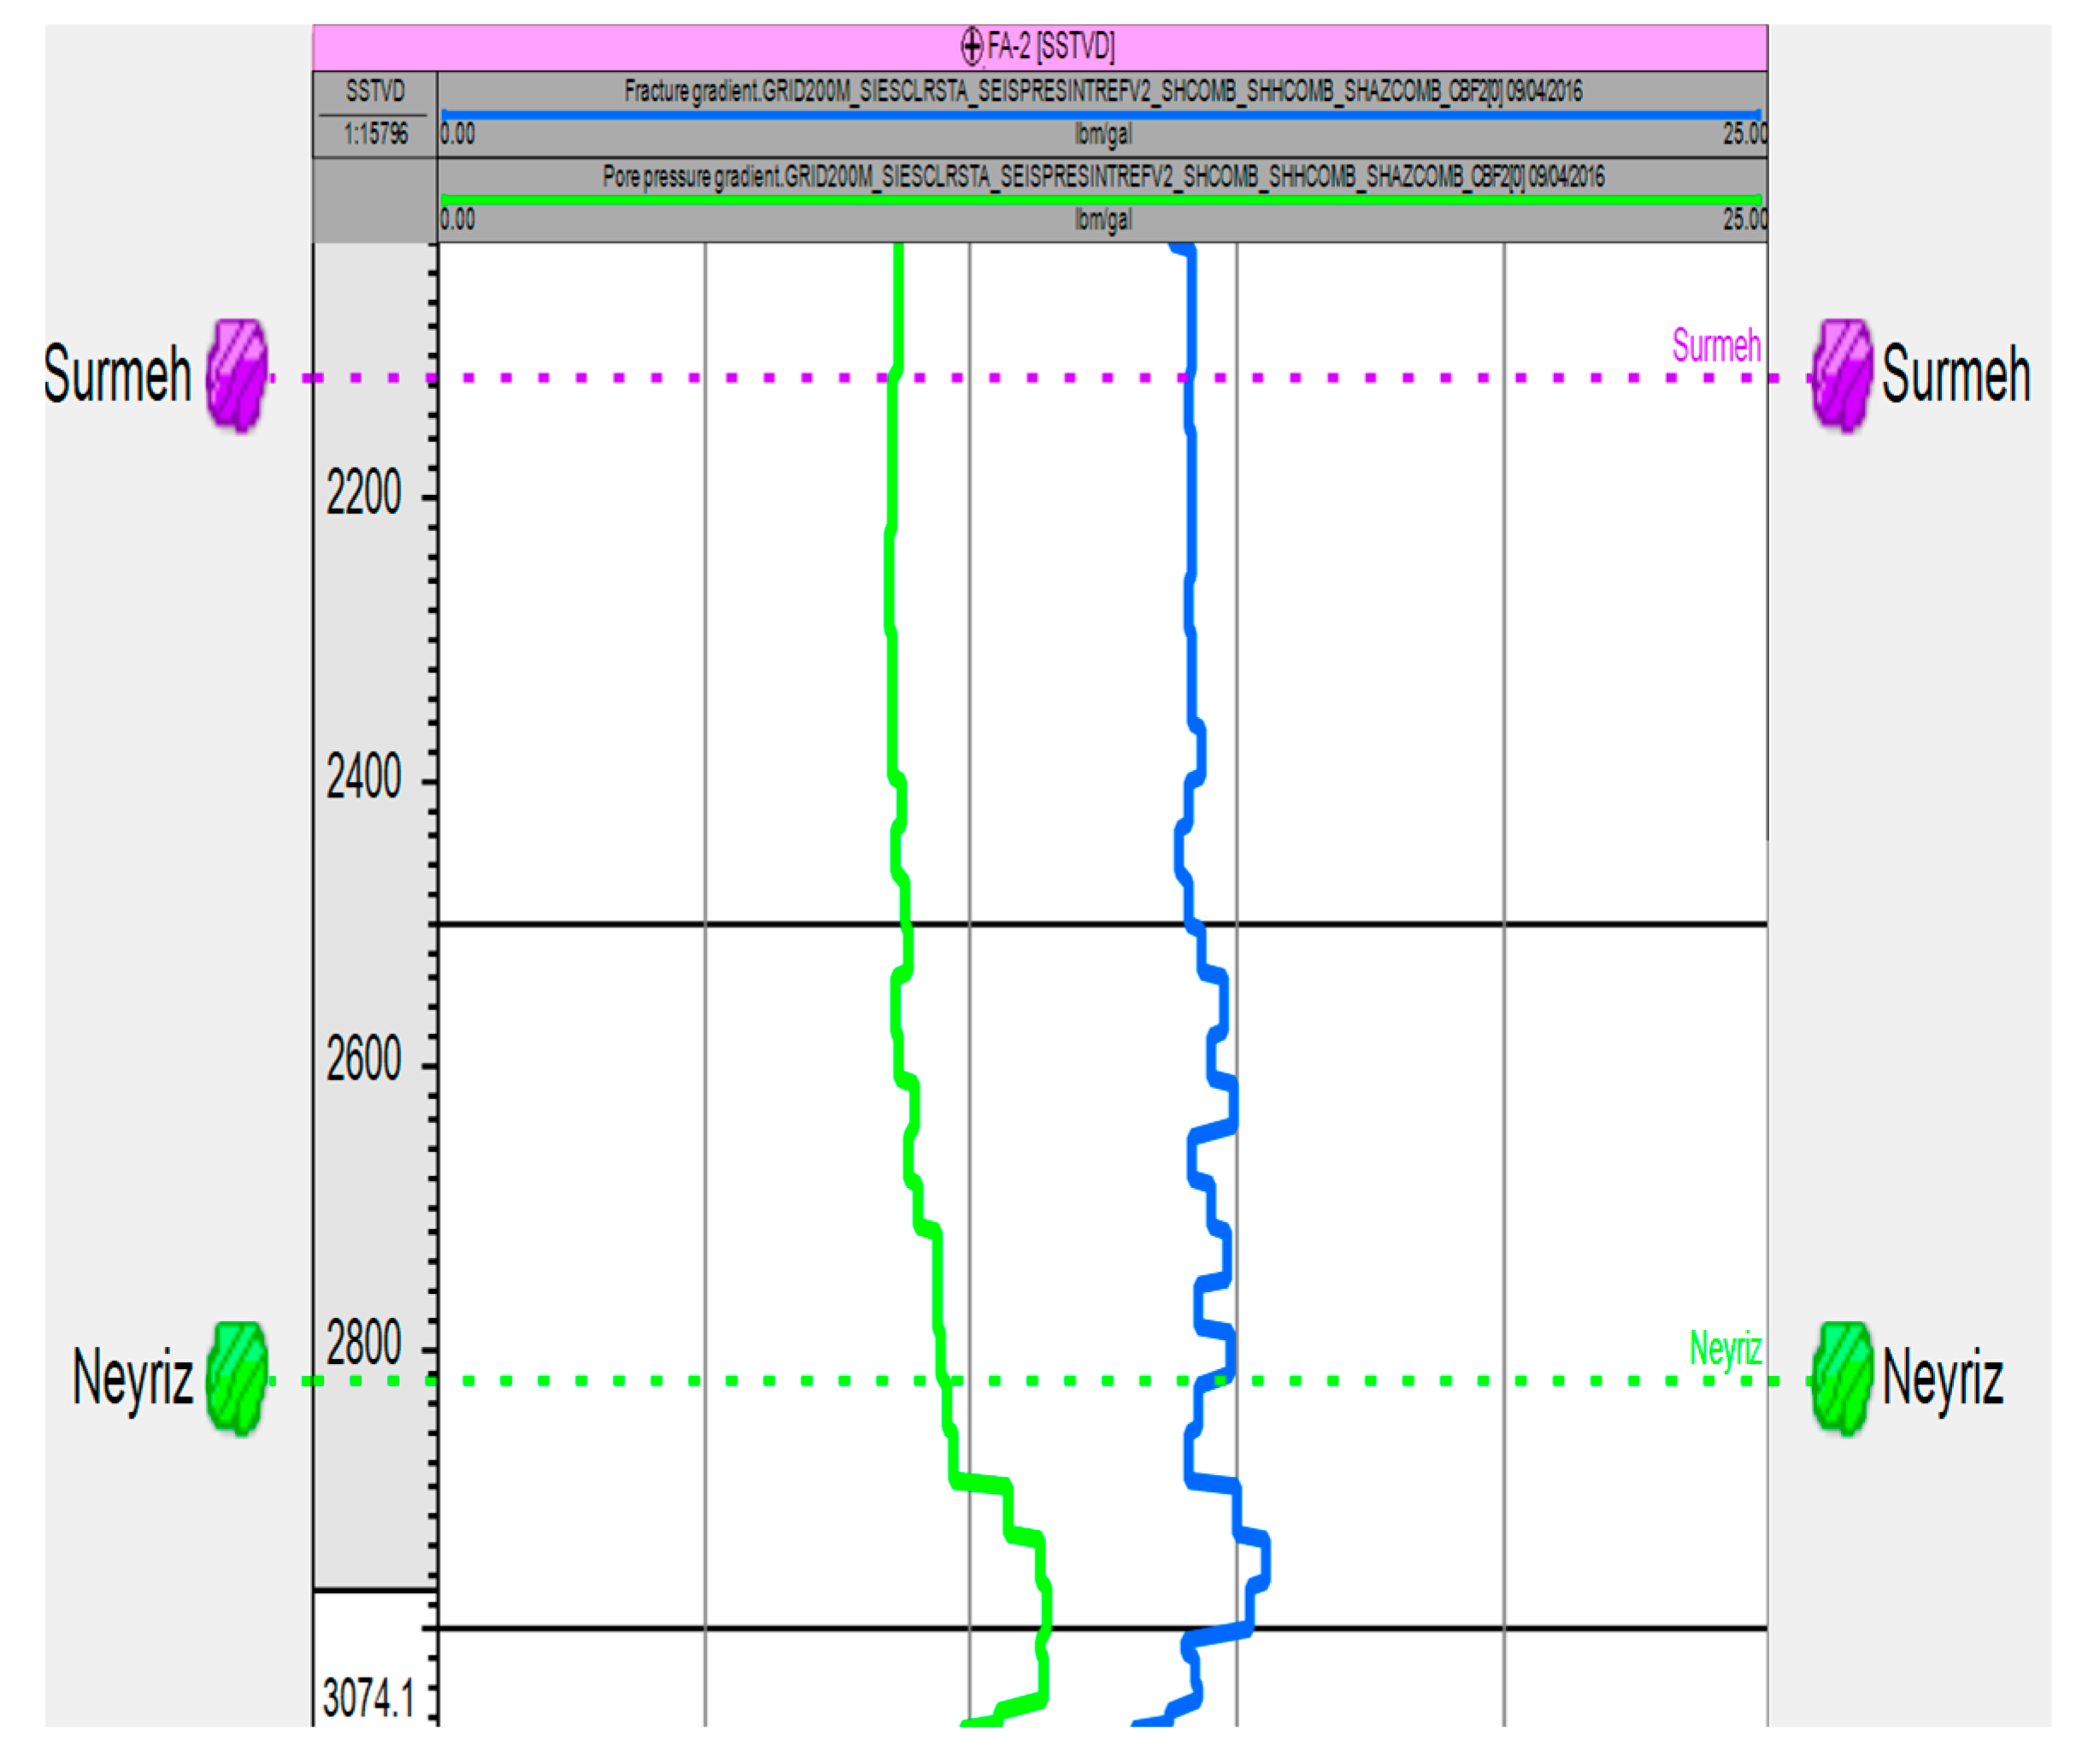
The geomechanical model was employed to estimate pore and fracture pressures in the Surmeh formation (Figure 7). Drilling data were used to estimate the pore pressure specifically in this formation. Drilling data indicate that the lower portion of the Surmeh formation exhibits higher permeability, as evidenced by the mud loss data. However, the porosity in this area is very low, suggesting a higher degree of fracturing. Using the Geomechanical Earth Modeling (GEM) approach, the estimated pore pressure in the Surmeh formation is 3800 psi, while the estimated fracture pressure is 6100 psi.
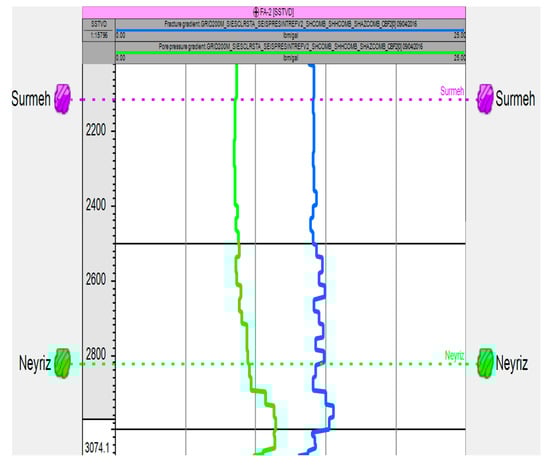
Figure 7.
Estimated pore and fracture pressures in FA-02.
Seismic thickness mapping revealed that the integrity of the Hith formation caprock varies at the desired location for injection well drilling (Figure 8). The thickness ranges from approximately 60 m to almost 110 m. This information is essential in assessing the effectiveness of the caprock as a barrier for containing the injected fluids within the Surmeh formation. Variations in caprock thickness can affect the overall containment and long-term stability of the CO2 storage operation.
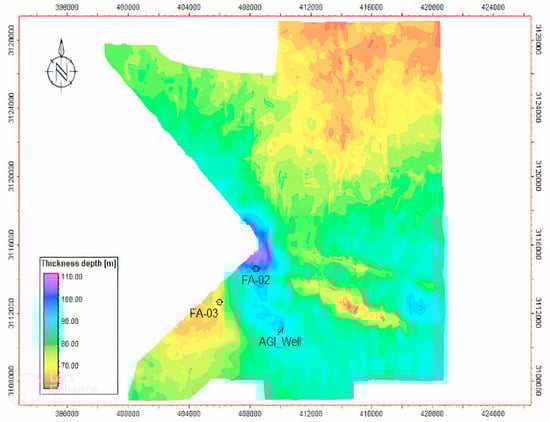
Figure 8.
Thickness map of the Hith formation (Surmeh Cap rock).
Table 1 shows the properties that predominantly constitute the static model.

Table 1.
Static properties of the Surmeh formation in the upper and lower parts.
4. Dynamic Modelling
The plan is to transfer a sour gas that has been extracted from one field (source field) and injected into the Surmeh Formation. As mentioned above, acid gas consists mainly of H2S and CO2. According to the PVT (Standard Pressure Volume Temperature) data, the H2S concentration in the source field is 39,000 ppm, while the CO2 concentration is 68,000 ppm (see Table 2).
Table 2.
Injected Fluid composition.
Considering the extraction of all H2S, CO2, and a small portion of methane during the acid gas processing, approximately 12% of the injected gas is acid gas. Based on the MDP (Master Development Plan) of the source field, the gas estimated in place is 22 TCF of sour gas. Consequently, considering a recovery factor of 75% for dry gas reservoirs, roughly 2 TCF of acid gas will be injected into the Surmeh formation.
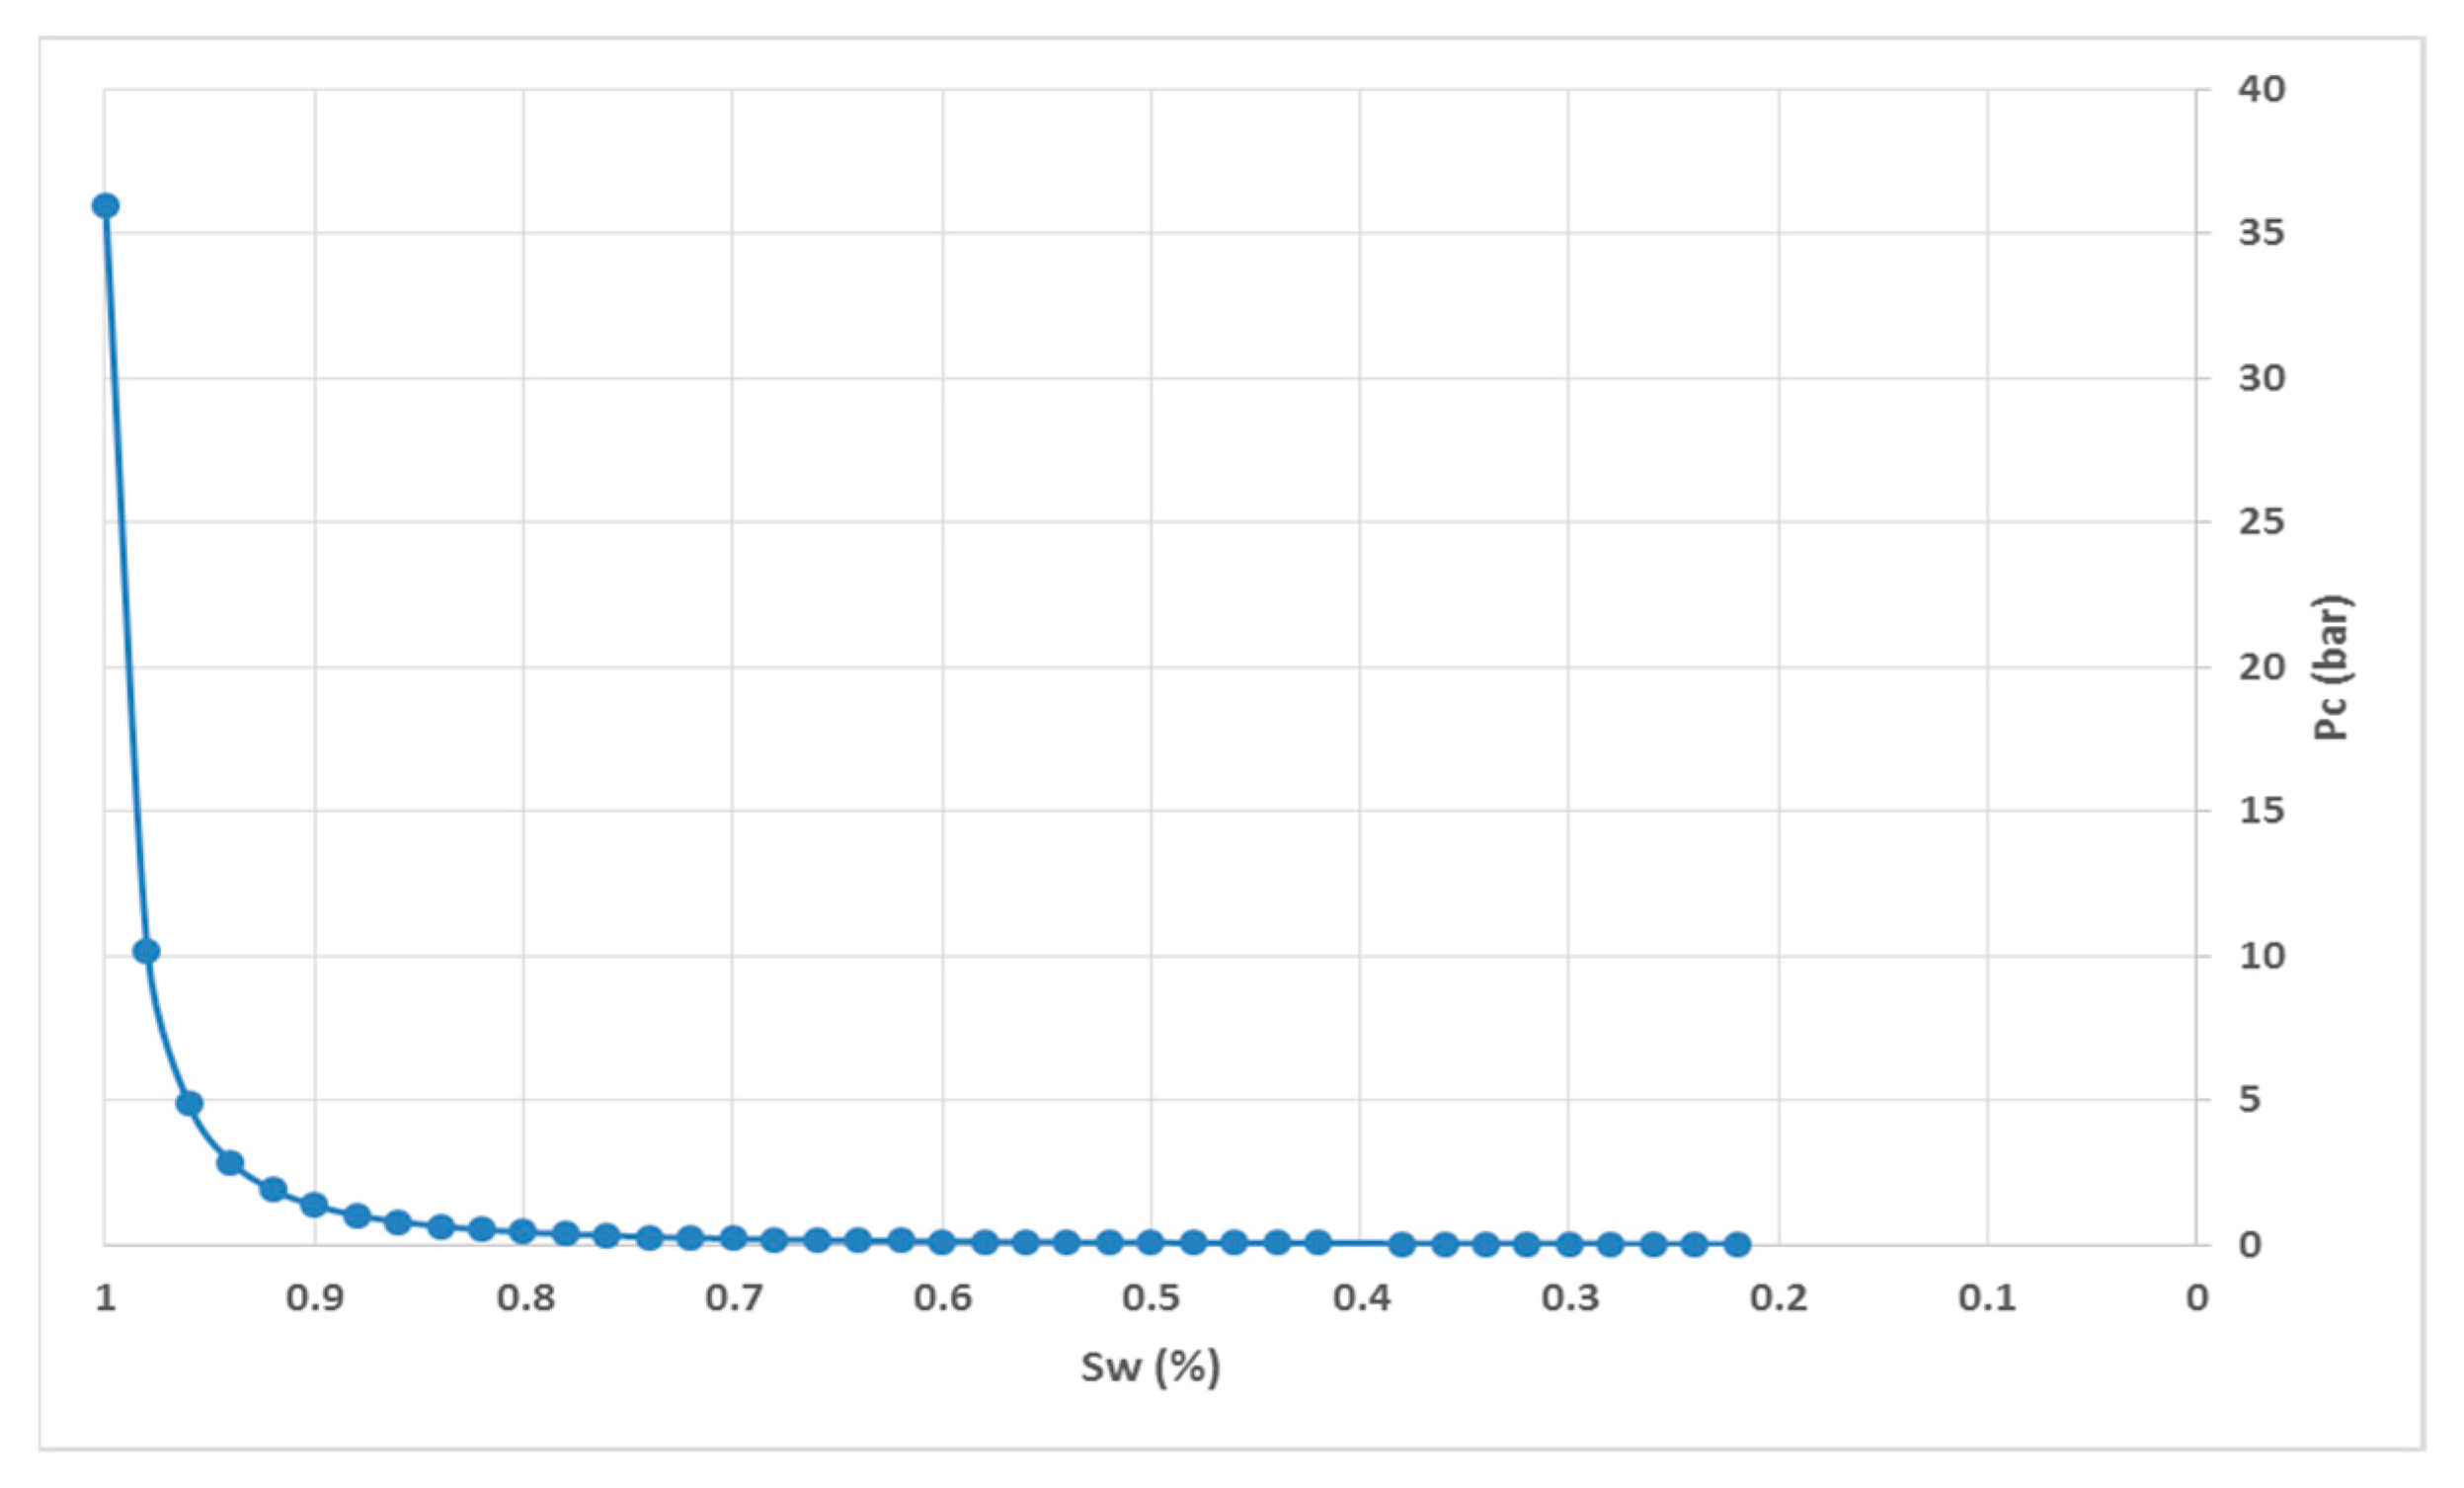
Ref. [22] expresses the capillary pressure as a function of saturation (S) using the following equation [1]:
where SW is water saturation, is Irreducible Water Saturation, Pe is the minimum pressure required for the gas to enter the pores of the rock, and λ is a fit parameter known as the pore size distribution index [23]. For this formation, λ was 0.55.
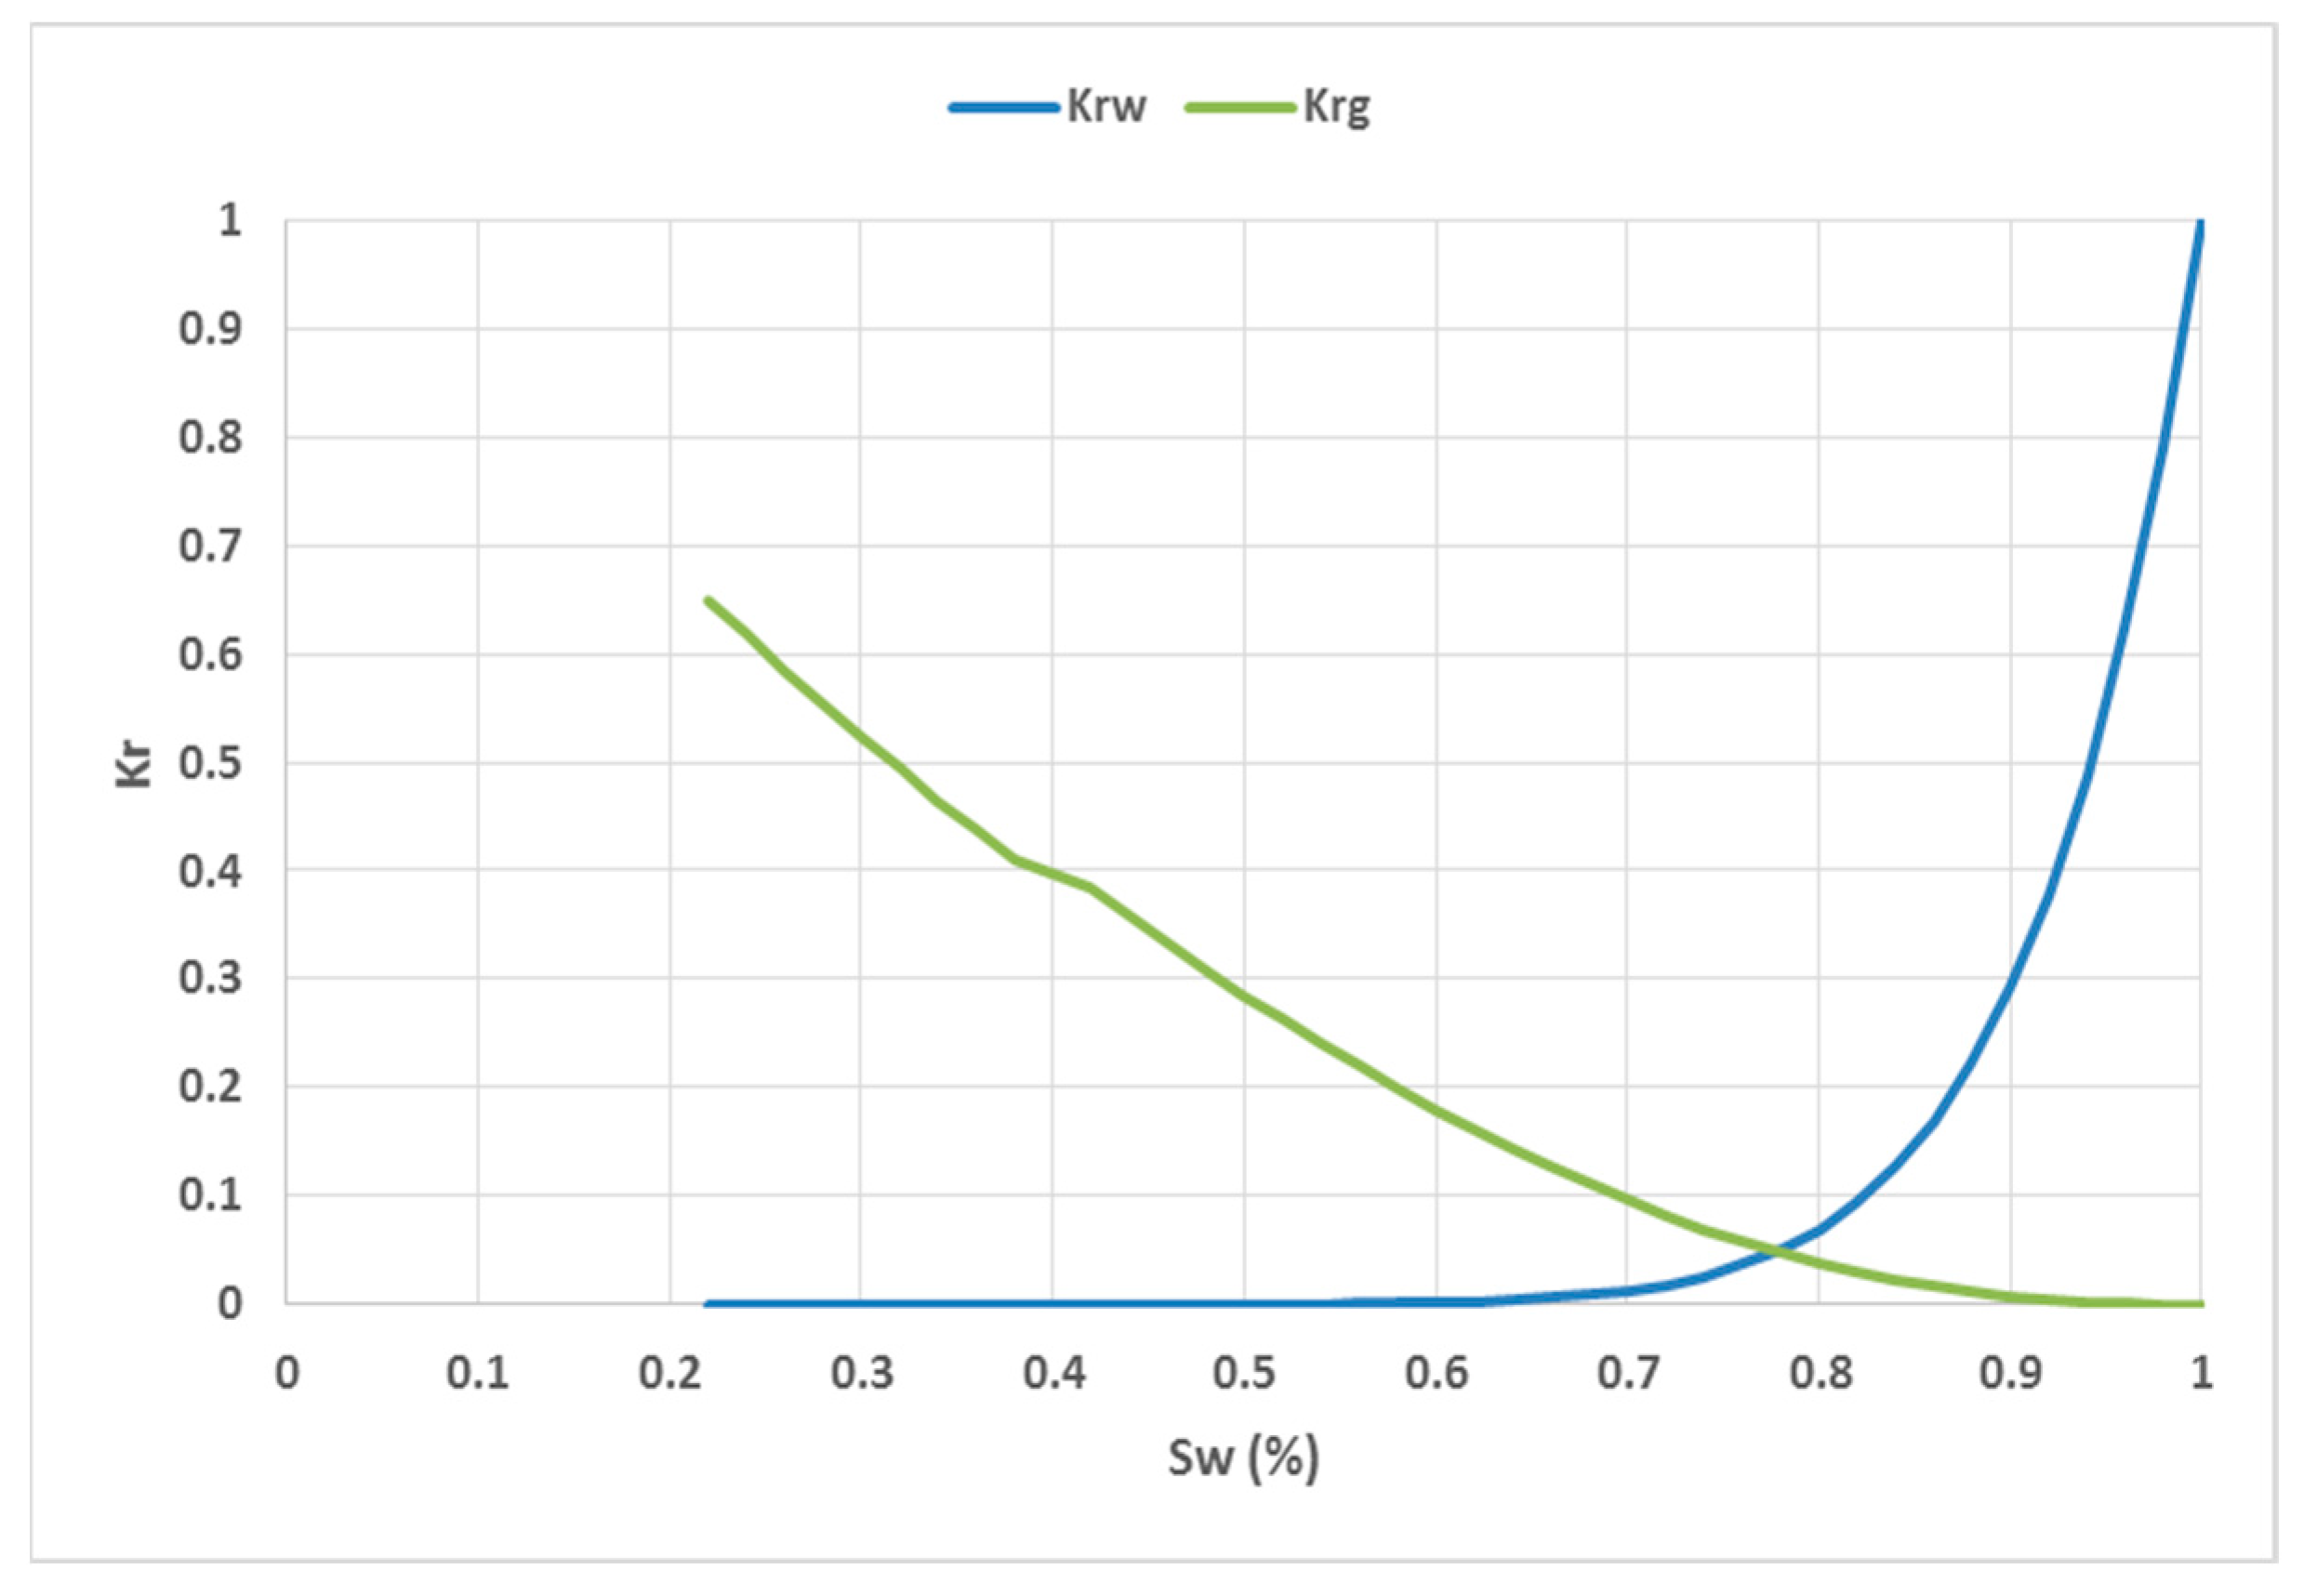
The relative permeability curves employed in this study were based on the relationships of [24], specifically using the Equations (2)–(4) proposed by [25]:
The variables Nw and Ngas, (range from 1 to 6) are used as fitting parameters, known as the Corey exponents for water and gas, respectively [26]. The following values are used, Nw = 5 and Ngas = 4 (typical value used in modeling in the Persian Gulf). Table 3 shows a summary of the saturation function data.
Table 3.
Saturation function data for acid gas simulation.
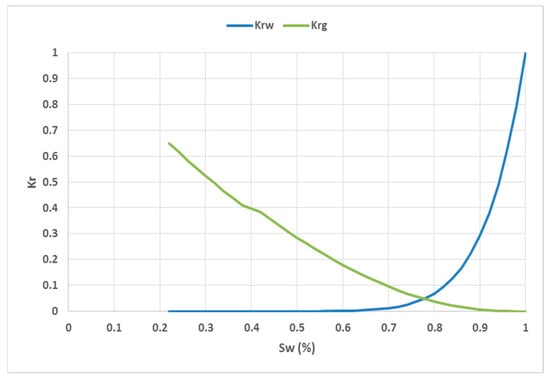
Figure 9.
Relative permeability curves used for water and gas.

Figure 10.
Capillary pressure of water and gas.
In the context of gas injection scenarios for storage purposes, a comprehensive understanding of the four identified trapping mechanisms is crucial; these are: structural, capillary, solubility, and mineralization trapping. These mechanisms are responsible for the prolonged storage of injected gas within geological formations. The relative contribution of each trapping mechanism during the storage period may vary. In the short term, capillary trapping serves as the primary mechanism for gas retention in porous media. This phenomenon can be attributed to the hysteresis of relative permeability and capillary pressure. Capillary trapping plays a pivotal role in the initial stages of CO2 storage, effectively containing a significant portion of the gas plume within the formation. Furthermore, capillary pinning is expected to occur because of contrasting constitutive relations among different rock types, such as variations in capillary pressure (Pc), relative permeability (Kr), and irreducible water saturation (Swi), which are commonly observed in natural rock formations. Consequently, capillary trapping exerts a considerable influence on the spatial distribution of gas plumes within the reservoirs [27].
The capillary trapping mechanism can be clarified as follows: once the gas is injected into a saline aquifer, the significant density and viscosity disparities between the gas and water phases cause the gas plume to ascend towards the highest accessible formation top until it encounters an impermeable cap rock layer. In this phase, a drainage process takes place, during which the non-wet gaseous phase displaces the wet phase, which in this case is saline water. Upon completion of the injection, the saline water reabsorbs into the formation, displacing the gas plume in a process like imbibition. During this process, the continuous gas plume fragments, forming bubbles which subsequently become trapped within the formation [28].
To simulate the trapping mechanism from a conceptual perspective, a simple structure with dimensions of 100 × 100 × 10 m is used. To replicate this phenomenon in a simulation, two methods are employed: one assumes homogeneous rock properties with a single rock type, employing single relative permeability and capillary pressure curves without incorporating a hysteresis process; the other considers heterogeneous rock properties with two different rock types, defining the single relative permeability and capillary pressure curves, and hypothesizing a hysteresis process for both curves.
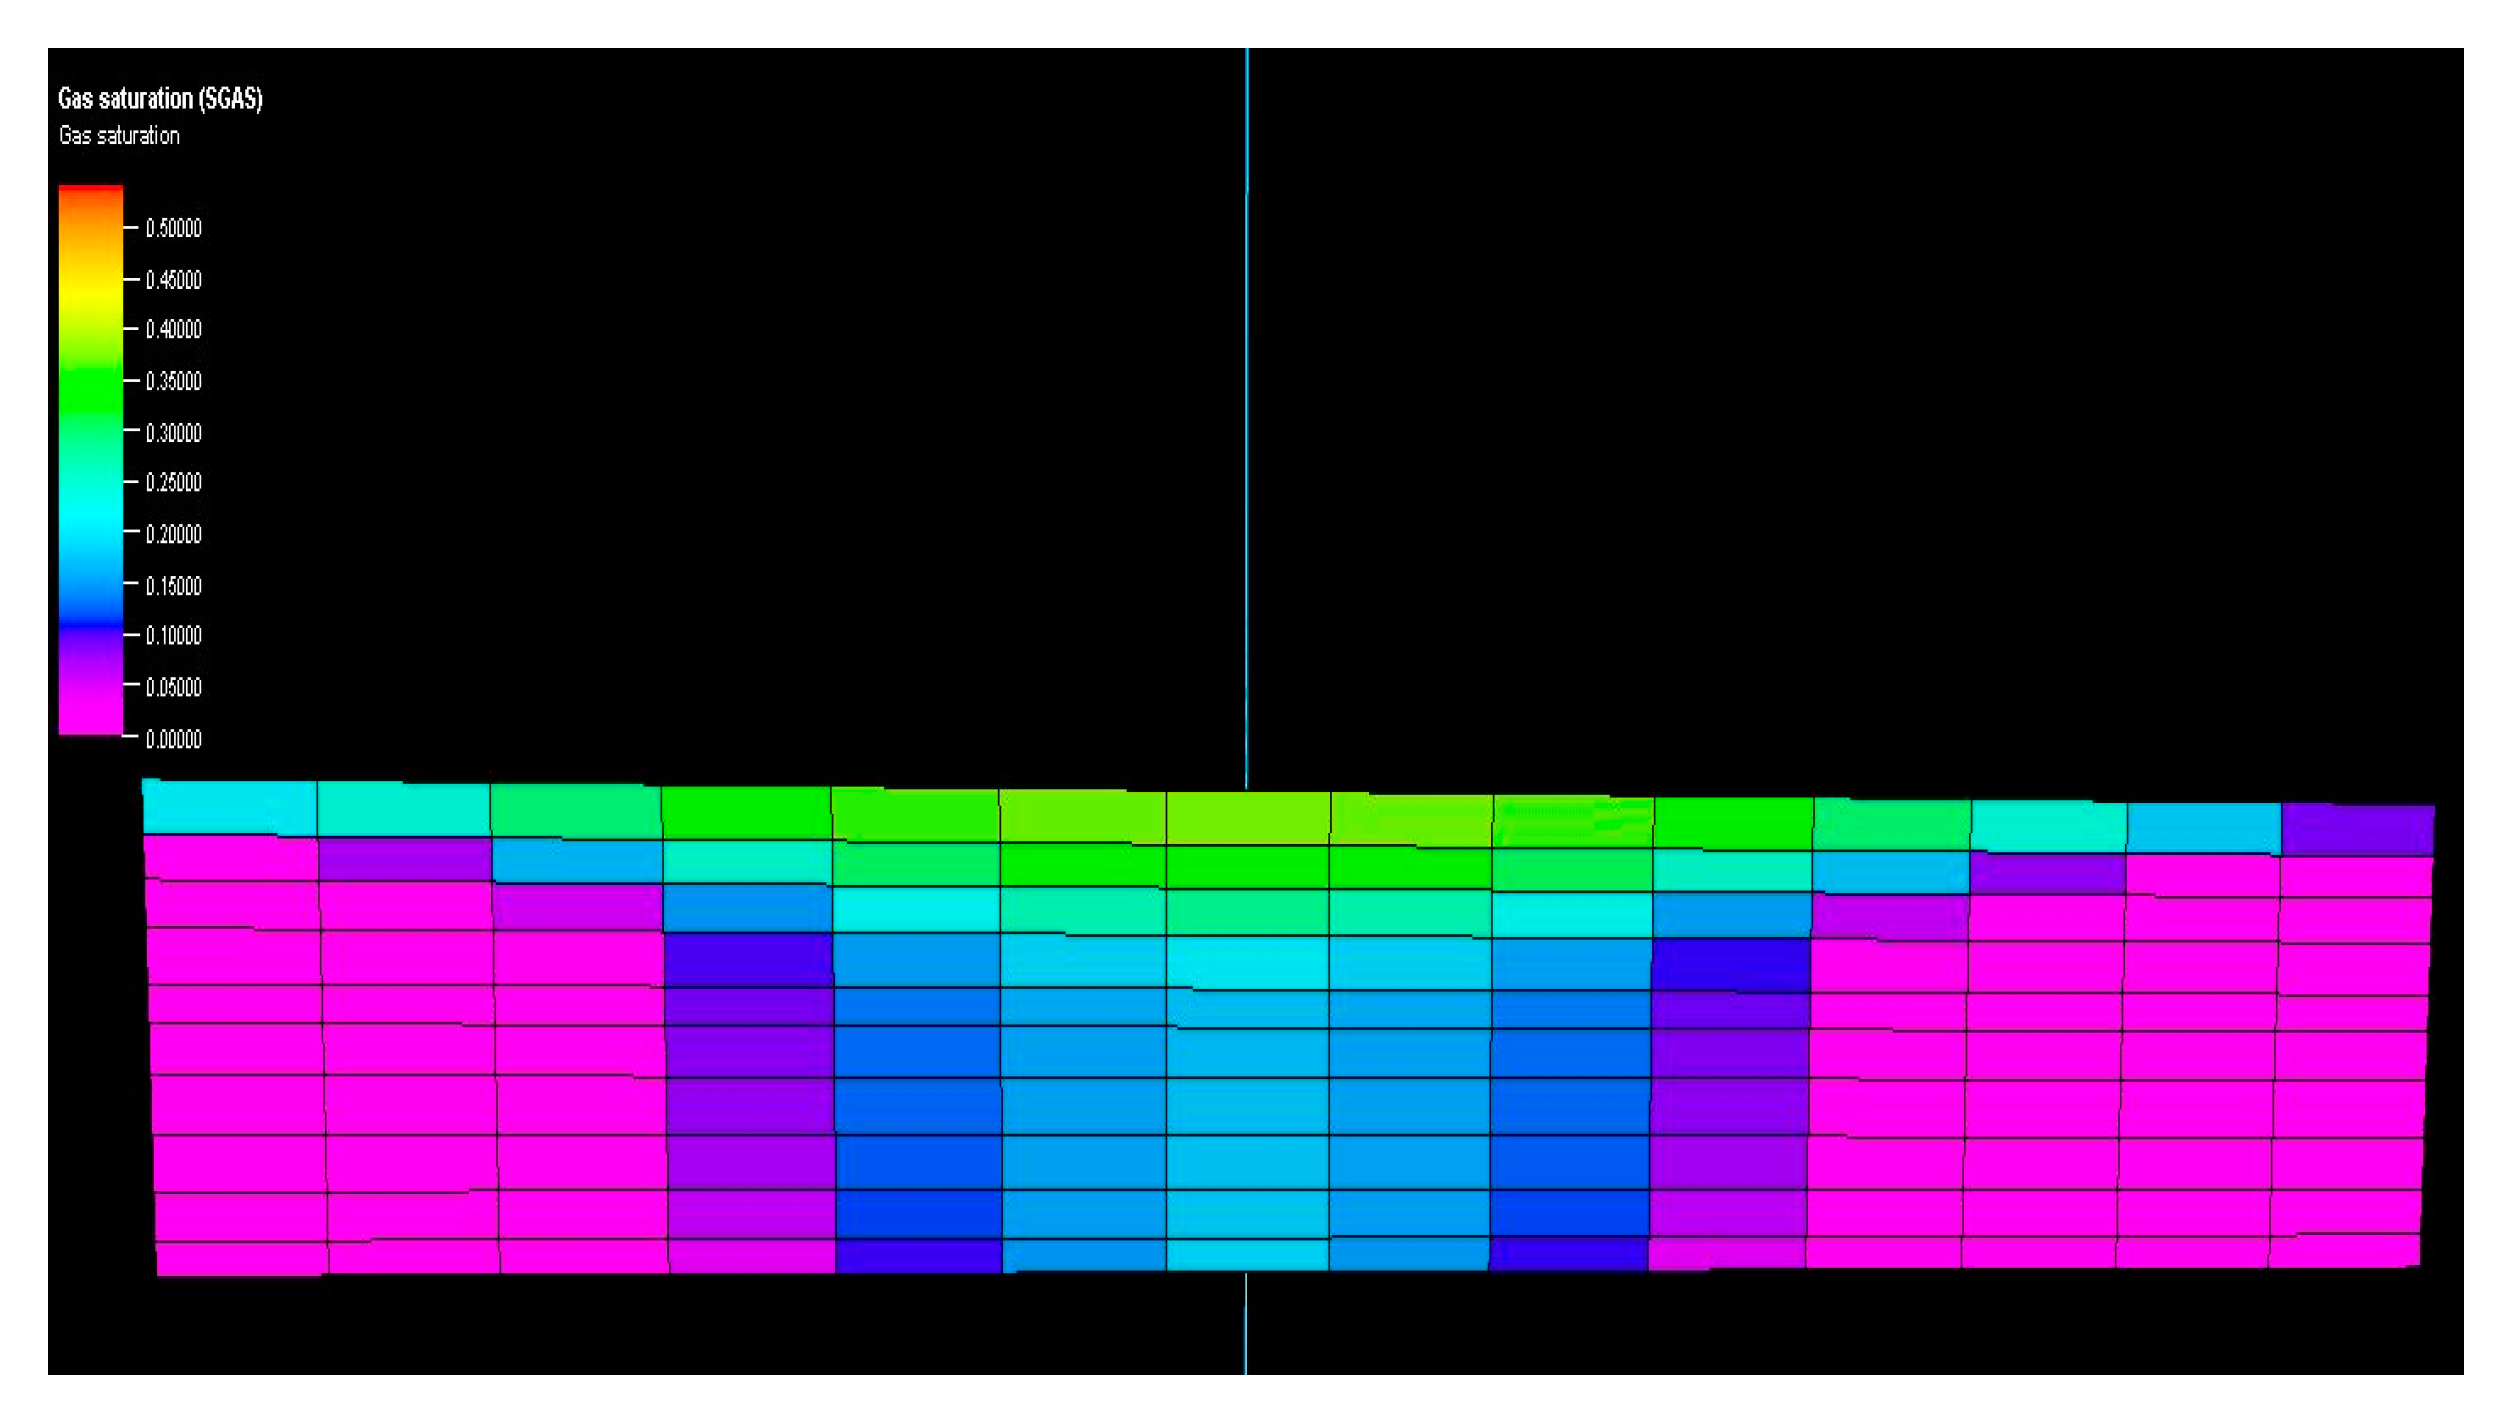
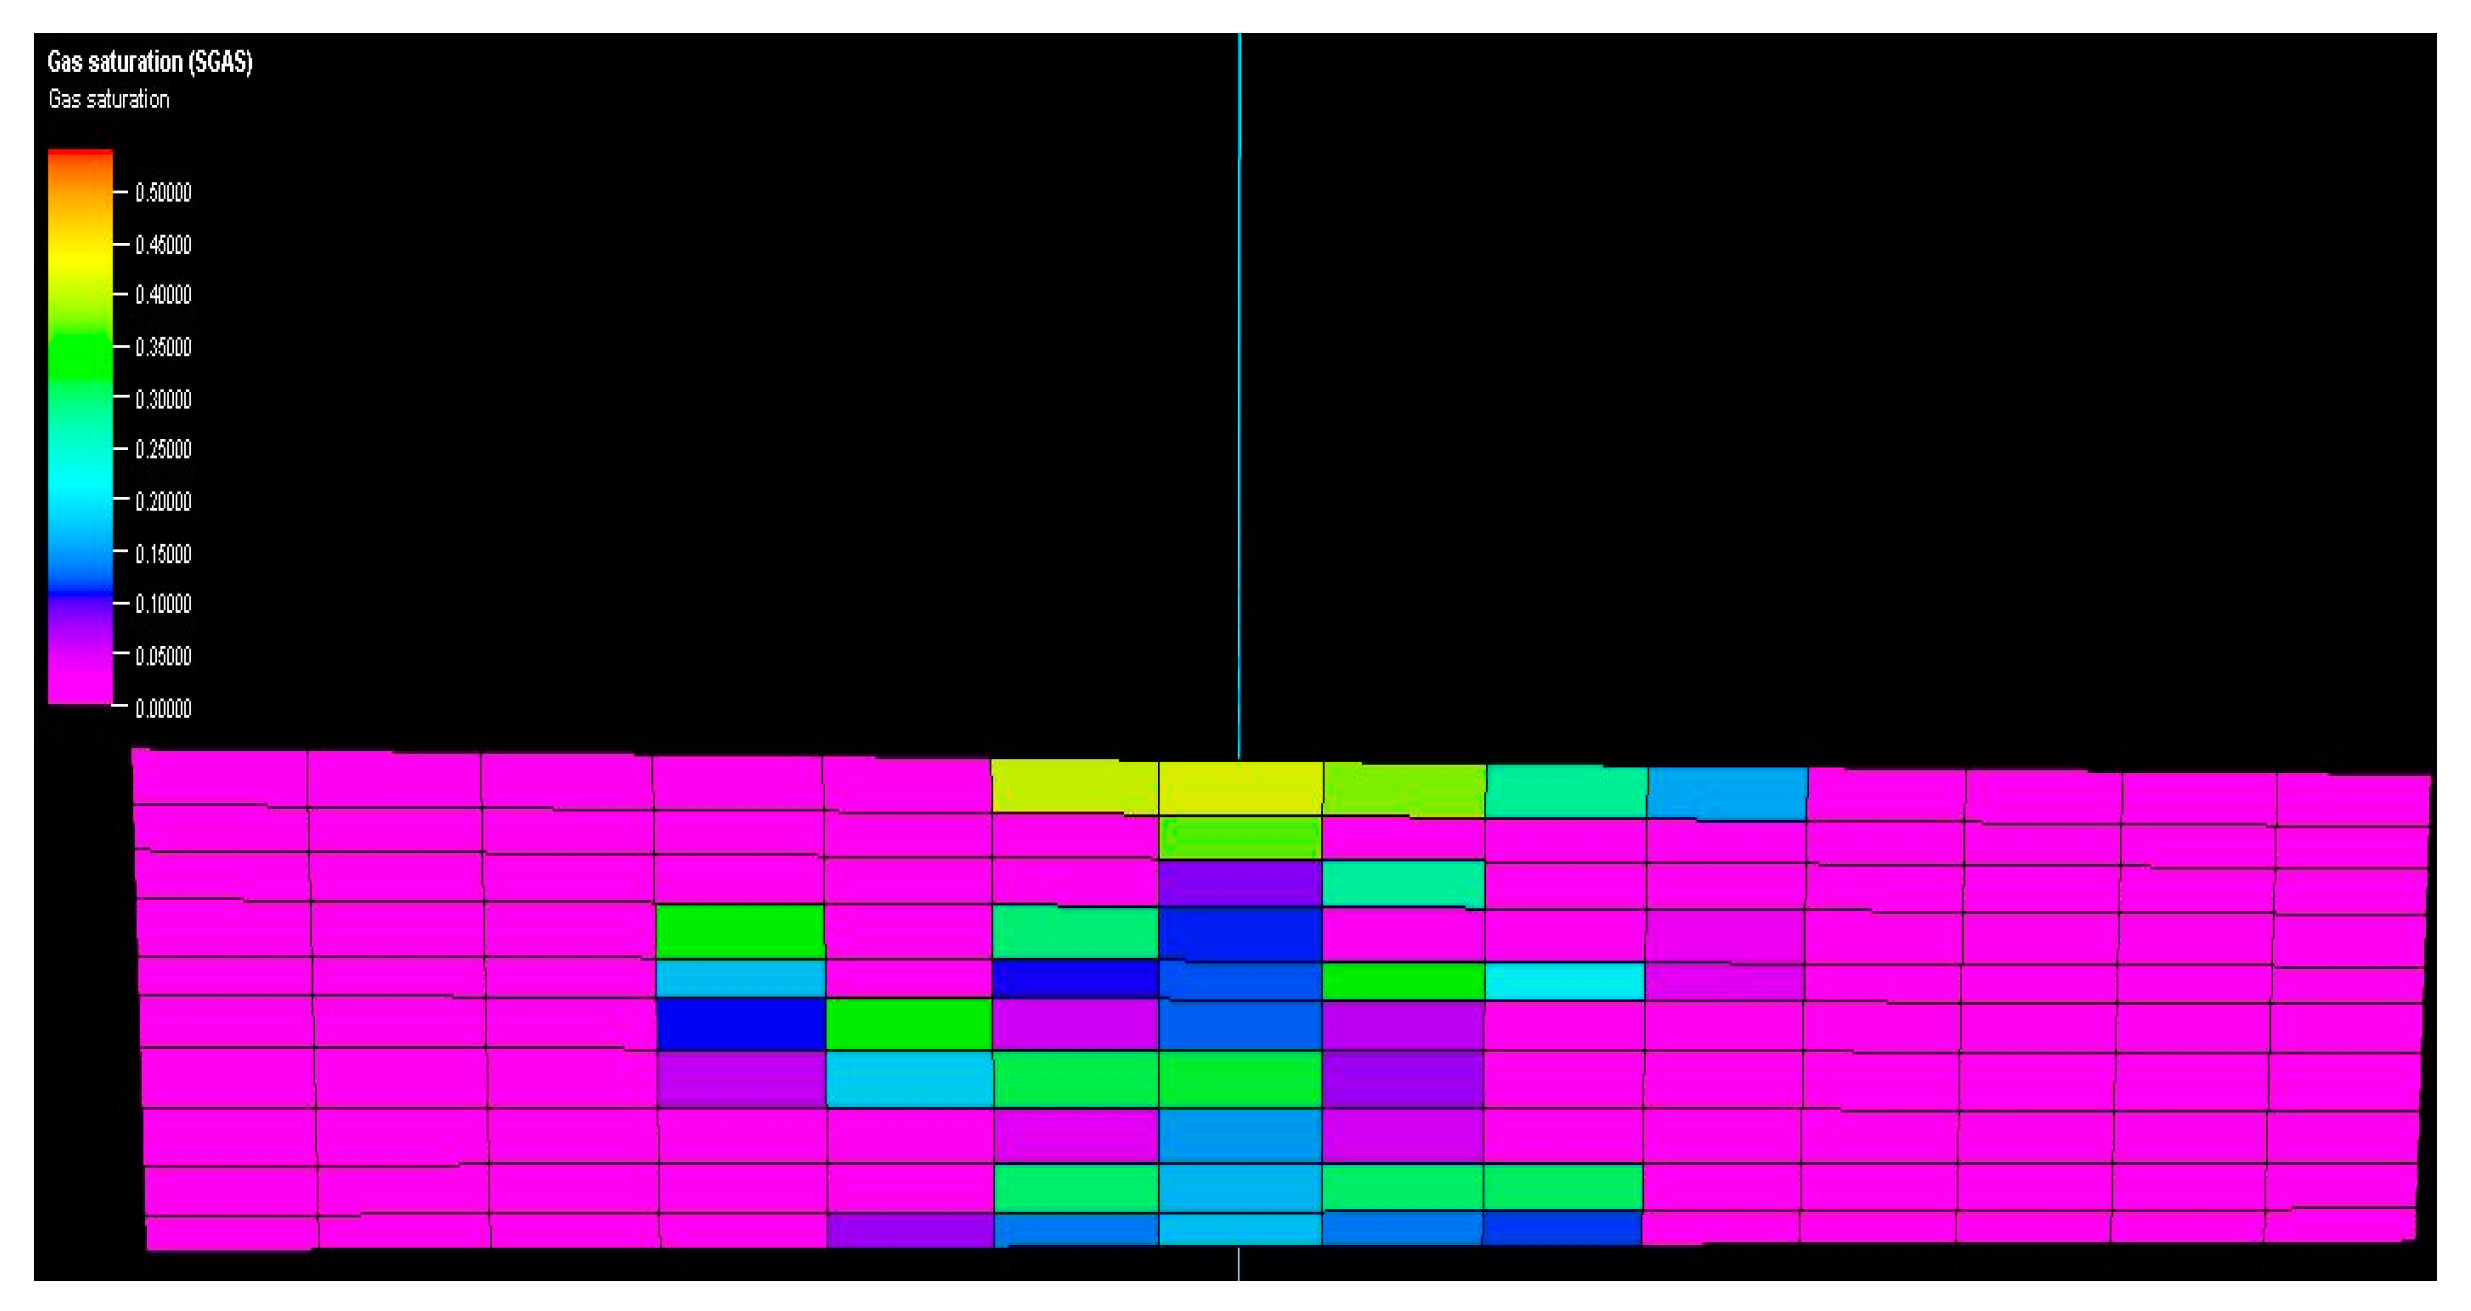
Figure 11 and Figure 12 show vertical cross-sections of gas saturation for the homogeneous and heterogeneous cases after the injection is stopped. Once injected, the CO2 disperses both horizontally and vertically. The buoyancy force drives the upward movement of the gas plume. The relative strengths of the viscous and gravitational forces determine the shape of the plume uniformly. In a homogeneous reservoir, the gas plume rapidly rises to the top of the reservoir and then expands laterally at a slower rate.
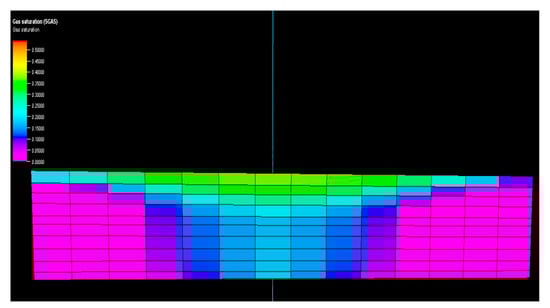
Figure 11.
Vertical cross-section of reservoirs showing gas saturation in a homogenous model.

Figure 12.
Vertical cross-section of reservoirs showing gas saturation in a heterogenous model.
On the other hand, under heterogeneous conditions, the gas plume exhibits distinct characteristics. It becomes twice as wide as in the homogeneous case, and only a portion of the gas manages to reach the top of the reservoir. Furthermore, the distribution of gas saturation within the reservoir becomes non-uniform. These results highlight the significant influence of capillary curves and hysteresis processes associated with different rock types, which fundamentally dictate trapping mechanisms and consequently shape and govern gas plume dynamics.
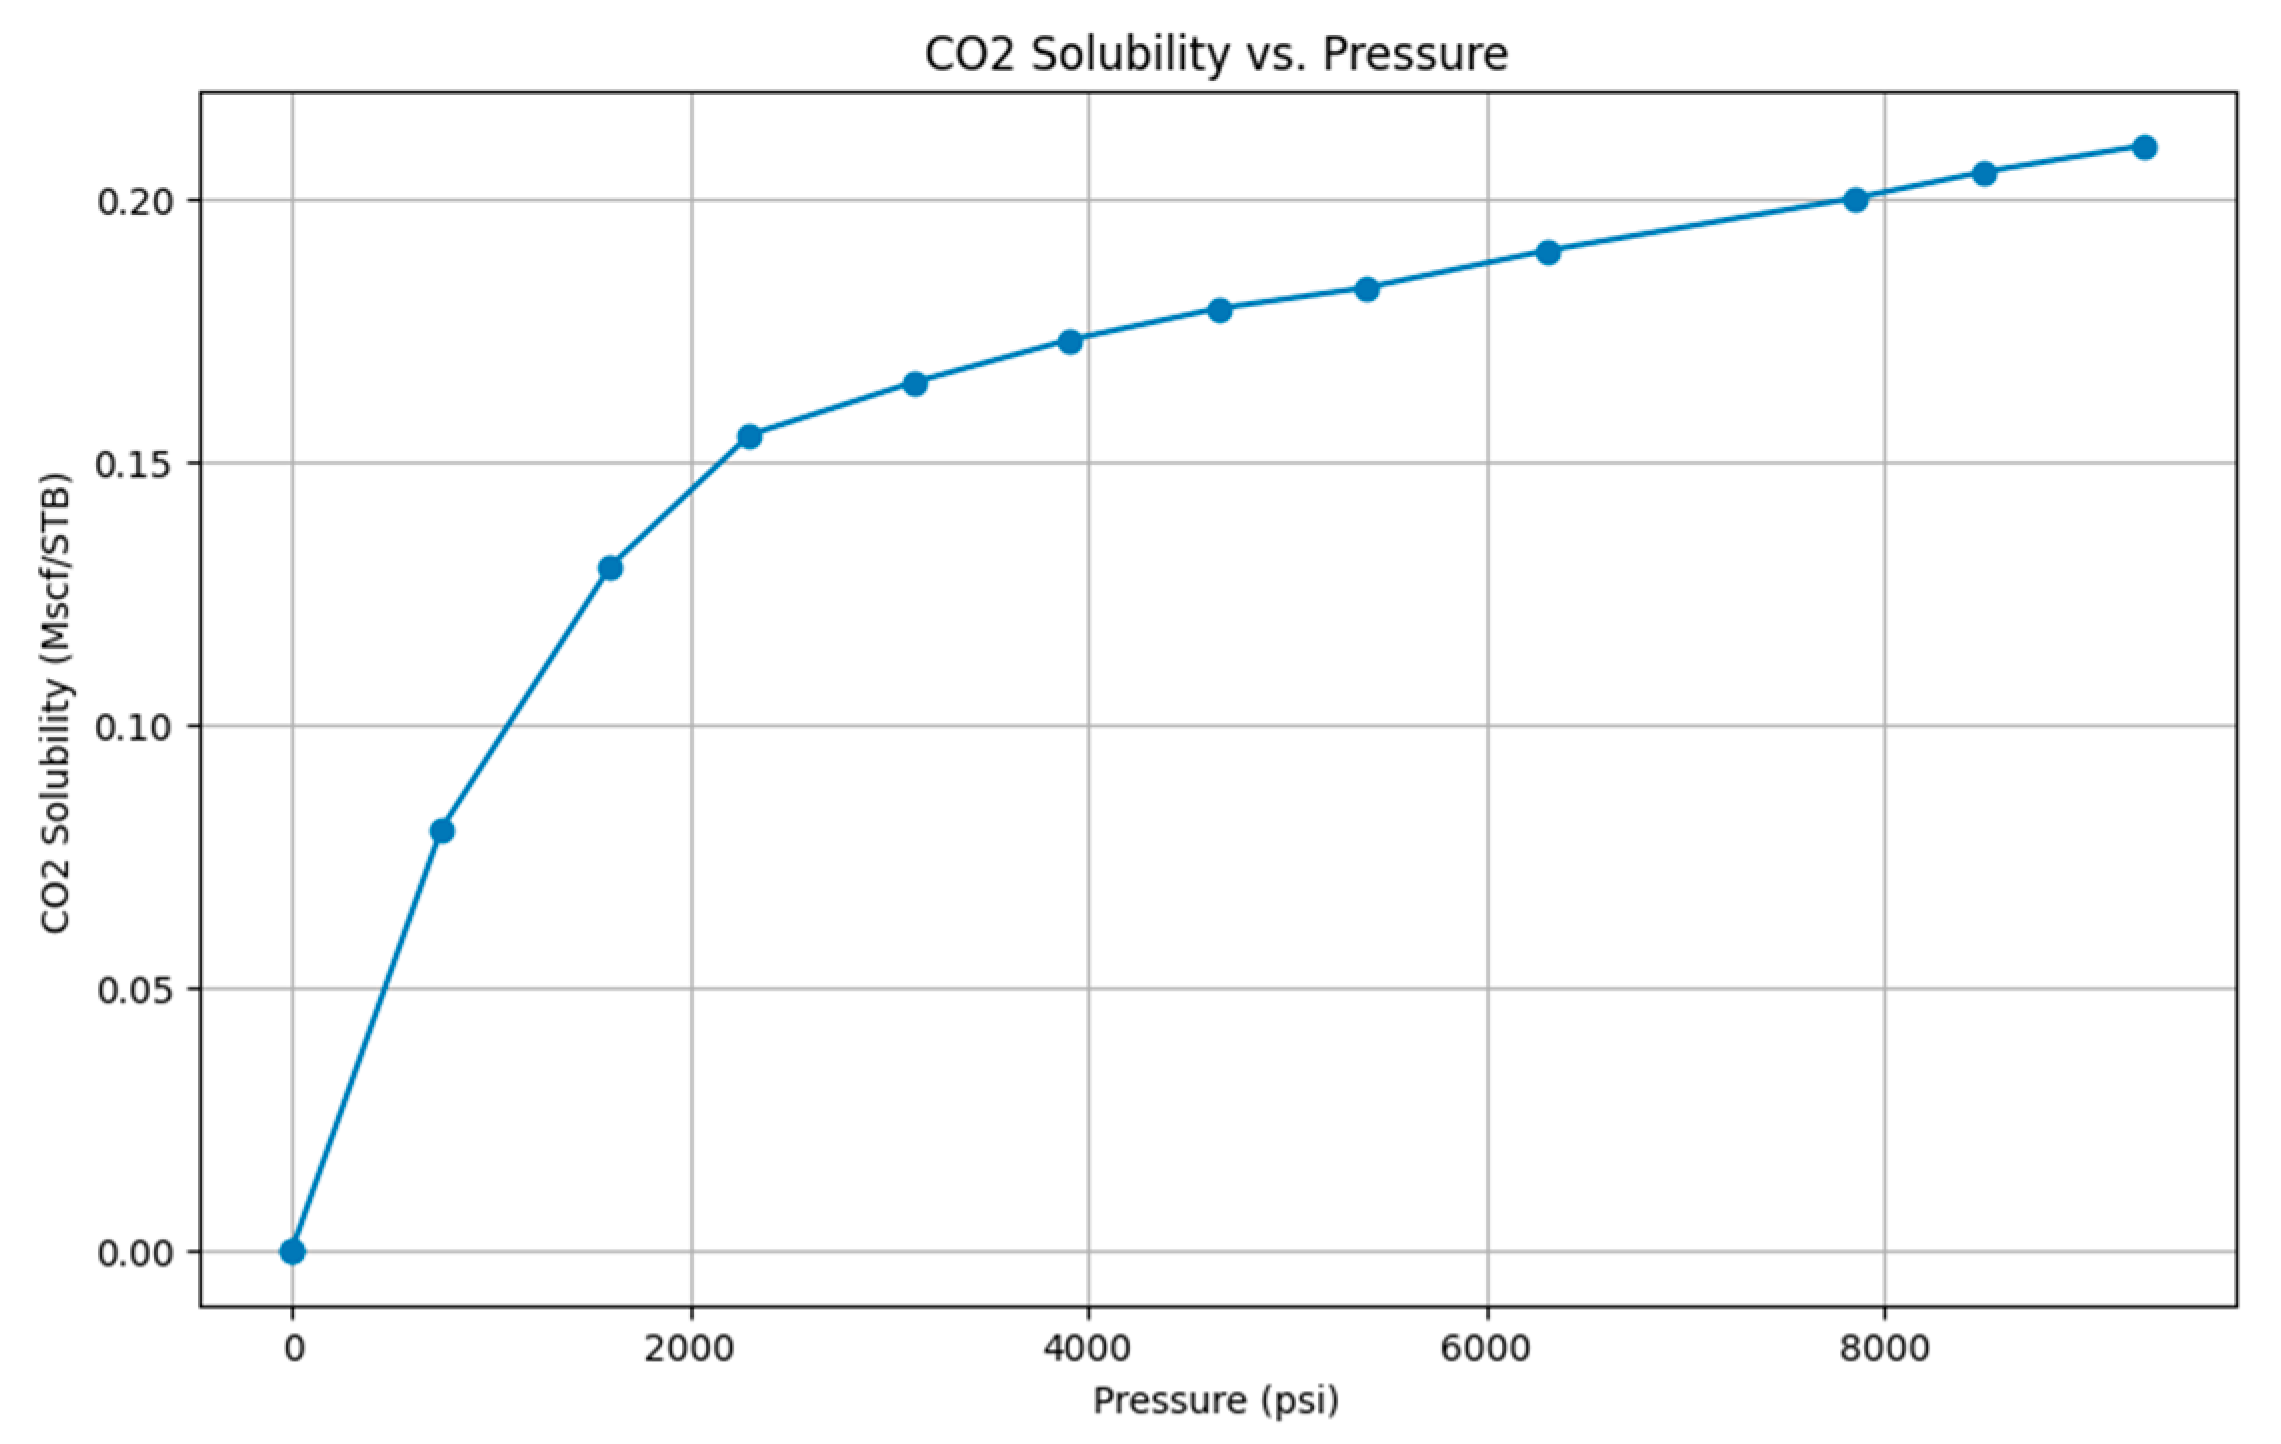
Extensive research has been carried out on CCS, resulting in the availability of relevant data. In this case, the acid gas composition is primarily composed of CO2 rather than H2S. Therefore, only the CO2 composition was considered for simulation purposes. The solubility of CO2 in water was determined thanks to the experimental data from [29]. Figure 13 shows the behavior of CO2 in the presence of water when increasing the pressure. This information serves as a crucial input for the simulation processes.
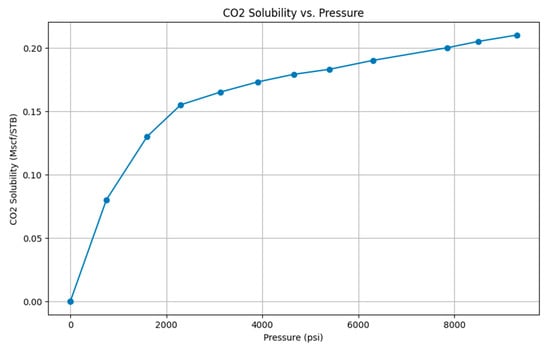
Figure 13.
CO2 solubility in water (T = 80 °C).
An important remark is that both CO2 and H2S exhibit similar phase equilibria. The critical points, as regards CO2, are at T = 31.1 °C and P = 1070 psi, and for H2S at T = 100.2 °C and P = 1300 psi [4]. It is worth noting that CO2 can form hydrates at temperatures up to 10 °C and H2S above 30 °C, even if there is no free water. Due to the lack of experimental data, a decision was taken to consider and simulate only one component, which led to the selection of CO2. This choice was due to the extensive research that was conducted on the behavior and properties of CO2 in various studies [22,27,29].
In the project plan, about 2 TCF of acid gas should be injected from the source field into the Surmeh formation. The source field consists of three production platforms, each with a capacity of 500 MMSCFD. Therefore, the total daily production from these platforms will be 1500 MMSCFD, with 12% of this gas being acid. This results in an average daily acid gas rate of 180 MMSCFD.
Considering this acid gas rate and taking into account factors such as fluctuating flow rates, it is estimated that it will take about 30–35 years to inject the 2 TCF of acid gas into the formation. Simulation models were run over a 100-year lifetime to observe pressure changes throughout the injection period. This long simulation period allows a complete understanding of pressure dynamics throughout the injection process.
5. Results
Two different cases were examined, respectively, with a permeability of 1 and 0.1 mD covering the minimum and maximum possible range expected for Surmeh formation at the forecasted burial depth in the field. In the following, the results obtained are highlighted.
Permeability = 1 mD: To assess the gas injection capacity into the reservoir, a sensitivity analysis was conducted based on empirical correlations. These correlations show that for a porosity of 6%, the typical range of permeability falls between 0.1 and 1 mD (see Figure 5). By varying the permeability values within this range, the study aimed to determine the maximum gas injection volume that could be accommodated by the reservoir.
When performing dynamic modeling, it is important to consider the following factors:
- Vertical permeability: in all models, the vertical permeability (Ky) was assumed to be 0.1 times the horizontal permeability (KH).
- Chemical reactions: none of the simulation cases accounted for chemical reactions between rock and fluids. It is necessary to conduct precise laboratory tests to evaluate such reactions accurately.
- Wellbore diameter: in all simulation cases it was assumed equal to 19 cm, which is the default value in the software.
- Simulation area: all simulations were conducted in the upper Surmeh reservoir, due to its higher porosity value, which is a crucial factor for accurate modeling.
Based on the estimations made, the fracture pressure of the rock is 6100 psi, which is equivalent to 420 bars. Therefore, it is important to note that as the pressure approaches 400 bars (with a safety margin of 20 bars), the risk of rock fracturing arises.
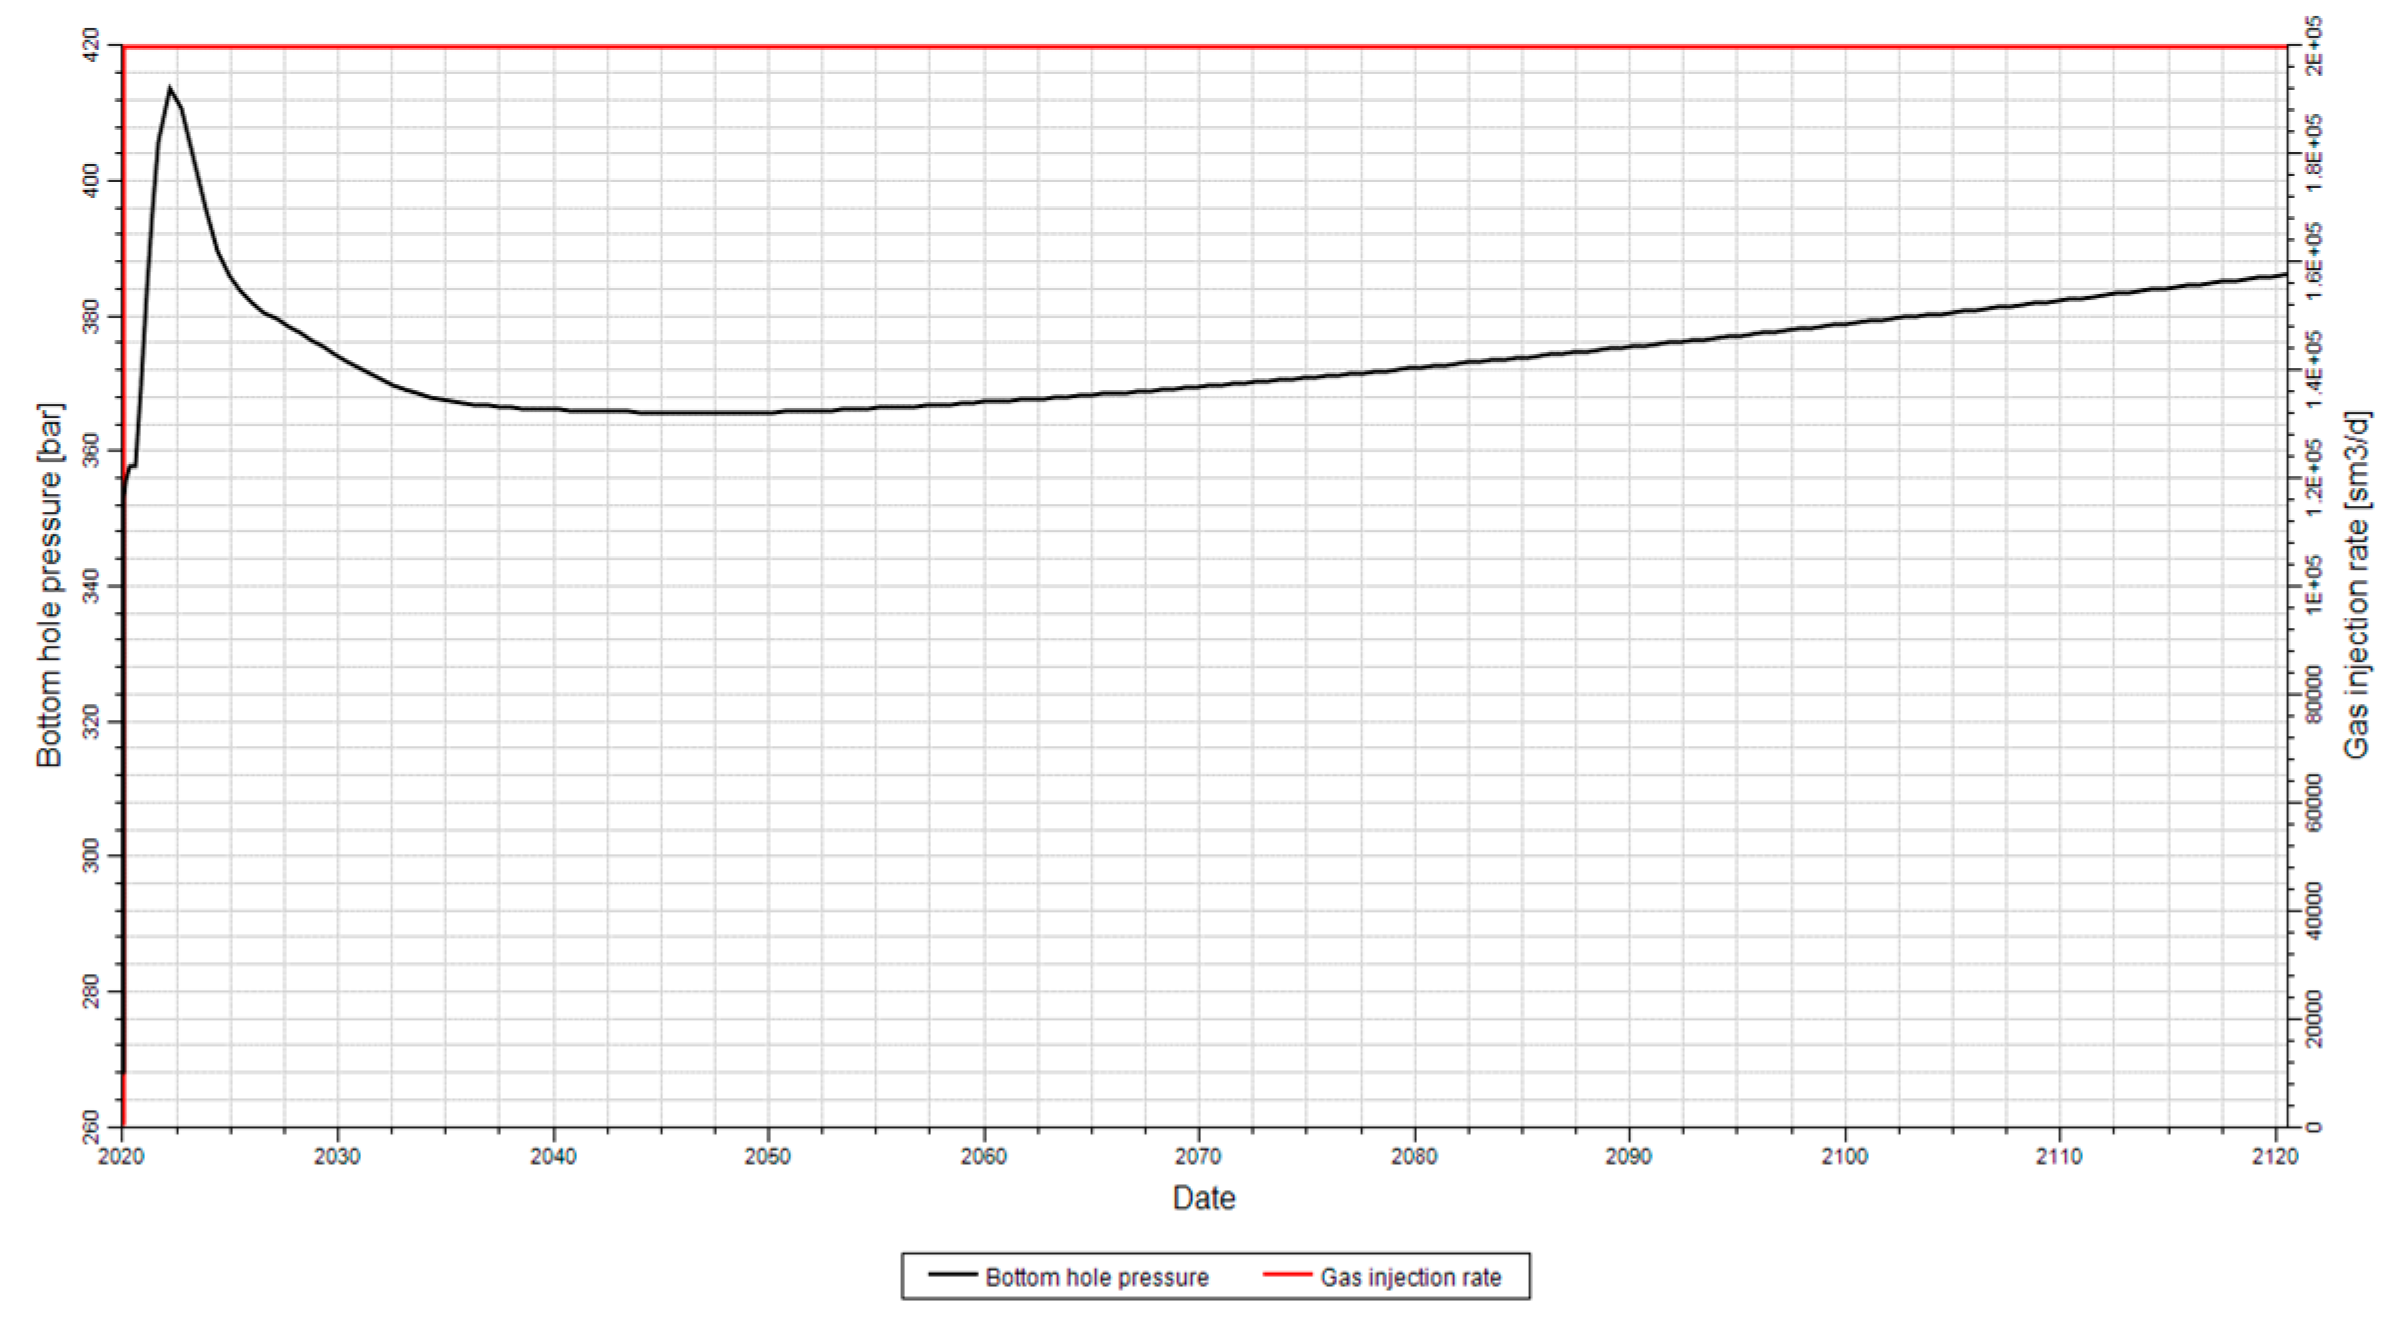
In the first model, the horizontal permeability was 1 mD, and the vertical permeability was 0.1 mD. Figure 14 shows the trend of the bottom-hole pressure with an injection rate of 200,000 Sm3/d or 7 MMSCFD.
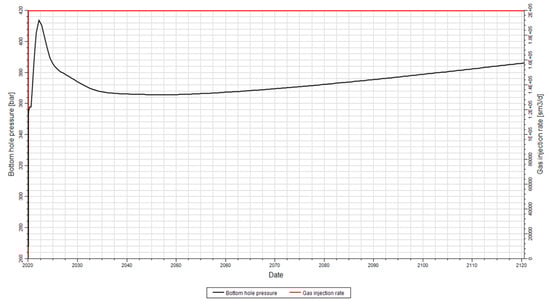
Figure 14.
Trend of the well bottom-hole pressure according to a gas injection rate of 200,000 Sm3/d.
Figure 14 depicts the well’s bottom-hole pressure profile for the injector in the implemented model. The pressure initially started at 270 bars and reached a maximum of 386 bars over the 100-year injection period. This rapid pressure rise is influenced by the compressibility of both fluids and rock, and it depends on the type of well and the length of completion.
As more gas is injected, the bottom-hole pressure gradually increases due to the increasing gas saturation. The initial sharp spike in the pressure is caused by the low relative permeability of the gas at the beginning of the injection process [30].
The pressure changes at the well affect the pressure at the cap rock, which is crucial for maintaining the seal integrity. The slow, long-term increase in the well’s bottom-hole pressure shown in Figure 14 is a result of the net accumulation of fluid within the formation.
It was anticipated that injecting a flow rate of 300,000 Sm3/d could potentially cause fractures in the formation, given its low permeability. The upper limit for this permeability is determined to be 200,000 Sm3/d.
As observed, the reservoir permeability is quite low to accommodate an injection rate of 180 MMSCFD. Therefore, achieving high well injectivity becomes crucial to enable the injection of such a flow rate. However, it is important to ensure that the bottom-hole pressure does not exceed 400 bars to maintain the integrity of the reservoir.
According to the information provided, the initial bottom-hole pressure of 270 bars increases to 386 bars over a span of 100 years. Considering the typical Vertical Flow Performance curves, the corresponding pressure drop along the wellbore would be estimated to be between 1000–1300 psi (68–90 bars). Consequently, the resulting wellhead pressure is projected to be within the range of 352–475 bars.
Permeability = 0.1 mD: Based on the simulation results for a permeability of 1 mD, it can be concluded that lower permeability tends to result in reduced injectivity. In this case, to prevent formation damage, the simulation suggests that an injection rate of 20,000 Sm3/d (0.7 MMSCF/D) can be safely maintained. This rate is determined to be within the acceptable range for injection without causing the formation to fracture or break.
6. Ideal Reservoir
In 2003, Gas Liquids Engineering (GLE) conducted a conceptual design study to explore the possibility of acid gas injection at Kharg Island. Recently, in the current year, GLE has initiated a Front-End Engineering Design (FEED) study for an acid gas injection facility to replace the existing sulfur plant [31]. These studies are crucial for evaluating the feasibility and potential of implementing acid gas injection in the reservoirs at Kharg Island and further assessing the suitability of the reservoirs for this process.
Based on the available data from the formation core and logs [31], the primary reservoir properties in the Dhruma Zone are as follows:
- Depth range: 4016–4150 m;
- Net Pay: Approximately 125 m;
- Typical porosity of the injection zone: 15–23%;
- Typical permeability of the injection zone: 10–600 mD;
- Proposed injection rate: 80 MMSCFD.
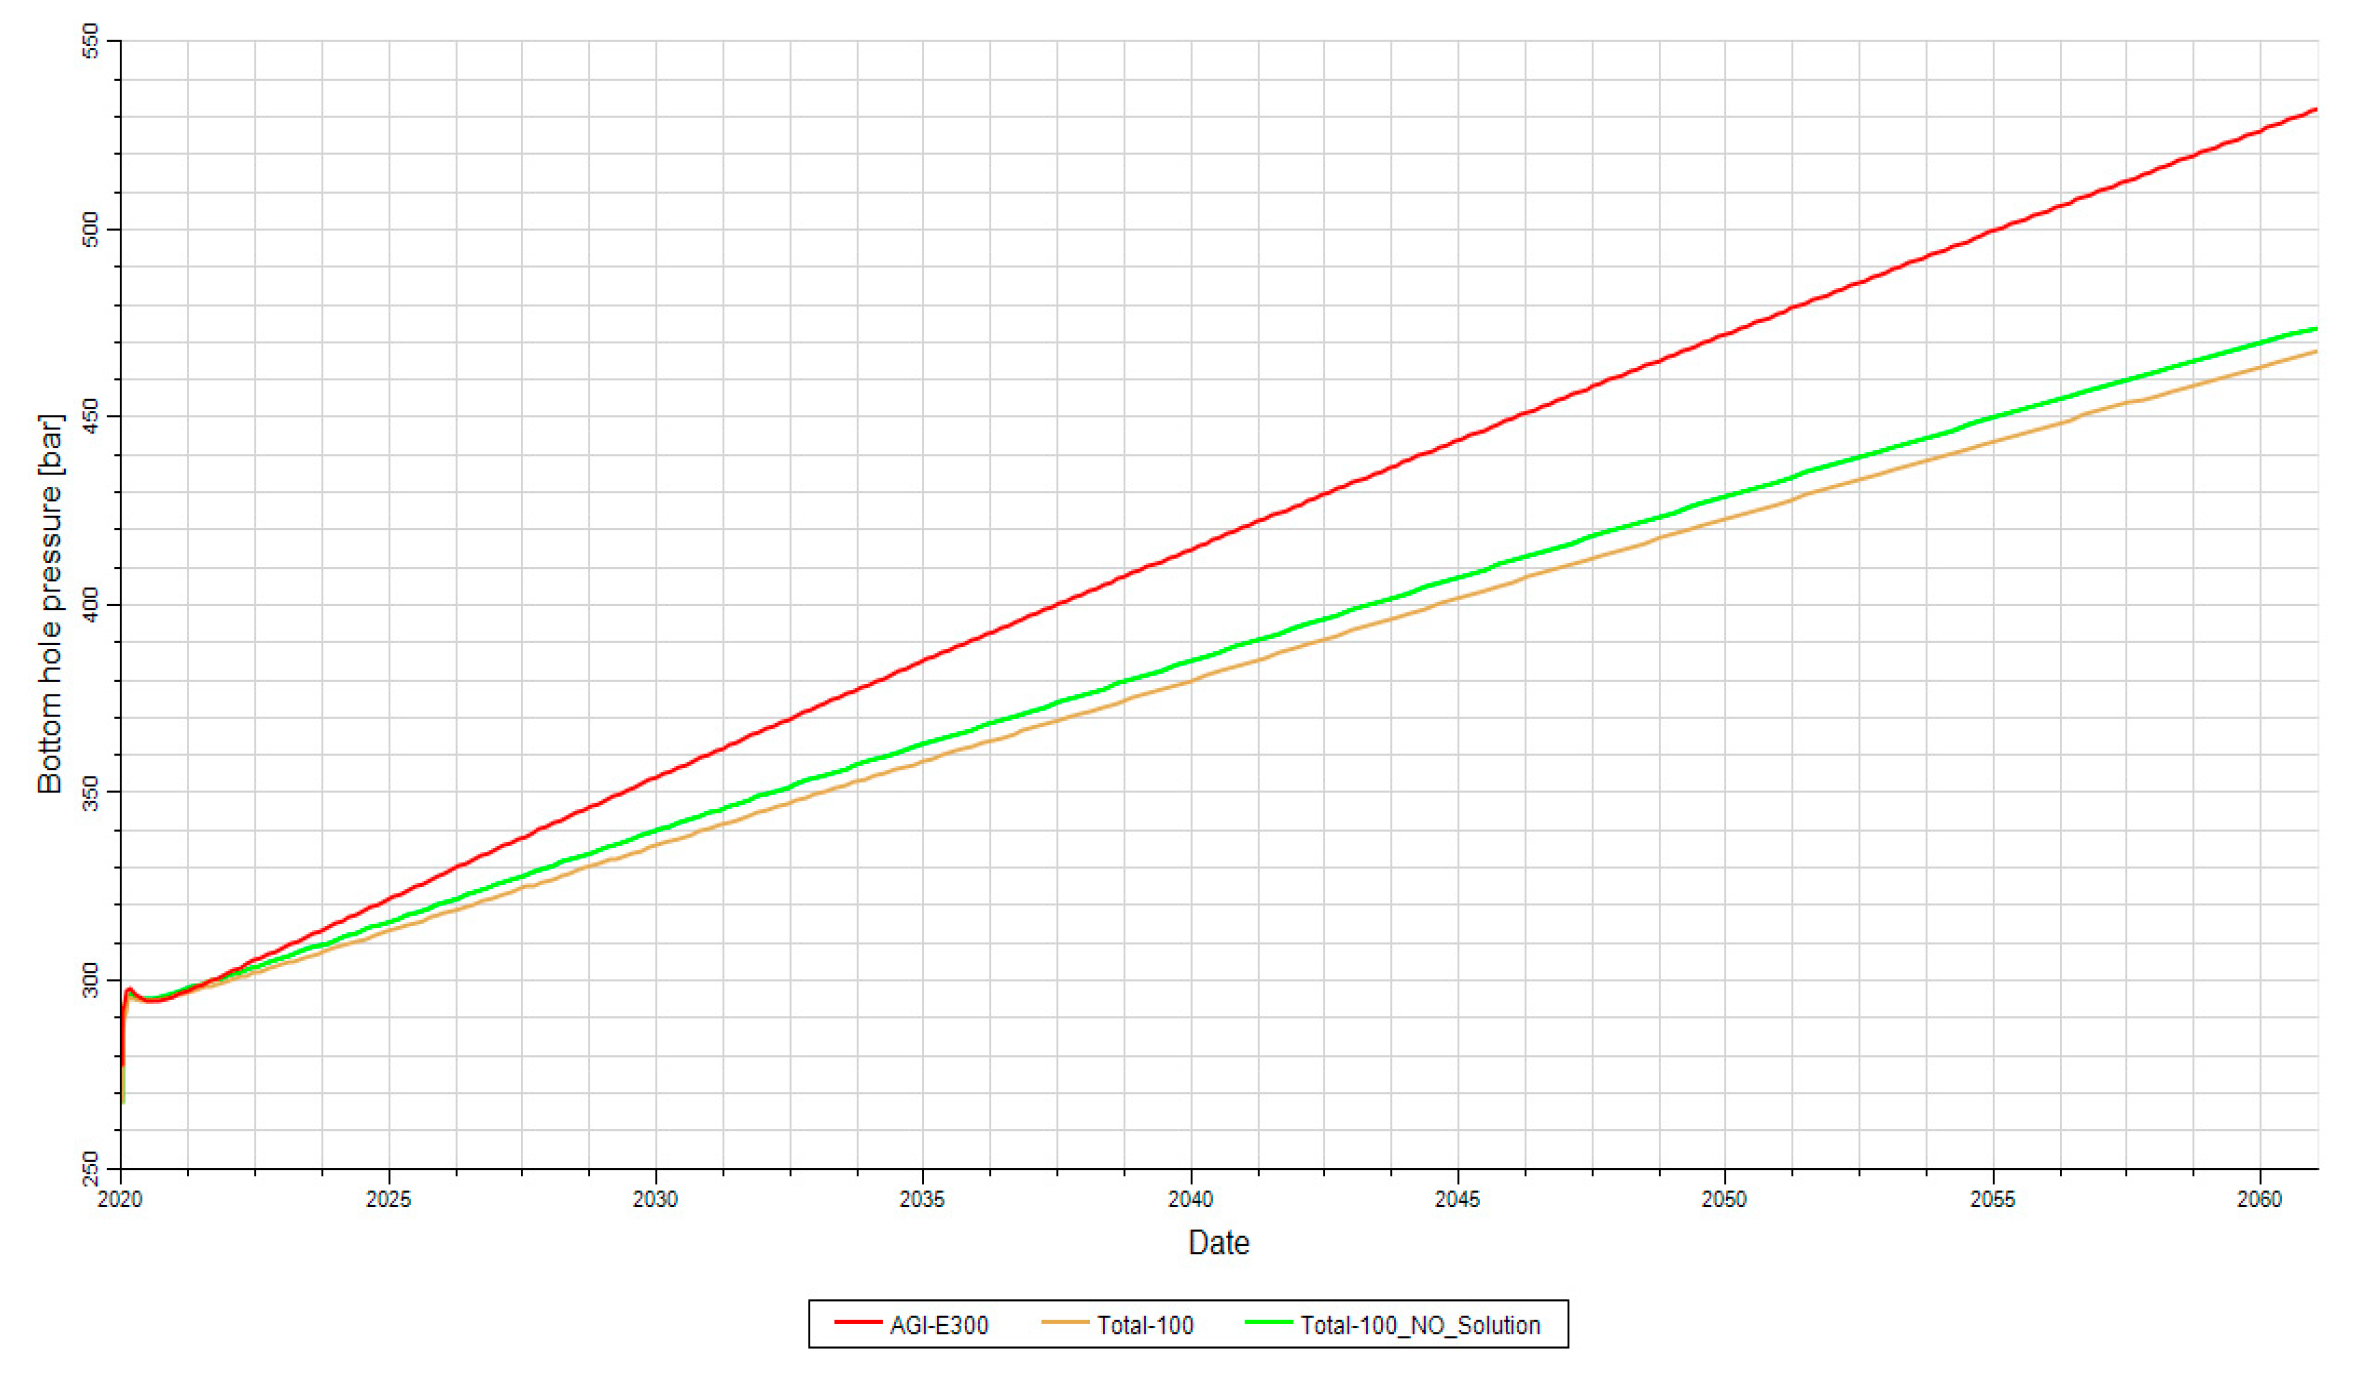
As can be seen, the permeability of the reservoir is relatively high, and the formation is highly porous (15% porosity). By considering a permeability of 100 mD and a porosity of 6%, the results are shown in Figure 15. It should be emphasized that a porosity of 6% in rocks generally results in a permeability of less than 100 mD: this value is only considered for the conceptual feasibility of acid gas injection. Under such conditions, the bottom-hole pressure increases over time. After 25 years it reaches 400 bars, which coincides with the fracture pressure. Throughout this period, the injection rate remains constant at 2,000,000 Sm3/d (70 MMSCFD).
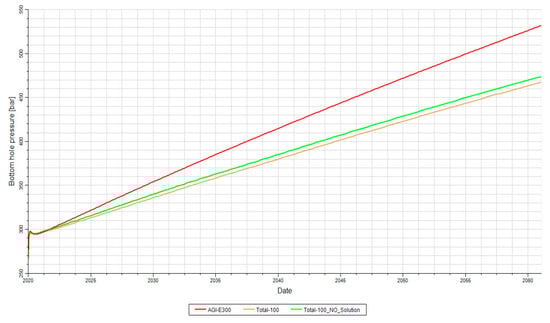
Figure 15.
BHP for 3 cases (Red: Compositional; Green: Black oil without CO2 solubility; Brown: Black oil with CO2 solubility).
In addition to black oil simulation, a compositional model was used to validate the results. This involved considering two components, CO2 and H2O. By comparing the results obtained from the compositional model with those from the black oil simulation, the accuracy and reliability of the findings were assessed. This approach allows a more comprehensive understanding of the behavior and performance of the reservoir during acid gas injection.
Figure 15 shows two black oil cases and one compositional case: it is evident that the injection rate involves a high risk of fracturing and, over a period of 30 years of injection, there is a possibility of formation breakdown. In the black oil cases, two scenarios were examined, and the descriptions of both of them are shown in Table 4.
Table 4.
Characteristics of the 3 cases examined (Porosity: 6%, Permeability = 100 mD).
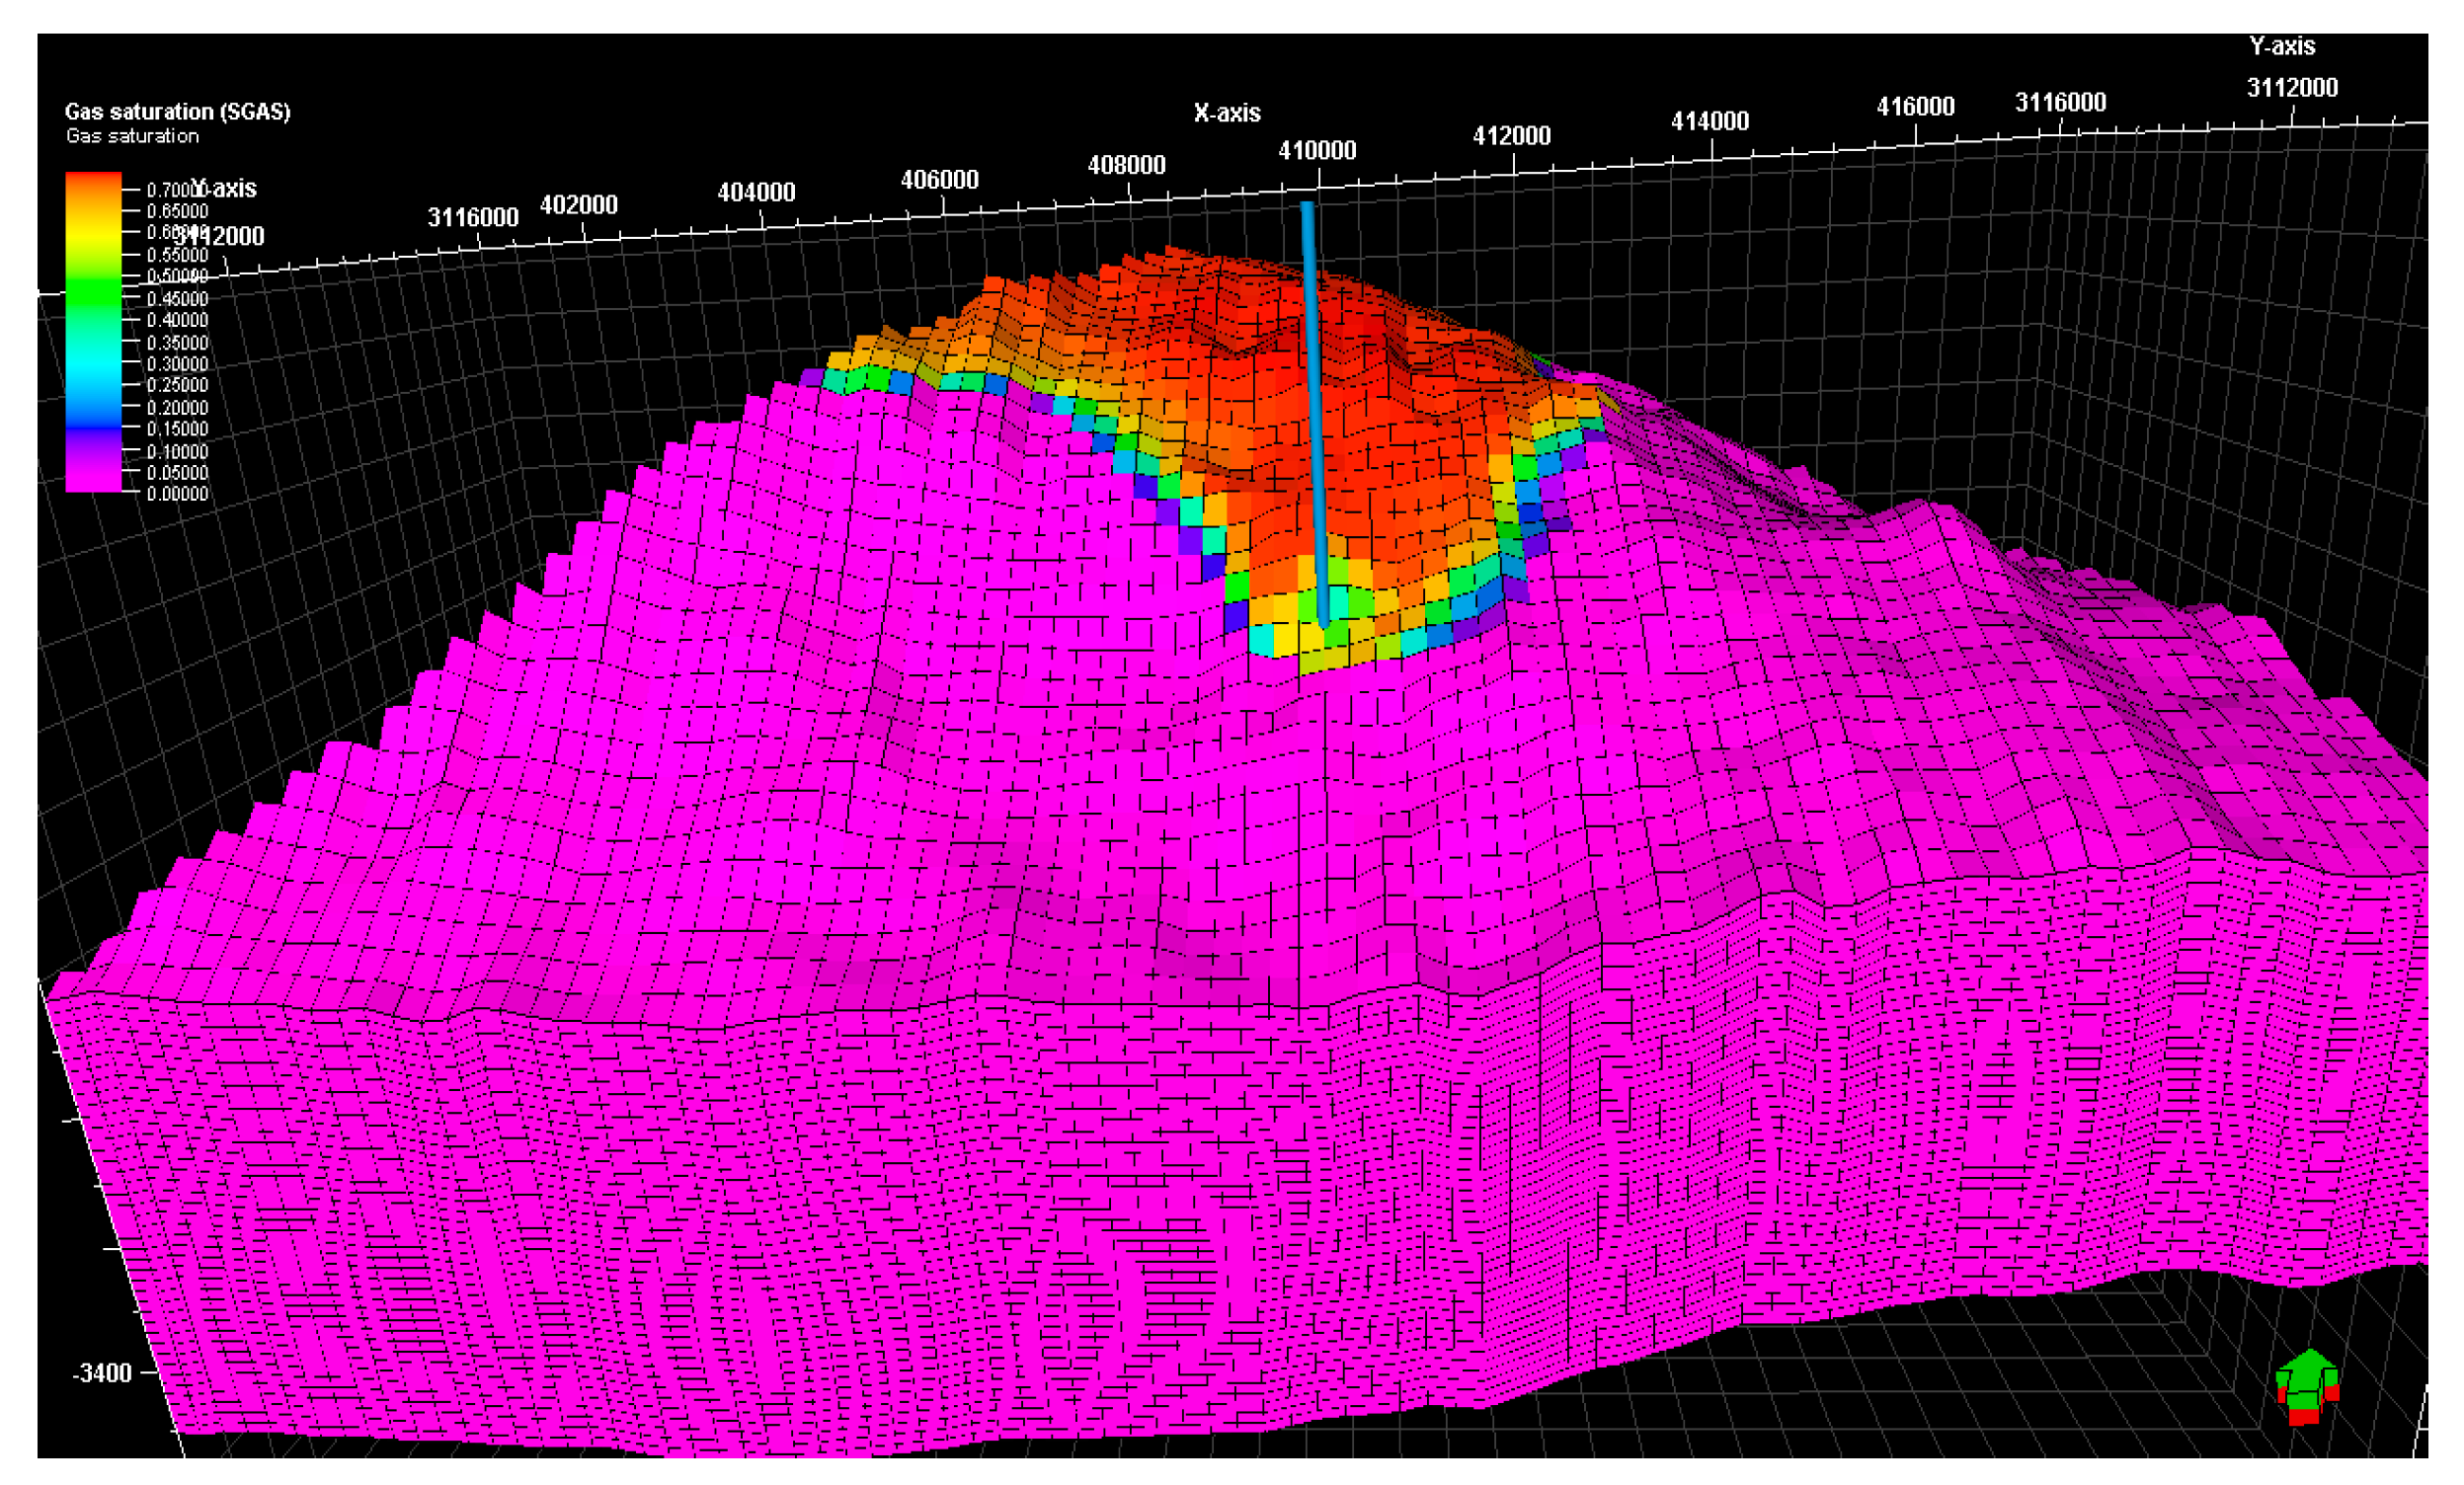
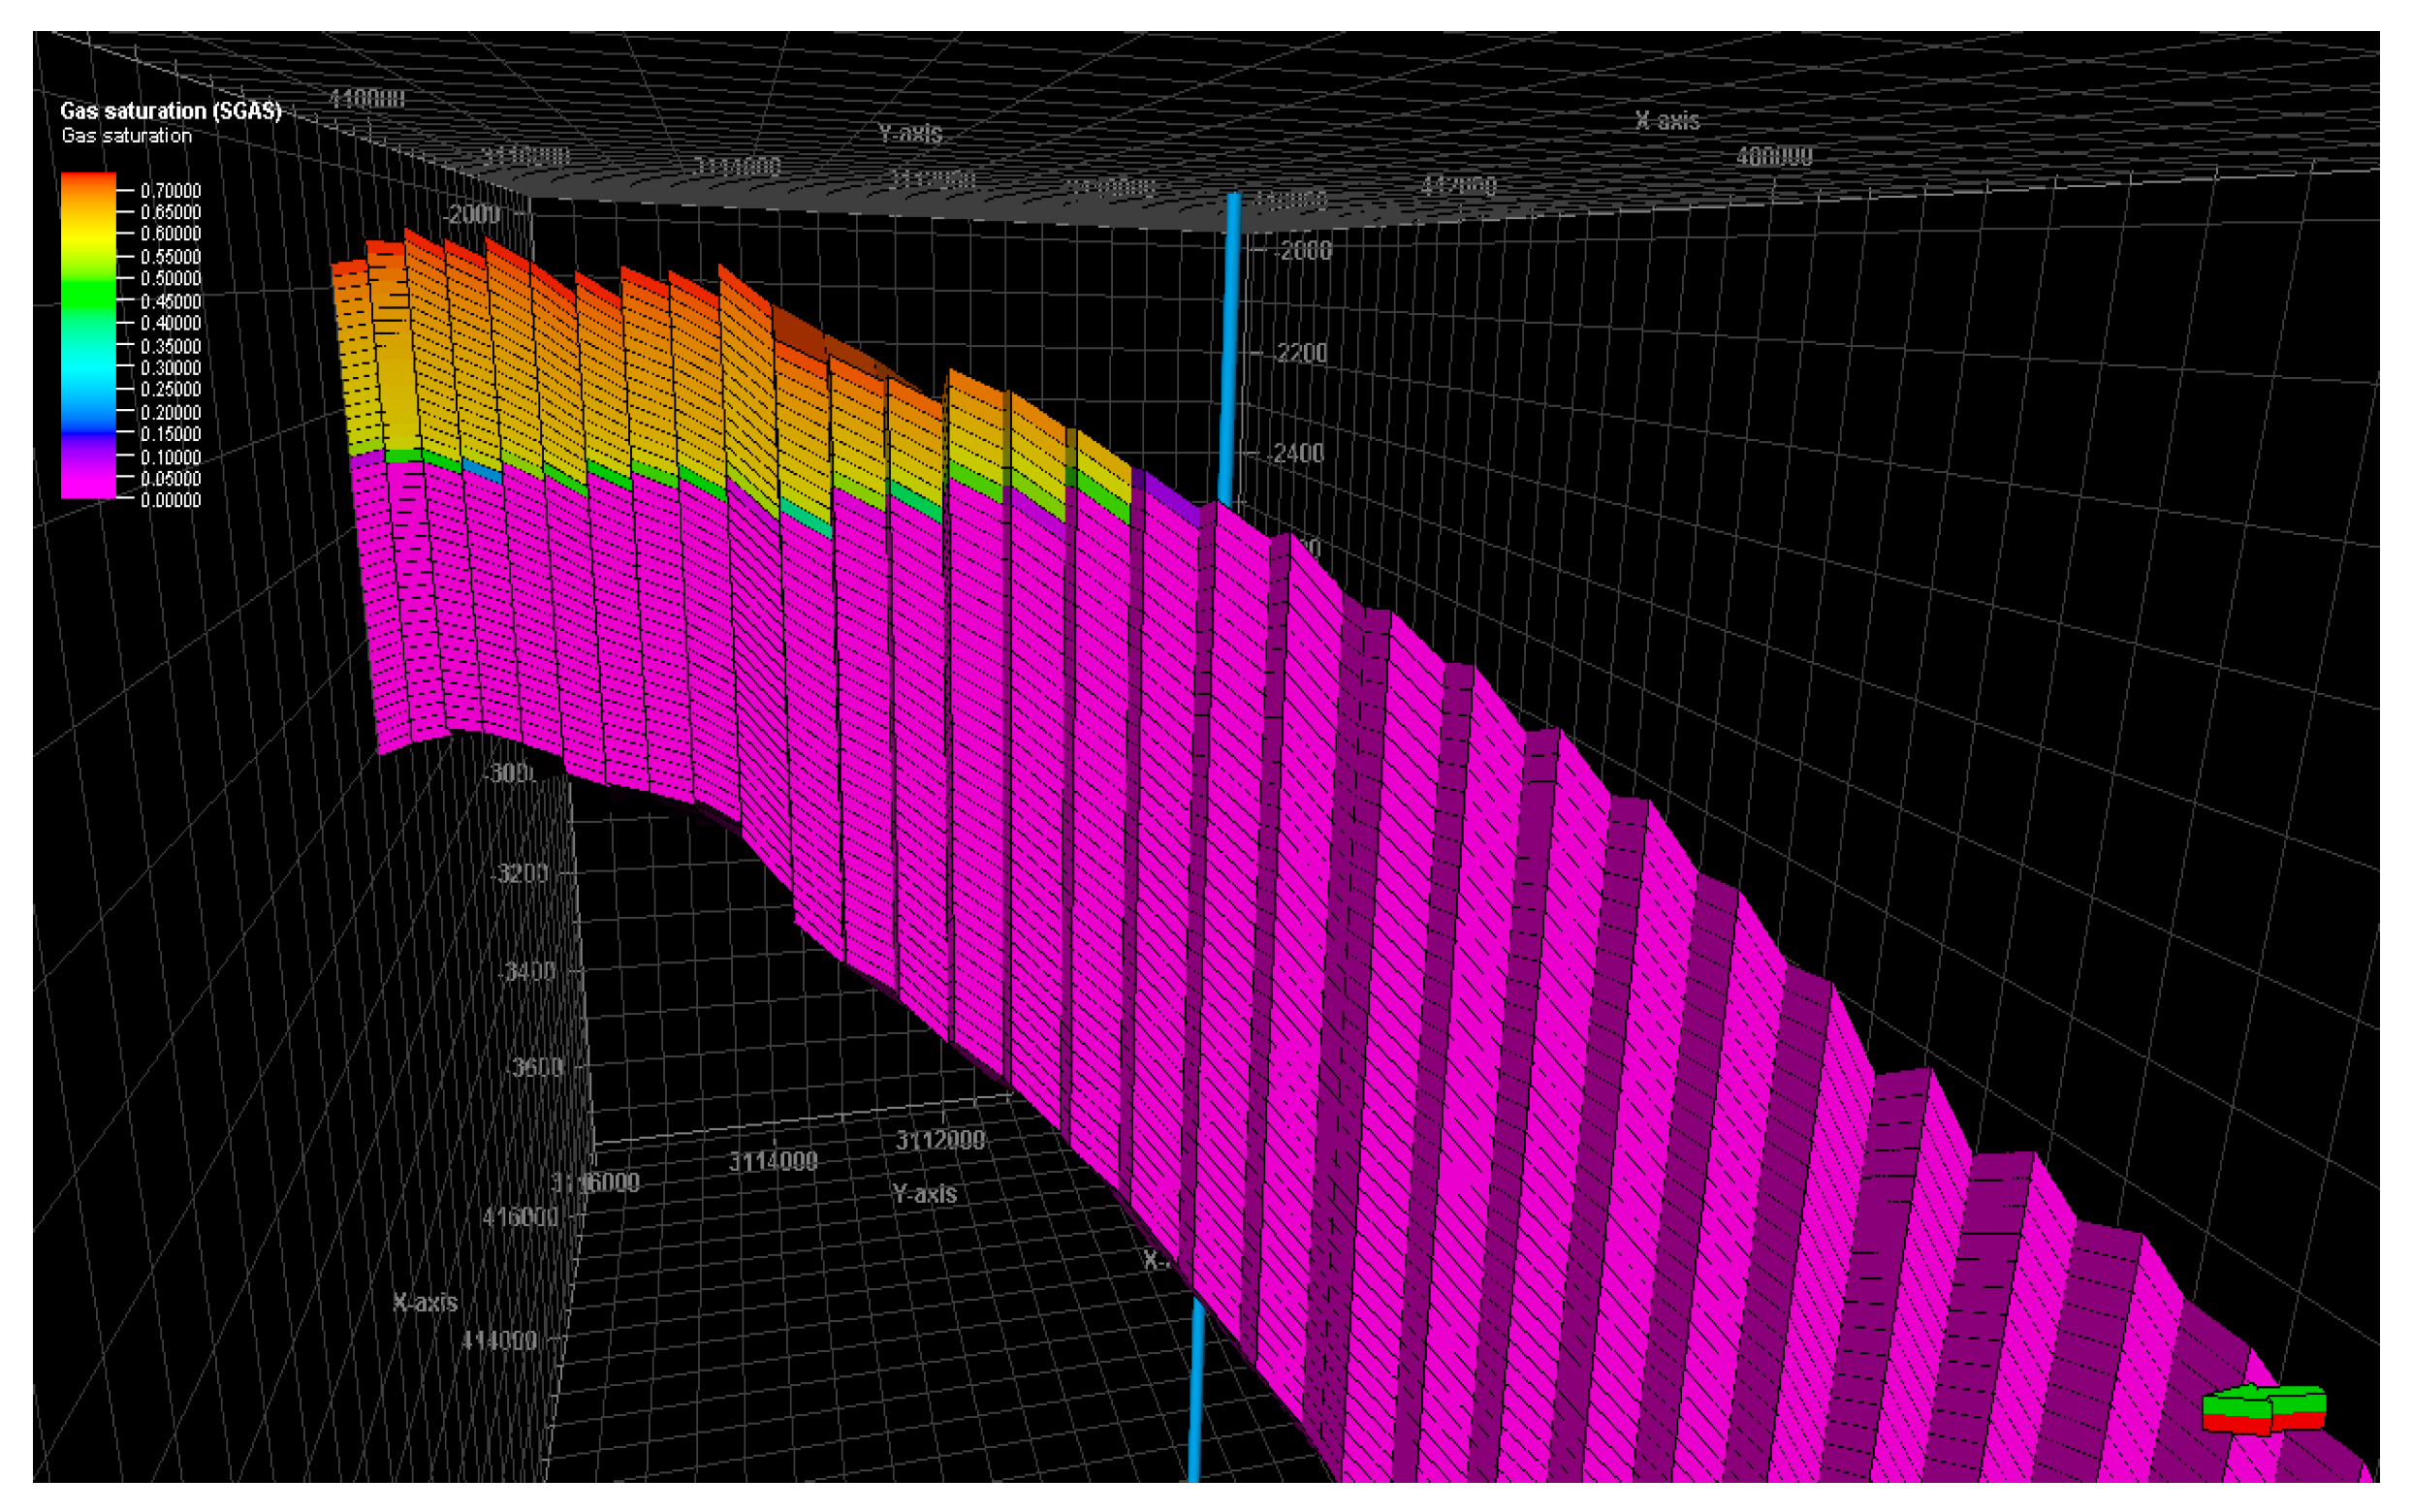
Figure 16 and Figure 17 display the gas saturation distribution within the reservoir: they show how the gas fluid rapidly moves upward, driven by the buoyancy force, and accumulates in the crest of the structure. As a result, a gas cap is formed over the water zone in the formation. The visualization of gas saturation provides insights into the spatial distribution and movement of gas within the reservoir.
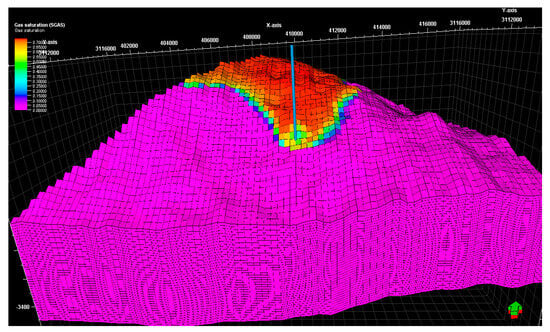
Figure 16.
Illustration of gas saturation after 50 years.
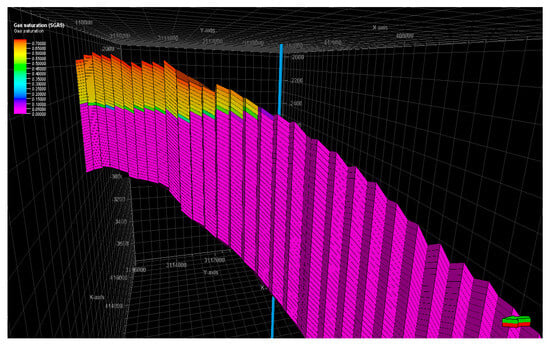
Figure 17.
Secondary gas cap after acid gas injection.
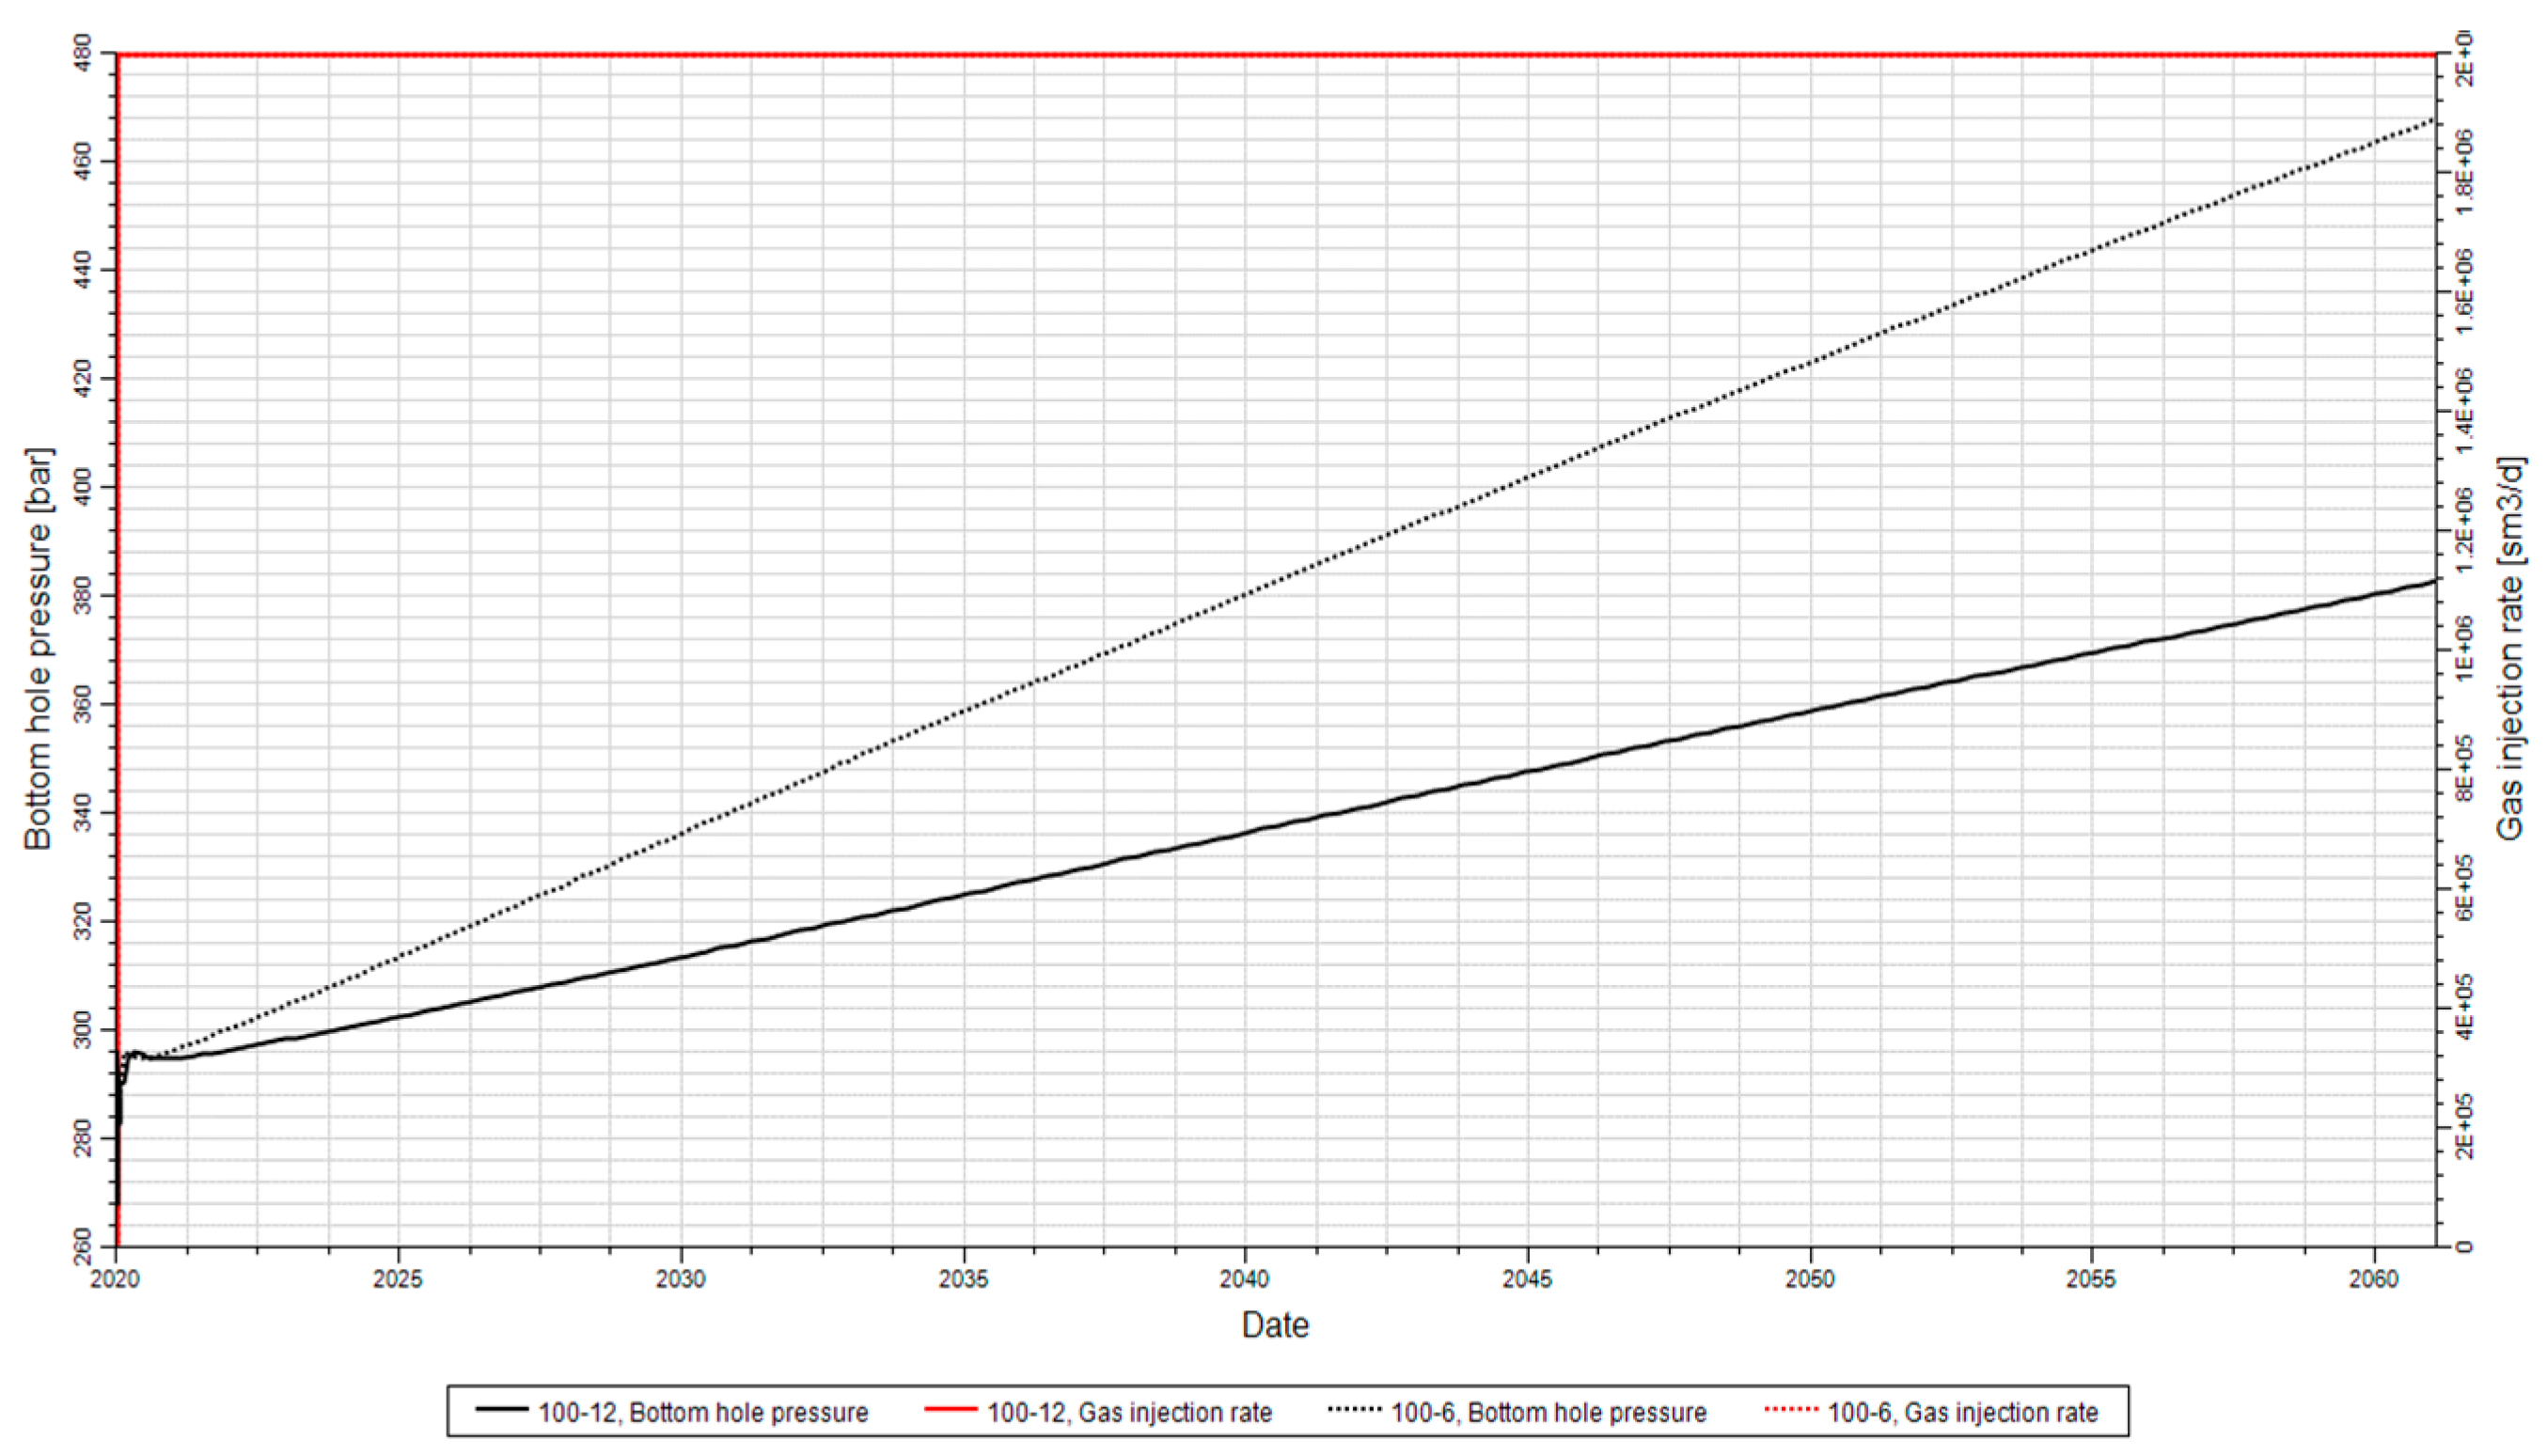
The formation’s porosity of 6% and permeability of 100 mD restrict the injection rate, allowing a maximum injection of 70 MMSCFD. To maintain the pressure of the reservoir and reduce the pressure of the bottom-hole, three injection wells are needed. The low porosity of the reservoir significantly affects the increase in reservoir pressure and BHP.
Figure 18 shows a comparison between the bottom-hole pressures obtained for two different cases, based on the porosity values of 6% and 12%. The Arab formation (Surmeh), depicted in Figure 5, exhibits a porosity range of 10–15% and a permeability range of 1–100 mD, highlighting its high heterogeneity. Considering a porosity of 12%, which is higher than 6%, BHP is expected to differ between the two cases.
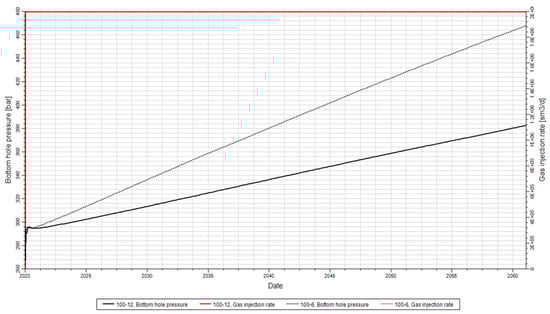
Figure 18.
BHP for the same case (Surmeh formation) with porosity values of 6% and 12% and permeability of 100 md.
Based on the information provided, the porosity of 12% resulted in a reduction of the bottom-hole pressure over a period of 50 years of injection. In this case, the BHP does not exceed 400 bars, indicating that higher flow rates, potentially exceeding 2,000,000 Sm3/d, could be injected.
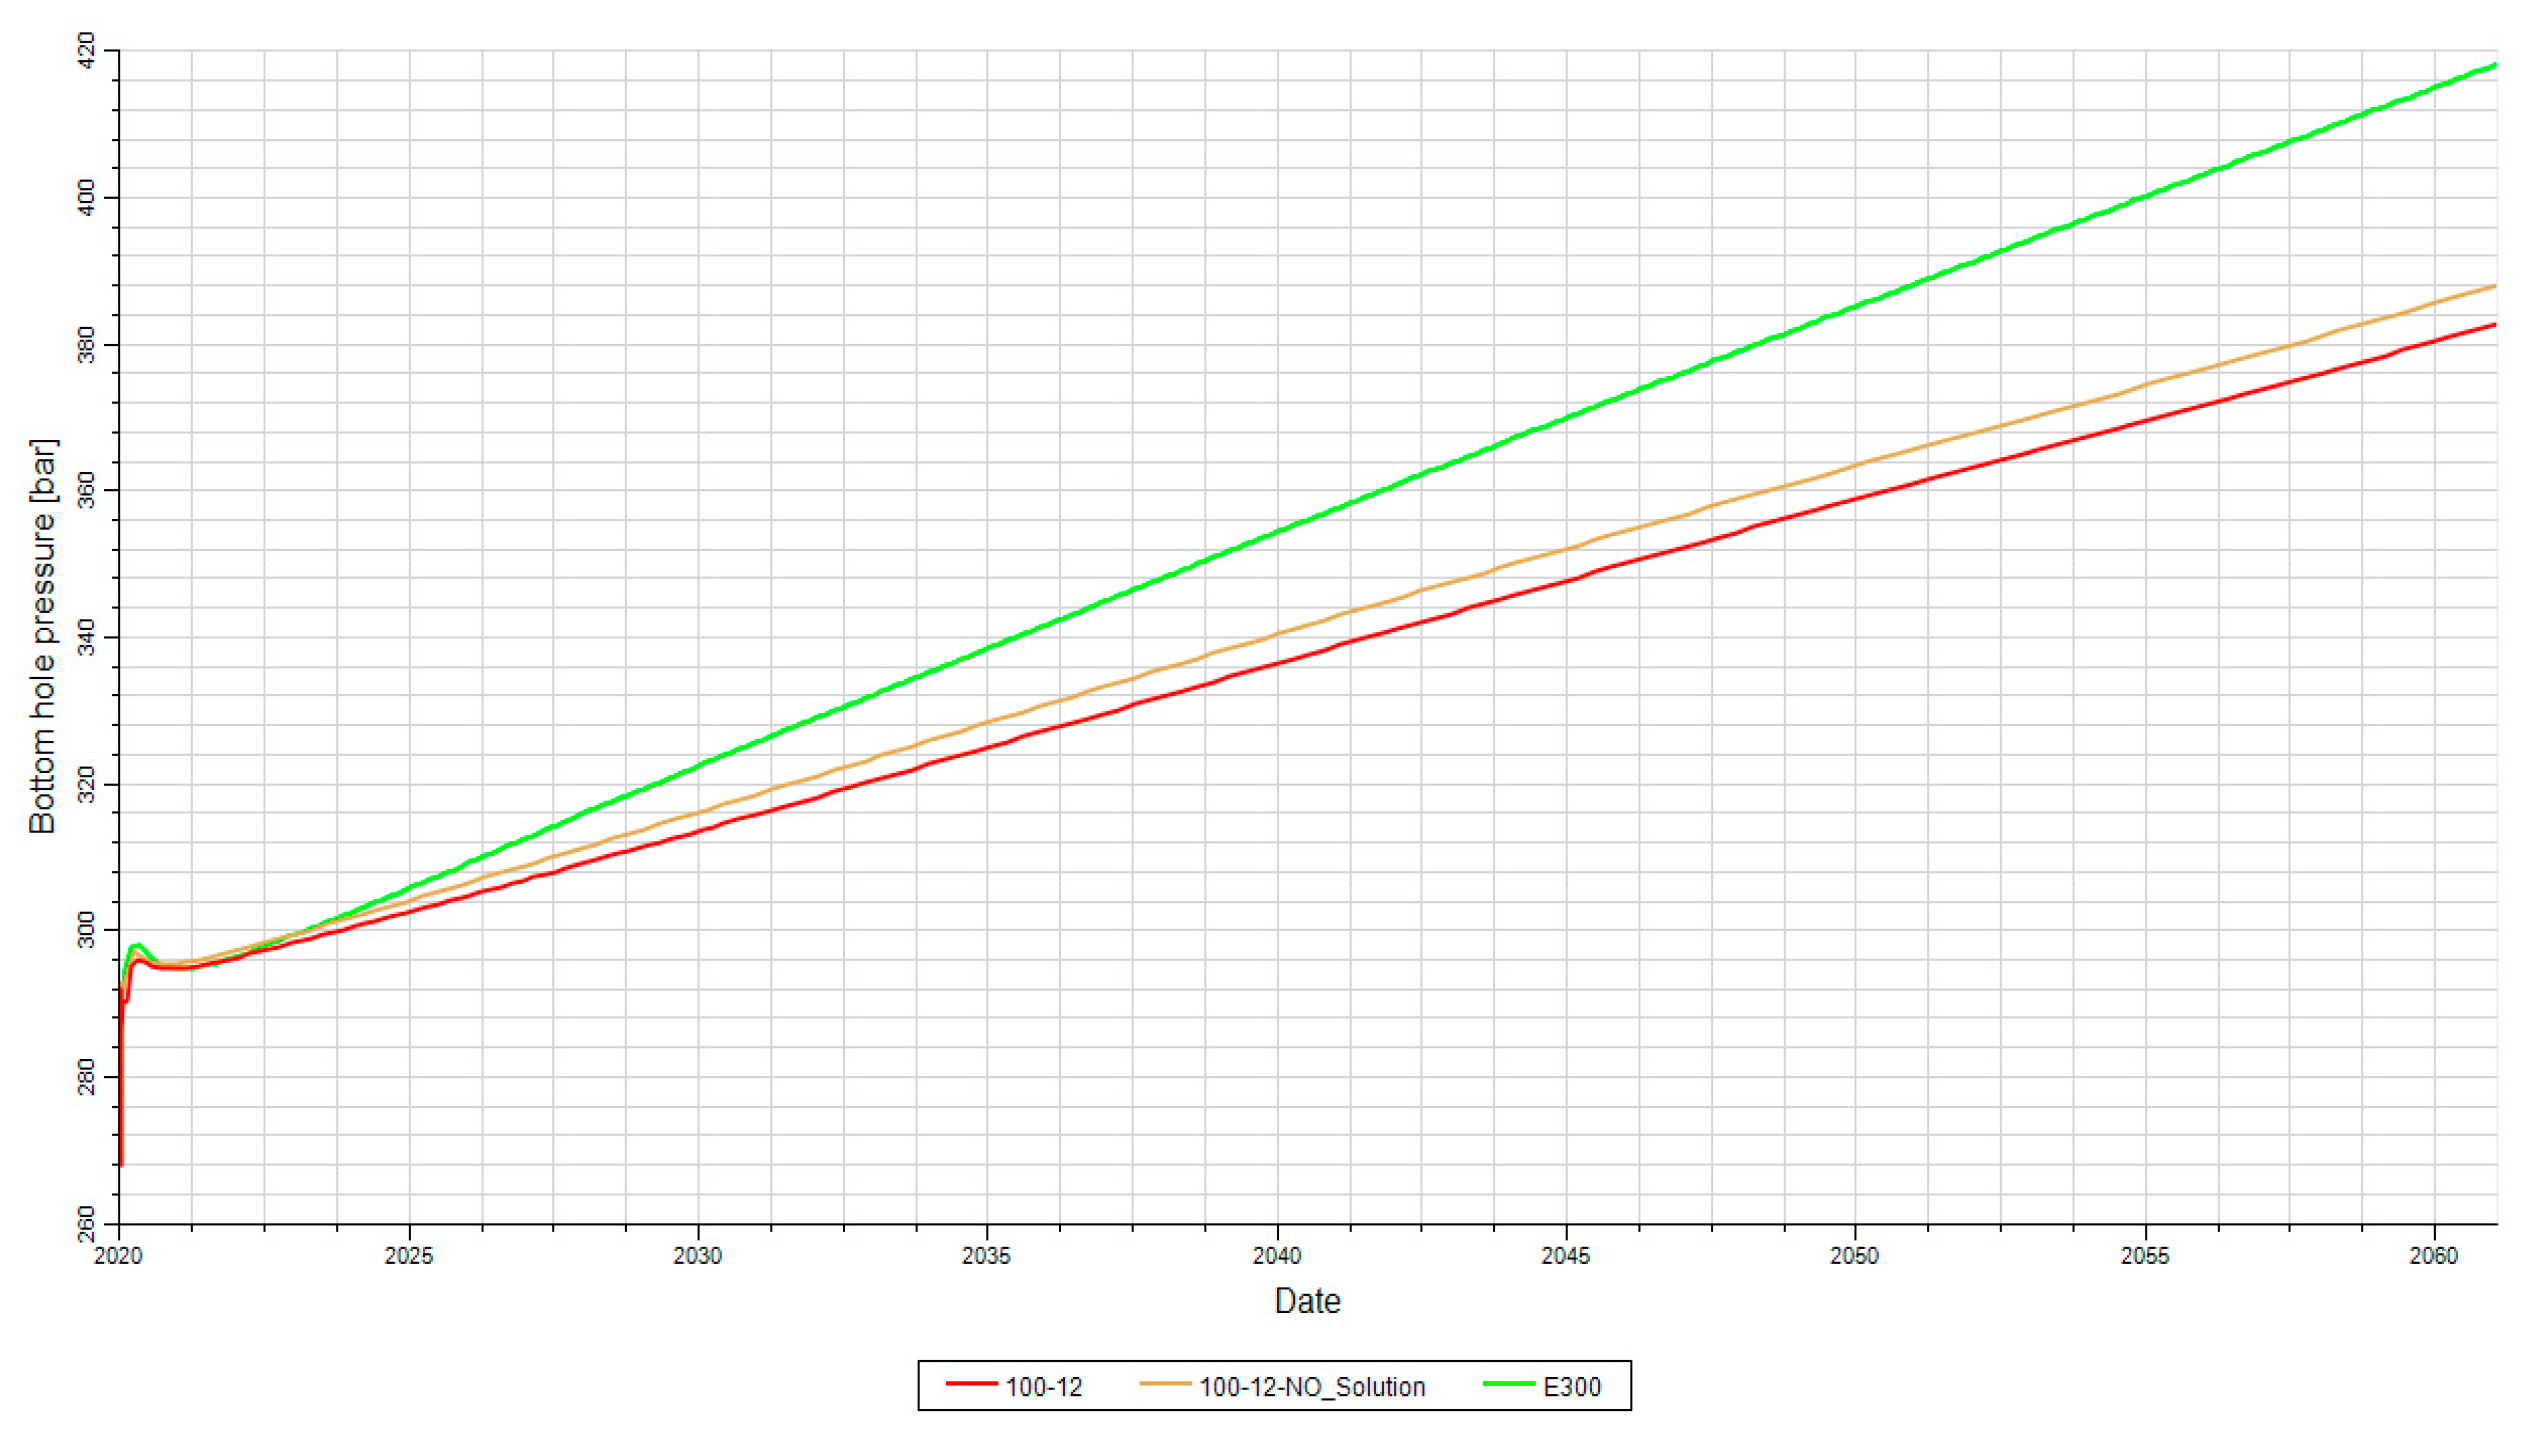
On the contrary, for the compositional case, the BHP reaches 400 bars after approximately 35 years. This suggests that the compositional characteristics of the reservoir have a different impact on the pressure behavior than the case of higher porosity mentioned earlier (Figure 19).
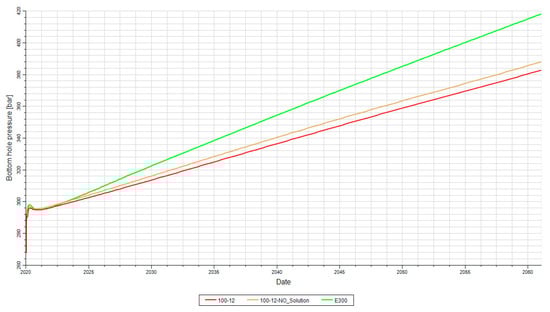
Figure 19.
BHP for 3 cases with an injection rate of 70 MMSCFD and porosity of 12%. (Red: Compositional; Green: Black oil without CO2 solubility; Brown: Black oil with CO2 solubility).
7. Main Uncertainties
Based on the simulation results and analysis, several crucial reservoir properties and factors have been identified as main uncertainties for the Surmeh formation. These include:
- Porosity and permeability: they play a significant role in controlling fluid flow and pressure behavior. Accurate analysis of these properties is crucial and can be obtained through coring and laboratory testing.
- Formation temperature: it affects the solubility of gas in water and impacts the behavior of fluids within the reservoir. Understanding the formation temperature is important for accurate modeling and prediction.
- Injectivity and fall-off test: conducting injectivity tests and fall-off tests provides valuable information about the reservoir’s ability to accept injected fluids and the behavior of pressure response. These tests help to determine the formation injectivity and generate Vertical Flow Performance (VFP) curves, which are necessary for compressor design and calculation of well-head pressure.
- Relative permeability and capillary pressure curves: understanding relative permeability and capillary pressure relationships is essential for accurate reservoir modeling and simulation. These curves provide insights into multiphase flow behavior and fluid displacement within the reservoir.
- Fracture pressure: determining the fracture pressure of the reservoir is important for well design and drilling operations. It helps to ensure that the pressure exerted during the injection or production operations does not exceed the integrity of the reservoir.
- Caprock integrity: it acts as a seal for the reservoir and is crucial to prevent fluid migration and to maintain the reservoir pressure. Analyzing the caprock’s integrity helps assess the risk of potential leaks or breaches.
- Gas solubility in water: the temperature of the reservoir influences the solubility of gas in water. Understanding the gas solubility is vital for accurately modeling gas–water interactions and predicting fluid behavior during injection and production processes.
Addressing and reducing these uncertainties through comprehensive analysis and testing will improve the understanding of the Surmeh formation and enhance decision-making in reservoir management and development strategies.
8. Conclusions
The research focused on a specific area in the Persian Gulf, about 100 km from Iran’s coast and 120 km from Bushehr city. Due to limited permeability data, an empirical correlation was used to incorporate permeability information into the simulation for both carbonate and dolomite formations. According to this correlation, the estimated average permeability for the upper part of the Surmeh formation was approximately 0.1 mD.
Geomechanical Earth Modeling (GEM) was employed to assess pore pressure and fracture pressure (3800 and 6100 psi, respectively), which are crucial factors for evaluating the suitability of the formation for CO2 storage. Variations in caprock thickness were identified as significant considerations affecting the containment and long-term stability of injection operations.
Understanding capillary trapping phenomena is essential, and the study analyzed two simulation models. In the first scenario, a homogeneous gas plume rapidly reached the reservoir’s top and spread laterally. In the second scenario, which was heterogeneous, the plume was wider with a non-uniform gas saturation distribution as only a fraction of the gas reached the top. These findings emphasized the significant impact of different rock types and hysteresis in capillary curves on trapping processes and the dynamic behavior of the gas plume.
The Surmeh formation is known for its low porosity and permeability, making it a challenging reservoir with a permeability of only 1 mD. This limits the maximum achievable injection rate to 7 MMSCFD, while the required injection rate is much higher, at 180 MMSCFD. Due to these limitations, it is important to consider formations with higher porosity and permeability values for efficient gas injection. An ideal scenario would involve a porosity of 12% and permeability of 100 mD, allowing high-flow gas injection without fracturing the formation, which would require two injection wells, each with a capacity of 90 MMSCFD.
In summary, this study utilized available data to model a range of permeabilities (0.1 to 1 mD) and simulated gas injection into the Surmeh formation. The results highlighted the challenges posed by the formation’s low porosity and permeability and emphasized the importance of considering formations with higher porosity and permeability for efficient injection operations.
Author Contributions
Conceptualization, O.F. and A.S.; Methodology, M.C., O.F. and A.S.; Petrel 2015, O.F. and A.S.; Validation, O.F.; Formal analysis, S.J. (Seyedkhashayar Jamali); Investigation, S.J. (Seyedyasin Jamali); Data curation, M.C. and A.S.; Writing—original draft, S.J. (Seyedkhashayar Jamali); Writing—review & editing, S.J. (Seyedyasin Jamali). All authors have read and agreed to the published version of the manuscript.
Funding
This research received no external funding.
Institutional Review Board Statement
Not applicable.
Informed Consent Statement
Not applicable.
Data Availability Statement
Not applicable.
Conflicts of Interest
The authors declare no conflict of interest.
References
- Intergovernmental Panel on Climate. Change Global Warming of 1.5 °C: An IPCC Special Report on the Impacts of Global Warming of 1.5 °C above Pre-Industrial Levels and Related Global Greenhouse Gas Emission Pathways, in the Context of Strengthening the Global Response to the Threat of Climate Change, Sustainable Development, and Efforts to Eradicate Poverty; Intergovernmental Panel on Climate Change: Geneva, Switzerland, 2018. [Google Scholar]
- Ketzer, J.M.; Iglesias, R.S.; Einloft, S. Reducing Greenhouse Gas Emissions with CO2 Capture and Geological Storage. In Handbook of Climate Change Mitigation; Chen, W.-Y., Seiner, J., Suzuki, T., Lackner, M., Eds.; Springer: New York, NY, USA, 2012; pp. 1405–1440. ISBN 978-1-4419-7991-9. [Google Scholar]
- Shu, D.Y.; Deutz, S.; Winter, B.A.; Baumgärtner, N.; Leenders, L.; Bardow, A. The Role of Carbon Capture and Storage to Achieve Net-Zero Energy Systems: Trade-Offs between Economics and the Environment. Renew. Sustain. Energy Rev. 2023, 178, 113246. [Google Scholar] [CrossRef]
- Bachu, S.; Gunter, W. Overview of Acid-Gas Injection Operations in Western Canada. In Greenhouse Gas Control Technologies, Proceedings of the 7th International Conference on Greenhouse Gas Control Technologies 5 September 2004, Vancouver, Canada; Elsevier Science Ltd.: Amsterdam, The Netherlands, 2005. [Google Scholar] [CrossRef]
- Olabi, A.G.; Obaideen, K.; Elsaid, K.; Wilberforce, T.; Sayed, E.T.; Maghrabie, H.M.; Abdelkareem, M.A. Assessment of the Pre-Combustion Carbon Capture Contribution into Sustainable Development Goals SDGs Using Novel Indicators. Renew. Sustain. Energy Rev. 2022, 153, 111710. [Google Scholar] [CrossRef]
- Carroll, J.J. Acid Gas Injection—The Next Generation; Gas Liquids Engineering Ltd.: Calgary, AB, Canada, 2009. [Google Scholar]
- Gale, S.; Heidug, W.; Zarlenga, F. Capter 5—Underground Geological Storage; Cambridge University Press: Cambridge, UK; New York, NY, USA, 2005; pp. 195–265. ISBN 13 978-0-521-86643-9. [Google Scholar]
- Bachu, S.; Haug, K. Chapter 12—In Situ Characteristics of Acid-Gas Injection Operations in the Alberta Basin, Western Canada: Demonstration of CO2 Geological Storage. In Carbon Dioxide Capture for Storage in Deep Geologic Formations; Thomas, D.C., Ed.; Elsevier Science: Amsterdam, The Netherlands, 2005; pp. 867–876. ISBN 978-0-08-044570-0. [Google Scholar]
- Ajayi, T.; Gomes, J.S.; Bera, A. A Review of CO2 Storage in Geological Formations Emphasizing Modeling, Monitoring and Capacity Estimation Approaches. Pet. Sci. 2019, 16, 1028–1063. [Google Scholar] [CrossRef]
- Metz, B.; Davidson, O.; de Coninck, H.; Loos, M.; Meyer, L. IPCC Special Report on Carbon Dioxide Capture and Storage; Cambridge University Press: Cambridge, UK, 2005. [Google Scholar]
- Hatzignatiou, D.G.; Riis, F.; Berenblyum, R.; Hladik, V.; Lojka, R.; Francu, J. Screening and Evaluation of a Saline Aquifer for CO2 Storage: Central Bohemian Basin, Czech Republic. Int. J. Greenh. Gas Control 2011, 5, 1429–1442. [Google Scholar] [CrossRef]
- Ito, T.; Nakajima, T.; Xue, Z. Geological Reservoir Characterization and Modelling of a CO2 Storage Aquifer: A Case Study of the Nagaoka Site, Japan. Energy Procedia 2017, 114, 2792–2798. [Google Scholar] [CrossRef]
- Khatibi, S.; Aghajanpour, A.; Ostadhassan, M.; Farzay, O. Evaluating Single-Parameter Parabolic Failure Criterion in Wellbore Stability Analysis. J. Nat. Gas Sci. Eng. 2018, 50, 166–180. [Google Scholar] [CrossRef]
- Sfidari, E.; Amini, A.; Kadkhodaie-Ilkhchi, A.; Chehrazi, A.; Zamanzadeh, S.M. Depositional Facies, Diagenetic Overprints and Sequence Stratigraphy of the Upper Surmeh Reservoir (Arab Formation) of Offshore Iran. J. Afr. Earth Sci. 2019, 149, 55–71. [Google Scholar] [CrossRef]
- Sun, J. Permeability of Particle Soils under Soil Pressure. Transp. Porous Media 2018, 123, 257–270. [Google Scholar] [CrossRef]
- Morad, S.; Al-Aasm, I.; Nader, F.; Ceriani, A.; Gasparrini, M.; Morad, M.H. GeoArabia 2013. Available online: https://www.researchgate.net/publication/236234811_Morad_et_al_GeoArabia (accessed on 15 September 2023).
- Farzay, O.; Khatibi, S.; Aghajanpour, A.; Shakhouri, A.; Al-Ajmi, A.M. A Numerical Method for Potential Implementation of Underbalanced Drilling in High Pore Pressure Reservoirs. Int. J. Oil Gas Coal Technol. 2022, 30, 283–299. [Google Scholar] [CrossRef]
- Farzay, O.; Shakhouri, A.; Gholami, R.; Al-Ajmi, A.M. Optimum Directional Well Path Design Considering Collapse and Fracture Pressures. Int. J. Oil Gas Coal Technol. 2022, 30, 388–414. [Google Scholar] [CrossRef]
- Khatibi, S.; Ostadhassan, M.; Farzay, O.; Aghajanpour, A. Seismic Driven Geomechanical Studies: A Case Study in an Offshore Gas Field. In ARMA US Rock Mechanics/Geomechanics Symposium; ARMA: Overland Park, KS, USA, 2019; p. ARMA-2019-0093. [Google Scholar]
- Khatibi, S.; Farzay, O.; Aghajanpour, A. A Method to Find Optimum Mud Weight in Zones with No Safe Mud Weight Windows. In ARMA US Rock Mechanics/Geomechanics Symposium; ARMA: Overland Park, KS, USA, 2018; p. ARMA-2018-011. [Google Scholar]
- Shakouri, A.; Farzay, O.; Masihi, M.; Ghazanfari, M.H.; Al-Ajmi, A.M. An Experimental Investigation of Dynamic Elastic Moduli and Acoustic Velocities in Heterogeneous Carbonate Oil Reservoirs. SN Appl. Sci. 2019, 1, 1023. [Google Scholar] [CrossRef]
- Gershenzon, N.I.; Soltanian, M.; Ritzi Jr, R.W.; Dominic, D.F. Influence of Small Scale Heterogeneity on CO2 Trapping Processes in Deep Saline Aquifers. Energy Procedia 2014, 59, 166–173. [Google Scholar] [CrossRef]
- Lu, X.; Kharaghani, A.; Adloo, H.; Tsotsas, E. The Brooks and Corey Capillary Pressure Model Revisited from Pore Network Simulations of Capillarity-Controlled Invasion Percolation Process. Processes 2020, 8, 1318. [Google Scholar] [CrossRef]
- Corey, A.T. The Interrelation between Gas and Oil Relative Permeabilities. Prod. Mon. 1954, 38–41. [Google Scholar]
- Dullien, F.A. Porous Media: Fluid Transport and Pore Structure; Academic Press: Cambridge, MA, USA, 2012; ISBN 0-323-13933-7. [Google Scholar]
- Zhou, X.; Otaibi, F.; Kokal, S. Relative Permeability Characteristics and Wetting Behavior of Supercritical CO2 Displacing Water and Remaining Oil for Carbonate Rocks at Reservoir Conditions. Energy Fuels 2019, 33, 5464–5475. [Google Scholar] [CrossRef]
- Raza, A.; Rezaee, R.; Gholami, R.; Rasouli, V.; Bing, C.H.; Nagarajan, R.; Hamid, M.A. Injectivity and Quantification of Capillary Trapping for CO2 Storage: A Review of Influencing Parameters. J. Nat. Gas Sci. Eng. 2015, 26, 510–517. [Google Scholar] [CrossRef]
- Ren, B. Local Capillary Trapping in Carbon Sequestration: Parametric Study and Implications for Leakage Assessment. Int. J. Greenh. Gas Control 2018, 78, 135–147. [Google Scholar] [CrossRef]
- Ülker, E.B. Investigation of the CO2 Storage Capacity of Aquifer Struktures: CO2 Storage in a Buntsandstein Prototype Aquifer. Doctoral Dissertation, Clausthal University of Technology, Clausthal-Zellerfeld, Germany, 2009. [Google Scholar]
- Eigestad, G.T.; Dahle, H.K.; Hellevang, B.; Riis, F.; Johansen, W.T.; Øian, E. Geological Modeling and Simulation of CO2 Injection in the Johansen Formation. Comput. Geosci. 2009, 13, 435–450. [Google Scholar] [CrossRef]
- Rahimi, N.; Griffin, P.; Eng, P. Potential for Acid Gas Injection at Kharg Island; SOGAT: Doha, Qatar, 2004; p. E6. [Google Scholar]


Disclaimer/Publisher’s Note: The statements, opinions and data contained in all publications are solely those of the individual author(s) and contributor(s) and not of MDPI and/or the editor(s). MDPI and/or the editor(s) disclaim responsibility for any injury to people or property resulting from any ideas, methods, instructions or products referred to in the content. |
© 2023 by the authors. Licensee MDPI, Basel, Switzerland. This article is an open access article distributed under the terms and conditions of the Creative Commons Attribution (CC BY) license (https://creativecommons.org/licenses/by/4.0/).