Article

Analysis of Low-Frequency Communication of Hypersonic Vehicles in Thermodynamic and Chemical Non-Equilibrium State

1
GBA Branch of Aerospace Information Research Institude, Chinese Academy of Sciences, Guangzhou 510700, China
2
Guangdong Provincial Key Laboratory of Terahertz Quantum Electromagnetics, Guangzhou 510700, China
3
Institute of Remote Sensing Satellite, China Academy of Space Technology (CAST), Beijing 100094, China
*
Author to whom correspondence should be addressed.
Appl. Sci. 2023, 13(19), 10815; https://doi.org/10.3390/app131910815
Submission received: 20 June 2023 / Revised: 26 September 2023 / Accepted: 27 September 2023 / Published: 28 September 2023
(This article belongs to the Section Electrical, Electronics and Communications Engineering)

Abstract

:
A plasma sheath will be developed surrounding a hypersonic vehicle in flight, which can reflect, absorb, and scatter electromagnetic (EM) waves of lower frequencies than its own, resulting in a communication blackout. This paper focuses on knowing how to limit the absorption and reflection of low-frequency EM waves by plasma sheath in a thermodynamic and chemical non-equilibrium state. According to the temperature increment model, the energy of high-power microwave (HPM) irradiation is translated into the temperature increment of heavy particles in plasma. As a result of this modification process, the transmittance of low-frequency EM waves going through the plasma sheath in a certain time frame rises, potentially easing the communication blackout problem.

1. Introduction

When a vehicle flies in near space at hypersonic speed, a shock layer will be formed at the head of the vehicle. Due to the shock layer’s extremely high temperature, air passing through it undergoes a dissociation and ionization process, resulting in the formation of plasma in the head region of the vehicle. As the vehicle continues to move forward, the plasma in the head region continuously gathers and flows towards the middle and tail of the vehicle, forming a layer of plasma that envelops the vehicle. This plasma sheath is generated by the high-temperature real gas effect [1] and belongs to the quasi-neutral plasma sheath [2]. According to the EM properties of the plasma, EM waves below this frequency can be reflected, absorbed, and scattered by the plasma sheath, causing the attenuation or even interruption of the communication signal, forming a so-called communication “blackout” [3,4,5].
During the flight of hypersonic vehicles, due to the change of speed and the difference of altitude, the air around the vehicle will be in a thermodynamic equilibrium and chemical non-equilibrium state, or a thermodynamic and chemical non-equilibrium state [1,6,7]. Because of the existence of these two thermodynamic states, the fluid distribution around the vehicle is different. For example, the high-temperature air model and the hybrid structure based on the graphic processing unit are used to simulate the flow field around the hypersonic vehicle as studied in [8]. The computational fluid dynamics (CFD) benchmark problem is used to verify the mathematical model and the calculation algorithm, and the results of hypersonic fluid flow efficiency on the graphic processing unit are given. The thermal and chemical non-equilibrium effects on the flow structure and the performance of the hypersonic internal turning inlet passage of the air-breathing scramjet at Mach 12 were studied by the numerical method in ref. [9]. The results show that the thermochemical non-equilibrium effect of the Mach 12 inlet is significant under the condition of an adiabatic wall. Reference [10] developed a domestic parallel solver for hypersonic thermochemical non-equilibrium flow with the Reynolds-averaged Navier–Stokes (N-S) turbulence model. Using this solver, it is found that the combined effect of turbulence and thermochemical non-equilibrium has a significant impact on the flow field organization, wall data, and separation length of the shock/boundary layer interaction. The influence of the high-temperature effect on the motion characteristics of hypersonic vehicles was studied in ref. [11]. Using numerical methods, hypersonic fluids were numerically simulated under the consideration of the high-temperature effect and non-equilibrium chemical reaction. The numerical results of flow momentum distribution and separation distance in the shock layer at different free-flow Mach numbers are given in the literature.
The communication problem of the hypersonic vehicle during flight is essentially the interaction between EM waves and plasma. In particular, the plasma produced by hypersonic vehicles is also in these two thermodynamic states, which have a very direct impact on the propagation between plasma and EM waves. The interaction between them, including the flow field, thermal field, and EM field, is a comprehensive problem of multi-physical field coupling. However, there are few works about how the thermodynamic state affects the propagation of EM waves in the plasma.
Moreover, for multi-physics field coupled numerical computation, the huge numerical simulation computation is a difficult problem for daily solutions. In electromagnetic numerical computation, meta-structures can be utilized to bring a new twist to the computation of electromagnetic waves in the spatial domain [12]. Refer to [13] for computational complexity. The material structure of surface coatings for hypersonic vehicles is also one of the issues that need to be addressed. Metamaterials present an extremely advantageous side as currently focused materials [14,15]. Vehicles require sensors for detection during flight, and the study by [16] proposes a sensing structure for technological waveguide channels. Its sensors are able to detect changes in dielectric constant, refractive index, or position. The special properties of plasmas are also one of the problems studied by hypersonic vehicles, whose anisotropies play a key role in the realization and characterization of metamaterial components [17].
To explore how to alleviate the blackout problem, analyzing the changes among the particles in the plasma is also an effective method. It is noteworthy that HPM, as an energy source, can go deep into the interior of some substances and interact with molecules and atoms. However, few investigations have been conducted on the interaction of HPM with plasma. One of the studies on its internal connection is the study by [18], which provided a multi-physics coupling model. Using this coupling model, the energy of the HPM absorbed by the plasma can be transferred to the N-S equations’ energy conservation equation. Despite the fact that [18] proposes a coupling model for the flow field and EM field, the results reveal that once the plasma absorbs HPM’s energy, more atoms absorb the energy and ionize. This increases the electron density of the plasma as a whole, resulting in a more serious blackout phenomenon [18,19].
It is exciting that [20] found a way to alleviate the blackout in studying the interaction between the HPM and the plasma. The authors of [20] proposed a multi-physics coupling model called the temperature increment model. As a coupling model of the flow field and EM field, this model directly converts the energy of the HPM absorbed by the plasma into an increase in the temperature of the internal heavy particles. We know that the fluid parameters in the hypersonic flow field are a function of temperature, except for velocity. Temperature will have a more direct and efficient effect on fluid characteristics as a result. What is more, an in-depth examination of the temperature increment model revealed that under continuous HPM irradiation, the transmittance of plasma to low-frequency EM waves is dramatically increased in a certain time. This suggested a means to improve hypersonic vehicles’ low-frequency communication.
However, the temperature increment model proposed in ref. [20] is only applicable to the situation that the plasma sheath is in thermodynamic equilibrium and chemical non-equilibrium. Moreover, both the flow and EM fields are only deduced in 2-D space, so the research is not comprehensive. This paper not only expands the 2-D space model to 3-D space but also explores the effect of HPM on the capacity of low-frequency EM waves to enter plasma in a thermodynamic non-equilibrium and chemical non-equilibrium condition, providing a comprehensive model on the interaction between the HPM and the plasma generated by the hypersonic vehicles.
Our investigation follows the steps shown in Figure 1. Firstly, the plasma sheath created by a hypersonic vehicle during flight is simulated using the CFD approach, and its state is in thermodynamic and chemical non-equilibrium [6,21,22]. Secondly, using the temperature increment model as the basic principle, we deduce and simulate the interaction between the plasma sheath and the HPM. Thirdly, according to the ADE-FDTD algorithm [23,24,25], the transmission and reflection of the plasma sheath for low-frequency EM waves are simulated under the irradiation of the HPM.

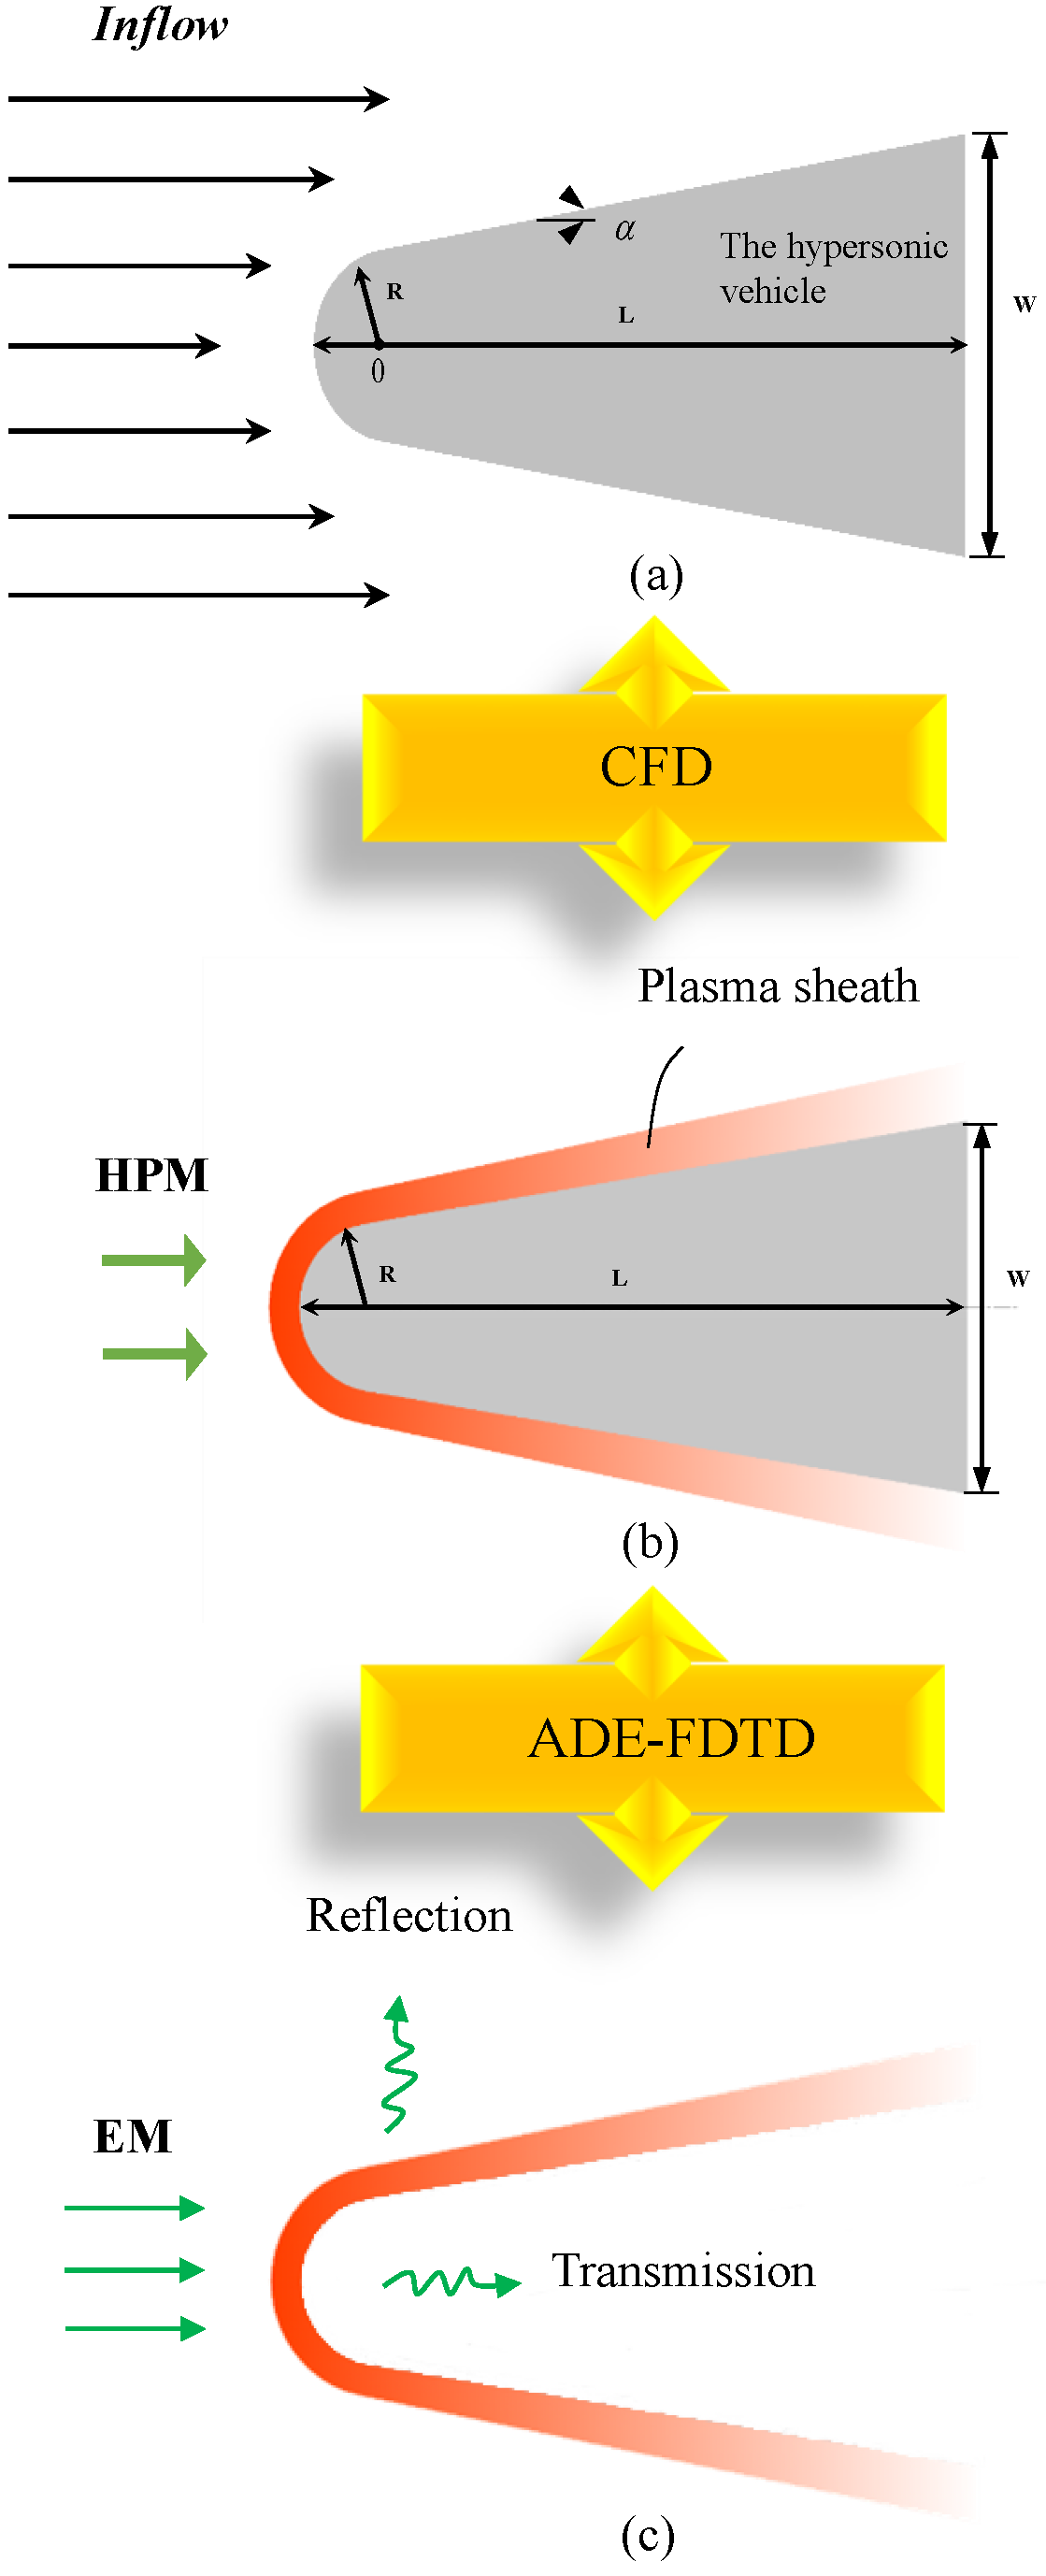
2. Simulation of Plasma Sheath Fluid Model

The study of low-frequency communication issues in hypersonic vehicle essentially involves a qualitative analysis of the characteristics of the plasma sheath. Therefore, the thickness, the concentration of the plasma sheath (related to the flight altitude of the vehicle), and the location of the plasma sheath on the vehicle should be the key factors to consider. Due to the restrictions of the shock layer, the vehicle does not generate a very thick plasma sheath, so thickness is not the key factor we need to consider. However, the flight altitude of the vehicle has a significant impact on the plasma concentration [26]. When the hypersonic vehicle is flying above 70 km altitude, the air density reduces the collision frequency between the gas elements and increases the motion time of the air molecules. These processes cause thermodynamic energy change processes such as advection, rotation, vibration, and electron excitation of the gas molecules to lag behind their respective equilibrium states; therefore, they must undergo a thermodynamic non-equilibrium process. As the altitude decreases, e.g., below 70 km, the collision frequency between the gases increases because of the increased density of the air; the motion time of the air molecules decreases, and all the internal energy modes of the gas elements are in equilibrium with the advection modes of the heavy particles, which are in a state of thermodynamic equilibrium [27,28,29]. The EM properties of plasma sheath in thermodynamic equilibrium and chemical non-equilibrium have been studied and discussed in ref. [20]. As a consequence, when the plasma sheath is in thermodynamic and chemical non-equilibrium, this work focuses on the EM characteristics after the contact between the plasma sheath and the HPM.
Regarding the consideration of plasma concentration at different positions of the vehicle, according to the principle of plasma sheath formation, the plasma concentration is highest in the head region of the vehicle and lowest in the tail region. This article mainly focuses on studying the area with the highest plasma concentration on the vehicle. If low-frequency communication is significantly improved in the area with the highest plasma concentration, it will also have a good effect in other areas of the vehicle.

2.1. Fluid Dynamics Model

We carry out a numerical simulation with the basic RAM-C II model in this research to investigate the interaction of EM waves with the hypersonic vehicle under HPM irradiation. In 1960, the National Aeronautics and Space Administration (NASA) embarked on a research effort to investigate the subject of communication blackout, and the RAM-C II was the vehicle. The RAM-C II model’s construction is shown in Figure 1a. The head of the RAM-C II model is a nose cap with a radius of R = 0.15 m, a half-angle of α = 9 deg, a cone length of L = 1.275 m, and a tail width of W = 0.67 m.
The flight status of the vehicle in this paper is a flight test at 71 km altitude [30], the speed of the vehicle is 7650 m/s, the surrounding area temperature is 216 K, the pressure is 4.764 Pa, and the air density is 7.68 × 10 5 kg/m 3 . The wall temperature of the vehicle is 1500 K, and it is considered to be a non-catalytic wall. In addition, the free flow air is composed of 79% N 2 and 21% O 2 . To solve the N-S equations, the finite volume method (FVM) is utilized [21,31], which is based on the fundamental condition of physical quantity conservation and creates the discrete equation by discretizing the finite sub-region in fluid motion with integral discretization.
This paper adopts the chemical kinetic model of the 7-component (O 2 , N 2 , O, N, NO, NO + , and e ), 7-reaction model proposed by Gupta [26]. In 1990, Gupta proposed an 11-component, 20-reaction model for chemical reactions in air. Among them, at lower Mach numbers (Ma < 9), less ionization occurs in the air, and the ion content is negligible when only a 5-component (O 2 , N 2 , O, N, NO) model needs to be considered. When in a hypersonic non-equilibrium flow, the high-temperature environment around the vehicle causes the air molecules internal energy excitation and ionization reaction. At this time, the chemical reaction model of the 7-component or 11-component model (O 2 , N 2 , O, N, NO, O 2 + , N 2 + , O + , N + , NO + , e ) should be selected.
According to the actual simulation results and the calculation results in refs. [18,32], the results of the electron density calculated by using the chemical model with the 7-component model are in good agreement with the NASA experimental data. Therefore, the 7-component chemical model is used to simulate the fluid of the plasma sheath with the RAM-C II model in this paper. Since the flight environment simulated is a thermodynamic and chemical non-equilibrium state, in the thermodynamic non-equilibrium state, the dual temperature model is used. The non-equilibrium states of molecular advection, rotation, and vibration are included in the dual-temperature model, so this article will not consider them separately.

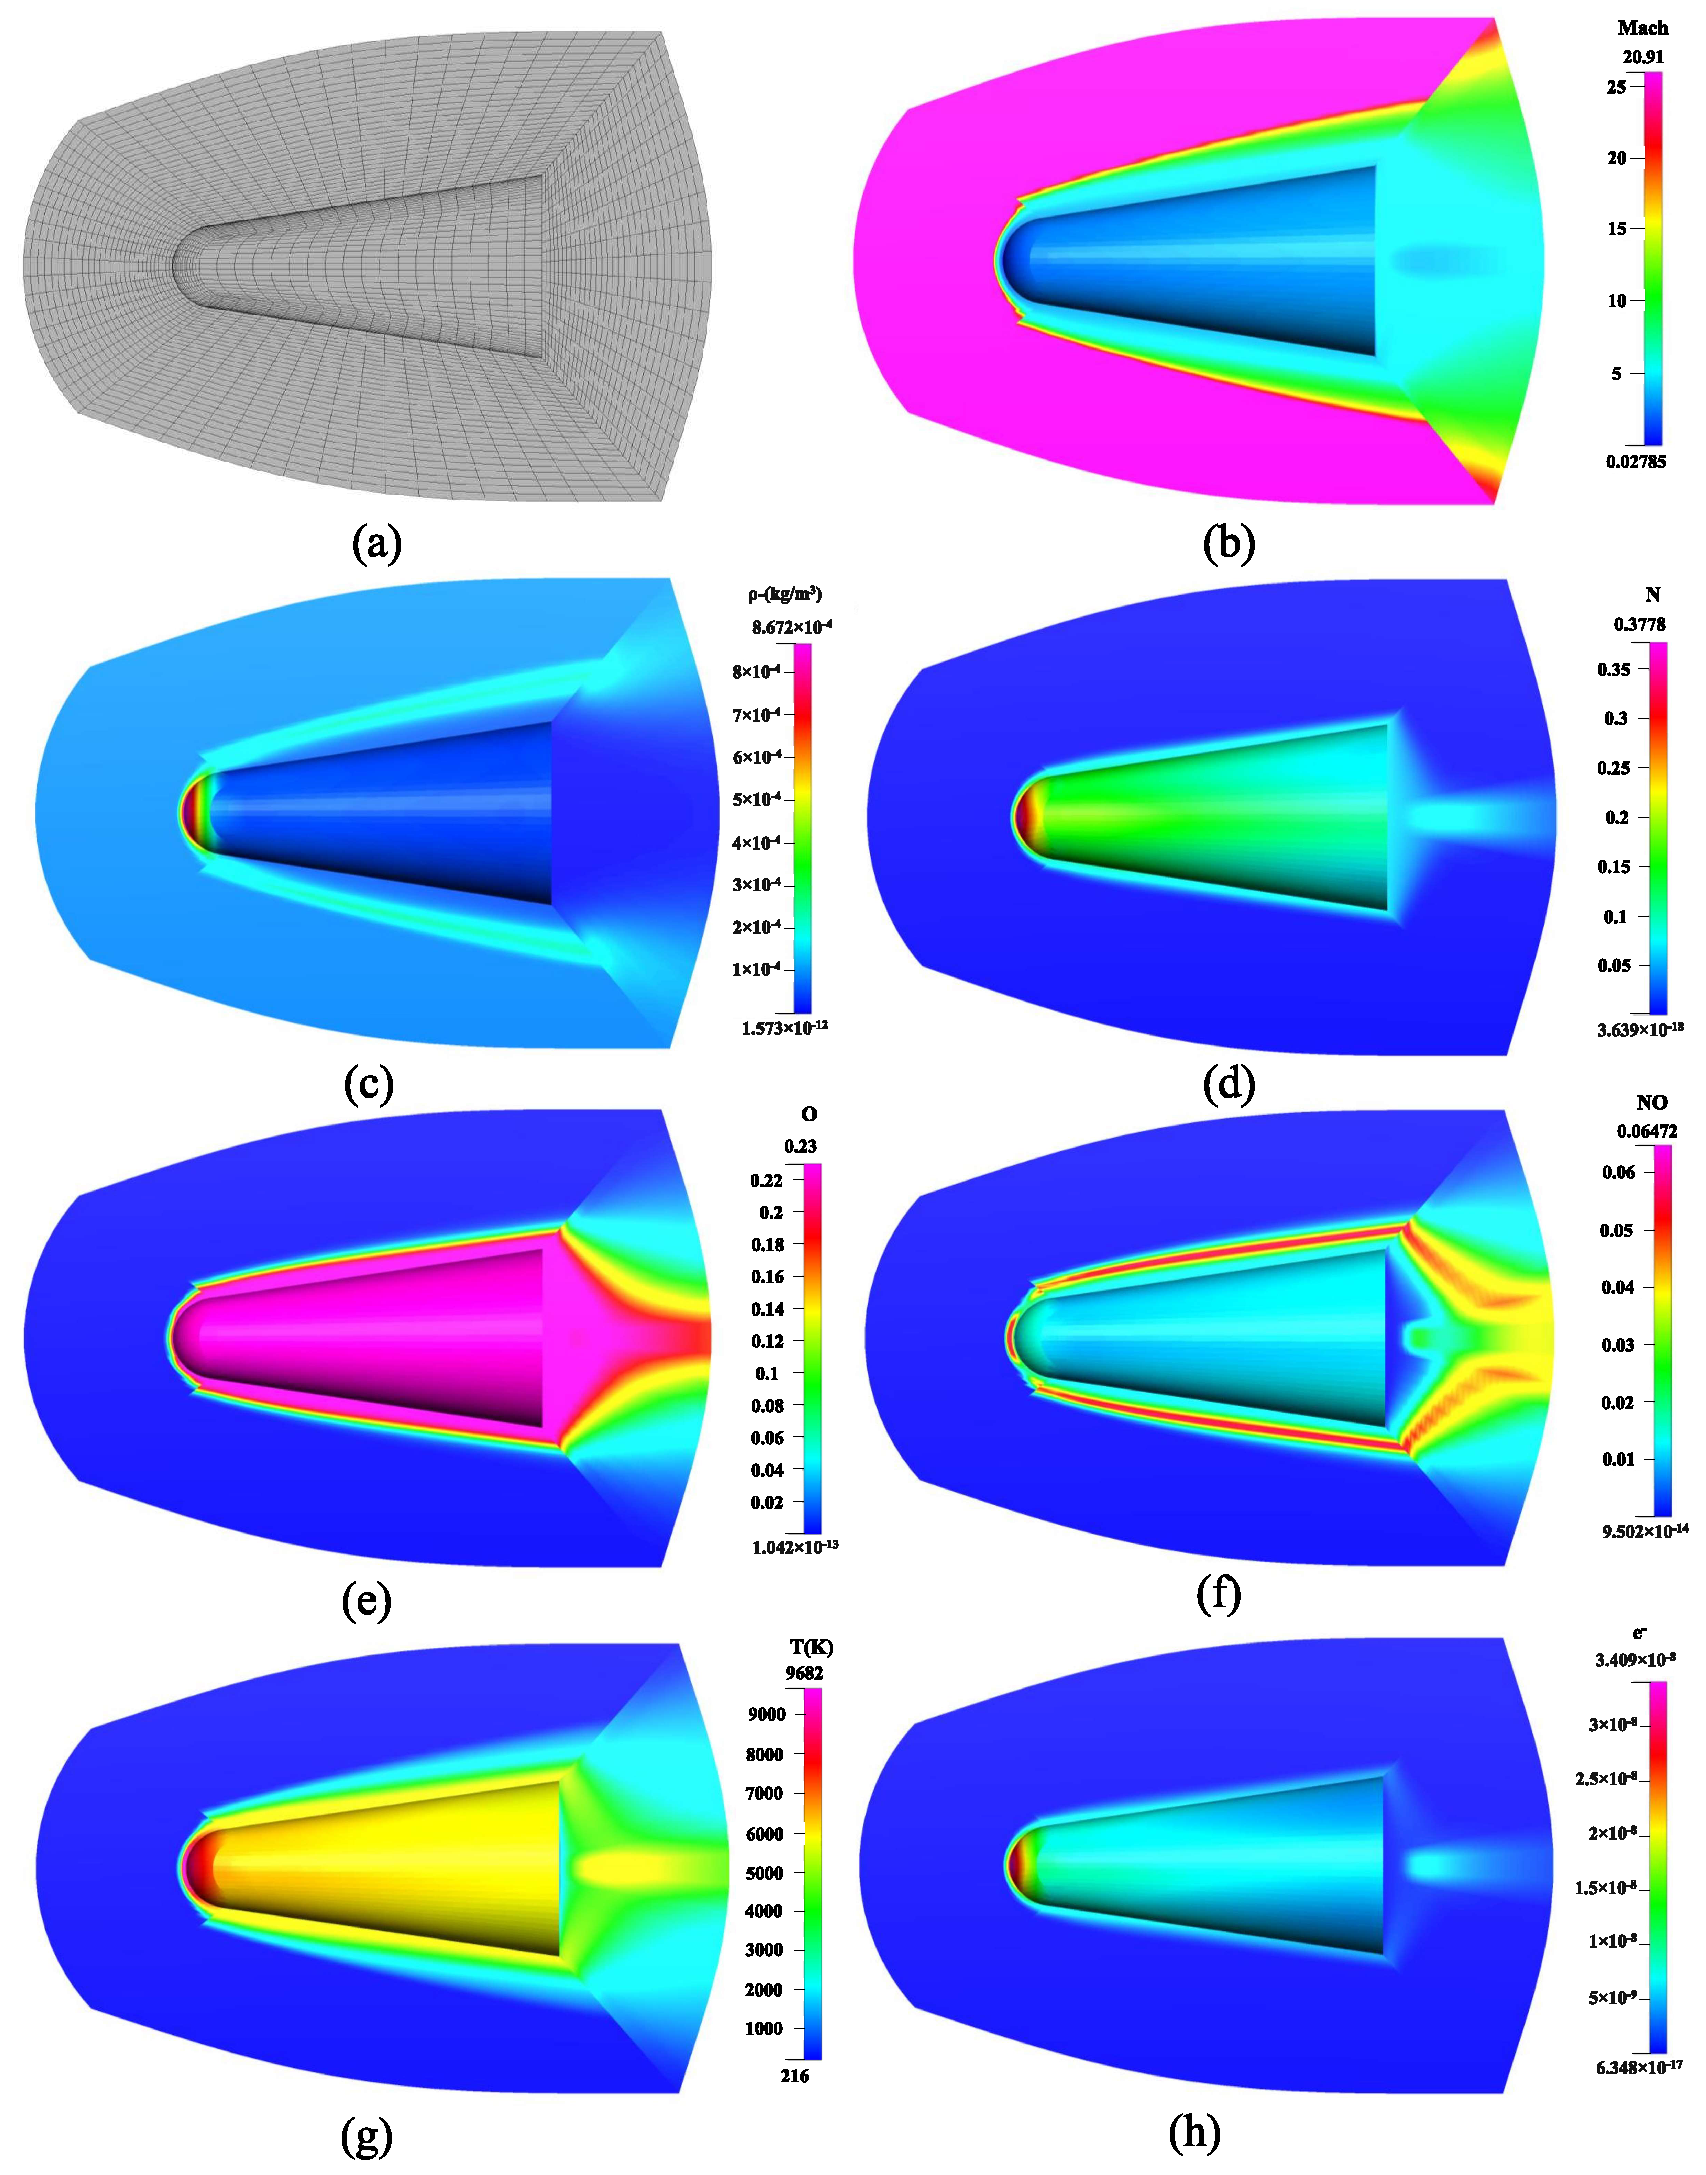
2.2. Numerical Simulation Results

In the fluid domain setup, the fluid domain space around the vehicle is appropriately enlarged with the aim of minimizing external disturbances during simulation calculations. The fluid domain around the vehicle is set up using the O-Block setup scheme, and the mesh is a structured advective mesh with 22 final setup regions; 98,123 total meshes; and 117,000 total nodes. For hypersonic fluid calculations, structured meshes give more accurate simulation results. During the flow process, there is a large gradient in the flow field area on the aircraft wall. In order to better capture the physical characteristics of the flow, the mesh points must fall into the actual boundary layer, and the mesh on the boundary layer should be encrypted. In this paper, exponential encryption of the vehicle wall along the flow direction is used for the 3D model, and since the head of the vehicle is the region where the shock waves are generated, it should also be encrypted with a mesh.
For the numerical method of fluid mesh space, the Roe approximate Riemannian solution method is set. For mixing/chemical reactions, only the Roe format is currently available. During the solving process, the displayed format has less dissipation than the implicit format for time accuracy issues. Therefore, this simulation uses the multi-step Runge–Kutta format to solve the discrete equation. During the iterative calculation process, convergence of the calculation occurs when the residual values of each physical variable have reached the convergence criteria. Furthermore, the CFD time step should be chosen in accordance with the CFL condition (Courant Friedrichs Lewy) [21]. The convergence criterion set for this simulation experiment is that the simulation calculation can be considered to converge when the residual values of all the variables are reduced to less than 10 6 . Figure 2 contains the mesh distribution of the vehicle and the surrounding area, as well as a cloud view of the distribution of each fluid parameter.
To verify the correctness of the calculation results, the calculation results of the peak electron number density of the flow field along the blunt cone streamline direction of the vehicle are compared with those in ref. [30]. As shown in Figure 3, it can be seen that the simulation results are in good agreement with [30].

3. Interaction between Plasma Sheath and HPM

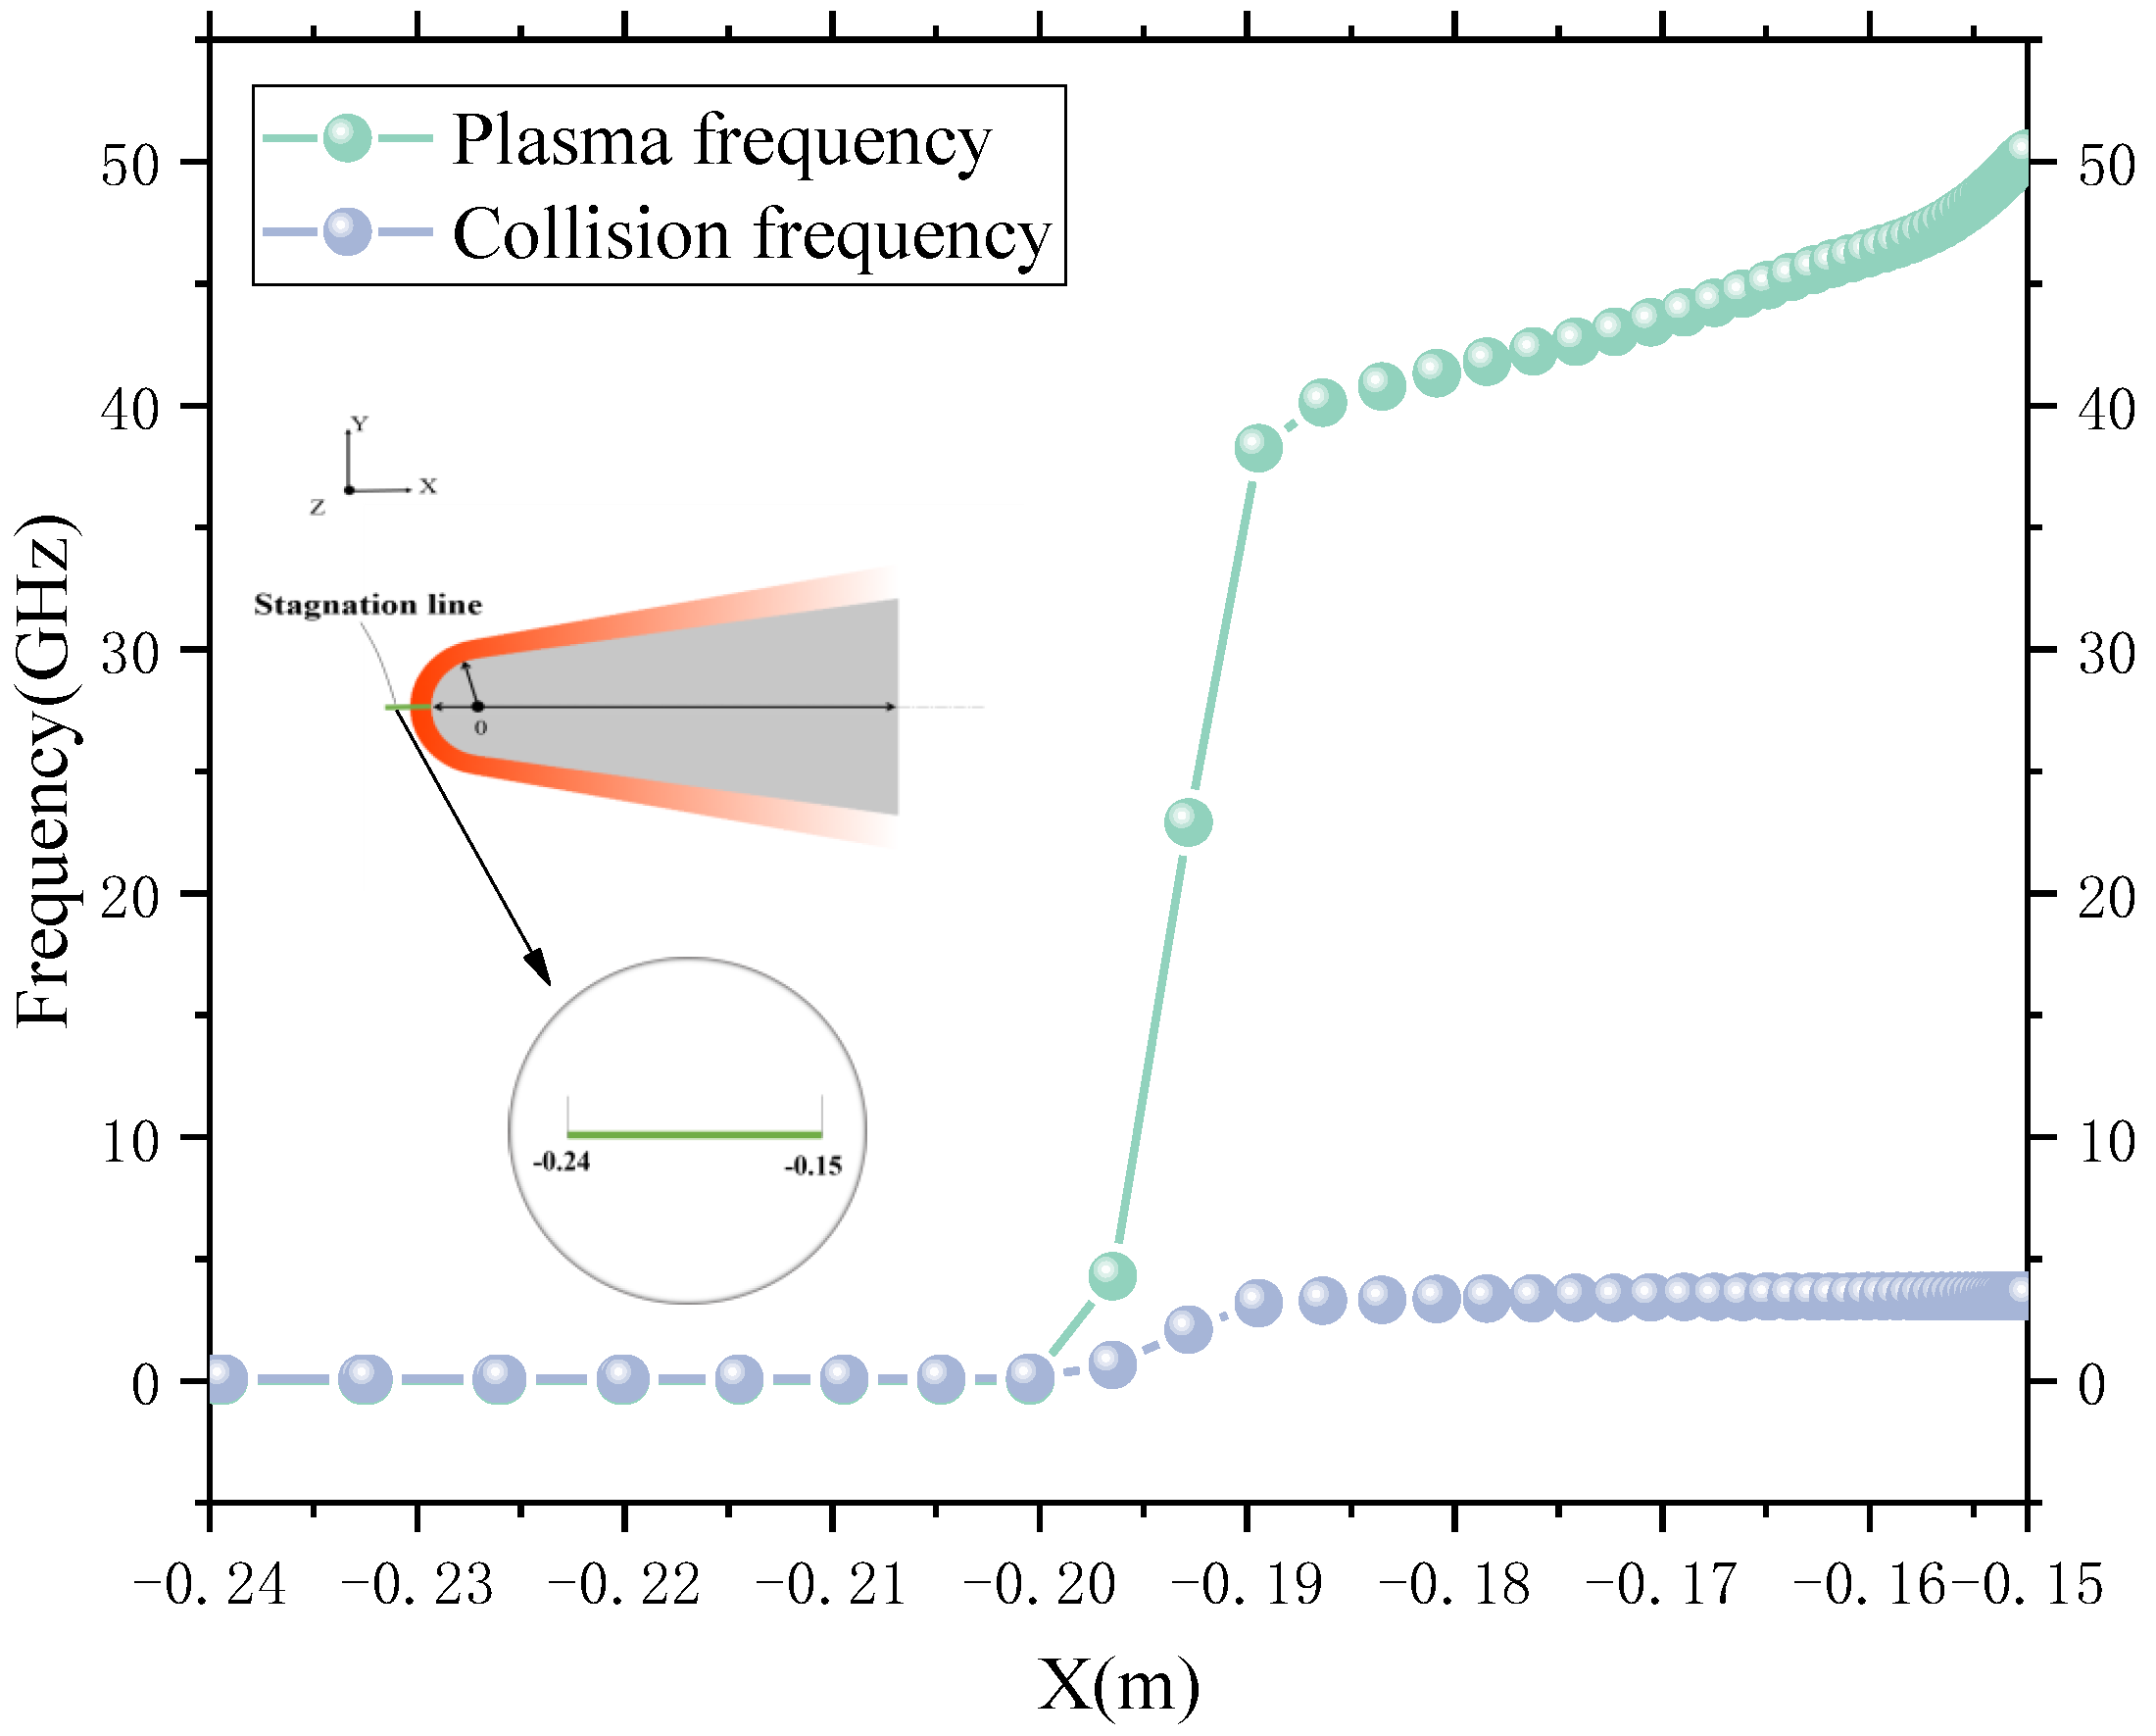
3.1. The EM Properties of Plasma Sheath

The fluid parameters are obtained through the CFD simulation calculation, which can be converted and calculated to produce the electron density n e and the neutral particle density n m . The formulas are
n e = 6.02 × 10 23 ρ Y 7 M 7 ,
n m = 6.02 × 10 23 s = 1 5 ρ Y s M s ,
where ρ is the plasma density, M s is the relative atomic mass of component s (N 2 , O 2 , N, O, NO, NO + , and e ), and Y s is the mass fraction of component s.
After obtaining the neutral particle density n m , the electron density n e , and the electron temperature T e , the EM parameters of plasma [33] can be established: plasma frequency ω p and the collision frequency υ c [18].
ω p = e 2 n e ε 0 m e ,
υ c = 6.3 × 10 15 n m T e 300 ,
where e is electron charge, ε 0 is the dielectric constant of vacuum, and m e is the electron mass.
In EM simulation calculations, the computational EM algorithm uses ADE-FDTD [23,24,25]. On the one hand, ADE-FDTD can be used to observe the propagation of EM waves in plasma over a wide frequency range. The polarization current, on the other hand, can be utilized to finish the conversion from plasma absorption energy to temperature increase when using ADE-FDTD to compute the polarization current of intermediate variables in the propagation process of EM waves.
In the ADE-FDTD algorithm, the polarization current is described as
J n + 1 = 2 υ c t 2 + υ c t J n + ε 0 ω p 2 t 2 + υ c t ( E n + 1 + E n ) .
It is known that the relationship between the polarization current and the electric field is
J = ε 0 ω p 2 j ω + υ c E = ( υ c j ω ) ε 0 ω p 2 υ c 2 + ω 2 E .
The ADE-FDTD algorithm must satisfy a certain relationship between both temporal and spatial accuracy in terms of numerical stability; otherwise, it will make the calculated values unstable. This is manifested by an infinite increase in the value of the calculated field quantity as the number of calculation steps increases. This increase is not due to the accumulation of errors but to the disruption of the propagation relations of the EM waves. The following conditions must be satisfied for computational space and time for non-uniform media compositions:
Δ s Δ x , Δ y , Δ z λ 12 ,
Δ t μ ε 1 Δ x 2 + 1 Δ y 2 + 1 Δ z 2 .
Depending on the size of the CFD computational fluid domain, the FDTD region was set at 2.5 m, 1.8 m, and 1.8 m in the X, Y, and Z directions, respectively. The FDTD mesh size is set to Δ x = Δ y = Δ z = 1.5 × 10 3 m , which is 1/20th of the wavelength of a 10 GHz frequency EM wave traveling in free space. The overall FDTD mesh quantity is 1670 × 1200 × 1200. According to the CFL stability condition, the minimum time step of FDTD is set as Δ t F D T D = 2.5 × 10 12 s .
In the process of EM field simulation and flow field simulation, the data of CFD mesh nodes and FDTD mesh nodes can be known by calculating N-S equations and Maxwell equations. According to the comparison between the fluid and the EM mesh, we can know that computational fluid mesh is much larger than computational EM mesh, so each computational fluid mesh contains many computational EM meshes. When the node data of the plasma sheath are transferred to the computational EM mesh, the computational fluid mesh node data are allocated to the computational EM mesh nodes contained in the mesh to complete the data transmission of multi-physics coupling.
According to the vehicle model shown in Figure 1a, the circular center of the vehicle nose cap is taken as the origin of the x-axis. On the stagnation line [30], the distribution graph of plasma frequency and collision frequency is presented in Figure 4.
As the frequency of EM waves exceeds that of the plasma, EM waves can travel through the plasma without being obstructed, according to plasma characteristics. The EM waves are reflected and absorbed by the plasma when their frequency is lower than that of the plasma. When the EM waves’ frequency approaches that of the plasma, the plasma absorbs the EM waves to the greatest extent possible [18,20].
By irradiating the plasma sheath with EM waves in the 0.1–100 GHz frequency range, the plasma sheath transmission, reflection, and absorption are investigated. As shown in Figure 5, it can be seen that the characteristic frequency of the plasma sheath in this example is about 24 GHz, and the absorption of the plasma sheath near this frequency reaches the maximum. As the frequency of EM waves increases, the plasma’s transmittance gradually increases, and the absorptivity gradually decreases.

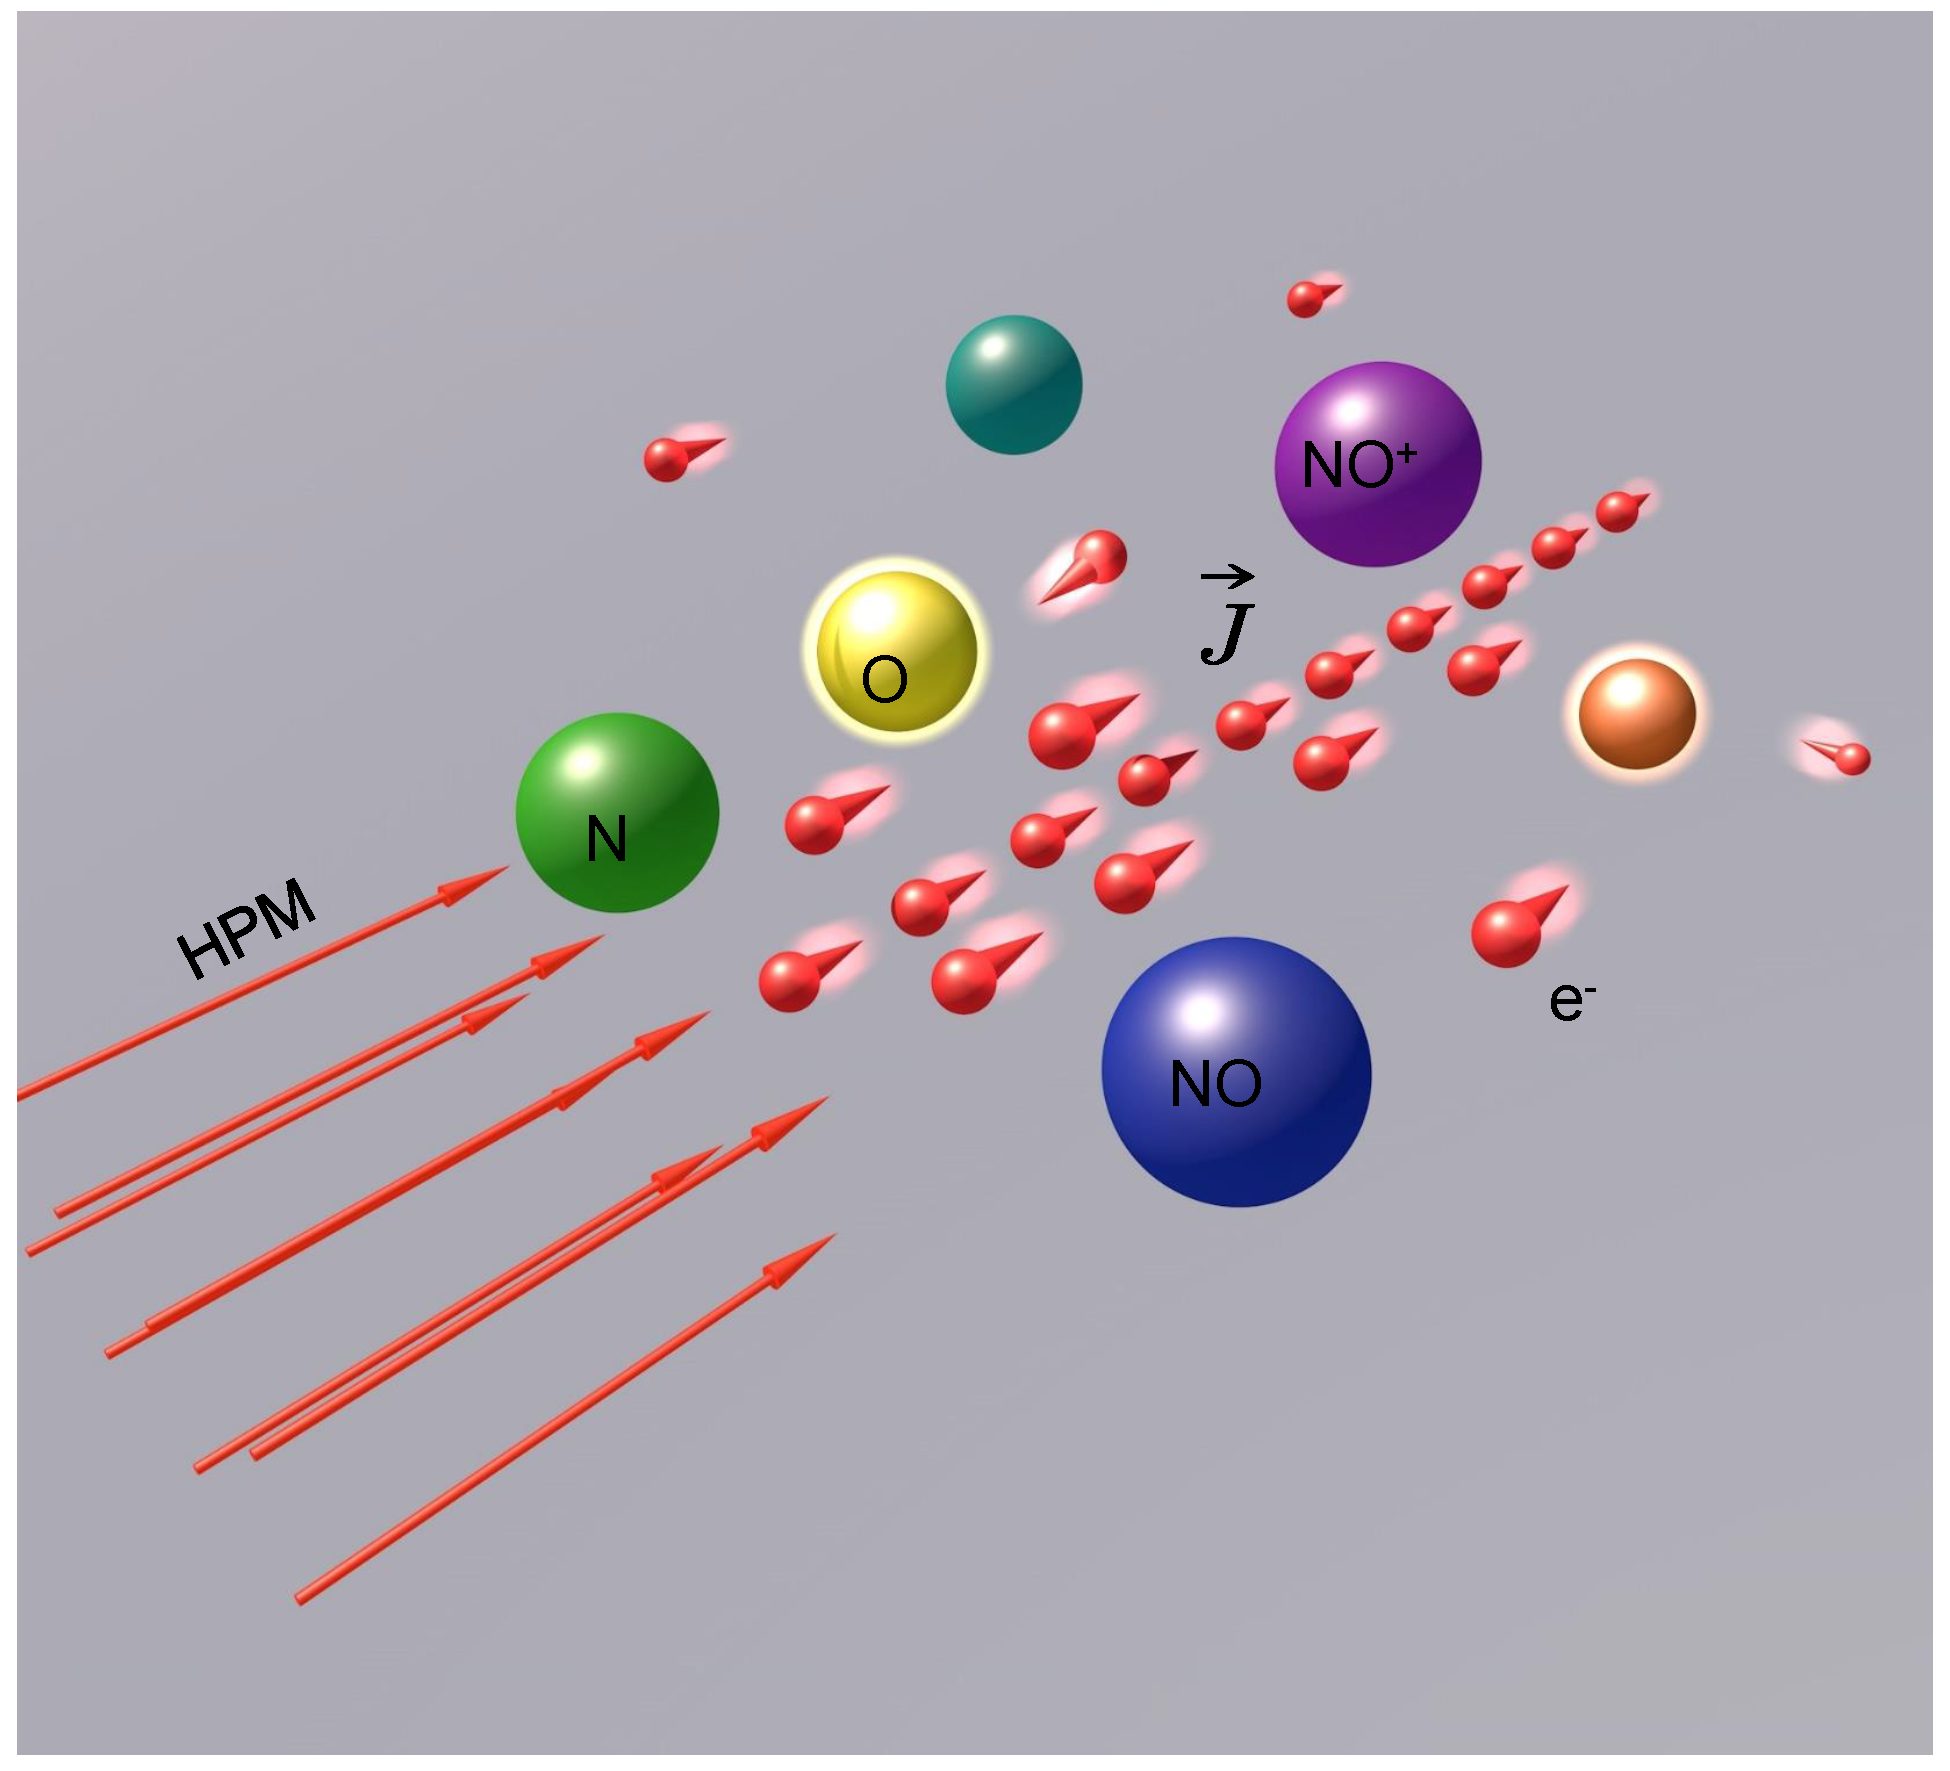
3.2. Particle Model in Thermodynamic Non-Equilibrium State

Because the masses of electrons, ions, and neutral particles are so dissimilar in the HPM irradiating plasma process, the electric field force has a limited driving impact on heavier particles in comparison to electrons. As a result, it is safe to infer that the electric field forces only affect the electrons but not the heavier particles. In other words, the velocity of heavy particles remains unaltered due to the impact of the electric field force, but electrons accelerate and collide with heavy particles continuously for energy exchange, resulting in a rise in the internal energy and temperature of heavy particles.
The electrons in the plasma travel under the influence of an electric field in a directed motion, according to Joule’s law, and the electric field does work on the electron motion. The electron accelerates initially as a result of the electric field and then collides with the surrounding heavier particles as a result of the collision, resulting in the formation of a polarization current at a specific speed. The electrons transmit kinetic energy to heavy particles, causing the internal energy of the heavy particles to increase. As previously stated, Figure 6 depicts the particle motion law under the HPM.
The polarization current value at each time step can be computed using the iterative ADE-FDTD algorithm. The Joule power of the plasma is the product of the polarization current and the electric field value of the plasma, and the Joule power at this time represents the energy that the plasma absorbs from the HPM. The following is the formula:
Q e m = J · E .
The polarization current value excited at each time step can be determined using the ADE-FDTD technique to mimic the propagation of EM waves in the plasma [34,35,36,37,38,39,40,41,42]. There is current flow in the weakly ionized plasma when it is exposed to an external electric field. The effect of ions’ mobility on the electrical characteristics of plasma can be overlooked. As a result, the principal source of internal current is electrons moving in a specific direction.
The plasma’s polarization current can be written as
J = e n e v e ,
where e is the electron charge, n e is the electron density, and v e is the electron velocity.
The electron velocity v e creating the polarization current J is derived by incorporating the ADE-FDTD algorithm into (10). It can be observed from (6) of the ADE-FDTD to compute the polarization current, and when particle collisions are taken into account, the polarization current emerges. As a consequence, the polarization current’s electron velocity v e is the velocity following an electron collision. The total amount of energy received by plasma, comprising the kinetic energy following electron impact and the increase in a particle’s internal energy, is computed by (9) as plasma absorption energy Q e m .
As an outcome, a rise in the internal energy of a particle equals the plasma absorbed energy Q e m minus the electron’s kinetic energy 1 2 ρ v e 2 at this time. The ADE-FDTD determines the energy absorbed by an electron Q e m as well as its kinetic energy 1 2 ρ v e 2 . We can calculate the increase in the particle’s internal energy.
According to the control unit’s energy conservation law, total energy E per unit volume equals the sum of internal and kinetic energy stated as
E = ρ [ e + 1 2 ( u 2 + v 2 + w 2 ) ] ,
where ρ is the density per unit volume; e is the internal energy per unit volume; and u, v, and w are the velocity of the particle in the x, y, and z directions, respectively.
The internal energy per unit volume is expressed as
e = e t r + e r + e v + e e 1 + e 0 ,
where e t r is the translational energy, e r is the rotational energy, e v is the vibrational energy, e e 1 is the electron excitation energy, and the formation energy is e 0 .
There are four modes of gas components in the state of the thermodynamic system: the translational mode, rotational mode, vibrational mode, and electronic mode [43]. Only the translational and rotational energy of gas molecules are activated in the thermodynamic equilibrium state; hence, the aforementioned four energy modes can be characterized by temperature. In the thermodynamic non-equilibrium state, the translational energy, rotational energy, vibrational energy, and electronic energy are excited successively. Therefore, a single temperature can no longer accurately reflect the change of intramolecular energy.
In ref. [43], Park proposed a dual temperature model. That is, the translational temperature and the rotational temperature of molecules can be described by temperature T, and the vibration temperature of molecules and the electron excitation temperature is defined by another temperature T v . The model can describe the basic properties of the thermodynamic non-equilibrium state well.
When studying thermochemical non-equilibrium relaxation at the molecular level, it should be emphasized that molecular vibrational energy and electron excitation have a far longer relaxation period than chemical reactions, while the relaxation time of molecular translational energy and rotational kinetic energy is much shorter [7,44]. Therefore, the vibration energy and electron excitation energy can be frozen when computing the electrical properties of the flow field, leaving only the temperature of molecular translational energy and rotational kinetic energy to consider. Thermodynamics, in other words, can be said to be in equilibrium.
The internal particle’s energy in the system of thermodynamic equilibrium follows the Maxwell–Boltzmann distribution [45,46]. The energy per unit mass component s can be represented as
e s = T r e f T c v s d T + e s 0 ,
where c v s is the heat capacities at constant volume of component s and e s 0 is the formation energy of component s at reference temperature T r e f . The formation energy of dissociated ionized air components can be found in [46], which is not listed here.
The gas component s’s translational energy is
e t r s = 3 2 R T M s , c o m p o n e n t s i s a t o m ,
e t r s = 5 2 R T M s , c o m p o n e n t s i s m o l e c u l e .
The rotational energy of the gas component s is
e r s = R T M s , c o m p o n e n t s i s m o l e c u l e .
According to (13)–(16), the rise in heavy particles’ internal energy may be calculated using the translational and rotational modes of gas components, and the temperature T affects the rise of internal energy. As a corollary, the temperature increase Δ T after the plasma absorbs HPM radiation may be estimated. The model of temperature increase is the result of the above processes for calculating the temperature increment Δ T of heavy particles.

4. Simulation of Low-Frequency Communication in Plasma Sheath

4.1. Temperature Increment Model

The change in particle temperature has a direct impact on the collision frequency for the plasma EM parameters. As a consequence, the impact of changing collision frequency on plasma EM characteristics is an important concern. Firstly, the polarization current J is proportional to the frequency of collision frequency υ c and plasma frequency ω p , as seen in the iterative diagram of Figure 7. Furthermore, the energy Q e m of the plasma absorption from the HPM can be obtained from the polarization current J . Secondly, the temperature increment model can convert the energy Q e m into the particle temperature increment Δ T Thirdly, the temperature increase Δ T has a direct impact on the collision frequency. Finally, the collision frequency is a polarization current parameter that has a direct impact on the plasma’s EM characteristics. Because the plasma sheath continues to be irradiated by the HPM, the EM properties of the plasma are constantly changing.
In the above process, it can be seen that the increment of temperature directly affects the collision frequency. However, the plasma fluid is constantly changing, and the temperature increment will also affect other fluid parameters, so the plasma frequency will also change as time goes by. When the EM parameters of two plasmas change simultaneously, it is difficult to clarify the effect of a single parameter. Therefore, we want to find a special period in which only the collision frequency changes while the plasma frequency remains unchanged.
Fortunately, we found a time window to ensure that only the collision frequency changed and the plasma frequency remained unchanged. We know that the state of the plasma is chemical non-equilibrium. In this state, D a 1 . D a is known as the Damkohler number [7], and it is written as
D a = τ f / τ c ,
where τ f is the flow’s characteristic duration (the flow field’s characteristic length divided by the flying speed, l / V ). τ c is the time it takes for a chemical reaction to take place.
The RAM-C II model’s major dimension is 1.295 m, and the speed of flight is 7650 m/s, as shown in Figure 1a. Therefore, the characteristic time of the flow field is determined as
τ f = l / V = 1.295 / 7650 = 1.69 × 10 4 s .
As a result of D a 1 , a chemical process’ characteristic time may be estimated using the characteristic time of a fluid. Chemical reactions in the area of flow have a typical duration of roughly 1.69 × 10 4 s.
The HPM has high frequency, short pulse, and high power, and it is an essential form of strong EM pulse. The maximum pulse width of the HPM added in this paper is 100 ns, the characteristic electrical time is calculated as 1.0 × 10 7 s, and the chemical reaction characteristic time is about 1000 times that of the characteristic electrical time. Therefore, the parameters in the fluid are almost static when we calculate the flow field’s electrical properties. This creates a distinct time window, which is the typical duration of a fluid’s chemical reaction. During the characteristic time of the fluid’s chemical reaction, the internal parameters of the flow field do not change. The internal temperature of the flow field increases instantly with the addition of HPM, according to the temperature increment model. The collision frequency of plasma υ c increases instantaneously, but the plasma frequency remains unchanged.
Plasma is a medium that disperses [47] its dielectric loss angular tangent value t a n δ , whose formula is
t a n δ = ε ε = ω p 2 υ c ω ( υ c 2 + ω 2 + ω p 2 ) .
The smaller the value of the loss angular tangent value of dielectric, the less EM energy is lost by the medium. As a result, this is the EM parameter that we concentrate on.
Because the plasma frequency remains constant during the characteristic time of chemical reaction, the frequency of HPM should be tuned to the maximum frequency of EM waves absorbed by the plasma in order to maximize the plasma’s absorption of HPM energy. The collision frequency of plasma increases with the continuous irradiation of HPM, while the plasma frequency and the EM waves frequency remain unchanged.
With an increase in collision frequency alone, the vacuum permittivity is approached by the real component of the corresponding relative permittivity. The dielectric loss angular tangent value of plasma will decrease over a specified length of time, as compared to the starting value. Our focus is to reduce the plasma’s dielectric loss angular tangent value at this exact period in order to improve capacity to flow through the plasma sheath for low-frequency EM waves.

4.2. Propagation Characteristics of Low-Frequency EM Waves in Plasma Sheath

To improve the collision frequency in a short time, firstly, we find that the maximum energy absorption of plasma in the state of thermodynamic non-equilibrium and chemical non-equilibrium is reached at a certain fixed frequency (this frequency is set to the maximum absorption frequency of 24 GHz on the second section of the head stagnation line). Secondly, the power density of HPM should be improved. Using HPM technology that already exists, it is simpler to deploy equipment with increased power density [19].
Therefore, we set the frequency of the HPM to 24 GHz to match the maximum absorption frequency on the stagnation line. During the fluid simulation, the flow direction of the fluid is set to the y-direction. In this case, when the polarization direction of the HPM pulse is set to the direction perpendicular to the y-direction, the electron number density in the channel can be minimized. Therefore, the HPM pulse was set as x-direction polarized harmonic plane waves
E = x ^ E 0 ( 2 π f t ) ,
where E 0 and f are the amplitude and the frequency of the incident EM waves, respectively. For the selection of HPM energy density, we set three HPM with higher energy densities, namely, HPM-1 = 1.0 × 10 8 W/m 2 , HPM-2 = 2.0 × 10 8 W/m 2 , and HPM-3 = 3.0 × 10 8 W/m 2 , to analyze how different energy densities affect the dielectric loss tangent of the plasma.
In order to study the change of dielectric loss tangent of the plasma, it is better not to choose the front and rear ends of the plasma sheath when selecting the point of the plasma sheath. We choose the middle part of the stagnation zone. As shown in Figure 4, the point x = −0.17 m is located in the middle part of the stagnation zone, and its internal EM parameters change relatively smoothly. As shown in Figure 8, it can be seen that with the passage of time, the larger the energy density, the more advantageous it is to reduce the dielectric loss tangent of the plasma.
We take the HPM-2 in Figure 8 as an example to analyze the relationship among collision frequency, dielectric loss tangent of the plasma, and the increment value of electron temperature in the plasma. According to the values of the plasma frequency and the collision frequency of x = −0.17 m, and in (19), it can be known that when the collision frequency is greater than 601.4 GHz, the plasma’s dielectric loss tangent steadily diminishes. However, when the dielectric loss tangent of the plasma reaches the initial value with the increase in collision frequency, according to (4), the increment value of the plasma electron temperature converted by the HPM is 3037 K. This means that the dielectric loss tangent of the plasma will begin to decrease, and the effect of absorbing low-frequency EM waves will begin to weaken only when the electron temperature in the plasma is greater than 3037 K. As shown in Figure 8, where t = 22 ns is the time, the frequency of collisions hits 601.4 GHz. After the time t, the dielectric loss angular tangent value begins to rapidly decrease compared to the initial value at this stage, and the loss of plasma to EM waves decreases over time.
We select four points of time t 1 = 15 ns, t = 22 ns, t 2 = 40 ns, and t 3 = 60 ns in Figure 8, respectively. ω p and the υ c of the plasma sheath at these four time periods are stored individually to investigate changes in the plasma sheath’s transmittance and reflectance to EM waves of various frequencies following HPM irradiation. At this time, we select a point (not included in the plasma sheath) at the front and back of the stagnation area of the plasma sheath to study the reflection and transmission of plasma sheath. As a corollary, we add EM waves with frequencies ranging from 0.1 to 100 GHz to examine transmission and reflection at four times in time for EM waves with varied frequencies, as shown in Figure 9a,b.
It can be seen from Figure 9 that the transmission increases at low frequencies (0.1–30 GHz), and the reflection decreases (0.1–50 GHz) with the addition of collision frequency before and after time t. In brief, as the HPM constantly irradiates the plasma sheath throughout this precise period, the collision frequency grows independently after time t and before the start of the chemical reaction, while other EM parameters remain unaltered. The low-frequency EM waves’ capacity to travel through the plasma sheath can be improved in this way.

5. Conclusions

The low-frequency EM waves are important for vehicle communication, and these waves will be absorbed by the plasma sheath and reflected by it. To investigate the interaction between the HPM and the plasma in a thermodynamic and chemical non-equilibrium state, we propose a temperature increment model. A specific time window is discovered using this methodology. The collision frequency increases within this time span, but the plasma frequency remains unchanged. As a result, the angular tangent value of plasma’s dielectric loss lowers over time, enhancing low-frequency EM waves flowing through the plasma sheath. In a future study, we can aim to enhance the HPM’s power density so that the collision frequency can rise at a quicker rate. Furthermore, the HPM’s pulse width can be raised properly to minimize the plasma’s dielectric loss angular tangent value more quickly before the chemical reaction.

Author Contributions

Conceptualization, K.W.; writing-original draft preparation, K.W. and X.C.; writing-review and editing, X.C. and K.W.; visualization, X.C.; supervision, Z.W. All authors have read and agreed to the published version of the manuscript.

Funding

This work has been supported by National Natural Science Foundation of China (61988102), Key Research and Development Program of Guangdong Province (2019B090917007), and Science and Technology Planning Project of Guangdong Province (2019B090909011).

Institutional Review Board Statement

Not applicable.

Informed Consent Statement

Not applicable.

Data Availability Statement

Not applicable.

Conflicts of Interest

The authors declare no conflict of interest.

References

  1. Anderson, J.D. Hypersonic and High Temperature Gas Dynamics; AIAA: San Diego, CA, USA, 2000. [Google Scholar]
  2. Chen, F.F. Introduction to Plasma Physics and Controlled Fusion; Springer: Berlin/Heidelberg, Germany, 2015. [Google Scholar]
  3. Bai, B.; Zhao, Z.; Yuan, K.; Tang, R.; Deng, X.; Mao, M.; Xiong, J.; Wang, K. Characteristics of EHF Wave Propagation in Hypersonic Plasma Sheaths Magnetized by Dipole Magnetic Fields. Appl. Sci. 2022, 12, 3105. [Google Scholar] [CrossRef]
  4. NASA. The Entry Plasma Sheath and its Effect on Space Vehicle Electromagnetic Systems; NASA Special Publication; NASA: Washington, DC, USA, 1971; Volume 252. [Google Scholar]
  5. Albano, M.; Micheli, D.; Gradoni, G.; Morles, R.B.; Marchetti, M.; Moglie, F.; Primiani, V.M. Electromagnetic shielding of thermal protection system for hypersonic vehicles. Acta Astronaut. 2013, 87, 30–39. [Google Scholar] [CrossRef]
  6. Hansen, C.; Heims, S.P. A Review of the Thermodynamic, Transport, and Chemical Reaction Rate Properties of High-Temperature Air; Technical Report Archive and Image Library; Ames Aeronautical Laboratory: Moffett Field, CA, USA, 1958. [Google Scholar]
  7. Tam, L.T.; Li, C.P. Three-dimensional thermochemical nonequilibrium flow modeling for hypersonic flows. AIAA J. 1989, 1860. [Google Scholar]
  8. Dobrov, Y.; Karpenko, A.; Malkovsky, S.; Sorokin, A.; Volkov, K. Simulation of high-temperature flowfield around hypersonic waverider using graphics processor units. Acta Astronaut. 2022, 204, 745–760. [Google Scholar] [CrossRef]
  9. Zuo, F.Y.; Mölder, S.; Hu, S.L. Thermochemical non-equilibrium effects on hypersonic wavecatcher intake at Mach 12. Acta Astronaut. 2022, 198, 56–68. [Google Scholar] [CrossRef]
  10. Jiang, H.; Liu, J.; Luo, S.; Huang, W.; Wang, J.; Liu, M. Thermochemical non-equilibrium effects on hypersonic shock wave/turbulent boundary-layer interaction. Acta Astronaut. 2022, 192, 1–14. [Google Scholar] [CrossRef]
  11. Dobrov, Y.; Gimadiev, V.; Karpenko, A.; Volkov, K. Numerical simulation of hypersonic flow with non-equilibrium chemical reactions around sphere. Acta Astronaut. 2022, 194, 468–479. [Google Scholar] [CrossRef]
  12. Mohammadi Estakhri, N.; Edwards, B.; Engheta, N. Inverse-designed metastructures that solve equations. Science 2019, 363, 1333–1338. [Google Scholar] [CrossRef]
  13. Akbari, M.; Shahbazzadeh, M.J.; La Spada, L.; Khajehzadeh, A. The graphene field effect transistor modeling based on an optimized ambipolar virtual source model for DNA detection. Appl. Sci. 2021, 11, 8114. [Google Scholar] [CrossRef]
  14. Lalegani, Z.; Ebrahimi, S.S.; Hamawandi, B.; La Spada, L.; Batili, H.; Toprak, M. Targeted dielectric coating of silver nanoparticles with silica to manipulate optical properties for metasurface applications. Mater. Chem. Phys. 2022, 287, 126250. [Google Scholar] [CrossRef]
  15. Lincoln, R.L.; Scarpa, F.; Ting, V.P.; Trask, R.S. Multifunctional composites: A metamaterial perspective. Multifunct. Mater. 2019, 2, 043001. [Google Scholar] [CrossRef]
  16. Pacheco-Peña, V.; Beruete, M.; Rodríguez-Ulibarri, P.; Engheta, N. On the performance of an ENZ-based sensor using transmission line theory and effective medium approach. New J. Phys. 2019, 21, 043056. [Google Scholar] [CrossRef]
  17. Greybush, N.J.; Pacheco-Peña, V.; Engheta, N.; Murray, C.B.; Kagan, C.R. Plasmonic optical and chiroptical response of self-assembled Au nanorod equilateral trimers. ACS Nano 2019, 13, 1617–1624. [Google Scholar] [CrossRef] [PubMed]
  18. Li, J.; He, M.; Li, X.; Zhang, C. Multiphysics modeling of electromagnetic wave-hypersonic vehicle interactions under high-power microwave illumination: 2-D case. IEEE Trans. Antennas Propag. 2018, 66, 3653–3664. [Google Scholar] [CrossRef]
  19. Yan, S.; Greenwood, A.; Jin, J.M. Modeling of Plasma Formation During High-Power Microwave Breakdown in Air Using the Discontinuous Galerkin Time-Domain Method. IEEE J. Multiscale Multiphysics Comput. Tech. 2017, 1, 2–13. [Google Scholar] [CrossRef]
  20. Wang, K.; Li, J. Analyses of Multiphysical Model of Electromagnetic and Fluid in Thermodynamic Equilibrium and Chemical Nonequilibrium State. IEEE Trans. Microw. Theory Tech. 2021, 69, 5228–5240. [Google Scholar] [CrossRef]
  21. Blazek, J. Computational Fluid Dynamics: Principles and Applications. Comput. Fluid Dyn. Princ. Appl. 2001, 55, 5–22. [Google Scholar]
  22. Prabhu, R.K.; Stewart, J.R.; Thareja, R.R. A Navier–Stokes solver for high speed equilibrium flows and application to blunt bodies. In Proceedings of the 27th Aerospace Sciences Meeting, Reno, NV, USA, 9–12 January 1989; p. 668. [Google Scholar]
  23. Taflove, A.; Hagness, S.C.; Piket-May, M. Computational electromagnetics: The finite-difference time-domain method. In The Electrical Engineering Handbook; Elsevier: Amsterdam, The Netherlands, 2005; Volume 3. [Google Scholar]
  24. Takayama, Y.; Klaus, W. Reinterpretation of the auxiliary differential equation method for FDTD. IEEE Microw. Wirel. Components Lett. 2002, 12, 102–104. [Google Scholar] [CrossRef]
  25. Duan, X.; Hong, W.Y.; Han, L.; Li, A. Auxiliary Differential Equation FDTD Method of Plasma in Parallel Environment. J. Infrared Millim. Terahertz Waves 2009, 30, 860–867. [Google Scholar] [CrossRef]
  26. Gupta, R.N.; Yos, J.M.; Thompson, R.A. A Review of Reaction Rates and Thermodynamic and Transport Properties for the 11-Species Air Model for Chemical and Thermal Nonequilibrium Calculations to 30,000 K; NASA: Washington, DC, USA, 1989. [Google Scholar]
  27. Mitcheltree, R.A.; Gnoffo, P.A. Thermochemical nonequilibrium issues for earth reentry of Mars mission vehicles. J. Spacecr. Rocket. 1990, 28, 552–559. [Google Scholar] [CrossRef]
  28. Shuen, J.S.; Chen, K.H.; Choi, Y. A coupled implicit method for chemical non-equilibrium flows at all speeds. J. Comput. Phys. 1993, 106, 306–318. [Google Scholar] [CrossRef]
  29. Shuen, J.S.; Liou, M.S.; Leer, B.V. Inviscid flux-splitting algorithms for real gases with non-equilibrium chemistry. J. Comput. Phys. 1990, 90, 371–395. [Google Scholar] [CrossRef]
  30. Jones, W.L., Jr.; Cross, A.E. Electrostatic-Probe Measurements of Plasma Parameters for Two Reentry Flight Experiments at 25,000 Feet per Second; National Aeronautics and Space Administration (NASA): Washington, DC, USA, 1972. [Google Scholar]
  31. Nagaraj, N.; Lombard, C.K.; Bardina, J. Navier–Stokes simulation of 3-D hypersonic equilibrium air flow. In Proceedings of the 23rd Thermophysics, Plasmadynamics and Lasers Conference, San Antonio, CA, USA, 27–29 June 1988; p. 2695. [Google Scholar]
  32. Sha, Y.X.; Zhang, H.L.; Guo, X.Y.; Xia, M.Y. Analyses of electromagnetic properties of a hypersonic object with plasma sheath. IEEE Trans. Antennas Propag. 2019, 67, 2470–2481. [Google Scholar] [CrossRef]
  33. Yuan, Z.C.; Shi, J.M. Electron collision frequency of the non-magnetized plasma. Hejubian Dengliziti Wuli/Nuclear Fusion Plasma Phys. 2004, 24, 157–160. [Google Scholar]
  34. Cummer, S.A. An analysis of new and existing FDTD methods for isotropic cold plasma and a method for improving their accuracy. Antennas Propag. IEEE Trans. 1997, 45, 392–400. [Google Scholar] [CrossRef]
  35. Chen, Q.; Katsurai, M.; Aoyagi, P.H. An FDTD formulation for dispersive media using a current density. IEEE Trans. Antennas Propag. 1998, 46, 1739–1746. [Google Scholar] [CrossRef]
  36. Kelley, D.F.; Luebbers, R.J. Piecewise linear recursive convolution for dispersive media using FDTD. IEEE Trans. Antennas Propag. 1996, 44, 792–797. [Google Scholar] [CrossRef]
  37. Luebbers, R.; Steich, D. FDTD calculation of scattering from frequency-dependent materials. IEEE Trans. Antennas Propag. 1993, 41, 1249–1257. [Google Scholar] [CrossRef]
  38. Qian, Z.; Chen, R.; Yang, H.; Leung, K. FDTD analysis of microstrip patch antenna covered by plasma sheath. Prog. Electromagn. Res. 2004, 52, 173–183. [Google Scholar] [CrossRef]
  39. Liu, S.; Yuan, N.; Mo, J. A novel FDTD formulation for dispersive media. IEEE Microw. Wirel. Components Lett. 2003, 13, 187–189. [Google Scholar]
  40. Xu, L.; Yuan, N. PLJERC-ADI-FDTD method for isotropic plasma. IEEE Microw. Wirel. Components Lett. 2005, 15, 277–279. [Google Scholar]
  41. Nickisch, L.J.; Franke, P.M. Finite-difference time-domain solution of Maxwell’s equations for the dispersive ionosphere. IEEE Antennas Propag. Mag. 1992, 34, 33–39. [Google Scholar] [CrossRef]
  42. Gandhi, O.P.; Gao, B.-Q. A frequency-dependent finite-difference time-domain formulation for general dispersive media. IEEE Trans. Microw. Theory Tech. 1993, 41, 658–665. [Google Scholar] [CrossRef]
  43. Park, C. Assessment of two-temperature kinetic model for ionizing air. J. Thermophys. Heat Transf. 1989, 3, 233–244. [Google Scholar] [CrossRef]
  44. Park, C. A review of reaction rates in high temperature air. In Proceedings of the 24th Thermophysics Conference, Buffalo, NY, USA, 12–14 June 1989; p. 1740. [Google Scholar]
  45. Shengtao, Y.U.; Hsieh, K.; Shuen, J.; Mcbride, B. Numerical simulation of hypersonic inlet flows with equilibrium or finite rate chemistry. In Proceedings of the 26th Aerospace Sciences Meeting, Reno, NV, USA, 11–14 January 1988. [Google Scholar]
  46. Gnoffo, P.A.; Gupta, R.N.; Shinn, J.L. Conservation Equations and Physical Models for Hypersonic Air Flows in Thermal and Chemical Nonequilibrium; National Aeronautics and Space Administration, Office of Management, Scientific and Technical Information Division: Washington, DC, USA, 1989.
  47. Min, Y.; Li, X.; Kai, X.; Liu, Y. Parasitic modulation of electromagnetic signals caused by time-varying plasma. Phys. Plasmas 2015, 22, 022120. [Google Scholar]
Figure 1. Flow chart of EM characteristic analysis of the hypersonic vehicle’s plasma sheath. (a) Geometric sketch of the RAM-C II model and its high-speed fluid analysis. (b) The RAM-C II generates plasma sheath and is irradiated by the HPM. (c) Analysis of transmission and reflection characteristics of the plasma sheath.
Applsci 13 10815 g001
Figure 2. Legend of the flow field simulation. Schematic diagram of (a) the computational fluid region meshes, (b) the Mach number distribution in the fluid region, (c) the density distribution in fluid region, (d) the mass fraction distribution of N atoms in the fluid region, (e) the mass fraction distribution of O atoms in the fluid region, (f) the mass fraction distribution of NO atoms in the fluid region, (g) the temperature distribution in the fluid region, and (h) the mass fraction distribution of the electrons in the fluid region.
Applsci 13 10815 g002
Figure 3. The distribution characteristics of the peak electron number density of RAM-C II along the blunt cone streamline at an altitude of 71 km.
Applsci 13 10815 g003
Figure 4. The distribution of plasma EM parameters on stagnation line.
Applsci 13 10815 g004
Figure 5. The transmission, reflection, and absorption of plasma sheath are in the frequency range of 0.1–100 GHz.
Applsci 13 10815 g005
Figure 6. Diagram of electron collision and polarization current in plasma under HPM.
Applsci 13 10815 g006
Figure 7. Iterative diagram of temperature increment Δ T and collision frequency υ c .
Applsci 13 10815 g007
Figure 8. The change of dielectric loss tangent value of the plasma with time at stagnation line x = −0.17 m.
Applsci 13 10815 g008
Figure 9. At t, t 1 , t 2 , and t 3 , the propagation of 0.1–100 GHz EM waves in the stagnation region of the plasma sheath. (a) Transmission coefficient. (b) Reflection coefficient.
Applsci 13 10815 g009
Disclaimer/Publisher’s Note: The statements, opinions and data contained in all publications are solely those of the individual author(s) and contributor(s) and not of MDPI and/or the editor(s). MDPI and/or the editor(s) disclaim responsibility for any injury to people or property resulting from any ideas, methods, instructions or products referred to in the content.

