Abstract
Background: Biological ageing and pathological changes of teeth impact the appearance and may hinder the effectiveness of facial aesthetic treatments. The present cross-sectional study in Caucasian dentate individuals aimed to measure facial features of the lower and middle parts of the face across different ages and to identify any significant impacts of age, sex and dental variables on facial aesthetics. Methods: Fifty-eight adults (ranging from 26 to 79 years of age) participated in the study. Facial measurements were collected via digital two-dimensional photography, and intraoral variables were recorded. The data were digitally analysed using ImageJ software and statistically analysed using SPSS Software. Results: The lower and middle third of the face revealed statistically significant changes across the age span tested, with the middle third presenting higher values in females and the lower appearing more prominent in males. A negative correlation with age was revealed for the distance between the pupil and the orbital point. Intraoral dental variables were also significantly related to facial measures. Conclusions: The study enriches the anthropometric data available for the Greek population, with age and sex significantly impacting facial aesthetics and oral variables. Considering such information during preoperative planning for full-arch dental restorations or facial surgery is essential.
1. Introduction
Ageing is a dynamic and continuous process that alters the harmony and symmetry of the face, affecting smooth facial contours and thus each individual’s physical attractiveness, self-esteem and social interaction [1,2,3].
A broad spectrum of changes occurs in facial anatomy with age. Extrinsic factors such as lifestyle or environmental influences and intrinsic factors such as development and innate soft and bony changes may vary; facial skeleton remodelling, fat pad repositioning, volume increase or atrophy, skin weakening and the thinning and loss of muscle tone result in a flabby or drooping appearance known as the “ageing face” [3,4]. The first signs of facial ageing typically appear between 20 and 30 years old. These signs appear earlier in females than males [4,5,6,7]. Specifically, discrepancies in facial and dental anatomy are clinically noted from the age of 25 [5,6].
The face is divided into the upper, middle, and lower thirds for extra-oral examination. In the upper third of the face, a dominant ageing element is the formation of wrinkles, which is attributed to muscle activation and fat loss [4,8,9]. Another substantial alteration is the observed elongation of the upper third that is caused by the upward movement of the hairline [10]. In the middle third, nasal tip ptosis is noted, along with dorsal irregularities and nose lengthening [10], while the maxillary height is reduced, and alveolar bone resorption occurs [11]. In the lower third of the face, the lips may lose their fullness over time, and their contour may lose its shape and distinction from the perioral skin [12]. In addition, bone alterations in dentate individuals indicate that the mandible changes shape and continues to grow with time [13,14,15]. These progressive changes may affect the appearance of the lower face, making it appear older and affecting facial aesthetics.
The analysis of facial aesthetics through anthropometric measurements constitutes an integral part of diagnosing and planning extraoral and intraoral interventions. Lately, there has been a growing interest in assessing the thickness of facial soft tissue through different methods. This is because it provides vital data for estimating the facial features of the skull [16,17]. Moreover, a recent study reported that the thickness of facial soft tissue, which affects facial aesthetics, is influenced by sex. Males tend to have greater soft tissue thickness in the mouth region, while females have greater thickness in the zygomatic and eye regions [18]. However, Meikle et al. stated that there is still a need to improve technical recommendations for soft facial tissues, particularly in the provision of better underlying data structures and standardisation [19].
Anthropometric parameters differ among ethnic groups and can be influenced by age, sex, environmental factors and intraoral conditions such as partial or total tooth loss [20]. At present, aesthetic standards have shifted through the immense usage of Botox, hyaluronic acid and other fillers [21,22]. There is also an increased emphasis on aesthetic standards for older individuals [1]. This has resulted in more people opting for multiple plastic surgeries, injectables or full-arch-implant-supported dental restorations to meet these demands.
The analysis of anthropometric parameters is of key importance for scientific fields such as dentistry to achieve the best design of dental restorations in the case of missing teeth or cosmetic surgery and to restore aged facial structures accurately. Scientific data based on anthropometric parameters assessed during an extra-oral examination indicate a correlation with aesthetic outcomes. This information can be useful when planning full-arch dental restorations, extractions of wisdom teeth, intraoral bone regeneration techniques, sinus lift augmentations and reconstructive surgery after trauma or oncological resections to achieve an aesthetically harmonious appearance [23,24,25]. Most dental practitioners do not take into consideration scientifically established anthropometric data when performing interventions that may have an impact on facial aesthetics. Consequently, synergies between various scientific fields could be promoted though the use of anthropometric measurements to redefine and reassess natural features of beauty throughout life.
Scientifically collected anthropometric data are of paramount importance for each ethnic group to provide patients with individualised treatment planning and therapy. The present study aimed to (a) measure the facial features of the lower and middle parts of the face in dentate Caucasian individuals of both sexes of different ages, (b) analyse both oral and extraoral factors to understand how they relate to the appearance and function of the face, and (c) identify any significant changes that occur due to age in individuals with sufficient natural teeth for effective chewing. The ultimate goal of this study was to better understand how these factors interact and change over time to deliver excellent care to patients in a multidisciplinary context.
2. Materials and Methods
2.1. Participants
The participants in this study were adults who sought treatment at the Clinic of Prosthodontics, School of Dentistry, Aristotle University of Thessaloniki (AUTH), from January 2018 to October 2019.
2.2. Inclusion and Exclusion Criteria
The inclusion criteria were (a) male and female individuals of Greek nationality and second-generation Greek individuals of Greek origin who were older than 25 years as the facial and dental changes that indicate signs of ageing are typically clinically noted from the age of 25 [6]. (b) All participants had at least twenty well-distributed natural teeth, securing a satisfactory chewing ability, with at least four functional tooth units (FTUs) of either natural teeth or teeth restored with fillings, crowns or small bridges [26].
The exclusion criteria were (a) individuals with a body height over 1.90 m (due to the limitations of the technical equipment—the height of the tripod and camera), (b) individuals who had undergone maxillofacial or plastic surgery (including injectables such as Botox and fillers), (c) individuals who had undergone orthodontic treatment or who presented with facial or neck skin tattoos or excessive facial hair, (d) individuals with full-arch fixed prostheses, implant restorations or removable partial dentures, and (e) athletes and individuals with high muscle mass.
2.3. Data Collection
The AUTH School of Dentistry Committee for Research Ethics approved the study protocol (No. 23/02.02.2017).
After assessing their orthopantomographic X-rays, one hundred eighty randomly selected dentate individuals were called to participate in the study. A thorough extra- and intraoral clinical examination was carried out.
Fifty-eight adults met the inclusion criteria and signed the informed consent document. Sex, height, weight, and body mass index were recorded. During the intraoral examination, the following data were recorded: periodontal disease index (PDI), anterior-posterior overlap (overjet and overbite), angle class, and the number of FTUs.
Digital two-dimensional photography was utilised for the collection of facial anthropometric measurements. This method was chosen due to its frequent application in everyday clinical practice, ease of use, efficiency, and low cost [27,28,29].
The armamentarium included a DSLR Canon 1200D digital camera, along with a Canon EF 100 mm f/2.8 Macro USM lens (Canon U.S.A. Inc., Melvill, New York, USA), a camera tripod (Polaroid Corp., Minnetonka, MN, USA), two flashlights, a “monolight” and a “soft-box”, which were fixed on tripods (Neewer®, Shenzhen, China), a black background, a fixed standing base, a measuring tape, a weight scale, calibration stickers, a computer (Lenovo Ideapad Flex 14 Notebook, Lenovo Technology B.V.—Greece Branch, Marousi, Athens, Greece), a dental examination set, and photography equipment [30].
The photographs were obtained with the participants in a standing position, with the head in a natural head posture and a mandibular physiologic rest position. For both full-face frontal and lateral views, three standardised photographs were obtained. The distance between the participant’s face and the camera was 160 cm. The camera was adjusted to the participant’s height (eye level), utilising a mounted spirit level for standardisation. Subsequently, five intraoral photographs were taken of each participant.
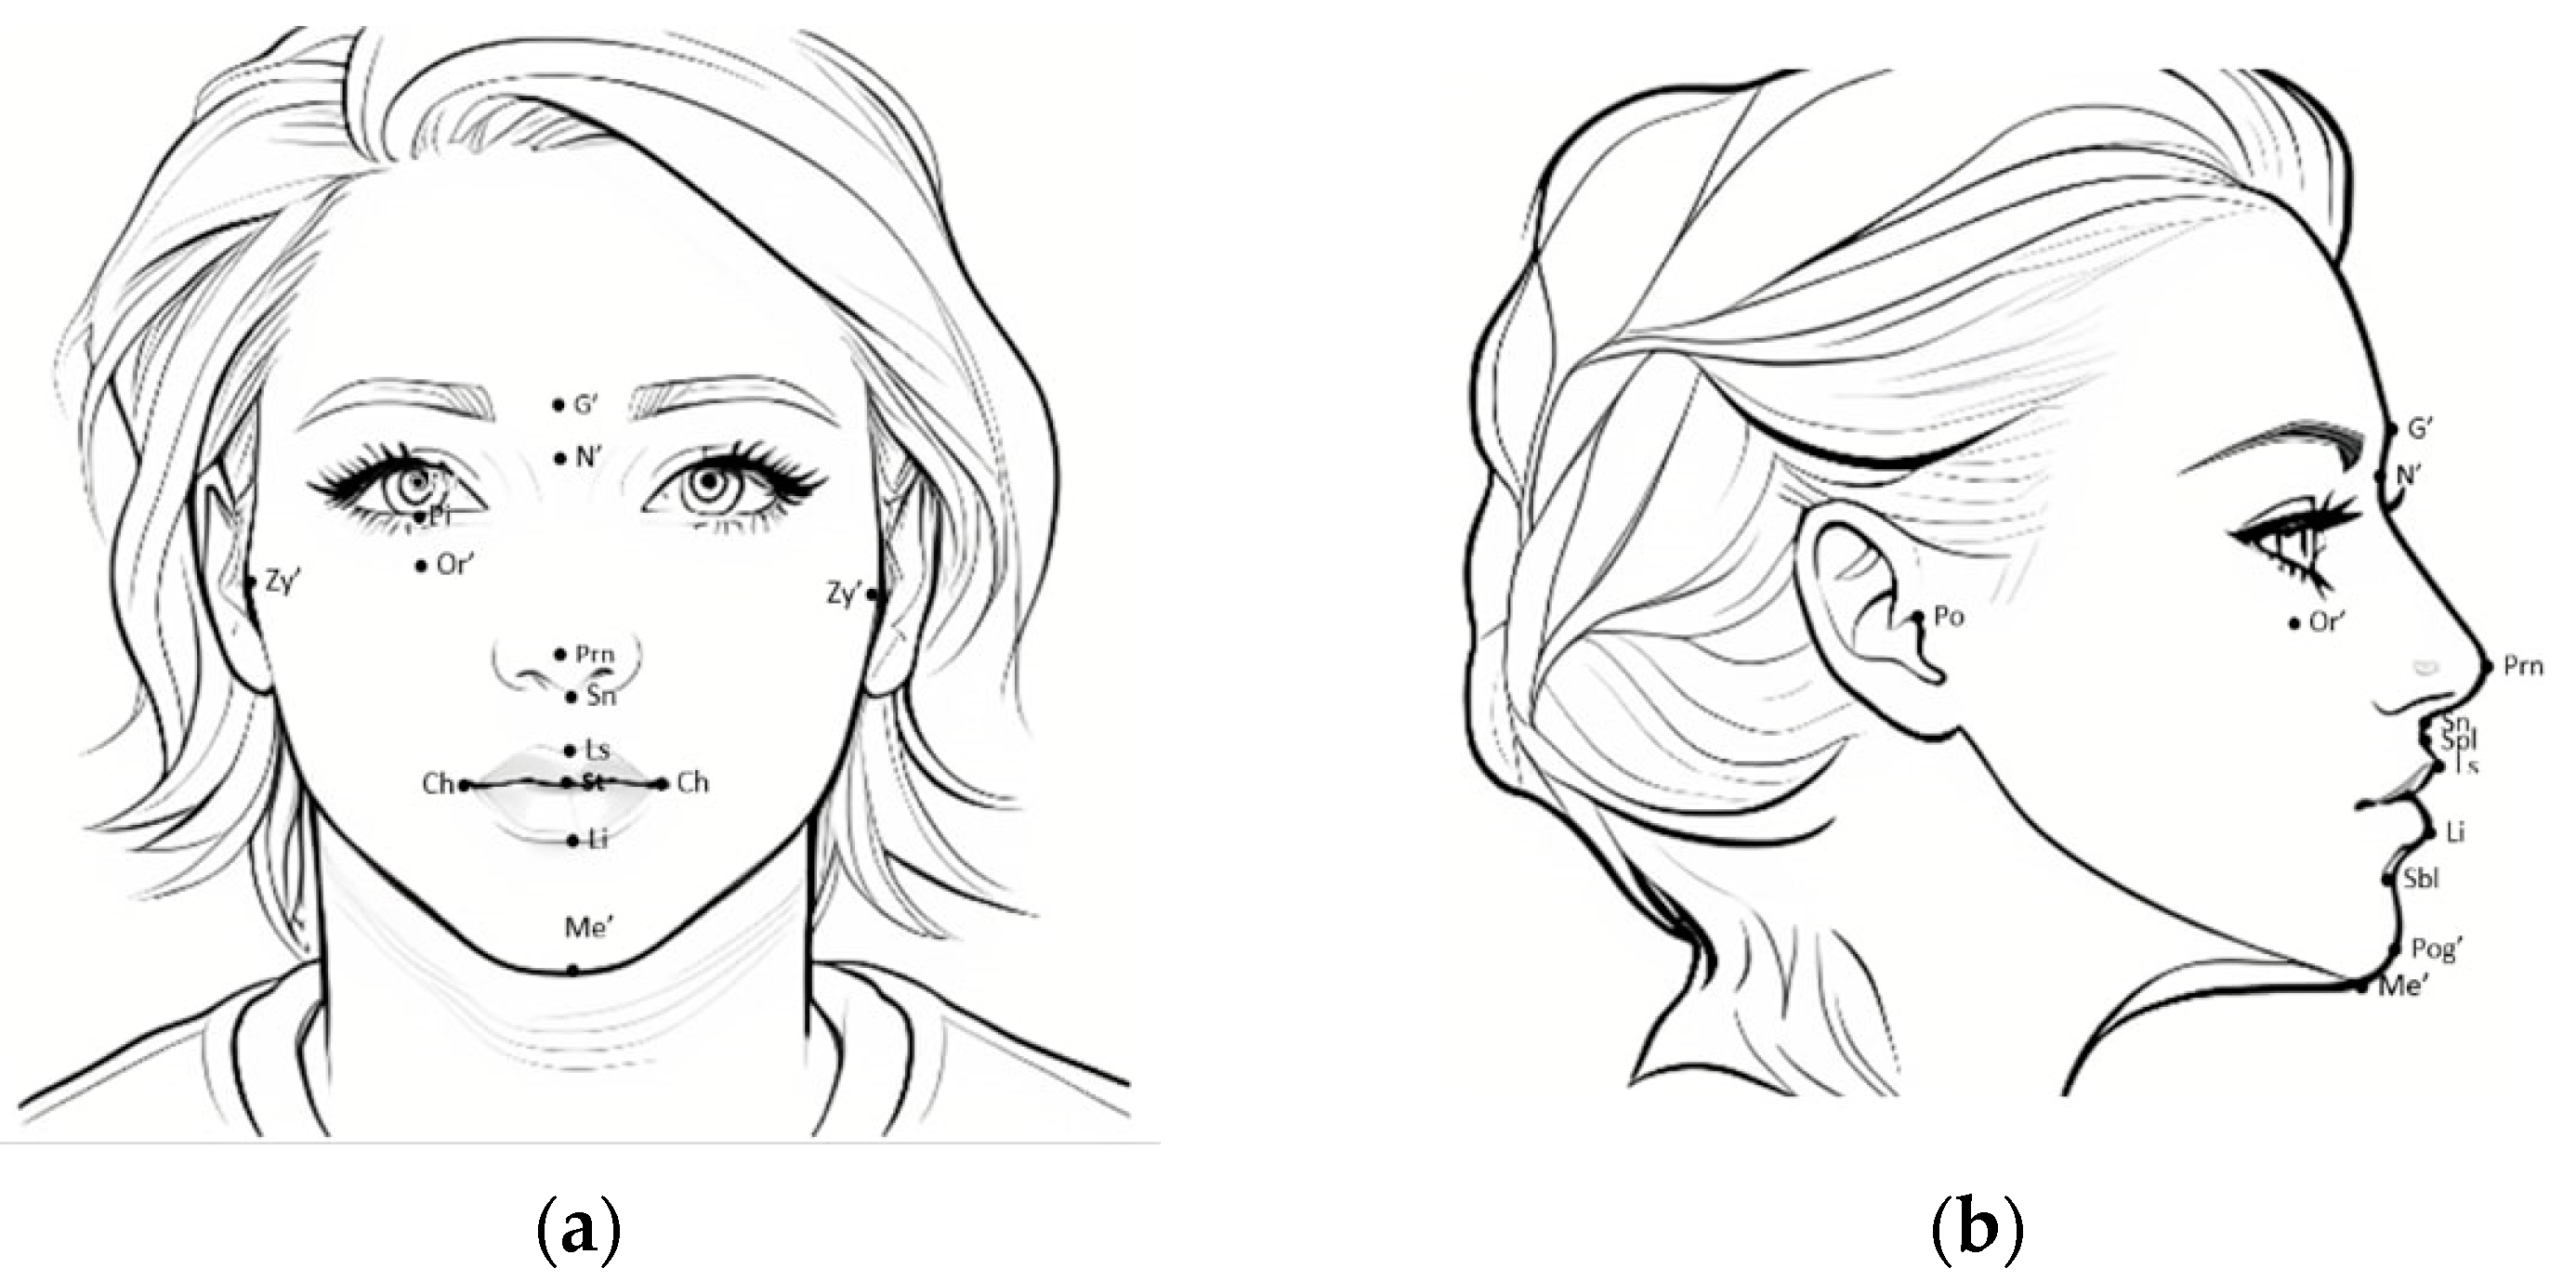
Vitruvian trisection was used to define facial thirds, while the middle and lower thirds were studied. The middle third of the face is defined between the soft tissue points glabella (G’) and subnasale (Sn). The lower third of the face is defined between the soft tissue points subnasale (Sn) and soft tissue menton (Me’) [31,32]. Figure 1 is an illustrative sketch which better demonstrates facial thirds and facial points that were registered in our study (Figure 1).
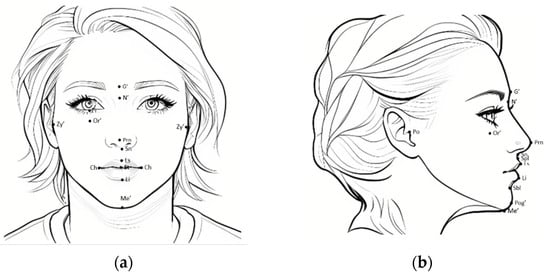
Figure 1.
Landmarks: (a) frontal and (b) lateral views. (a) Facial Index (N’-Me’) x 100/(Zy’-Zy’), vertical facial proportions, middle (%)—G’-Sn; vertical facial proportions, lower (%)—Sn-Me’; nose-to-mouth distance (mm)—Sn-St; mouth width (mm)—Sn-St; mouth width (mm)—Ch-Ch; pupil–orbital (mm)—Pu-Or’; height of the lower lid (mm)—Pi-Or’. (b) Frankfort plane (degrees)—Po-Or’; nasolabial angle (degrees), tangent to the nasal columella—Sn–Ls; Po-N-A angle (degrees)—Po-N’-A (Spl); Po-N-B angle (degrees)—Po-N’-B (Sbl); ANB angle (degrees)—A (Spl)-N’-B (Sbl); ANB angle (degrees)—A (Spl)-N’-B (Sbl); E-line upper lip distance (mm)—E line (Prn-Pog’)–Ls; E-line lower lip distance (mm)— e-line (Prn-Pog’)–Li.
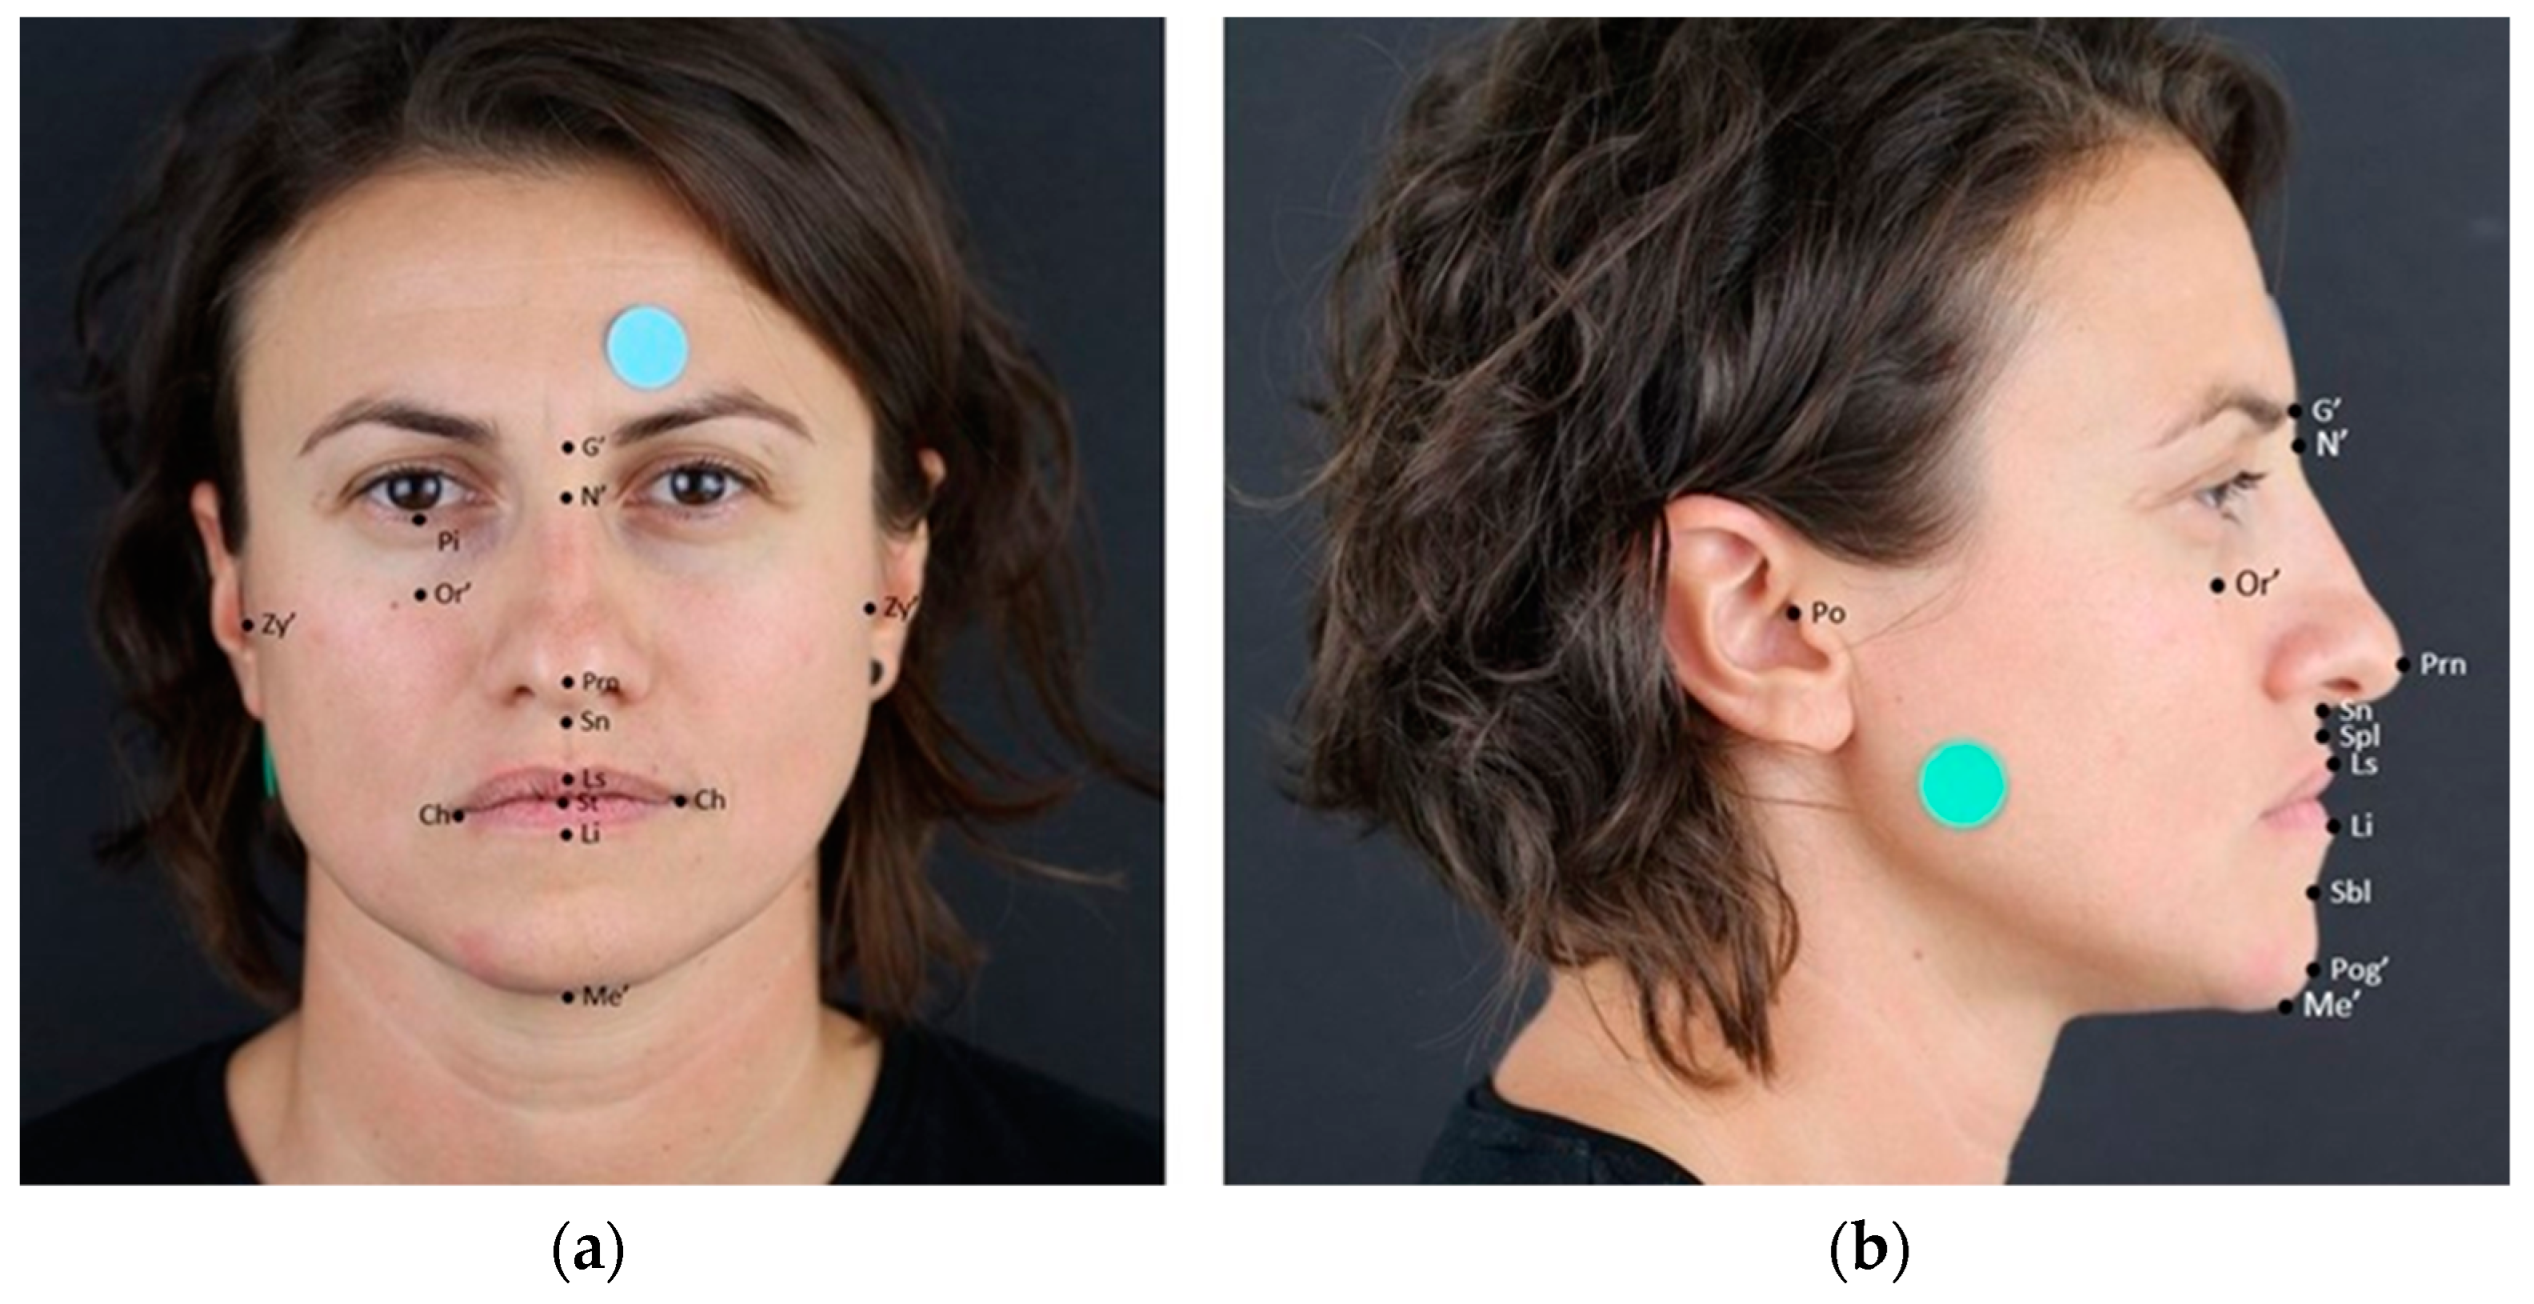
To accurately capture the face in a photograph, a make-up pencil was used to mark relevant anatomical points that were prominent or palpable but not visible in the picture. Furthermore, a standardized sticker was provided to adjust the image (Figure 2).

Figure 2.
Photographs of one of the participants. Landmarks: (a) frontal and (b) lateral views. (a) Facial Index (N’-Me’) x 100/(Zy’-Zy’); vertical facial proportions, middle (%)—G’-Sn; vertical facial proportions, lower (%)—Sn-Me’; nose-to-mouth distance (mm)—Sn-St; mouth width (mm)—Sn-St; mouth width (mm)—Ch-Ch; pupil–orbital (mm)—Pu-Or’; height of the lower lid (mm)—Pi-Or’. (b) Frankfurt plane (degrees)—Po-Or’; nasolabial angle (degrees) tangent to the nasal columella—Sn–Ls; Po-N-A angle (degrees)—Po-N’-A (Spl); Po-N-B angle (degrees)—Po-N’-B (Sbl); ANB angle (degrees)—A (Spl)-N’-B (Sbl); ANB angle (degrees)—A (Spl)-N’-B (Sbl); E-line upper lip distance (mm)—E line (Prn-Pog’)–Ls; E-line lower lip distance (mm)—E line (Prn-Pog’)–Li.
Anthropometric measurements are a reliable tool for analysing facial aesthetics, although a universal protocol has yet to be established. However, specific measurements have been widely implemented in numerous studies as a standard practice [29,33,34]. The anthropometric parameters explored in the present study were the facial index, the vertical facial percentage of the middle third of the face to the lower third of the face (based on the Vitruvian trisection), the mouth width, the distance between the nose and mouth, the pupil-to-orbital point height, the height of the lower lid, the Frankfurt plane inclination, the nasolabial angle, the Po-N-A angle (porion–nasion point A angle), the Po-N-B angle (porion–nasion point B angle), the ANB angle (point A–nasion point B angle), and the distance between the upper lip and E-line, as well as the distance between the lower lip and E-line (Ricketts’ esthetic line).
A digital analysis of the measurements was performed using the software ImageJ, which is available for use without permission [35].
2.4. Statistical Analysis
A statistical analysis was performed using IBM SPSS Statistics software, Version 25.0 (Armonk, NY, USA: IBM Corp.), which was enhanced with the Exact Tests for a Monte Carlo simulation.
The level of significance was set at 0.05 (p ≤ 0.05). Pearson’s r and Spearman’s rho correlation coefficients were calculated for testing and evaluating the linear or rank associations between age and the facial anthropometric measurements selected. The data were analysed in consecutive order, without any further grouping regarding age. The “Loess” best-fitting curve was plotted on the corresponding scatter plots for a more detailed interpretation of the data included to visualize the correlations between age and facial variables [36].
The distributions of the facial anthropometric measurements across the male and female participants were compared using the Mann–Whitney (M-W) test. In all tested hypotheses, the significance level (p-value) was calculated using the Monte Carlo simulation method based on 10,000 resampling circles [37,38]. This method leads to valid inferential conclusions even in cases in which the methodological prerequisites of the statistical tests were not fulfilled (e.g., random samples, independent observations, symmetrical distributions, large samples, and the absence of “heavy” outliers).
3. Results
3.1. Descriptive Statistics
All participants were of Greek origin (Caucasian): 33 males and 25 females.
The ages of the participants ranged between 26 and 79 years, with a mean of 52.52 (±5.09) years. Out of the total participants, 17 were between 26 and 45 years old (29%), 24 were between 46 and 64 years old (42%), and 17 were older than 65 years (29%).
On average, the participants were 1.71 (±0.10) meters tall and had an average weight of 80.97 (±15.72) kilograms. After a thorough analysis of the data, it was found that the participant’s body mass index (BMI) ranged from 19.1 to 45.49, with an average of 27.64 (±4.76). Most participants (57%) were overweight, whereas 24% had a BMI within the normal range, and 19% of the participants were classified as obese.
Moreover, 59% of the patients had a brachyfacial face (euriprosopic, with a broad face and an ovoid-shaped dental arch), 26% a mesofacial face, and 15% a dolichofacial (leptoprosopic, long) face [39,40].
In the total number of participants, the occluding pairs of teeth described as functional tooth units (FTUs) ranged from 4 to 16, with a mean of 10.53 (±2.88), while overjet presented a range from 0 to 7, with a mean of 2.60 (±1.65), and overbite presented a range from 0 to 9, with a mean of 2.84 (±1.94). Out of all the participants, the majority—45 individuals (78%)—were classified as Angle I, 8 (14%) were classified as Angle II, and 5 (9%) were classified as Angle III. Thus, the majority of the participants presented an Angle Class of I, a finding which was in line with the dominant craniofacial pattern.
Only 10% of the patients presented healthy periodontal tissues; 21% had gingivitis, and 69% showed a loss of periodontal support.
Table 1 displays the participants’ facial characteristics in frontal view, revealing that the dominant craniofacial framework pattern was the brachyfacial (euriprosopic) one (average facial index = 83.94), accompanied by a larger lower third of the face.

Table 1.
Facial characteristics in frontal view for all participants (n = 58).
Table 2 illustrates the participants’ facial characteristics in lateral view. After analysing the values of the Frankfurt plane, with an average of 10.15°, it was discovered that some participants’ horizontal planes were not parallel to it. Furthermore, all participants had their upper lips positioned behind the e-line, and some had lower lips protruding beyond it.
Table 2.
Facial characteristics in lateral view for all participants (n = 58).
3.2. Correlations
3.2.1. Correlations between Age, Sex, and the Participants’ Profiles and Intraoral Variables
The mean age of the males was 53 (±15.01) years, while the mean age of the females was 51.88 (±13.46). There was no significant difference in age between the males and females (p = 0.07). Although statistically significant differences were found between the males and females for height (p < 0.001) and weight (p < 0.001), there were no statistically significant differences for BMI (p = 0.0402) (Table 3).
Table 3.
Profile characteristics of males and females (* indicates statistical significance).
Weight also showed a statistically significant impact on the length of the upper (Spearman’s, rho = −0.262, p = 0.047) and lower (Spearman’s, rho = −0.277, p = 0.035) lips to the e-line. Finally, a positive weak correlation was recorded between the distance between the pupil and the orbital point and height (Spearman’s rho = 0.363, p = 0.01) (Table 3).
A positive weak linear correlation was also found between the ANB angle and horizontal overjet (Pearson’s, r = 0.278, p = 0.03).
With respect to describing the intraoral values that are reflected in facial features, no statistically significant differences were found between males and females for FTUs (p = 0.752), overjet (p = 0.059), overbite (0.316), the PDI index (p = 0.568), or the Angle classification (p = 0.434).
3.2.2. Facial Variables Correlations with Sex
The differences between males and females for facial variables in the frontal view are illustrated in Table 4. The middle third of the face presented significantly higher values in female participants than in males (p = 0.01), while the lower third appeared more prominent in male individuals than in females (p = 0.01).
Table 4.
Facial anthropometric variables in frontal view for males and females for all participants (n = 58) (* indicates statistical significance).
Moreover, a statistically significant difference was recorded for facial variables in the lateral view, specifically the Po-N-A angle (p = 0.02), the Po-N-B angle (p = 0.01), and the distance between the upper lip and the e-line (p = 0.03), with males showing higher values than females (Table 5).
Table 5.
Facial anthropometric variables in lateral view for males and females for all participants (n = 58) (* indicates statistical significance).
3.2.3. Facial Variables’ Correlation with Age
Statically significant associations were found for facial variables for the frontal and lateral views.
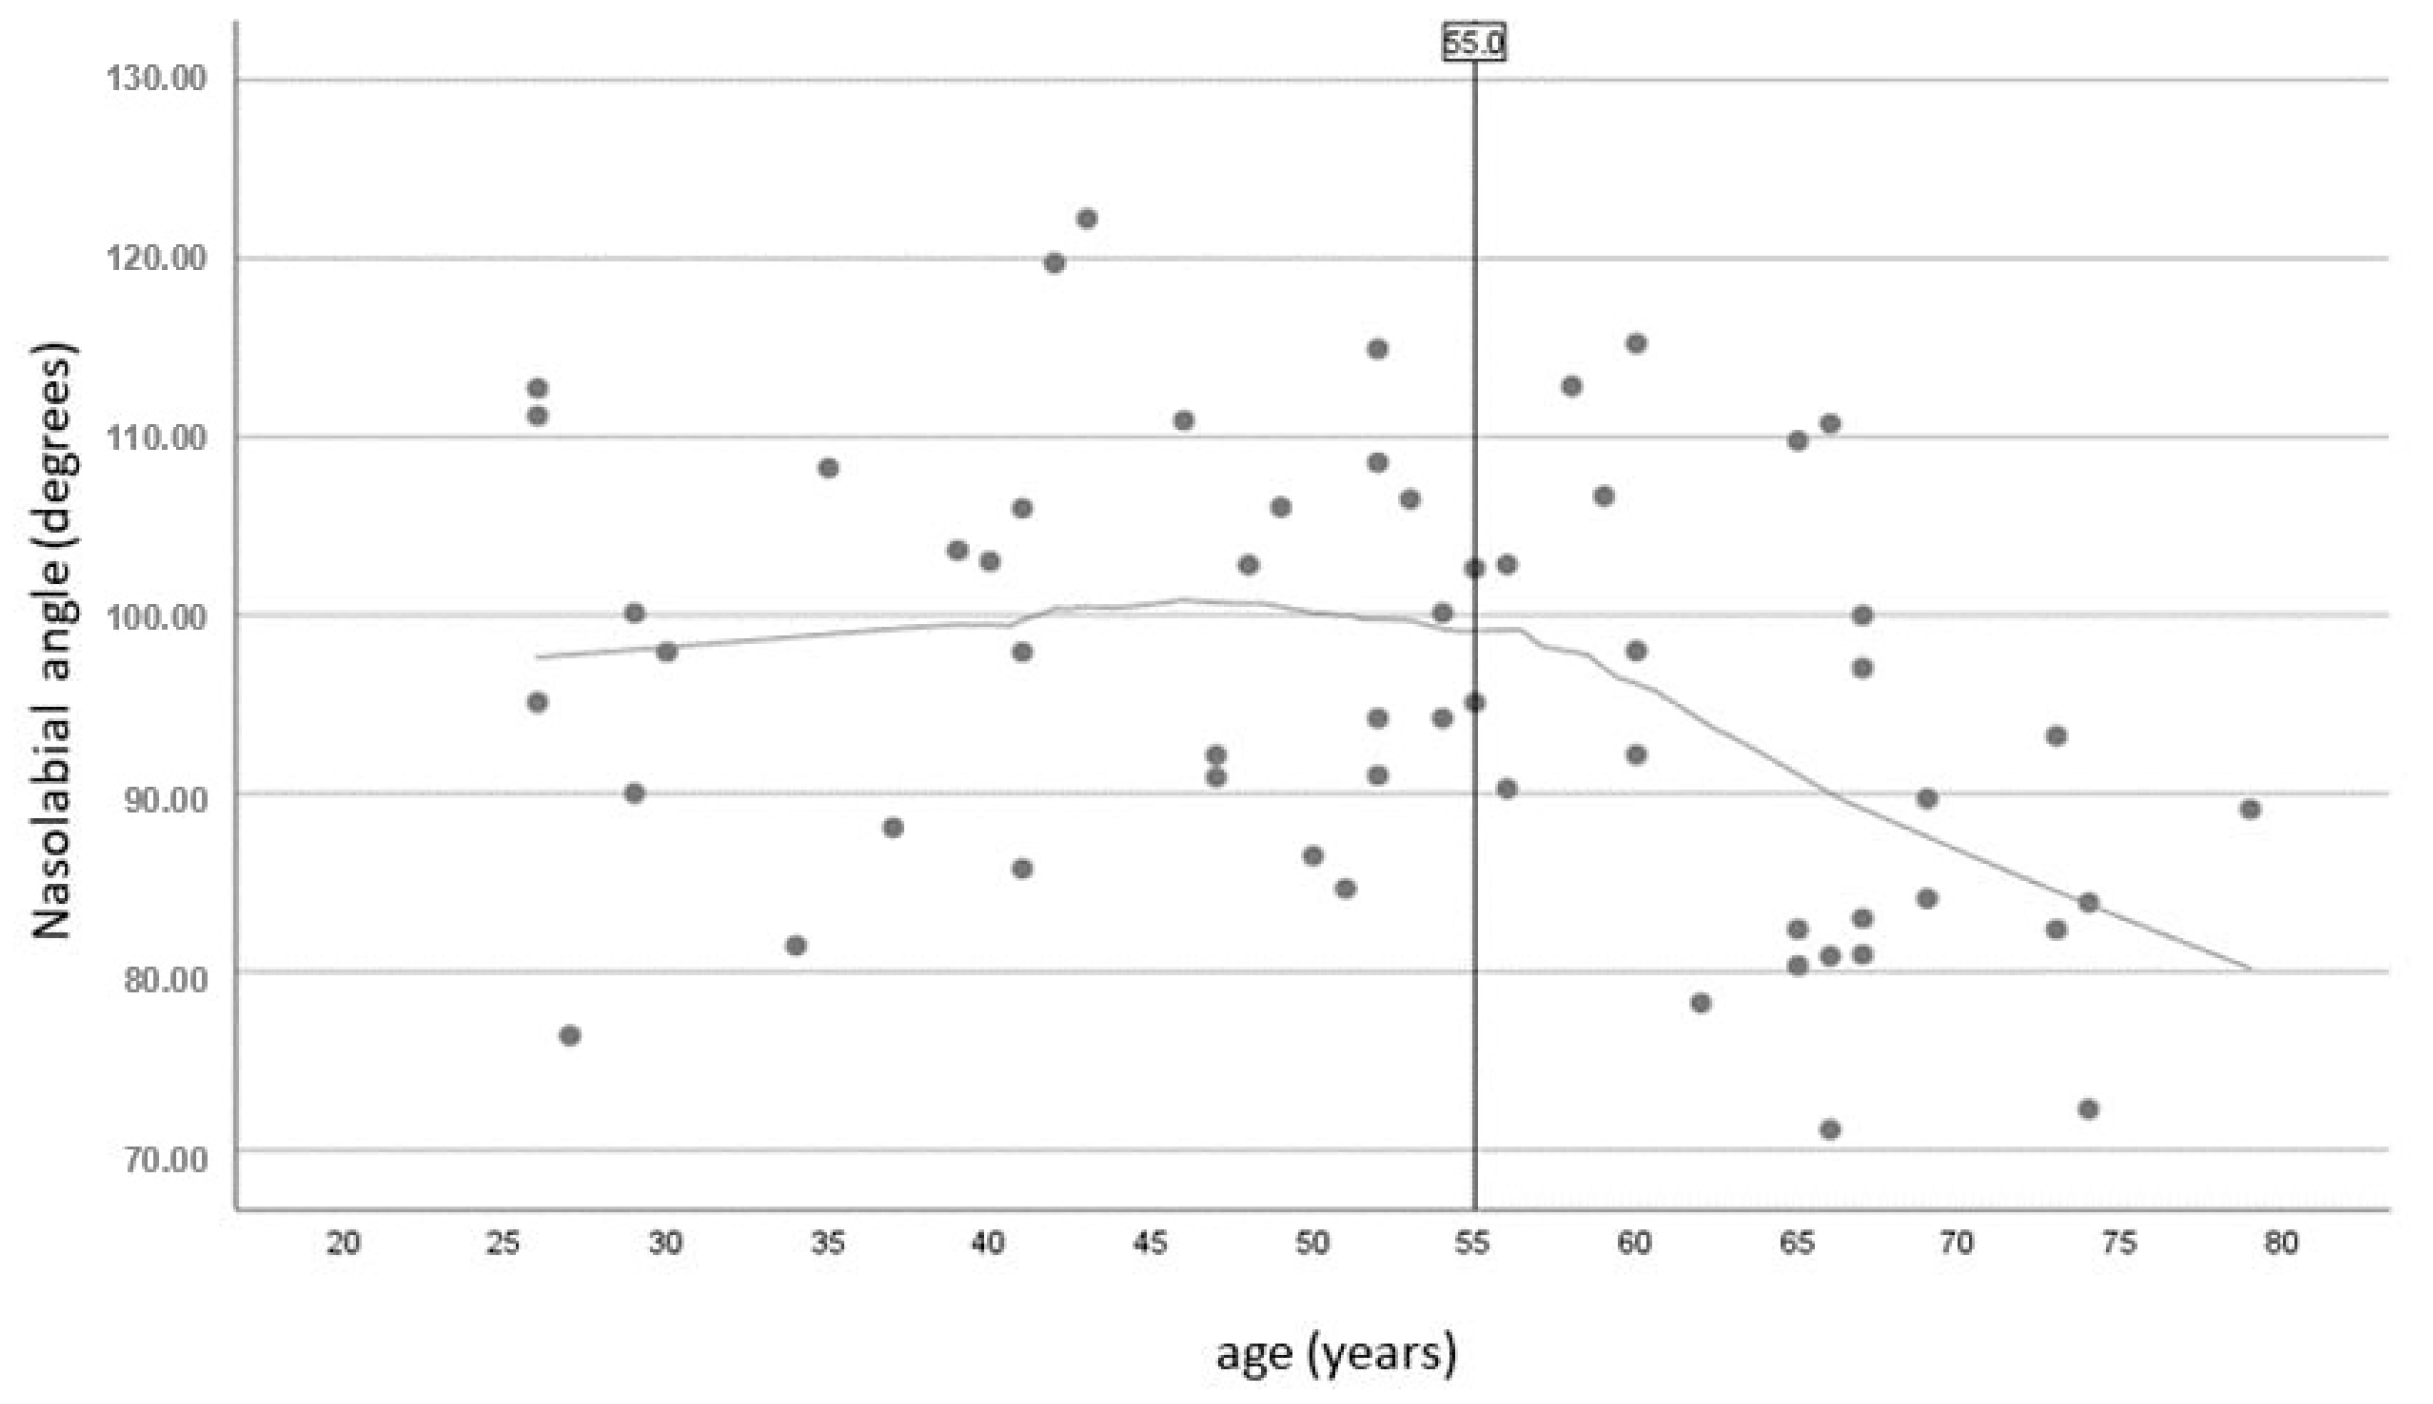
A negative weak correlation was revealed for the distance between the pupil and the orbital point (Pearson’s r = −0.276, p = 0.036) with respect to the frontal view and for the nasolabial angle (Pearson’s r = −0.276, p = 0.036), and the distance from the E line to the upper lip (Pearson’s r = −0.248, p = 0.042) with respect to the lateral view. Moreover, weak rank correlations were found for the ANB angle with age.
The above significant correlations were further studied utilising Loess curve graphs (Figure 2, Figure 3, Figure 4, Figure 5 and Figure 6).
The Loess curve graph shows the correlation between age and the distance between the eye pupil and the orbital point (Figure 3). This correlation is particularly pronounced among individuals aged between 26 and 46 years and those over 53 years of age. The values remain remarkably consistent between 46 and 53 years of age.
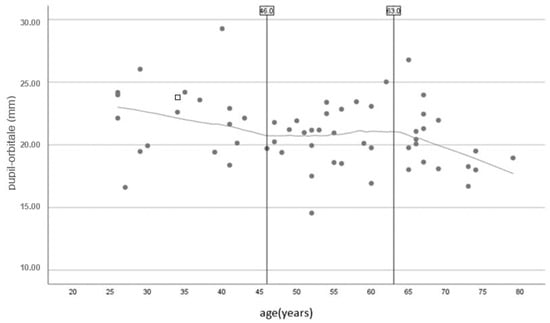
Figure 3.
Scatter plot with Loess curve to visualize the correlation between age and the distance between the pupil and the orbital point.
Figure 3.
Scatter plot with Loess curve to visualize the correlation between age and the distance between the pupil and the orbital point.

Participants above the age of 56 exhibited a significantly stronger negative correlation between age and the nasolabial angle. Conversely, individuals younger than 56 years of age displayed a relatively stable nasolabial angle value (Figure 4).

Figure 4.
Scatter plot with Loess curve to visualize the correlation between age and nasolabial angle.
Figure 4.
Scatter plot with Loess curve to visualize the correlation between age and nasolabial angle.
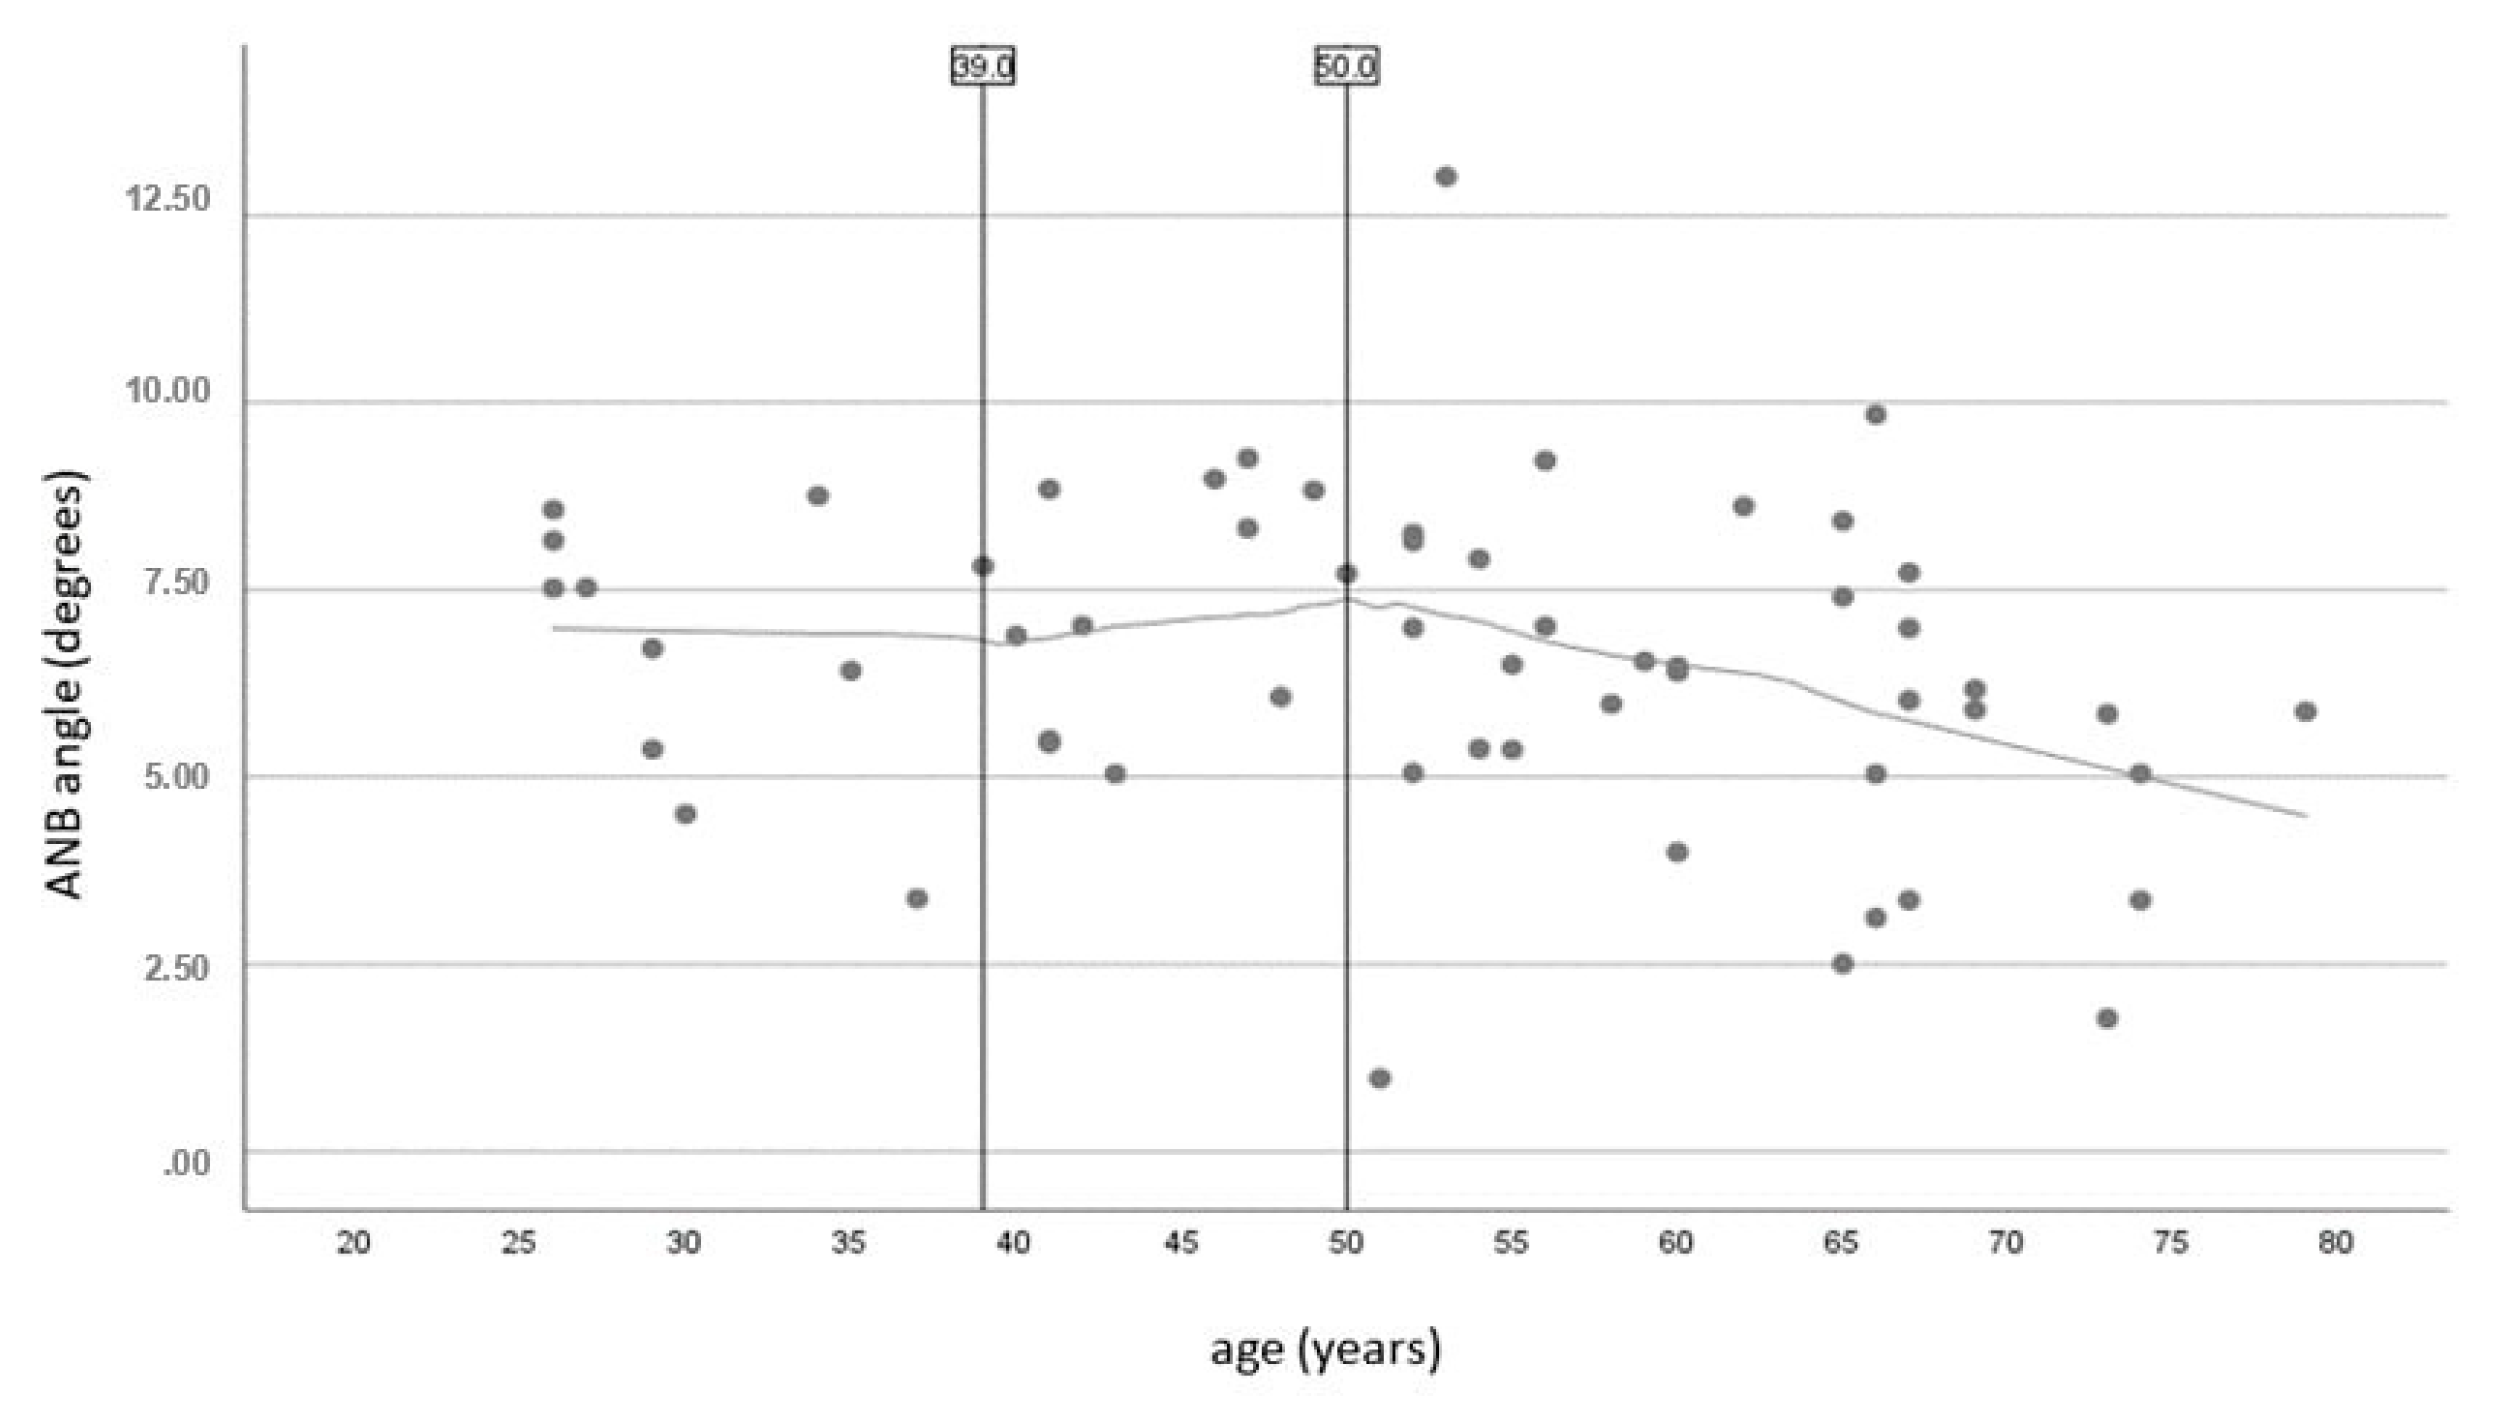
Similarly, the negative association between age and the ANB angle was more evident in participants older than 50. Between the ages of 39 and 50, this angle softened in comparison to younger individuals. For those under 39, the angle remained constant. In older individuals, the difference in the sagittal plane for the maxillary and mandibular positions became less noticeable (Figure 5).
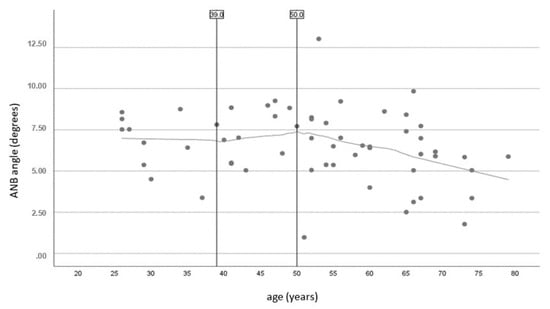
Figure 5.
Scatter plot with Loess curve to visualize the correlation between age and ANB angle.
Figure 5.
Scatter plot with Loess curve to visualize the correlation between age and ANB angle.
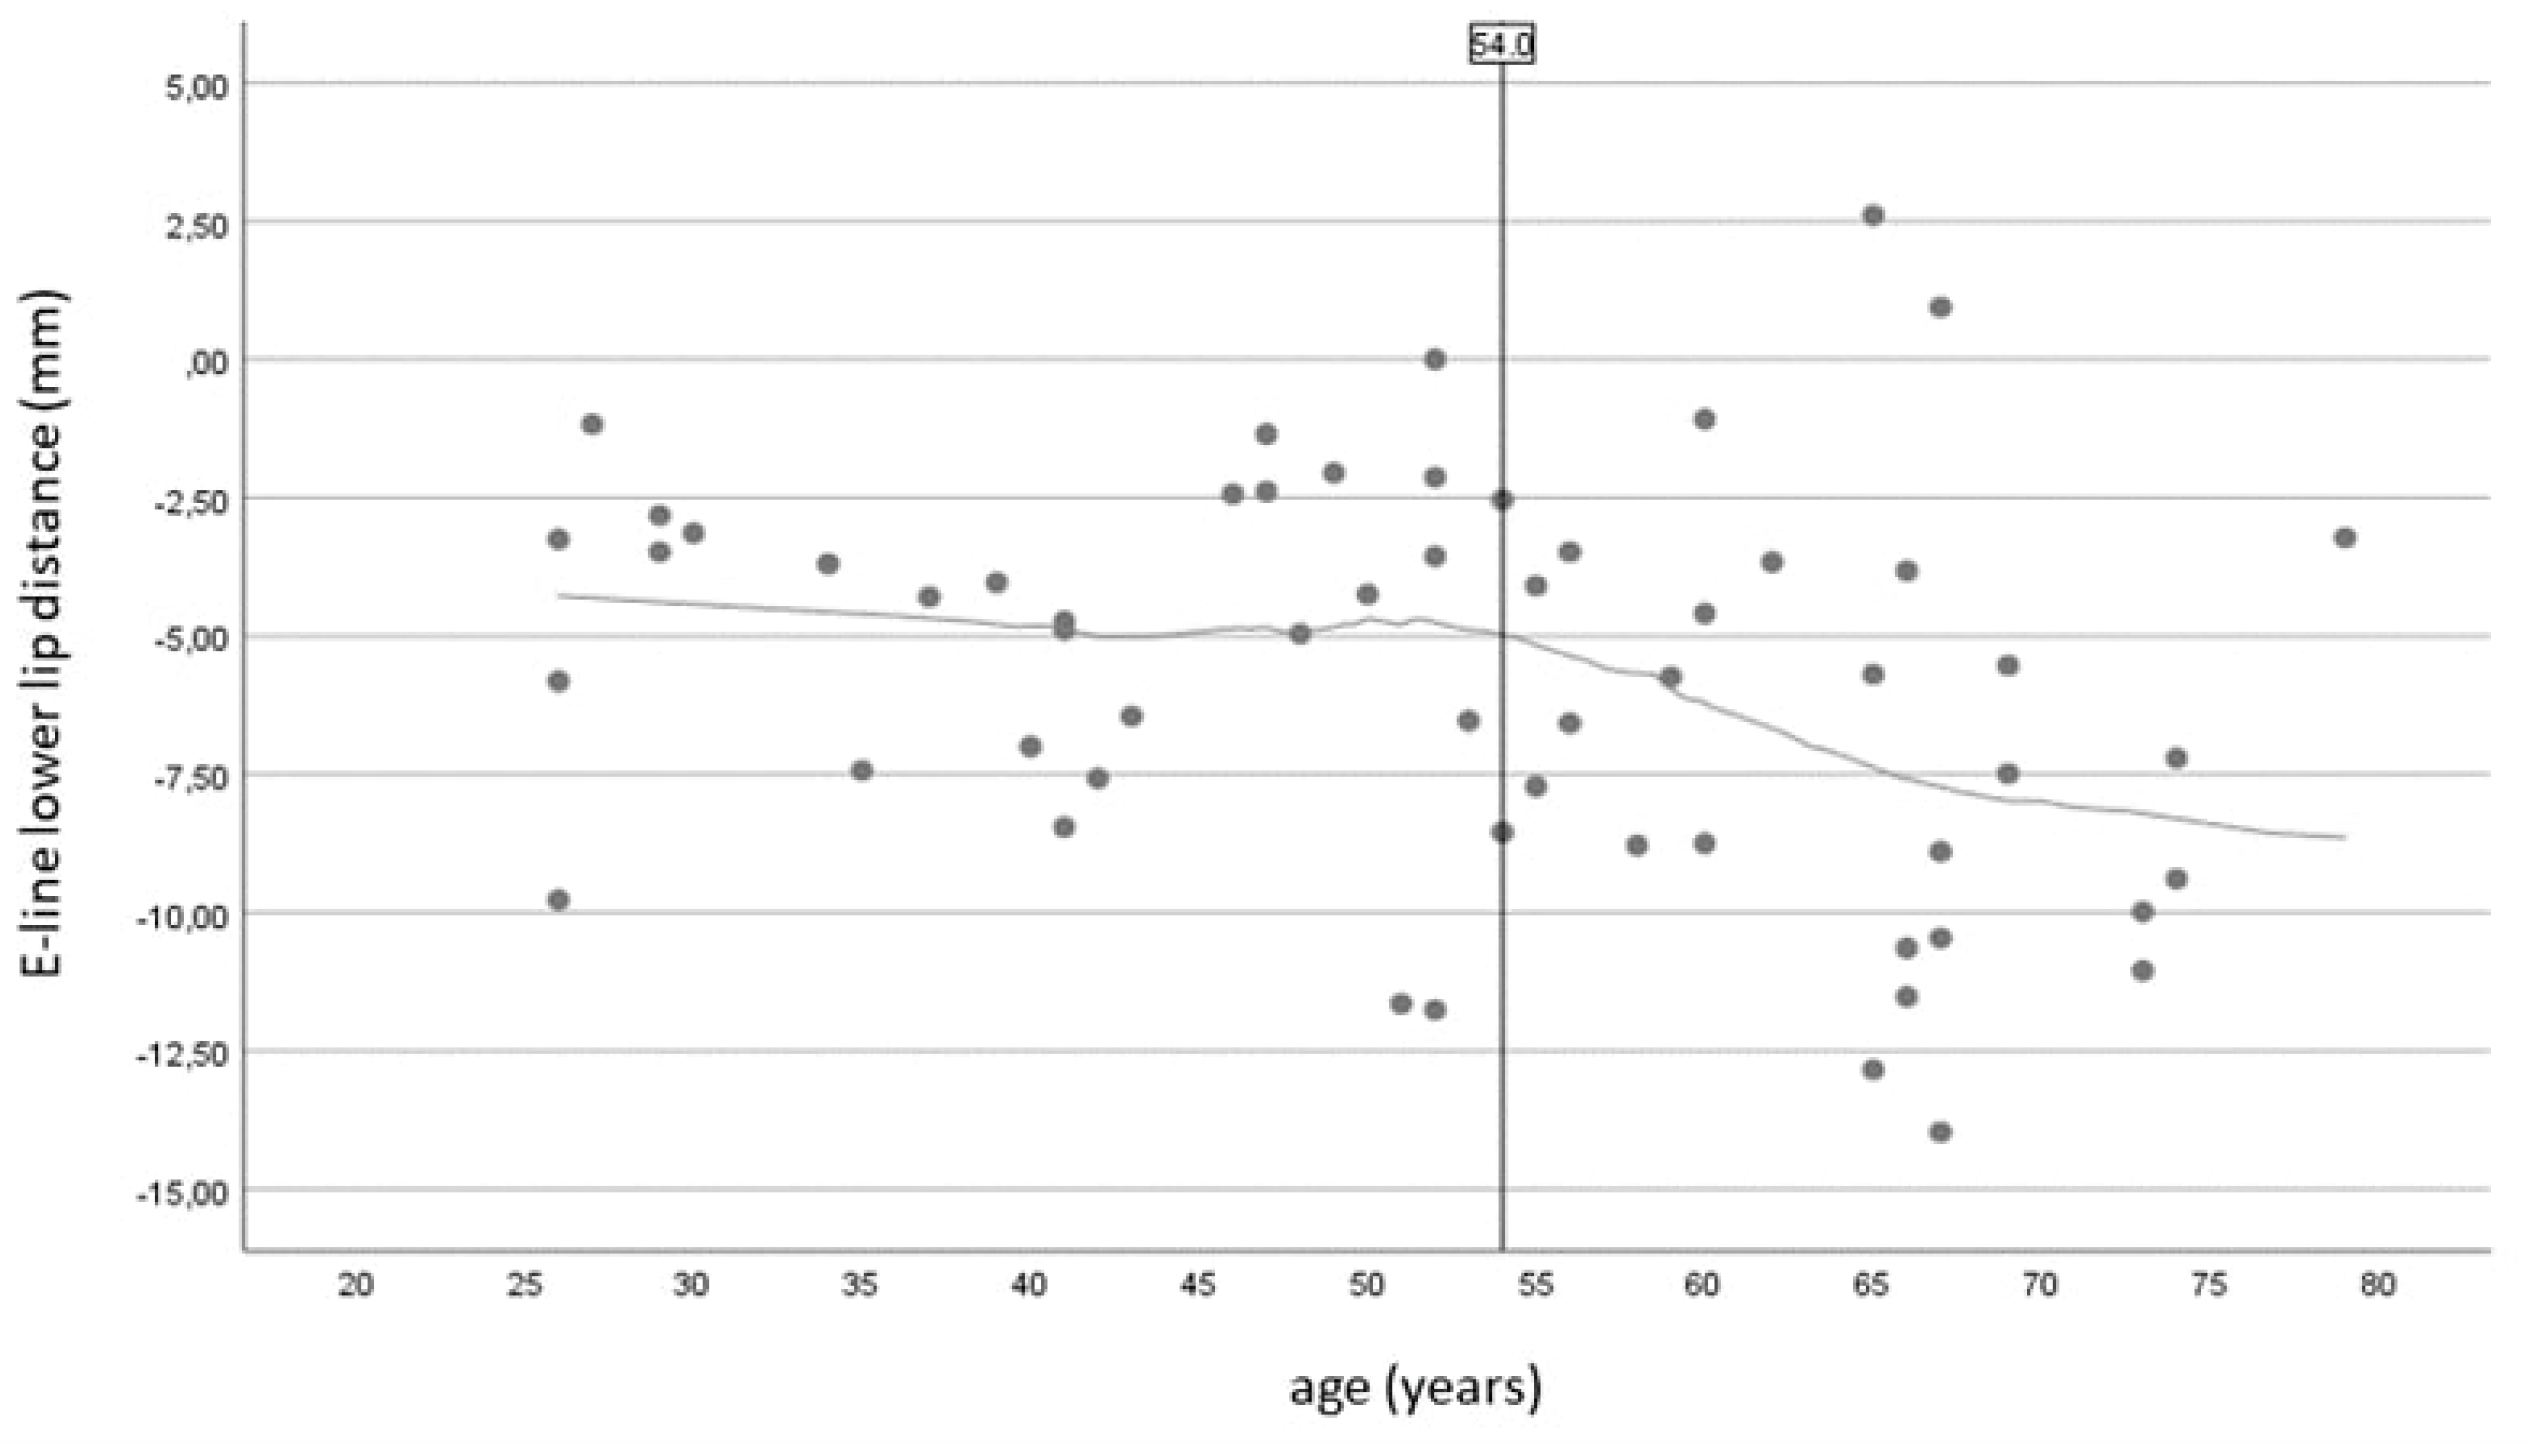
The point at which ageing becomes more apparent, as determined by the distance between the e-line and the upper or lower lip, is roughly 55 and 54 years old, respectively (Figure 6 and Figure 7).

Figure 7.
Scatter plot with Loess curve to visualize the correlation between age and the distance from the E-line to the lower lip.
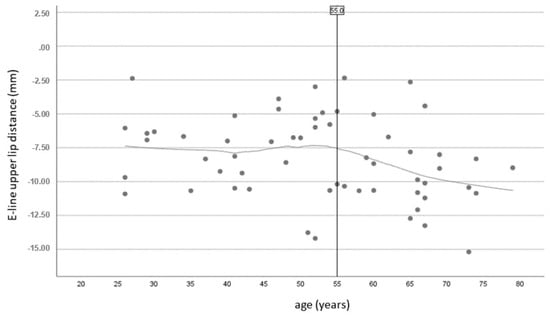
Figure 6.
Scatter plot with Loess curve to visualize the correlation between age and the distance from the E-line to the upper lip.
Figure 6.
Scatter plot with Loess curve to visualize the correlation between age and the distance from the E-line to the upper lip.

4. Discussion
The present study utilized two-dimensional digital photography to identify correlations between aesthetic facial parameters and factors such as sex and age. The facial anthropometric parameters for this study were chosen due to their wide use in everyday clinical practice, considering the effect of the ageing process on facial changes.
Although profile characteristics such as height and weight presented statistically significant differences, BMI did not influence the parameters studied. It could be argued that the p-value (0.402) could be considered limited as the significance level was set at 0.05. A larger sample with wider ranges of weight and height could potentially show a statistically significant BMI difference. However, this was beyond the scope of this study as it excluded athletes, individuals with high muscle mass, to overcome the limitations of the technical equipment, the height of the tripod and camera. However, the participants’ characteristics proved comparable, and the statistical approach adopted managed to highlight interesting variations between anthropometric and oral variables among different ages and sexes to monitor changes over time.
Moreover, the europrosopic (a broad face and ovoid-shaped dental arch with a facial index of 80–85 [39,40]) pattern was the dominant pattern as the average facial index in this study was within the normal range, and there were no statistically significant differences within age and sex. That the majority of the participants belonging to Angle class I (78%) was a finding in line with the pattern of the europrosopic sample, further revealing a larger lower third on average which was more prominent in men than the average of the middle third, which presented with higher values in females. It could be argued that a minor percentage (9%) of participants who belonged to Angle Class II had a facial index within the europrosopic range due to periodontal problems causing malocclusion since only 10% of the participants had healthy periodontal tissues. The marginal statistical significance found in overbite (p = 0.05) between males and females enhances this finding as it potentially contributes to the labial flaring of teeth due to tongue movement. One could argue that this condition had an impact on certain participants’ horizontal planes not being parallel to it, but this was not proven to be statistically significant, with a p-value of 0.08.
The correlation of facial measurements with the progression of time underscores the impact of the complex ageing process, which evolves individually among subjects. In modern dentistry, treatment planning for cases that require prosthodontic restorations is based on anthropometric measurements conducted in young adults which do not necessarily reflect the age of the actual patient [41,42,43]. Furthermore, most studies in the field of anthropometry tend to involve sample groups consisting of young people, i.e., from 18 to 30 years old [42,44,45,46,47,48], and rarely involve individuals up to 45 years old [33,49,50]. The present clinical study recruited individuals as a consecutive sample regarding age, males and females of the same race and with comparable profile characteristics, ranging from 26 to 79 years old. It allowed for an examination of how facial features change over time, making it a valuable contribution to the field as it captured the early, middle and late stages of the progression of facial ageing.
The fact that the distance between the pupil and the orbital point appears to shorten with age was an interesting finding of the present investigation. Changes in the distance between the eye pupil and the orbital point are of great importance for aesthetic and plastic interventions performed in this region to reduce wrinkles. Previous studies showed that the lower eyelid rises, and the orbital aperture widens with time [34,51]. However, the latter is not in line with the results of our study. The decrease recorded for this value in the study’s participants may be attributed to the distinct characteristics of the Greek-on-average population. The differences found in the dental and bone changes with age and sex in the middle and lower thirds are depicted in the alterations to the facial features’.
Furthermore, the nasolabial angle proved to decrease with age. This finding agrees with previous data [52]. Nose tip ptosis justifies the sharpening of the nasolabial angle as age progresses. This condition could be explained via Lambros’s theory of the clockwise rotation of the facial skeleton (upper and middle third) [14,34]. According to PDI, the sharpening of the nasolabial angle in the present study could also be associated with the large percentage of participants experiencing periodontal problems. Patients with periodontal disease often show changes in the position of the upper front teeth, such as labial inclination or flaring [53]. Moreover, previous studies found that the upper lip lengthens with age [54,55,56], whereas our study’s results did not indicate a statistically significant correlation of this parameter. The increases in the distances of the upper and lower lips from Ricketts’ esthetic line exhibit the suboptimal support of soft perioral tissues with age which is aggravated by dental pathology such as periodontal problems and the loss of FTUs. An analysis of the figures of the present study (Figure 2, Figure 3, Figure 4, Figure 5 and Figure 6) indicated that the age between 40 and 60 is an influential period concerning aesthetical facial changes, as reflected in the anthropometric parameters.
Furthermore, sex proved to play a statistically significant role in the anthropometric parameters in the Greek population in the present study. An interesting result was that the middle third of the face covers a more significant part of the vertical dimension in females, while the lower third is more extended in males. The recent literature also supports these data [56]. The above finding should be taken into consideration when restoring the vertical dimension of occlusion in edentulous patients, in full-arch implant restorations and in cases with decreased vertical dimension. These values contradict the classical Vitruvius trisection and Leonardo da Vinci’s aesthetic analysis, in which the percentages of the three-thirds of the face are supposed to be equal. Moreover, the Po-N-A and Po-N-B angles appear increased in male individuals compared to female. The latter should be taken into account for the sagittal plane when restoring the upper jaw with dental prostheses or when modifying and reforming the shape of the lips through the use of injectables in cosmetic medicine. It has also been reported that over the years, differences concerning aesthetic parameters between males and females are blurred, and that parameters such as the lower third of the face in adults turn out to be similar between the two sexes with time [57,58].
As far as the Greek population is concerned, anthropometric data are scarce in the literature [42,59], though it has been demonstrated that for most modern Greeks, the neoclassical facial canons are not valid [60]. In the present study, sex did not significantly impact the facial index, as mentioned in detail earlier, contrasting with one of the few studies found in the literature concerning the Greek population [59]. Furthermore, Zacharopoulos et al. [59] reported that the most common face types were the hyperleptoprosop and leptoprosop (long and narrow) types for males and the mesoprosop (medium) type for females. Anthropometric measurements vary among ethnic groups [23,24,25]. The latter elucidates the need for the further investigation and classification of the aesthetic analysis for each ethnic or racial group to obtain valid individual outcomes.
A limitation of the present study was that many participants were classified as overweight according to the WHO’s body mass index analysis. This distribution follows data reported by the World Health Organization (WHO) showing that 53.7% of the adult population (≥20 years) in Greece is overweight, and 20.1% is obese [61]. The high percentage of obesity among the participants may also be attributed to the lower socioeconomic level of the patients seeking dental treatment in a university setting. These aspects should be considered when forming groups of participants in future anthropometric research. The face of an overweight participant may present slight differences in the thickness of adipose tissue and curvatures when compared to patients of a physiologic weight. This was a random finding and should be considered when comparing the results of the present investigation with anthropometric measurements obtained in other countries. For female participants, the period of menopause and pre-menopause is accompanied by severe hormonal changes, potentially contributing to facial changes. The current investigation did not include this factor in the criteria for participation, which could be viewed as a limitation. A further limitation of the study is its cross-sectional design, which should also be acknowledged. In addition, the study was performed using two-dimensional photos. Digital protocols and a three-dimensional analysis could reduce the risk of measurement errors. Further studies including a larger population size would be helpful in estimating facial norms for each ethnic group and to provide guidance when planning plastic surgery, aesthetic interventions or extensive dental restorations.
5. Conclusions
In conclusion, within its limitations, the present study enriches the anthropometric data available for Caucasian populations with the inclusion of intraoral attributes. Age proved to significantly impact facial aesthetics, with the ageing process being more compromising for individuals between 40 and 60 years of age. Sex had a statistically significant impact on both anthropometric and oral variables. These data should be considered by plastic surgeons when performing facial aesthetic or reconstructive interventions, as well as by dentists and maxillofacial surgeons when restoring missing oral tissues and teeth and manufacturing prosthetic restorations.
Author Contributions
I.Y.: Methodology, Validation, Investigation, Resources, Data Curation, Writing—Original Draft, Visualisation. K.S.: Validation, Writing—Original Draft, Visualisation. A.T.: Writing—Review & Editing, Visualization. G.M.: Software, Validation, Formal analysis, Data Curation. V.A.: Conceptualization, Methodology, Validation, Data Curation, Writing—Review & Editing, Visualization, Supervision, Project administration. All authors have read and agreed to the published version of the manuscript.
Funding
This research received no external funding.
Informed Consent Statement
All the participants provided written informed consent, according to the Declaration of Helsinki, before the research procedures commenced. The participants completed the written informed consent form issued by Aristotle University of Thessaloniki School of Dentistry Ethical Committee (protocol number 23-02-2017/23).
Data Availability Statement
The data that support the findings of this study are available on request from the first author, [IY]. The data are not publicly available since they contain information that could compromise the privacy of research participants (photos of patients seeking treatment in AUTH).
Conflicts of Interest
The authors declare no conflict of interest.
References
- Laughter, M.R.; Anderson, J.B.; Maymone, M.B.C.; Kroumpouzos, G. Psychology of Aesthetics: Beauty, Social Media, and Body Dysmorphic Disorder. Clin. Dermatol. 2023, 41, 28–32. [Google Scholar] [CrossRef]
- Reilly, M.J.; Tomsic, J.A.; Fernandez, S.J.; Davison, S.P. Effect of Facial Rejuvenation Surgery on Perceived Attractiveness, Femininity, and Personality. JAMA Facial Plast. Surg. 2015, 17, 202–207. [Google Scholar] [CrossRef]
- Swift, A.; Liew, S.; Weinkle, S.; Garcia, J.K.; Silberberg, M.B. The Facial Aging Process From the “Inside Out”. Aesthetic Surg. J. 2021, 41, 1107–1119. [Google Scholar] [CrossRef]
- Coleman, S.R.; Grover, R. The anatomy of the aging face: Volume loss and changes in 3-dimensional topography. Aesthetic Surg. J. 2006, 26, S4–S9. [Google Scholar] [CrossRef]
- Bishara, S.E.; Treder, J.E.; Jakobsen, J.R. Facial and dental changes in adulthood. Am. J. Orthod. Dentofac. Orthop. 1994, 106, 175–186. [Google Scholar] [CrossRef]
- Albert, A.M.; Ricanek, K., Jr.; Patterson, E. A review of the literature on the aging adult skull and face: Implications for forensic science research and applications. Forensic Sci. Int. 2007, 172, 1–9. [Google Scholar] [CrossRef]
- Koudelová, J.; Hoffmannová, E.; Dupej, J.; Velemínská, J. Simulation of facial growth based on longitudinal data: Age progression and age regression between 7 and 17 years of age using 3D surface data. PLoS ONE 2019, 14, e0212618. [Google Scholar] [CrossRef]
- Cotofana, S.; Fratila, A.A.M.; Schenck, T.L.; Redka-Swoboda, W.; Zilinsky, I.; Pavicic, T. The Anatomy of the Aging Face: A Review. Facial Plast. Surg. 2016, 32, 253–260. [Google Scholar]
- Ilankovan, V. Anatomy of ageing face. Br. J. Oral Maxillofac. Surg. 2014, 52, 195–202. [Google Scholar] [CrossRef]
- Gierloff, M.; Stöhring, C.; Buder, T.; Gassling, V.; Açil, Y.; Wiltfang, J. Aging changes of the midfacial fat compartments: A computed tomographic study. Plast. Reconstr. Surg. 2012, 129, 263–273. [Google Scholar] [CrossRef]
- Shaw, R.B.; Kahn, D.M. Aging of the Midface Bony Elements: A Three-Dimensional Computed Tomographic Study. Plast. Reconstr. Surg. 2007, 119, 675–681. [Google Scholar] [CrossRef] [PubMed]
- Morera Serna, E.; Serna Benbassat, M.; Terré Falcón, R.; Murillo Martín, J. Anatomy and Aging of the Perioral Region. Facial Plast. Surg. 2021, 37, 176–193. [Google Scholar] [CrossRef] [PubMed]
- Pecora, N.G.; Baccetti, T.; McNamara, J.A. The aging craniofacial complex: A longitudinal cephalometric study from late adolescence to late adulthood. Am. J. Orthod. Dentofac. Orthop. 2008, 134, 496–505. [Google Scholar] [CrossRef] [PubMed]
- Pessa, J.E. An Algorithm of Facial Aging: Verification of Lambros’s Theory by Three-Dimensional Stereolithography, with Reference to the Pathogenesis of Midfacial Aging, Scleral Show, and the Lateral Suborbital Trough Deformity. Plast. Reconstr. Surg. 2000, 106, 479–488. [Google Scholar] [CrossRef] [PubMed]
- Shaw, R.B.; Katzel, E.B.; Koltz, P.F.; Kahn, D.M.; Girotto, J.A.; Langstein, H.N. Aging of the Mandible and Its Aesthetic Implications. Plast. Reconstr. Surg. 2010, 125, 332–342. [Google Scholar] [CrossRef] [PubMed]
- Munn, L.; Stephan, C.N. Changes in Face Topography from Supine-to-Upright Position—And Soft Tissue Correction Values for Craniofacial Identification. Forensic Sci. Int. 2018, 289, 40–50. [Google Scholar] [CrossRef]
- Stephan, C.N.; Preisler, R. In Vivo Facial Soft Tissue Thicknesses of Adult Australians. Forensic Sci. Int. 2018, 282, 220.e1–220.e12. [Google Scholar] [CrossRef]
- Švábová, P.; Matláková, M.; Beňuš, R.; Chovancová, M.; Masnicová, S. The Relationship between Biological Parameters and Facial Soft Tissue Thickness Measured by Ultrasound and Its Forensic Implications. Med. Sci. Law 2023, 20, 258024231182360. [Google Scholar] [CrossRef]
- Meikle, B.; Stephan, C.N. B-Mode Ultrasound Measurement of Facial Soft Tissue Thickness for Craniofacial Identification: A Standardized Approach. J. Forensic Sci. 2020, 65, 939–947. [Google Scholar] [CrossRef]
- El Rhazi, M.; Zarghili, A.; Majda, A.; Bouzalmat, A.; Oufkir, A.A. Facial Beauty Analysis by Age and Gender. Int. J. Intell. Syst. Technol. Appl. 2019, 18, 179–203. [Google Scholar] [CrossRef]
- Czumbel, L.M.; Farkasdi, S.; Gede, N.; Mikó, A.; Csupor, D.; Lukács, A.; Gaál, V.; Kiss, S.; Hegyi, P.; Varga, G. Hyaluronic Acid Is an Effective Dermal Filler for Lip Augmentation: A Meta-Analysis. Front. Surg. 2021, 8, 681028. [Google Scholar] [CrossRef] [PubMed]
- Li, X.; Sui, C.; Xia, X.; Chen, X. Efficacy and Safety of Botulinum Toxin Type A for Treatment of Glabellar Lines: A Network Meta-Analysis of Randomized Controlled Trials. Aesthetic Plast. Surg. 2023, 47, 365–377. [Google Scholar] [CrossRef] [PubMed]
- Choe, K.S.; Sclafani, A.P.; Litner, J.A.; Yu, G.-P.; Romo, T. The Korean American woman’s face: Anthropometric measurements and quantitative analysis of facial aesthetics. Arch. Facial Plast. Surg. 2004, 6, 244–252. [Google Scholar] [CrossRef] [PubMed]
- Farkas, L.G.; Katic, M.J.; Forrest, C.R. Comparison of craniofacial measurements of young adult African-American and North American white males and females. Ann. Plast. Surg. 2007, 59, 692–698. [Google Scholar] [CrossRef]
- Husein, O.F.; Sepehr, A.; Garg, R.; Sina-Khadiv, M.; Gattu, S.; Waltzman, J.; Wu, E.C.; Shieh, M.; Heitmann, G.M.; Galle, S.E. Anthropometric and aesthetic analysis of the Indian American woman’s face. J. Plast. Reconstr. Aesthetic Surg. 2010, 63, 1825–1831. [Google Scholar] [CrossRef]
- Naka, O.; Anastassiadou, V.; Pissiotis, A. Association between functional tooth units and chewing ability in older adults: A systematic review. Gerodontology 2012, 31, 166–177. [Google Scholar] [CrossRef]
- Edelstein, D.R. Aging of the Normal Nose in Adults. Laryngoscope 1996, 106, 1–25. [Google Scholar] [CrossRef]
- Glass, L.R.D.; Lira, J.; Enkhbold, E.; Dimont, E.; Scofield, S.; Sherwood, P.R.; Winn, B.J. The lateral brow: Position in relation to age, gender, and ethnicity. Ophthalmic Plast. Reconstr. Surg. 2014, 30, 295–300. [Google Scholar] [CrossRef]
- Lee, M.; Chung, D.H.; Lee, J.; Cha, K. Assessing soft-tissue characteristics of facial asymmetry with photographs. Am. J. Orthod. Dentofac. Orthop. 2010, 138, 23–31. [Google Scholar] [CrossRef]
- Meneghini, F.; Biondi, P. Clinical Facial Analysis. In Clinical Facial Analysis: Elements, Principles, and Techniques, 2nd ed.; Springer: Berlin/Heidelberg, Germany, 2012. [Google Scholar]
- Prokopakis, E.P.; Vlastos, I.M.; Picavet, V.A.; Nolst Trenite, G.; Thomas, R.; Cingi, C.; Hellings, P.W. The Golden Ratio in Facial Symmetry. Rhinology 2013, 51, 18–21. [Google Scholar] [CrossRef]
- Kaya, K.S.; Türk, B.; Cankaya, M.; Seyhun, N.; Coşkun, B.U. Assessment of Facial Analysis Measurements by Golden Proportion. Braz. J. Otorhinolaryngol. 2019, 85, 494–501. [Google Scholar] [CrossRef] [PubMed]
- Bidra, A.S.; Uribe, F.; Taylor, T.D.; Agar, J.R.; Rungruanganunt, P.; Neace, W.P. The Relationship of Facial Anatomic Landmarks with Midlines of the Face and Mouth. J. Prosthet. Dent. 2009, 102, 94–103. [Google Scholar] [CrossRef] [PubMed]
- Lambros, V. Observations on Periorbital and Midface Aging. Plast. Reconstr. Surg. 2007, 120, 1367–1376. [Google Scholar] [CrossRef] [PubMed]
- Rasband, W.S. ImageJ; U.S. National Institutes of Health: Bethesda, MD, USA, 1997–2015. Available online: https://imagej.nih.gov/ij/ (accessed on 15 March 2023).
- Jacoby, W.G. Loess: A nonparametric, graphical tool for depicting relationships between variables. Elect. Stud. 2000, 19, 577–613. [Google Scholar] [CrossRef]
- Mehta, C.R.; Patel, N.R. A network algorithm for performing fisher’s exact test in r × c contingency tables. J. Am. Stat. Assoc. 1983, 78, 427–434. [Google Scholar] [CrossRef]
- Mehta, C.R.; Patel, N.R.; SPSS Inc. SPSS Exact Tests 7.0 for Windows; Educational Gerontology; SPSS Incorporated: Chicago, IL, USA, 1996; Volume 37. [Google Scholar]
- Maalman, R.S.-E.; Abaidoo, C.S.; Darko, D.N.; Tetteh, J. Facial Types and Morphology: A study among Sisaala and Dagaaba adult population in the Upper West Region, Ghana. Sci. Afr. 2019, 3, e00071. [Google Scholar] [CrossRef]
- Shetti, V.R.; Pai, S.R.; Sneha, G.K.; Gupta, C.; Chethan, P.; Soumya. Study of Prosopic (Facial) Index of Indian and Malaysian Students. Int. J. Morphol. 2011, 29, 1018–1021. [Google Scholar] [CrossRef]
- Arnett, G.W.; Bergman, R.T. Facial keys to orthodontic diagnosis and treatment planning. Part I. Am. J. Orthod. Dentofac. Orthop. 1993, 103, 299–312. [Google Scholar] [CrossRef]
- Farkas, L.G.; Katic, M.J.; Forrest, C.R. International Anthropometric Study of Facial Morphology in Various Ethnic Groups/Races. J. Craniofacial Surg. 2005, 16, 615–646. [Google Scholar] [CrossRef]
- Rifkin, R. Facial analysis: A comprehensive approach to treatment planning in aesthetic dentistry. Pract. Periodontics Aesthetic Dent. 2000, 12, 865–871. [Google Scholar]
- Amini, F.; Mashayekhi, Z.; Rahimi, H.; Morad, G. Craniofacial morphologic parameters in a Persian population: An anthropometric study. J. Craniofacial Surg. 2014, 25, 1874–1881. [Google Scholar] [CrossRef] [PubMed]
- Bozkir, M.G.; Karakas, P.; Oguz, Ö.; Oguz, O.; Oguz, Ö. Vertical and horizontal neoclassical facial canons in Turkish young adults. Surg. Radiol. Anat. 2004, 26, 212–219. [Google Scholar] [CrossRef] [PubMed]
- Hossain, M.G.; Lestrel, P.E.; Ohtsuki, F. Secular changes in head dimensions of Japanese adult male students over eight decades. HOMO 2005, 55, 239–250. [Google Scholar] [CrossRef] [PubMed]
- Sadacharan, C.M. Vertical and horizontal facial proportions of Indian American men. Anat. Cell Biol. 2016, 49, 125. [Google Scholar] [CrossRef]
- van den Bosch, W.A.; Leenders, I.; Mulder, P. Topographic anatomy of the eyelids, and the effects of sex and age. Br. J. Ophthalmol. 1999, 83, 347–352. [Google Scholar] [CrossRef]
- Bishara, S.E.; Jakobsen, J.R.; Hession, T.J.; Treder, J.E. Soft tissue profile changes from 5 to 45 years of age. Am. J. Orthod. Dentofac. Orthop. 1998, 114, 698–706. [Google Scholar] [CrossRef]
- Owens, E.G.; Goodacre, C.J.; Loh, P.L.; Hanke, G.; Okamura, M.; Jo, K.; Muñoz, C.A.; Naylor, W.P. A multicenter interracial study of facial appearance. Part 1: A comparison of extraoral parameters. Int. J. Prosthodont. 2002, 15, 273–282. [Google Scholar]
- Kahn, D.M.; Shaw, R.B. Aging of the bony orbit: A three-dimensional computed tomographic study. Aesthetic Surg. J. 2008, 28, 258–264. [Google Scholar] [CrossRef]
- Helal, H.A.; Ghanem, M.A.M.; Al-Badawy, A.M.; Abdel Haleem, M.M.; Mousa, M.H. Histological and Anthropometric Changes in the Aging Nose. Aesthetic Surg. J. 2019, 39, 943–952. [Google Scholar] [CrossRef]
- Towfighi, P.P.; Brunsvold, M.A.; Storey, A.T.; Arnold, R.M.; Willman, D.E.; McMahan, C.A. Pathologic Migration of Anterior Teeth in Patients With Moderate to Severe Periodontitis. J. Periodontol. 1997, 68, 967–972. [Google Scholar] [CrossRef]
- Doll, C.; Nahles, G.; Voss, J.O.; Sachse, C.; Nelson, K.; Damaskos, W.; Nahles, S. Age-Related Changes of the Orolabial Region in Caucasian Women: An Anthropometric Analysis. J. Oral Maxillofac. Surg. 2016, 74, 2497–2503. [Google Scholar] [CrossRef] [PubMed]
- Iblher, N.; Kloepper, J.; Penna, V.; Bartholomae, J.P.; Stark, G.B. Changes in the aging upper lip—A photomorphometric and MRI-based study (on a quest to find the right rejuvenation approach). J. Plast. Reconstr. Aesthetic Surg. 2008, 61, 1170–1176. [Google Scholar] [CrossRef] [PubMed]
- Modabber, A.; Peters, F.; Galster, H.; Kniha, K.; Bock, A.; Ghassemi, M.; Hölzle, F.; Möhlhenrich, S.C. Gender-dependent impact of aging on facial proportions. J. Orofac. Orthop. 2019, 80, 165–173. [Google Scholar] [CrossRef] [PubMed]
- Berneburg, M.; Dietz, K.; Niederle, C.; Göz, G. Changes in esthetic standards since 1940. Am. J. Orthod. Dentofac. Orthop. 2010, 137, 450.e1–450.e9. [Google Scholar] [CrossRef]
- Farkas, L.G.; Katic, M.J.; Hreczko, T.A.; Deutsch, C.; Munro, I.R. Anthropometric proportions in the upper lip-lower lip-chin area of the lower face in young white adults. Am. J. Orthod. 1984, 86, 52–60. [Google Scholar] [CrossRef]
- Zacharopoulos, G.V.; Manios, A.; Kau, C.H.; Velagrakis, G.; Tzanakakis, G.N.; De Bree, E. Anthropometric Analysis of the Face. J. Craniofacial Surg. 2016, 27, e71–e75. [Google Scholar] [CrossRef]
- Zacharopoulos, G.V.; Manios, A.; De Bree, E.; Kau, C.H.; Petousis, M.; Zacharopoulou, I.; Kouremenos, N. Neoclassical facial canons in young adults. J. Craniofacial Surg. 2012, 23, 1693–1698. [Google Scholar] [CrossRef]
- World Health Organization; Regional Office for Europe. Nutrition, Physical Activity and Obesity Greece. 2013. Available online: http://www.euro.who.int/en/nutrition-country-profiles (accessed on 20 May 2023).
Disclaimer/Publisher’s Note: The statements, opinions and data contained in all publications are solely those of the individual author(s) and contributor(s) and not of MDPI and/or the editor(s). MDPI and/or the editor(s) disclaim responsibility for any injury to people or property resulting from any ideas, methods, instructions or products referred to in the content. |
© 2023 by the authors. Licensee MDPI, Basel, Switzerland. This article is an open access article distributed under the terms and conditions of the Creative Commons Attribution (CC BY) license (https://creativecommons.org/licenses/by/4.0/).