
Analysis of Peak Ground Acceleration and Seismogenic Fault Characteristics of the Mw7.8 Earthquake in Turkey

Abstract
:Featured Application
Abstract
1. Introduction
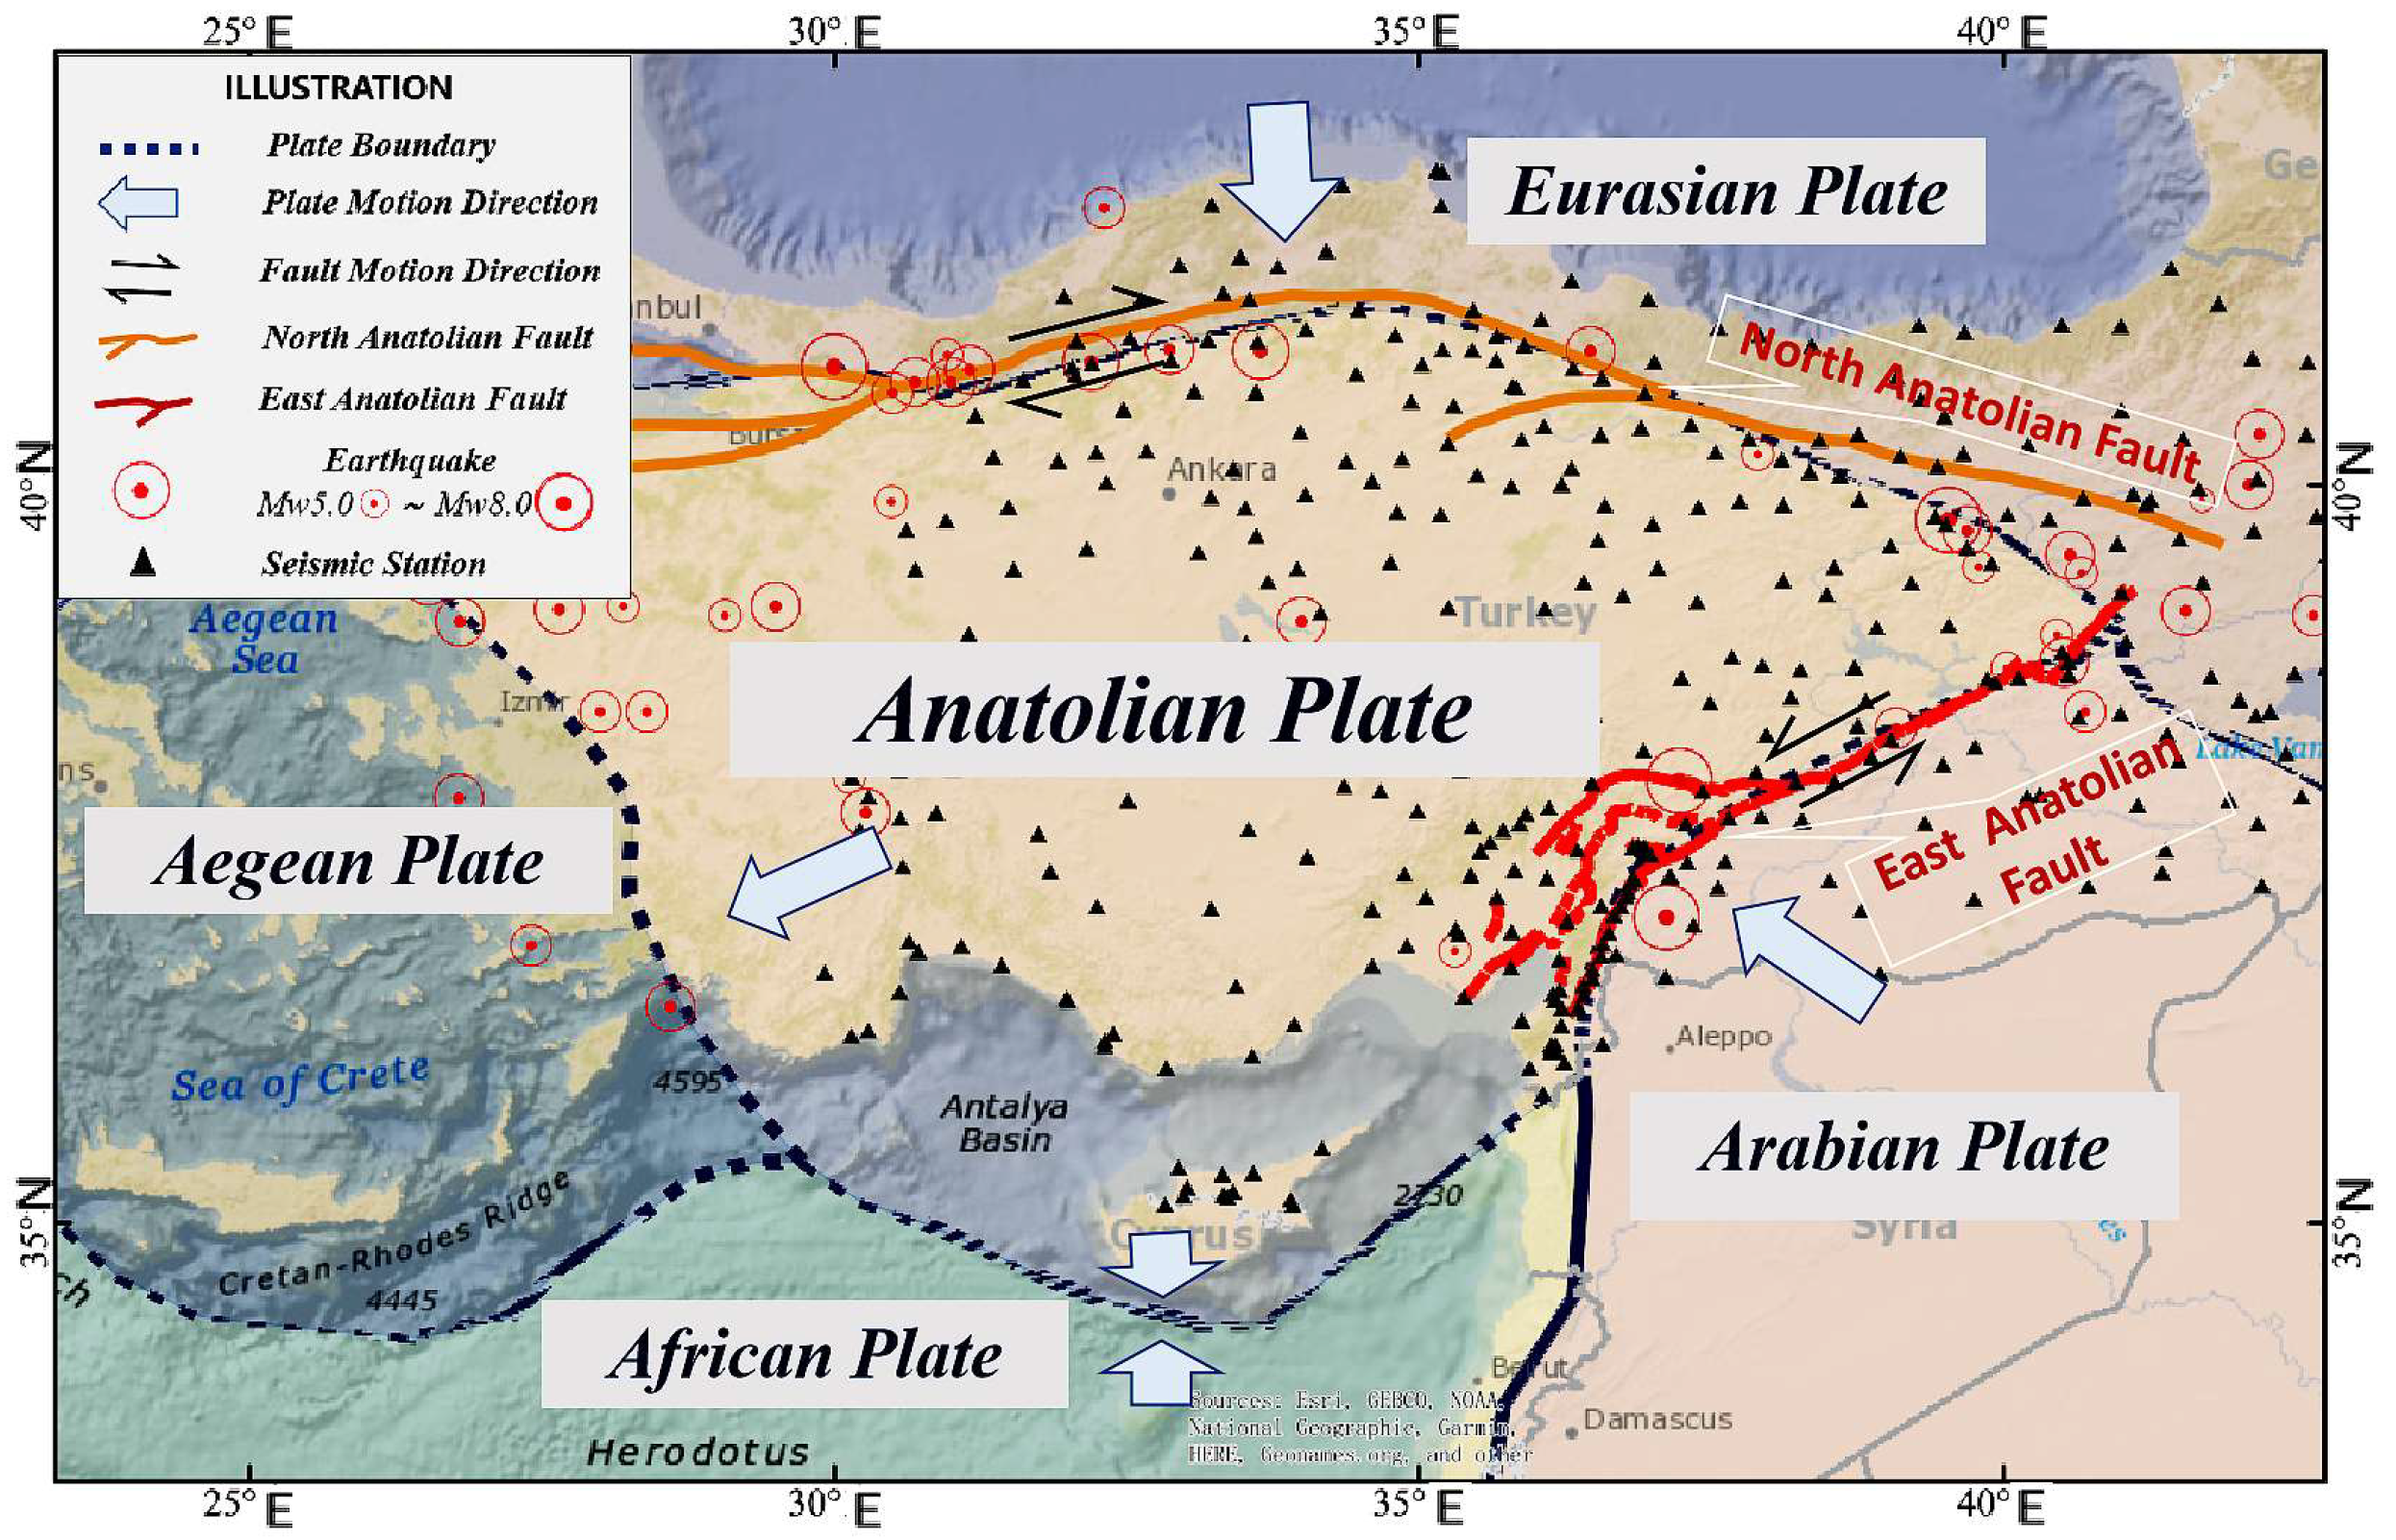
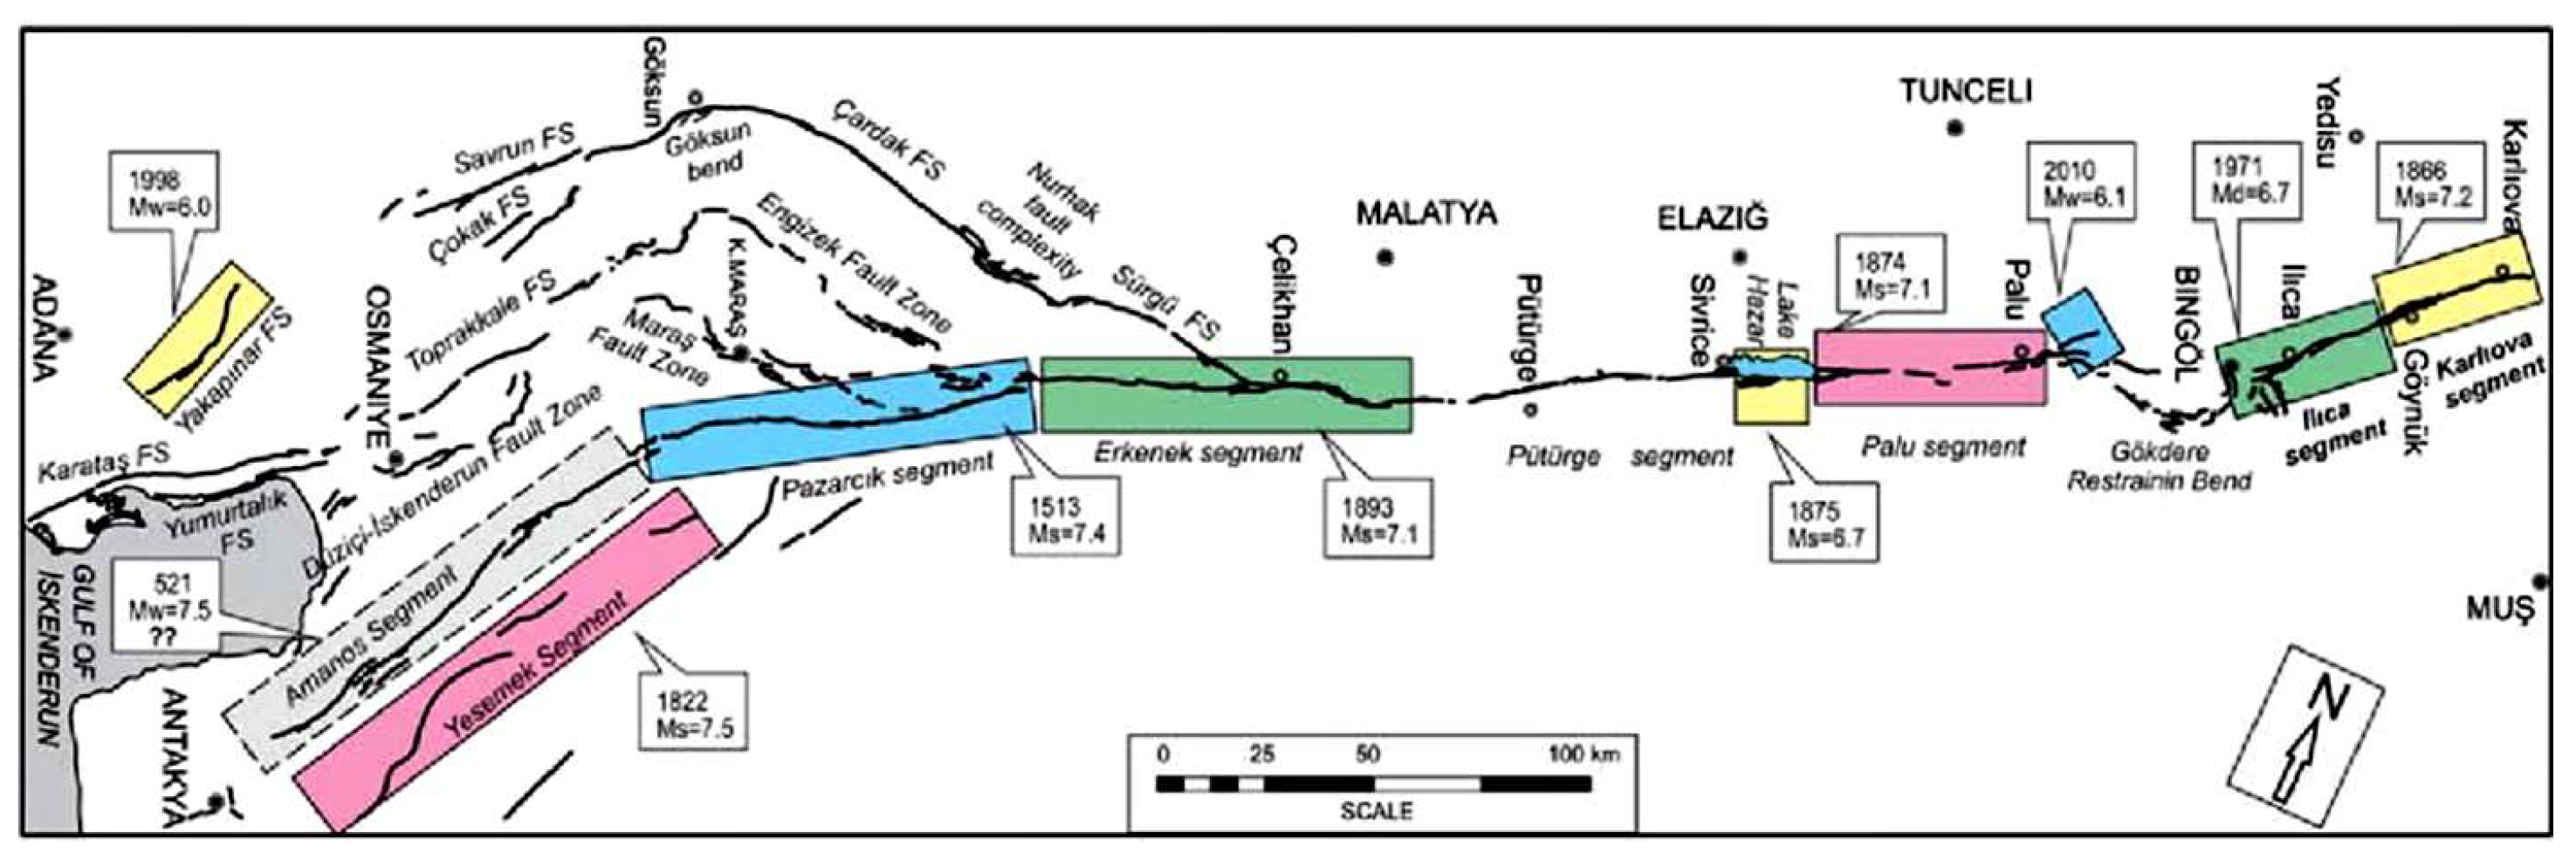
2. Regional Tectonics and Earthquake Overview
3. Materials and Methods
3.1. Data Sources
3.2. Strong Motion Record Screening and Processing
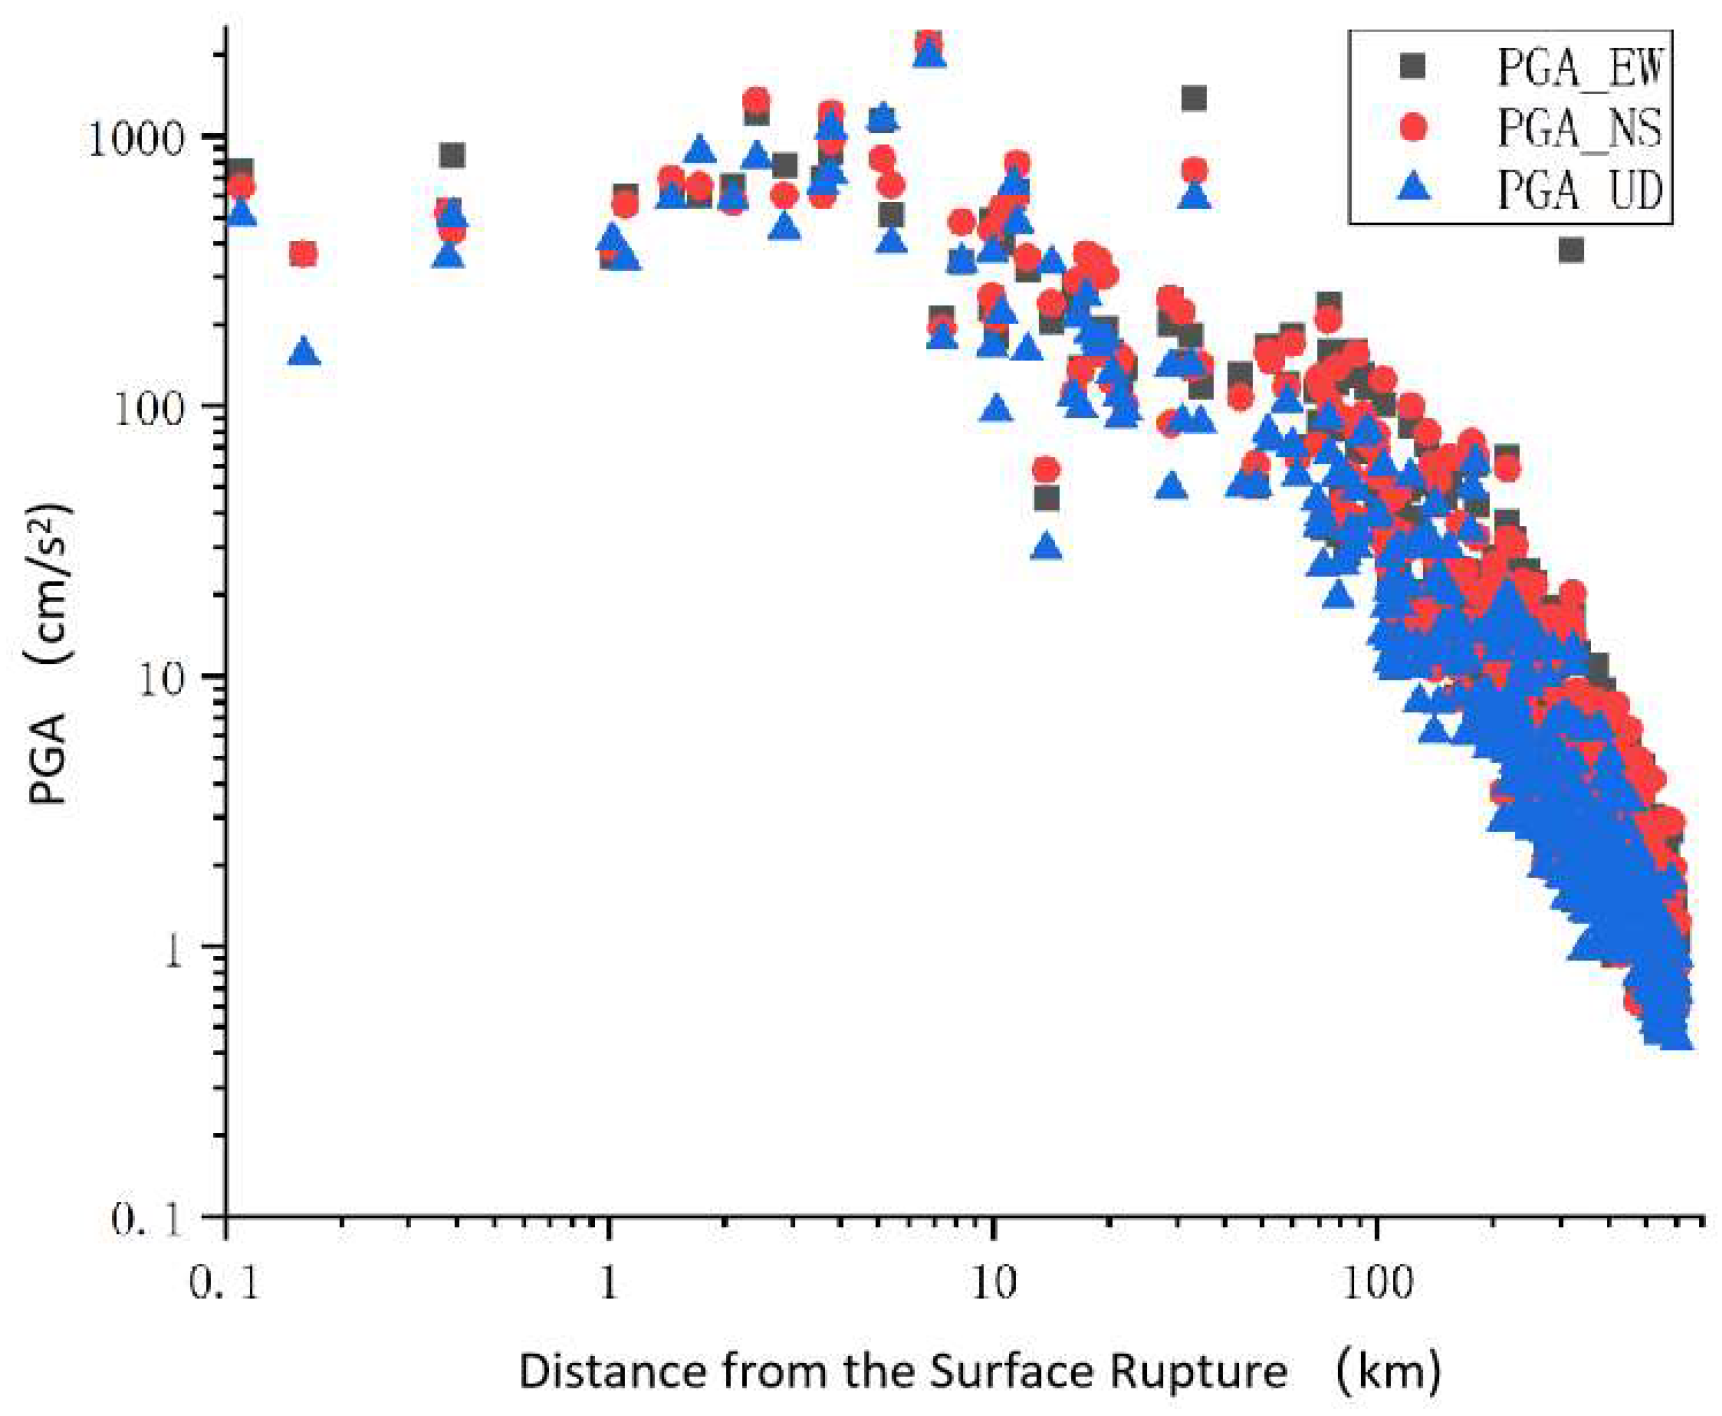
3.3. Preliminary Analysis of the Characteristics of PGA Distribution
4. Discussion
4.1. Discussion on Concentration of Near-Fault Strong Ground Motions
4.2. Discussion on Locked Segment Effect
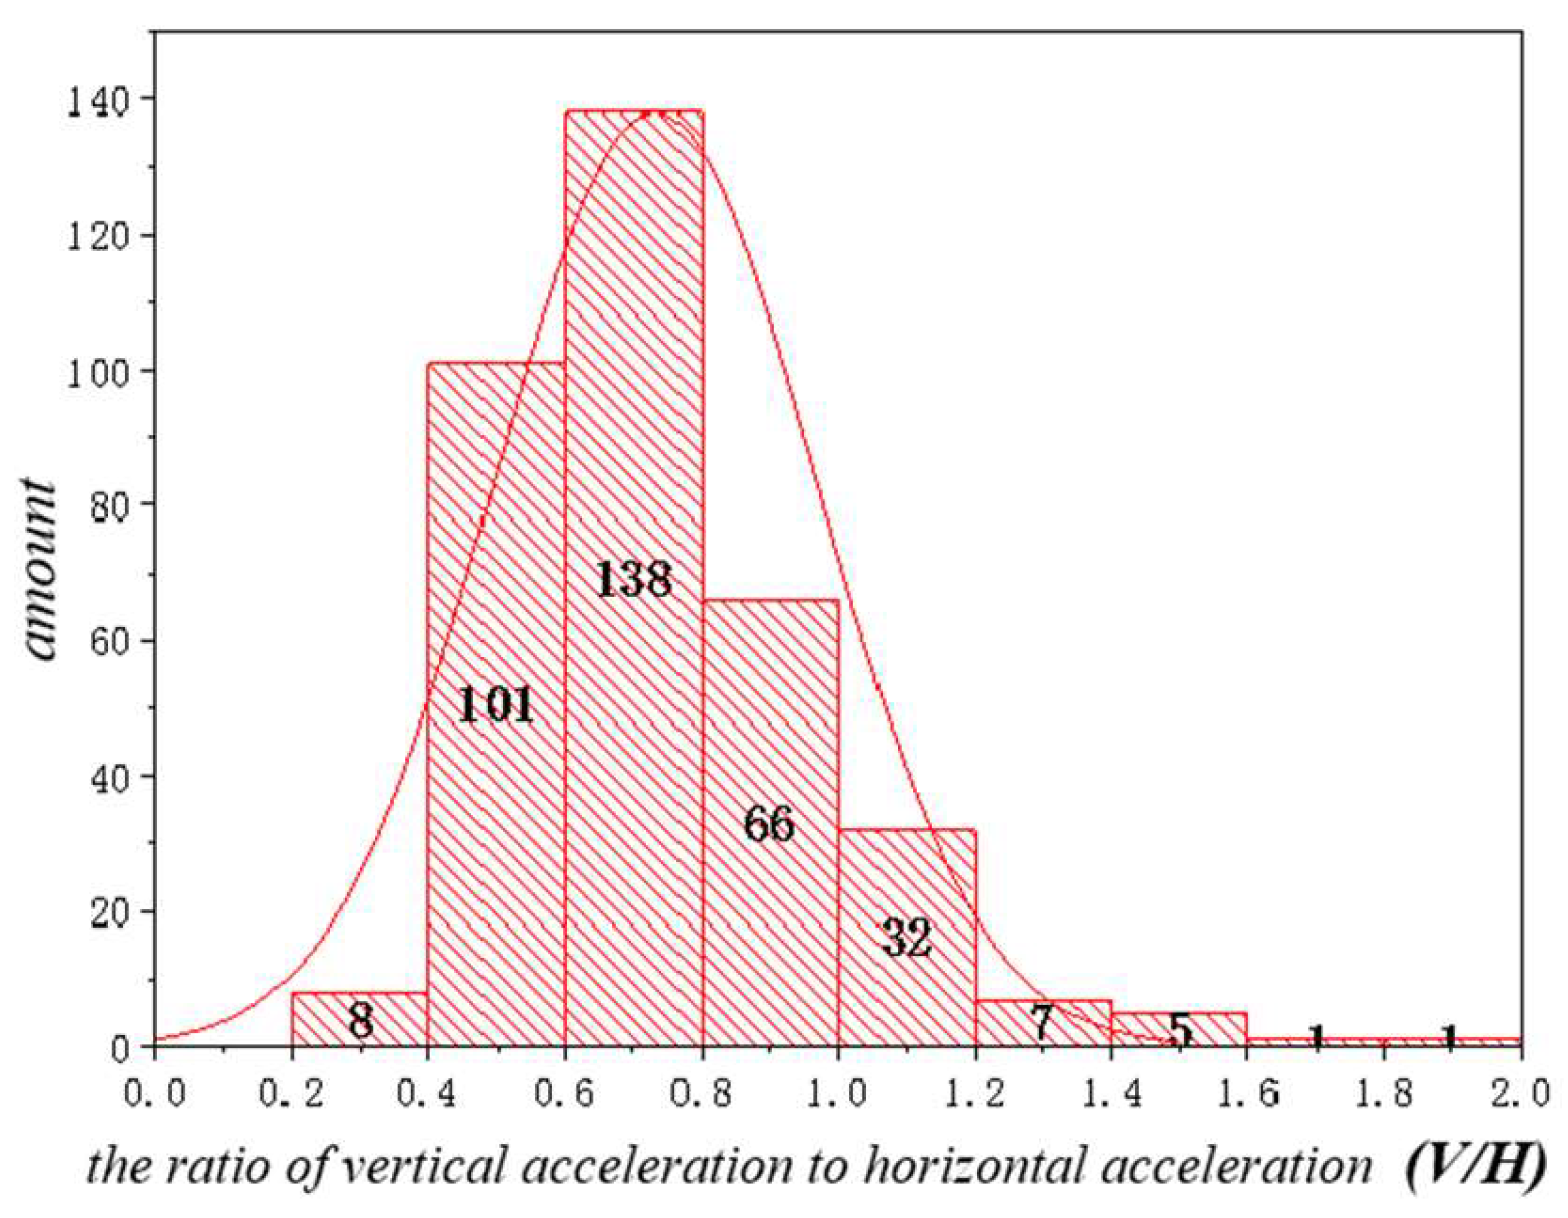
4.3. Discussion on the Trampoline Effect
5. Conclusions
Author Contributions
Funding
Institutional Review Board Statement
Informed Consent Statement
Data Availability Statement
Acknowledgments
Conflicts of Interest
References
- Sandıkkaya, M.A.; Yılmaz, M.T.; Bakır, B.S.; Yılmaz, Ö. Site classification of Turkish national strong-motion stations. J. Seismol. 2010, 14, 543–563. [Google Scholar] [CrossRef]
- Akkar, S.; Çağnan, Z.; Yenier, E.; Erdoğan, Ö.; Sandıkkaya, M.A.; Gülkan, P. The recently compiled Turkish strong motion database: Preliminary investigation for seismological parameters. J. Seismol. 2012, 14, 457–479. [Google Scholar] [CrossRef]
- Frontiers. Relationship Between Asperities and Velocity Pulse Generation Mechanism. Available online: https://www.frontiersin.org/articles/10.3389/feart.2022.843532/full (accessed on 1 June 2023).
- Akkar, S.; Bommer, J.J. Prediction of elastic displacement response spectra in Europe and the Middle East. Earthq. Eng. Struct. Dyn. 2007, 36, 1275–1301. [Google Scholar] [CrossRef]
- Beyhan, G.; Keskinsezer, A.; Kafadar, Ö. Analysis of strong ground motion data from the Van earthquake (Turkey), 2011. Geomech. Geophys. Geo-Energy Geo-Resour. 2019, 5, 253–270. [Google Scholar] [CrossRef]
- Akkar, S.; Bommer, J.J. Empirical equations for the prediction of PGA, PGV, and spectral accelerations in Europe, the Mediterranean region, and the Middle East. Seismol. Res. Lett. 2010, 81, 195–206. [Google Scholar] [CrossRef]
- Sandeep, S.D.; Parveen Kumar, M.; Kumar, R. Strong motion modelling of the 1999 Izmit Earthquake using site effect in a semi-empirical technique: A more realistic approach. Pure Appl. Geophys. 2022, 179, 483–497. [Google Scholar] [CrossRef]
- Chen, W.; Rao, G.; Kang, D.; Wan, Z.; Wang, D. Early report of the source characteristics, ground motions, and casualty estimates of the 2023 M w 7.8 and 7.5 Turkey earthquakes. J. Earth Sci. 2023, 34, 297–303. [Google Scholar] [CrossRef]
- Aochi, H.; Durand, V.; Douglas, J. Influence of super-shear earthquake rupture models on simulated near-source ground motion from the 1999 Izmit, Turkey, earthquake. Bull. Seismol. Soc. Am. 2011, 101, 726–741. [Google Scholar] [CrossRef]
- Askan, A.; Karimzadeh, S.; Bilal, M. Seismic Intensity Maps for the Eastern Part of the North Anatolian Fault Zone (Turkey) Based on Recorded and Simulated Ground-Motion Data. In Active Global Seismology: Neotectonics and Earthquake Potential of the Eastern Mediterranean Region; American Geophysical Union: Washington, DC, USA, 2017; pp. 273–287. [Google Scholar] [CrossRef]
- Büyüksaraç, A.; Işık, E.; Bektaş, Ö. A comparative evaluation of earthquake code change on seismic parameter and structural analysis; a case of Turkey. Arab. J. Sci. Eng. 2022, 47, 12301–12321. [Google Scholar] [CrossRef]
- Cremen, G.; Galasso, C.; Zuccolo, E. Investigating the potential effectiveness of earthquake early warning across Europe. Nat. Commun. 2022, 13, 639. [Google Scholar] [CrossRef]
- Byun, J.E.; D’Ayala, D. Urban seismic resilience mapping: A transportation network in Istanbul, Turkey. Sci. Rep. 2022, 12, 8188. [Google Scholar] [CrossRef] [PubMed]
- Jackson, J.; McKenzie, D. The relationship between plate motions and seismic moment tensors, and the rates of active deformation in the Mediterranean and Middle East. Geophys. J. Int. 1988, 93, 45–73. [Google Scholar] [CrossRef]
- Jackson, J. Partitioning of strike-slip and convergent motion between Eurasia and Arabia in eastern Turkey and the Caucasus. J. Geophys. Res. Atmos. 1992, 97, 12471–12479. [Google Scholar] [CrossRef]
- Westaway, R.O.B.; Arger, J.A.N. The Gölbaºi basin, southeastern Turkey: A complex discontinuity in a major strike-slip fault zone. J. Geol. Soc. 1996, 153, 729–744. [Google Scholar] [CrossRef]
- Stein, R.S.; Barka, A.A.; Dieterich, J.H. Progressive failure on the North Anatolian fault since 1939 by earthquake stress triggering. Geophys. J. Int. 1997, 128, 594–604. [Google Scholar] [CrossRef]
- Taymaz, T.; Eyidogãn, H.; Jackson, J. Source parameters of large earthquakes in the East Anatolian Fault Zone (Turkey). Geophys. J. Int. 1991, 106, 537–550. [Google Scholar] [CrossRef]
- Wang, Z.; Zhang, W.; Taymaz, T.; He, Z.; Xu, T.; Zhang, Z. Dynamic rupture process of the 2023 Mw 7.8 Kahramanmaraş earthquake (SE Türkiye): Variable rupture speed and implications for seismic hazard. Geophys. Res. Lett. 2023, 50, e2023GL104787. [Google Scholar] [CrossRef]
- Ozkula, G.; Dowell, R.K.; Baser, T.; Lin, J.L.; Numanoglu, O.A.; Ilhan, O.; Olgun, C.G.; Huang, C.W.; Uludag, T.D. Field reconnaissance and observations from the February 6, 2023, Turkey earthquake sequence. Nat. Hazards 2023, 119, 663–700. [Google Scholar] [CrossRef]
- World Bank Disaster Assessment Report. Earthquake Damage in Türkiye Estimated to Exceed $34 billion. Available online: https://www.worldbank.org/en/news/press-release/2023/02/27/earthquake-damage-in-turkiye-estimated-to-exceed-34-billion-world-bank-disaster-assessment-report (accessed on 1 June 2023).
- Karataş, L.; Ateş, T.; Alptekin, A.; Dal, M.; Yakar, M. A systematic method for post-earthquake damage assessment: Case study of the Antep Castle, Türkiye. Adv. Eng. Sci. 2023, 3, 62–71. [Google Scholar]
- Mavroulis, S.; Mavrouli, M.; Vassilakis, E.; Argyropoulos, I.; Carydis, P.; Lekkas, E. Debris Management in Turkey Provinces Affected by the 6 February 2023 Earthquakes: Challenges during Recovery and Potential Health and Environmental Risks. Appl. Sci. 2023, 13, 8823. [Google Scholar] [CrossRef]
- Zenodo. Preliminary Mapping of Liquefaction Phenomena Triggered by the February 6 2023 M7.7 earthquake, Türkiye/Syria, Based on Remote Sensing Data. Technical Report. February 2023. Available online: https://doi.org/10.5281/zenodo.7668401 (accessed on 1 June 2023).
- Dal Zilio, L.; Ampuero, J.P. Earthquake doublet in Turkey and Syria. Commun. Earth Environ. 2023, 4, 71. [Google Scholar] [CrossRef]
- Baltzopoulos, G.; Baraschino, R.; Chioccarelli, E.; Cito, P.; Iervolino, I. Preliminary Engineering Report on Ground Motion Data of the Feb. 2023 Turkey Seismic Sequence. Earthquake reports, 24 February 2023. [Google Scholar]
- Disaster and Emergency Management Authority. Turkish National Strong Motion Network. Department of Earthquake, Disaster and Emergency Management Authority. 1973. Available online: https://doi.org/10.7914/SN/TK (accessed on 1 June 2023).
- Moshou, A.; Konstantaras, A.; Argyrakis, P.; Petrakis, N.S.; Kapetanakis, T.N.; Vardiambasis, I.O. Data Management and Processing in Seismology: An Application of Big Data Analysis for the Doublet Earthquake of 3 March 2021, Elassona, Central Greece. Appl. Sci. 2022, 12, 7446. [Google Scholar] [CrossRef]
- Li, X. Thoughts on the seismic damage phenomena and engineering seismic problems of recent large earthquakes. Int. Seism. Dyn. 2001, 3, 26–32. [Google Scholar]
- Nuti, C.; Briseghella, B.; Lavorato, D.; Taciroglu, E.; Bergami, A.V. Effects of Near-Fault Ground Motions on Civil Infrastructure. Appl. Sci. 2023, 13, 5929. [Google Scholar] [CrossRef]
- Chen, K.H.; Furumura, T.; Rubinstein, J.; Rau, R.-J. Observations of changes in waveform character induced by the 1999 Mw7.6 Chi-Chi earthquake. Geophys. Res. Lett. 2011, 38, 1–5. [Google Scholar] [CrossRef]
- Ulusay, R.; Tuncay, E.; Sonmez, H.; Gokceoglu, C. An attenuation relationship based on Turkish strong motion data and iso-acceleration map of Turkey. Eng. Geol. 2004, 74, 265–291. [Google Scholar] [CrossRef]
- Inoue, T.; Miyatake, T. 3D simulation of near-field strong ground motion based on dynamic modeling. Bull. Seismol. Soc. Am. 1998, 88, 1445–1456. [Google Scholar] [CrossRef]
- Liu, Q.; Yuan, Y.; Jin, X.; Ding, H. Basic characteristics of near-fault ground motion. Earthq. Eng. Eng. Vib. 2006, 2, 1. [Google Scholar] [CrossRef]
- Xu, Q.; Li, W. Study on the distribution of large-scale landslides induced by the Wenchuan earthquake. J. Eng. Geol. 2010, 18, 818–826. [Google Scholar]
- Huang, R. Large-scale landslides and their occurrence mechanisms in China since the 20th century. Chin. J. Rock Mech. Eng. 2007, 182, 433–454. [Google Scholar]
- Qin, S.; Xue, L.; Wang, Y. Further verification of the brittle fracture theory of multi-locked segments of seismogenic faults and discussion on related scientific issues. Prog. Geophys. 2010, 25, 749–758. [Google Scholar]
- Yang, B.; Qin, S.; Xue, L.; Wu, X.W.; Zhang, K. On the equivalence between the cumulative Benioff strain and the shear strain for the locked patchesalong a seismogenic fault system. Prog. Geophys. 2017, 32, 1067–1070. [Google Scholar]
- Duman, T.Y.; Emre, O. The East Anatolian Fault: Geometry, Segmentation and Jog Characteristics. Geol. Soc. Lond. Spec. Publ. 2013, 372, 495–529. [Google Scholar] [CrossRef]
- Hu, Y. Seismic Engineering; Seismological Press: Beijing, China, 1988. [Google Scholar]
- Zhou, Z.; Zhou, Y.; Zhao, G. Statistical analysis of peak acceleration ratio and response spectrum in strong earthquake near-field. Earthq. Eng. Eng. Vib. 2002, 22, 15–18. [Google Scholar]
- Aoi, S.; Kunugi, T.; Fujiwara, H. Trampoline effect in extreme ground motion. Science 2008, 322, 727–730. [Google Scholar] [CrossRef] [PubMed]
- Anderson, J.G. Source and site characteristics of earthquakes that have caused exceptional ground accelerations and velocities. Bull. Seism. Soc. Am. 2010, 100, 1–36. [Google Scholar] [CrossRef]
- Meng, L.; Shi, B.; Liu, J. Comparative analysis of near-field strong ground motion characteristics of the 2010 New Zealand Mw7.0 mainshock and the 2011 Mw6.1 aftershock. Acta Seismol. Sin. 2013, 35, 351–368. [Google Scholar]


| Basic Facts | Date and Time | 6 February 2023, 01:17 (UTC) |
| Location | Pazarcık | |
| Latitude (°) | 37.288 | |
| Longitude (°) | 37.043 | |
| Earthquake magnitude | Mw7.8 | |
| Seismogenic Structure | Hypocentral depth (km) | 10 |
| Fault | East Anatolian Fault | |
| Rupture Length (km) | 70 | |
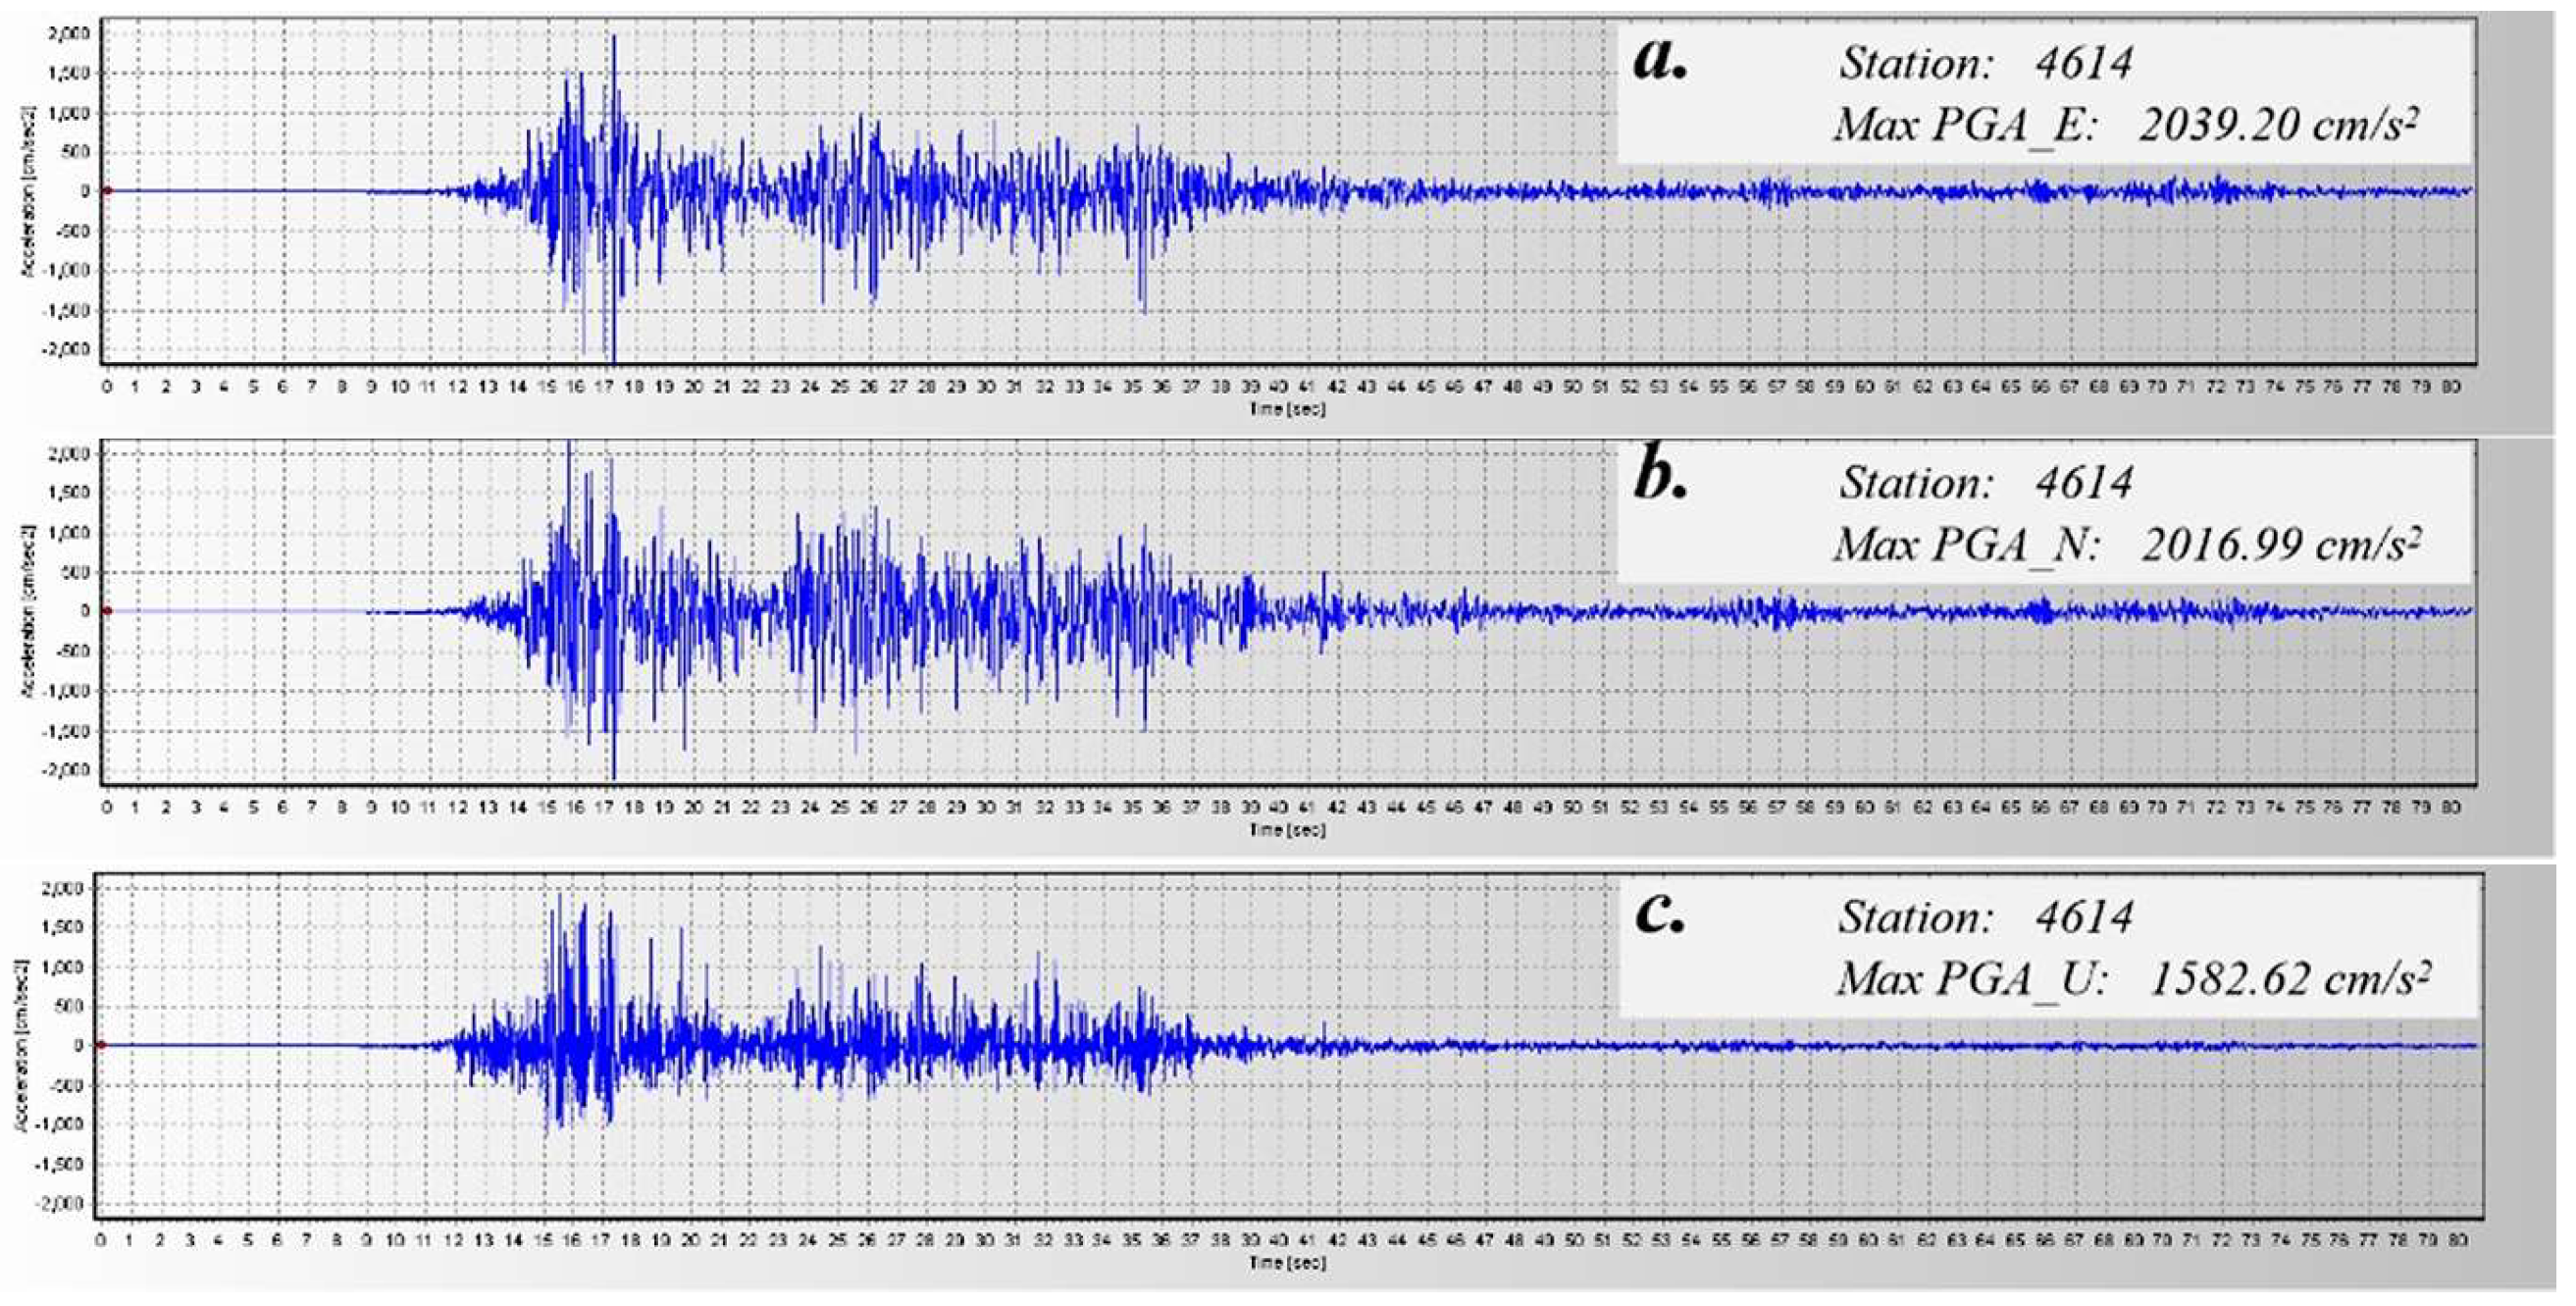
| Peak Value | PGA (cm/s2) | 2039.20 |
| PGV (cm/s) | 186.78 | |
| PGD (cm) | 142.08 | |
| Damage Loss | Direct physical damages (USD) | 34.2 Billion |
| Casualty | 59,259 |
| Station | District | Lon. | Lat. | Repi. (km) | Rrup. (km) | PGA_E (km) | PGA_N (km) | PGA_U (km) |
|---|---|---|---|---|---|---|---|---|
| 0208 | Gölbaşı | 37.653 | 37.787 | 77.255 | 1.67 | 14.00 | 30.20 | 16.97 |
| 0214 | Çelikhan | 38.226 | 38.028 | 132.738 | 2.91 | 54.38 | 61.68 | 69.91 |
| 2712 | Nurdağı | 36.732 | 37.184 | 29.85 | 1.10 | 592.35 | 555.59 | 313.75 |
| 2718 | İslahiye | 36.627 | 37.008 | 48.33 | 1.45 | 630.31 | 654.43 | 592.28 |
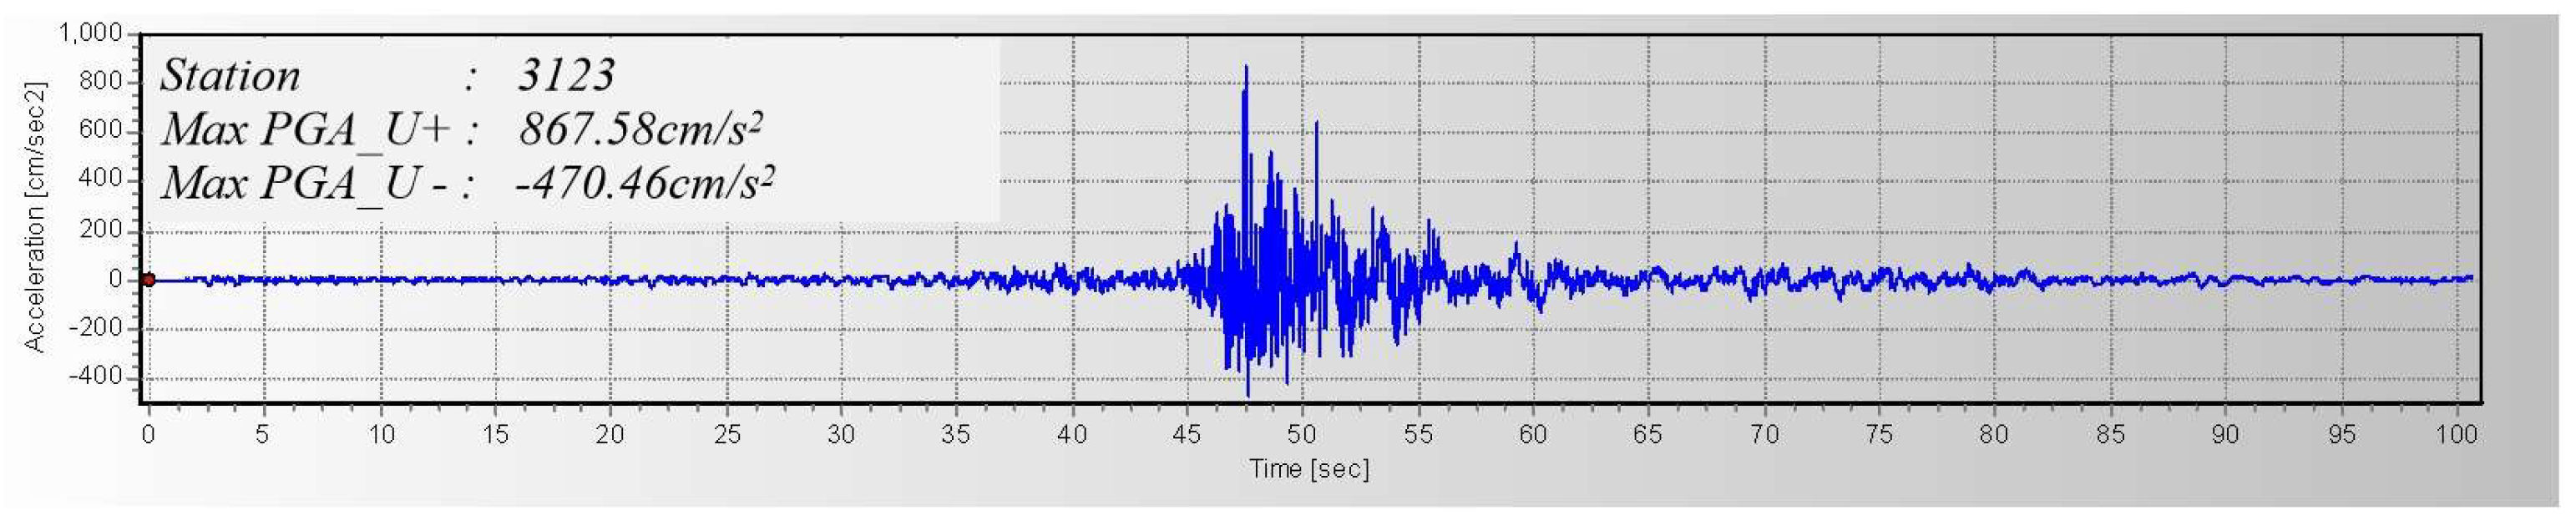
| 3123 | Hatay | 36.160 | 36.214 | 142.92 | 1.72 | 593.94 | 655.57 | 867.58 |
| 3125 | Hatay | 36.133 | 36.238 | 142.09 | 5.15 | 1121.95 | 822.62 | 1151.56 |
| 3129 | Defne | 36.134 | 36.191 | 146.39 | 2.42 | 1198.74 | 1351.50 | 716.94 |
| 3134 | Dörtyol | 36.205 | 36.828 | 90.39 | 28.95 | 203.91 | 246.11 | 141.51 |
| 3135 | Arsuz | 35.883 | 36.409 | 142.23 | 33.44 | 1372.07 | 740.97 | 588.97 |
| 3137 | Hatay | 36.489 | 36.693 | 82.46 | 0.39 | 670.17 | 428.37 | 448.37 |
| 4614 | Kahramanmaraş | 37.298 | 37.485 | 31.42 | 6.81 | 2039.20 | 2016.99 | 1582.62 |
| 4615 | Kahramanmaraş | 37.138 | 37.387 | 13.82 | 11.28 | 556.65 | 584.65 | 656.68 |
| 4626 | Onikişubat | 36.915 | 37.575 | 33.84 | 16.15 | 223.09 | 108.81 | 112.27 |
| 4702 | Midyat | 41.357 | 37.417 | 381.59 | 248.63 | 21.33 | 0.38 | 15.82 |
| 7901 | Kilis | 37.112 | 36.709 | 64.57 | 50.92 | 16.55 | 53.11 | 50.14 |
| 8002 | Osmaniye | 36.562 | 37.192 | 44.01 | 14.19 | 202.89 | 242.95 | 336.56 |
| 8004 | Kadirli | 36.100 | 37.380 | 181.86 | 168.43 | 181.86 | 168.42 | 71.780 |
| Fault Distance (km) | 0--5 | 5--10 | 10--15 | 15--20 | 20--25 | 25--30 | |
|---|---|---|---|---|---|---|---|
| Mean PGA (cm/s2) | Horizontal | 692.49 | 614.25 | 314.92 | 244.64 | 122.81 | 135.90 |
| North–South | 674.19 | 614.40 | 375.94 | 250.61 | 138.02 | 104.94 | |
| Vertical | 561.37 | 539.45 | 283.61 | 172.11 | 102.38 | 69.21 | |
Disclaimer/Publisher’s Note: The statements, opinions and data contained in all publications are solely those of the individual author(s) and contributor(s) and not of MDPI and/or the editor(s). MDPI and/or the editor(s) disclaim responsibility for any injury to people or property resulting from any ideas, methods, instructions or products referred to in the content. |
© 2023 by the authors. Licensee MDPI, Basel, Switzerland. This article is an open access article distributed under the terms and conditions of the Creative Commons Attribution (CC BY) license (https://creativecommons.org/licenses/by/4.0/).
Share and Cite
Duan, Y.; Bo, J.; Peng, D.; Li, Q.; Wan, W.; Qi, W. Analysis of Peak Ground Acceleration and Seismogenic Fault Characteristics of the Mw7.8 Earthquake in Turkey. Appl. Sci. 2023, 13, 10896. https://doi.org/10.3390/app131910896
Duan Y, Bo J, Peng D, Li Q, Wan W, Qi W. Analysis of Peak Ground Acceleration and Seismogenic Fault Characteristics of the Mw7.8 Earthquake in Turkey. Applied Sciences. 2023; 13(19):10896. https://doi.org/10.3390/app131910896
Chicago/Turabian StyleDuan, Yushi, Jingshan Bo, Da Peng, Qi Li, Wei Wan, and Wenhao Qi. 2023. "Analysis of Peak Ground Acceleration and Seismogenic Fault Characteristics of the Mw7.8 Earthquake in Turkey" Applied Sciences 13, no. 19: 10896. https://doi.org/10.3390/app131910896
APA StyleDuan, Y., Bo, J., Peng, D., Li, Q., Wan, W., & Qi, W. (2023). Analysis of Peak Ground Acceleration and Seismogenic Fault Characteristics of the Mw7.8 Earthquake in Turkey. Applied Sciences, 13(19), 10896. https://doi.org/10.3390/app131910896