Article

Multiobjective Optimization of Stereolithography for Dental Bridge Based on a Simple Shape Model Using Taguchi and Response Surface Methods

by
Tiba Raed Mhmood
and
Nazar Kais AL-Karkhi
*
Department of Automated Manufacturing Engineering, Al-Khwarizmi College of Engineering, University of Baghdad, Aljadrya Str., D534, Building 15, Baghdad 10070, Iraq
*
Author to whom correspondence should be addressed.
Appl. Sci. 2023, 13(19), 10911; https://doi.org/10.3390/app131910911
Submission received: 8 August 2023 / Revised: 19 September 2023 / Accepted: 20 September 2023 / Published: 1 October 2023

Abstract

:
Stereolithography (SLA) has become an essential photocuring 3D printing process for producing parts of complex shapes from photosensitive resin exposed to UV light. The selection of the best printing parameters for good accuracy and surface quality can be further complicated by the geometric complexity of the models. This work introduces multiobjective optimization of SLA printing of 3D dental bridges based on simple CAD objects. The effect of the best combination of a low-cost resin 3D printer’s machine parameter settings, namely normal exposure time, bottom exposure time and bottom layers for less dimensional deviation and surface roughness, was studied. A multiobjective optimization method was utilized, combining the Taguchi method with response surface methodology and the desirability function technique. The predicted optimal values for the cube’s dimensional deviation and surface roughness were 0.0517 mm and 2.8079 µm, respectively. The experiments’ validation of the findings confirmed the results, which were determined to be 0.0560 and 0.064667 mm and 2.770 and 2.6431 µm for the dimensional deviation and surface roughness for the cube and bridge, respectively. The percentages of prediction errors between the predicted optimum results and the printed response were 7.68% and 1.36% for dimensional deviation and surface roughness, respectively. This study demonstrates that the robust method used produced a dental bridge with good accuracy and a smooth surface.

1. Introduction

Stereolithography (SLA) is a flexible three-dimensional printing process for rapid prototyping, and it is a successful additive manufacturing (AM) technique for producing highly accurate components. It is a layer-by-layer process of producing parts from photosensitive resin exposed to ultraviolet (UV) light [1,2]. An increasing number of materials have been created using SLA for a wide variety of applications, including soft robotic actuators, sensors, microfluidics devices and energy storage components [3,4]. Among the various AM techniques, stereolithography (SLA) is the most popular for dental applications, offering the most remarkable accuracy and resolution, fine building details and a smooth surface finish [5]. Light-curing technology is now employed in more than 75% of dental 3D printing applications, and light-cured resins are often used in dentistry as fillers and restorative materials [6]. However, the stereolithographic (SLA) printing process’s major drawback is the compromise in terms of accuracy and surface roughness. While SLA offers advantages in terms of flexibility and the ability to create complex dental structures, it may need to be improved in achieving the desired precision and smoothness of components [7].
Moreover, correctly selecting the process’s printing variables to achieve the desired objectives may not be possible even for qualified users [8]. The printing parameters in SLA 3D printers present critical and challenging tasks for determining the dimensional accuracy and the surface roughness of the resulting parts [9]. Many researchers have previously made an effort to investigate the impacts of process factors, namely part orientation, layer thickness, laser power, scan pitch, scanning speed, spot overlap, hatch spacing, hatch style, hatch overcure and fill cure depth, on the dimensional accuracy in stereolithographic (SLA) printing of 3D objects [10,11,12,13]. They examined these parameters’ impact and relative importance for dimensional accuracy following mathematical models or numerical analysis for the resin shrinkage and distortion. They concluded that accuracy increases with increasing layer thickness, which is the most significant affecting parameter; also, part orientation factors effects significantly onto dimensional errors. Onuh and Hon [14] employed the Taguchi approach in their experimental research to optimize the building parameters for a better stereolithographic surface finish. Their analyses considered the following build parameters—layer thickness, hatch spacing, hatch style, hatch overcure and fill cure depth—to improve the SLA part surface quality. It could be said that hatch spacing and fill cure depth significantly affect the surface finish, and low layer thickness gives minimum surface roughness. Zhou et al. [2] used a Taguchi experimental design with ANOVA to optimize five build parameters affecting SLA parts’ accuracy: layer thickness, overcure, hatch space, blade gap and part position. It was concluded that the optimal build conditions corresponding to a small layer thickness had the greatest influence on accuracy.
Other articles in the literature review examined the effects of the SLA process factors on various dimensional and geometrical features [15,16,17]. In order to optimize the printing factors, like layer thickness, hatch spacing, hatch overcure, hatch space, blade gap and part orientation, they used a neural network and a genetic algorithm for the analysis. Their studies indicated that for achieving minimum shrinkage and distortion and more dimensional accuracy, parameters such as a small layer thickness value, slight hatch overcure and medium-to-large hatch spacing are desirable. Singhal et al. [18] determined the optimum part deposition orientation to achieve minimum average surface roughness in stereolithography. An optimization technique based on trust region methods was used. Statistical analysis using the Taguchi method was employed by Campanelli et al. [19] to optimize the stereolithographic process factors in order to increase the accuracy of the geometrical component. This analysis considered the following parameters: layer thickness, hatch overcure, hatch spacing, border overcure, fill spacing and fill cure depth. Sager and Rosen [20] presented a parameter estimation approach to process planning for stereolithography to demonstrate significant surface finish improvements. Dzionk [21] created a model based on geometrical analysis to describe the roughness of the surfaces of parts printed using the SLA process. The model was based on triangular shapes, called the stairstep effect, which depend on parameters like layer thickness, position on the platform and part orientation. Khorasani and Baseri [9] proposed a neural network model with a genetic algorithm and simulated annealing to optimize stereolithographic (SLA) parameters to achieve minimum shrinkage of H-shaped parts. Three input parameters were selected: layer thickness, hatch overcure and hatch spacing. The results showed that the layer thickness and hatch overcure had a negative effect, and hatch spacing positively affected the total dimensional inaccuracy of the SLA parts.
Moreover, researchers have been motivated in recent decades to improve the dimensional accuracy of 3D-printed objects by optimizing the process parameters. Unkovskiy et al. [22] evaluated the influence of printing parameters like print orientation, part positioning on a build platform and the postcuring process on the dimensional accuracy of SLA-printed rectangular objects. One-way ANOVA was used for data evaluation, and it was found that the printing orientation and position affect parts’ dimensional accuracy. Loflin et al. [23] assessed the impact of print layer thickness on the clinical acceptability of 3D-printed SLA orthodontic models. The results showed that a thin layer thickness gave better accuracy. Cotabarren et al. [24] applied response surface methodology to model stereolithographic process parameters with dimensional accuracy and found that the layer thickness was the most significant factor. In Khodaii and Rahimi [25], the influences of surface angle, hatch space and postcuring time on surface roughness in the SLA process were studied using the printed parts under various experimental parameters. The results demonstrated that as the surface angle increased from 0 to 90 degrees, the surface irregularity rose dramatically. In contrast, postcuring time had a negligible and insignificant impact on surface roughness. Mostafa et al. [7] studied the surface roughness of the side walls of the parts manufactured using projection micro-stereolithography. They proposed a physics-based analytical model as a function of the exposure time and the layer thickness to predict the surface roughness of the manufactured parts. The layer thickness significantly influenced the light-induced surface roughness compared with the exposure time. Katheng et al. [26] examined the dimensional accuracy and degree of polymerization of a transparent photopolymer resin object produced using SLA at different postpolymerization times and temperatures using ANOVA. Lower temperatures improve tissue surface accuracy; according to the study, the polymerizing temperature had a greater effect on dimensional accuracy than the polymerizing time. Using the Taguchi method, the manufacturing parameters of the stereolithographic apparatus were adjusted by Borra [27] to assure the accuracy of the 3D-printed objects. Layer thickness, orientation and exposure duration were selected as the printing factors, and the ANOVA results showed that exposure duration significantly affected accuracy. Dhanunjayarao et al. [28] examined the experimental data on the dimensional correctness of cured resin SLA 3D-printed objects. In this research, the authors set out to use an experimental design to show how layer thickness, exposure time and x-orientation interact as process characteristics that contribute to dimensional accuracy errors. It was found from a Taguchi L9 orthogonal array analysis that the part’s size and shape variations caused dimensional inaccuracies, and the layer thickness was the most influential parameter. The effect of SLA printing parameters such as the layer thickness, the build angle, the support structure density and the contact point size on the dimensional accuracy and geometrical properties of castable wax printed parts was investigated by Badanova et al. [29]. The experimental design by Taguchi was utilized to determine the number of experimental trials. The build angle and the layer thickness were determined as the first and second most influential parameters, influencing both the dimensional and geometric precision, respectively.
In the literature, many researchers have studied the effects of printing parameters, like dimensional error and surface roughness, on the SLA process output. Most of them used single-response optimization, while a few studies used multiobjective optimization for good dimensional accuracy and surface roughness. This study introduces the Taguchi method with response surface methodology and the desirability function technique for multiobjective optimization. Also, the combination effect of SLA printing parameters, namely normal exposure time, bottom exposure time and bottom layers, has never been studied in the literature.

2. Materials and Methods

2.1. SLA Resin

SLA uses a variety of materials with distinct properties, including flexible, transparent, stable and heat-resistant materials [30]. Photosensitive resin is used in the photocuring process for 3D printing. The curing procedure depends on the light wavelength and printing method [31]. Common materials used in SLA are conventional epoxy, acrylate resins, thermoplastic elastomers and water-washable or soluble resin [32]. In this work, water-washable resin from the manufacturer Creality was used. The water-washable resin was a new type formulated explicitly for use in stereolithographic (SLA) 3D printing technology. It is designed to be easily cleaned and postprocessed with water, making it more convenient and efficient than other types of resins that require harsh chemicals or solvents for cleaning. Most of the water-washable resin compositions include inert dyes for light absorption and improved polymerization control. Resins have additional additives like acrylic acid, methacrylic acid, acrylamide, dimethyl-acrylamide, dimethylamino ethyl methacrylate, vinylpyrrolidone, etc. These resins have good solubility, low viscosity, high photosensitivity, shrinkage during polymerization and controlled mechanical properties, and are relatively unaffected by temperature and humidity changes [33]. The physical properties of water-washable resin are given in Table 1.

2.2. Design of Experiments

Experimental investigation necessitates the execution of a number of costly and time-consuming experiments. Design of experiment (DOE) methods, such as Taguchi’s method, response surface method (RSM), etc., are statistical techniques used to simultaneously examine the effects of multiple input parameters on performance measures [34,35]. Recently, the Taguchi and RSM methods for estimating machining performance have been developed [34]. The Taguchi method has been extensively utilized in engineering analysis and is an effective tool for the design of high-quality systems. Additionally, the Taguchi method employs a unique design of an orthogonal array to investigate the effects of all machining parameters through multiple experiments [36].
The response surface method (RSM) is a statistical and mathematical technique that aids in the design of experiments, modeling, the estimation of the proportional importance of various independent parameters and the determination of optimal conditions for achieving optimal responses [24]. The primary objective of this method is multiresponse optimization that is influenced by multiple input process parameters [35].
Taguchi analysis is an effective technique for modeling the SLA process, and the success and implementation of additive manufacturing technology may be dependent on the understanding of process parameters [27]. In this study, the Taguchi L9 orthogonal array (OA) was used to consider three parameters: (1) normal exposure time, (2) bottom exposure time and (3) bottom layers. The Taguchi design permits the development of an L9 OA capable of simulating the most accurate configurations of experiments to predict outcomes. From preliminary experiments and dental lab technicians’ experience, the ranges of parameters were as follows: normal exposure time: 1.2–2.5 s, bottom layers: 1-7 and bottom exposure time: 15–55 s. It is recommended that the bottom exposure time be eight to twelve times longer than the typical layer cure time [27]. The abbreviations of printing parameters and output responses are shown in Table 2. The printing parameters and their levels are shown in Table 3. The nine experiments with the Taguchi L9 orthogonal array are shown in Table 4. The experimental measurements were then analyzed using the response surface method in order to determine the influencing factors and optimal levels.
Based on response data, MINITAB (v18) was used to create the RSM model’s empirical connection, which best matches experimental findings for predicting output. Analysis of variance (ANOVA) was utilized to conduct statistical analyses.

2.3. Printing Process Parameters

This study considered the following parameters: normal exposure time, bottom layers and bottom exposure time. Normal exposure time (A) is the quantity of time each layer is exposed to ultraviolet light (UV), and it impacts the shrinkage of the photocurable resins, giving less accuracy and changes in surface roughness [13,27]. The bottom layers (C) are often called the “base” or “build platform”. These are the layers where the printing process begins, as the foundation for the entire 3D print. However, for larger or more complex objects, increasing the number of bottom layers may be necessary to provide additional support and prevent warping or deformation during the printing process [19]. Bottom exposure time (B) refers to the UV exposure time to determine the first layer’s thickness between the platform and the bottom of the resin container during the fabrication of the first layer. Similar to exposure time, the bottom exposure time only pertains to the first few layers of the 3D print. During the manufacturing process of bare surfaces with SLA technology, it is the bottom surfaces of the exposed and curing layer that bond with the previously cured layer [37,38].

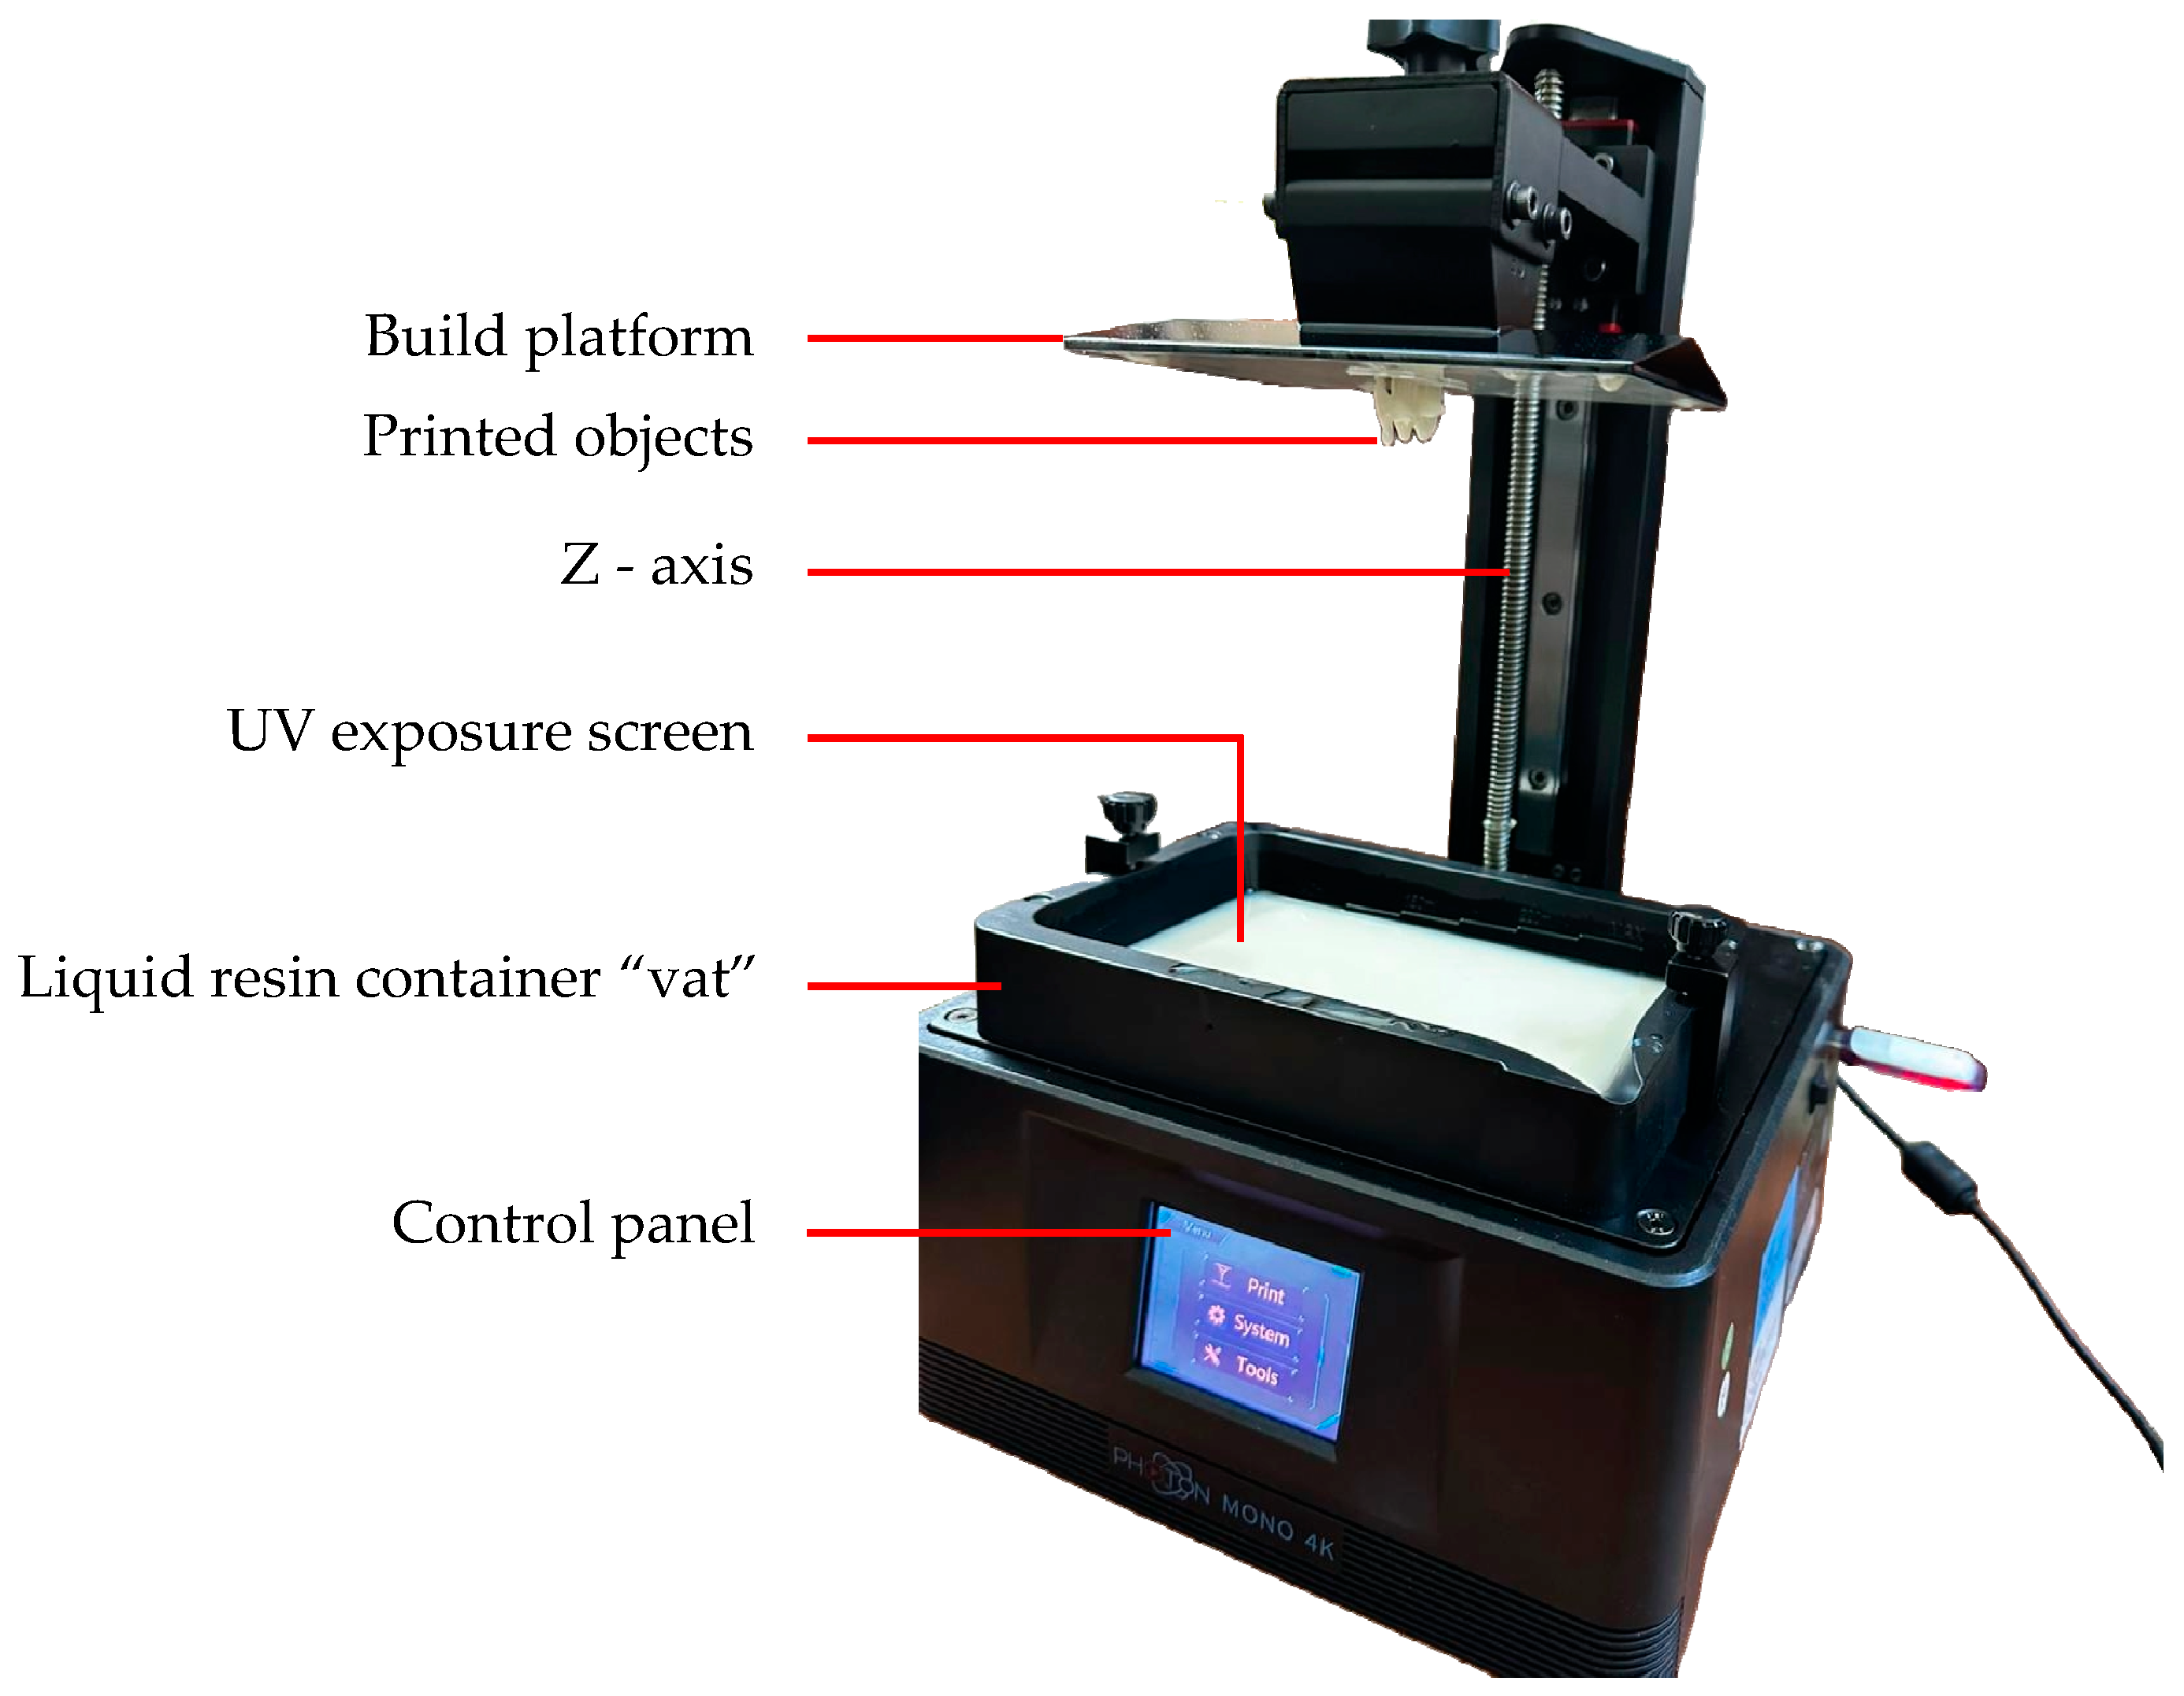
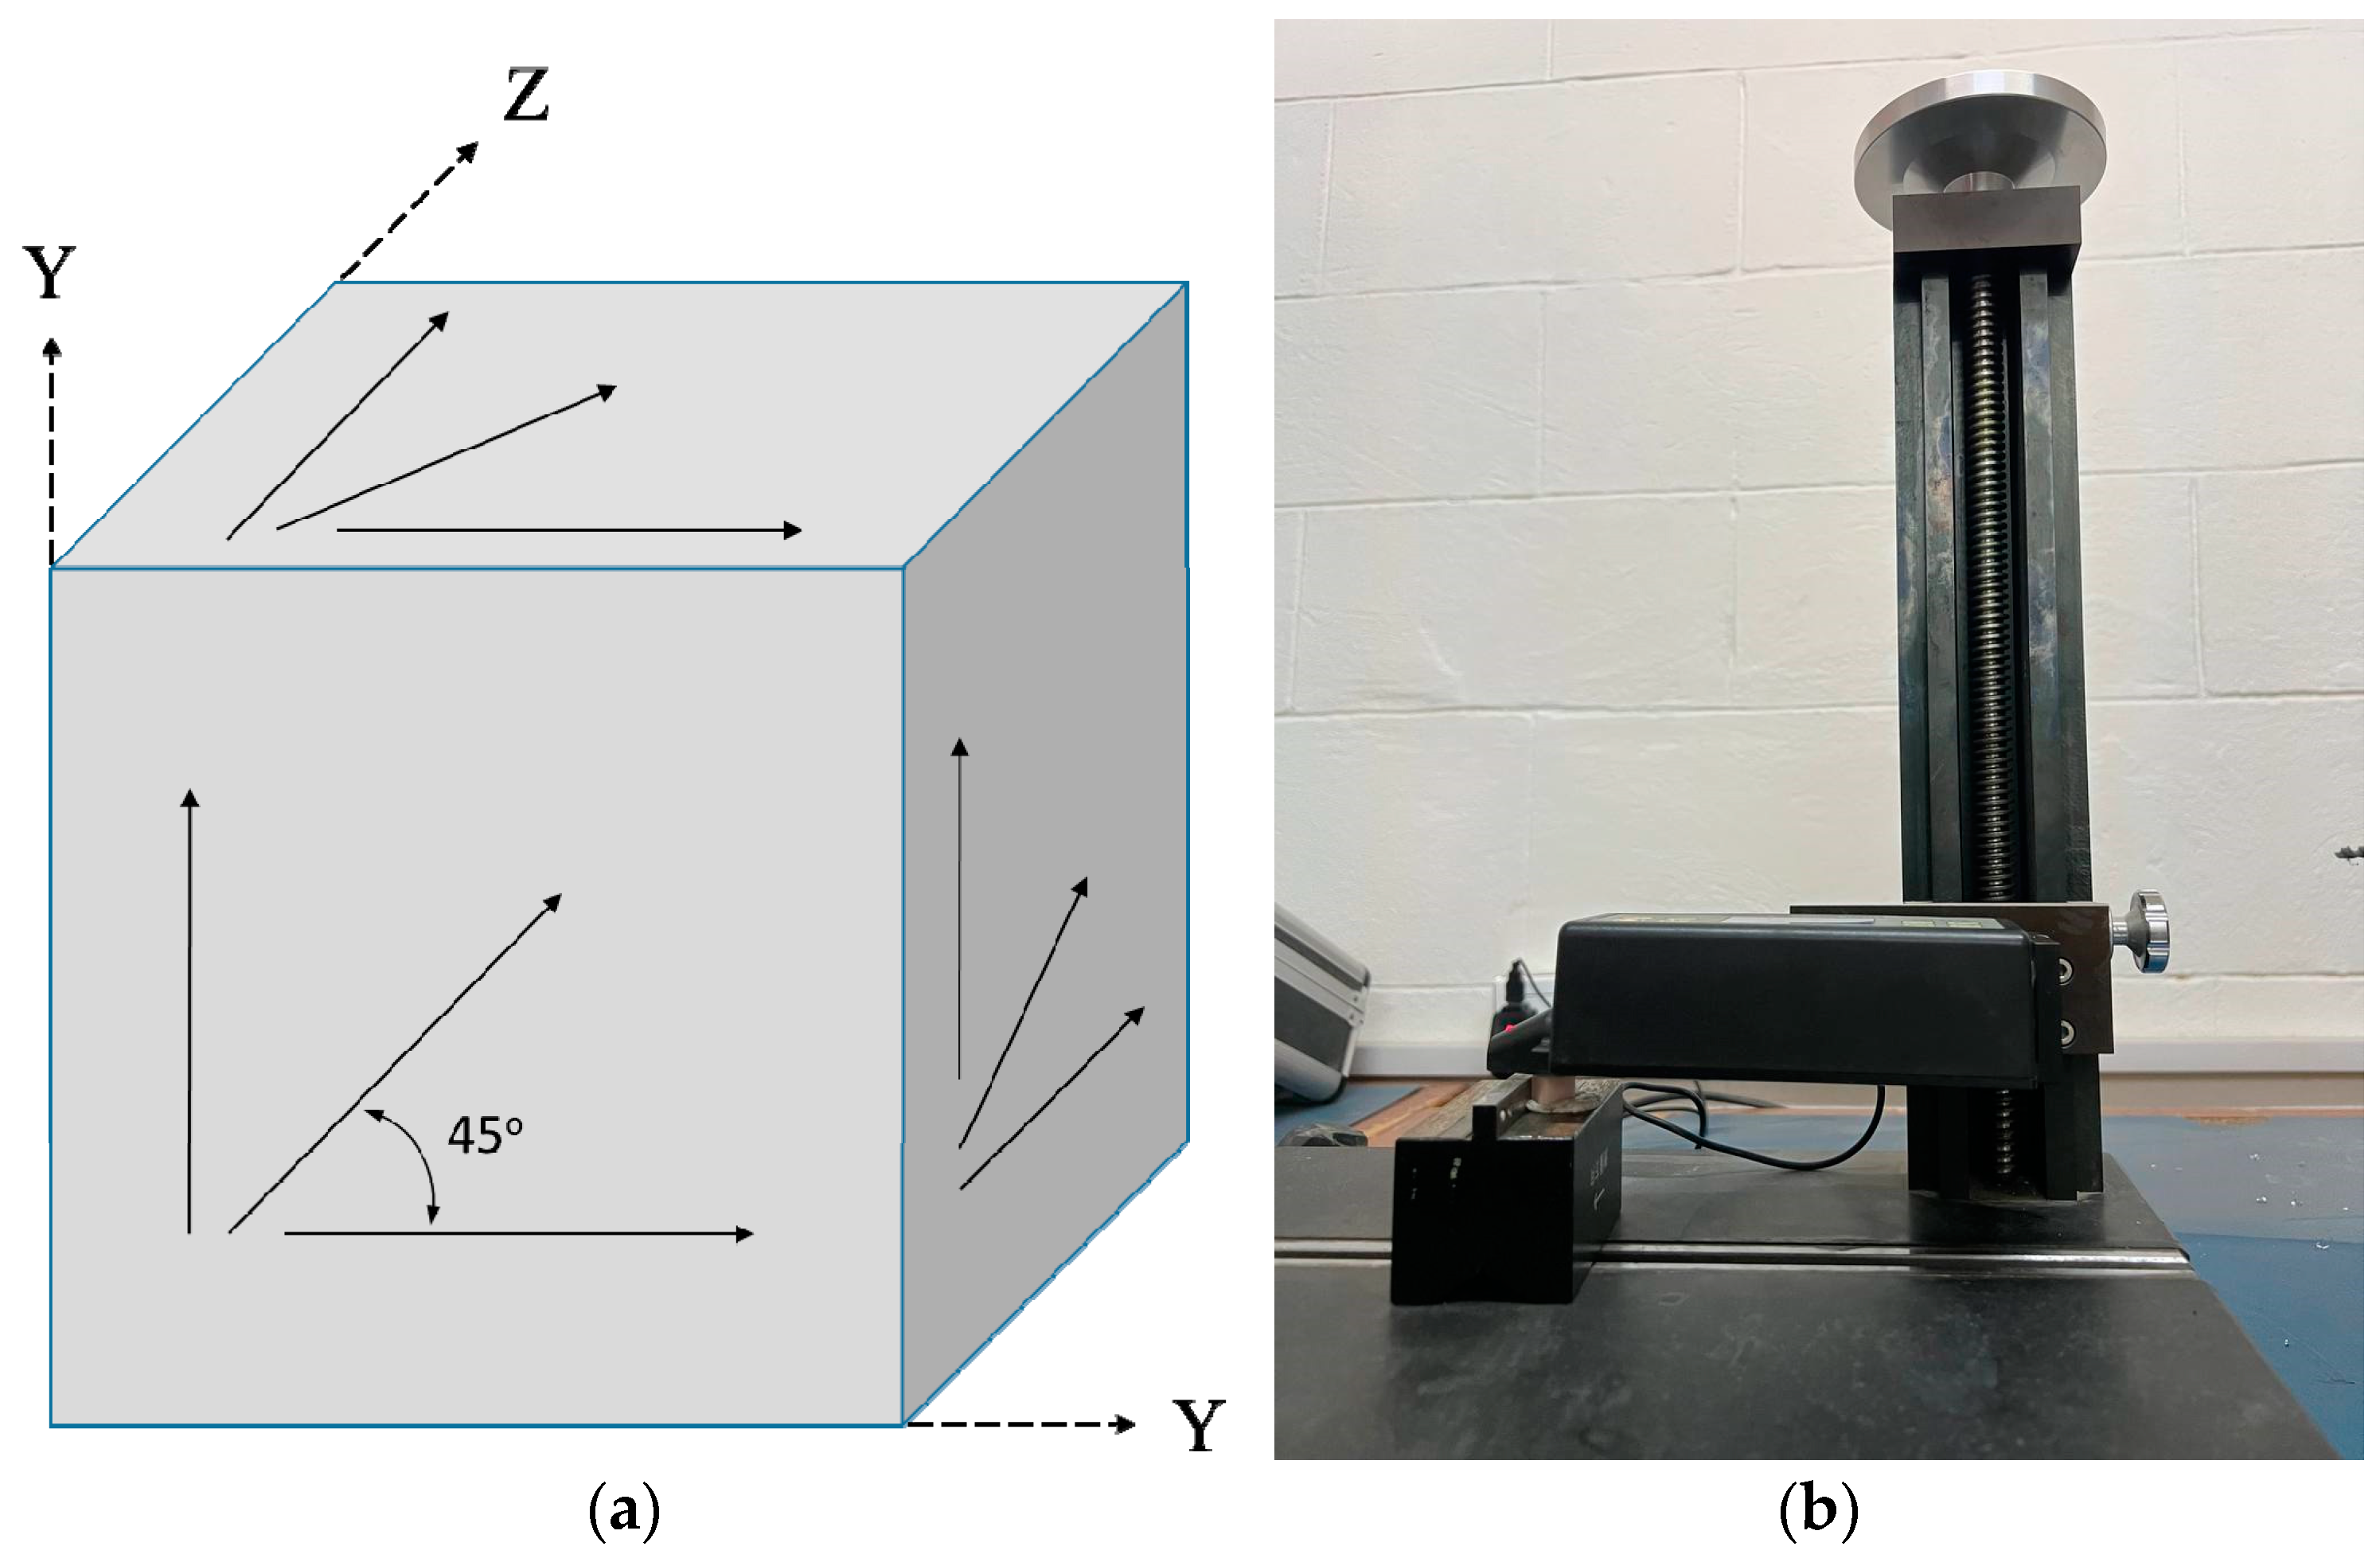
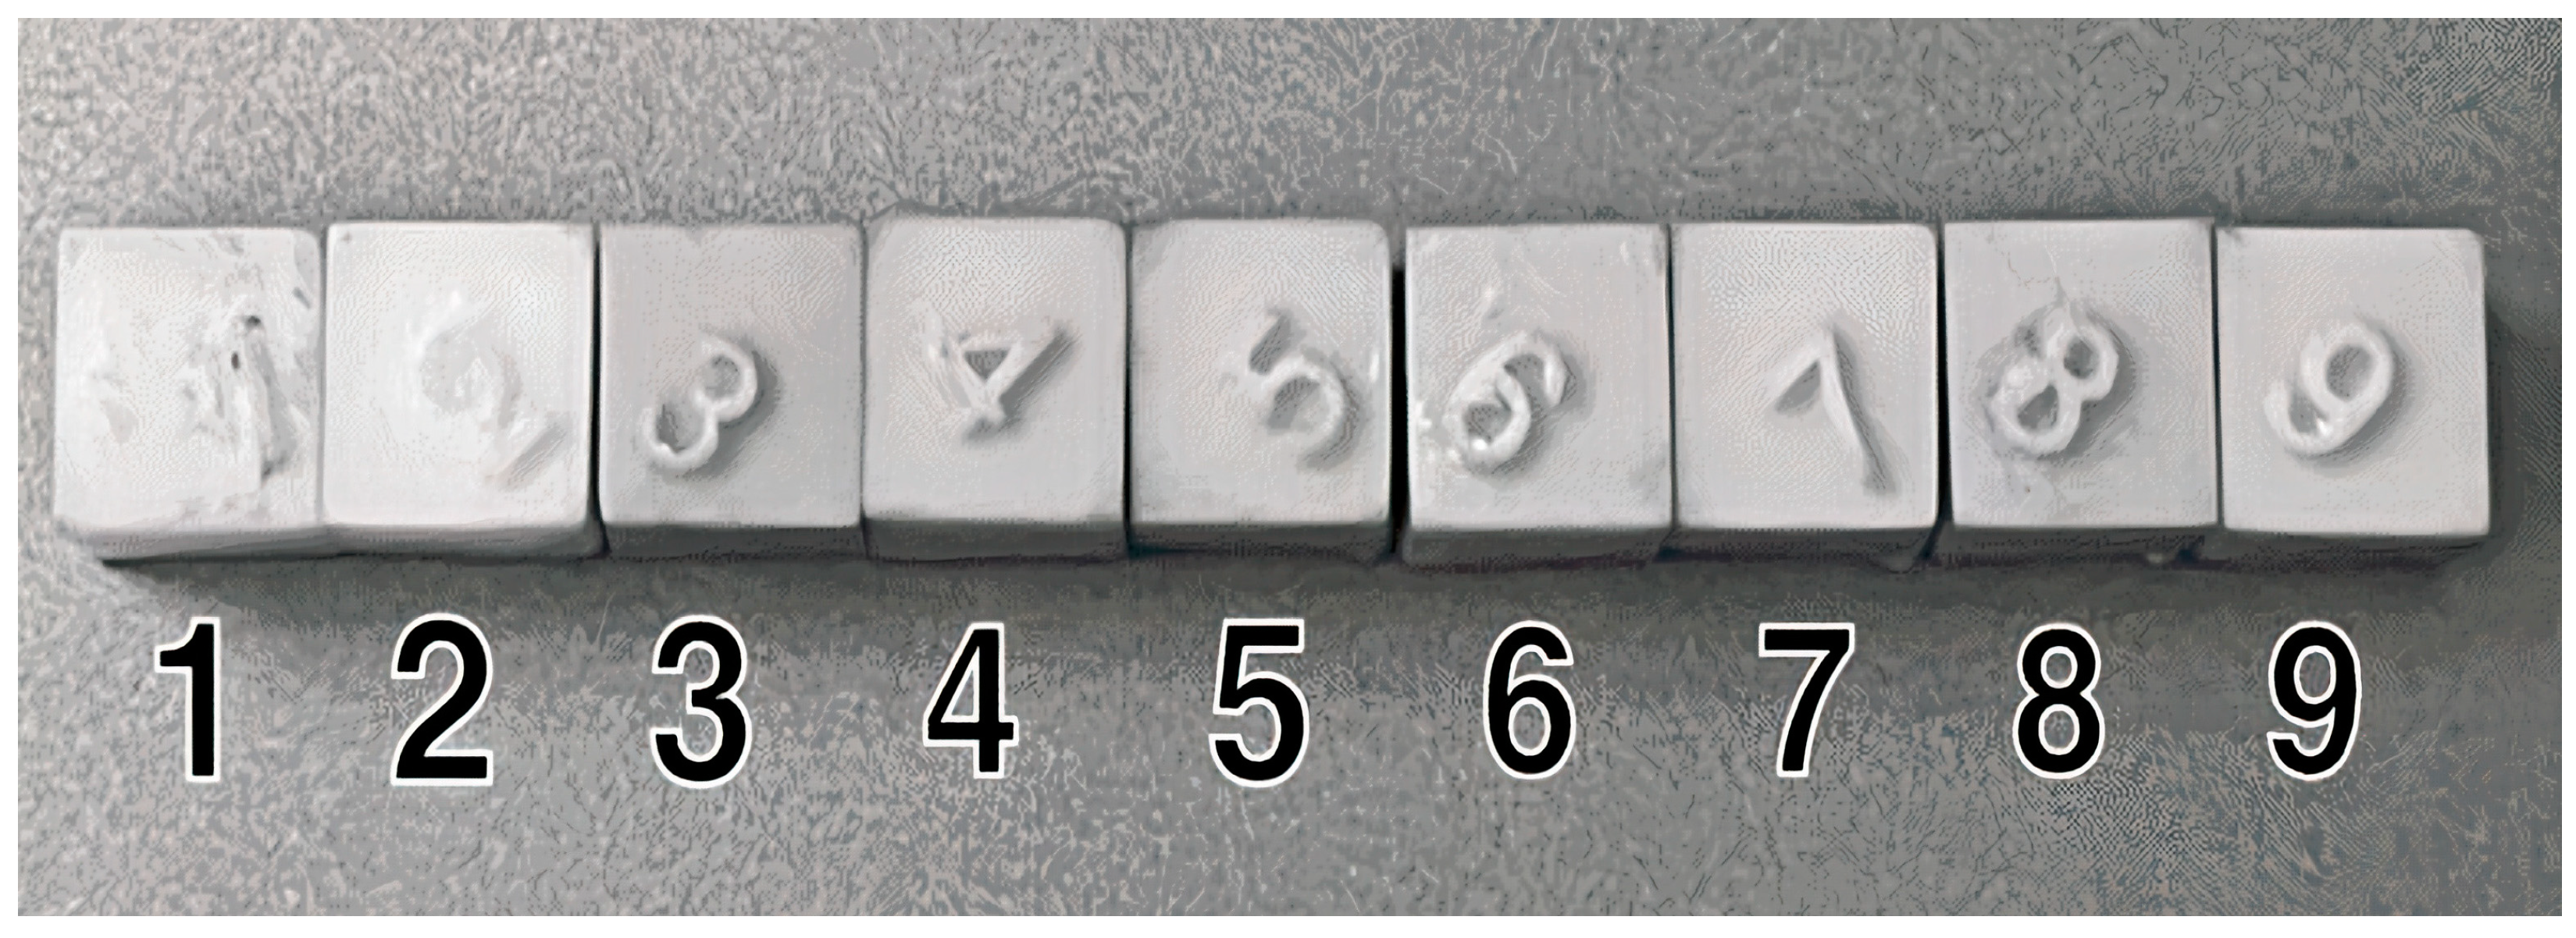
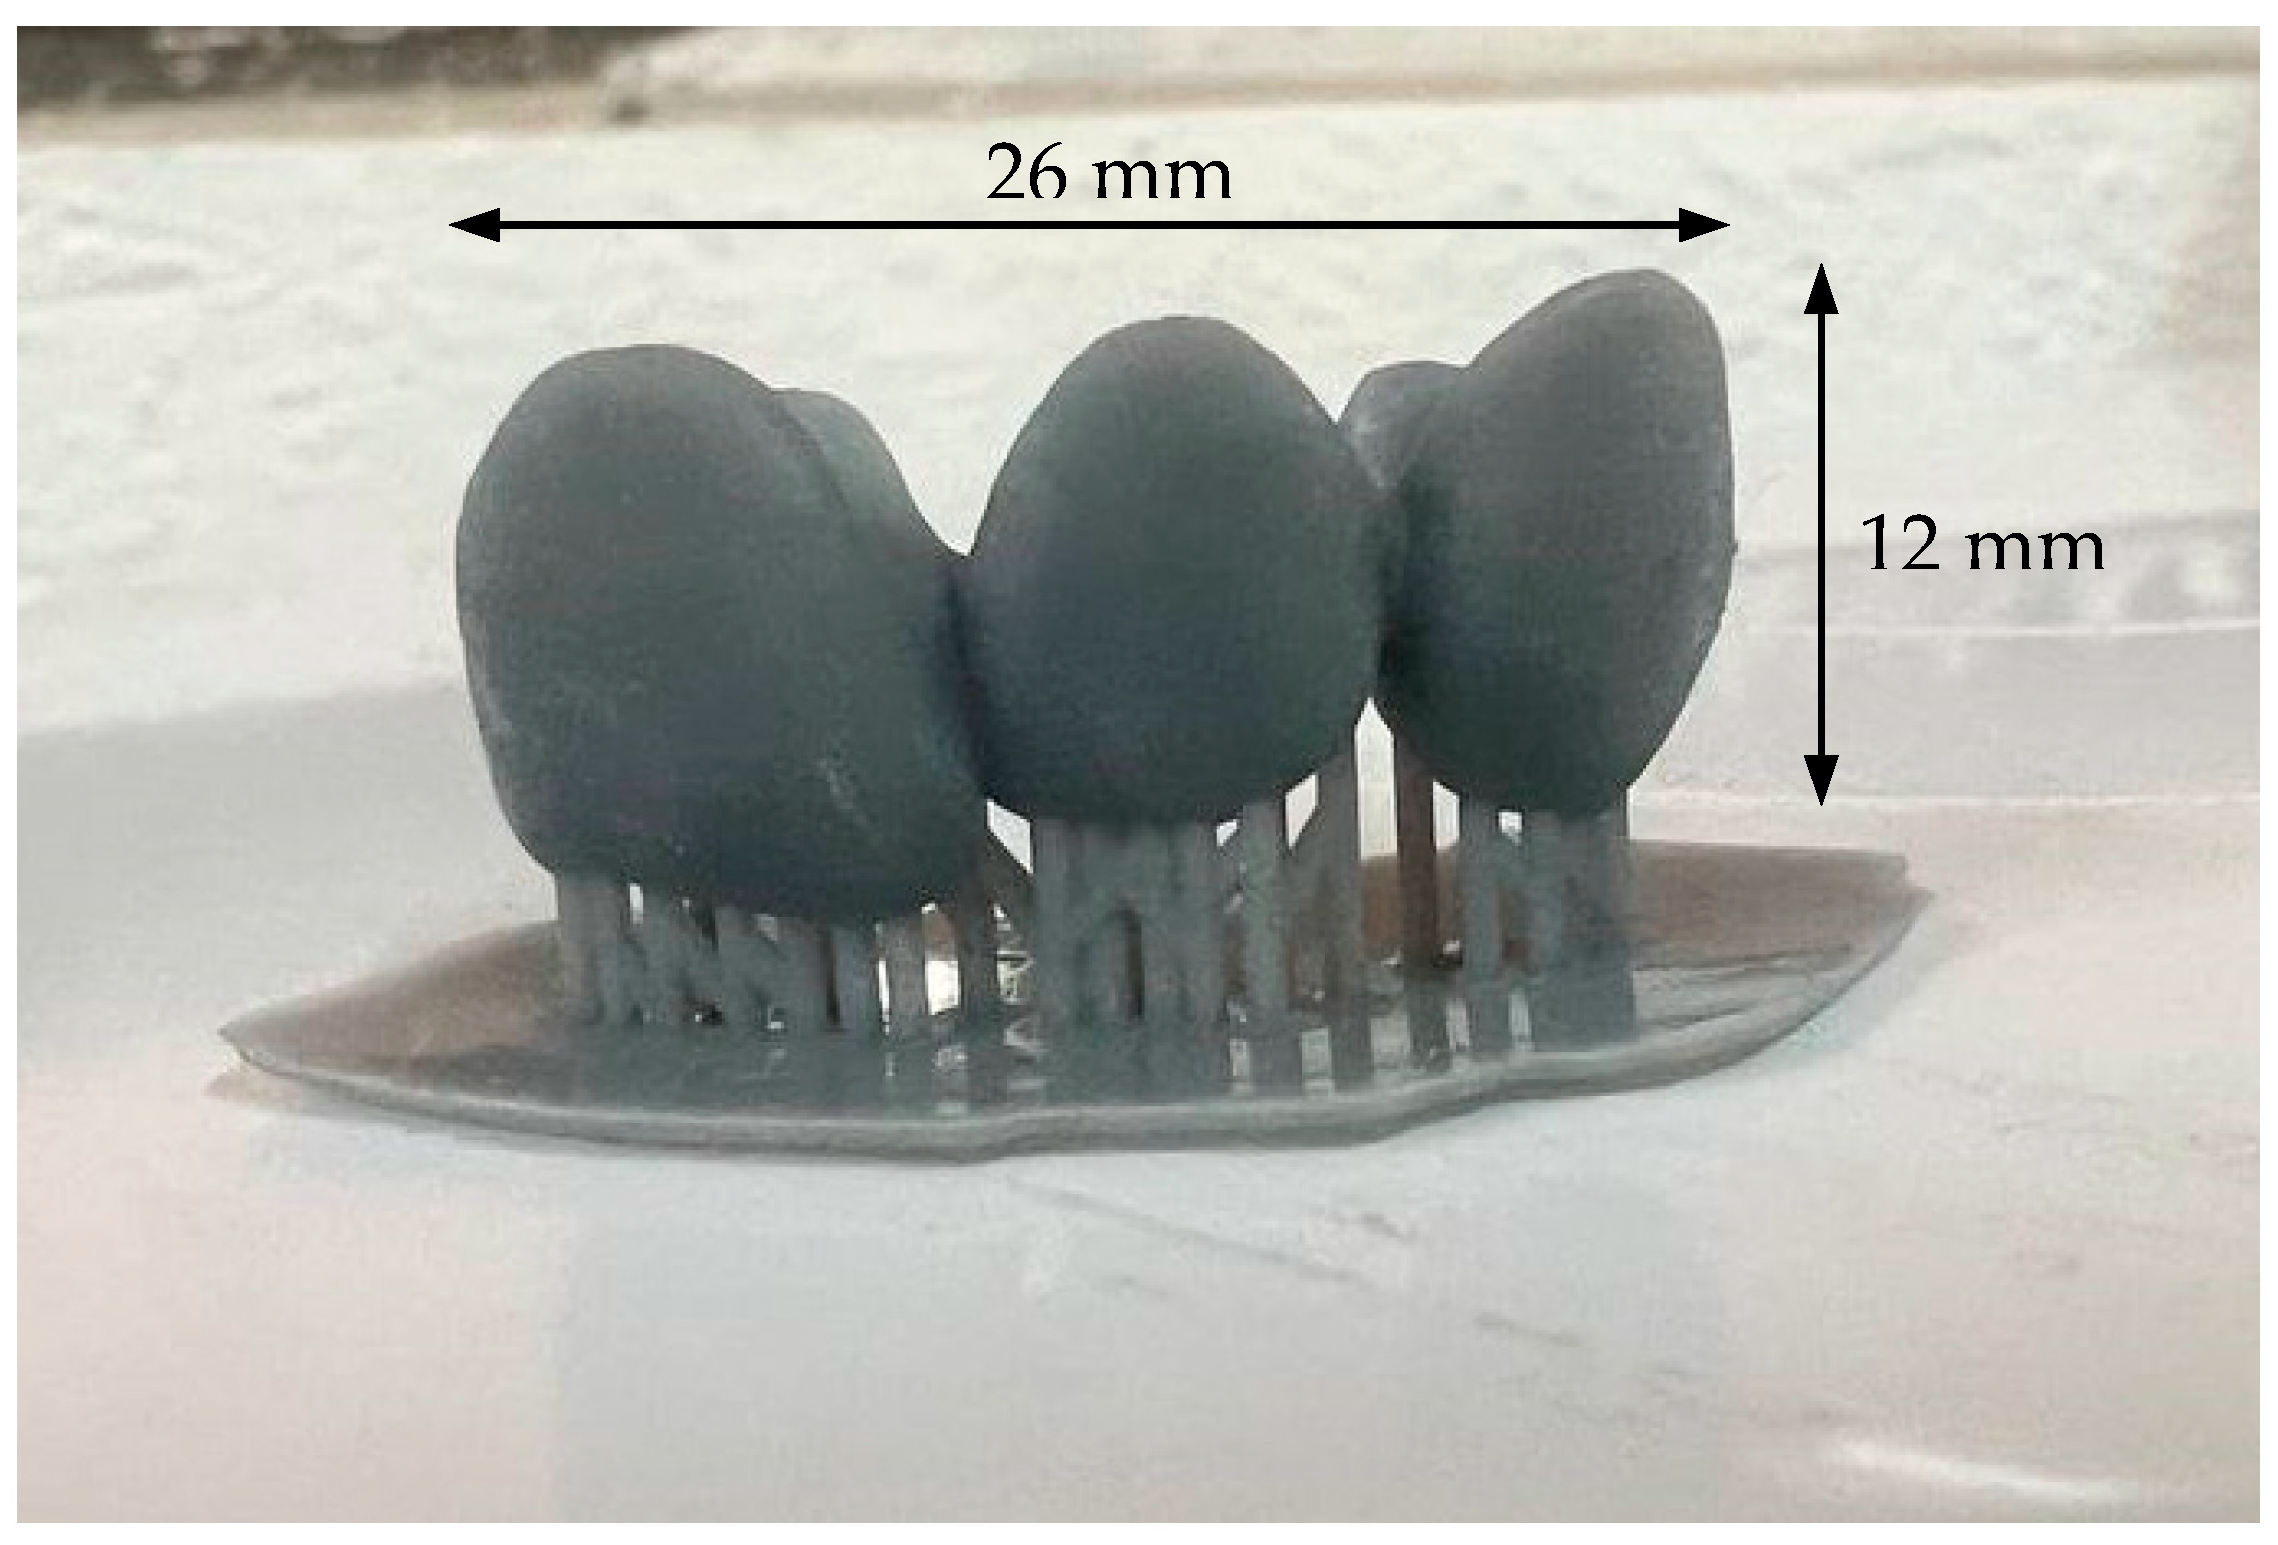
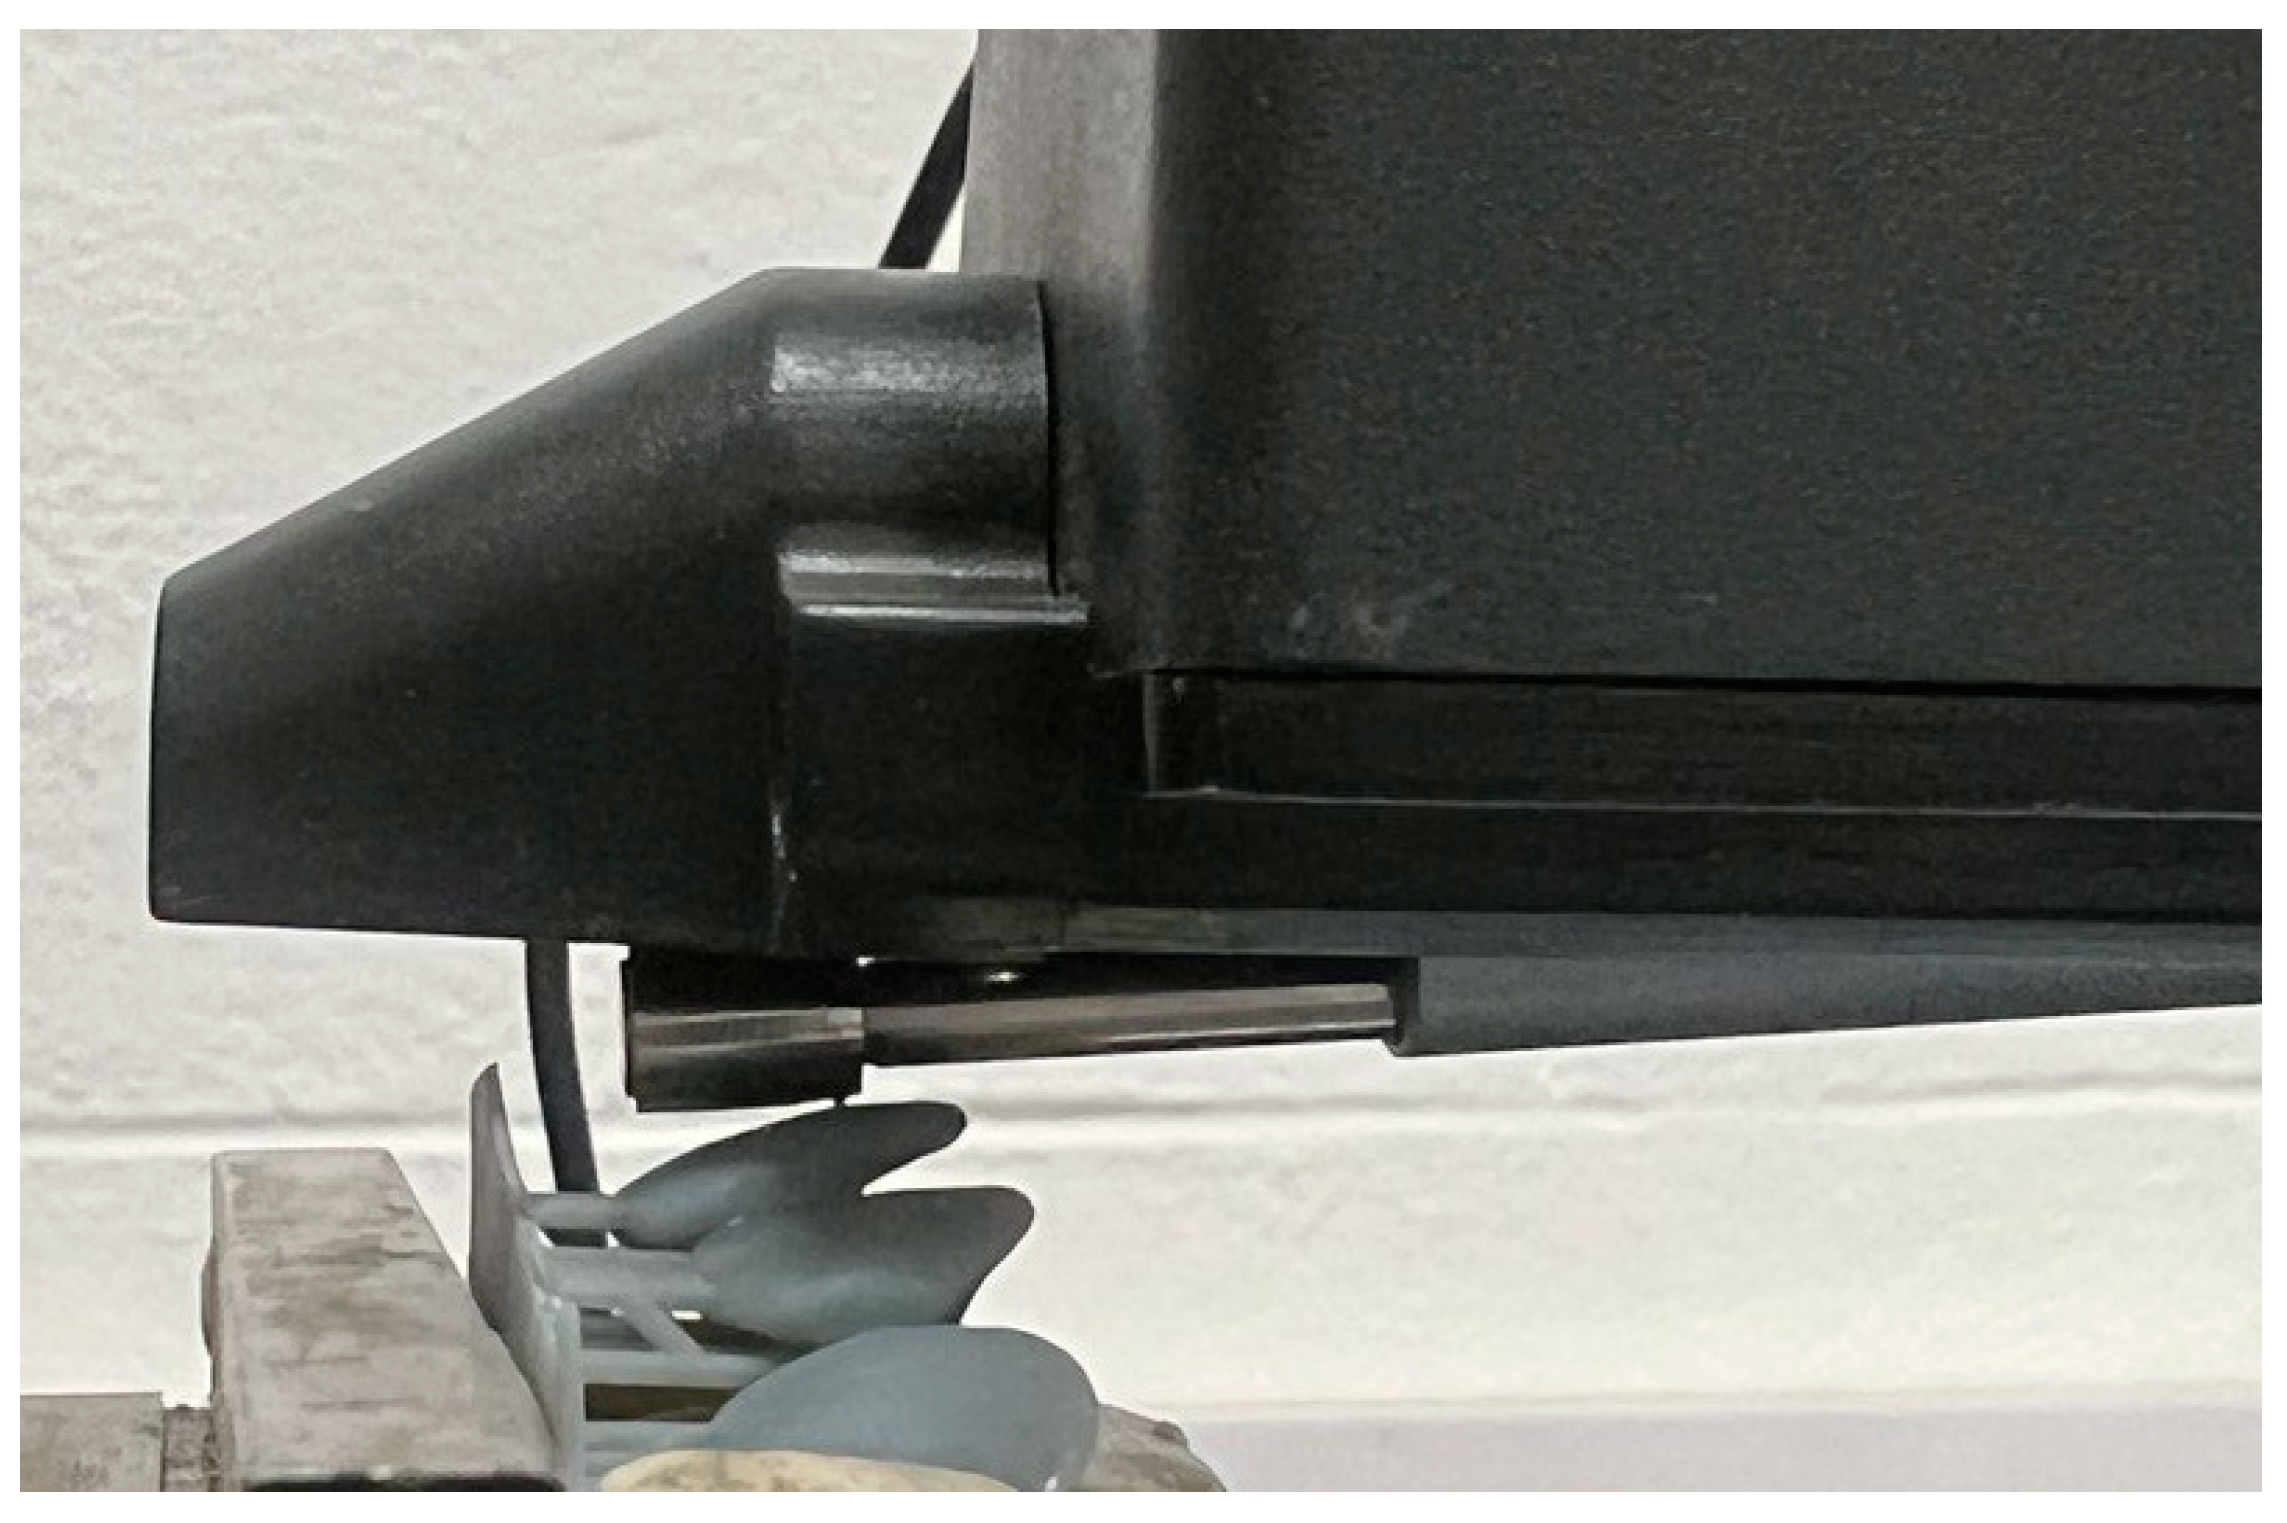
2.4. Experimental Setup

Printing operations were conducted on a low-cost ANYCUBIC photon Mono X resin 3D printer; this is shown in Figure 1, and its specifications are shown in Table 5. New water-washable resin from Creality was used as a UV-sensitive material for the 3D printer. A cube with a dimension of 10 mm and a dental bridge from Vital were designed in SOLIDWORKS and EXOCAD, respectively, and downloaded as STL files to the printer software’s (Photon Workshop V2.1.21.RC6) cube slicer. The software slices the cube in layers, and the cube file is downloaded to the Mono X resin 3D printer via a flash disk. Firstly, instead of printing the complicated shapes of nine dental bridge models, nine cubes as samples with different parameters for each experiment were printed. Secondly, the same above experimental procedure was repeated for printing the dental bridge using the optimum values of the parameters obtained from simple CAD parts (cubes). When the bottom exposure period gets longer, the raft becomes more securely attached to the build plate, leading to a longer printing time [27]. The room temperature for all nine experimental conditions was 26–27 °C. The layer thickness for all experiments was 0.050 mm. It has been reported in the literature that when using SLA technology to print samples with a decrease in layer thickness, the strength and accuracy of the sample increase.

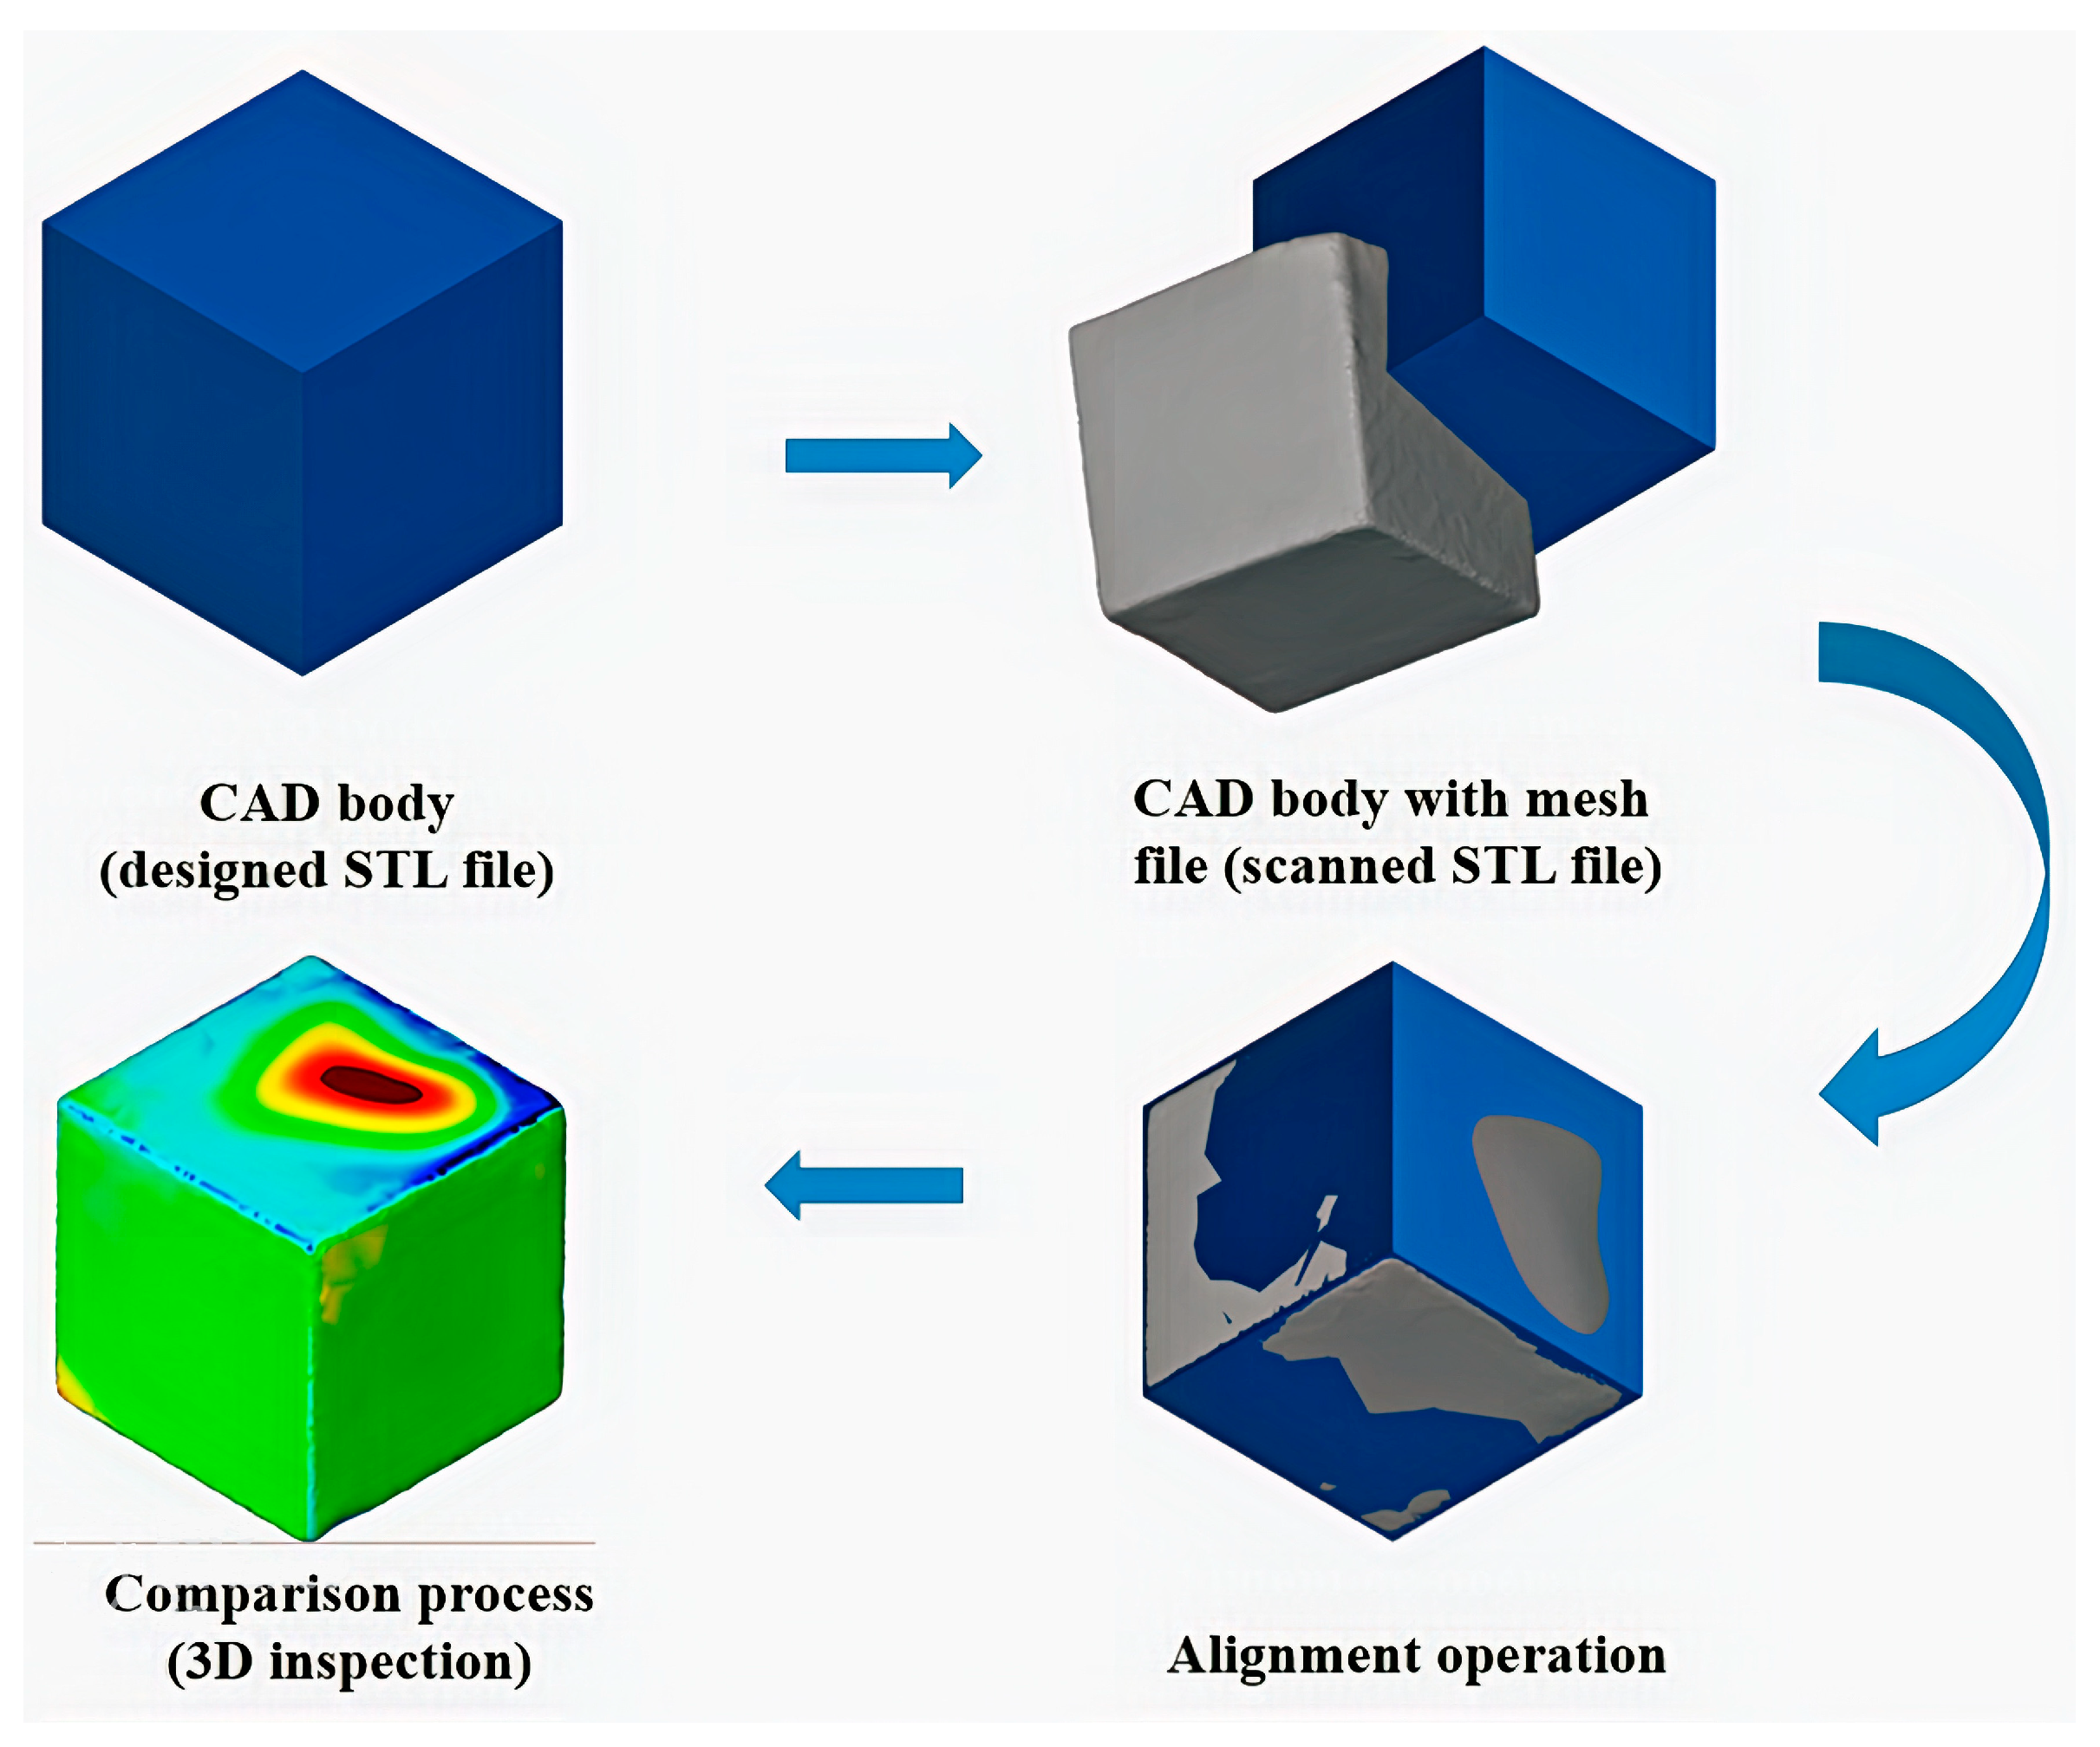
3. Output Response Measurements

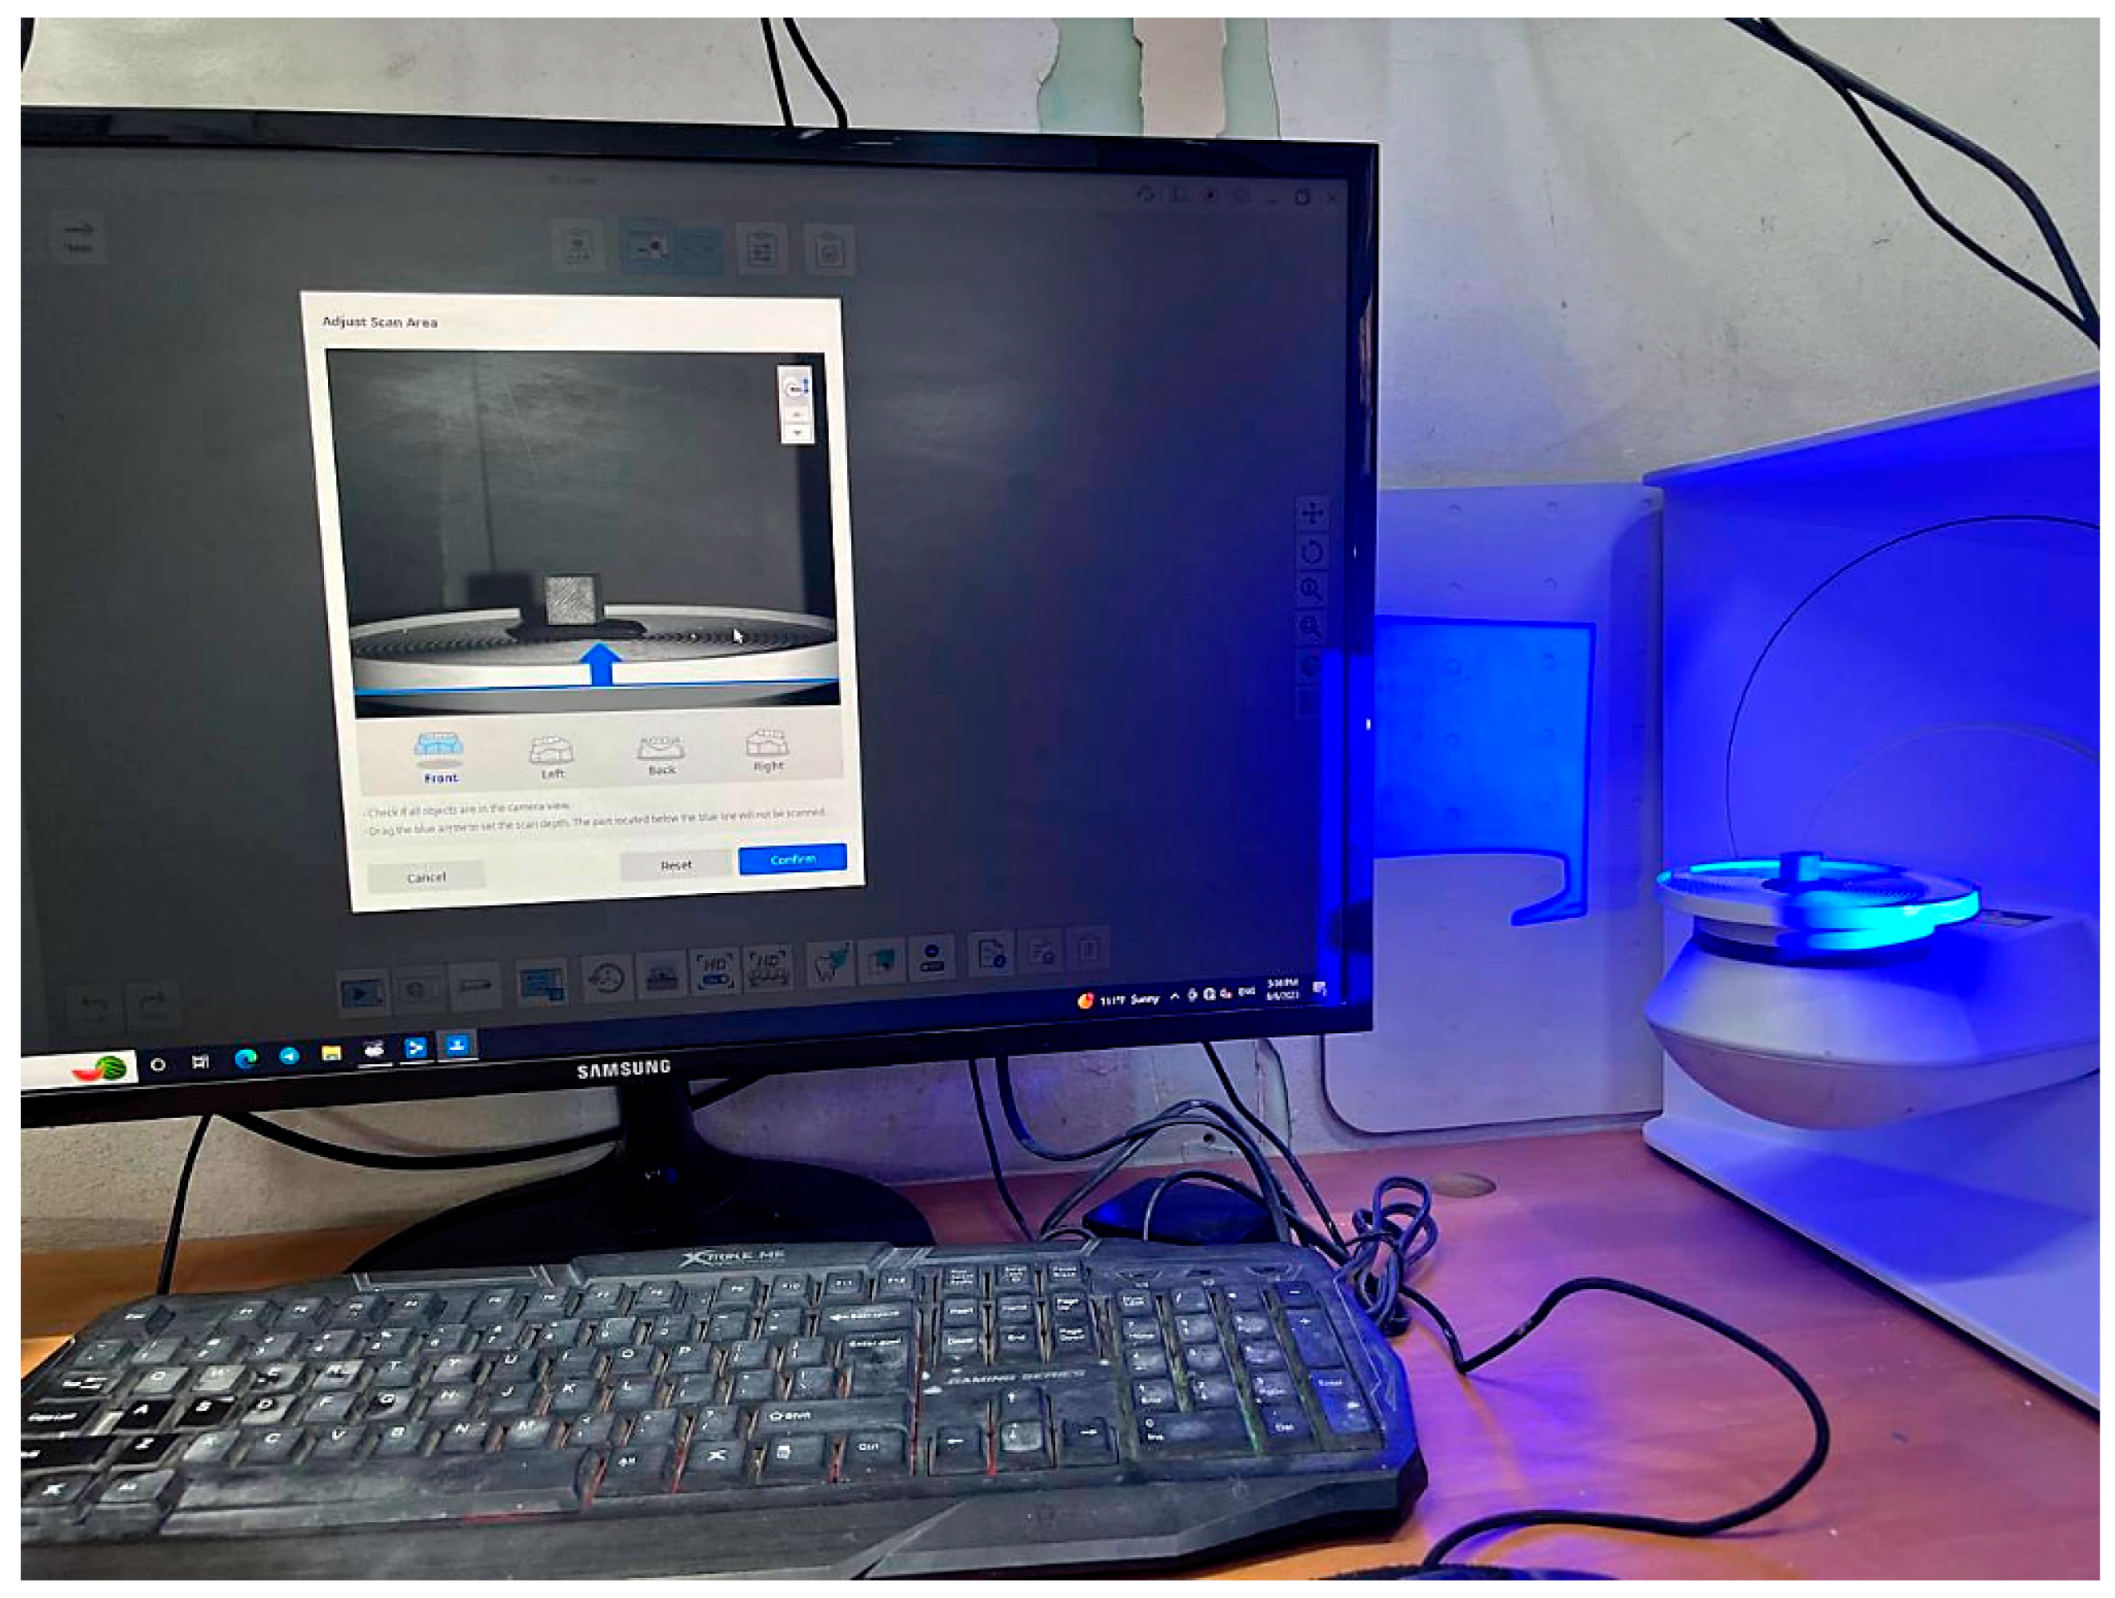
3.1. Surface Roughness Measurement

One of the significant drawbacks to rapid prototyping (RP) is that parts have an excessive surface roughness and require additional postprocess finishing [7]. The printer’s mechanism in creating the printed parts, which is the formation of one layer over another by exposure to UV, caused the roughness of the surface of the printed parts. Roughness for each cube surface was tested using the surface roughness tester (SRT-6210) shown in Figure 2a. Tests were taken with different directions and positions for each surface of the nine cubes (Figure 2b). The measurements were repeated three times at three separate locations on each surface, and the average values were used to calculate the roughness value. For all measurements, the cutoff length was taken as 0.8 mm.

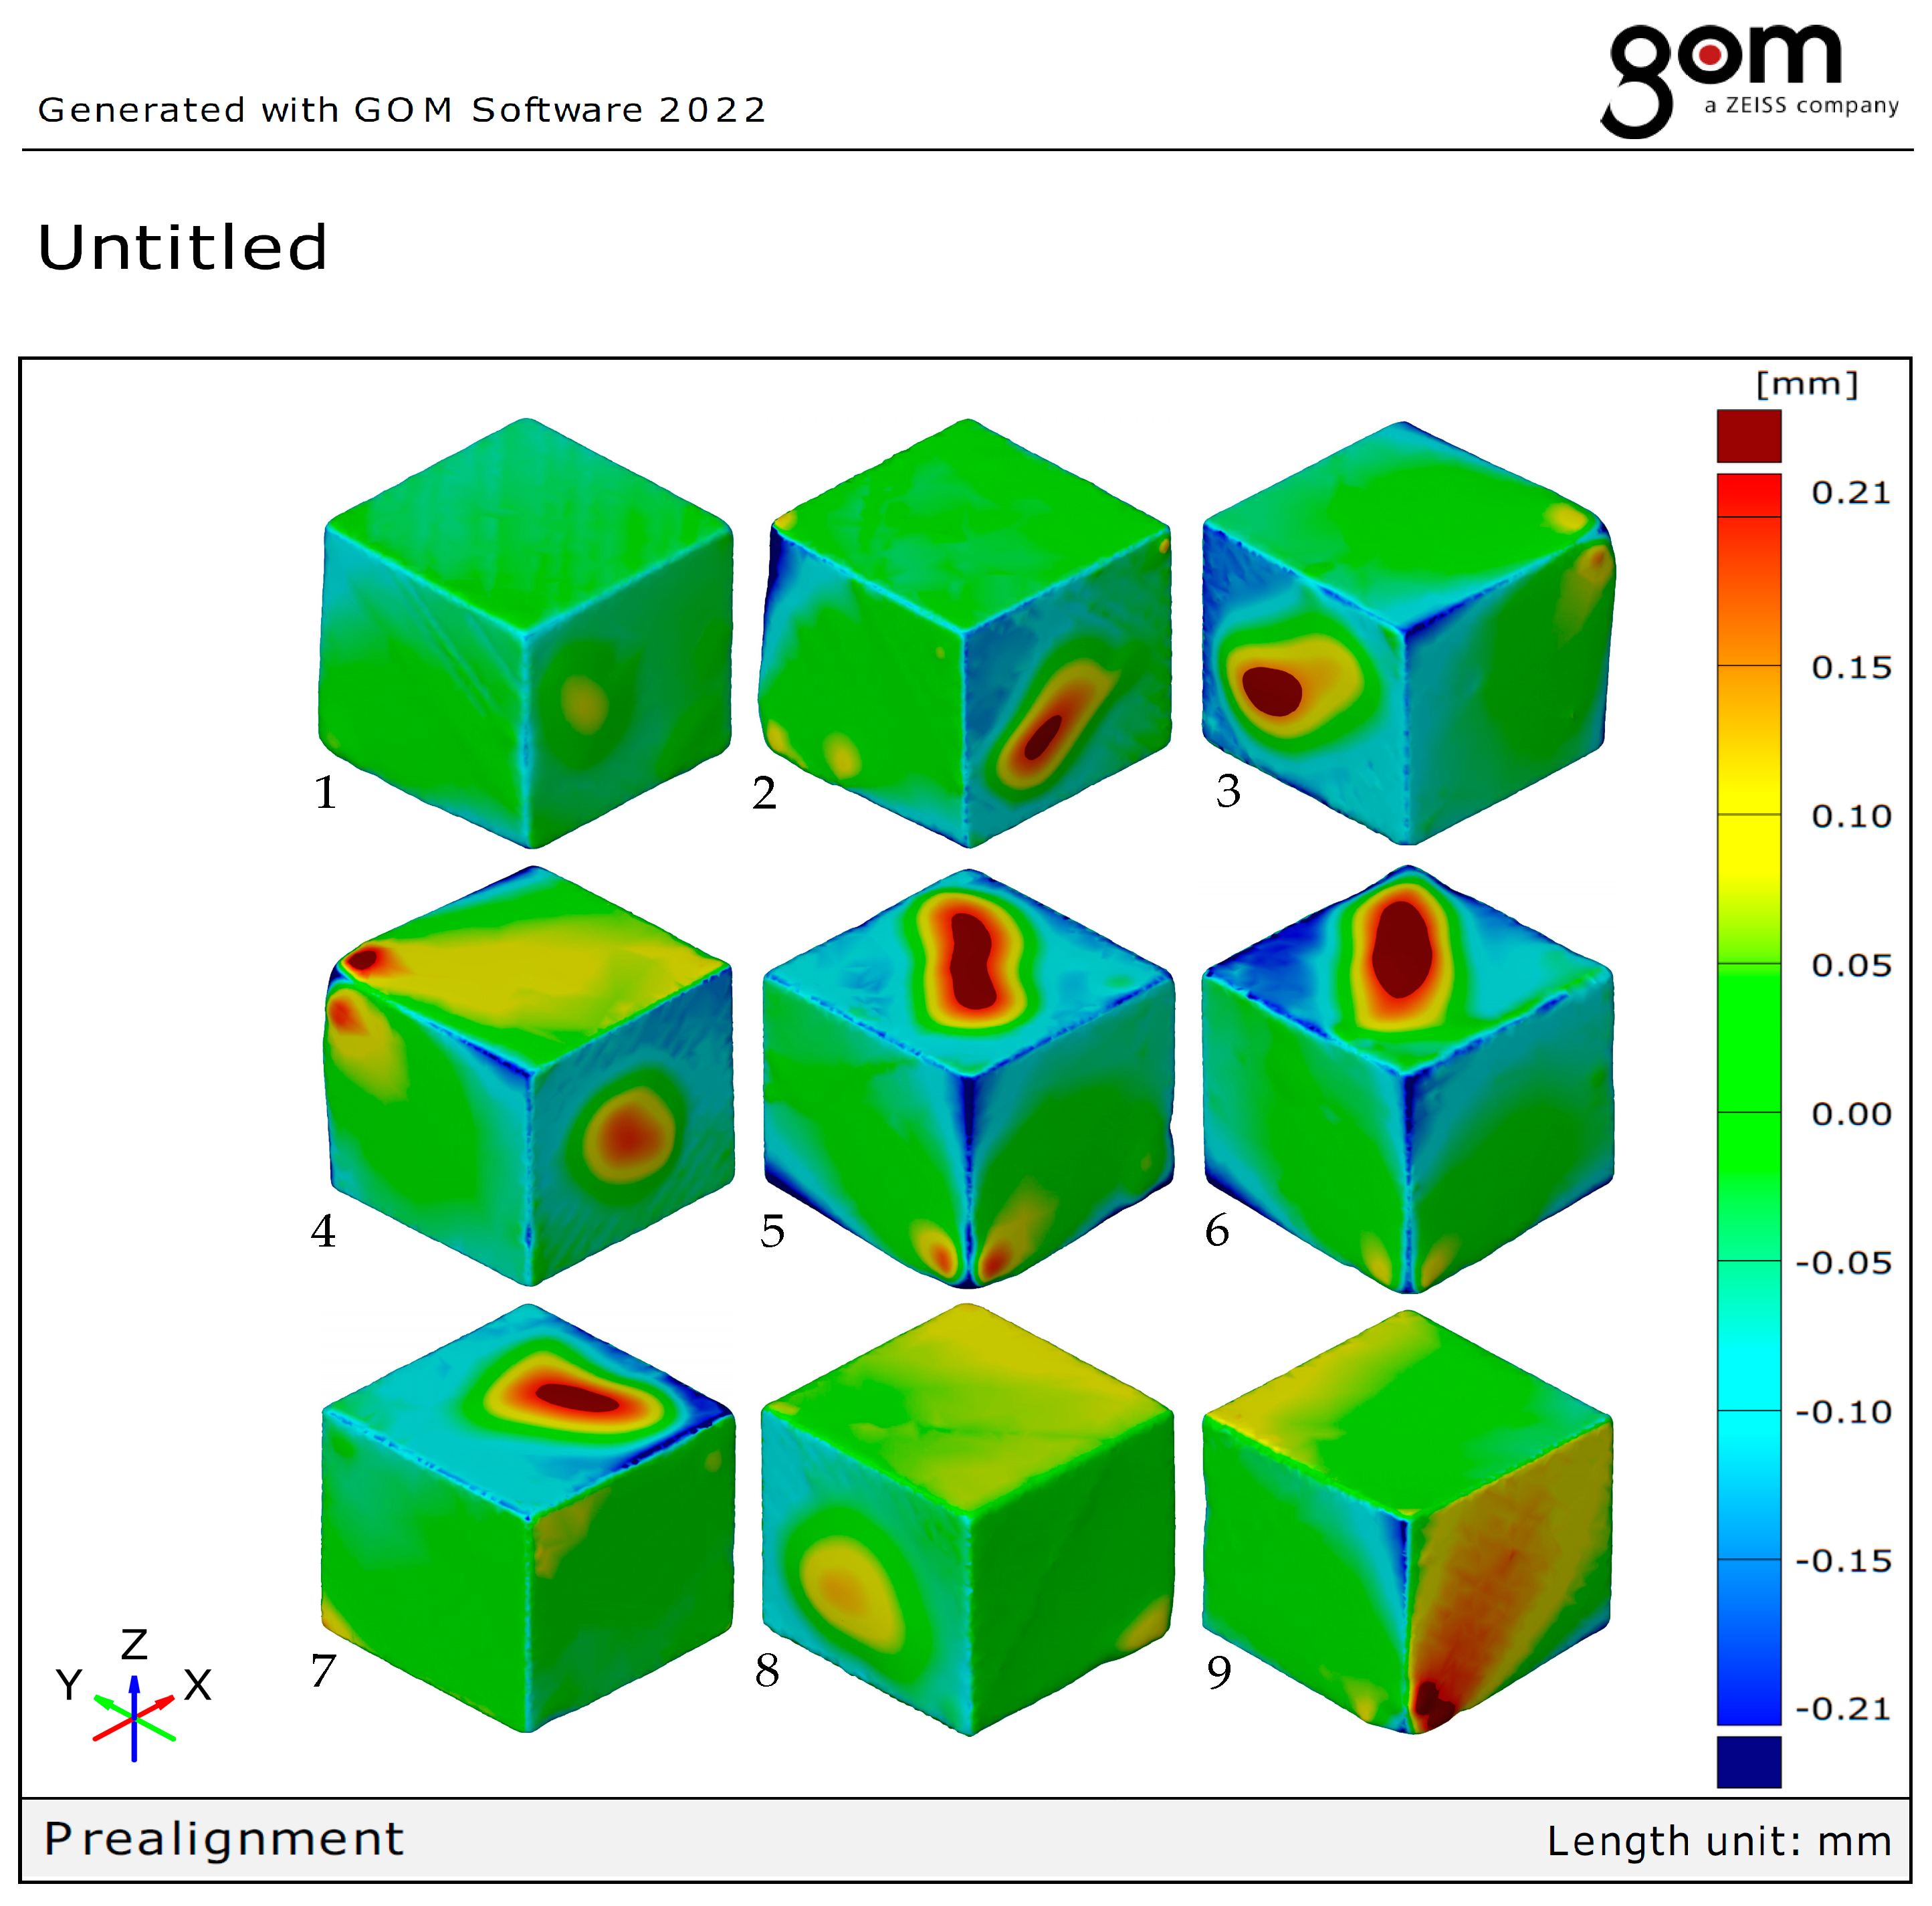
3.2. Dimensional Deviation Measurement

Dimensional accuracy in 3D printing is multifactorial and depends on several factors, such as printing technology, postprocessing methods, usage of support material and object orientation [39]. Each resulting printed cube was scanned with a Medit–T710 3D scanner with an accuracy of 0.4 µm (Figure 3), the nine scanned cubes are shown in Figure 4. In order to evaluate the geometric precision of the printed components, the resulting scanned file was opened using GOM 3D inspection software 2022 to measure the dimensional deviation by comparing each scanned cube with the CAD cube designed with SOLIDWORKS. The dimension measurement process was as follows: The scanner was connected to EXOCAD software 3.0 Galway 2021 to view and save the scanned file as an STL file. The initial step involved aligning the scanned mesh surface (representing the actual part) with the nominal CAD surface (representing the designed part) using a prealignment approach implemented within the GOM inspection software. The alignment method involves aligning the CAD and mesh components by evaluating a global best fit in the 3D space. This alignment aims to minimize errors and optimize computations. Once the scanned part and the nominal CAD surfaces have been aligned, a surface comparison is conducted. Following this, a color map is constructed to visually illustrate the differences in geometry between the actual data and the nominal data. The color map is displayed with both positive and negative values. The presence of positive values suggests that the actual sheet has undergone excessive deformation in relation to the intended nominal surface. In contrast, the presence of negative values indicates that the printed region shows insufficient formation in relation to the initial CAD surface. Figure 5 shows the sequence of dimensional measuring steps for GOM 3D inspection software.

4. Results and Discussion

The color map comparison between the CAD model and the SLA-printed version for the nine cubes using GOM 3D inspection software is shown in Figure 6. The colors denote zones with varied deviation ranges (in millimeters) from the actual printed component known as the CAD component. Positive numbers indicate that the manufactured component has exceeded the intended profile, whilst negative values indicate that the manufactured component has not reached the necessary depth. The GOM values of the nine figures represent the color maps of the nine cubes that were printed, following a different set of parameters for each one. The average of the absolute difference values for each cube’s overall dimensional deviation measurements was taken from all nine cubes [40], resulting in nine values per test cube (Table 5).
Taguchi L9’s three-level design was used to conduct the experimental plan. The resulting nine cubes based on this experimental plan are shown in Figure 7. The results for the measured dimensional deviation (Div) and surface roughness (Ra), respectively, are shown in Table 6 as the process output responses.

4.1. Analysis Using the Response Surface Method

The effect of the printing parameters, like normal exposure time (A), bottom exposure (B) time and bottom layers (C), on the dimensional deviation (Div) and surface roughness (Ra) as the output responses of a 10 mm printed cube was analyzed using the response surface method (RSM). The statistical analysis of variance (ANOVA) was used to analyze the results to identify the significant process parameters affecting the (Div) and (Ra) as responses, which should always be lower values. Based on the data presented in Table 6, the models were developed using Minitab (v18). A second-order regression model related to inputs and outputs was developed. The degree of reliability of the model was determined based on high values of R-square (R2), adjusted R-square (R2adj) and predicted R-square (R2pred) values [35]. Full quadratic models for regressions were achieved to give accuracy and reliability in predicting input–output relationships. The ANOVA was carried out for the responses with at least a 0.05 significance level or 95% confidence interval. Thus, in order to be significant, the parameters must have had a P-value less than or equal to 0.05; the lower the P-value, the more significant the impact [35]. The forward elimination method was used to exclude the nonsignificant terms in the model structure with p-values > 0.05 [36]. After eliminating the insignificant elements, the predicted mathematical regression equations for (Div) and (Ra) were obtained:
Div = 0.05646 + 0.03725 A − 0.000080 B − 0.015514 C − 0.000613 A*B + 0.000325 B*C
Ra = 18.56 − 9.70 A − 0.0243 B − 0.2399 C + 1.692 A*A
Table 7 and Table 8 show the ANOVA findings of the models (with a 95% confidence level) for (Div) and (Ra), respectively. According to the findings of the analysis, all quadratic regression models were either extremely significant (p = 0) or significant (0 < p < 0.05), and were negligible relative to pure error; hence, all the models were capable of reflecting all experimental data with a good degree of reliability, as shown in Table 9 and Table 10.

4.2. Parametric Analyses of Responses

The main effects of the process parameters were plotted, and the response curves (main effects) were used to examine the parametric effects on the response characteristics in order to identify the significant parameters and quantify their influence on the response characteristics.

4.2.1. Analysis of Dimensional Deviations

Dimensional deviations (Div) are a significant factor in the SLA process because of their vital influence on accuracy. Figure 8 shows the main effect plot for the means for each variable relating to (Div).
It is clear from Figure 6 that the normal exposure time (A) has significant effects on the dimensional deviation. As mentioned before, the average exposure time refers to the specific duration for which each photocurable resin layer is exposed to ultraviolet (UV) light during the curing process. This exposure time plays a crucial role in the shrinkage behavior of the resin and can affect the accuracy of the cured product [11].
The figure depicts that (Div) initially decreases as the exposure time increases, reaching a minimum value at the middle stage, but subsequently starts to increase with further increases in exposure time. This characteristic defines the behavior of the photosensitive material during curing or polymerization. The photosensitive material experiences initial low-volume shrinkage during the curing process, which gradually increases over time.
Generally, during curing, the photosensitive material undergoes chemical reactions, such as cross-linking or polymerization, where individual molecules join together to form more extensive, interconnected networks. These reactions involve the formation of chemical bonds between the molecules. As the bonds are formed, the material’s molecular structure undergoes changes, leading to a reduction in volume and resulting in shrinkage [31].
As is evident from Figure 8, bottom exposure time (B) has little effect on dimensional deviation (Div). This slight increase in (Div) refers to the UV exposure time applied to the first few layers of the 3D prints. It specifically applies to the initial layer fabrication between the platform and the bottom of the resin container. However, the increased UV exposure time for the bottom layers results in more significant shrinkage, leading to increased dimensional deviation.
Finally, it is understandable that the bottom layer (C) greatly impacts dimensional deviation. More specifically, transforming (C) alone from 1 to 7 can decrease (Div). Increasing the number of (C) provides additional support and prevents warping or deformation during the printing process, leading to a smaller amount of deviation [19].

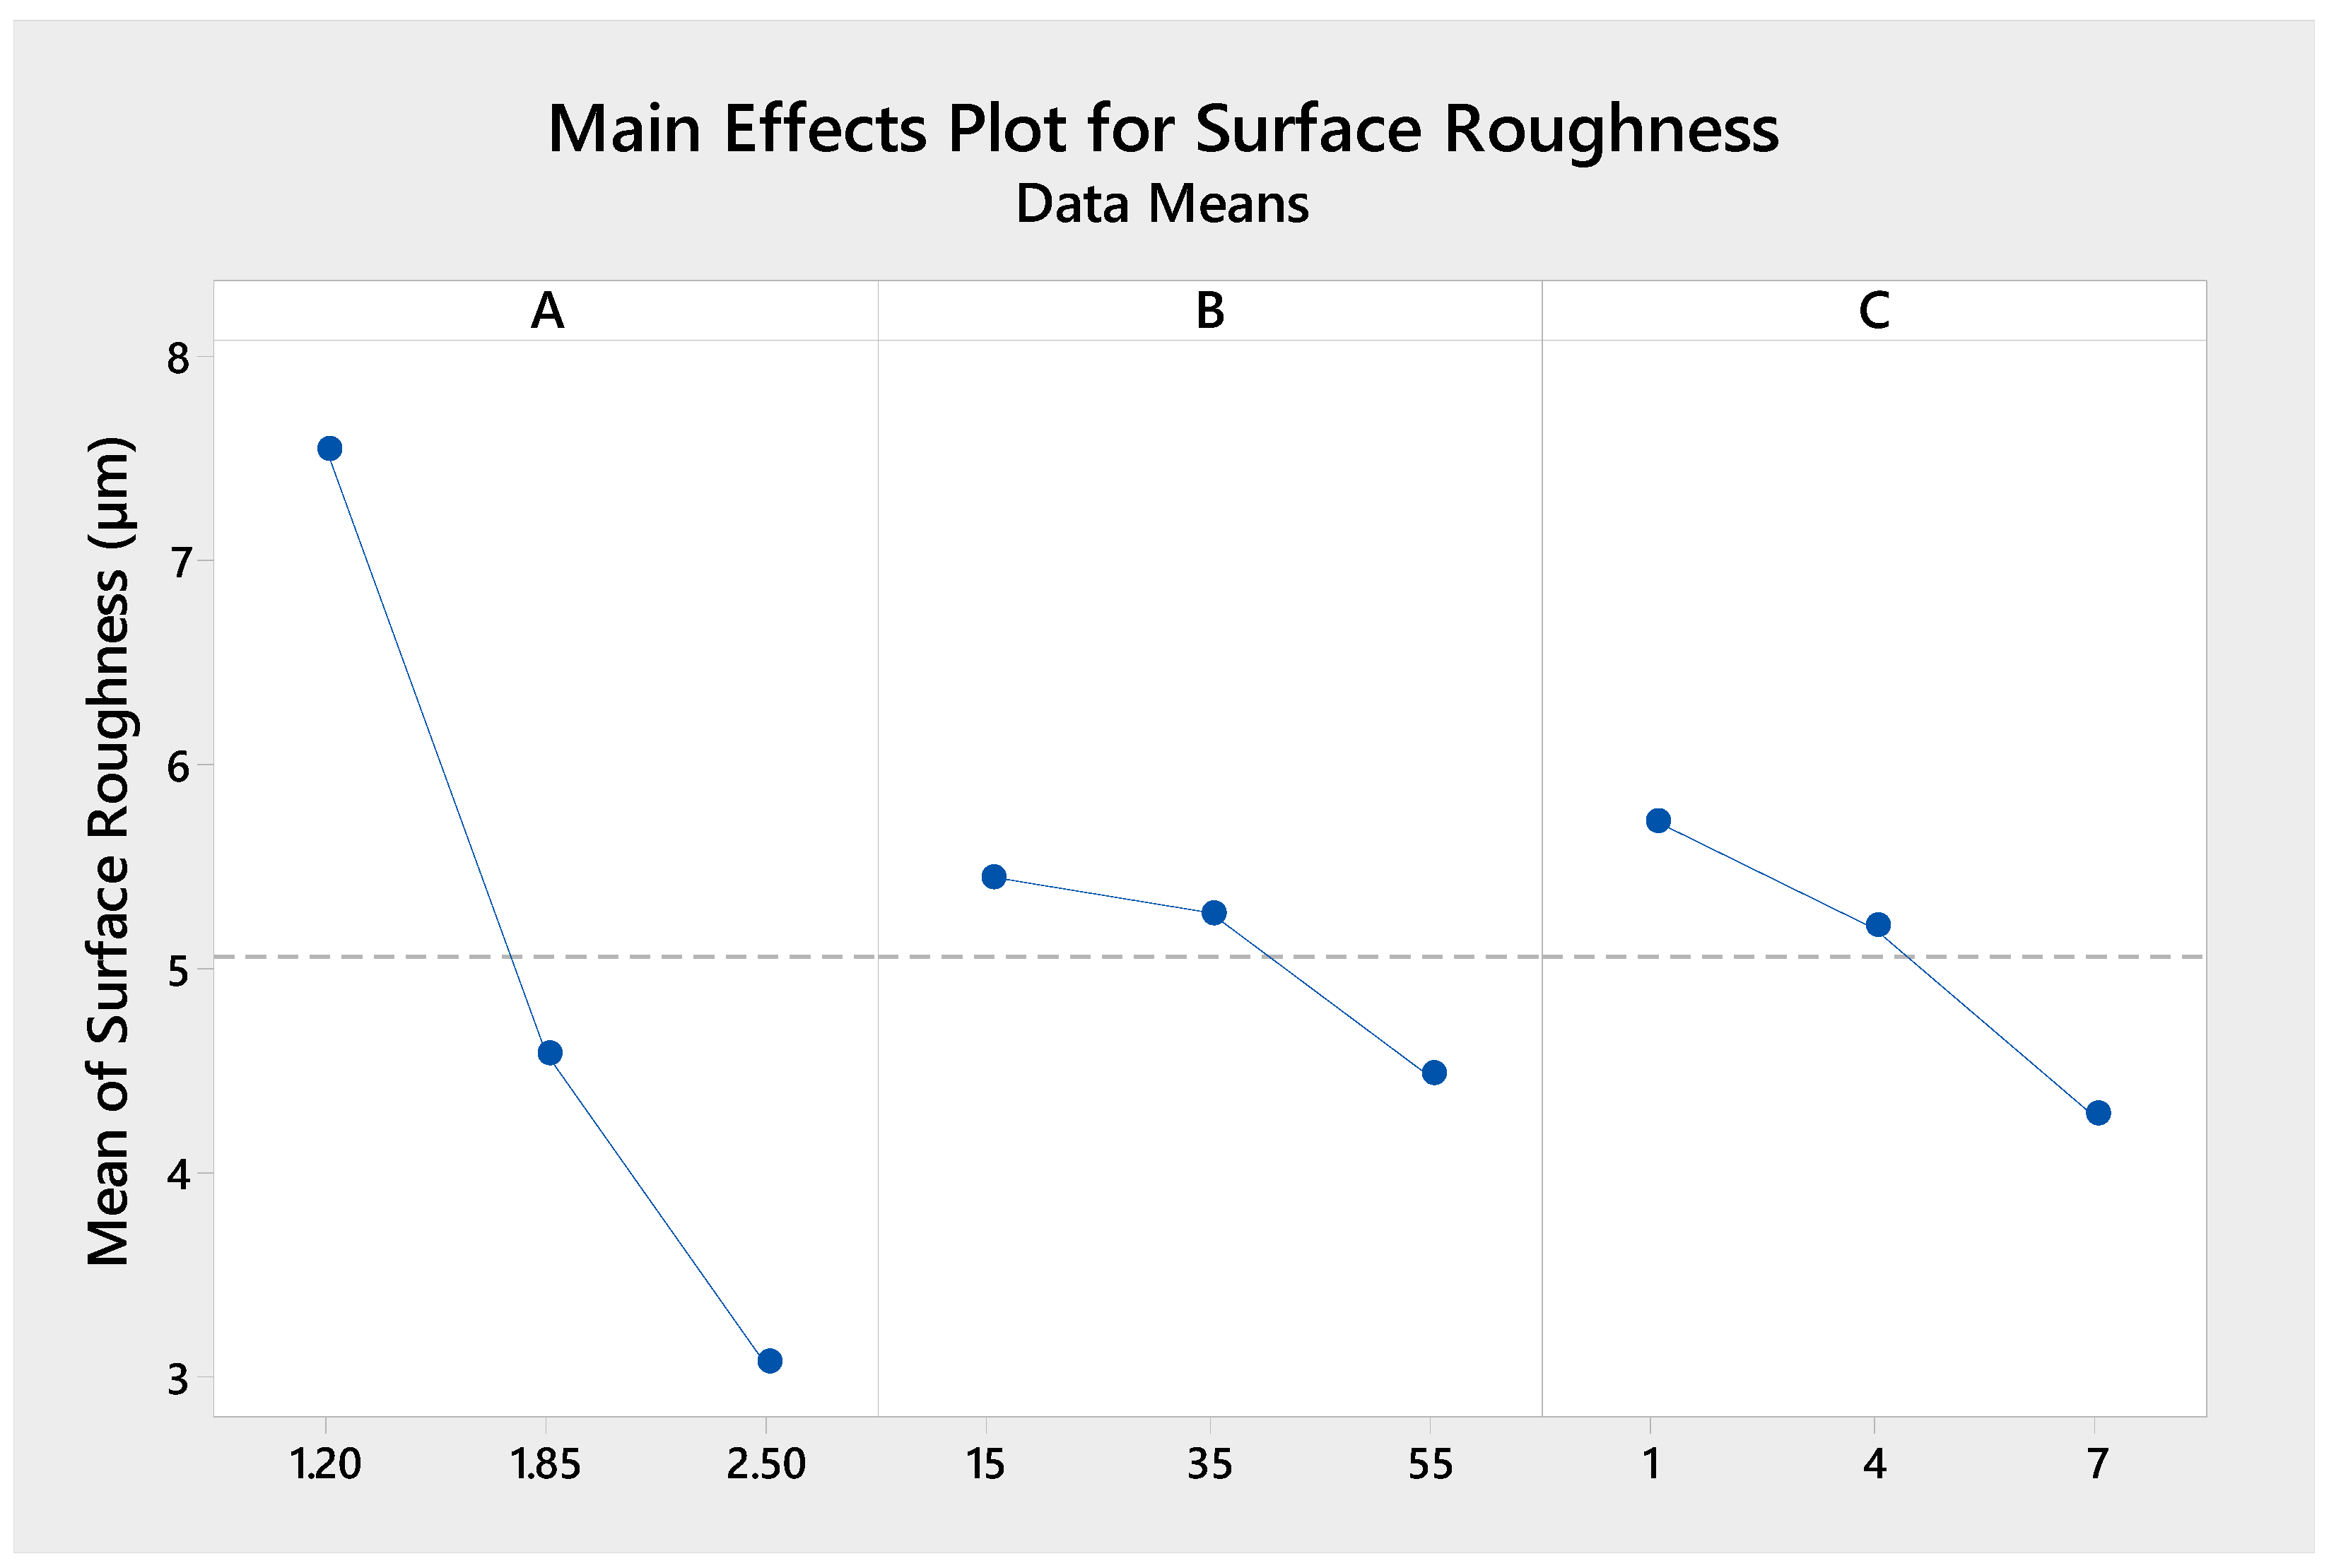
4.2.2. Analysis of Surface Roughness

The main effects plot of means for surface roughness (Ra) is illustrated in Figure 9. It is clear that (A) has a more significant impact on (Ra), and (Ra) decreases with an increase in (A). The decrease in roughness of the surface of the printed parts via exposure to UV light indicates a higher level of chemical bonds at the surface, which is associated with cross-linking and/or oxidation [41]. Enhancing the bonds between layers can lead to a reduction in the visibility of layer lines and surface irregularities on the printed product, hence yielding a more refined surface texture. Also, the application of a polymer surface treatment technique results in a decrease in surface roughness upon exposure to ultraviolet (UV) light, hence potentially enhancing the glossiness of the polymer surface [42]. A notable correlation exists between gloss and surface roughness, whereby an increase in gloss is accompanied by a decrease in surface roughness [43].
Similarly, the increase in (B) results in a smaller (Ra) value. This is the same reason as that mentioned above for (A), which can surely be applied here.
Lastly, Figure 9 clarifies that the increase in bottom layers (C) decreases surface roughness (Ra); these layers act as support structures and are necessary to prevent the part from warping or collapsing (changing orientation) during the printing process. The (Ra) of a stereolithographic (SLA) printed part can vary depending on its orientation, which can result in marks being left on the surface during the printing process [25]. For example, if the part is printed with a flat surface parallel to the build platform, the resin layers are deposited horizontally, resulting in a smoother surface finish. On the other hand, if the part is printed with a flat surface perpendicular to the build platform, the resin layers are deposited vertically, resulting in a rougher surface finish with visible layer lines. However, increasing the number of bottom layers may be necessary to provide additional support and prevent warping or deformation during the printing process [19].

5. Multiobjective Optimization of Response

Complex systems (such as the SLA process) necessitate multiobjective optimization because it is difficult to determine the optimal combination of all parameters [35]. Multiresponse optimization generates multiple optimal solutions as opposed to a single optimal solution. This study therefore employed multiresponse optimization with a desirability function. In this manner, the optimal set of parameters for simultaneously obtaining the minimum (Div) and minimum (Ra) as the desired output conditions was chosen. Due to the many process variables and their interactions, it was challenging to choose the optimal combination of process parameters (A, B and C) to achieve the desired outputs. The objective functions of the responses can be expressed as follows:
Minimize (Div) = f (A, B, C)
Minimize (Ra) = f (A, B, C)

5.1. Parametric Optimization

On the basis of the second-order quadratic mathematical model of the responses developed in the previous sections via Equations (1) and (2), the independent desirability functions d1 and d2 for minimum dimensional deviation and minimum surface irregularity, respectively, were selected. Next, the weighting factor (s) value associated with each response’s desirability function was assigned. When the weighting factor has a value of less than one, the desirability function of a response for pursuing the target becomes less sensitive. A weighting factor greater than one has the opposite effect. Therefore, it is typically set to unity, which offers a moderate level of sensitivity [44].
In the case of multiresponse optimization, it should be noted that a suitable weighting factor must be assigned to each response based on the relative importance of each response. This study assigned (Div) and (Ra) equal weightings (w = 0.5). Furthermore, the default importance value (s = 1) was chosen for all responses, meaning it was equally essential to achieving the goals.
Minitab’s Response Optimizer was used to seek the optimal input combinations that would yield the most acceptable compromise between responses. Table 11 provides a summary of the essential parameters and values for determining the optimal global solution.
Figure 10 is a visual representation of the optimal outcome. The optimization diagram illustrates how each input (columns) affects the desirability of the output (rows). In addition, each cell illustrates how the response varies with specific inputs while other inputs remain constant. The solid red lines represent the optimal configuration, while the blue dashed lines represent the current output value. High and low input parameters are also represented by the numbers 1 and −1, respectively.
The most important part of this graph is located in the middle row, between the high and low rows, as represented by “cur” (in red) and written in code. This information offers the ideal parameter settings needed to meet the specified criterion. In this regard, the composite desirability value (shown in blue in the first column from the left) is calculated by adding the individual desirability values of each response. Figure 10 reveals that high values of desirability were attained for each output, resulting in a high composite desirability value. Therefore, optimization was effective in determining the optimal set of parameters. In conclusion, moderate levels of (A) and (B) with high (C) should be used to achieve the optimum combination of (Div) and (Ra) with values of 0.0517 mm and 2.8079 µm, respectively.

5.2. Confirmation of the Experiments

Confirmation experiments were performed to validate the optimization results. As is shown in Figure 11, a supplementary cube was printed with the optimal set of input parameters. The color map comparison between the CAD model and the SLA-printed version for the optimum cubes using GOM 3D inspection software is shown in Figure 12. The outcomes of these experiments are contrasted with the outcomes of the optimization in Table 12. The percentage of relative verification errors between the optimization results and the printed response is calculated as follows [27]:
Prediction error % = [(Printed result − Predicted result)/Predicted result] × 100
As is clear from Table 12, the percentage values of the prediction error are satisfying from the viewpoint of engineering applications. The experimental printed validation results are in good agreement with the optimal values predicted.
Figure 13 shows a photograph of the printed bridge model based on the optimum parameters of the cubes. Its average surface roughness was measured as shown in Figure 14, and its value was 2.6431 µm. Also, the bridge was scanned and compared with the designed EXOCAD bridge model using GOM 3D inspection software to measure the dimensional deviation, as shown in Figure 15 and Figure 16. The three-dimensional comparison technique using GOM is based on the alignment of the STL files of the CAD design and the scanned file, followed by a 3D comparison operation. Thus, Figure 16 depicts the dental bridge (alignment and comparison) in two different views for the same inspection. The average value of the dimensional deviation was 0.064667 mm. The clinically acceptable value in dentistry is 0.25 mm [45], so this work introduces a very powerful method for producing parts with high accuracy.

6. Conclusions and Future Studies

This study employed a multioptimization technique that uses the Taguchi method with the RSM method and that depends upon the concept of the desirability function (DF). The optimal parameter combinations for SLA printing of a dental bridge model obtained from a simple CAD model were investigated. The essential conclusions drawn from the present work are summarized as follows:
  • The surface roughness shows a significant decrease with the decrease in exposure time and a slight decrease with the increases in bottom exposure time and bottom layers.
  • The normal exposure time gives a lower average dimensional deviation at its middle level, but the bottom layers show a significant decrease in dimensional deviation. The bottom exposure time shows a slight increase in dimensional deviation.
  • The mathematical models developed by utilizing the Taguchi method with the RSM method revealed that input–output relationships in the SLA process could be determined with reasonable accuracy and reliability to produce a dental bridge model based on a simple CAD model.
  • Analyses of the main effects of the process variables (normal exposure time, bottom exposure time and bottom layers) showed that they were significant for the process outputs except in the case of the insignificant effect of bottom exposure time on surface roughness.
  • The multioptimization method used in this research gives ideal parameter sets, i.e., the highest levels of normal exposure time, highest bottom layers and moderate levels of bottom exposure time, for achieving the best combination of low dimensional deviation and low surface roughness.

Author Contributions

Conceptualization, N.K.A.-K.; methodology, N.K.A.-K.; software, N.K.A.-K. and T.R.M.; validation and investigation, N.K.A.-K. and T.R.M.; formal analysis, N.K.A.-K. and T.R.M.; writing—original draft preparation, N.K.A.-K. and T.R.M.; writing—review and editing and supervision, N.K.A.-K. All authors have read and agreed to the published version of the manuscript.

Funding

This research received no external funding.

Institutional Review Board Statement

Not applicable.

Informed Consent Statement

Not applicable.

Data Availability Statement

All data used are shown in the text. The authors will make the data available free of charge upon request.

Acknowledgments

The authors of this publication would like to thank the technical staff in the King dental lab, especially Adel Mohammed Hussein and Oday Gheni Jawad.

Conflicts of Interest

The authors declare no conflict of interest.

References

  1. Zhang, H.; Yang, Y.; Hu, K.; Liu, B.; Liu, M.; Huang, Z. Stereolithography-based additive manufacturing of lightweight and high-strength Cf/SiC ceramics. Addit. Manuf. 2020, 34, 101199. [Google Scholar] [CrossRef]
  2. Zhou, J.G.; Herscovici, D.; Chen, C.C. Parametric process optimization to improve the accuracy of rapid prototyped stereolithography parts. Int. J. Mach. Tools Manuf. 2000, 40, 363–379. [Google Scholar] [CrossRef]
  3. Huang, J.; Qin, Q.; Wang, J. A review of stereolithography: Processes and systems. Processes 2020, 8, 1138. [Google Scholar] [CrossRef]
  4. Dawood, A.; Marti, B.M.; Sauret-Jackson, V.; Darwood, A. 3D printing in dentistry. Br. Dent. J. 2015, 219, 521–529. [Google Scholar] [CrossRef] [PubMed]
  5. Della Bona, A.; Cantelli, V.; Britto, V.T.; Collares, K.F.; Stansbury, J.W. 3D printing restorative materials using a stereolithographic technique: A systematic review. Dent. Mater. 2021, 37, 336–350. [Google Scholar] [CrossRef]
  6. Chen, S.G.; Yang, J.; Jia, Y.G.; Lu, B.; Ren, L. TiO2 and PEEK reinforced 3D printing PMMA composite resin for dental denture base applications. Nanomaterials 2019, 9, 1049. [Google Scholar] [CrossRef]
  7. Mostafa, K.G.; Nobes, D.S.; Qureshi, A.J. Investigation of light-induced surface roughness in projection micro-stereolithography additive manufacturing (PµSLA). Procedia CIRP 2020, 92, 187–193. [Google Scholar] [CrossRef]
  8. Kazemi, M.; Rahimi, A. Stereolithography process optimization for tensile strength improvement of products. Rapid Prototyp. J. 2018, 24, 688–697. [Google Scholar] [CrossRef]
  9. Khorasani, E.R.; Baseri, H. Determination of optimum SLA process parameters of H-shaped parts. J. Mech. Sci. Technol. 2013, 27, 857–863. [Google Scholar] [CrossRef]
  10. Cheng, W.; Fuh, J.Y.H.; Nee, A.Y.C.; Wong, Y.S.; Loh, H.T.; Miyazawa, T. Multi-objective optimization of part-building orientation in stereolithography. Rapid Prototyp. J. 1995, 1, 12–23. [Google Scholar] [CrossRef]
  11. Fuh, J.Y.H.; Choo, Y.S.; Nee, A.Y.C.; Lu, L.; Lee, K.C. Improvement of the UV curing process for the laser lithography technique. Mater. Des. 1995, 16, 23–32. [Google Scholar] [CrossRef]
  12. Bugeda, G.; Cervera, M.; Lombera, G.; Onate, E. Numerical analysis of stereolithography processes using the finite element method. Rapid Prototyp. J. 1995, 1, 13–23. [Google Scholar] [CrossRef]
  13. Wang, W.L.; Cheah, C.M.; Fuh, J.Y.H.; Lu, L. Influence of process parameters on stereolithography part shrinkage. Mater. Des. 1996, 17, 205–213. [Google Scholar] [CrossRef]
  14. Onuh, S.O.; Hon, K.K.B. Optimising build parameters for improved surface finish in stereolithography. Int. J. Mach. Tools Manuf. 1998, 38, 329–342. [Google Scholar] [CrossRef]
  15. Cho, H.S.; Park, W.S.; Choi, B.W.; Leu, M.C. Determining optimal parameters for stereolithography processes via genetic algorithm. J. Manuf. Syst. 2000, 19, 18–27. [Google Scholar] [CrossRef]
  16. Lee, S.H.; Park, W.S.; Cho, H.S.; Zhang, W.L.M.C.; Leu, M.C. A neural network approach to the modelling and analysis of stereolithography processes. Proc. Inst. Mech. Eng. Part B J. Eng. Manuf. 2001, 215, 1719–1733. [Google Scholar] [CrossRef]
  17. Chockalingam, K.; Jawahar, N.; Vijaybabu, E.R. Optimization of process parameters in stereolithography using genetic algorithm. In Smart Materials, Structures, and Systems; SPIE: Washington, DC, USA, 2003; Volume 5062, pp. 417–424. [Google Scholar]
  18. Singhal, S.K.; Pandey, A.P.; Pandey, P.M.; Nagpal, A.K. Optimum part deposition orientation in stereolithography. Comput.-Aided Des. Appl. 2005, 2, 319–328. [Google Scholar] [CrossRef]
  19. Campanelli, S.L.; Cardano, G.; Giannoccaro, R.; Ludovico, A.D.; Bohez, E.L. Statistical analysis of the stereolithographic process to improve the accuracy. Comput.-Aided Des. 2007, 39, 80–86. [Google Scholar] [CrossRef]
  20. Sager, B.; Rosen, D.W. Use of parameter estimation for stereolithography surface finish improvement. Rapid Prototyp. J. 2008, 14, 213–220. [Google Scholar] [CrossRef]
  21. Dzionk, S. Surface roughness model for components created by stereolithography method. Solid State Phenom. 2010, 165, 268–273. [Google Scholar] [CrossRef]
  22. Unkovskiy, A.; Bui, P.H.B.; Schille, C.; Geis-Gerstorfer, J.; Huettig, F.; Spintzyk, S. Objects build orientation, positioning, and curing influence dimensional accuracy and flexural properties of stereolithographically printed resin. Dent. Mater. 2018, 34, e324–e333. [Google Scholar] [CrossRef] [PubMed]
  23. Loflin, W.A.; English, J.D.; Borders, C.; Harris, L.M.; Moon, A.; Holland, J.N.; Kasper, F.K. Effect of print layer height on the assessment of 3D-printed models. Am. J. Orthod. Dentofac. Orthop. 2019, 156, 283–289. [Google Scholar] [CrossRef] [PubMed]
  24. Cotabarren, I.; Palla, C.A.; McCue, C.T.; Hart, A.J. An assessment of the dimensional accuracy and geometry-resolution limit of desktop stereolithography using response surface methodology. Rapid Prototyp. J. 2019, 25, 1169–1186. [Google Scholar] [CrossRef]
  25. Khodaii, J.; Rahimi, A. Improving the surface roughness in stereolithography by controlling surface angle, hatch spaces, and postcuring time. Eng. Rep. 2020, 2, e12193. [Google Scholar] [CrossRef]
  26. Katheng, A.; Kanazawa, M.; Iwaki, M.; Minakuchi, S. Evaluation of dimensional accuracy and degree of polymerization of stereolithography photopolymer resin under different postpolymerization conditions: An in vitro study. J. Prosthet. Dent. 2021, 125, 695–702. [Google Scholar] [CrossRef]
  27. Borra, N.D.; Neigapula, V.S.N. Parametric optimization for dimensional correctness of 3D printed part using masked stereolithography: Taguchi method. Rapid Prototyp. J. 2023, 29, 166–184. [Google Scholar] [CrossRef]
  28. Dhanunjayarao, B.N.; Naidu, N.S. Assessment of dimensional accuracy of 3D printed part using resin 3D printing technique. Mater. Today Proc. 2022, 59, 1608–1614. [Google Scholar] [CrossRef]
  29. Badanova, N.; Perveen, A.; Talamona, D. Study of SLA Printing Parameters Affecting the Dimensional Accuracy of the Pattern and Casting in Rapid Investment Casting. J. Manuf. Mater. Process. 2022, 6, 109. [Google Scholar] [CrossRef]
  30. Msallem, B.; Sharma, N.; Cao, S.; Halbeisen, F.S.; Zeilhofer, H.F.; Thieringer, F.M. Evaluation of the dimensional accuracy of 3D-printed anatomical mandibular models using FFF, SLA, SLS, MJ, and BJ printing technology. J. Clin. Med. 2020, 9, 817. [Google Scholar] [CrossRef]
  31. Quan, H.; Zhang, T.; Xu, H.; Luo, S.; Nie, J.; Zhu, X. Photo-curing 3D printing technique and its challenges. Bioact. Mater. 2020, 5, 110–115. [Google Scholar] [CrossRef]
  32. Mhmood, T.R.; Al-Karkhi, N.K. A Review of the Stereo lithography 3D Printing Process and the Effect of Parameters on Quality. Al-Khwarizmi Eng. J. 2023, 19, 82–94. [Google Scholar] [CrossRef]
  33. Stampfl, J.; Wöß, A.; Seidler, S.; Fouad, H.; Pisaipan, A.; Schwager, F.; Liska, R. Water soluble, photocurable resins for rapid prototyping applications. In Macromolecular Symposia; No. 1; WILEY-VCH: Weinheim, Germany, 2004; Volume 217, pp. 99–108. [Google Scholar]
  34. Kilickap, E. Modeling and optimization of burr height in drilling of Al-7075 using Taguchi method and response surface methodology. Int. J. Adv. Manuf. Technol. 2010, 49, 911–923. [Google Scholar] [CrossRef]
  35. Raissi, S.; Farsani, R.E. Statistical process optimization through multi-response surface methodology. Int. J. Math. Comput. Sci. 2009, 3, 197–201. [Google Scholar]
  36. Mason, R.L.; Gunst, R.F.; Hess, J.L. Statistical Design and Analysis of Experiments: With Applications to Engineering and Science; John Wiley Sons: Hoboken, NJ, USA, 2003; Volume 474. [Google Scholar]
  37. Huang, Y.M.; Lan, H.Y. Compensation of distortion in the bottom exposure of stereolithography process. Int. J. Adv. Manuf. Technol. 2006, 27, 1101–1112. [Google Scholar] [CrossRef]
  38. Emami, M.M.; Barazandeh, F.; Yaghmaie, F. Scanning-projection based stereolithography: Method and structure. Sens. Actuators A Phys. 2014, 218, 116–124. [Google Scholar] [CrossRef]
  39. Sharma, N.; Cao, S.; Msallem, B.; Kunz, C.; Brantner, P.; Honigmann, P.; Thieringer, F.M. Effects of steam sterilization on 3D printed biocompatible resin materials for surgical guides—An accuracy assessment study. J. Clin. Med. 2020, 9, 1506. [Google Scholar] [CrossRef]
  40. Nocar, A.; Procházka, A.; Kloubcová, M.; Hyšpler, P.; Schatz, M.; Dostálová, T. A Three-Year Prospective Study Comparing Stereolithography Printed Models to Classical Impression and Plaster Cast Models in Orthodontic Therapy: A 3D Objectification Approach. Appl. Sci. 2023, 13, 7542. [Google Scholar] [CrossRef]
  41. Azevedo, E.C.; Nascimento, E.M.; Chierice, G.O.; Claro Neto, S.; Lepienski, C.M. UV and gamma irradiation effects on surface properties of polyurethane derivate from castor oil. Polímeros 2013, 23, 305–311. [Google Scholar] [CrossRef]
  42. Golhin, A.P.; Tonello, R.; Frisvad, J.R.; Grammatikos, S.; Strandlie, A. Surface roughness of as-printed polymers: A comprehensive review. Int. J. Adv. Manuf. Technol. 2023, 127, 987–1043. [Google Scholar] [CrossRef]
  43. Alhassan, M.; Maawadh, A.; Labban, N.; Alnafaiy, S.M.; Alotaibi, H.N.; BinMahfooz, A.M. Effect of Different Surface Treatments on the Surface Roughness and Gloss of Resin-Modified CAD/CAM Ceramics. Appl. Sci. 2022, 12, 11972. [Google Scholar] [CrossRef]
  44. Montgomery, D. Design and Analysis of Experiments, 8th ed.; Wiley: New York, NY, USA, 2013; ISBN 978-1-118-09793-9. [Google Scholar]
  45. Hazeveld, A.; Slater, J.J.R.H.; Ren, Y.J. Accuracy and reproducibility of dental replica models reconstructed by different rapid prototyping techniques. Am. J. Orthod. Dentofac. Orthop. 2014, 145, 108–115. [Google Scholar] [CrossRef] [PubMed]
Figure 1. Photon Mono X resin 3D printer.
Applsci 13 10911 g001
Figure 2. Surface roughness cube measurements: (a) direction of surface finish measurement; (b) surface roughness tester (SRT-6210).
Applsci 13 10911 g002
Figure 3. Cube scanning using Medit–T710 3D scanner.
Applsci 13 10911 g003
Figure 4. Nine scanned cubes for different set of parameters.
Applsci 13 10911 g004
Figure 5. GOM 3D inspection software dimensional measuring steps.
Applsci 13 10911 g005
Figure 6. Comparison between the CAD model and the SLA-printed version for the nine cubes.
Applsci 13 10911 g006
Figure 7. Photograph of printed cubes.
Applsci 13 10911 g007
Figure 8. Main effects plot for dimensional deviation. (A: Normal exposure time, B: Bottom exposure time, and C: Bottom layers).
Applsci 13 10911 g008
Figure 9. Main effects plot for surface roughness. (A: Normal exposure time, B: Bottom exposure time, and C: Bottom layers).
Applsci 13 10911 g009
Figure 10. The optimization plot.
Applsci 13 10911 g010
Figure 11. The printed cube for validation.
Applsci 13 10911 g011
Figure 12. Comparison between the CAD model and the SLA-printed version for the optimum cube.
Applsci 13 10911 g012
Figure 13. Photograph of printed bridge.
Applsci 13 10911 g013
Figure 14. Surface roughness bridge measurement.
Applsci 13 10911 g014
Figure 15. Bridge scanned with Medit–T710 3D scanner.
Applsci 13 10911 g015
Figure 16. Comparison between the EXOCAD bridge model and the SLA-printed version in front and back views.
Applsci 13 10911 g016
Table 1. The specifications of water-washable resin.
PropertyUnitValue
Densityg/cm³1.05–1.15
ViscosityCps150–250
Elongation at break 10–14%
Flexural strengthMpa45–75
Tensile strengthMpa30–46
HardnessD78–79
Shelf life 6 months (3 months after opening)
Wavelength (UV light)nm 405
Table 2. Printing parameters and output response abbreviations.
Printing Parameters and ResponsesAbbreviationsUnits
Normal exposure timeASecond (s)
Bottom exposure timeBSecond (s)
Bottom layersCCount
Dimension deviationDivMillimeter (mm)
Average roughnessRaMicrometer (µm)
Table 3. Printing parameters and their levels.
Input ParametersUnitsCoded LevelsActual Values
Normal exposure timeSeconds1231.21.852.5
Bottom exposure timeSeconds123153555
Bottom layersCount123147
Table 4. Taguchi level design for input parameters.
Run OrderABC
CodedActualCodedActualCodedActual
111.211511
211.223524
311.235537
421.8511524
521.8523537
621.8535511
732.511537
832.523511
932.535524
Table 5. Anycubic photon Mono X specifications.
Operation3.5-inch touch screen
Light sourceHigh-quality filament
Light wavelength405 nm
XY resolution0.050 mm 3840 × 2400 (4k)
Z axis resolution0.01 mm
Layer resolution0.01–0.15 mm
Printing speedMAX 60 mm/h
Rated power120 w
Material405 nm UV resin
SoftwareANYCUBIC photon workshop V2.1.30.RC17
ConnectivityUSB
TechnologyLCD-based SLA
Table 6. Average response results.
Exp.
No.
A
(s)
B
(s)
C
(Count)
Div
(mm)
Ra
(µm)
11.201510.0798.901
21.203540.0563337.963
31.205570.0726675.781
41.851540.0628814.718
51.853570.0538334.328
61.855510.0608334.740
72.501570.0516952.747
82.503510.0891673.534
92.505540.0703332.934
Table 7. ANOVA table for dimensional deviation.
SourceDFAdj SSAdj MSF-Valuep-Value
Model50.0012460.000249177.560.001
Linear30.0008020.000267190.400.001
A10.0003690.000369263.080.001
B10.0000180.00001812.490.039
C10.0005430.000543386.400.000
2-way interaction20.0007970.000399283.840.000
A*B10.0001330.00013394.890.002
B*C10.0007970.000797567.620.000
Error30.0000040.000001
Total80.001251
Table 8. ANOVA table for surface roughness.
SourceDFAdj SSAdj MSF-Valuep-Value
Model435.6048.900933.930.002
Linear334.58211.527443.940.002
A130.06130.0608114.580.000
B11.4121.41235.380.081
C13.1093.109011.850.026
Square11.0211.02153.890.120
A*A11.0211.02153.890.120
Error41.0490.2623
Total836.653
Table 9. Model summary for dimensional deviation.
SR-sqR-sq (Adj)R-sq (pred)
0.001184999.66%99.10%97.79%
Table 10. Model summary for surface roughness.
SR-sqR-sq (Adj)R-sq (pred)
0.51220197.14%94.27%84.54%
Table 11. Goals and constraints for inputs and responses.
Parameter/ResponseGoalLower LimitUpper LimitWeightImportance
AIn range1.22.511
BIn range155511
CIn range1711
DivMinimize0.0516950.0891670.51
RaMinimize2.7478.9010.51
Table 12. Validation of optimized results.
Optimized Inputs
A = 2.5B = 16.1988C = 7.0
OutputsPredictedPrinted Error percentage %
Div (mm)0.05170.05608.32%
Ra (µm)2.80792.7701.35%
Disclaimer/Publisher’s Note: The statements, opinions and data contained in all publications are solely those of the individual author(s) and contributor(s) and not of MDPI and/or the editor(s). MDPI and/or the editor(s) disclaim responsibility for any injury to people or property resulting from any ideas, methods, instructions or products referred to in the content.

