Article

Simplified Method for Nonlinear Seismic Response Analysis of Corroded Pile-Supported Wharf

1
Department of Civil Infrastructure Engineering, Faculty of Vocational, Institut Teknologi Sepuluh Nopember, Surabaya 60111, Indonesia
2
Research Center for Urban Safety and Security, Kobe University, Kobe City 657-8501, Japan
*
Author to whom correspondence should be addressed.
Appl. Sci. 2023, 13(19), 10936; https://doi.org/10.3390/app131910936
Submission received: 21 August 2023 / Revised: 21 September 2023 / Accepted: 28 September 2023 / Published: 3 October 2023

Abstract

:
Fiber-based finite element analysis (FB-FEA) has been widely recognized for its ability to reproduce experimental results and is also a reliable method for evaluating the nonlinear seismic response of pile-supported wharves (PSWs). Design practice often employs frame analysis (FA) due to its easy implementation. To precisely reproduce the nonlinear seismic response of PSW using FA, it is necessary to configure mechanical properties such as the hinge property correctly. However, it is unclear whether the hinge properties proposed in previous studies can be applied to PSWs with spun piles. In this study, a novel FA method was developed to investigate the nonlinear seismic response of PSWs with corroded spun piles considering PC bar area reduction, deteriorated material properties, the bending stiffness reduction factor, and the moment–curvature relationship of the spun pile. The nonlinear seismic response of corroded PSWs was determined by performing pushover analysis using three methods: FA using the method of the previous study (FA-1), the proposed FA method (FA-2), and FB-FEA. As regards PSW foundations, vertical pile and batter pile configurations were considered. The pushover analysis results were compared in terms of several parameters, such as the natural period, plastic hinge formation, and load capacity of the corroded PSWs. The FA-2 results agreed very well with the FB-FEA results, while the FA-1 results were less precise with respect to the natural periods and load capacities of corroded PSWs. The results indicated that the bending stiffness reduction factor, moment–curvature relationship, and axial load–bending moment (P–M) capacity of the corroded spun piles should be appropriately defined. Corrosion had greater negative impacts on the compressive axial load and bending moment capacities of the spun pile than on its tensile axial load capacity.

1. Introduction

Pile-supported wharves (PSWs), commonly used as port structures, provide platforms for loading and unloading goods and passengers from ships. Variations of the pile configuration of PSWs include batter pile and vertical pile foundation systems. A commonly used PSW pile type in Indonesia is a prestressed concrete pile with closed-ended circular hollow sections, known as a spun pile [1]. Spun piles in marine environments are frequently damaged by corrosion during their service life [2,3]. As corrosion propagates, damage due to the expansion of corrosion products (rust) is characterized by cracking, spalling, and delamination of the concrete cover [4]. Corrosion can have a significant impact on the seismic performance of PSWs. A numerical study by Yin et al. [5] found that corrosion could cause a reduction in the stiffness and strength of the piles, leading to increased displacement and a decreased reliability index of the wharf foundation under horizontal load. Therefore, the nonlinear seismic analysis of corroded PSWs is essential to ensure their structural integrity and safety during earthquake events.
Design codes for port facilities [6,7] provide guidance on earthquake-resistant PSW design based on elastic analysis to ensure that PSWs are in repairable condition after low- and medium-intensity earthquakes. During large earthquakes, PSWs may undergo inelastic behavior, and design codes for port facilities introduce strain-based displacement limits to ensure that PSWs remain structurally safe to ensure the safety of human lives. Nonlinear simulation must be employed in the seismic analysis of the response of PSWs to massive earthquakes. Pushover analysis is a reliable and effective approach for observing the inelastic behavior, seismic load capacity, and plastic hinge formation of PSWs [8]. In addition, PSW serviceability (i.e., displacement and crack width limitations) plays a vital role in these designs [9].
Fiber-based finite element analysis (FB-FEA) is a numerical technique frequently used to develop nonlinear PSW models due to the accuracy of the results [10,11,12,13]. This technique has been extensively validated for its ability to accurately reproduce experimental results [14,15,16]. FB-FEA involves dividing the structural members into two-end frame elements and connecting each boundary to a discrete cross-section through fiber grids. The nonlinear response of the material can be considered in FB-FEA by integrating stress–strain modeling into the fiber grid to generate stress-resultant forces and rigidity terms. These are then used to calculate the forces and rigidities along the length of structural members using finite element interpolation functions that satisfy equilibrium and compatibility conditions [17]. However, only a few studies [18,19] have employed FB-FEA for the nonlinear seismic analysis of corroded PSWs, as numerical corrosion simulations are time-consuming and require high-performance software. Schmuhl et al. [18] investigated the effect of chloride corrosion on the lateral force capacity and ductility of PSWs using FB-FEA in the OpenSees platform [20]. The results indicated that the failure frequency of concrete piles aged between 25 and 75 years increased significantly due to stress corrosion cracking and brittle fracture. Mirzaeefard et al. [19] assessed the seismic fragility of PSWs by considering the corrosion of concrete piles. Their results showed that corrosion considerably reduces seismic performance due to diminished structural strength and ductility over the life cycle of the PSW. Considering time-dependent deterioration caused by corrosion, fragility curves can illustrate the increasing potential for damage at various seismic intensities. The nonlinear Winkler spring model approximates the soil reaction as a series of nonlinear springs and is commonly used in nonlinear structural analysis to model the pile–soil interaction [21]. Numerous studies have discussed the pile–soil interaction modeling method and its application for the dynamic analysis of structures [22,23,24,25,26].
Frame analysis (FA) is a simplified approach to the seismic analysis of PSWs [27] and corroded reinforced concrete (RC) structures [28,29] that offers a reasonable compromise between accuracy and computational time. Nonlinear behavior can be modeled in FA by applying hinge properties (e.g., force–deformation or moment–rotation relationships) to one or more points along the frame element [30]. Nonlinear procedures for FA have been introduced in the design codes for buildings [31,32] by providing recommended force–deformation or moment–rotation relationships for RC members. However, the moment–rotation relationship specified in building design codes is unsuitable for the nonlinear seismic response analysis of corroded PSWs due to differences in inelastic behavior and cross-sectional configuration, which have also not been considered for corrosion-induced material property degradation. Therefore, the moment–rotation relationship of corroded spun piles should be developed first in the nonlinear seismic response analysis of corroded PSWs using FA.
Corrosion is known to degrade the material properties of RC members, including spun piles. Therefore, the nonlinear seismic response analysis of PSWs with corroded spun piles should consider the deterioration of material properties due to corrosion. Refani and Nagao [33] demonstrated the prediction of the material properties of corroded spun pile materials, including the cover and core concrete compressive strength, prestressed concrete steel bar (PC bar) yield strength, and concrete–PC bar bond strength. These predictions are expected to provide more accurate nonlinear seismic response analysis results for corroded PSWs than analyses based on material deterioration predictions from non-spun pile studies [34,35].
Since little research has been conducted on the nonlinear seismic response analysis of PSWs with corroded spun piles, this study aims to develop a novel FA method to investigate the nonlinear seismic response of PSWs with corroded spun piles. According to Indonesian government regulations [36], buildings and infrastructure (including port facilities) must remain operational for at least 50 years. Therefore, in this study, the nonlinear seismic response of corroded PSWs was observed for 75 years. The nonlinear seismic response of corroded PSWs was determined by performing pushover analysis using three methods: FA using the method of the previous study (FA-1), the proposed FA method (FA-2), and FB-FEA. This study also considered vertical pile and batter pile configurations as variations of PSW foundations. The pushover analysis results for the corroded PSWs using FA-1, FA-2, and FB-FEA were compared in terms of several parameters, such as natural period, plastic hinge formation, and load capacity of the corroded PSW. The material responses of the spun pile in terms of stress–strain curves for corroded PC bars, cover concrete, and core concrete, along with the reduction of the corroded PC bar area, were considered in FB-FEA. Furthermore, FA-1 and FA-2 considered several characteristics (i.e., PC bar area reduction, deteriorated concrete compressive strength, PC bar yield strength reduction, spun pile bending stiffness reduction factor, and spun pile moment–curvature relationship).

2. Methods

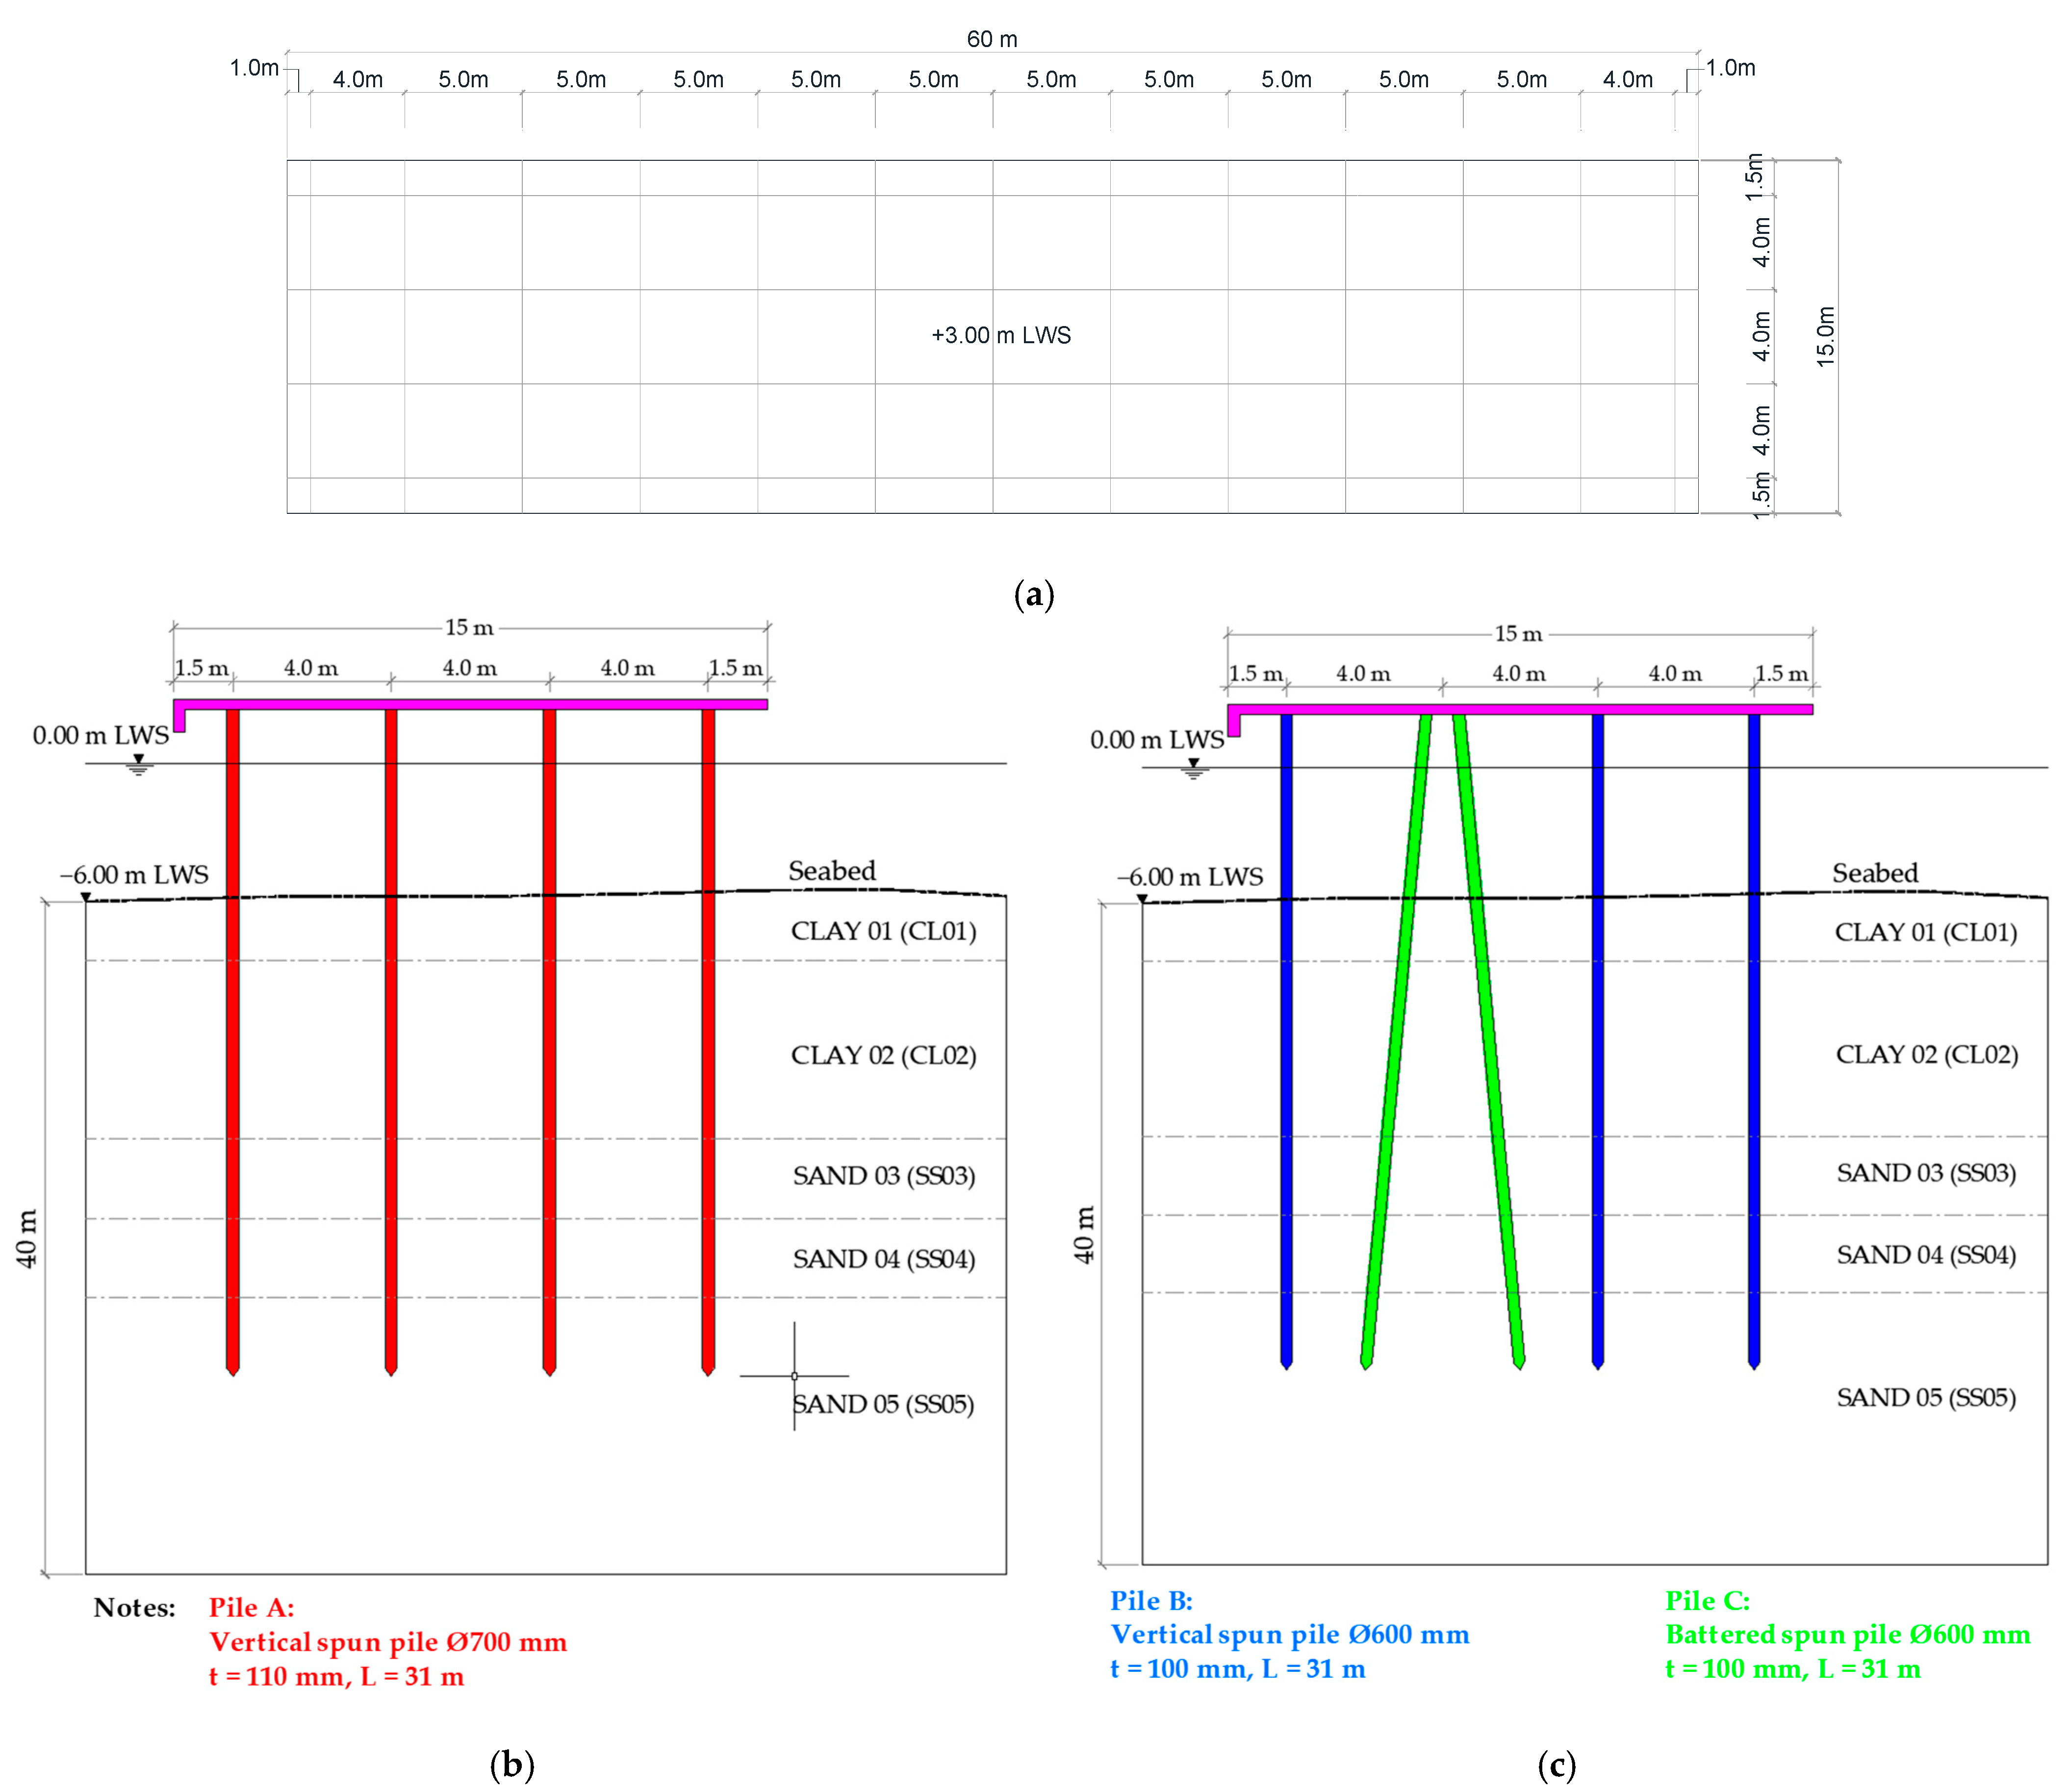
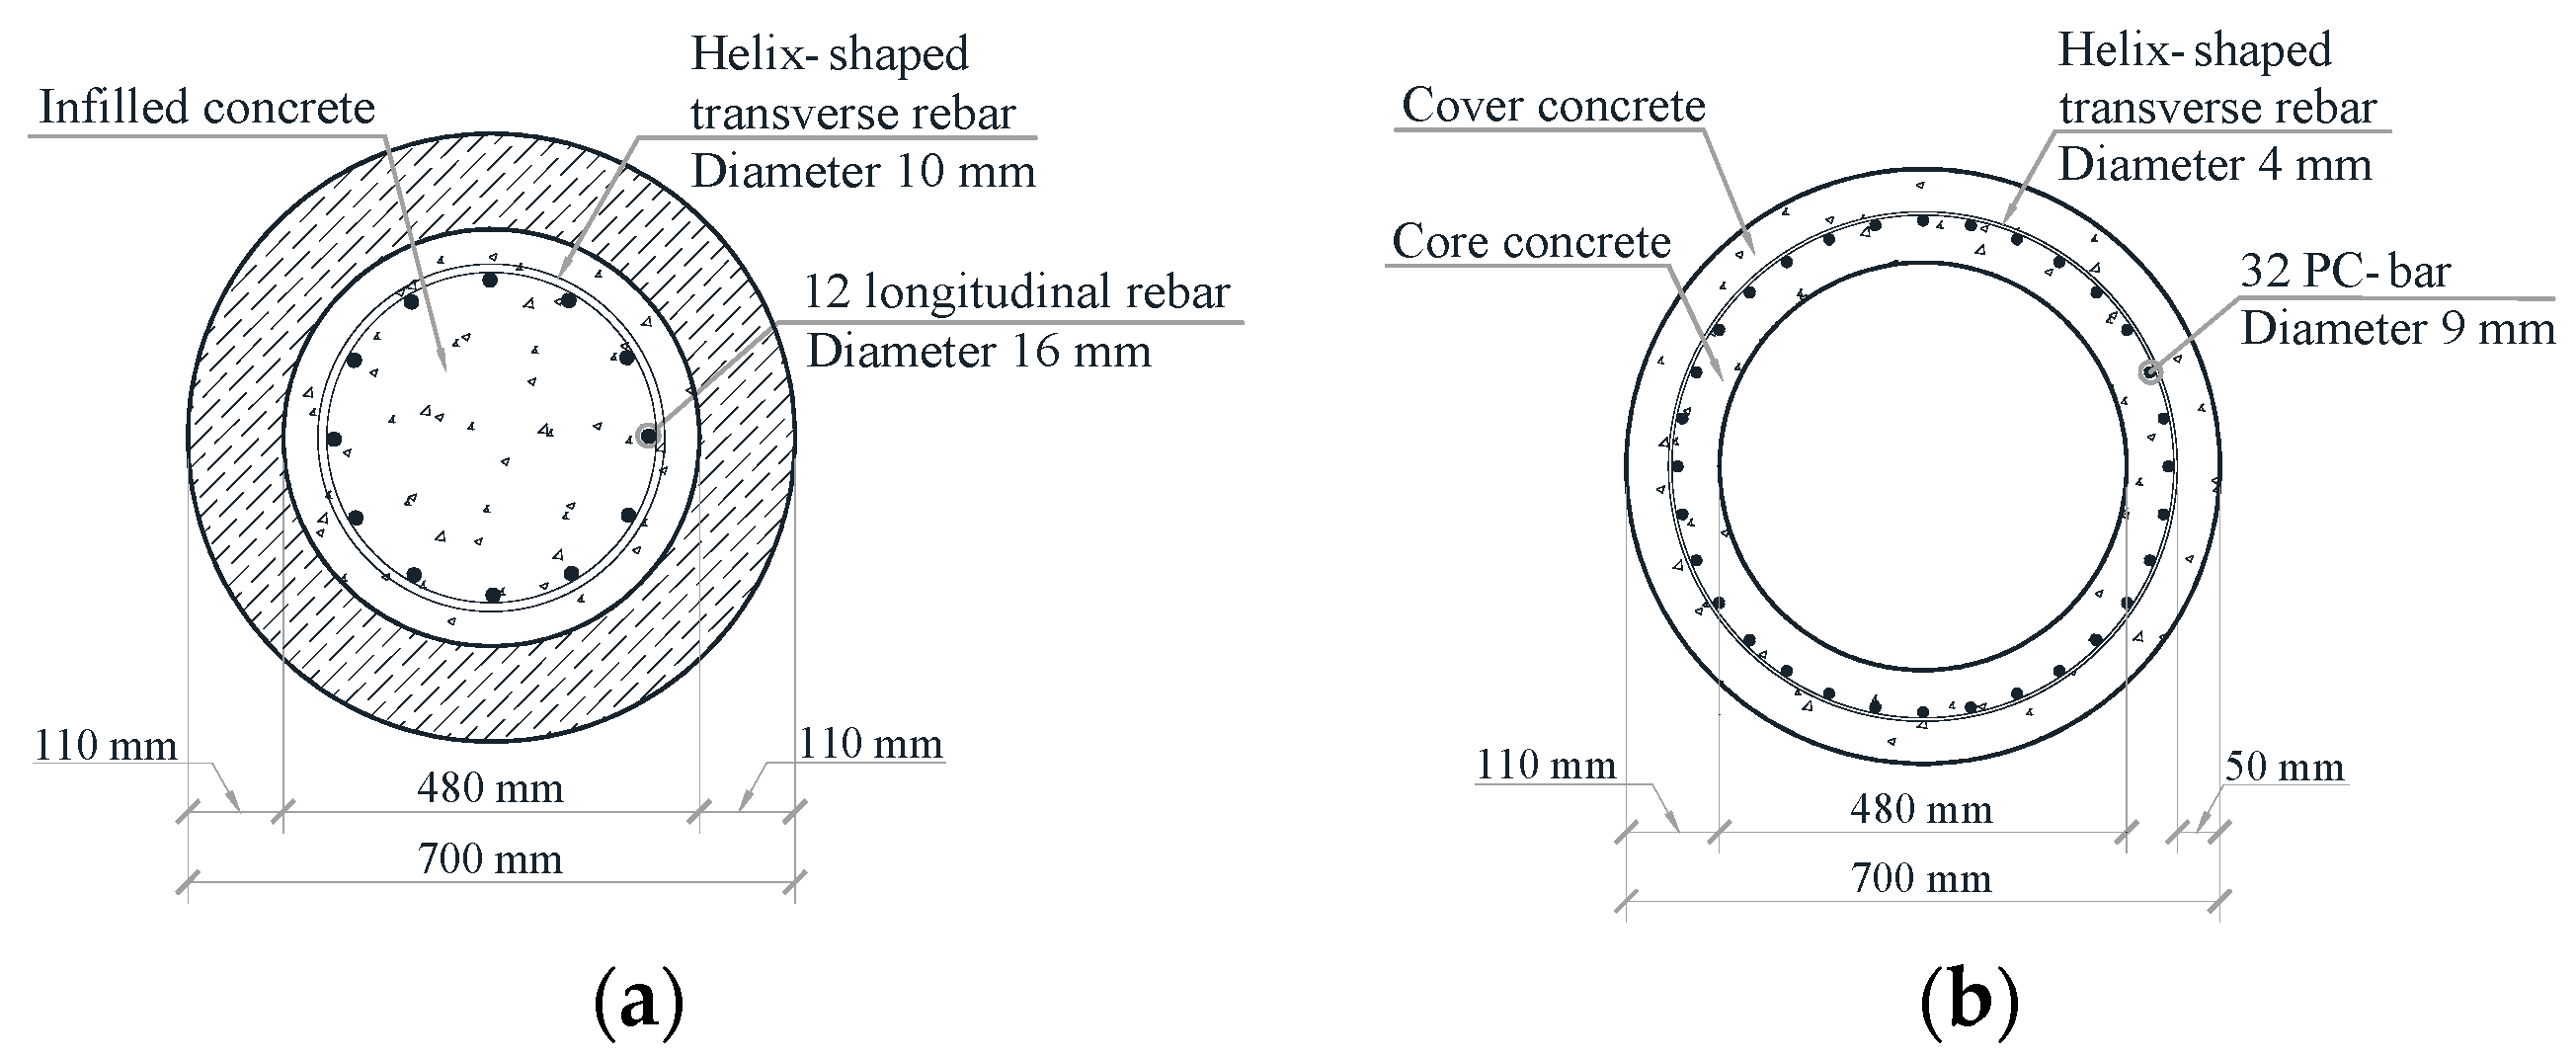
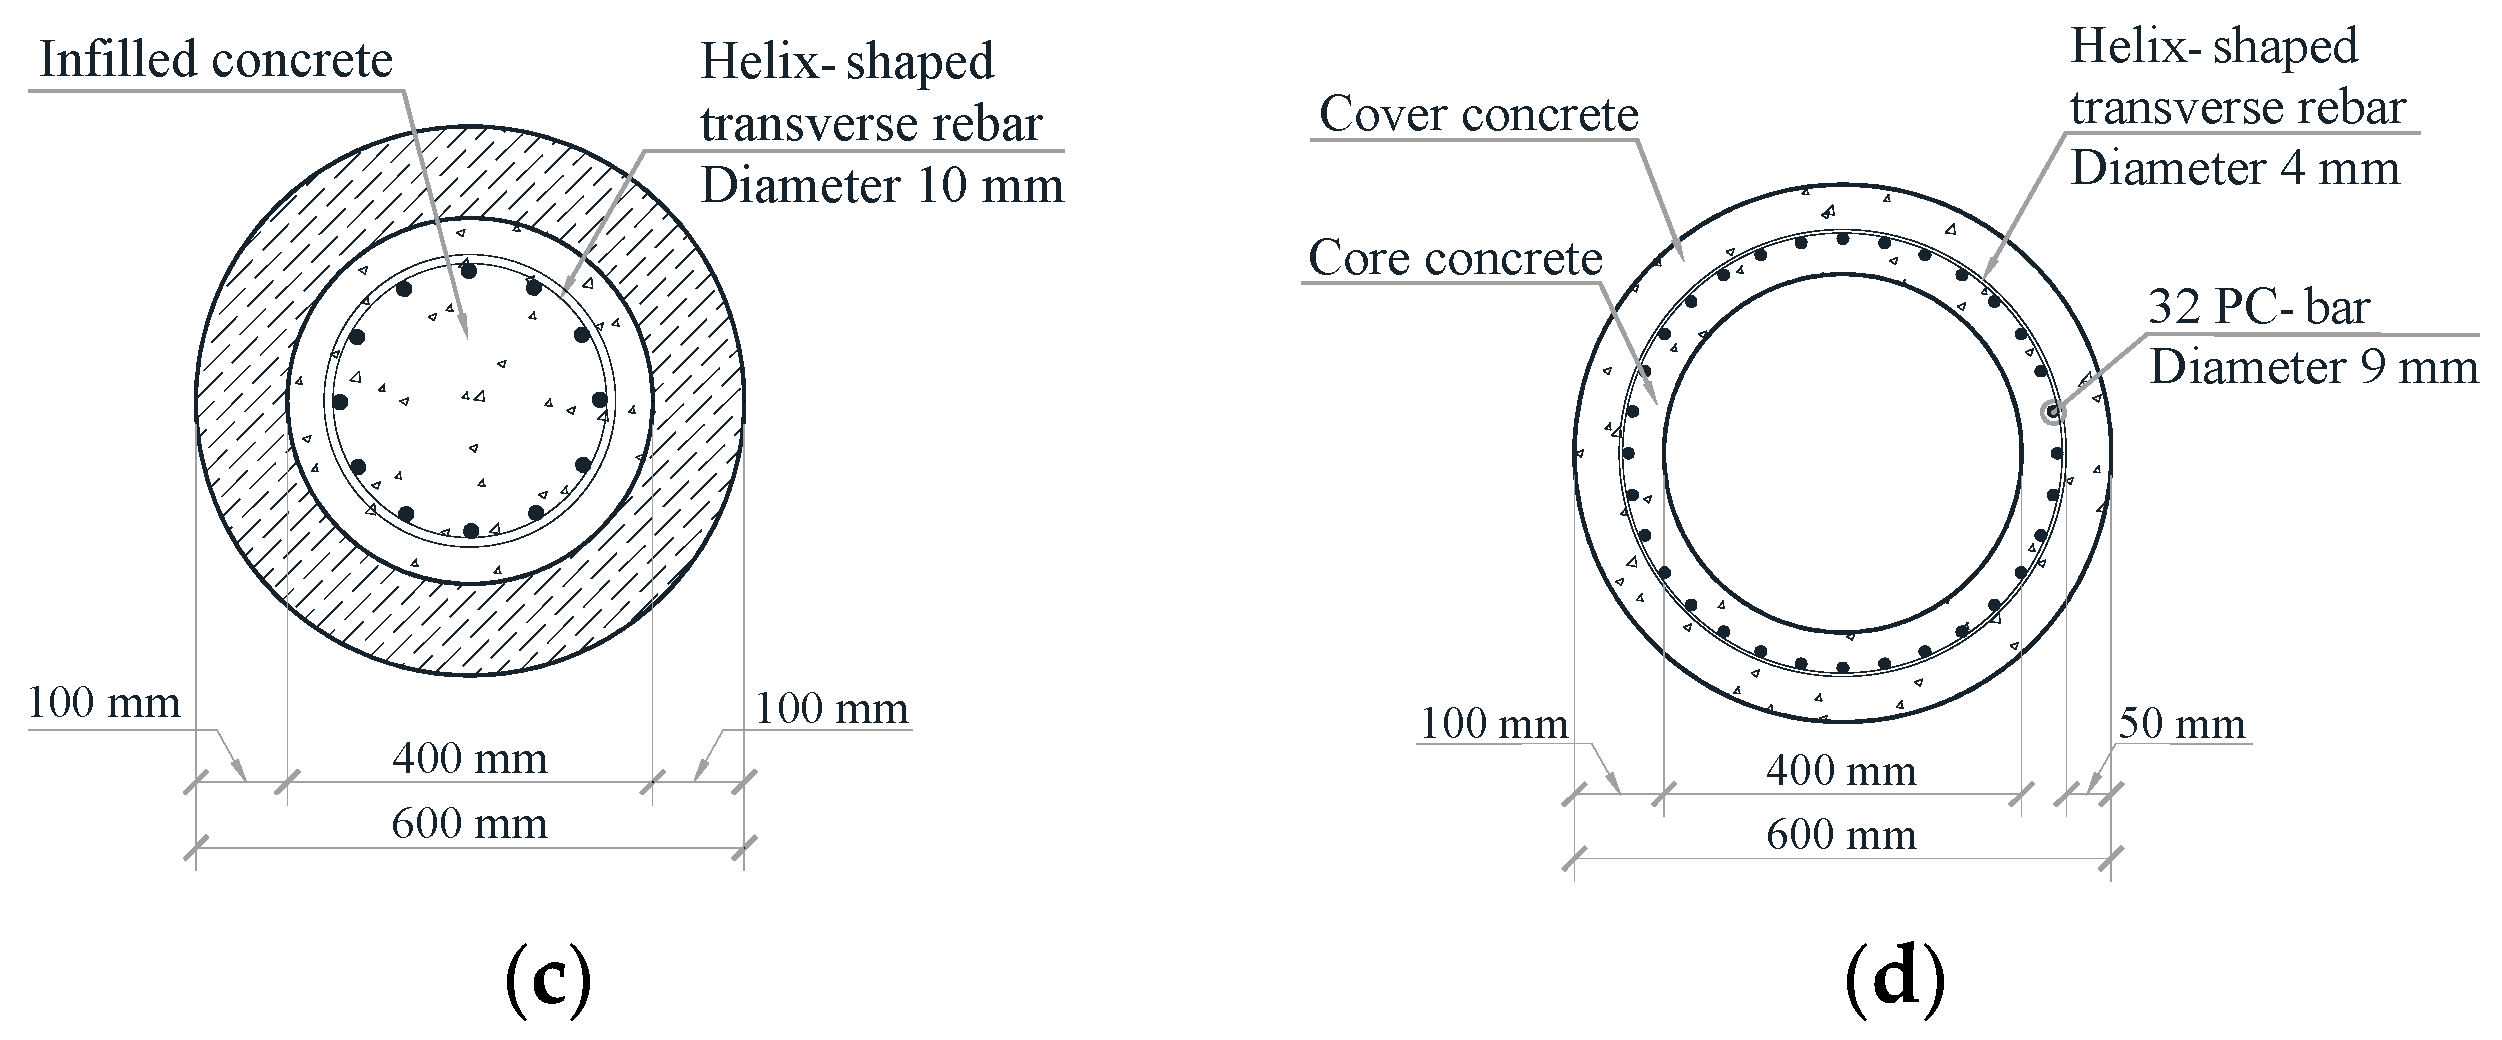
2.1. Model Geometry and Material Properties

The target PSW is a typical small jetty in Indonesia, consisting of the deck and spun pile foundation. The pile configuration of the PSW varies, using both batter pile and vertical pile foundation systems. The target PSW and ground configurations are depicted in Figure 1. The crown height of the wharf is +3.00 m at low water spring (LWS). For the PSW with vertical piles, the deck is supported by four rows of vertical spun piles (Pile A) with a diameter (Ø) of 700 mm. For the PSW with batter piles, the deck is supported by three rows of vertical spun piles (Pile B) and two rows of battered spun piles (Pile C) with a diameter (Ø) of 600 mm. The angle of the batter pile is 5 degrees. Figure 2 shows the cross-sections of Piles A, B, and C. The top 2 m of each pile is filled with concrete. The initial material properties of the spun pile and deck members of the PSW used in the FB-FEA and FA are shown in Table 1. The initial material properties data utilized in this study correspond with the material specifications typically employed in the construction of port facilities in Indonesia. The initial material property is defined as the state of the material upon the recent completion of PSW construction.
Table 2 displays the soil properties obtained from a soil investigation. The ground consists of two clay layers and three sand layers, with CL01 being a soft clay layer at the seabed and SS05 being a dense sand layer at the base of the spun pile. The shear wave velocity (Vs) of each soil layer was computed utilizing the correlation equation proposed by Imai and Tonouchi [37], and the N-value was determined from the standard penetration test (N-SPT). The average shear wave velocity in the top 30 m (Vs30) at the site was 205.48 m/s, placing it in site class SD (medium soil), according to the Indonesian seismic code [38].

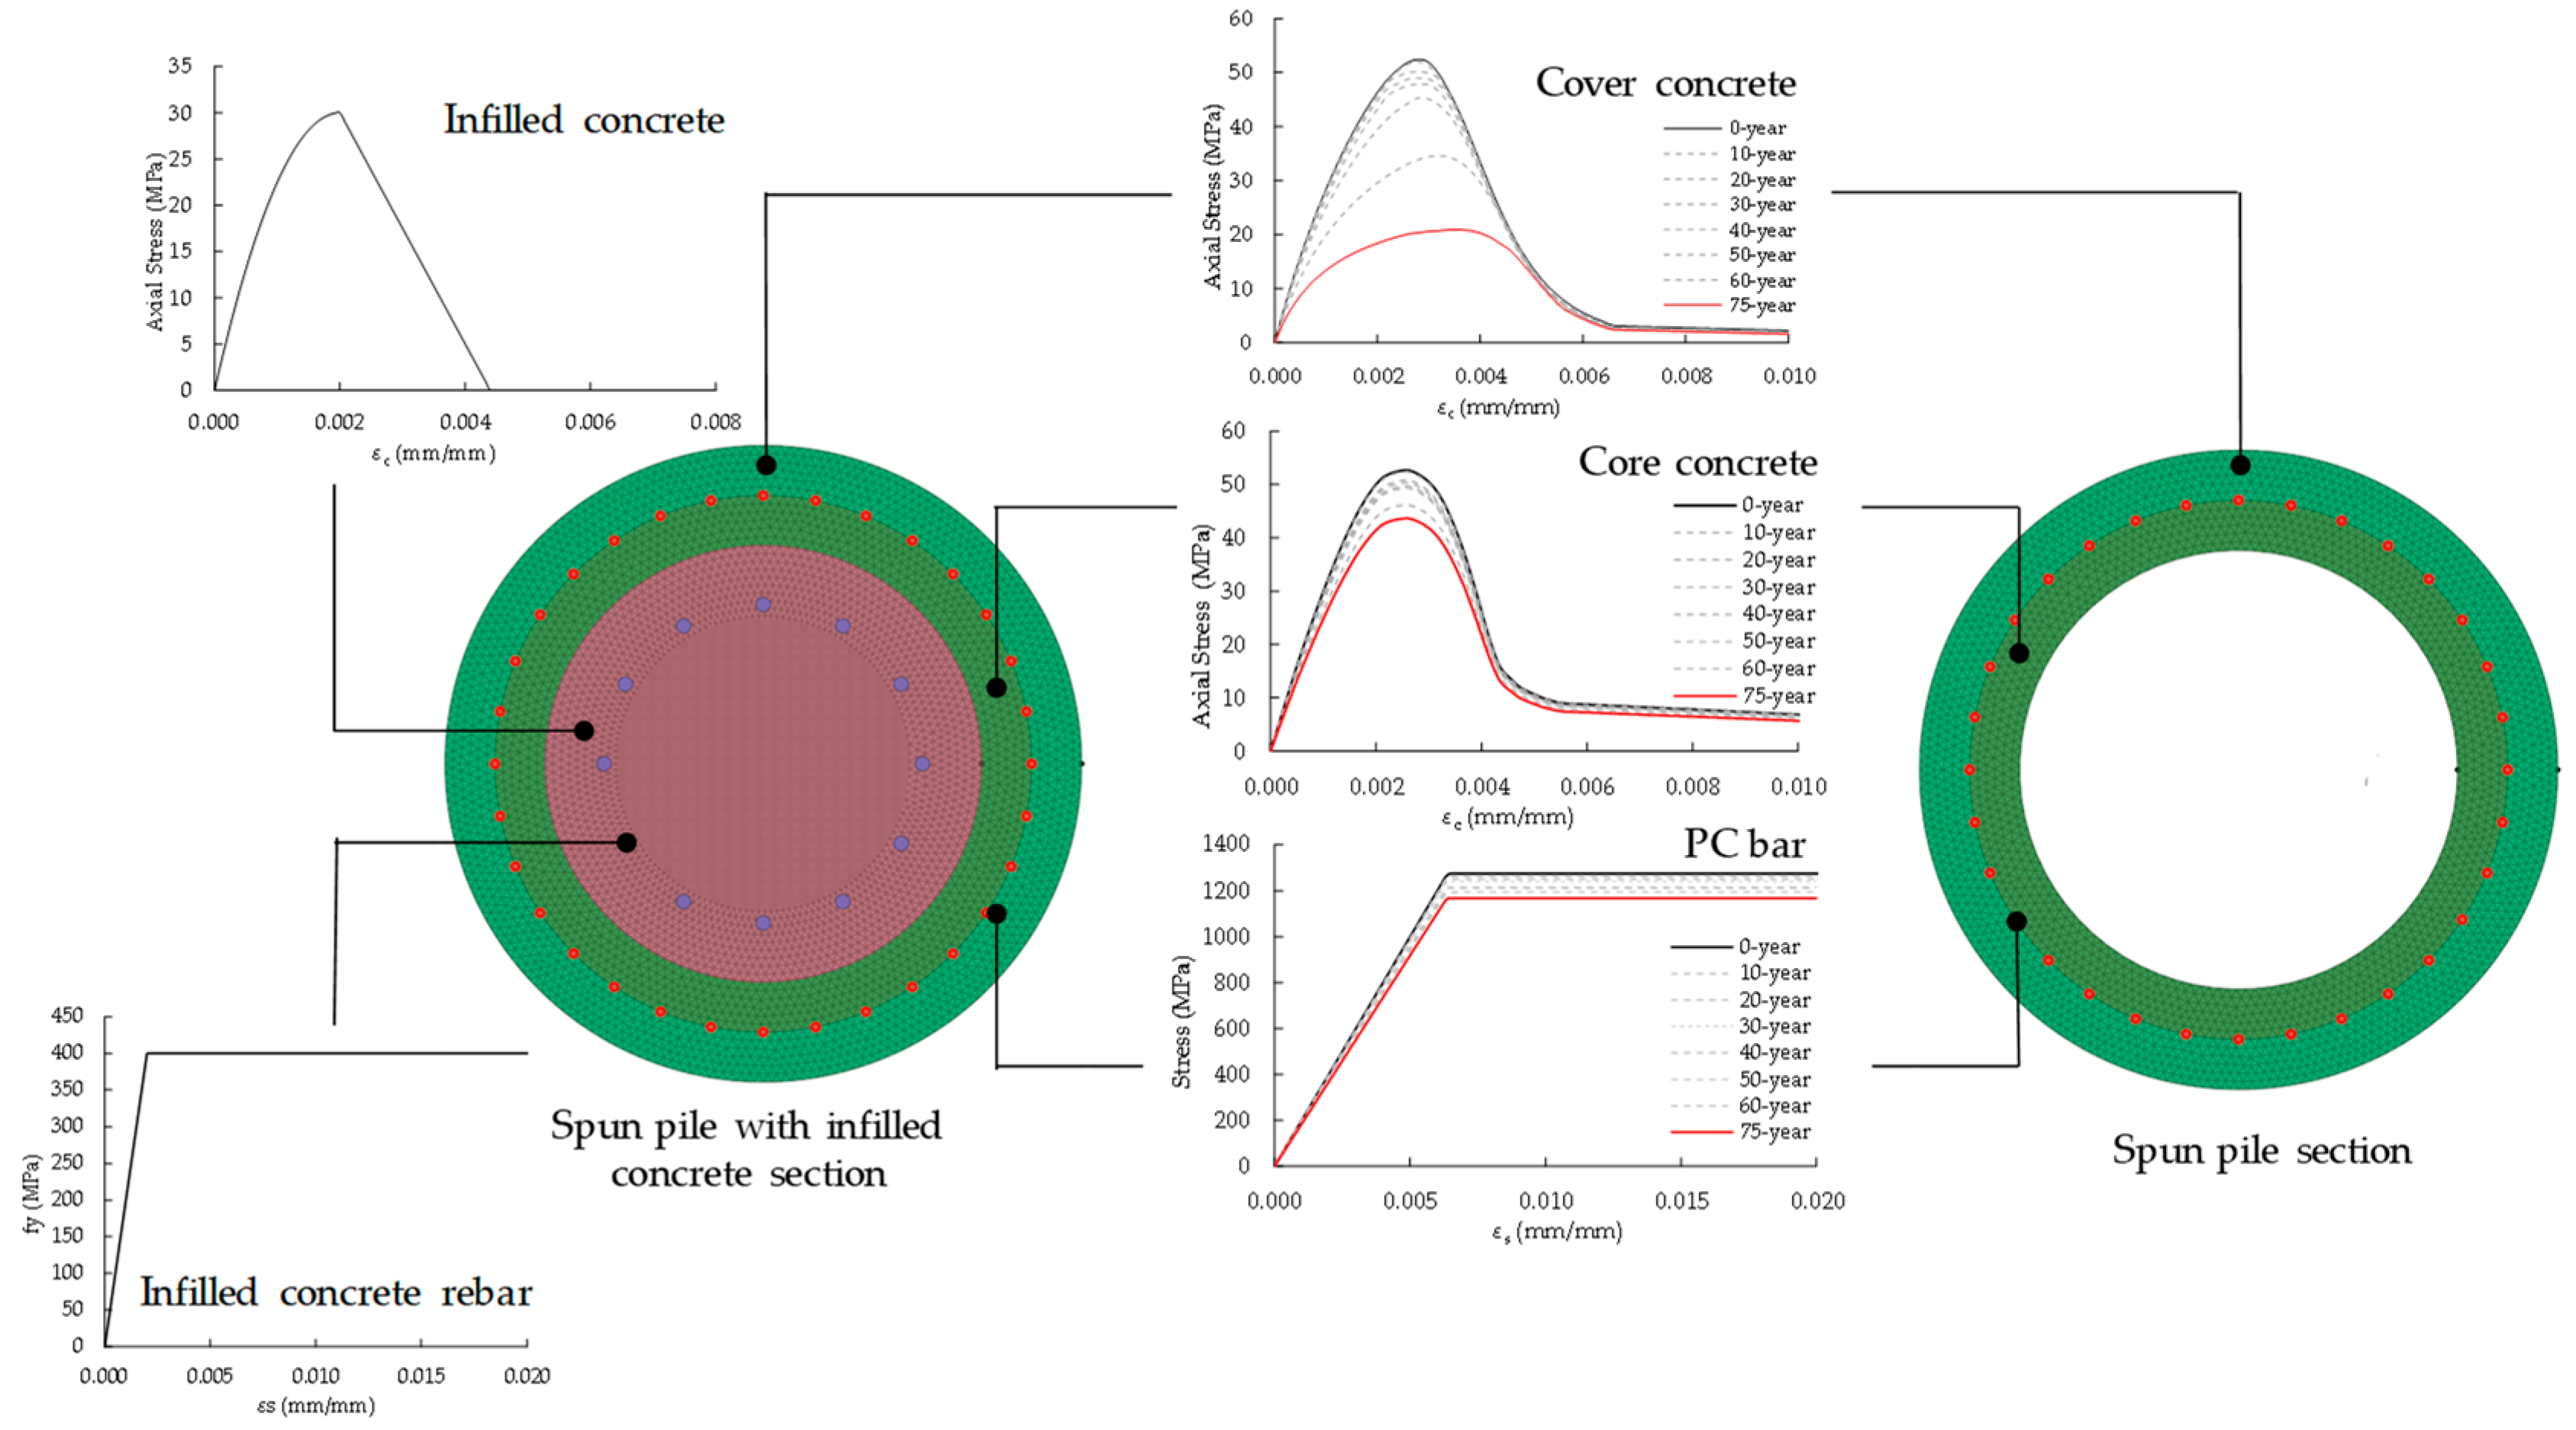
2.2. Corrosion Effect on the Spun Pile Materials

The corrosion mechanisms affecting the material properties of spun piles commence with the formation of rust on the PC bar due to chloride ingress from sea salt spray and repeated wetting and drying cycles. The rust expands over time, decreasing the area of the PC bar, which puts pressure on the concrete and initiates cracks. The formation of rust and cracks reduces the compressive strength of the concrete [35], the yield strength of the PC bar [39,40], and the bond strength between the PC bar and the concrete [41,42]. Therefore, the corrosion effect in a marine environment was simplified in this study by altering the PC bar geometry and decreasing the material properties of the spun pile (i.e., the compressive strength of the cover concrete, core concrete, and yield strength of the PC bar reduction). Furthermore, to consider the confinement effects on corroded concrete, this study employed the reduced compressive strength of confined concrete (core concrete) as well as the reduced compressive strength of unconfined concrete (cover concrete) [33].
Figure 3 illustrates the non-uniform decrease in the cross-sectional area of the PC bar considered in this study to represent the changes in the PC bar geometry. Equations (1)–(6) were utilized to determine the PC bar’s corroded area and the corrosion degree [43].
A sl , corr = 2 r 2 θ sin θ cos θ
θ = arccos 1 d i 2 r ;   2 / 3 π     d i     4 / 3 π
d i = 0.0116   i corr ( t )   R t
where A sl , corr is the cross-sectional area loss of the corroded PC bar (mm2), r is the PC bar radius (mm), θ is the angle of the rust distribution (degrees), d i is the maximum rust thickness in the radial direction (mm) [44], R is a pitting factor variable ranging from 4 to 8 (=5.65 in this study based on [44]), and t is the corresponding year. The time-dependent corrosion rate was determined as follows [45]:
i corr t = 0.85   i corr 1 t 0.29
i corr 1 = 3.78   ( 1   w c ) 1.64 x
where i corr ( t ) is the time-dependent corrosion rate (µA/cm2), i corr 1 is the corrosion rate at the beginning of the corrosion propagation (µA/cm2), x is the spun pile cover concrete thickness (cm), and w c is the water–cement ratio of the concrete, which was set to 0.28 based on the material specifications of the spun piles [46] from the pile manufacturer in Indonesia.
This study considers the PC bar area loss to be evenly distributed along the PC bar. Hence, the corrosion degree (ψ) was empirically calculated as the relative reduction in cross-sectional area [47]. The corrosion degree was expressed as:
ψ = A sl , corr A 0
where ψ is the corrosion degree, A 0 is the initial cross-section area of the PC bar (mm2), and A sl , corr is the cross-section area loss of the corroded PC bar (mm2).
Equations (7)–(9) describe the effects of corrosion on the mechanical properties of spun pile materials. The compressive strength of corroded cover concrete and corroded core concrete and the yield strength of the corroded PC bar were determined as follows [33]:
f c , corr = 0.25 tan 1   0.149 ψ 0.025   + 0.65 f c , 0
f cc , corr = 0.14 tan 1 0.17 ψ 0.1   + 0.848 f cc , 0
f y , corr = 1 0.4448 ψ f y , 0
where f c , corr is the corroded cover concrete compressive strength (MPa), f cc , corr is the corroded core concrete compressive strength (MPa), f c , 0 is the initial cover concrete compressive strength (MPa), f cc , 0 is the initial core concrete compressive strength (MPa), f y , corr is the yield strength of a corroded PC bar (MPa), f y , 0 is the initial PC bar yield strength (MPa), and ψ is the corrosion degree.

2.3. Fiber-Based Finite Element Analysis

In this study, a 2D FB-FEA model was developed to account for the reduction in cross-sectional area of the PC bar and the nonlinear response of each spun pile material (i.e., PC bar, cover concrete, and core concrete). In the FB-FEA model, the deck and pile elements were meshed into a 1 m length. Each meshed element has a cross-section with five integration points along its length. The FB-FEA utilized nonlinear fiber displacement-based beam–column (DBC) elements [48] on the STKO-OpenSees platform [49]. The material models proposed by Refani and Nagao [33] were utilized in the FB-FEA model to describe the nonlinearity of the spun pile materials. The material models were assigned to each cross-section of the spun pile (Figure 4). Gauss–Lobatto integration was considered to obtain the combined response of each material at the intersection point of the spun pile’s cross-section. The initial material properties considered in the FB-FEA are listed in Table 1.
The 2D FB-FEA models employ p–y curves to describe the correlation between the soil reaction (p) and the horizontal displacement (y) surrounding the spun piles for every layer of soil at varying depths. The p–y parameters adopted for clay in this research are based on Matlock [50], while those for sand are based on Murchison and O’Neill [51]. Using the L-PILE computer program [52], the p–y curve was determined. Figure 5 illustrates the p–y curves for piles A, B, and C.
Furthermore, this study utilized the PSW model with the vertical pile (PSW-A) and the PSW model with the batter pile configuration (PSW-B). Each 2D FB-FEA model was simulated against the effects of corrosion for up to 75 years. Figure 6 shows the schematic numerical models of the studied PSW, while Figure 6 shows the fiber discretization of the spun pile section implemented in the 2D FB-FEA models.

2.4. Frame Analysis

In this study, FA-1 and FA-2 were used to observe the nonlinear response of PSWs. Each 2D FA model was simulated against the effects of corrosion for up to 75 years. The 2D PSW model, which was developed using SAP2000 software [53], considered hinge property settings to characterize the inelastic behavior of the PSW [30]. The 2D FA models used the elastic–plastic p–y curve of the soil spring as applied in the FB-FEA model (Figure 4). The inelastic behavior of the PSW can be modeled in SAP2000 using either default (auto-generated) or user-defined hinges [53]. In FA-1, the auto-generated hinge properties of spun piles based on ASCE 41-13 [32] were considered, while the user-defined hinge properties of spun piles were implemented in FA-2.
Figure 7a shows the moment–curvature curve adopted in the 2D FA-1 model. Five points (I, II, III, IV, and V) define the hinge behavior of the reinforced concrete column or pile members. No plastic deformation occurs up to point II, where the hinge yields. The rotation at point II was determined using Equation (10) [53]. Point II is followed by a yield plateau or strain hardening behavior until point III, representing the hinge’s ultimate capacity. The ultimate capacity of the hinge was set at 1.1 times the hinge yield capacity, based on FEMA 356 [31]. After point III, the curve drops to point IV, corresponding to the hinge’s residual strength. The magnitude of the residual strength and the rotations at points III and IV follow ASCE 41-13. Point V represents the ultimate rotation capacity of the hinge, and the magnitude of the final rotation also follows ASCE 41-13 [32].
ϕ II = M y 6   E p I p L  
where ϕ II is the rotation at point II (rad), M y is the yield bending moment of the spun pile (N·mm), I p is the moment of inertia of the spun pile (mm4), E p is the modulus of elasticity of the spun pile (MPa), and L is the spun pile length (mm).
In the proposed FA method (FA-2), the hinge property applied to the model was defined based on the moment–curvature analysis of the spun pile section. A trilinear approximation is commonly used to develop the moment–curvature curve for a reinforced concrete section. However, trilinear idealization does not adequately represent the moment–curvature relationships for pile and column sections [54] because the plastic moment occurs at a very low curvature compared to the ultimate curvature. Thus, this study used a multilinear idealization for the spun pile sections through points I, II, III, IV, and V (Figure 7b). Specifically, point I represents the origin, point II is the point of first yield, point III is the maximum moment point (plastic moment), point IV is an intermediate point on the horizontal branch of the multilinear idealization, and point V is the residual point. The moment–curvature curves were developed to be symmetric so that the absolute value of each point’s coordinate in the negative direction is the same as its coordinate in the positive direction. The moment–curvature curve for a spun pile under pure bending conditions can be determined using Equations (11)–(19) based on ACI 318 [55] and the PCI Design Handbook [56].
M cr = f r + F pe A g I p 0.5 D
φ cr = f r + F pe A g /   E p 0.5 D
M y = Σ   A s   f pc y i 0.5 D 2 +   Σ   1 2 f co A c , comp y c
φ y = f co E co c
M p = Σ   A s   f y - pc y i 0.5 D 2 +   Σ   0.85 f co A c , comp 0.5 D 2 y c
φ p = ε co c
Residual bending moment and curvature were adopted from [57], and are:
M res = 0.85   M p
φ res = φ p + φ p φ y
Ultimate curvature was adopted from [32], and is:
φ ult = φ y + 0.06
where M cr is the cracking moment of the spun pile section (N·mm), f r is the cover concrete tensile strength (MPa), F pe is the prestress force (N), A g is the cross-sectional area of the spun pile (mm2), D is the diameter of the spun pile (mm), I p is the moment of inertia of the spun pile (mm4), E p is the modulus of elasticity of the spun pile (MPa), φ cr is the cracking curvature of the spun pile (1/mm), M y is the yield bending moment of the spun pile (N·mm), A s   is the PC bar cross-sectional area (mm2), f pc is the PC bar tensile stress (MPa), y i is the distance from the PC bar axis point to the neutral axis of the spun pile cross-section (mm), f co is the cover concrete compressive strength (MPa), A c , comp is the compressed cross-sectional area of the spun pile (mm2), y c is the distance from the compressed area axis point to the neutral axis of the spun pile cross-section (mm), φ y is the yielding curvature of the spun pile (1/mm), E co is the secant modulus of elasticity of the cover concrete (MPa), c is the neutral axis of the spun pile cross-section (mm), M p is the plastic bending moment of the spun pile (N·mm), f y - pc is the PC bar yield strength (MPa); φ p is the plastic curvature of the spun pile (1/mm), ε co is the strain at the cover concrete’s peak strength, M res is the residual bending moment of the spun pile (N·mm), φ res is the residual curvature of the spun pile (1/mm), and φ ult is the ultimate curvature of the spun pile (1/mm).
To implement the proposed moment–curvature curve in the FA-2 model, points I, II, III, IV, and V must be converted into points in the moment–rotation (M–ϕ) relationship. Thus, the curvature must be considered to act on the selected plastic hinge length (lp), where plasticity is expected to occur in the element. In this case, the length of the plastic hinge was assumed to be equal to the depth or diameter of the member section [58]. Hinges were assigned at 0.1 and 0.9 of the relative distance of each spun pile element.
Table 3 and Table 4 summarize the moment–rotation relationship points for piles A, B, and C, considered in FA-1 and FA-2, respectively. Figure 8 shows the comparison of the proposed moment–curvature curve adopted in FA-2 with the curves considered in FA-1 and FB-FEA.

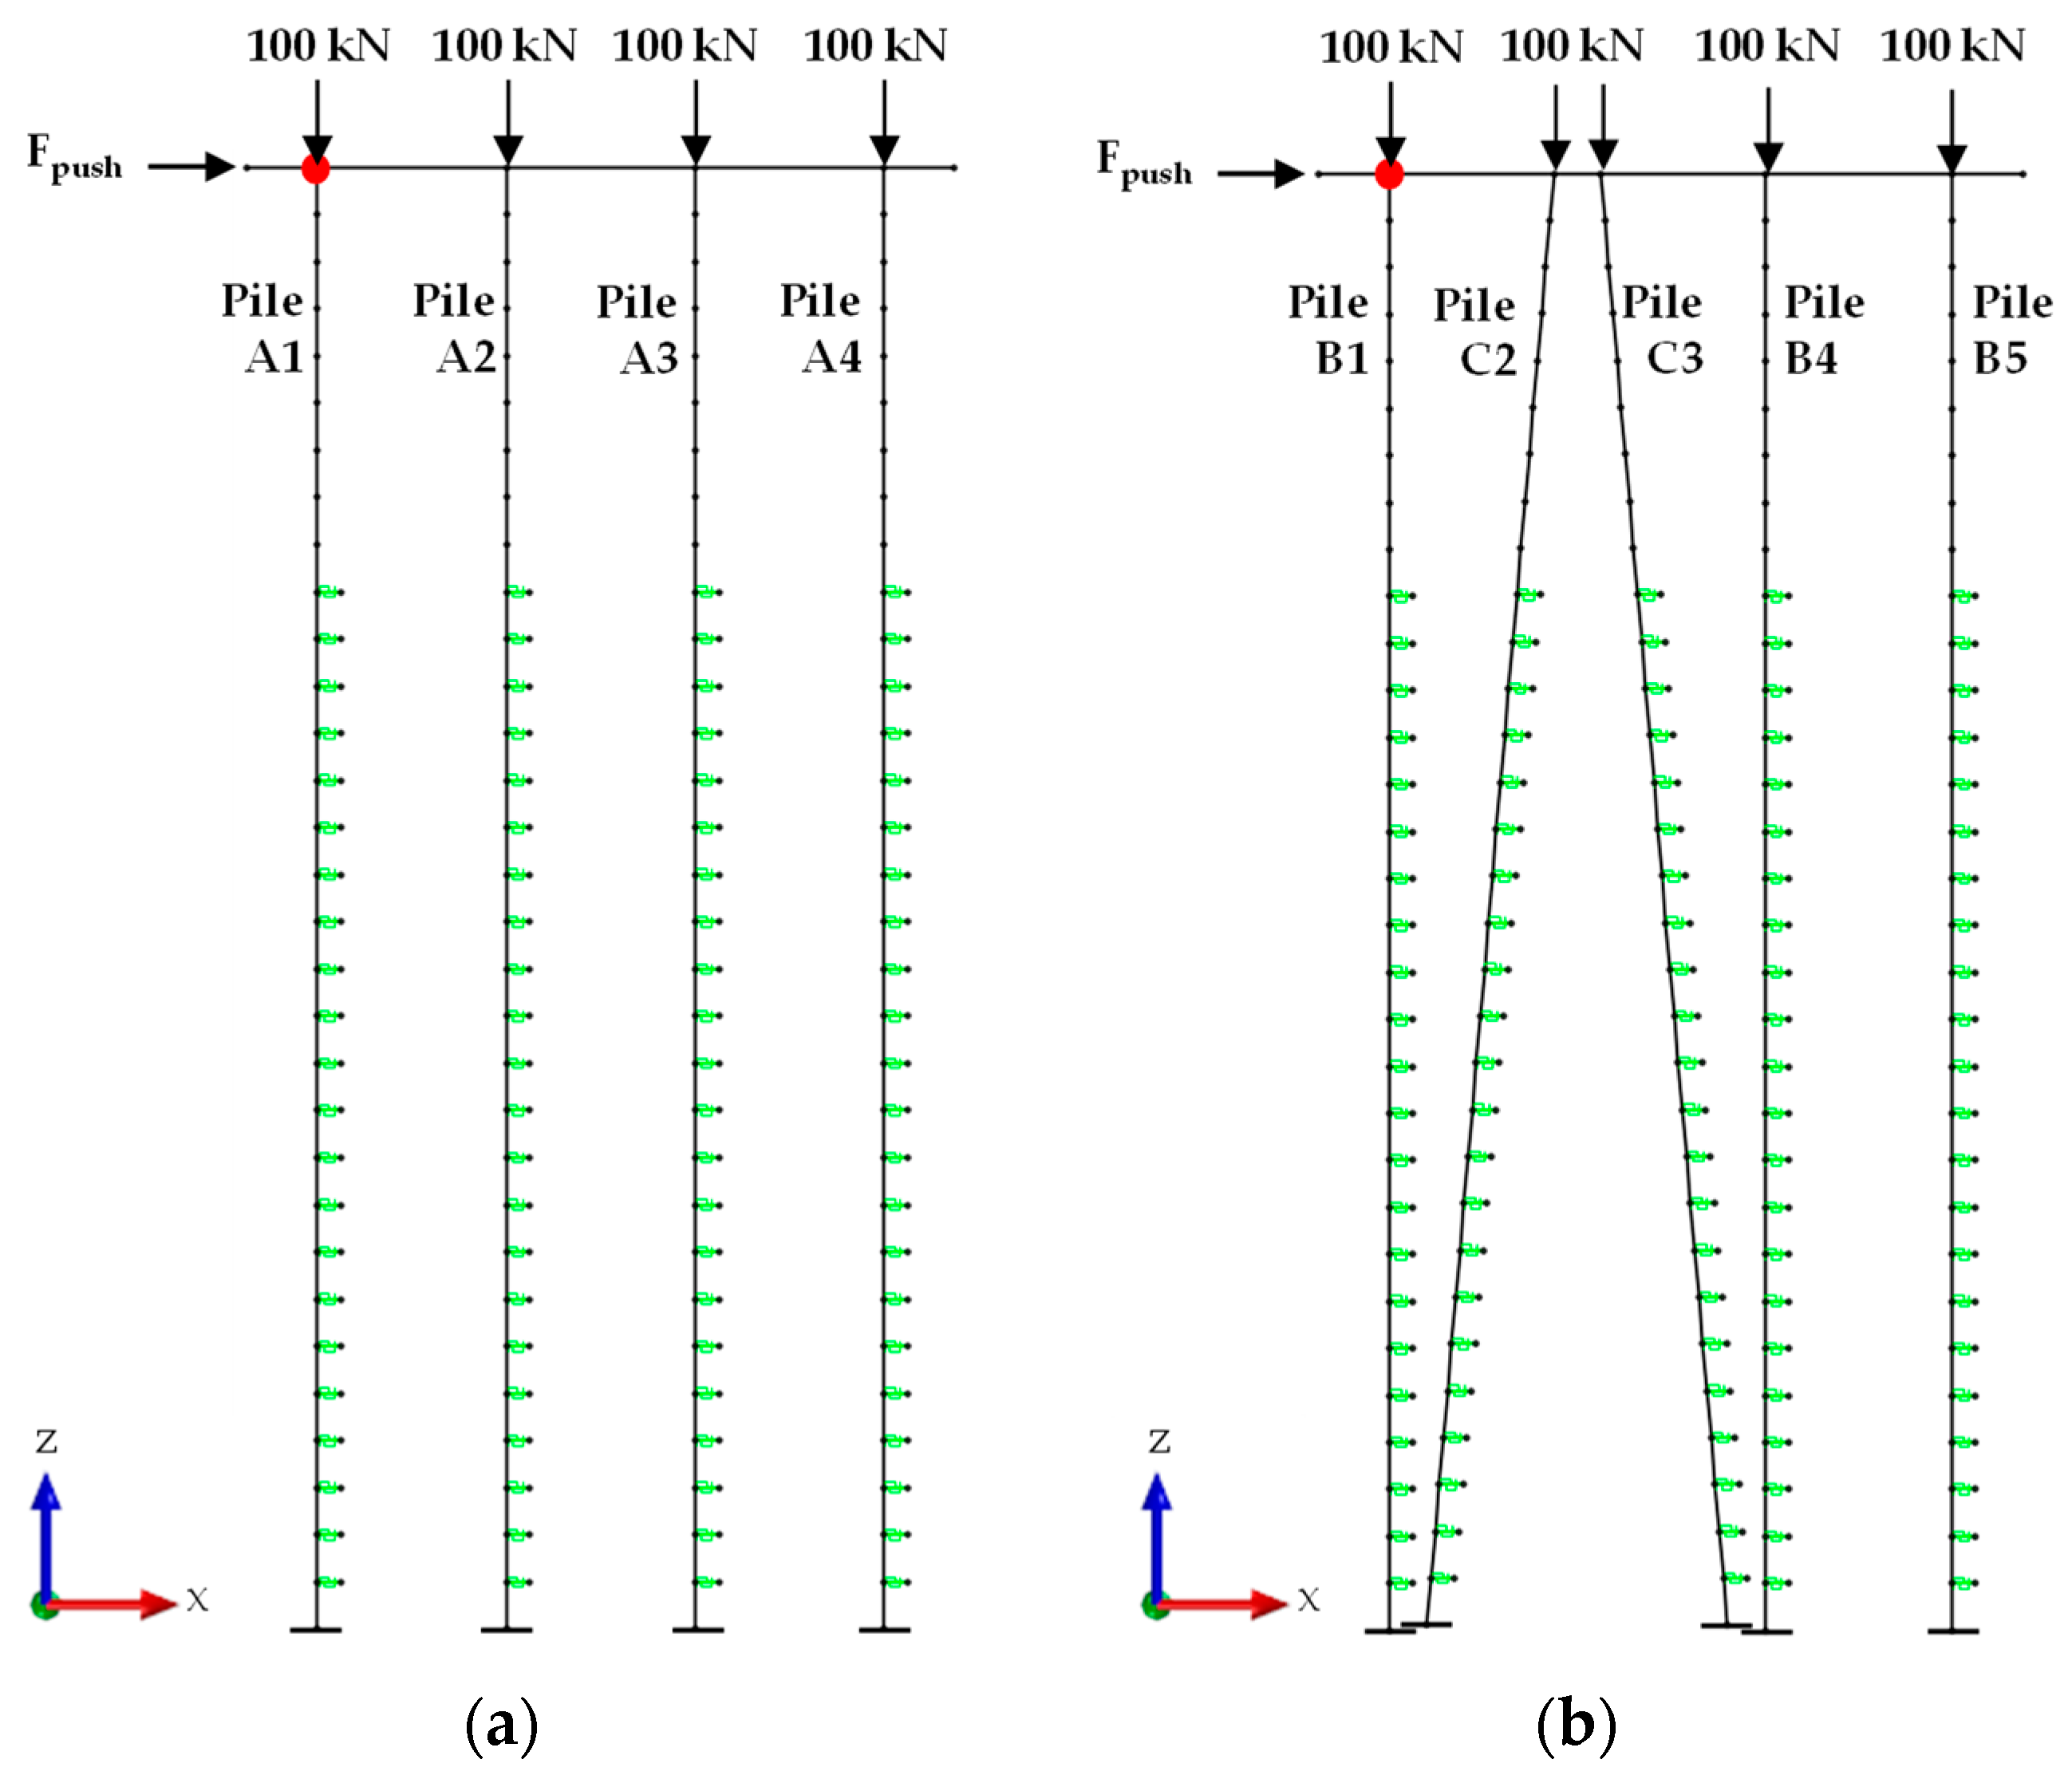
2.5. Pushover Analysis

The pushover analysis was performed in the 2D FB-FEA, FA-1, and FA-2 models, considering the corrosion effect up to 75 years and constant gravity loads (P = 100 kN). Furthermore, the lateral load (Fpush) was applied as a series of displacement-based loads [59] implemented on the top edge of the deck in 1 mm increments until the target displacement was reached. The target displacement was the horizontal displacement of the node at the top of piles A1 and B1 (Figure 9).
In general, the following stages were carried out in this study to observe the nonlinear seismic response of corroded PSWs utilizing three methods (FB-FEA, FA-1, and FA-2):
(1)
Determining the reduction in PC bar area due to corrosion over 75 years. The corrosion degree was determined for each elapsed year.
(2)
Developing mechanical properties of PSWs with corroded spun piles.
(3)
Constructing PSW models based on the step (2) results. FB-FEA models considered the stress–strain curve of the corroded spun pile materials combined with the corroded PC bar area reduction resulting from step (1). Furthermore, FA-1 and FA-2 models considered the reduced PC bar area, deteriorated concrete compressive strength of the corroded spun pile, and reduced PC bar yield strength.
(4)
Defining the hinge properties and bending stiffness reduction factor of corroded spun piles in FA-1 and FA-2 models. Setting the hinge properties of corroded spun piles consists of defining the moment–curvature relationship and determining the axial force-bending moment capacity of corroded spun piles. In FA-1, the definition of the moment–curvature relationship and bending stiffness reduction factor of corroded spun piles were referred to existing methods [3,32]. Whereas in FA-2, the moment–curvature relationship and bending stiffness reduction factor of corroded spun piles were proposed based on ACI 318 [55] and the PCI Design Handbook [56].
(5)
Performing pushover analysis at different corrosion degrees.
(6)
Observing the nonlinear seismic response of corroded PSWs obtained from the pushover analysis results and comparing the results of the three methods in terms of natural period, inertial force, plastic hinges formation, and load capacity of corroded PSWs.

3. Results and Discussion

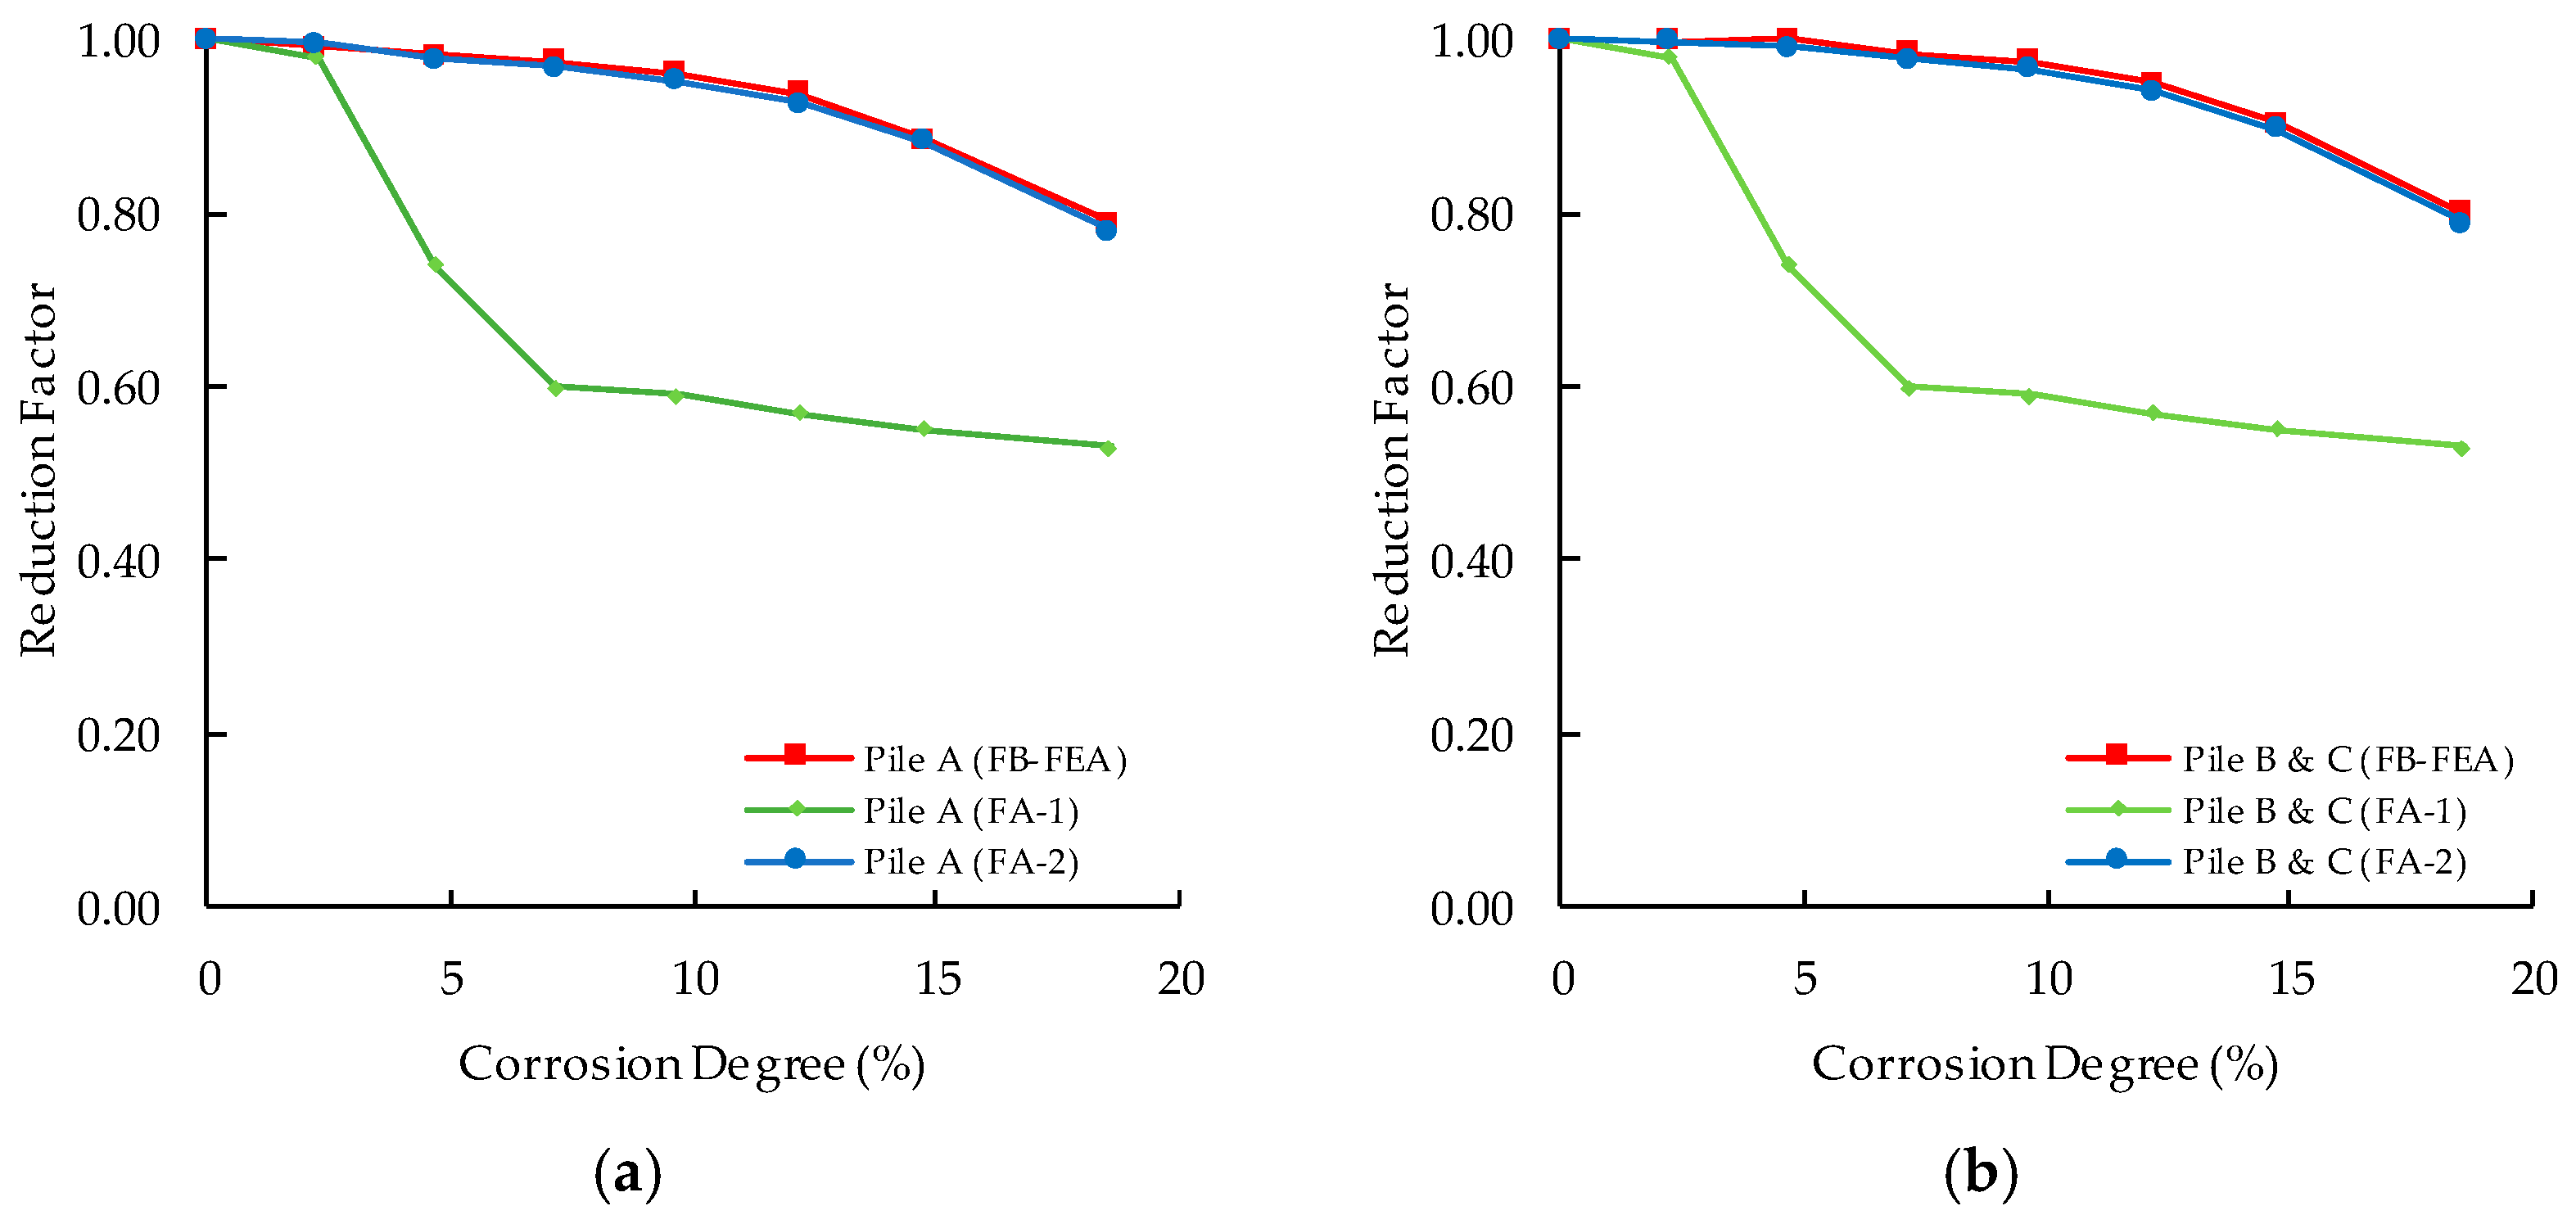
3.1. Bending Stiffness Reduction Factor of Corroded Spun Pile

The bending stiffness of the spun pile decreased from its initial value over time as the corrosion degree increased. This decrease is a function of the bending stiffness reduction factor (η). In FB-FEA, the bending stiffness of the corroded spun pile was computed in the sectional analysis by considering the material properties of corroded spun pile and the reduction in the PC bar cross-sectional area.
In the 2D FA-1 models, the bending stiffness reduction factor of corroded pile [3] was employed, and it is:
E I corr = η   E p I p
where E I corr is the bending stiffness of the corroded pile, I p is the moment of inertia of the spun pile (mm4), E p is the modulus of elasticity of the spun pile (MPa), and η is the bending stiffness reduction factor of corroded pile that can be calculated as [5]:
η = 1 A A i η i
where A is the total cross-sectional area of the PC bar, A i is the cross-sectional area of the ith PC bar after corrosion, and η i is the stiffness reduction factor of the ith PC bar caused by corrosion, calculated as follows [5]:
η i = 1.0                   0     d i   <   0.1 3.7   -   7 d i / 3       0.1     d i   <   0.25 0.65                   d i     0.25
where d i is the rust thickness of the ith PC bar, calculated using Equation (3).
The bending stiffness reduction factor of corroded spun pile considered in FA-2 was developed by modifying the bending stiffness reduction factor of the corroded pile formulation [3] as well as the moment of inertia [60] and the modulus of elasticity [55] of the spun pile formulation. This was achieved by considering the reduction in diameter of the PC bar caused by corrosion and the material properties degradation of the corroded spun pile. Equations (23)–(28) present the bending stiffness reduction factor of the corroded spun pile as follows:
η sp = E I sp - corr E p I p
EI sp - corr = E c , corr π d o 4 d i 4 64 + E s E c , corr 1 A pc , corr - i d pc - i 2
E c , corr   = A co A g E co , corr   + n A cc A g E cc , corr  
E co , corr   = 4700 f c , corr
E cc , corr   = 4700 f c c , corr
n = E co , corr   E cc , corr  
where η sp is the bending stiffness reduction factor for the corroded spun pile, E I sp - corr is the bending stiffness of the corroded spun pile, I p is the moment of inertia of the spun pile (mm4), E p is the modulus of elasticity of the spun pile (MPa), E c , corr   is the elastic modulus of corroded concrete of the spun pile (MPa), d o is the outside diameter of the spun pile (mm), d i is the inside diameter of the spun pile (mm), E s is the PC bar elastic modulus (MPa), A pc , corr - i is the ith cross-sectional area of the corroded PC bar (mm2), d pc - i   is the distance from the ith corroded PC bar’s neutral axis to the spun pile neutral axis (mm), A co is the cross-sectional area of the cover concrete of the spun pile (mm2), A cc is the cross-sectional area of the core concrete of the spun pile (mm2), A g is the cross-sectional area of the spun pile (mm2), E co , corr   is the modulus of elasticity of the corroded cover concrete (MPa), E cc , corr   is the modulus of elasticity of the corroded core concrete (MPa), n is the modular ratio, f c , corr is the corroded cover concrete compressive strength (MPa), and f cc , corr is the corroded core concrete compressive strength (MPa).
In this study, the same corrosion degree was assumed to occur throughout the PC bar of the spun pile. Table 5 shows the bending stiffness reduction factor (η) of the corroded spun pile from FB-FEA, FA-1, and FA-2.
Figure 10 illustrates the comparison of the bending stiffness reduction factor of corroded spun pile from FB-FEA, FA-1, and FA-2. The bending stiffness reduction factor of corroded spun pile used in FA-1 has a much smaller value than those used in FB-FEA and FA-2 for corrosion degrees greater than 2%. This is because FA-1 refers to Equations (20)–(22), which use rust thickness as the main factor in determining the bending stiffness reduction factor [5]. Equations (20)–(22) are considered to have relatively conservative results compared to the proposed Equations (23)–(28).
The decrease in the bending stiffness of the corroded spun pile led to an increase in the natural period of the PSWs. Table 6 displays the natural periods of PSW-A and PSW-B for up to 75 years. The maximum differences in the natural periods of corroded PSWs according to FA-1 and FA-2 were 15.96% and 0.35%, respectively, compared to the FB-FEA results.
The conservative bending stiffness reduction factor of the corroded spun pile calculation in FA-1 results in a significant increase in the natural periods of the corroded PSW as the degree of corrosion increases, which in turn affects the inertial force (Fi) calculation. Furthermore, the inaccurate estimation of inertial forces contributed to errors in estimating the seismic response of corroded PSWs. This study considered site-specific spectral acceleration (SA) for port facilities in Indonesia [61] developed based on earthquake ground motion records in Indonesia for the site class of medium soil (SD) (Figure 11).
Table 7 compares the inertial forces of the corroded PSW calculated based on the SA and the natural periods of the corroded PSW by FB-FEA, FA-1, and FA-2. As the corrosion degree increased, the inertial force of the corroded PSW decreased. The inertial force calculated by FB-FEA, FA-1, and FA-2 did not differ significantly under intact conditions. However, when the corrosion degree exceeded 4.68%, the inertial force calculated by FA-1 was substantially different from that calculated by FB-FEA, up to a maximum of 16.22% for PSW-A and 12.24% for PSW-B. In contrast, the inertial force calculated by FA-2 for PSW-A and PSW-B differed slightly from that calculated by FB-FEA by 0.23% for PSW-A and 0.42% for PSW-B. The comparison of the inertial forces for PSWs with different corrosion degrees indicates the importance of accurately estimating the bending stiffness reduction factor of corroded spun piles in the nonlinear seismic response analysis of corroded PSWs using FA.

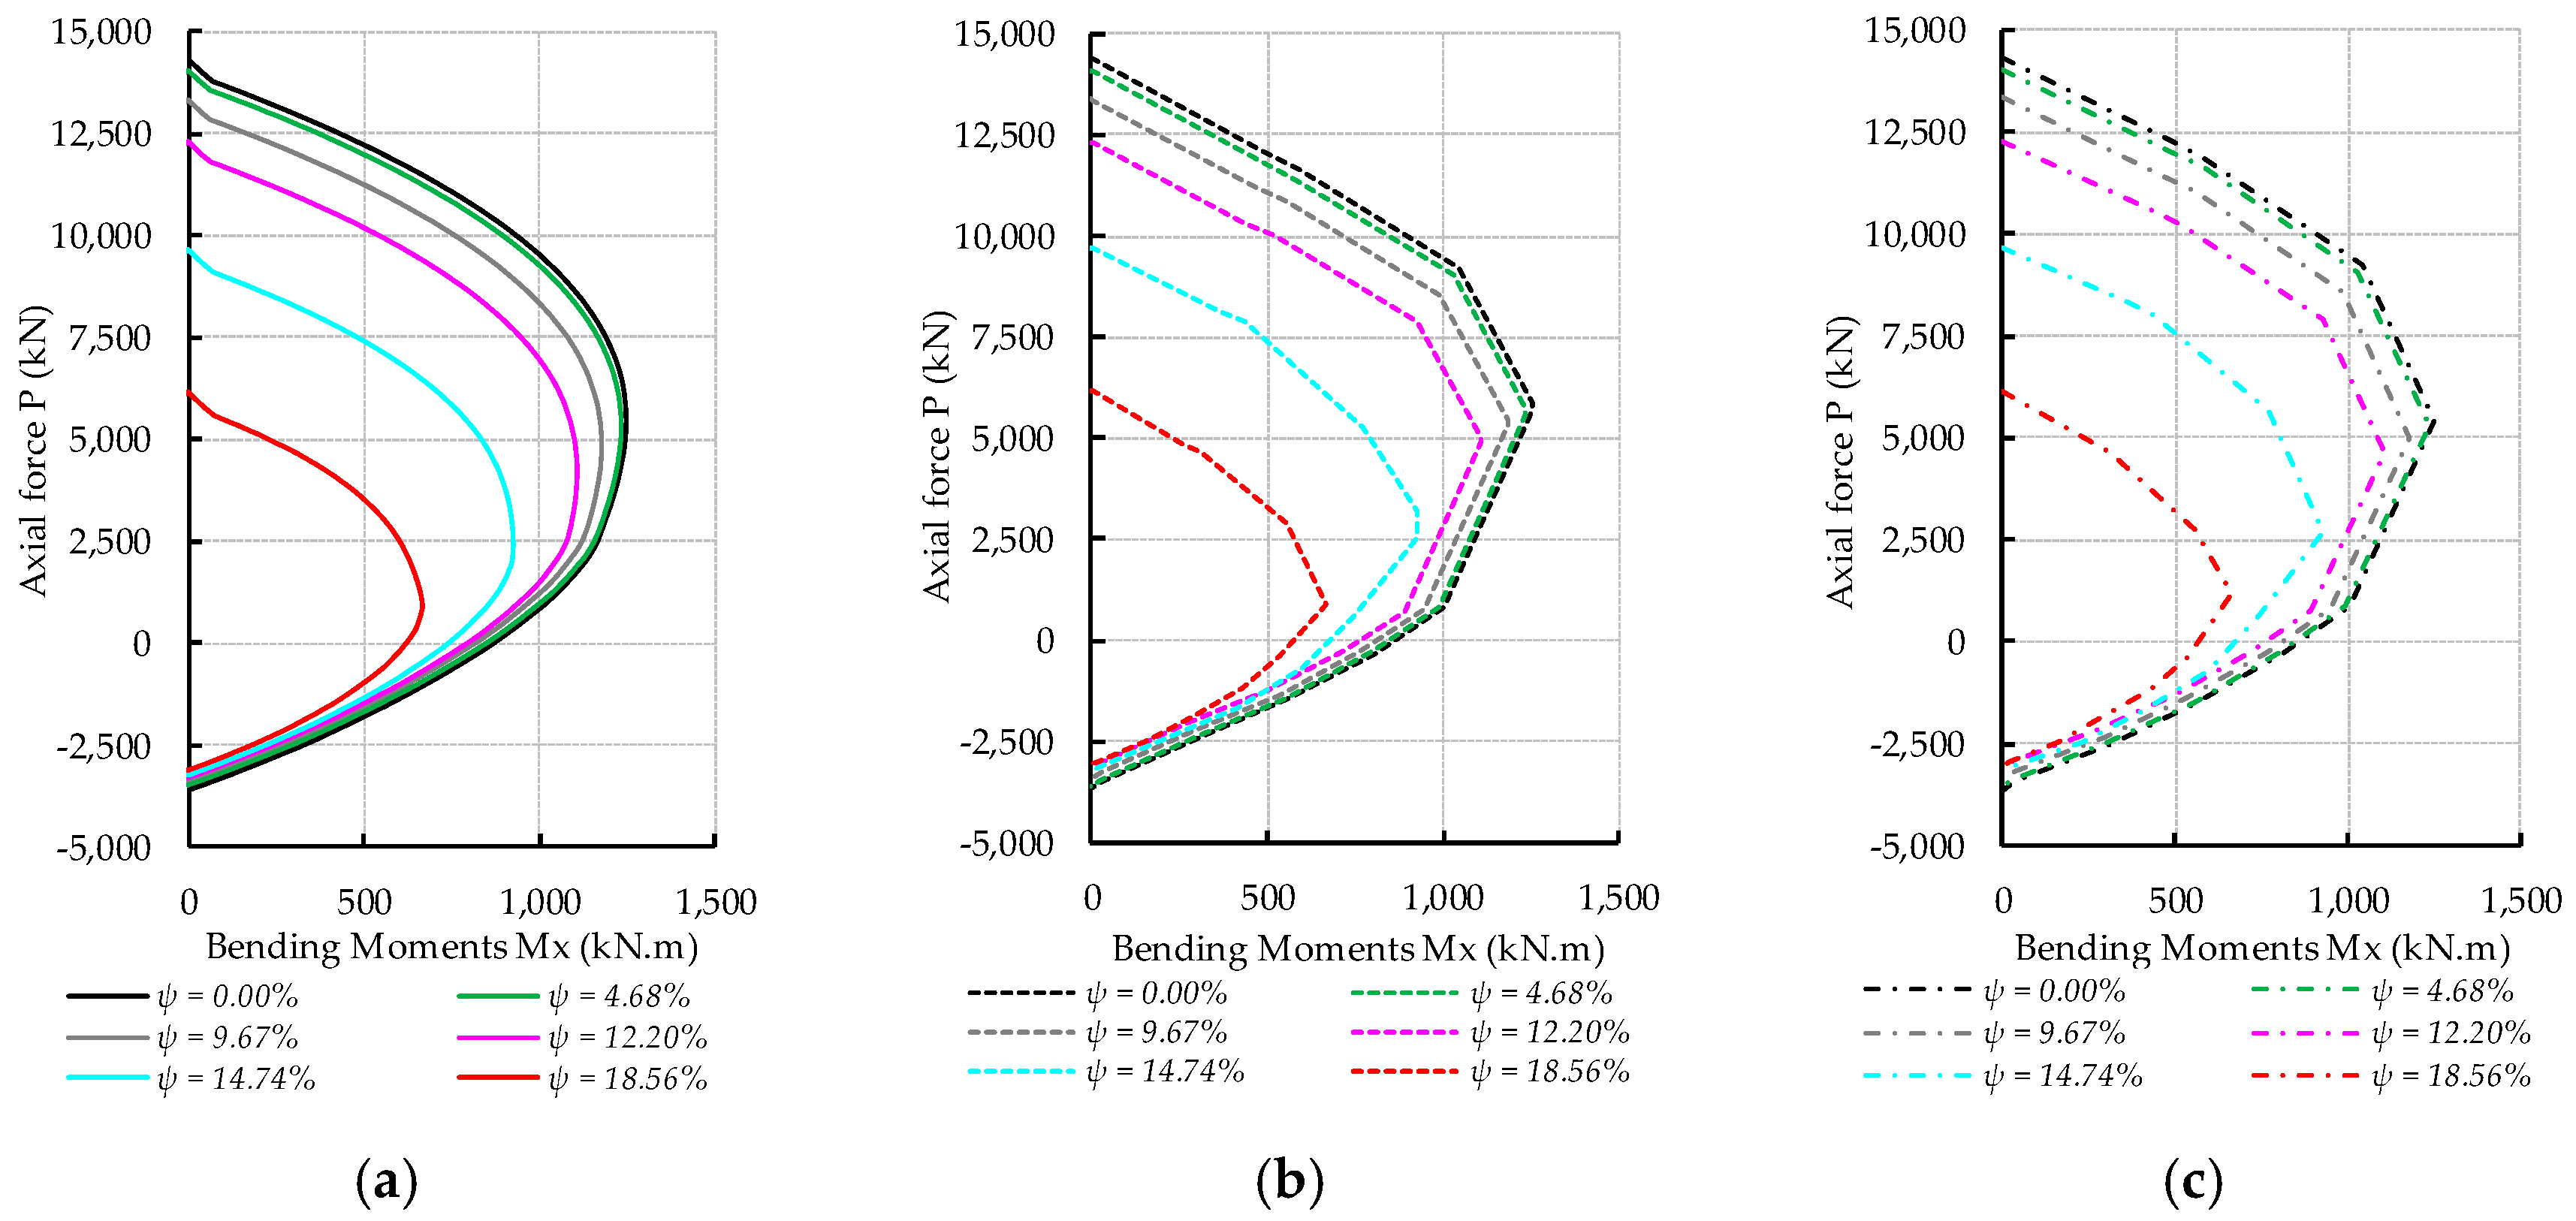
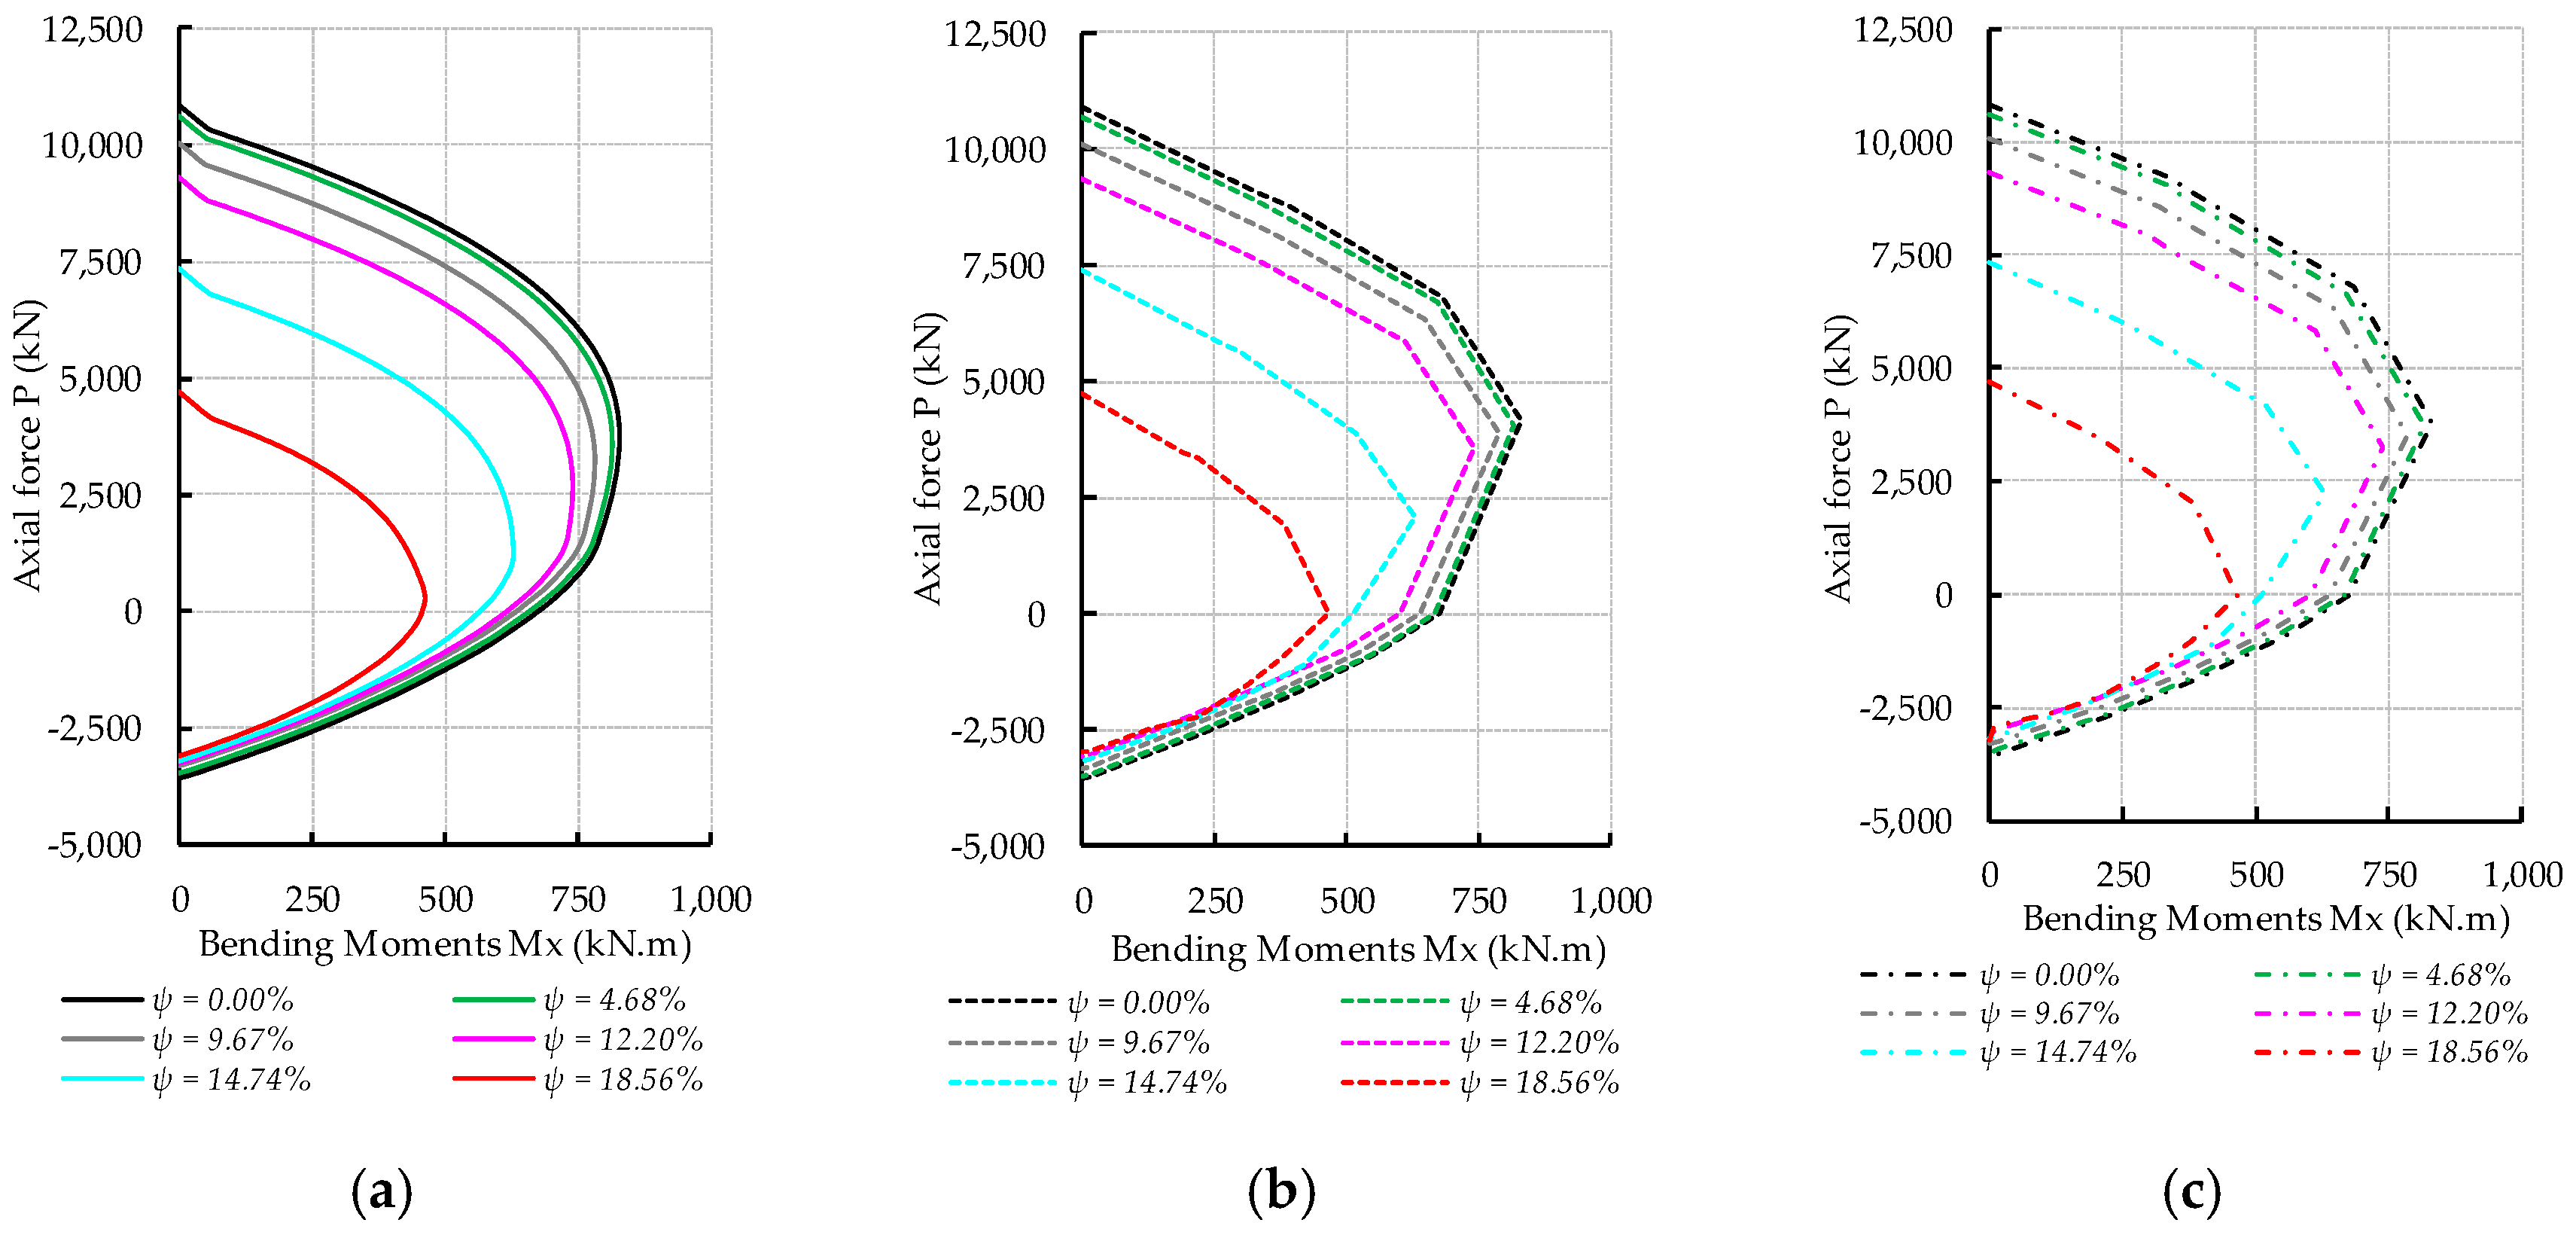
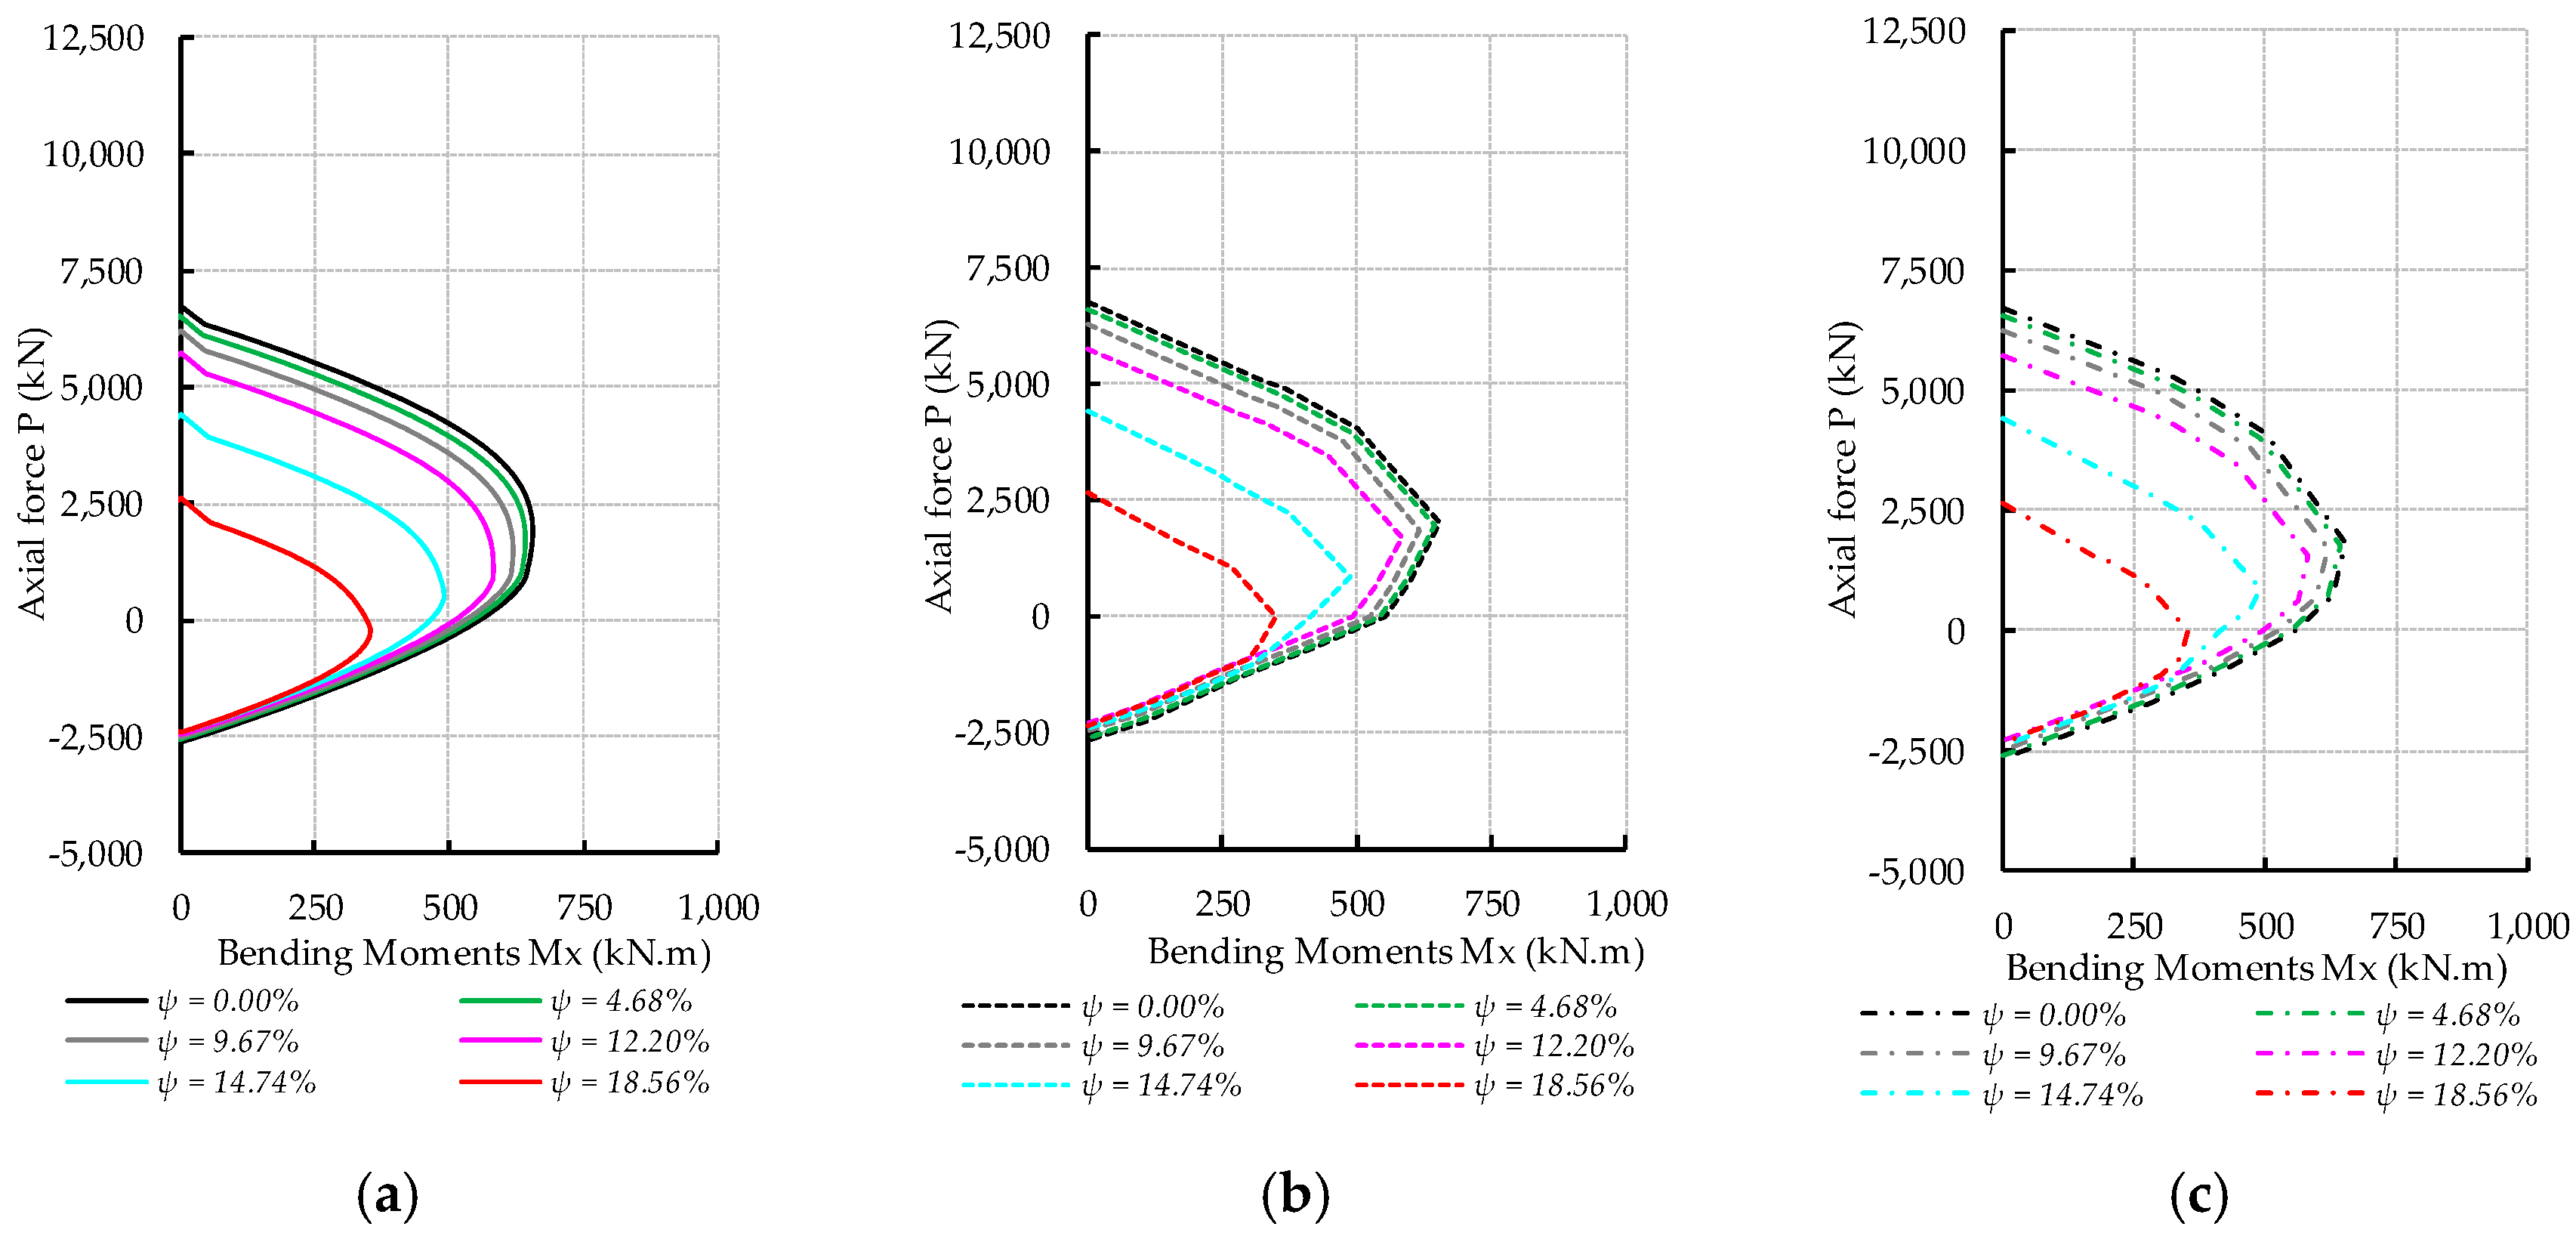
3.2. P-M Capacity Curves

The capacity of a spun pile is expressed as a curve describing the combination of its axial load (P) capacity and bending moment (M) capacity, commonly known as the axial load–bending moment (P-M) capacity curve [7]. Since the pile has a biaxially symmetric cross-section, the P-M capacity curve of spun pile is described in terms of axial load capacity (P) and principal moment (Mx). Positive values of axial load capacity indicate compressive axial load capacity and negative values indicate tensile axial load capacity.
In the FA method, the P-M capacity curve of the corroded spun pile must be determined to set the hinge properties. The P-M capacity applied in FA-1 was computed using SAP2000 software based on ACI 318–02 [55], while in FA-2 the P-M capacity was calculated with the help of XTRACT software [62]. Figure 12, Figure 13, Figure 14 and Figure 15 show the P-M capacity curves of piles A, B, and C, respectively. Figure 12, Figure 13, Figure 14 and Figure 15 also show that the P-M capacities of piles A, B, and C decreased significantly after the corrosion degree exceeded 12%.
Table 8 provides the parameters of the P–M capacity curves for non-corroded spun pile sections. Key point parameters of the P–M capacity curves of FA-1 and FA-2 are generally consistent with those obtained from the FB-FEA. The maximum deviation between FA-1, FA-2, and FB-FEA is within 3.7%. Furthermore, corrosion has more negative impact on the spun pile’s compressive axial load and bending moment capacities than on its tensile axial load capacity. For an 18.56% corrosion degree, the decrease in the axial compression capacity reached 56.95% for Pile A with infilled concrete, 59.75% for Pile A, 56.46% for Piles B and C with infilled concrete, and 60.84% for Piles B and C. For the same corrosion degree (18.56%), the decrease in bending moment capacity was 46.86% for Pile A with infilled concrete, 48.42% for Pile A, 43.80% for Piles B and C with infilled concrete, and 46.25% for Piles B and C. In contrast, the axial tension capacity of the spun pile at an 18.56% corrosion degree decreased by only 13.26% for Piles A, B, and C with infilled concrete and by only 8.32% for Piles A, B, and C. Table 9 compares the compressive and tensile axial load capacities as well as the bending moment capacities for various corrosion degrees according to the FB-FEA results.

3.3. Plastic Hinges Formation

Figure 16a,b show the distribution of plastic hinges resulting from FB-FEA, FA-1, and FA-2 for the corroded PSW-A and PSW-B, respectively. Pushover analysis was performed for all 2D PSW models under corrosion for up to 75 years. The FA-1 and FA-2 plastic hinge formation sequences of PSW-A and PSW-B agreed with the FB-FEA results. In PSW-A, the plastic hinge occurred first at the top of Pile A3, then sequentially at the tops of the other piles, and subsequently at the in-ground pile location (about 0–2 m below the seabed) until the PSW-A load capacity was reached. Furthermore, in PSW-B, the plastic hinge occurred first at the top of Pile C3, then sequentially at the tops of all other piles except the tension Pile C2. The in-ground plastic hinge then occurred until the PSW-B load capacity was reached.

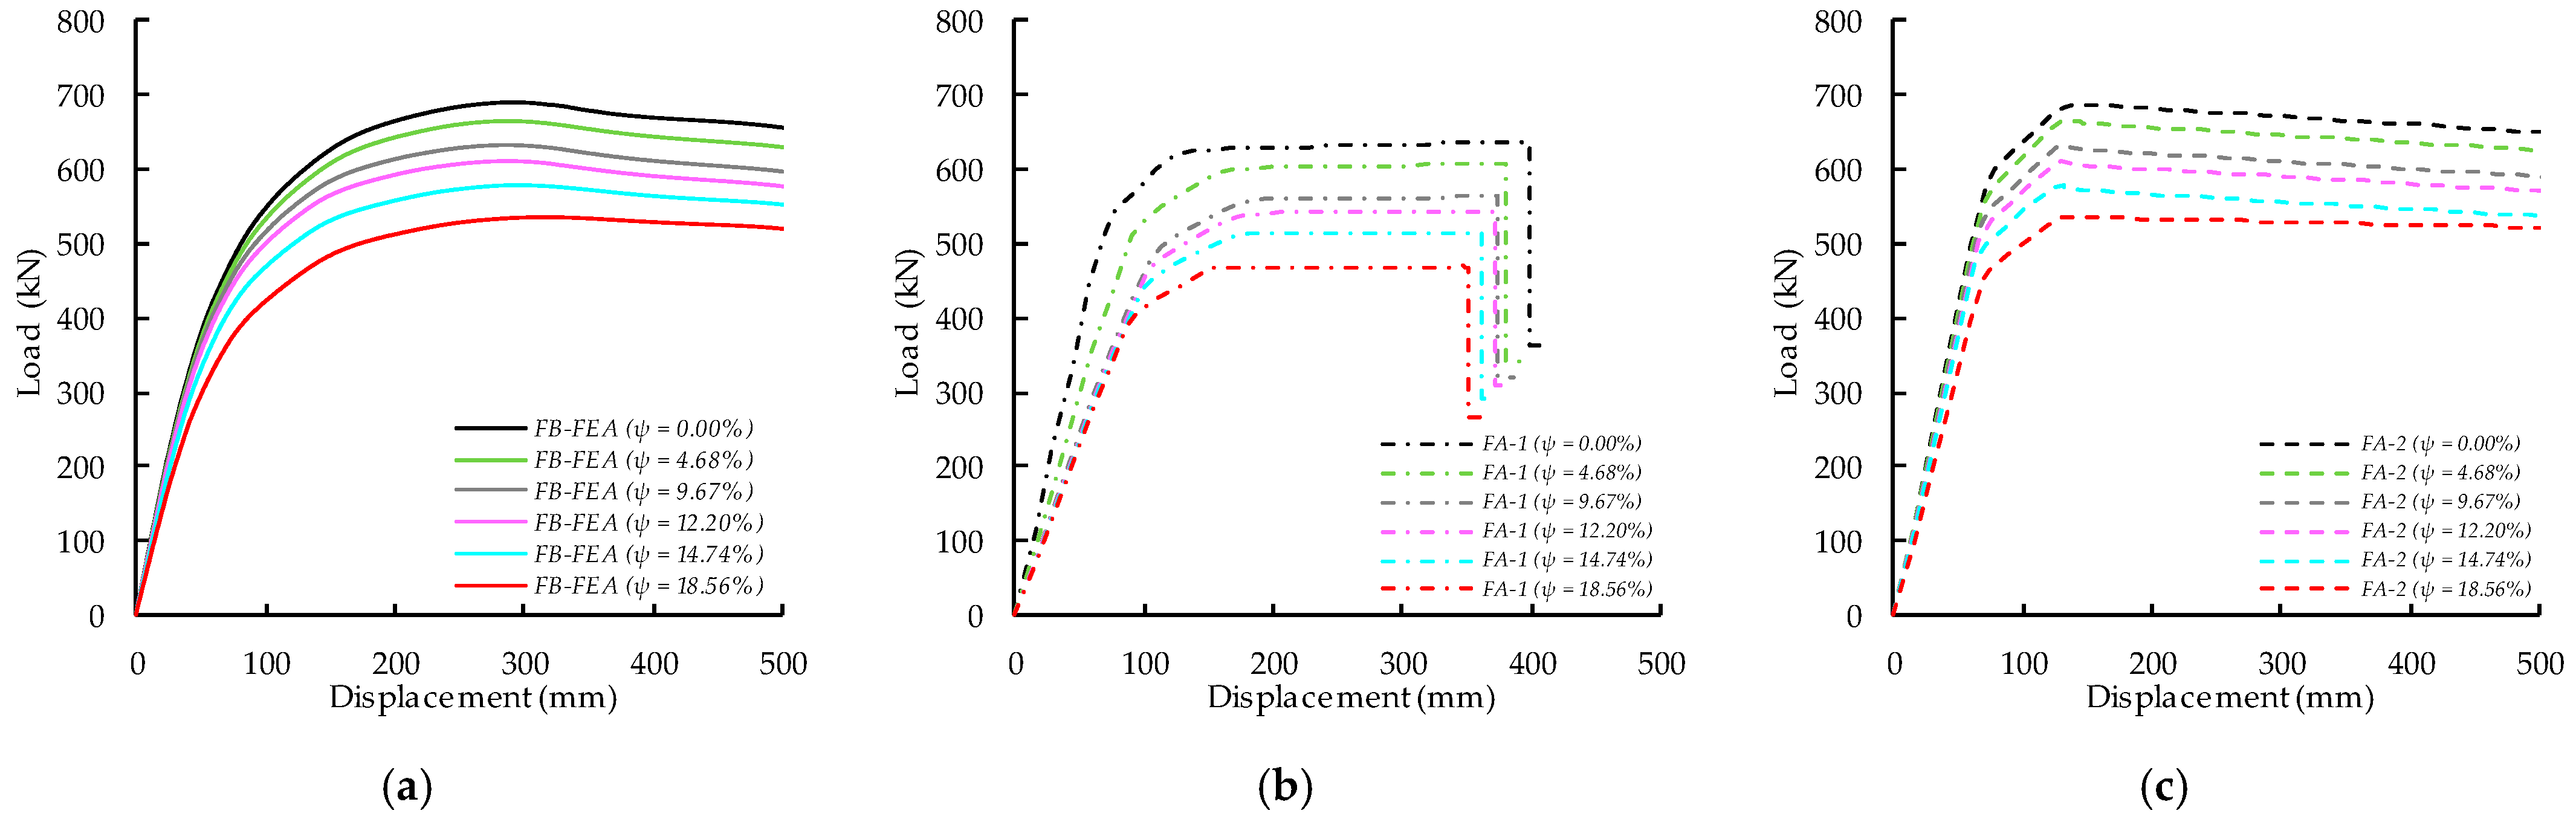
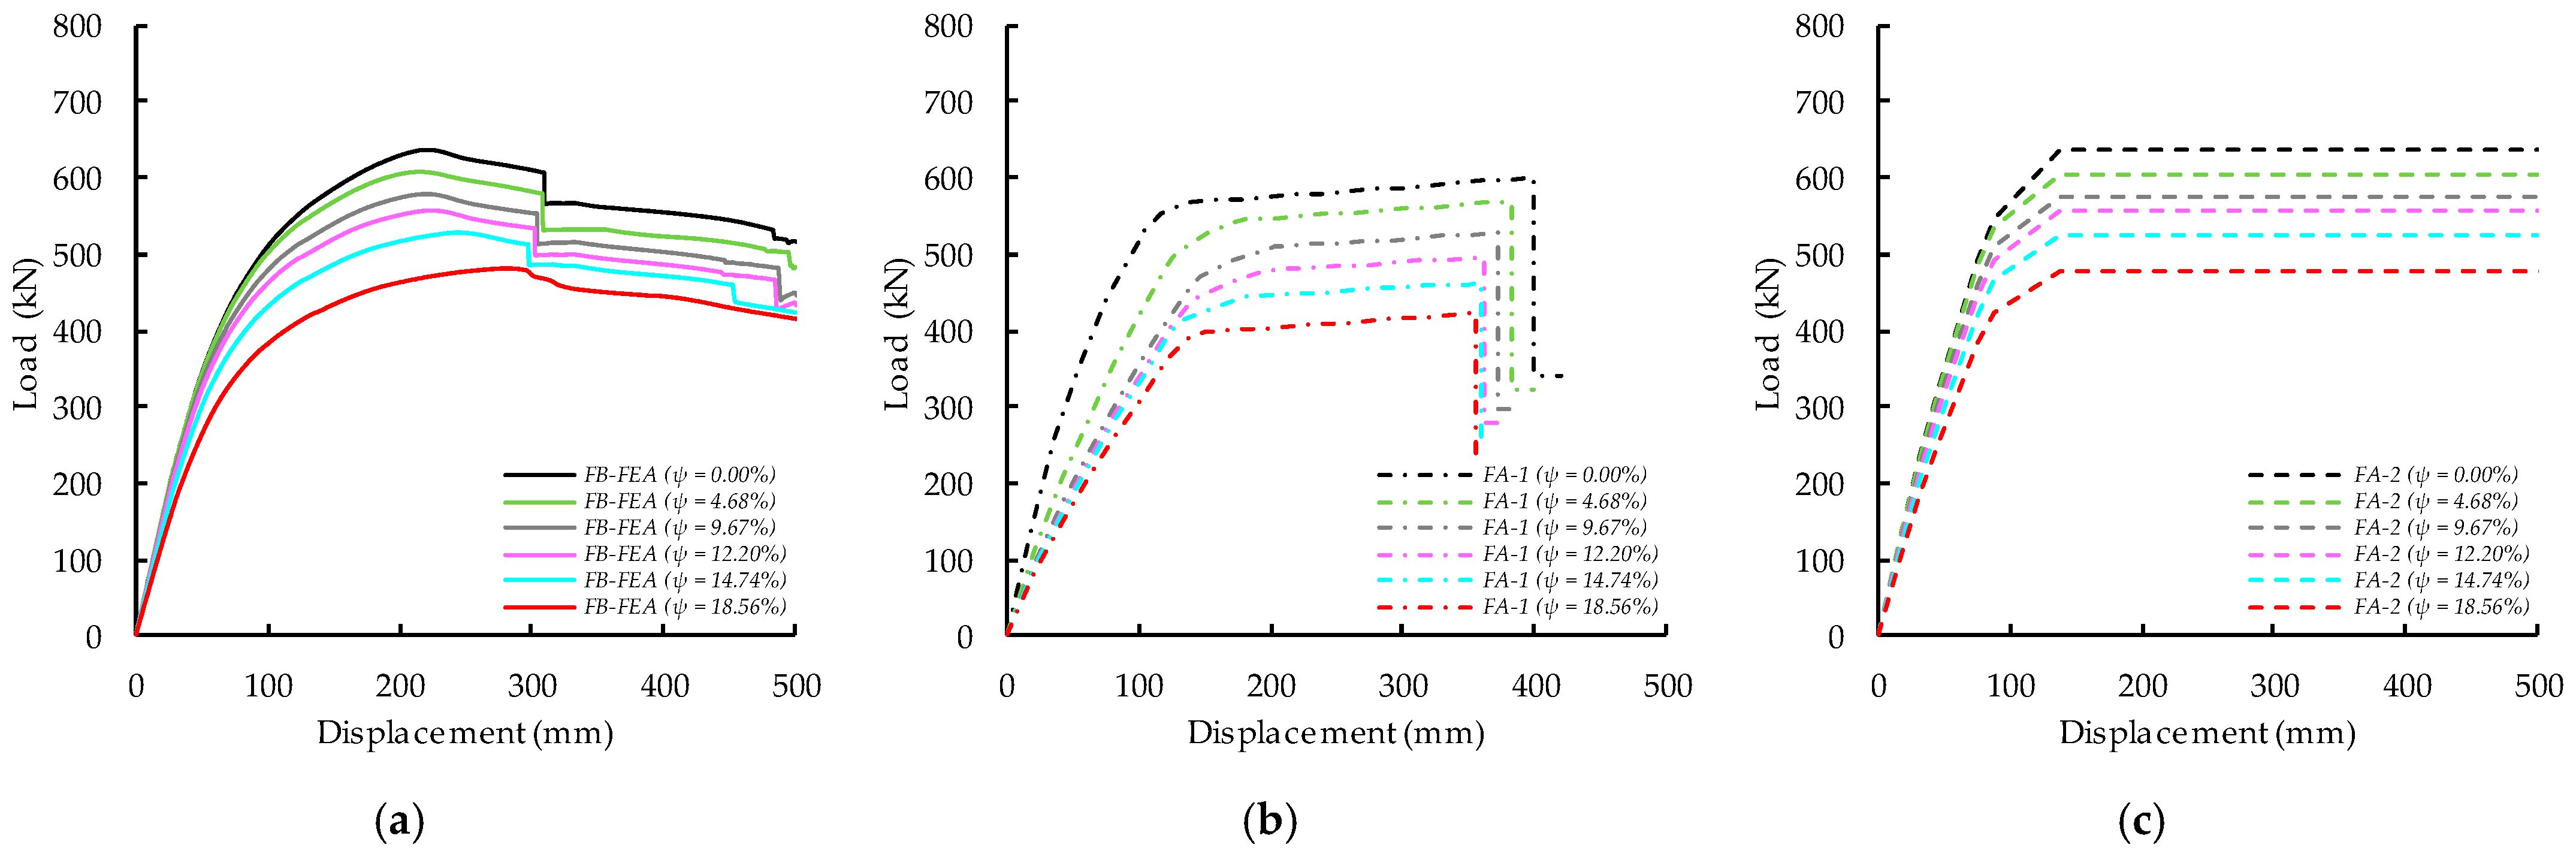
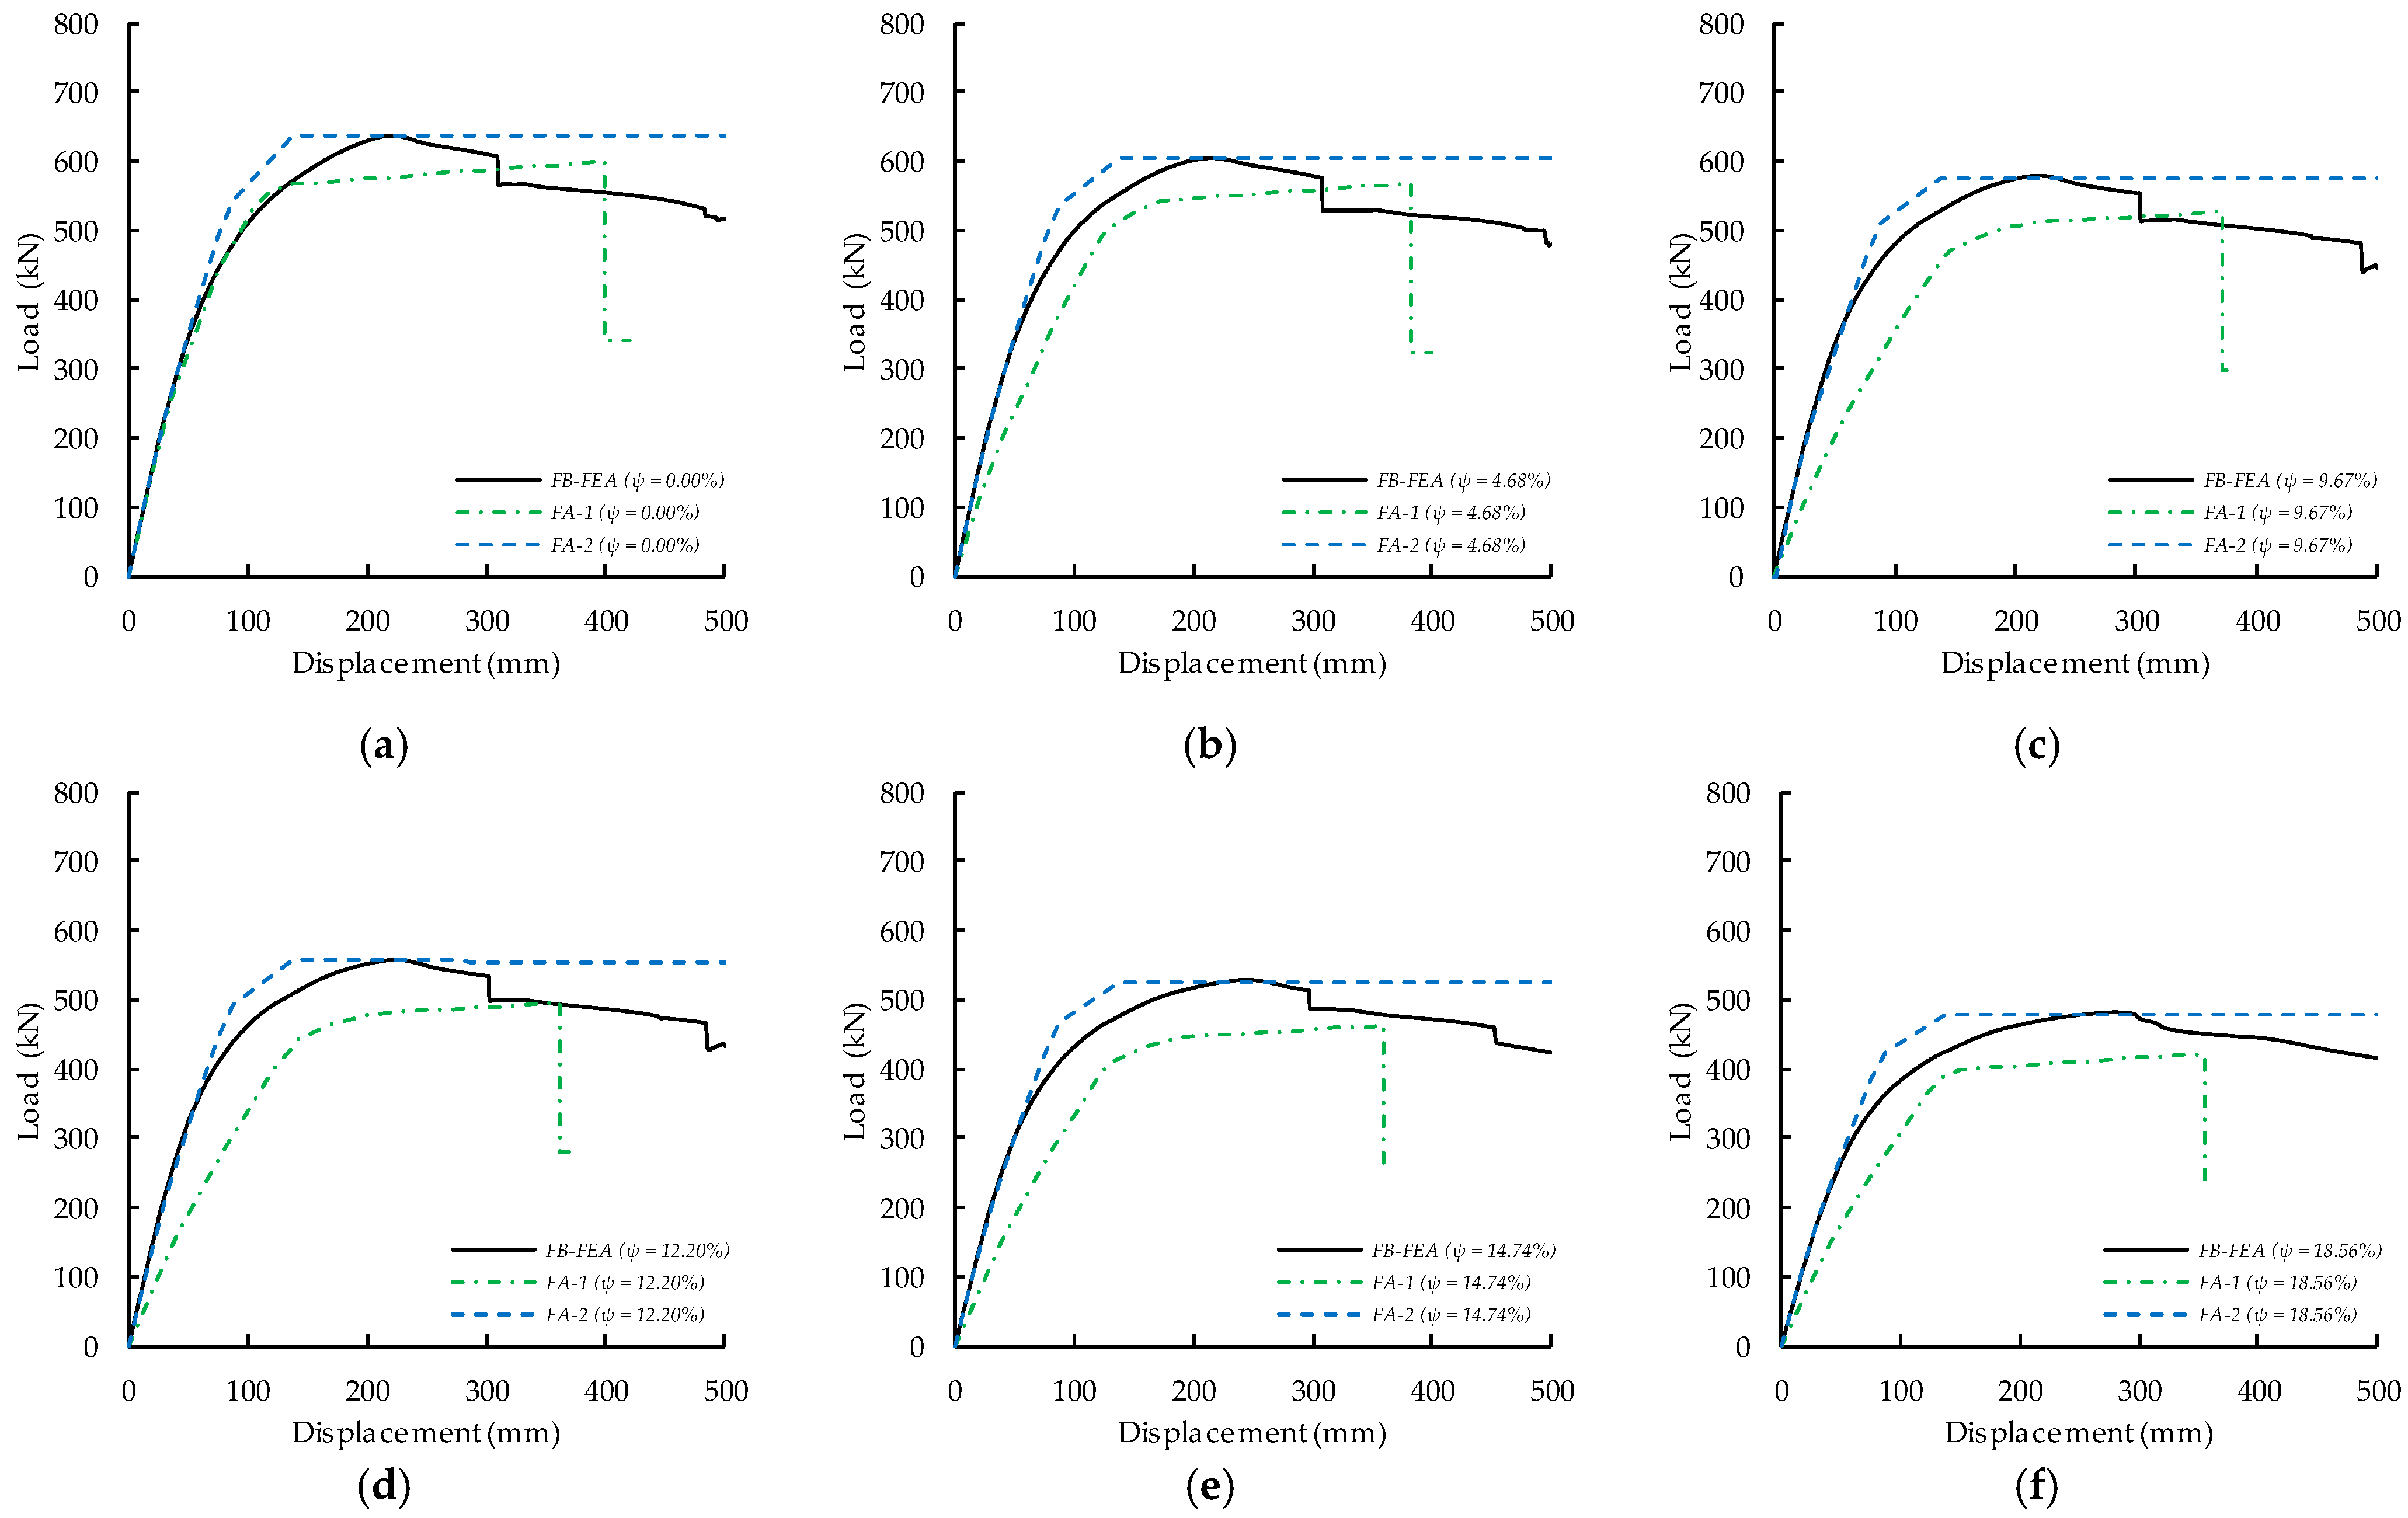
3.4. Pushover Curves

Figure 17 and Figure 18 show the pushover curves of corroded PSW-A and PSW-B, respectively. The pushover curves of the corroded PSWs obtained from FB-FEA were different from those obtained from FA-1 and FA-2. The 2D PSW model with distributed plasticity (FB-FEA) generated a smoother pushover curve than FA-1 and FA-2, considering an idealized plasticity approach (concentrated hinge). In FB-FEA, the spun pile section was discretized into multiple areas (material points), each corresponding to a predetermined material stress–strain curve. The moment–curvature relationship of the spun pile was calculated based on the stress–strain curve of each material point. As a result, the material nonlinearity and bending stiffness of corroded spun piles can be properly accounted for, resulting in smoother pushover curves. On the other hand, FA-1 and FA-2 considered the bending stiffness reduction factor and hinge property settings to characterize the inelastic behavior of the corroded spun piles. The hinge property settings reflect the moment–curvature and P-M capacity definitions for corroded spun piles. The pushover curves of FA-1 and FA-2 were influenced by the combination of the hinge property settings and the bending stiffness reduction factor of the corroded spun pile.
Figure 19 shows the effects of corrosion on the load–displacement curves of PSW-A according to FB-FEA, FA-1, and FA-2 for corrosion degrees of 0, 4.68, 9.67, 12.20, 14.74, and 18.56%. In the intact state (ψ = 0%), FB-FEA estimated the load capacity of PSW-A to be 689.05 kN. FA-1 produced a smaller load capacity of 635.97 kN, and FA-2 produced a slightly lower load capacity of 687.75 kN. In addition, FB-FEA led to a 22.06% decrease in the load capacity of PSW-A under a corrosion degree of 18.58%. In contrast, FA-1 and FA-2 led to 26.24% and 22.16% decreases in the load capacity of PSW-A under a corrosion degree of 18.58%, respectively.
Figure 20 shows the load–displacement curve of corroded PSW-B with different corrosion degrees ranging from 0% to 18.56%. FB-FEA determined the non-corroded PSW-B to have a load capacity of 635.20 kN, whereas FA-1 and FA-2 produced load capacities of 600.31 and 636.32 kN, respectively. Furthermore, FB-FEA resulted in a 24.25% decrease in the load capacity of PSW-B under a corrosion degree of 18.58%, while FA-1 and FA-2 resulted in 29.70% and 24.72% decreases, respectively. The different definitions of the moment–curvature relationship, defined as hinge properties of spun pile, used in FA-1 and FA-2 (i.e., ultimate capacity and ultimate curvature of the spun pile) result in the different load capacities of the non-corroded PSWs compared to the FB-FEA results. Furthermore, the bending stiffness reduction factor of the corroded spun pile used in FA-1 exacerbates the difference in load capacity reduction for the corroded PSW compared to the FB-FEA results.
Table 10 compares the load capacities of PSW-A and PSW-B in the range of corrosion degrees from 0 to 18.58%. The maximum differences in the load capacity results for the corroded PSWs from FA-1 and FA-2 were 12.66% and 0.44%, respectively, compared to the FB-FEA results. The load capacity and pushover curves of the corroded PSW-A and PSW-B obtained through FA-2 were more consistent with the FB-FEA results than those obtained through FA-1. The explanation is that FA-2 was properly defining the bending stiffness reduction factor, moment–curvature relationship, and P–M capacity of the corroded spun piles, and therefore the FA-2 method can predict load capacities and pushover curves of the corroded PSW with similar accuracy as FB-FEA.

4. Conclusions

This study proposed using the FA method to investigate the nonlinear seismic response of PSWs with corroded spun piles. The vertical pile and batter pile configurations were considered. The nonlinear seismic response of corroded PSWs was determined by performing pushover analysis and observed for 75 years using three methods: FA using the method of the previous study (FA-1), the proposed FA method (FA-2), and FB-FEA. The following conclusions can be drawn from the results of this study:
  • The results obtained with FA-2 are in excellent agreement with the FB-FEA results for the nonlinear seismic response of corroded PSWs in terms of the natural period, plastic hinge formation, and load capacity. The proposed method for defining the moment–curvature relationship, P-M capacity, and bending stiffness reduction factor for corroded spun piles has been introduced and applied to FA-2, resulting in differences for the natural period and load capacity of corroded PSWs that are no more than 0.35% and 0.44%, respectively, compared to the FB-FEA results. The FB-FEA itself has also been extensively validated for its ability to reproduce experimental results.
  • The FA-1 results for the P–M capacity and plastic hinge formation are the same as the FB-FEA and FA-2 results. However, FA-1 determines the bending stiffness reduction factor and moment–curvature relationship of corroded spun piles based on the results of previous studies and produces significantly different results for the natural periods and load capacities of corroded PSWs compared to the FB-FEA results. The maximum differences in the FA-1 results for the natural period and load capacity of a corroded PSW compared to the FB-FEA results were 15.96% and 12.66%, respectively.
  • The pushover curves of corroded PSWs obtained from FB-FEA differ from those obtained from the FA models. The 2D PSW model with distributed plasticity (FB-FEA) produces smoother, more precise pushover curves than the FA model with an idealized plasticity approach (concentrated hinge). However, by properly defining the bending stiffness reduction factor, moment–curvature relationship, and P–M capacity of the corroded spun piles, the FA-2 method can predict load capacities with similar accuracy as FB-FEA.
  • Corrosion has more adverse effects on the compressive axial load and bending moment capacities of spun piles than tensile axial load capacity. In this study, at a corrosion degree of 18.56%, the maximum reductions in compressive axial load capacity and bending moment capacity were 60.84% and 48.42%, respectively. In contrast, the maximum reduction in tensile axial load capacity was only 13.26%.

Author Contributions

Conceptualization, A.N.R. and T.N.; methodology, A.N.R. and T.N.; software, A.N.R.; validation, A.N.R. and T.N.; formal analysis, A.N.R. and T.N.; investigation, A.N.R. and T.N.; resources, A.N.R. and T.N.; data curation, A.N.R.; writing—original draft preparation, A.N.R.; writing—review and editing, T.N.; visualization, A.N.R.; supervision, T.N.; project administration, A.N.R.; funding acquisition, A.N.R. All authors have read and agreed to the published version of the manuscript.

Funding

This research was funded by PT. Inti Teknik Solusi Cemerlang (ITSC), grant number: 037/ADM.ITSC/VIII/2019, and the APC was funded by PT. ITSC.

Institutional Review Board Statement

Not applicable.

Informed Consent Statement

Not applicable.

Data Availability Statement

The datasets generated and/or analyzed during the current study are available from the corresponding author upon reasonable request.

Acknowledgments

The authors would like to express their gratitude to PT. Inti Teknik Solusi Cemerlang (ITSC) for providing the SAP2000 and STKO-OpenSees software package.

Conflicts of Interest

The authors declare no conflict of interest.

References

  1. Yulius; Prakoso, W.A.; Orientilize, M.; Sentosa, B.O.B. Numerical Study of Spun Pile to Pile Cap Connections in Soft Soil. J. Phys. Conf. Ser. 2021, 1858, 012087. [Google Scholar] [CrossRef]
  2. Liang, F.; Zhang, H.; Wang, J. Variational Solution for the Effect of Vertical Load on the Lateral Response of Offshore Piles. Ocean Eng. 2015, 99, 23–33. [Google Scholar] [CrossRef]
  3. Shao, W.; Shi, D.; Jiang, J.; Chen, Y. Time-Dependent Lateral Bearing Behaviour of Corrosion-Damaged RC Pipe Piles in Marine Environments. Constr. Build. Mater. 2017, 157, 676–684. [Google Scholar] [CrossRef]
  4. Poursaee, A.; Ross, B. The Role of Cracks in Chloride-Induced Corrosion of Carbon Steel in Concrete—Review. Corros. Mater. Degrad. 2022, 3, 258–269. [Google Scholar] [CrossRef]
  5. Yin, P.; Wang, K.; Chen, L.; Zhang, Y.; Yang, K.; Wang, J. Horizontal Bearing Capacity and Reliability of Piles in Coastal Soft Soil Considering the Time-Varying Characteristics. J. Mar. Sci. Eng. 2023, 11, 247. [Google Scholar] [CrossRef]
  6. International Navigation Association. Seismic Design Guidelines for Port Structures; Swets & Zeitlinger B.V.: Lisse, The Netherlands, 2001; ISBN 90 265 1818 8. [Google Scholar]
  7. The Overseas Coastal Area Development Institute of Japan. Technical Standards and Commentaries for Port and Harbour Facilities in Japan; Ports and Harbours Bureau, Ministry of Land, Infrastructure, Transport and Tourism (MLIT): Tokyo, Japan, 2020. [Google Scholar]
  8. Zacchei, E.; Lyra, P.H.C.; Stucchi, F.R. Nonlinear Static Analysis of a Pile-Supported Wharf. Rev. Ibracon Estrut. Mater. 2019, 12, 998–1009. [Google Scholar] [CrossRef]
  9. Leonhardt, F. Cracks and Crack Control in Concrete Structures. PCI J. 1988, 33, 124–145. [Google Scholar] [CrossRef]
  10. Chiaramonte, M.M.; Arduino, P.; Lehman, D.E.; Roeder, C.W. Seismic Analyses of Conventional and Improved Marginal Wharves. Earthq. Eng. Struct. Dyn. 2013, 42, 1435–1450. [Google Scholar] [CrossRef]
  11. Su, L.; Wan, H.P.; Lu, J.; Ling, X.; Elgamal, A.; Arulmoli, A.K. Seismic Performance Evaluation of a Pile-Supported Wharf System at Two Seismic Hazard Levels. Ocean Eng. 2021, 219, 108333. [Google Scholar] [CrossRef]
  12. Setiawan, A.F.; Darmawan, M.F.; Ismanti, S.; Sunarso, M.; Adityawarman, G.M. Numerical Model for Investigating Seismic Performance of Prestressed Hollow Concrete (PHC) Piles with Fiber Section Element. E3S Web Conf. 2020, 156, 3007. [Google Scholar] [CrossRef]
  13. Shafieezadeh, A.; DesRoches, R.; Rix, G.J.; Werner, S.D. Seismic Performance of Pile-Supported Wharf Structures Considering Soil-Structure Interaction in Liquefied Soil. Earthq. Spectra. 2012, 28, 729–757. [Google Scholar] [CrossRef]
  14. Kolozvari, K.; Orakcal, K.; Wallace, J.W. New Opensees Models for Simulating Nonlinear Flexural and Coupled Shear-Flexural Behavior of RC Walls and Columns. Comput. Struct. 2018, 196, 246–262. [Google Scholar] [CrossRef]
  15. Kashani, M.M.; Lowes, L.N.; Crewe, A.J.; Alexander, N.A. Computational Modelling Strategies for Nonlinear Response Prediction of Corroded Circular RC Bridge Piers. Adv. Mater. Sci. Eng. 2016, 2016, 2738265. [Google Scholar] [CrossRef]
  16. Feng, D.C.; Xiong, C.Z.; Brunesi, E.; Parisi, F.; Wu, G. Numerical Simulation and Parametric Analysis of Precast Concrete Beam-Slab Assembly Based on Layered Shell Elements. Buildings 2021, 11, 7. [Google Scholar] [CrossRef]
  17. Perea, T.; Leon, R.T. Composite Beam-Columns Performance Based on Nonlinear Fiber and Finite Element Analysis. In Proceedings of the World Conference on Earthquake Engineering (WCEE), Beijing, China, 12–17 October 2008. [Google Scholar]
  18. Schmuhl, D.T.; Loos, S.; Hur, J.; Shafieezadeh, A. Time-Dependent Probabilistic Capacity Degradation Assessment of Prestressed Concrete Piles in Marine Environment. Struct. Infrastruct. Eng. 2018, 14, 1372–1385. [Google Scholar] [CrossRef]
  19. Mirzaeefard, H.; Hariri-Ardebili, M.A.; Mirtaheri, M. Time-Dependent Seismic Fragility Analysis of Corroded Pile-Supported Wharves with Updating Limit States. Soil Dyn. Earthq. Eng. 2021, 142, 106551. [Google Scholar] [CrossRef]
  20. McKenna, F. OpenSees: A Framework for Earthquake Engineering Simulation. Comput. Sci. Eng. 2011, 13, 58–66. [Google Scholar] [CrossRef]
  21. Chiou, J.-S.; Yang, H.-H.; Chen, C.-H. Use of Plastic Hinge Model in Nonlinear Pushover Analysis of a Pile. J. Geotech. Geoenviron. Eng. 2009, 135, 1341–1346. [Google Scholar] [CrossRef]
  22. Wani, F.M.; Vemuri, J.; Rajaram, C.; Babu R, D.V. Effect of Soil Structure Interaction on the Dynamic Response of Reinforced Concrete Structures. Nat. Hazards Res. 2022, 2, 304–315. [Google Scholar] [CrossRef]
  23. Wu, W.; Zhang, Y. A Review of Pile Foundations in Viscoelastic Medium: Dynamic Analysis and Wave Propagation Modeling. Energies 2022, 15, 9432. [Google Scholar] [CrossRef]
  24. Wu, W.; Lu, C.; Chen, L.; Mei, G.; El Naggar, M.H.; Liu, H. Horizontal Vibration Characteristics of Pile Groups in Unsaturated Soil Considering Coupled Pile–Pile Interaction. Ocean Eng. 2023, 281, 115000. [Google Scholar] [CrossRef]
  25. Zhang, Y.; El Naggar, M.H.; Wu, W.; Wang, Z.; Yang, X.; Jiang, G. Dynamic Torsional Impedance of Large-Diameter Pipe Pile for Offshore Engineering: 3D Analytical Solution. Appl. Math. Model. 2022, 111, 664–680. [Google Scholar] [CrossRef]
  26. Zhang, Y.; Di, T.; Hesham El Naggar, M.; Wu, W.; Liu, H.; Jiang, G. Modified Rayleigh-Love Rod Model for 3D Dynamic Analysis of Large-Diameter Thin-Walled Pipe Pile Embedded in Multilayered Soils. Comput. Geotech. 2022, 149, 104853. [Google Scholar] [CrossRef]
  27. Chiou, J.S.; Chiang, C.H.; Yang, H.H.; Hsu, S.Y. Developing Fragility Curves for a Pile-Supported Wharf. Soil Dyn. Earthq. Eng. 2011, 31, 830–840. [Google Scholar] [CrossRef]
  28. Zhang, M.; Liu, R.; Li, Y.; Zhao, G. Seismic Performance of a Corroded Reinforce Concrete Frame Structure Using Pushover Method. Adv. Civ. Eng. 2018, 2018, 7208031. [Google Scholar] [CrossRef]
  29. Yalciner, H.; Sensoy, S.; Eren, O. Effect of Corrosion Damage on the Performance Level of a 25-Year-Old Reinforced Concrete Building. Shock Vib. 2012, 19, 891–902. [Google Scholar] [CrossRef]
  30. Nahavandi, H. Pushover Analysis of Retrofitted Reinforced Concrete Buildings. Ph.D. Thesis, Portland State University, Portland, OR, USA, 2015. [Google Scholar]
  31. American Society of Civil Engineer. FEMA 356—Prestandard and Commentary for the Seismic Rehabilitation of Buildings; Federal Emergency Management Agency (FEMA): Washington, DC, USA, 2000; pp. 1–68. [Google Scholar]
  32. American Society of Civil Engineer. Seismic Evaluation and Retrofit of Existing Buildings (ASCE/SEI 41-13); American Society of Civil Engineers: Virginia, USA, 2014; ISBN 978-0-7844-7791-5. [Google Scholar]
  33. Refani, A.N.; Nagao, T. Corrosion Effects on the Mechanical Properties of Spun Pile Materials. Appl. Sci. 2023, 13, 1507. [Google Scholar] [CrossRef]
  34. Coronelli, D.; Gambarova, P. Structural Assessment of Corroded Reinforced Concrete Beams: Modeling Guidelines. J. Struct. Eng. 2004, 130, 1214–1224. [Google Scholar] [CrossRef]
  35. Shayanfar, M.A.; Barkhordari, M.A.; Ghanooni-Bagha, M. Effect of Longitudinal Rebar Corrosion on the Compressive Strength Reduction of Concrete in Reinforced Concrete Structure. Adv. Struct. Eng. 2016, 19, 897–907. [Google Scholar] [CrossRef]
  36. Presiden Republik Indonesia. Peraturan Pemerintah No 16 Tahun 2021 Tentang Peraturan Pelaksanaan Undang-Undang Nomor 28 Tahun 2002 Tentang Bangunan Gedung; Direktorat Jenderal Perundang-undangan Kementerian Hukum dan HAM Republik Indonesia: Jakarta, Indonesia, 2021. [Google Scholar]
  37. Yoshida, N. Seismic Ground Response Analysis; Springer: Berlin/Heidelberg, Germany, 2015; Volume 36, ISBN 978-94-017-9460-2. [Google Scholar]
  38. BSN. SNI 1726:2019—Tata Cara Perencanaan Ketahanan Gempa Untuk Struktur Bangunan Gedung Dan Non Gedung; Badan Standardisasi Nasional: Jakarta, Indonesia, 2019; ISBN 91.080.01. [Google Scholar]
  39. Almusallam, A.A. Effect of Degree of Corrosion on the Properties of Reinforcing Steel Bars. Constr. Build. Mater. 2001, 15, 361–368. [Google Scholar] [CrossRef]
  40. Du, Y.G.; Clark, L.A.; Chan, A.H.C. Residual Capacity of Corroded Reinforcing Bars. Mag. Concr. Res. 2005, 57, 135–147. [Google Scholar] [CrossRef]
  41. Chung, L.; Jay Kim, J.H.; Yi, S.T. Bond Strength Prediction for Reinforced Concrete Members with Highly Corroded Reinforcing Bars. Cem. Concr. Compos. 2008, 30, 603–611. [Google Scholar] [CrossRef]
  42. Bhargava, K.; Ghosh, A.K.; Mori, Y.; Ramanujam, S. Corrosion-Induced Bond Strength Degradation in Reinforced Concrete-Analytical and Empirical Models. Nucl. Eng. Des. 2007, 237, 1140–1157. [Google Scholar] [CrossRef]
  43. Jeon, C.H.; Lee, J.B.; Lon, S.; Shim, C.S. Equivalent Material Model of Corroded Prestressing Steel Strand. J. Mater. Res. Technol. 2019, 8, 2450–2460. [Google Scholar] [CrossRef]
  44. Stewart, M.G. Spatial Variability of Pitting Corrosion and Its Influence on Structural Fragility and Reliability of RC Beams in Flexure. Struct. Saf. 2004, 26, 453–470. [Google Scholar] [CrossRef]
  45. Byrne, A.; Norton, B.; Holmes, N. State-of-the-Art Review of Cathodic Protection for Reinforced Concrete Structures. Mag. Concr. Res. 2016, 68, 664–677. [Google Scholar] [CrossRef]
  46. PT Wijaya Karya Beton. Wika Beton Brochure—The Precast Concrete Manufacturer; PT Wijaya Karya Beton: Jakarta, Indonesia, 2017. [Google Scholar]
  47. Xi, X.; Yang, S.; Li, C.Q. A Non-Uniform Corrosion Model and Meso-Scale Fracture Modelling of Concrete. Cem. Concr. Res. 2018, 108, 87–102. [Google Scholar] [CrossRef]
  48. Mazzoni, S.; McKenna, F.; Scott, M.H.; Fenves, G.L. Open System for Earthquake Engineering Simulation (OpenSEES) User Command-Language Manual; Pacific Earthquake Engineering Research Center: Berkeley, USA, 2006. [Google Scholar]
  49. Petracca, M.; Candeloro, F.; Camata, G. STKO User Manual; Asdea Software Technology: Pescara, Italy, 2017. [Google Scholar]
  50. Matlock, H. Correlations for Design of Laterally Loaded Piles in Soft Clay. In Proceedings of the Offshore Technology Conference, Houston, TX, USA, 21–23 April 1970. [Google Scholar]
  51. Murchison, J.; O’Neil, M. Evaluation of P-y Relationship in Cohesionless Soils. Proc. Conf. Anal. Des. Pile Found. 1984, 174–213. [Google Scholar]
  52. Isenhower, W.M.; Wang, S. User Manual for LPile 2016; Ensoft Inc.: Austin, TX, USA, 2016. [Google Scholar]
  53. Computer & Structures Inc. CSI Analysis Reference Manual For SAP2000; Computers & Structures Inc.: Berkeley, USA, 2017. [Google Scholar]
  54. Bolander, J.C. Investigation of Torsional Effects on Thirteen-Story Reinforced Concrete Frame-Wall Structure Modeled in ETABS and SAP2000 Using Linear and Nonlinear Static and Dynamic Analyses; University of California: Riverside, CA, USA, 2014; Volume 4. [Google Scholar]
  55. ACI Committee. Building Code Requirements for Structural Concrete (ACI 318-02) and Commentary (ACI 318R-02); American Concrete Institute: Farmington Hills, MI, USA, 2002. [Google Scholar]
  56. Precast Concrete Institute. PCI Design Handbook, 8th ed.; Precast Concrete Institute: Chicago, USA, 2017; ISBN 9780937040874. [Google Scholar]
  57. Xue, W.; Yang, X. Seismic Tests of Precast Concrete, Moment Resisting Frames and Connections. Pci J. 2010, 55, 102–121. [Google Scholar] [CrossRef]
  58. Salihovic, A.; Ademovic, N. Nonlinear Analysis of Reinforced Concrete Frame under Lateral Load. Coupled Syst. Mech. 2018, 7, 281–295. [Google Scholar] [CrossRef]
  59. Zacchei, E.; Lyra, P.H.C.; Stucchi, F.R. Pushover Analysis for Flexible and Semi-Flexible Pile-Supported Wharf Structures Accounting the Dynamic Magnification Factors Due to Torsional Effects. Struct. Concr. 2020, 21, 2669–2688. [Google Scholar] [CrossRef]
  60. Beer, F.P.; Johnston, E.; Russel, J.; DeWolf, J.T.; Mazurek, D.F. Mechanics of Materials; McGraw-Hill: New York, USA, 2012; Volume 6, ISBN 978-0-07-338028-5. [Google Scholar]
  61. Boyke, C.; Refani, A.N.; Nagao, T. Site-Specific Earthquake Ground Motions for Seismic Design of Port Facilities in Indonesia. Appl. Sci. 2022, 12, 1963. [Google Scholar] [CrossRef]
  62. Chadwell, C.B.; Imbsen, R.A. XTRACT: A Tool for Axial Force—Ultimate Curvature Interactions. In Structures 2004: Building on the Past, Securing the Future; American Society of Civil Engineers: Virginia, USA, 2004; pp. 1–9. [Google Scholar] [CrossRef]
Figure 1. PSW configuration. (a) Plan view; (b) side view of PSW with batter pile; (c) side view of PSW with vertical pile.
Applsci 13 10936 g001
Figure 2. Spun pile cross-sections. (a) Pile A with infilled concrete; (b) Pile A; (c) Piles B and C with infilled concrete; (d) Piles B and C.
Applsci 13 10936 g002aApplsci 13 10936 g002b
Figure 3. Rust thickness distribution of PC bar.
Applsci 13 10936 g003
Figure 4. Fiber discretization of spun pile section in FB-FEA.
Applsci 13 10936 g004
Figure 5. p–y curve. (a) Pile A (Ø700 mm vertical); (b) Pile B (Ø600 mm vertical); (c) Pile C (Ø600 mm battered).
Applsci 13 10936 g005
Figure 6. 2D FB-FEA models. (a) PSW-A; (b) PSW-B.
Applsci 13 10936 g006
Figure 7. Typical nonlinear deformation curve of the spun pile. (a) FA-1; (b) FA-2.
Applsci 13 10936 g007
Figure 8. Moment–curvature relationship of the spun pile. (a) Pile A with infilled concrete; (b) Pile A; (c) Piles B and C with infilled concrete; (d) Piles B and C.
Applsci 13 10936 g008aApplsci 13 10936 g008b
Figure 9. Loading schematic of non-linear static pushover analysis. (a) PSW-A; (b) PSW-B.
Applsci 13 10936 g009
Figure 10. Corrosion-based bending stiffness reduction factor. (a) Pile A; (b) Piles B and C.
Applsci 13 10936 g010
Figure 11. Site-specific SA for port facilities in Indonesia (site class SD).
Applsci 13 10936 g011
Figure 12. P-M capacity curves of corroded Pile A with infilled concrete. (a) FB-FEA; (b) FA-1; (c) FA-2.
Applsci 13 10936 g012
Figure 13. P-M capacity curves of corroded Pile A. (a) FB-FEA; (b) FA-1; (c) FA-2.
Applsci 13 10936 g013
Figure 14. P-M capacity curves of corroded Piles B and C with infilled concrete. (a) FB-FEA; (b) FA-1; (c) FA-2.
Applsci 13 10936 g014
Figure 15. P-M capacity curves of corroded Piles B and C. (a) FB-FEA; (b) FA-1; (c) FA-2.
Applsci 13 10936 g015
Figure 16. Distribution of plastic hinges resulting from FB-FEA, FA-1, and FA-2. (a) PSW-A; (b) PSW-B.
Applsci 13 10936 g016
Figure 17. Load–displacement curves of corroded PSW-A. (a) FB-FEA; (b) FA-1; (c) FA-2.
Applsci 13 10936 g017
Figure 18. Load–displacement curves of corroded PSW-B. (a) FB-FEA; (b) FA-1; (c) FA-2.
Applsci 13 10936 g018
Figure 19. PSW-A load–displacement curve comparison for various corrosion degrees. (a) ψ = 0.00 % ; (b) ψ = 4 . 68 % ; (c) ψ = 9 . 67 % ; (d) ψ = 12 . 20 % ; (e) ψ = 14 . 74 % ; (f) ψ = 18.56 % .
Applsci 13 10936 g019
Figure 20. PSW-B load–displacement curve comparison for various corrosion degrees. (a) ψ = 0.00 % ; (b) ψ = 4 . 68 % ; (c) ψ = 9 . 67 % ; (d) ψ = 12 . 20 % ; (e) ψ = 14 . 74 % ; (f) ψ = 18.56 % .
Applsci 13 10936 g020
Table 1. Initial material properties of PSWs.
Material Properties
fcoCover concrete compressive strength (MPa)52
εcoStrain at cover concrete peak strength0.00275
fccCore concrete compressive strength (MPa)53.95
εccStrain at core concrete peak strength0.00323
fcDeck and infilled concrete compressive strength (MPa)30
εcStrain at deck and infilled concrete peak strength0.00275
fy-pcPC bar yield strength (MPa)1275
fu-pcPC bar ultimate strength (MPa)1420
EsPC bar elastic modulus (MPa)190,000
σiniPC bar initial stress (MPa)781
fy-inInfilled concrete rebar yield strength (MPa)400
fu-inInfilled concrete rebar ultimate strength (MPa)620
EinInfilled concrete rebar elastic modulus (MPa)200,000
Table 2. Soil properties.
Layer CodeN-SPTLayer Thickness (m)Soil TypeSpecific Gravity (GS)Water Content Wn (%)Unit Weight γn (kN/m3)Liquid Limit
LL (%)
Plastic Limit
PL (%)
Friction Angle ϕ (°)Cohesion
c (kN/m2)
Shear Wave
Velocity
Vs (m/s)
CL012–43Very Soft Clay2.61461.2410.0778.7535.28641.19125.99
CL025–69Soft Clay2.62357.6810.3376.2434.14742.22170.48
SS0311–194Silty Sand2.65646.210.75--22-217.94
SS0428–334Medium Sand2.66315.7211.09--30-249.76
SS0535–6020Dense Sand2.66114.3611.89--34-285.47
Table 3. Nonlinear modeling parameters used in FA-1 models.
PointPile A with Infilled ConcretePile APile B&C with Infilled ConcretePile B&C
Bending MomentM/MyϕBending MomentM/MyϕBending MomentM/MyϕBending MomentM/Myϕ
(kN·m)(rad)(kN·m)(rad)(kN·m)(rad)(kN·m)(rad)
I0.000.000.00000.000.000.00000.000.000.00000.000.000.0000
II712.011.000.0014566.001.000.0015552.171.000.0016468.961.000.0017
III783.211.100.0330622.591.100.0330607.391.100.0330515.851.100.0330
IV156.640.200.0333124.520.220.0333121.480.220.0333103.170.230.0333
V156.640.200.0535124.520.220.0535121.480.220.0535103.170.230.0535
Table 4. Nonlinear modeling parameters used in FA-2 models.
PointPile A with Infilled ConcretePile APile B&C with Infilled ConcretePile B&C
Bending MomentM/MyϕBending MomentM/MyϕBending MomentM/MyϕBending MomentM/Myϕ
(kN·m)(rad)(kN·m)(rad)(kN·m)(rad)(kN·m)(rad)
I0.000.000.00000.000.000.00000.000.000.00000.000.000.0000
II706.361.000.0013560.391.000.0013547.791.000.0014457.801.000.0015
III882.951.250.0136711.701.270.0119684.741.250.0103581.411.270.0114
IV750.511.060.0258604.941.080.0225582.031.060.0192494.201.080.0212
V750.511.060.0613604.941.080.0613582.031.060.0613494.201.080.0613
Table 5. Bending stiffness reduction factor of the corroded spun pile.
Pile Corrosion DegreeRust Thickness of PC Bar, di (mm)FB-FEAFA-1FA-2
ηηηsp
Pile A0.00%0.0001.0001.0001.000
4.68%0.1970.9820.7400.977
9.67%0.4970.9600.5900.951
12.20%0.6690.9380.5700.927
14.74%0.8520.8850.5500.882
18.56%1.1440.7890.5300.778
Piles B and C0.00%0.0001.0001.0001.000
4.68%0.1970.9990.7400.990
9.67%0.4970.9740.5900.964
12.20%0.6690.9500.5700.939
14.74%0.8520.9020.5500.897
18.56%1.1440.7990.5300.788
Table 6. Natural period of corroded PSWs.
Exposure Time (Years)Corrosion DegreePSW-APSW-B
Natural Period (s)Natural Period (s)
FB-FEAFA-1FA-2FB-FEAFA-1FA-2
00.00%1.39151.39161.39161.40191.40181.4018
204.68%1.39381.53561.39641.40611.50011.4087
409.67%1.41431.63231.41611.42421.58181.4260
5012.20%1.42111.64791.42291.44761.59601.4508
6014.74%1.47721.66431.47441.48151.60851.4853
7518.56%1.58521.68131.58541.60211.62401.6077
Table 7. The inertial force of corroded PSWs.
Corrosion DegreePSW-APSW-B
Total Mass (kN)Fi (kN)Total Mass (kN)Fi (kN)
FB-FEAFA-1FA-2FB-FEAFA-1FA-2
0.00%1742.921068.821068.681068.681816.601103.981104.031104.03
4.68%1066.64949.011064.251099.921017.211097.46
9.67%1047.89882.621046.301082.96954.781081.32
12.20%1041.78872.791040.211061.84944.781058.97
14.74%994.14862.68996.411032.59936.031029.41
18.56%913.77852.43913.62940.50925.47936.56
Table 8. Parameters for the P–M curves of the non-corroded spun piles.
PileMaximum Compression Force (kN)Maximum Tension Force (kN)Maximum
Bending Moment (kN·m)
Pile A with infilled concrete
FB-FEA14,303.913560.681250.46
FA-114,378.363663.611252.96
FA-214,321.073649.011251.96
Pile A
FB-FEA8699.672595.58961.01
FA-18755.842587.32962.84
FA-28712.282578.05962.07
Piles B and C with infilled concrete
FB-FEA10,820.783560.68826.93
FA-110,878.313580.29828.67
FA-210,834.973564.92828.00
Piles B and C
FB-FEA6713.322595.58654.86
FA-16754.472691.66655.46
FA-26720.862678.26654.94
Table 9. P–M capacity of the corroded spun piles.
PileCorrosion Degree (%)Maximum Compression Force (kN)Maximum Tension Force (kN)Maximum
Bending Moment (kN·m)
Pile A with infilled concrete0.00%14,303.913560.681250.46
4.68%14,027.563453.431231.68
9.67%13,307.743332.611179.88
12.20%12,273.773267.171106.59
14.74%9667.493198.31924.13
18.56%6157.753088.70664.42
Pile A 0.00%8699.672595.58961.01
4.68%8565.062546.50946.71
9.67%8142.482491.21907.45
12.20%7486.242461.27849.57
14.74%7338.262429.75703.83
18.56%3501.192379.59495.68
Piles B and C with infilled concrete0.00%10,820.783560.68826.93
4.68%10,607.303453.43815.47
9.67%10,062.263332.61784.35
12.20%9286.793267.17739.43
14.74%7338.263198.31628.43
18.56%4710.833088.70464.74
Piles B and C 0.00%6713.322595.58654.86
4.68%6533.562546.50643.04
9.67%6214.062491.21618.25
12.20%5709.992461.27582.04
14.74%4397.512429.75489.03
18.56%2628.922379.59352.00
Table 10. Comparison of pushover analysis results.
Corrosion
Degree
PSW-APSW-B
Load Capacity (kN)Load Capacity (kN)
FB-FEAFA-1FA-2FB-FEAFA-1FA-2
0.00%689.05635.97687.75635.20600.31636.32
4.68%666.18606.85664.87605.74568.39604.63
9.67%632.89562.82630.84578.03527.21576.32
12.20%611.74542.64609.76557.93495.52555.87
14.74%579.56513.07577.69527.06462.89525.13
18.56%537.06469.08535.36481.14422.01479.02
Disclaimer/Publisher’s Note: The statements, opinions and data contained in all publications are solely those of the individual author(s) and contributor(s) and not of MDPI and/or the editor(s). MDPI and/or the editor(s) disclaim responsibility for any injury to people or property resulting from any ideas, methods, instructions or products referred to in the content.

