
Structural, Dielectric, and Mechanical Properties of High-Content Cubic Zirconia Ceramics Obtained via Solid-State Synthesis

 ,
,  , and
, and
Abstract
:1. Introduction
2. Experimental Section
3. Results and Discussion
4. Conclusions
Author Contributions
Funding
Institutional Review Board Statement
Informed Consent Statement
Data Availability Statement
Conflicts of Interest
References
- Mistarihi, Q.M.; Raj, V.; Kim, J.H.; Ryu, H.J. Thermal Conductivity of Mo-Reinforced ZrO2 Composites Fabricated by Spark Plasma Sintering for Inert Matrix Fuels. Mater. Des. 2017, 134, 476–485. [Google Scholar] [CrossRef]
- Lemaignan, C.; Niepce, J. Chapter 13. Nuclear Ceramics: Fuels, Absorbers and Inert Matrices. In Ceramic Materials: Processes, Properties and Applications; Boch, P., Niepce, J., Eds.; John Wiley & Sons: Hoboken, NJ, USA, 2007. [Google Scholar] [CrossRef]
- Matzke, H.; Rondinella, V.V.; Wiss, T. Materials Research on Inert Matrices: A Screening Study. J. Nucl. Mater. 1999, 274, 47–53. [Google Scholar] [CrossRef]
- Nandi, C.; Grover, V.; Bhandari, K.; Bhattacharya, S.; Mishra, S.; Banerjee, J.; Prakash, A.; Tyagi, A.K. Exploring YSZ/ZrO2–PuO2 Systems: Candidates for Inert Matrix Fuel. J. Nucl. Mater. 2018, 508, 82–91. [Google Scholar] [CrossRef]
- Kulyk, V.; Duriagina, Z.; Kostryzhev, A.; Vasyliv, B.; Marenych, O. Effects of Sintering Temperature and Yttria Content on Microstructure, Phase Balance, Fracture Surface Morphology, and Strength of Yttria-Stabilized Zirconia. Appl. Sci. 2022, 12, 11617. [Google Scholar] [CrossRef]
- Sivaperumal, V.R.; Mani, R.; Polisetti, V.; Aruchamy, K.; Oh, T. Synthesis of Hydroxyapatite (HAp)-Zirconia Nanocomposite Powder and Evaluation of Its Biocompatibility: An In Vitro Study. Appl. Sci. 2022, 12, 11056. [Google Scholar] [CrossRef]
- Chee Hon Cheong, A.; Sivanesan, S. The Application of Yttria-Stabilized Zirconia (YSZ). In Zirconia–New Advances, Structure, Fabrication and Applications [Working Title]; IntechOpen Limited: London, UK, 2023. [Google Scholar] [CrossRef]
- Poznyak, A.; Pligovka, A.; Salerno, M. Anodizing of Hydrogenated Titanium and Zirconium Films. Materials 2021, 14, 7490. [Google Scholar] [CrossRef]
- Garvie, R.C.; Hannink, R.H.; Pascoe, R.T. Ceramic Steel? In Sintering Key Papers; Springer: Dordrecht, The Netherlands, 1990; pp. 253–257. [Google Scholar] [CrossRef]
- Chevalier, J.; Gremillard, L.; Virkar, A.V.; Clarke, D.R. The Tetragonal-Monoclinic Transformation in Zirconia: Lessons Learned and Future Trends. J. Am. Ceram. Soc. 2009, 92, 1901–1920. [Google Scholar] [CrossRef]
- Arnold, B. Zircon, Zirconium, Zirconia—Similar Names, Different Materials; Springer: Berlin/Heidelberg, Germany, 2022; ISBN 978-3-662-64268-9. [Google Scholar]
- Drazin, J.W.; Castro, R.H.R. Phase Stability in Nanocrystals: A Predictive Diagram for Yttria–Zirconia. J. Am. Ceram. Soc. 2015, 98, 1377–1384. [Google Scholar] [CrossRef]
- Simpson, L.A.; Carter, R.E. Oxygen Exchange and Diffusion in Calcia-Stabilized Zirconia. J. Am. Ceram. Soc. 1966, 49, 139–144. [Google Scholar] [CrossRef]
- Cales, B.; Baumard, J.F. Oxygen Semipermeability and Electronic Conductivity in Calcia-Stabilized Zirconia. J. Mater. Sci. 1982, 17, 3243–3248. [Google Scholar] [CrossRef]
- Nakamura, A.; Wagner, J.B. Defect Structure, Ionic Conductivity, and Diffusion in Calcia-Stabilized Zirconia. J. Electrochem. Soc. 1980, 127, 2325–2333. [Google Scholar] [CrossRef]
- Kumar, A.; Kumar, P.; Dhaliwal, A.S. Phase Transformation Behavior of Ca-Doped Zirconia Sintered at Different Temperatures. J. Korean Ceram. Soc. 2022, 59, 370–382. [Google Scholar] [CrossRef]
- Kostishin, V.G.; Shakirzyanov, R.I.; Nalogin, A.G.; Shcherbakov, S.V.; Isaev, I.M.; Nemirovich, M.A.; Mikhailenko, M.A.; Korobeinikov, M.V.; Mezentseva, M.P.; Salogub, D.V. Electrical and Dielectric Properties of Yttrium–Iron Ferrite Garnet Polycrystals Grown by the Radiation–Thermal Sintering Technology. Phys. Solid State 2021, 63, 435–441. [Google Scholar] [CrossRef]
- Isaev, I.M.; Kostishin, V.G.; Korovushkin, V.V.; Salogub, D.V.; Shakirzyanov, R.I.; Timofeev, A.V.; Mironovich, A.Y. Magnetic and Radio-Absorbing Properties of Polycrystalline Li0.33Fe2.29Zn0.21Mn0.17O4 Spinel Ferrite. Tech. Phys. 2021, 66, 1216–1220. [Google Scholar] [CrossRef]
- Lira, C.; Fredel, M.C.; da Silveria, M.D.; Alarcon, O.E. Effect of Carbonates on Firing Shrinkage and on Moisture Expansion of Porous Ceramic Tiles. In Proceedings of the V. World Congress on Ceramic Tile Quality-Qualicer, Castellon, Spain, 8–11 March 1998; Volume 98, pp. 101–106. [Google Scholar] [CrossRef]
- Aripin, H.; Priatna, E.; Dedi, D.; Sudiana, I.N.; Sabchevski, S. Characterization of Ceramic Membrane Based on Calcium Carbonate from Onyx Stone and Its Application for Coconut Sap Treatment. Int. J. Eng. 2022, 35, 300–306. [Google Scholar] [CrossRef]
- Simão, L.; Montedo, O.R.K.; Caldato, R.F.; Innocentini, M.D.d.M.; Paula, M.M.d.S.; Angioletto, E.; Dal-Bó, A.G.; da Silva, L. Porous Ceramic Structures Obtained from Calcium Carbonate as Pore Generating Agent. Mater. Sci. Forum 2014, 775–776, 755–760. [Google Scholar] [CrossRef]
- Kozlovskiy, A.L.; Borgekov, D.B.; Zdorovets, M.V.; Kenzhina, I.E.; Shlimas, D.I. Study of Radiation Damage Kinetics in Dispersed Nuclear Fuel on Zirconium Dioxide Doped with Cerium Dioxide. J. Compos. Sci. 2023, 7, 277. [Google Scholar] [CrossRef]
- DIN EN ISO 6507-2:2018; Metallic Materials—Vickers Hardness Test—Part 2: Verification and Calibration of Testing Machines (ISO 6507–2:2018). DIN Deutsches Institut für Normung e.V.: Berlin, Germany, 2018.
- ISO 14705:2016; Fine Ceramics (Advanced Ceramics, Advanced Technical Ceramics)—Test Method for Hardness of Monolithic Ceramics at Room Temperature. ISO: Geneva, Switzerland, 2016.
- Yin, Y.; Xu, J.; Ji, M.; Li, L.; Chen, M. A Critical Review on Sintering and Mechanical Processing of 3Y-TZP Ceramics. Ceram. Int. 2023, 49, 1549–1571. [Google Scholar] [CrossRef]
- Doebelin, N.; Kleeberg, R. Profex: A Graphical User Interface for the Rietveld Refinement programBGMN. J. Appl. Crystallogr. 2015, 48, 1573–1580. [Google Scholar] [CrossRef] [PubMed]
- Boch, P. Ceramic Materials: Processes, Properties and Applications; Nièpce, J.-C., Ed.; John Wiley & Sons: Hoboken, NJ, USA, 2007; ISBN 978-1-905209-23-1. [Google Scholar]
- Pang, E.L.; McCandler, C.A.; Schuh, C.A. Reduced Cracking in Polycrystalline ZrO2-CeO2 Shape-Memory Ceramics by Meeting the Cofactor Conditions. SSRN Electron. J. 2019, 177, 230–239. [Google Scholar] [CrossRef]
- Duwez, P.; Odell, F.; Brown, F.H. Stabilization of Zirconia with Calcia and Magnesia. J. Am. Ceram. Soc. 1952, 35, 107–113. [Google Scholar] [CrossRef]
- Noguchi, T.; Mizuno, M.; Conn, W.M. Fundamental Research in Refractory System with a Solar Furnace—ZrO2 CaO System. Sol. Energy 1967, 11, 145–152. [Google Scholar] [CrossRef]
- Nath, D.; Singh, F.; Das, R. X-Ray Diffraction Analysis by Williamson-Hall, Halder-Wagner and Size-Strain Plot Methods of CdSe Nanoparticles—A Comparative Study. Mater. Chem. Phys. 2020, 239, 122021. [Google Scholar] [CrossRef]
- Mokrushin, A.S.; Simonenko, E.P.; Simonenko, N.P.; Bukunov, K.A.; Sevastyanov, V.G.; Kuznetsov, N.T. Microstructure, Phase Composition, and Gas-Sensing Properties of Nanostructured ZrO2-xY2O3 Thin Films and Powders Obtained by the Sol-Gel Method. Ionics 2018, 25, 1259–1270. [Google Scholar] [CrossRef]
- Tarrida, M.; Larguem, H.; Madon, M. Structural Investigations of (Ca,Sr)ZrO3 and Ca(Sn,Zr)O3 Perovskite Compounds. Phys. Chem. Miner. 2009, 36, 403–413. [Google Scholar] [CrossRef]
- Rueden, C.T.; Schindelin, J.; Hiner, M.C.; DeZonia, B.E.; Walter, A.E.; Arena, E.T.; Eliceiri, K.W. ImageJ2: ImageJ for the next Generation of Scientific Image Data. BMC Bioinform. 2017, 18, 529. [Google Scholar] [CrossRef]
- German, R.M. Sintering Theory and Practice; Wiley-VCH: Weinheim, Germany, 1996; ISBN 978-0-471-05786-4. [Google Scholar]
- Burke, J.E.; Fulrath, R.M.; Pask, J.A. Ceramic Microstructures; John Wiley & Sons: New York, NY, USA, 1968; ISBN 978-0-471-28720-9. [Google Scholar]
- Chauhan, L.; Shukla, A.K.; Sreenivas, K. Dielectric and Magnetic Properties of Nickel Ferrite Ceramics Using Crystalline Powders Derived from DL Alanine Fuel in Sol–Gel Auto-Combustion. Ceram. Int. 2015, 41, 8341–8351. [Google Scholar] [CrossRef]
- Liu, P.; Yao, Z.; Zhou, J.; Yang, Z.; Kong, L.B. Small Magnetic Co-Doped NiZn Ferrite/Graphene Nanocomposites and Their Dual-Region Microwave Absorption Performance. J. Mater. Chem. C 2016, 4, 9738–9749. [Google Scholar] [CrossRef]
- Tanrıverdi, E.E.; Uzumcu, A.T.; Kavas, H.; Demir, A.; Baykal, A. Conductivity Study of Polyaniline-Cobalt Ferrite (PANI-CoFe2O4) Nanocomposite. Nano-Micro Lett. 2011, 3, 99–107. [Google Scholar] [CrossRef]
- Huang, X.; Wei, J.; Zhang, Y.; Qian, B.; Jia, Q.; Liu, J.; Zhao, X.; Shao, G. Ultralight Magnetic and Dielectric Aerogels Achieved by Metal–Organic Framework Initiated Gelation of Graphene Oxide for Enhanced Microwave Absorption. Nano-Micro Lett. 2022, 14, 107. [Google Scholar] [CrossRef]
- Sivakumar, N.; Narayanasamy, A.; Ponpandian, N.; Govindaraj, G. Grain Size Effect on the Dielectric Behavior of Nanostructured Ni0.5Zn0.5Fe2O4. J. Appl. Phys. 2007, 101, 084116. [Google Scholar] [CrossRef]
- Ctibor, P.; Petrášek, J.; Sedláček, J.; Neufuss, K. Dielectric Properties of CaZrO3 Coatings Made by Plasma Spraying and Bulks Fired by Spark Plasma Sintering. Mater. Res. Bull. 2020, 124, 110775. [Google Scholar] [CrossRef]
- Gurevich, V.L.; Tagantsev, A.K. Intrinsic Dielectric Loss in Crystals. Adv. Phys. 1991, 40, 719–767. [Google Scholar] [CrossRef]
- Thompson, D.P.; Dickins, A.M.; Thorp, J.S. The Dielectric Properties of Zirconia. J. Mater. Sci. 1992, 27, 2267–2271. [Google Scholar] [CrossRef]
- Hannay, J.H. The Clausius-Mossotti Equation: An Alternative Derivation. Eur. J. Phys. 1983, 4, 141–143. [Google Scholar] [CrossRef]
- Lanagan, M.T.; Yamamoto, J.K.; Bhalla, A.; Sankar, S.G. The Dielectric Properties of Yttria-Stabilized Zirconia. Mater. Lett. 1989, 7, 437–440. [Google Scholar] [CrossRef]
- Acosta, M.; Novak, N.; Rojas, V.; Patel, S.; Vaish, R.; Koruza, J.; Rossetti, G.A.; Rödel, J. BaTiO3-Based Piezoelectrics: Fundamentals, Current Status, and Perspectives. Appl. Phys. Rev. 2017, 4, 041305. [Google Scholar] [CrossRef]
- Wang, M.; Pan, N. Predictions of Effective Physical Properties of Complex Multiphase Materials. Mater. Sci. Eng. R Rep. 2008, 63, 1–30. [Google Scholar] [CrossRef]
- Lee, H.; Kim, J.R.; Lanagan, M.J.; Trolier-McKinstry, S.; Randall, C.A. High-Energy Density Dielectrics and Capacitors for Elevated Temperatures: Ca(Zr,Ti)O3. J. Am. Ceram. Soc. 2013, 96, 1209–1213. [Google Scholar] [CrossRef]
- Lee, W.S.; Su, C.Y.; Lee, Y.C.; Lin, S.P.; Yang, T. Effects of Dopant on the Dielectric Properties of CaZrO3 Ceramic Sintered in a Reducing Atmosphere. Jpn. J. Appl. Phys. 2006, 45, 5853. [Google Scholar] [CrossRef]
- Xing, C.; Wang, J.; Li, J.; Shi, F. Precise Prediction of Dielectric Property for CaZrO3 Ceramic. J. Adv. Dielectr. 2018, 08, 1850029. [Google Scholar] [CrossRef]
- Sanesi, M.; Cremante, G.; Pizzini, S.; Wagner, V. On the Dielectric Constant of Zirconia and Lime-Zirconia. Z. Naturforschung A 1971, 26, 159–164. [Google Scholar] [CrossRef]
- Abyzov, A.M. Aluminum Oxide and Alumina Ceramics (Review). Part 1. Properties of Al2O3 and Commercial Production of Dispersed Al2O3. Refract. Ind. Ceram. 2019, 60, 24–32. [Google Scholar] [CrossRef]
- Amin, A.; Mumu, H.T.; Sarker, S.; Alam, Z.; Gafur, M.A. Effects of Sintering Temperature and Zirconia Content on the Mechanical and Microstructural Properties of MgO, TiO2 and CeO2 Doped Alumina–Zirconia (ZTA) Ceramic. J. Korean Ceram. Soc. 2022, 60, 141–154. [Google Scholar] [CrossRef]
- Alfahed, B.; Alayad, A. The Effect of Sintering Temperature on Vickers Microhardness and Flexural Strength of Translucent Multi-Layered Zirconia Dental Materials. Coatings 2023, 13, 688. [Google Scholar] [CrossRef]
- Rejab, N.A.; Azhar, A.Z.A.; Ratnam, M.M.; Ahmad, Z.A. The Relationship between Microstructure and Fracture Toughness of Zirconia Toughened Alumina (ZTA) Added with MgO and CeO2. Int. J. Refract. Met. Hard Mater. 2013, 41, 522–530. [Google Scholar] [CrossRef]


| Sample | Monoclinic Phase | Cubic Phase | |||||||
|---|---|---|---|---|---|---|---|---|---|
| a, Å | b, Å | c, Å | β, ° | V, Å3 | XRD Density, g/cm3 | a, Å | V, Å3 | XRD Density, g/cm3 | |
| ZrO2 | 5.1509 | 5.2060 | 5.3215 | 99.22 | 140.855 | 5.810 | - | - | - |
| 0.05 | 5.1537 | 5.2044 | 5.3191 | 99.22 | 140.825 | 5.811 | 5.1272 | 134.785 | 6.072 |
| 0.10 | 5.1468 | 5.1973 | 5.3199 | 99.21 | 140.469 | 5.826 | 5.1292 | 134.943 | 6.014 |
| 0.15 | 5.1367 | 5.1993 | 5.3264 | 99.21 | 140.420 | 5.828 | 5.1381 | 135.646 | 6.033 |
| Sample | Cubic Phase | Perovskite Phase | ||||||
|---|---|---|---|---|---|---|---|---|
| a, Å | V, Å3 | XRD Density, g/cm3 | a, Å | b, Å | c, Å | V, Å3 | XRD Density, g/cm3 | |
| 0.20 | 5.13707 | 135.565 | 6.037 | 5.6001 | 5.7526 | 8.0157 | 258.2269 | 4.612 |
| 0.25 | 5.1411 | 135.884 | 6.022 | 5.5940 | 5.7561 | 8.0174 | 258.1573 | 4.613 |
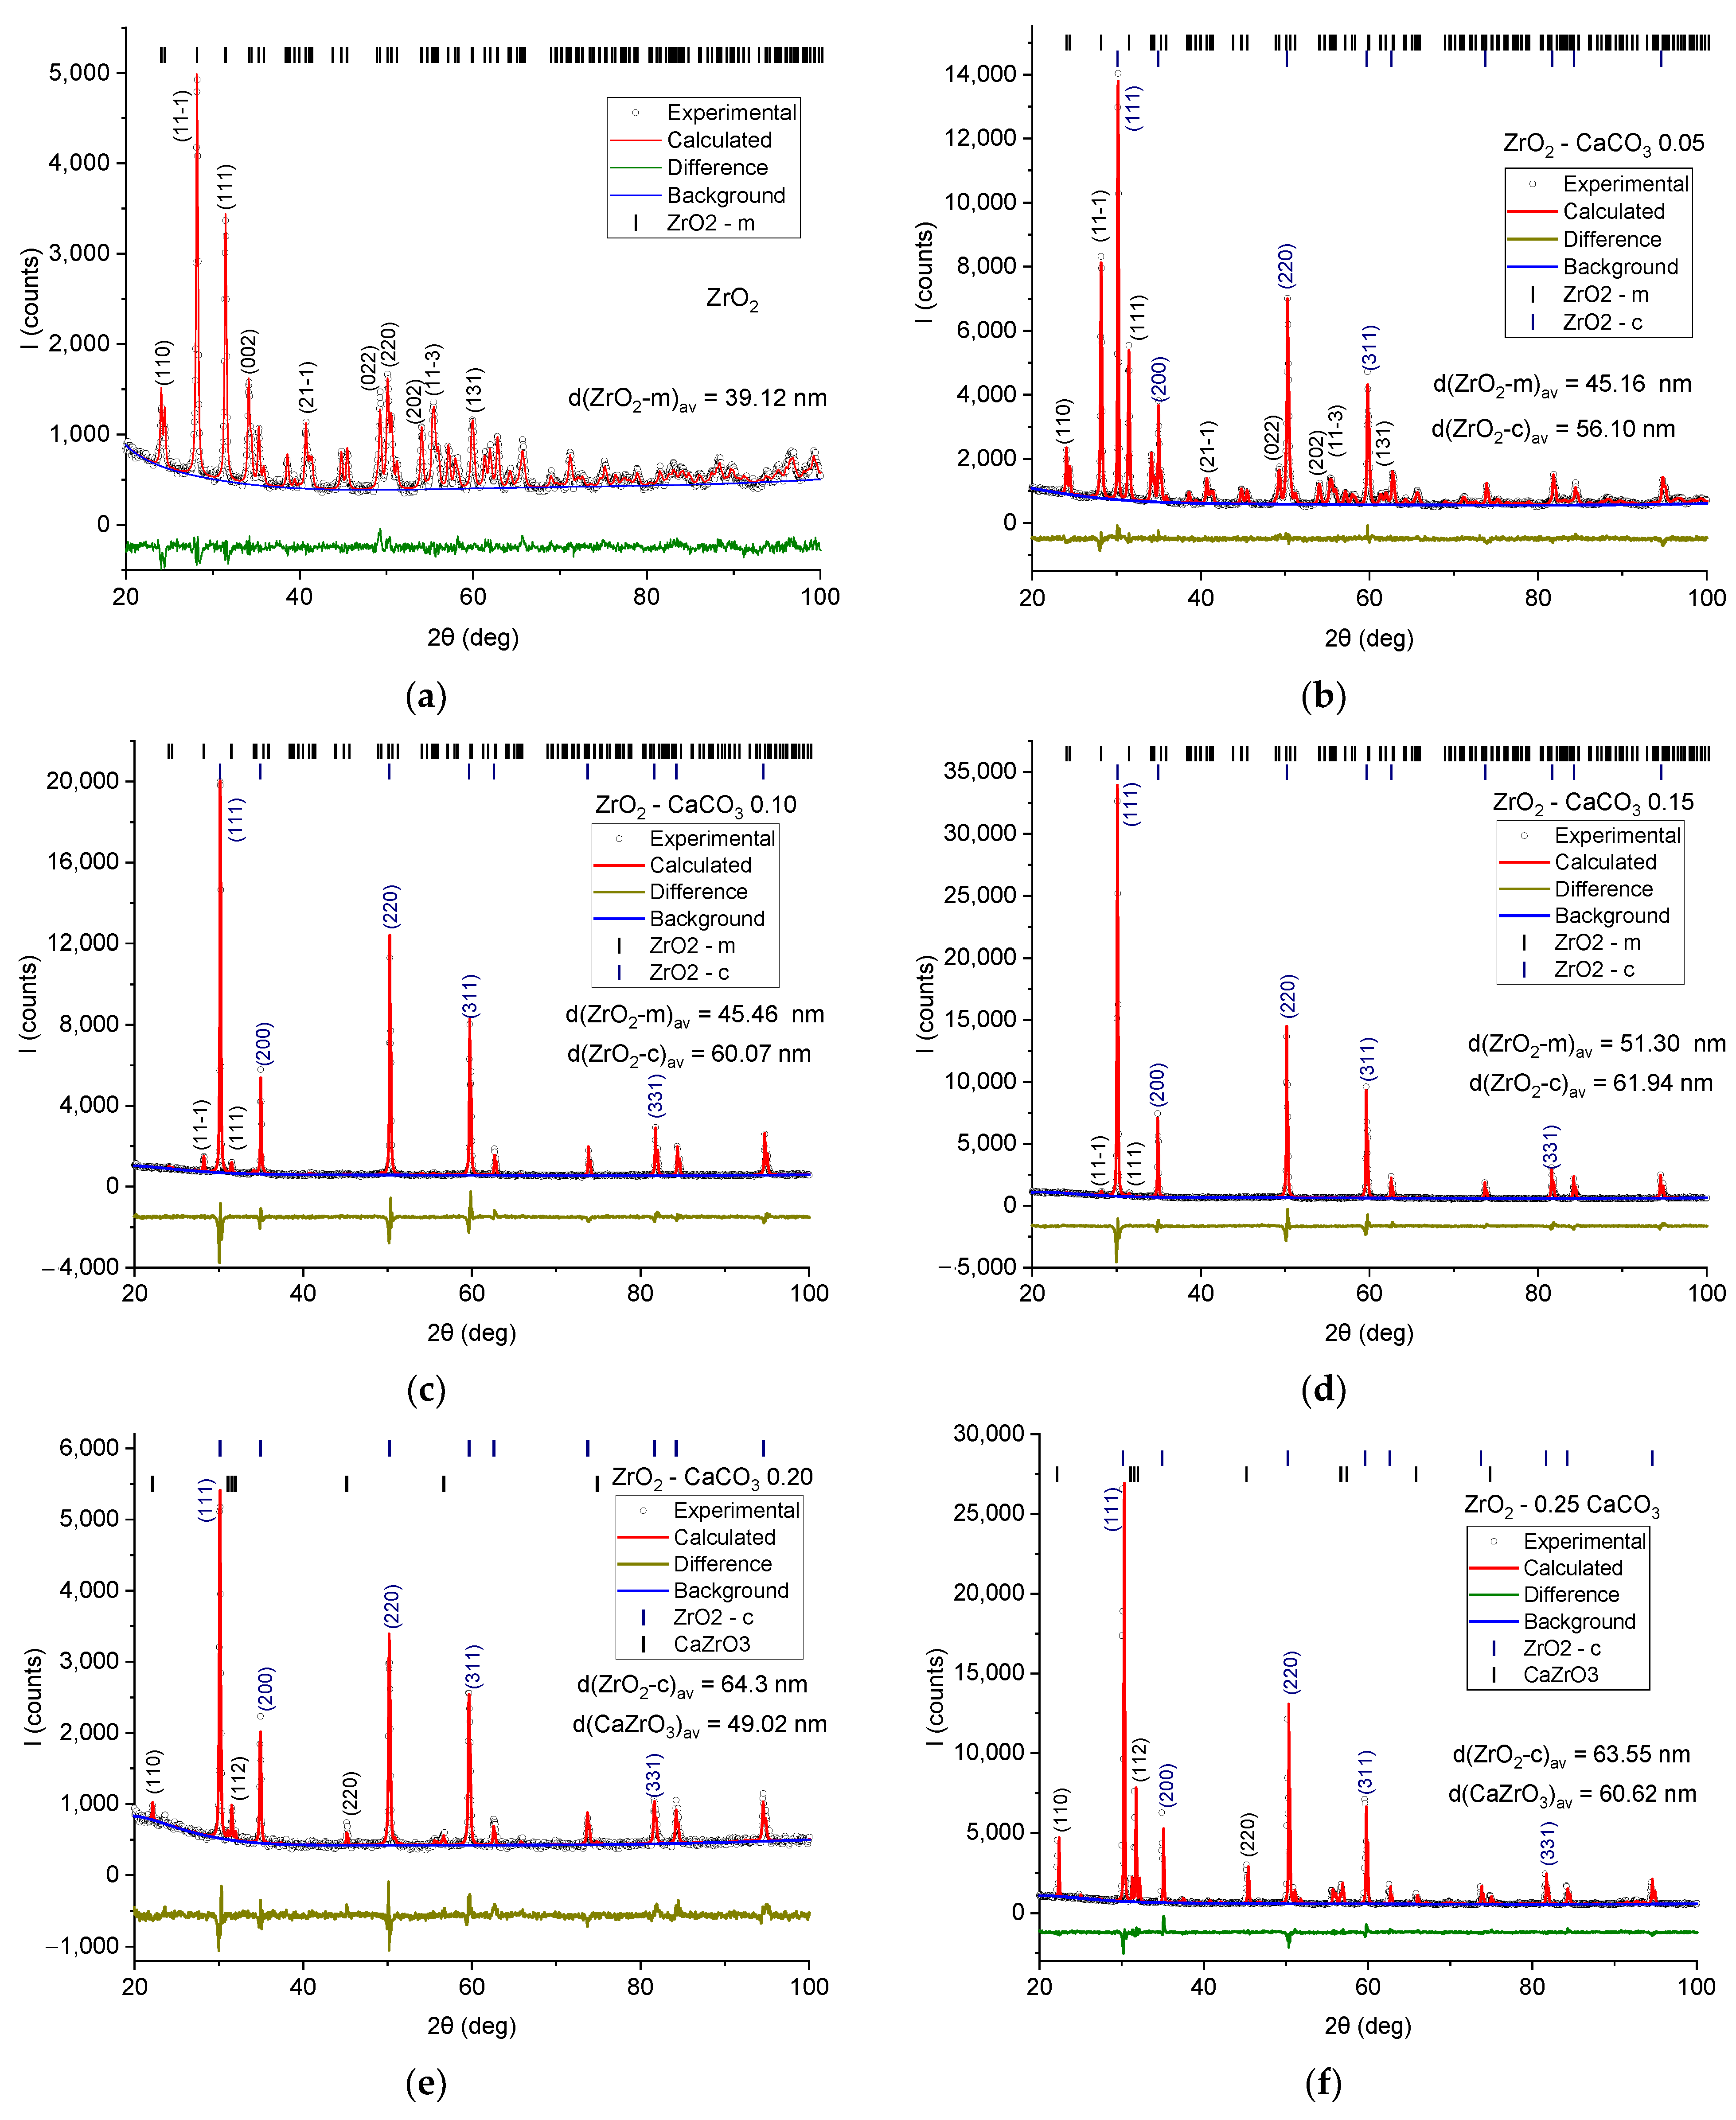
| Sample | Rexp | Rwp | GOF | χ2 | Phase Composition, % | ||
|---|---|---|---|---|---|---|---|
| ZrO2-m | ZrO2-c | CaZrO3 | |||||
| ZrO2 | 4.02 | 6.07 | 1.51 | 2.28 | 100 | 0 | 0 |
| 0.05 | 3.45 | 4.55 | 1.32 | 1.74 | 63.45 | 36.55 | 0 |
| 0.10 | 3.77 | 6.36 | 1.69 | 2.85 | 8.75 | 91.25 | 0 |
| 0.15 | 3.63 | 5.85 | 1.61 | 2.60 | 2.82 | 97.18 | 0 |
| 0.20 | 4.32 | 6.78 | 1.57 | 2.46 | 0 | 88.60 | 11.40 |
| 0.25 | 3.69 | 5.51 | 1.49 | 2.23 | 0 | 64.58 | 34.42 |
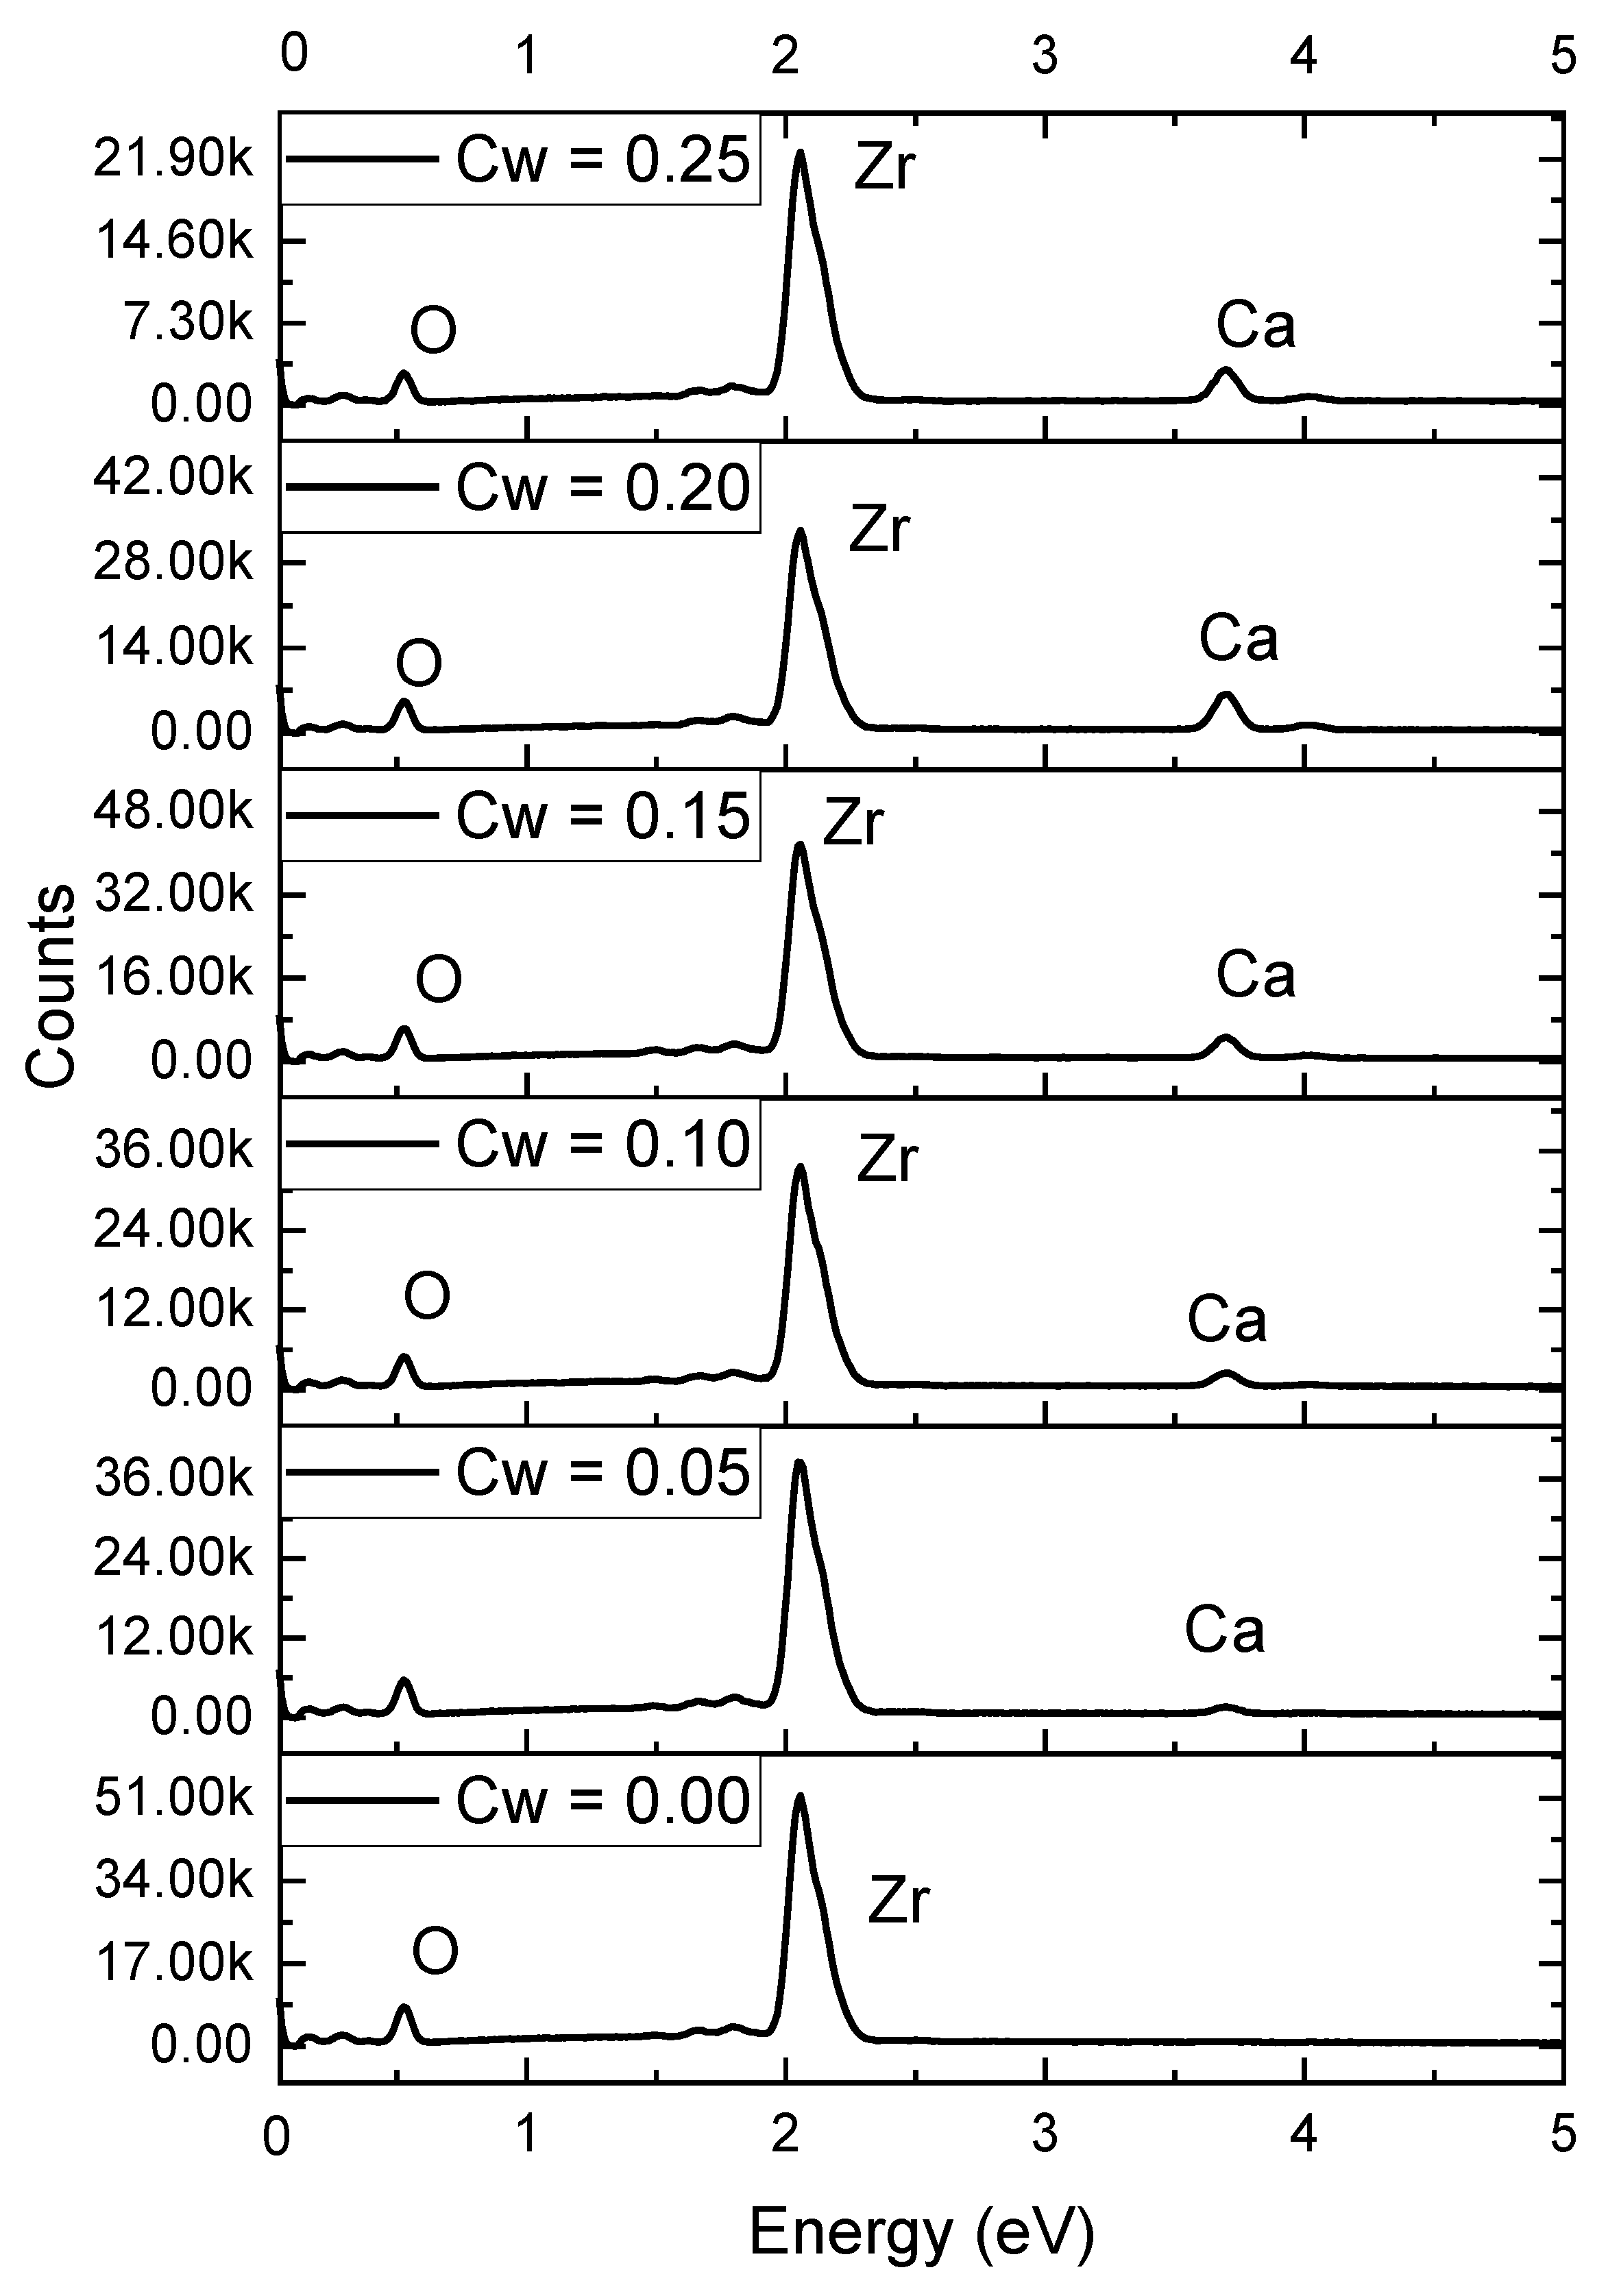
| Cw | O Concentration, at.% | Zr Concentration, at.% | Ca Concentration, at.% |
|---|---|---|---|
| 0.00 | 54.39 | 45.61 | - |
| 0.05 | 54.85 | 43.97 | 1.17 |
| 0.10 | 55.02 | 40.24 | 4.74 |
| 0.15 | 58.78 | 34.83 | 6.39 |
| 0.20 | 60.40 | 31.17 | 8.43 |
| 0.25 | 58.46 | 28.07 | 13.47 |
Disclaimer/Publisher’s Note: The statements, opinions and data contained in all publications are solely those of the individual author(s) and contributor(s) and not of MDPI and/or the editor(s). MDPI and/or the editor(s) disclaim responsibility for any injury to people or property resulting from any ideas, methods, instructions or products referred to in the content. |
© 2023 by the authors. Licensee MDPI, Basel, Switzerland. This article is an open access article distributed under the terms and conditions of the Creative Commons Attribution (CC BY) license (https://creativecommons.org/licenses/by/4.0/).
Share and Cite
Giniyatova, S.G.; Kozlovskiy, A.L.; Shakirzyanov, R.I.; Volodina, N.O.; Shlimas, D.I.; Borgekov, D.B. Structural, Dielectric, and Mechanical Properties of High-Content Cubic Zirconia Ceramics Obtained via Solid-State Synthesis. Appl. Sci. 2023, 13, 10989. https://doi.org/10.3390/app131910989
Giniyatova SG, Kozlovskiy AL, Shakirzyanov RI, Volodina NO, Shlimas DI, Borgekov DB. Structural, Dielectric, and Mechanical Properties of High-Content Cubic Zirconia Ceramics Obtained via Solid-State Synthesis. Applied Sciences. 2023; 13(19):10989. https://doi.org/10.3390/app131910989
Chicago/Turabian StyleGiniyatova, Sholpan G., Artem L. Kozlovskiy, Rafael I. Shakirzyanov, Natalia O. Volodina, Dmitriy I. Shlimas, and Daryn B. Borgekov. 2023. "Structural, Dielectric, and Mechanical Properties of High-Content Cubic Zirconia Ceramics Obtained via Solid-State Synthesis" Applied Sciences 13, no. 19: 10989. https://doi.org/10.3390/app131910989