
Taxonomic Structure Evolution, Chemical Composition and Anaerobic Digestibility of Microalgae-Bacterial Granular Sludge (M-BGS) Grown during Treatment of Digestate


Abstract
:1. Introduction
2. Materials and Methods
2.1. Experimental Design
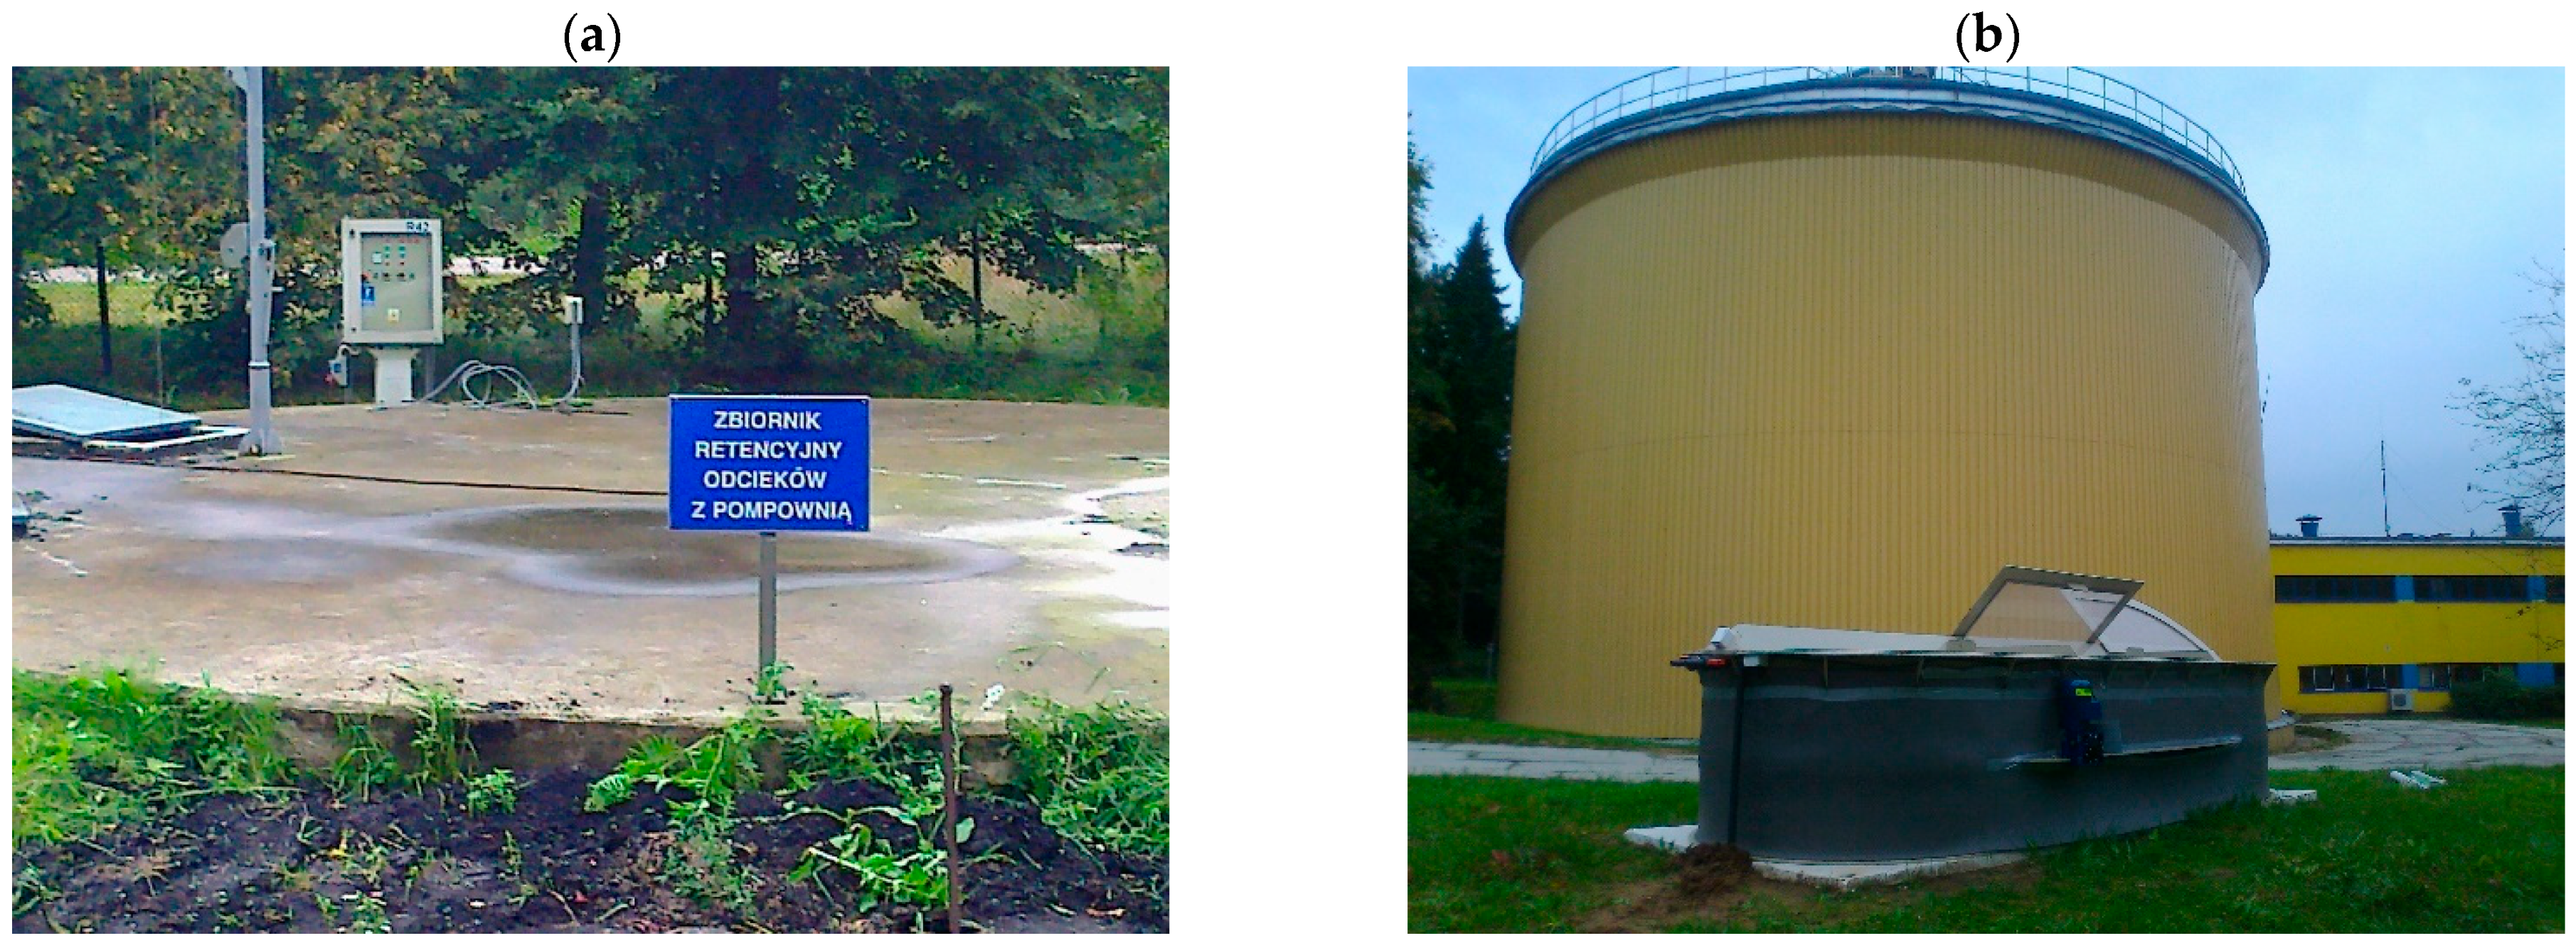
2.2. Location
2.3. Materials
2.3.1. Stage 1—LF-DSS Treatment and M-BGS Production
2.3.2. Stage 2—M-BGS Anaerobic Digestion
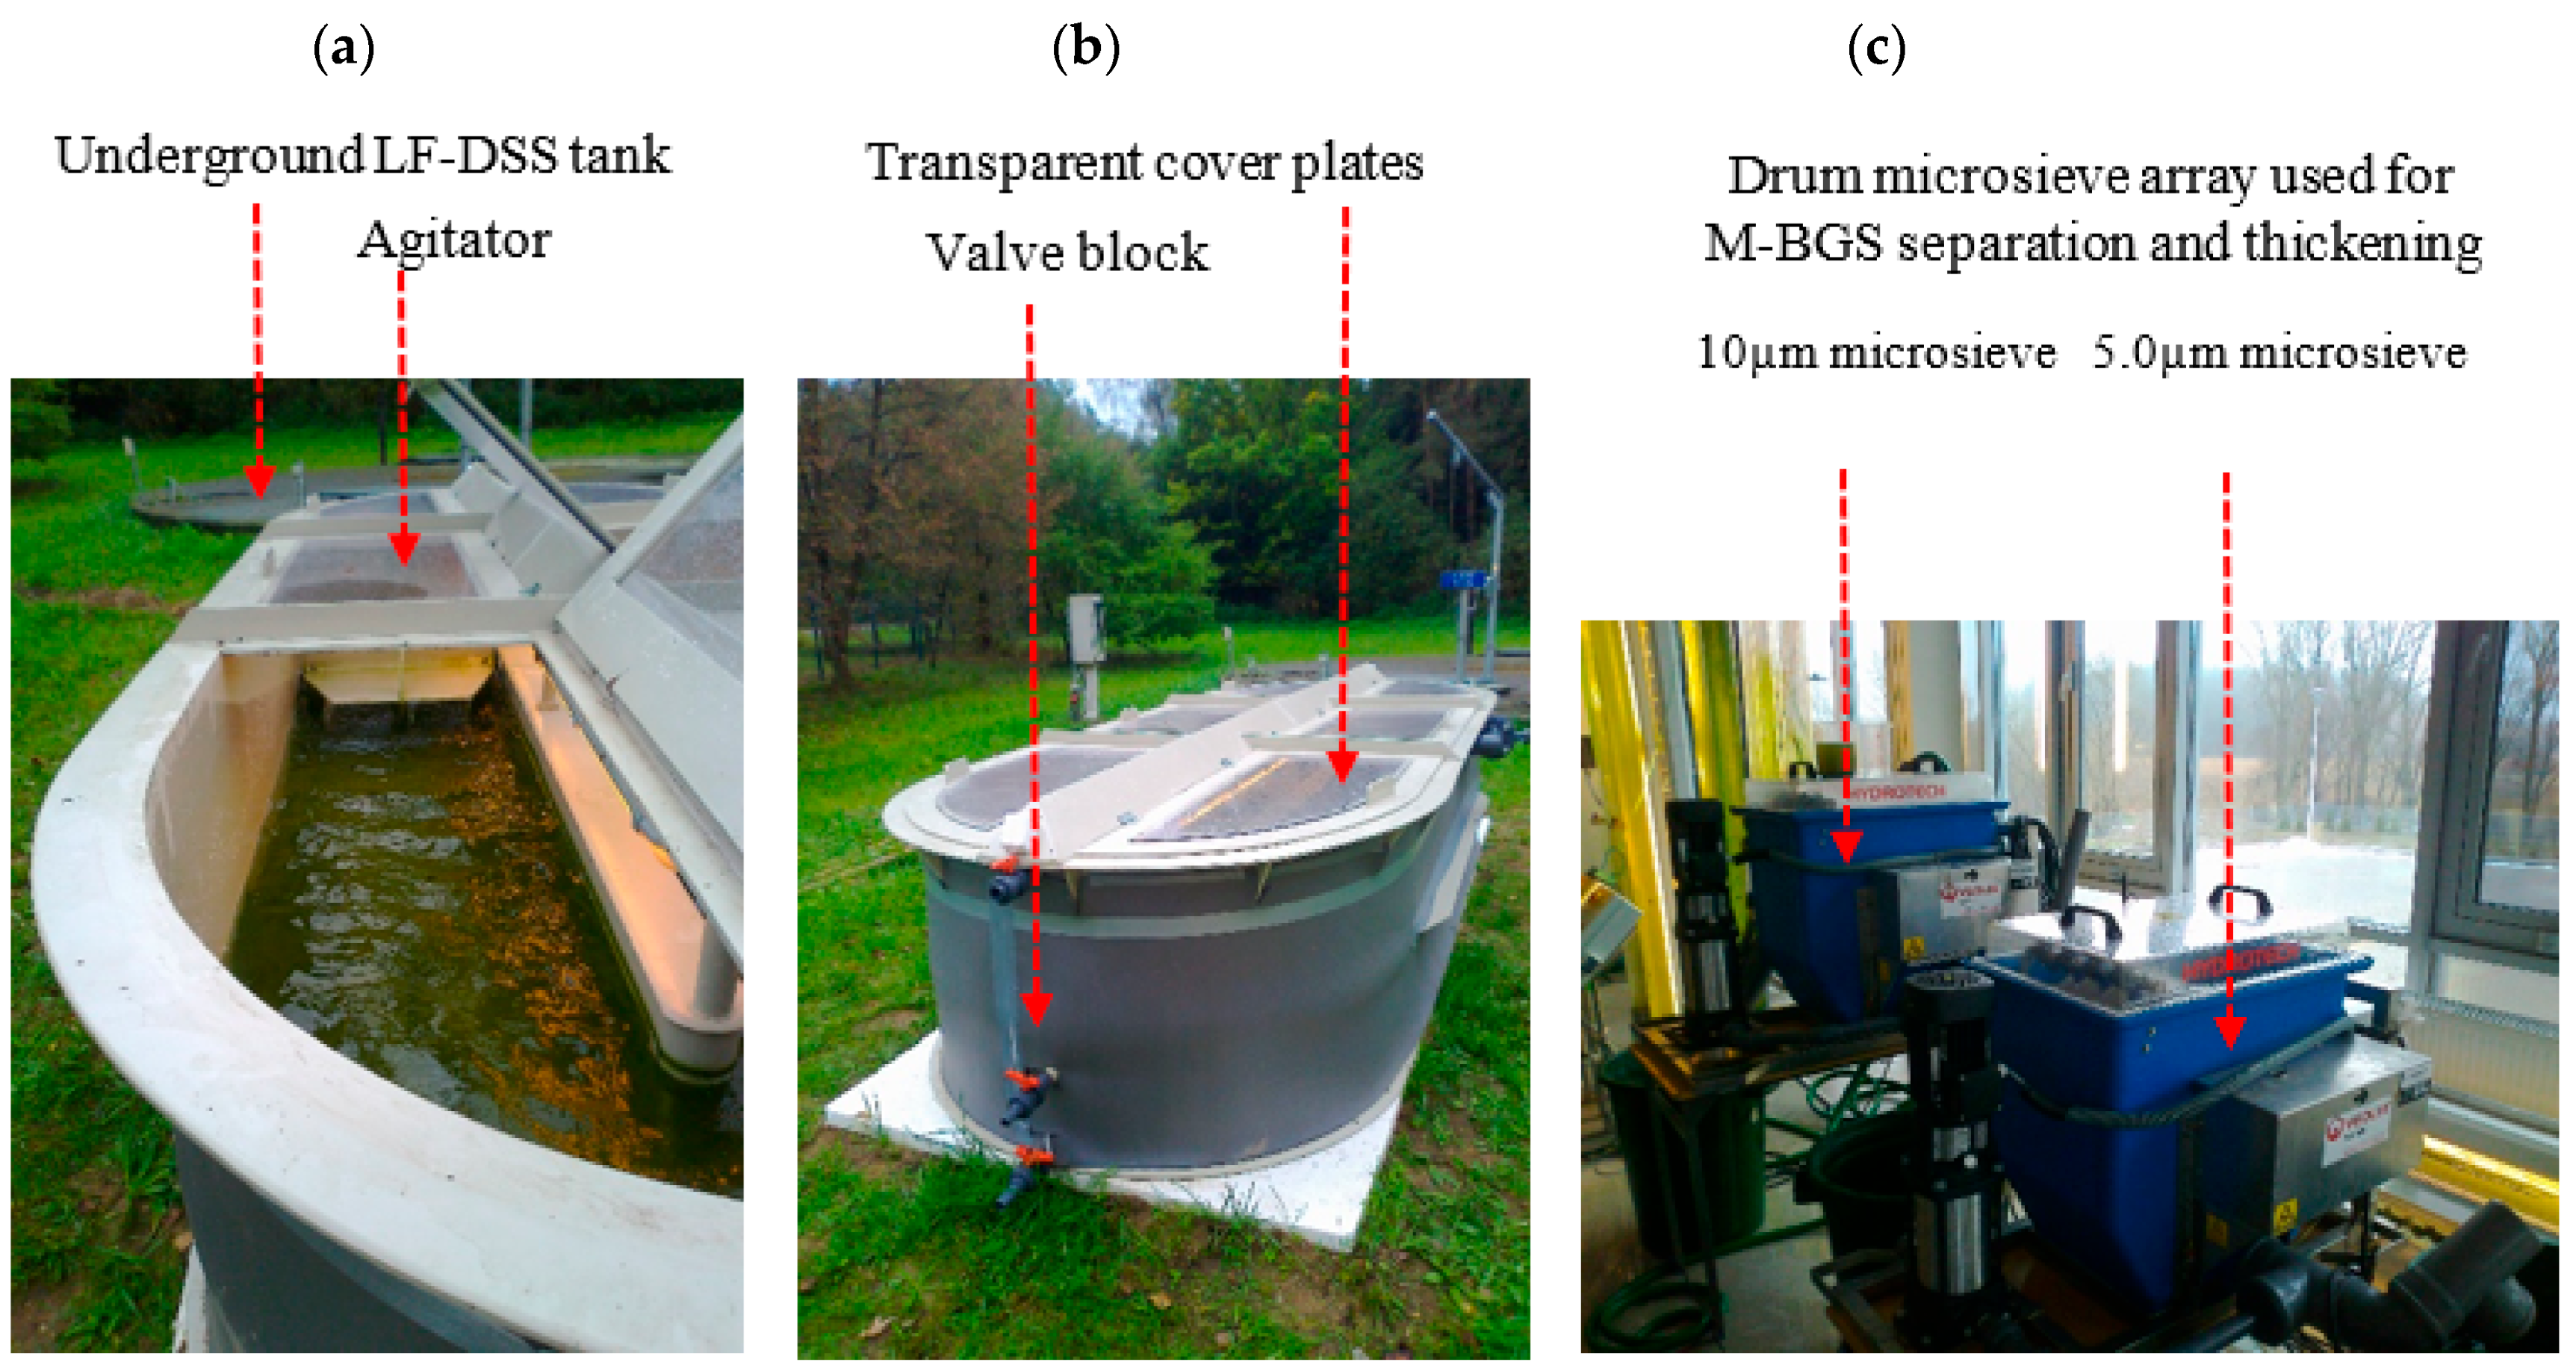
2.4. Experimental Set-Up
2.4.1. Stage 1—LF-DSS Treatment and M-BGS Production
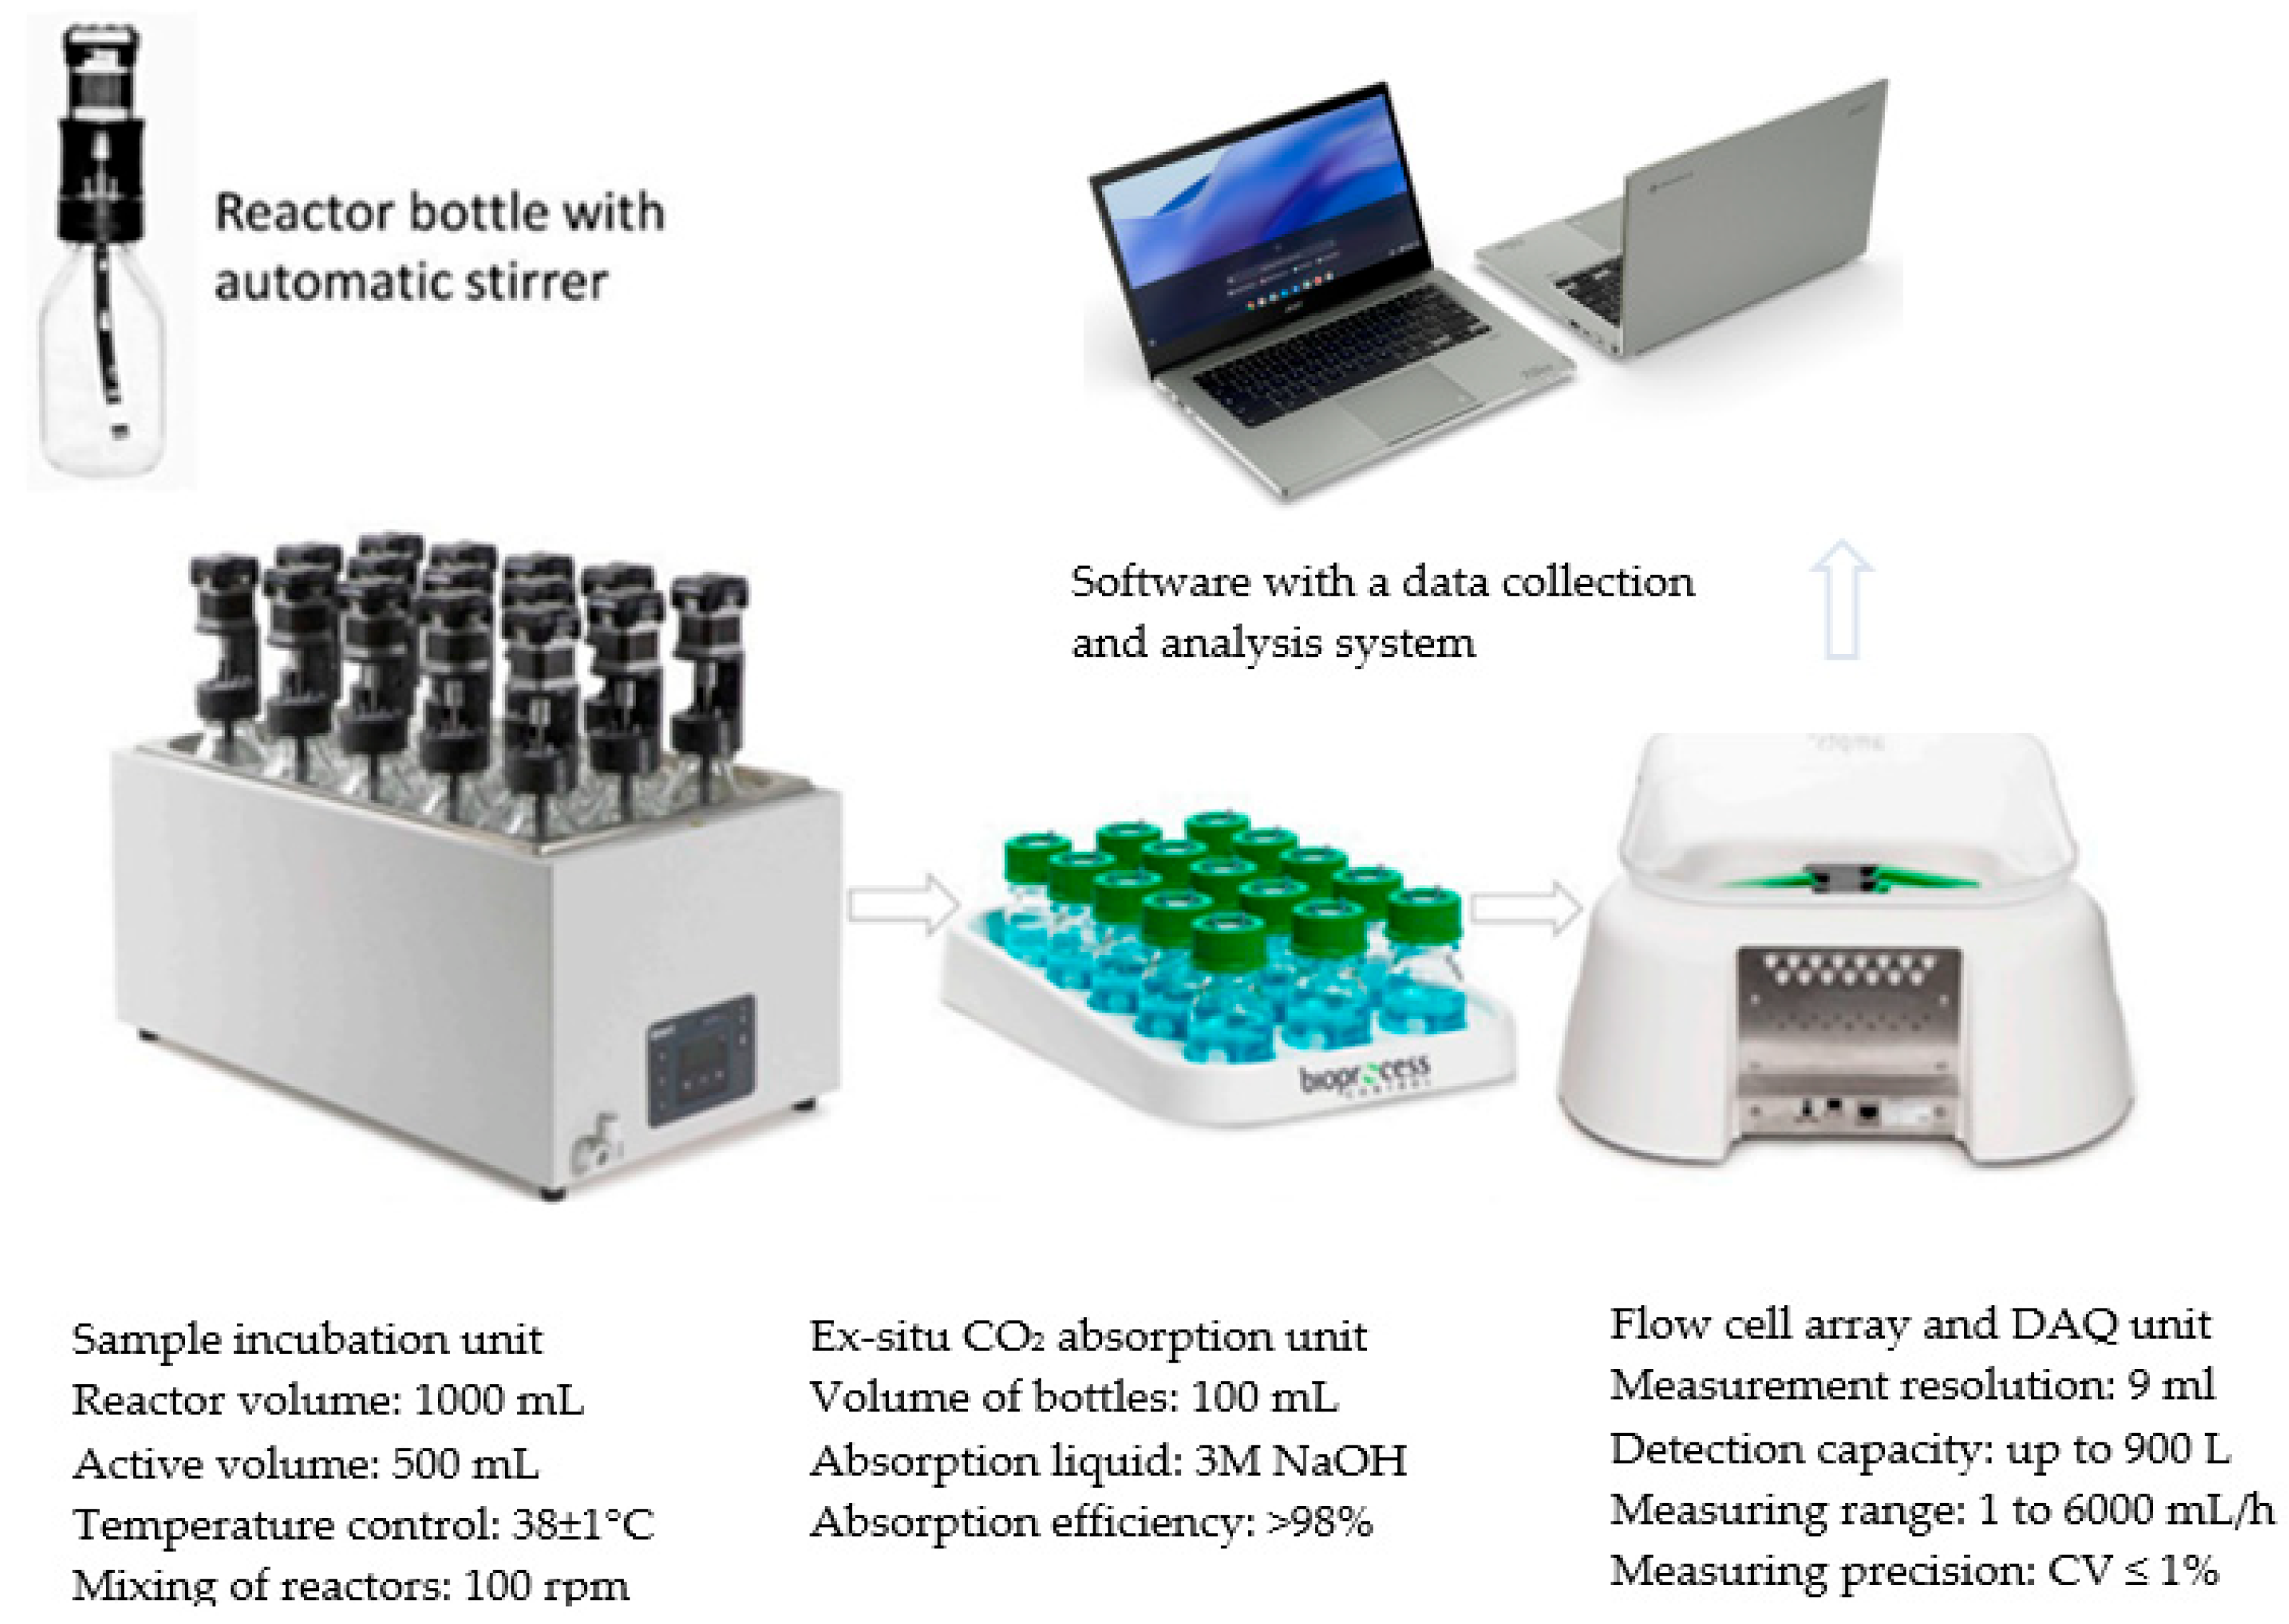
2.4.2. Stage 2—M-BGS Anaerobic Digestion
2.5. Analytical Methods
2.6. Taxonomic Identification
2.7. Statistical Methods
3. Results and Discussion
3.1. Stage 1—LF-DSS Treatment and M-BGS Production
3.1.1. Biomass Growth
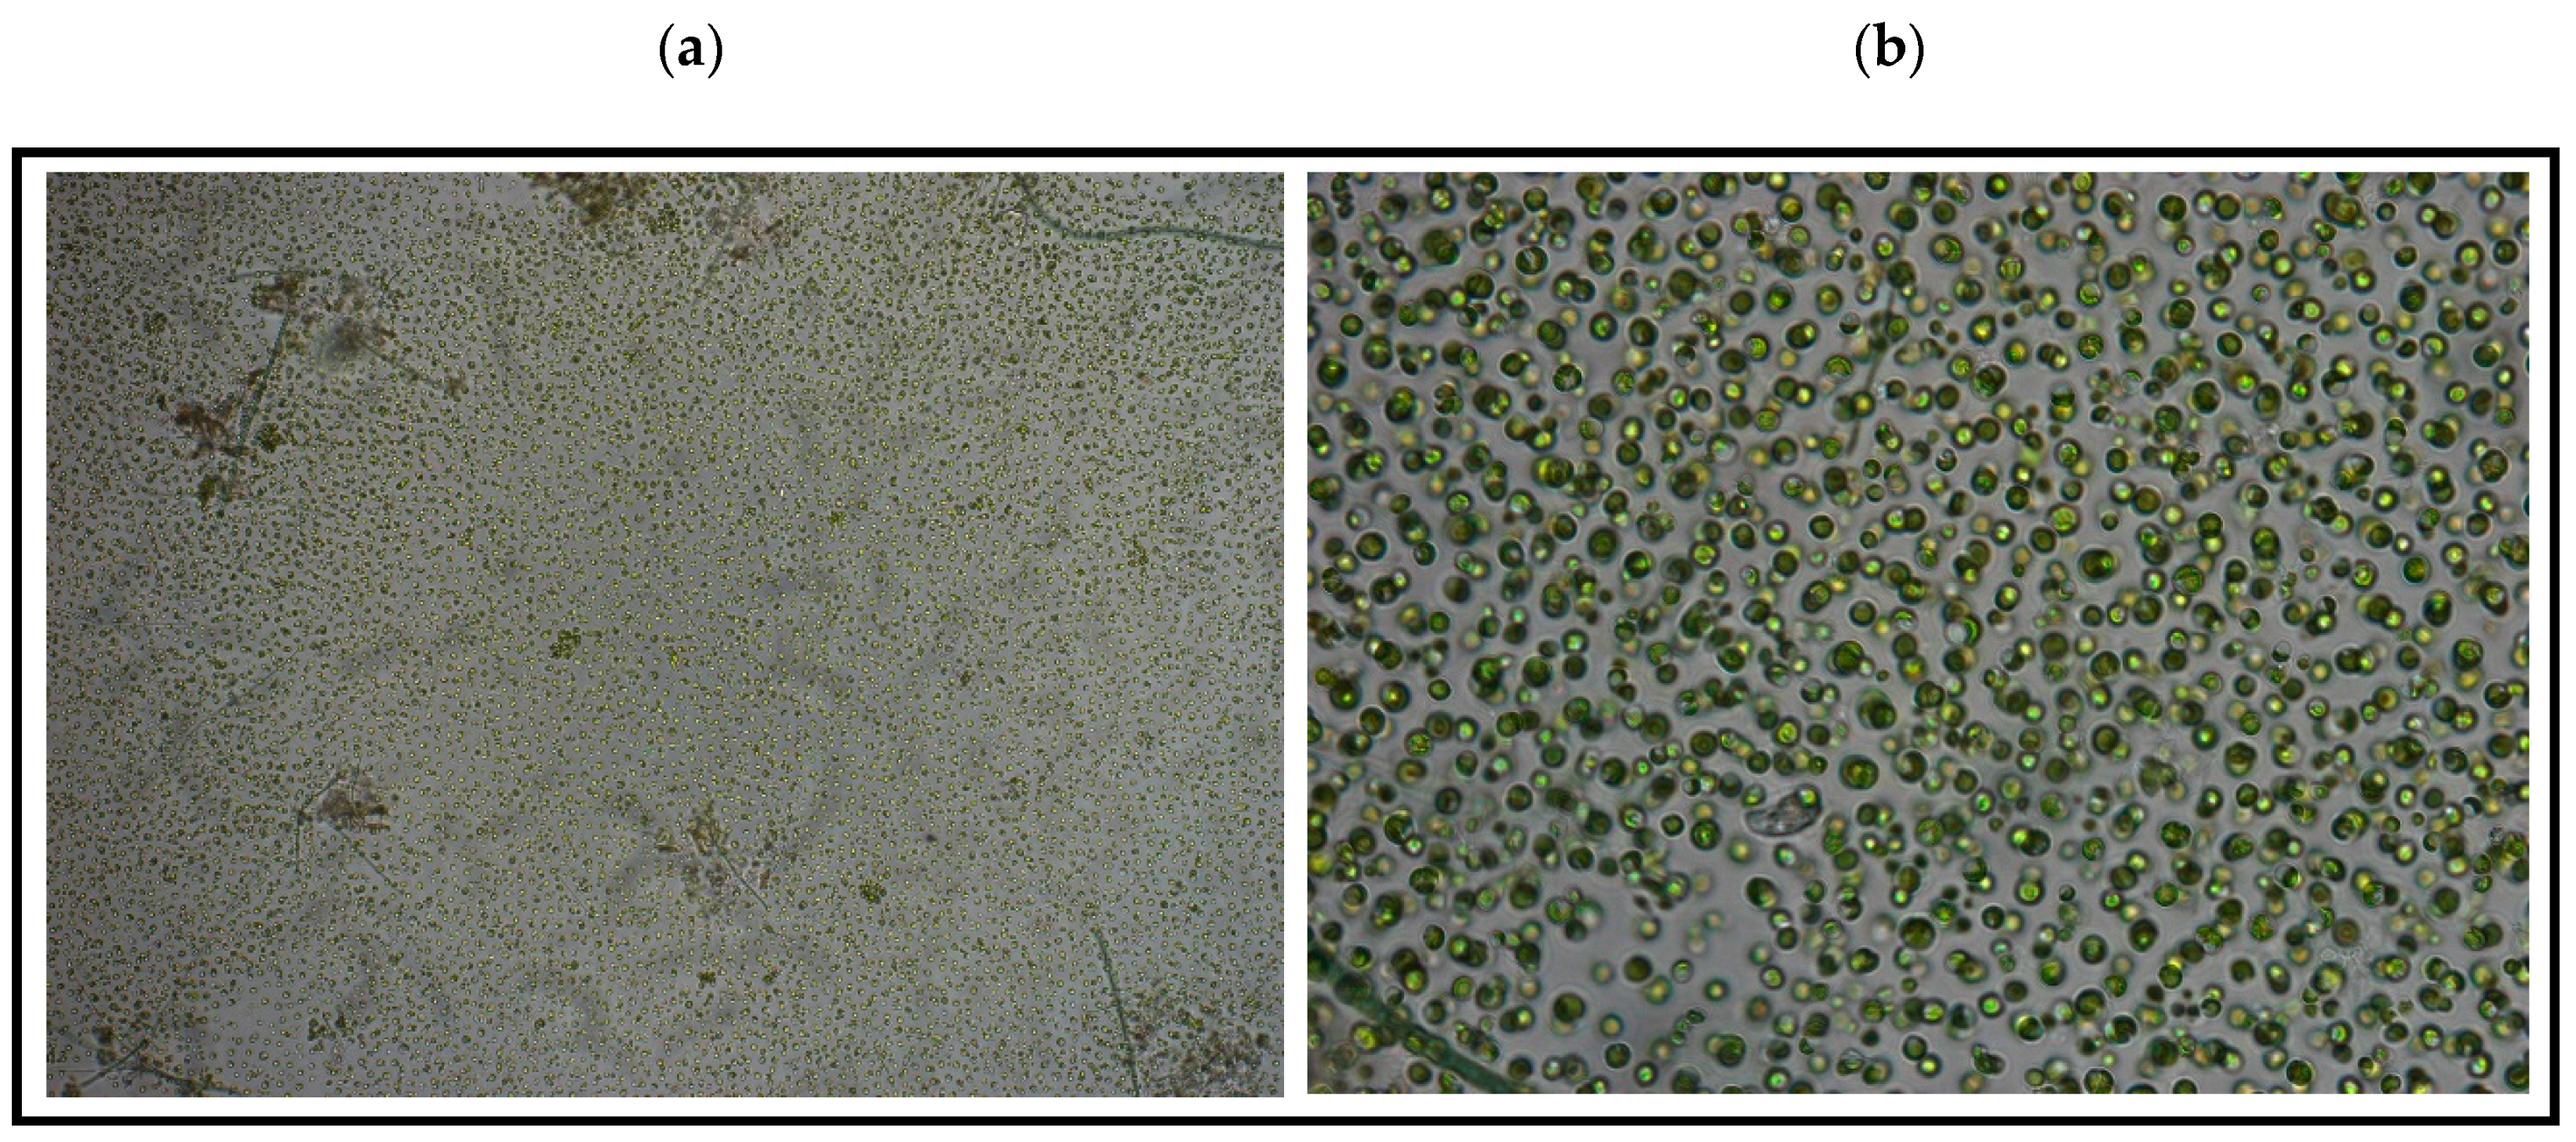
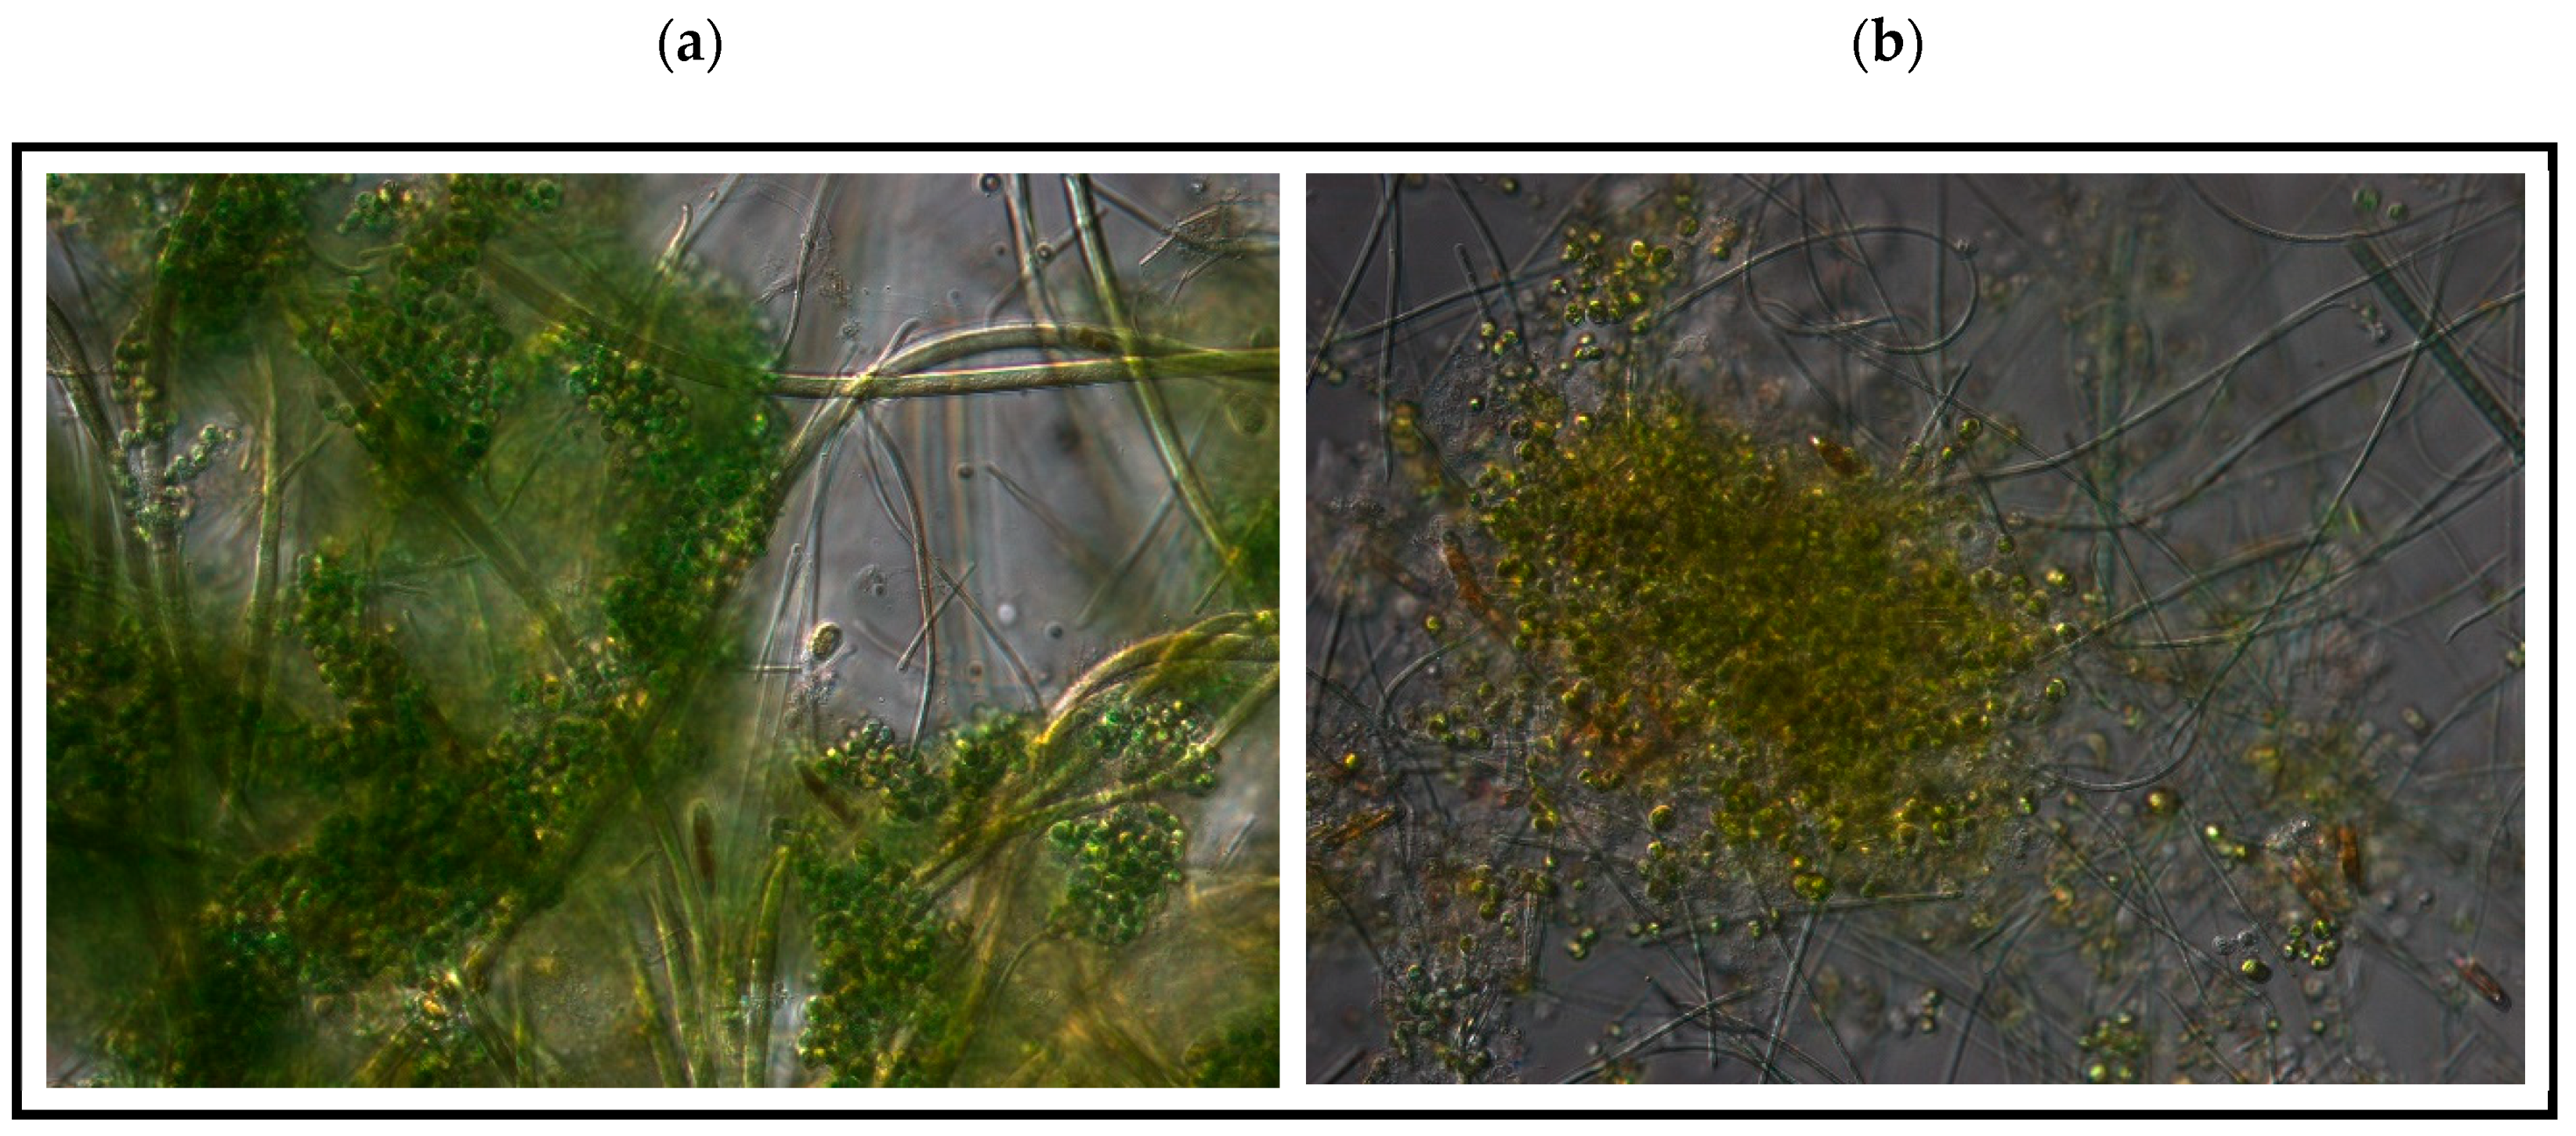
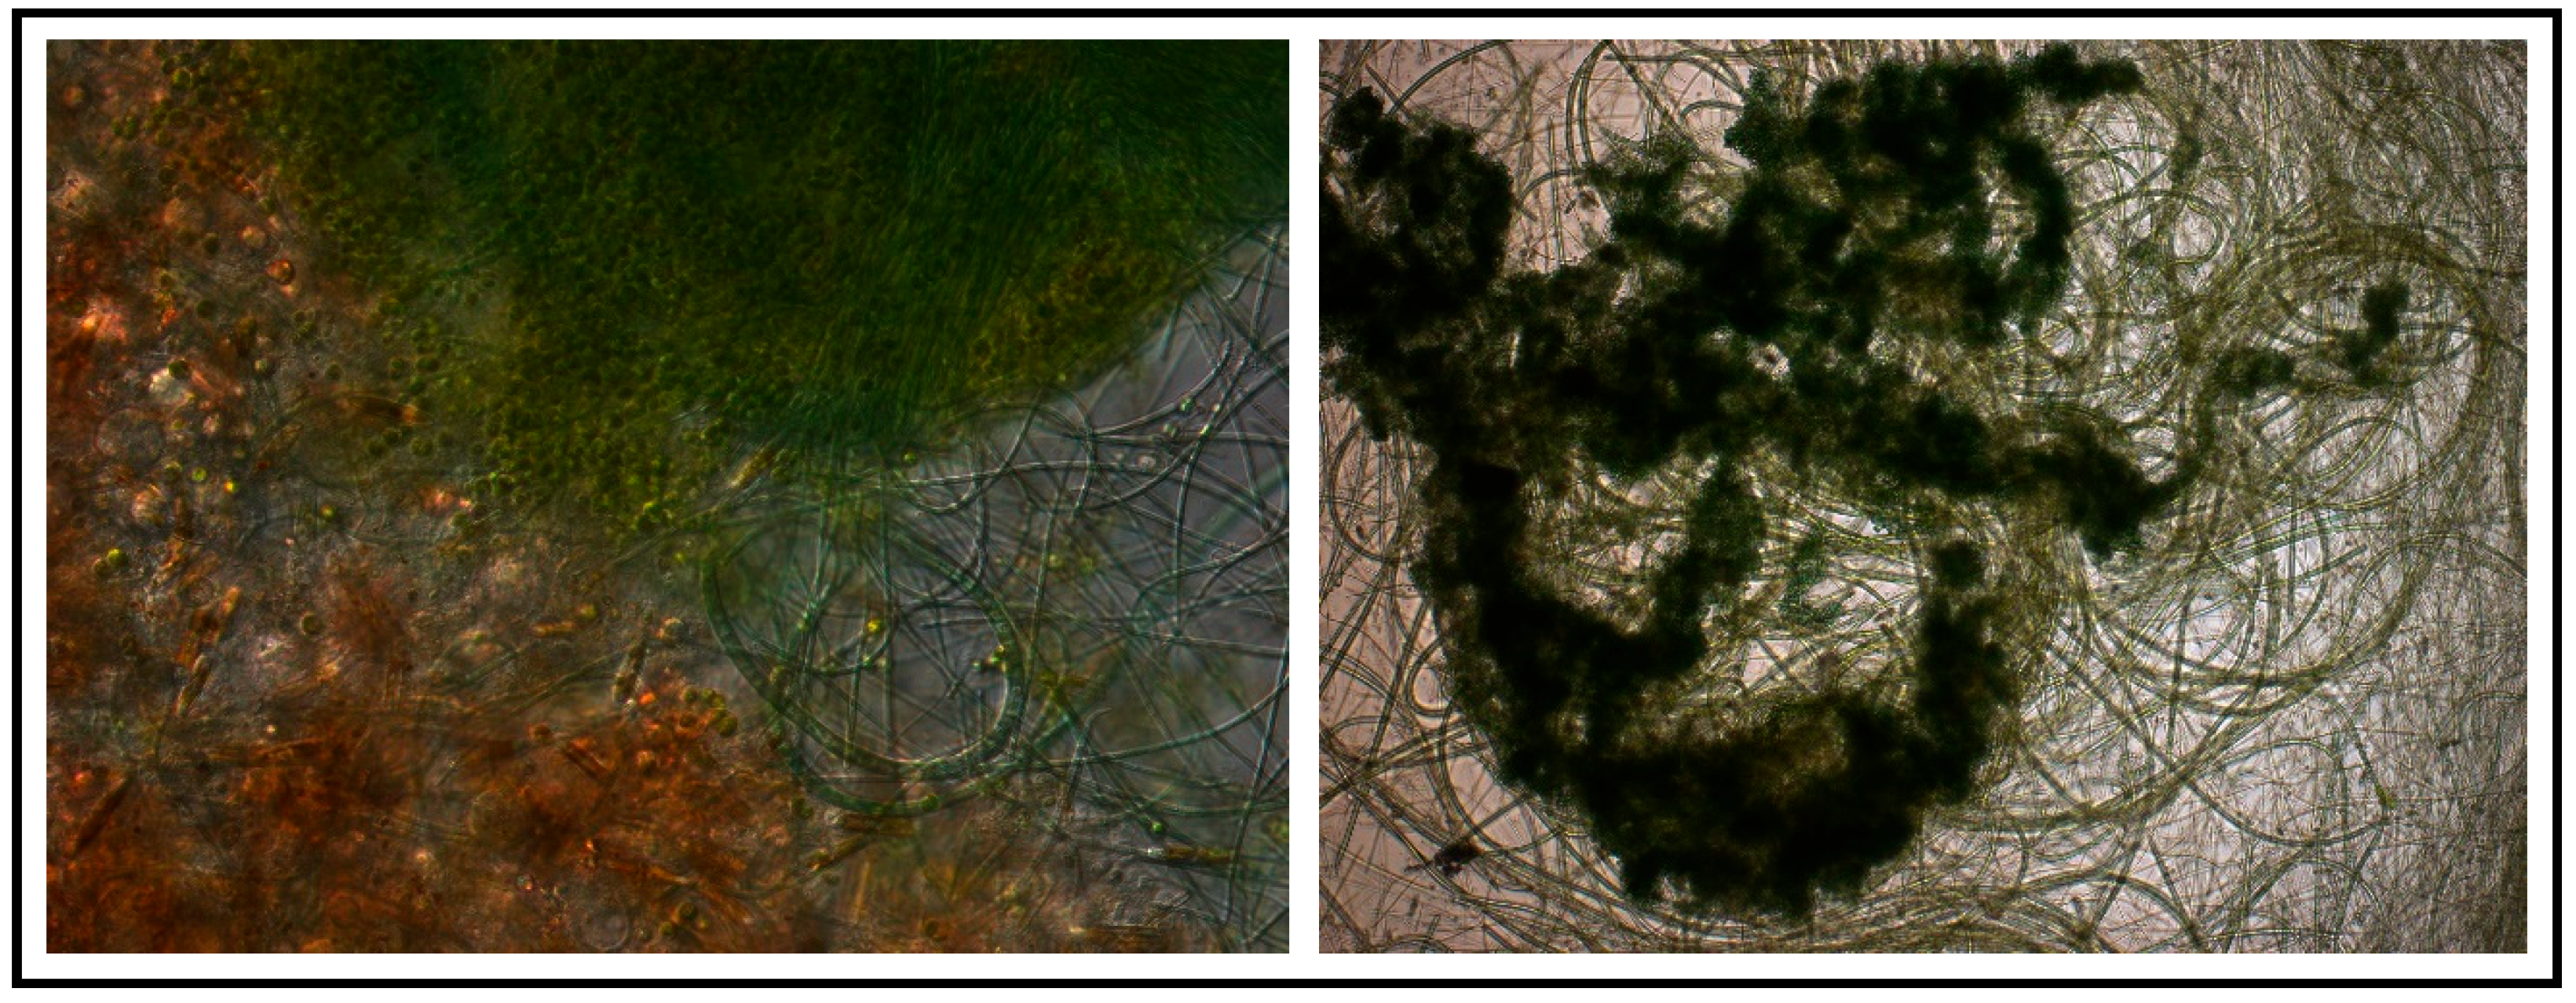
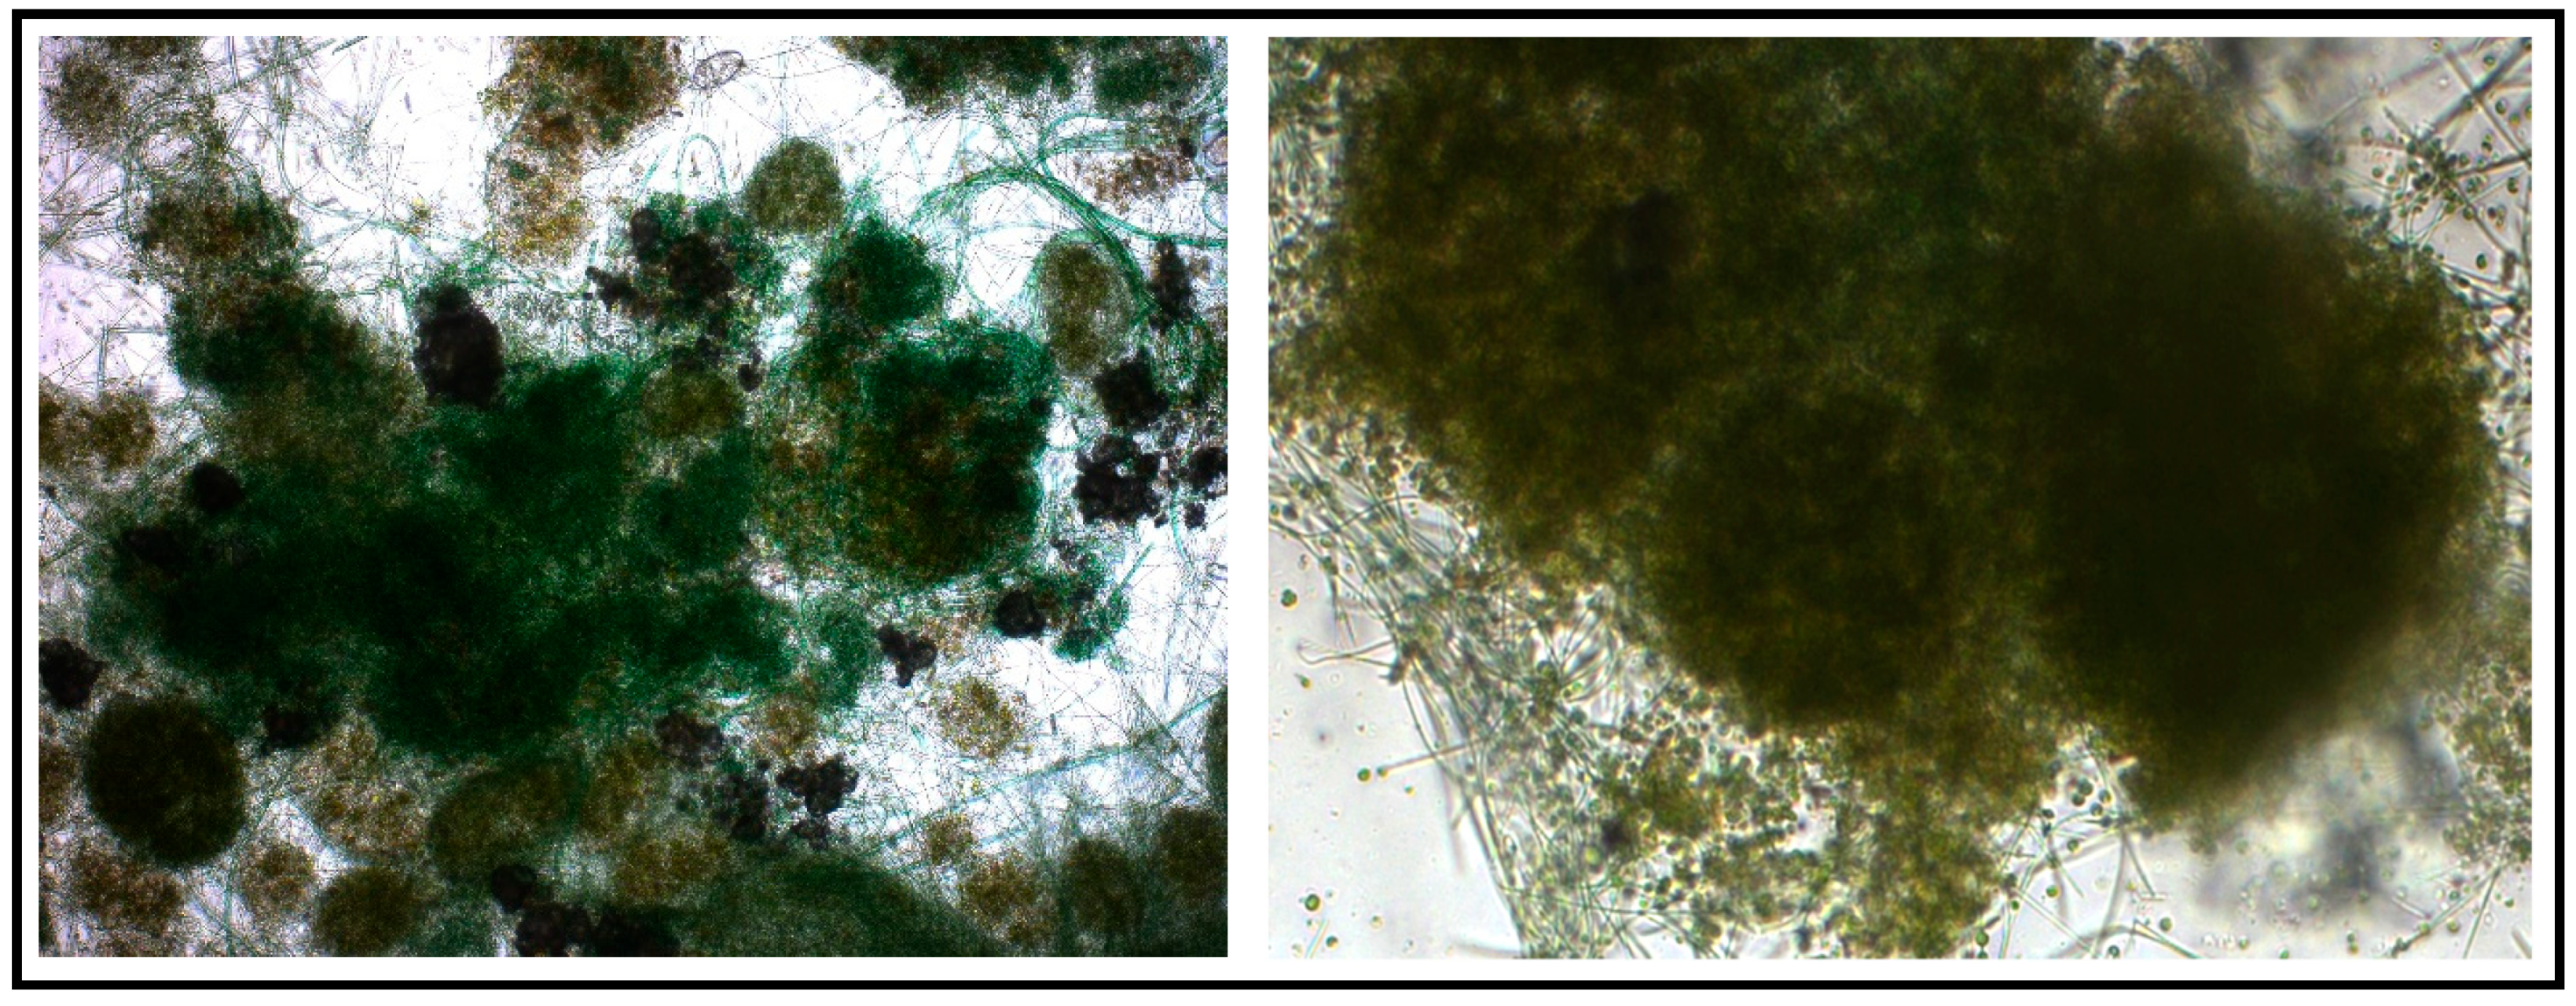
3.1.2. Taxonomic Structure
3.1.3. Chemical Composition of M-BGS Biomass
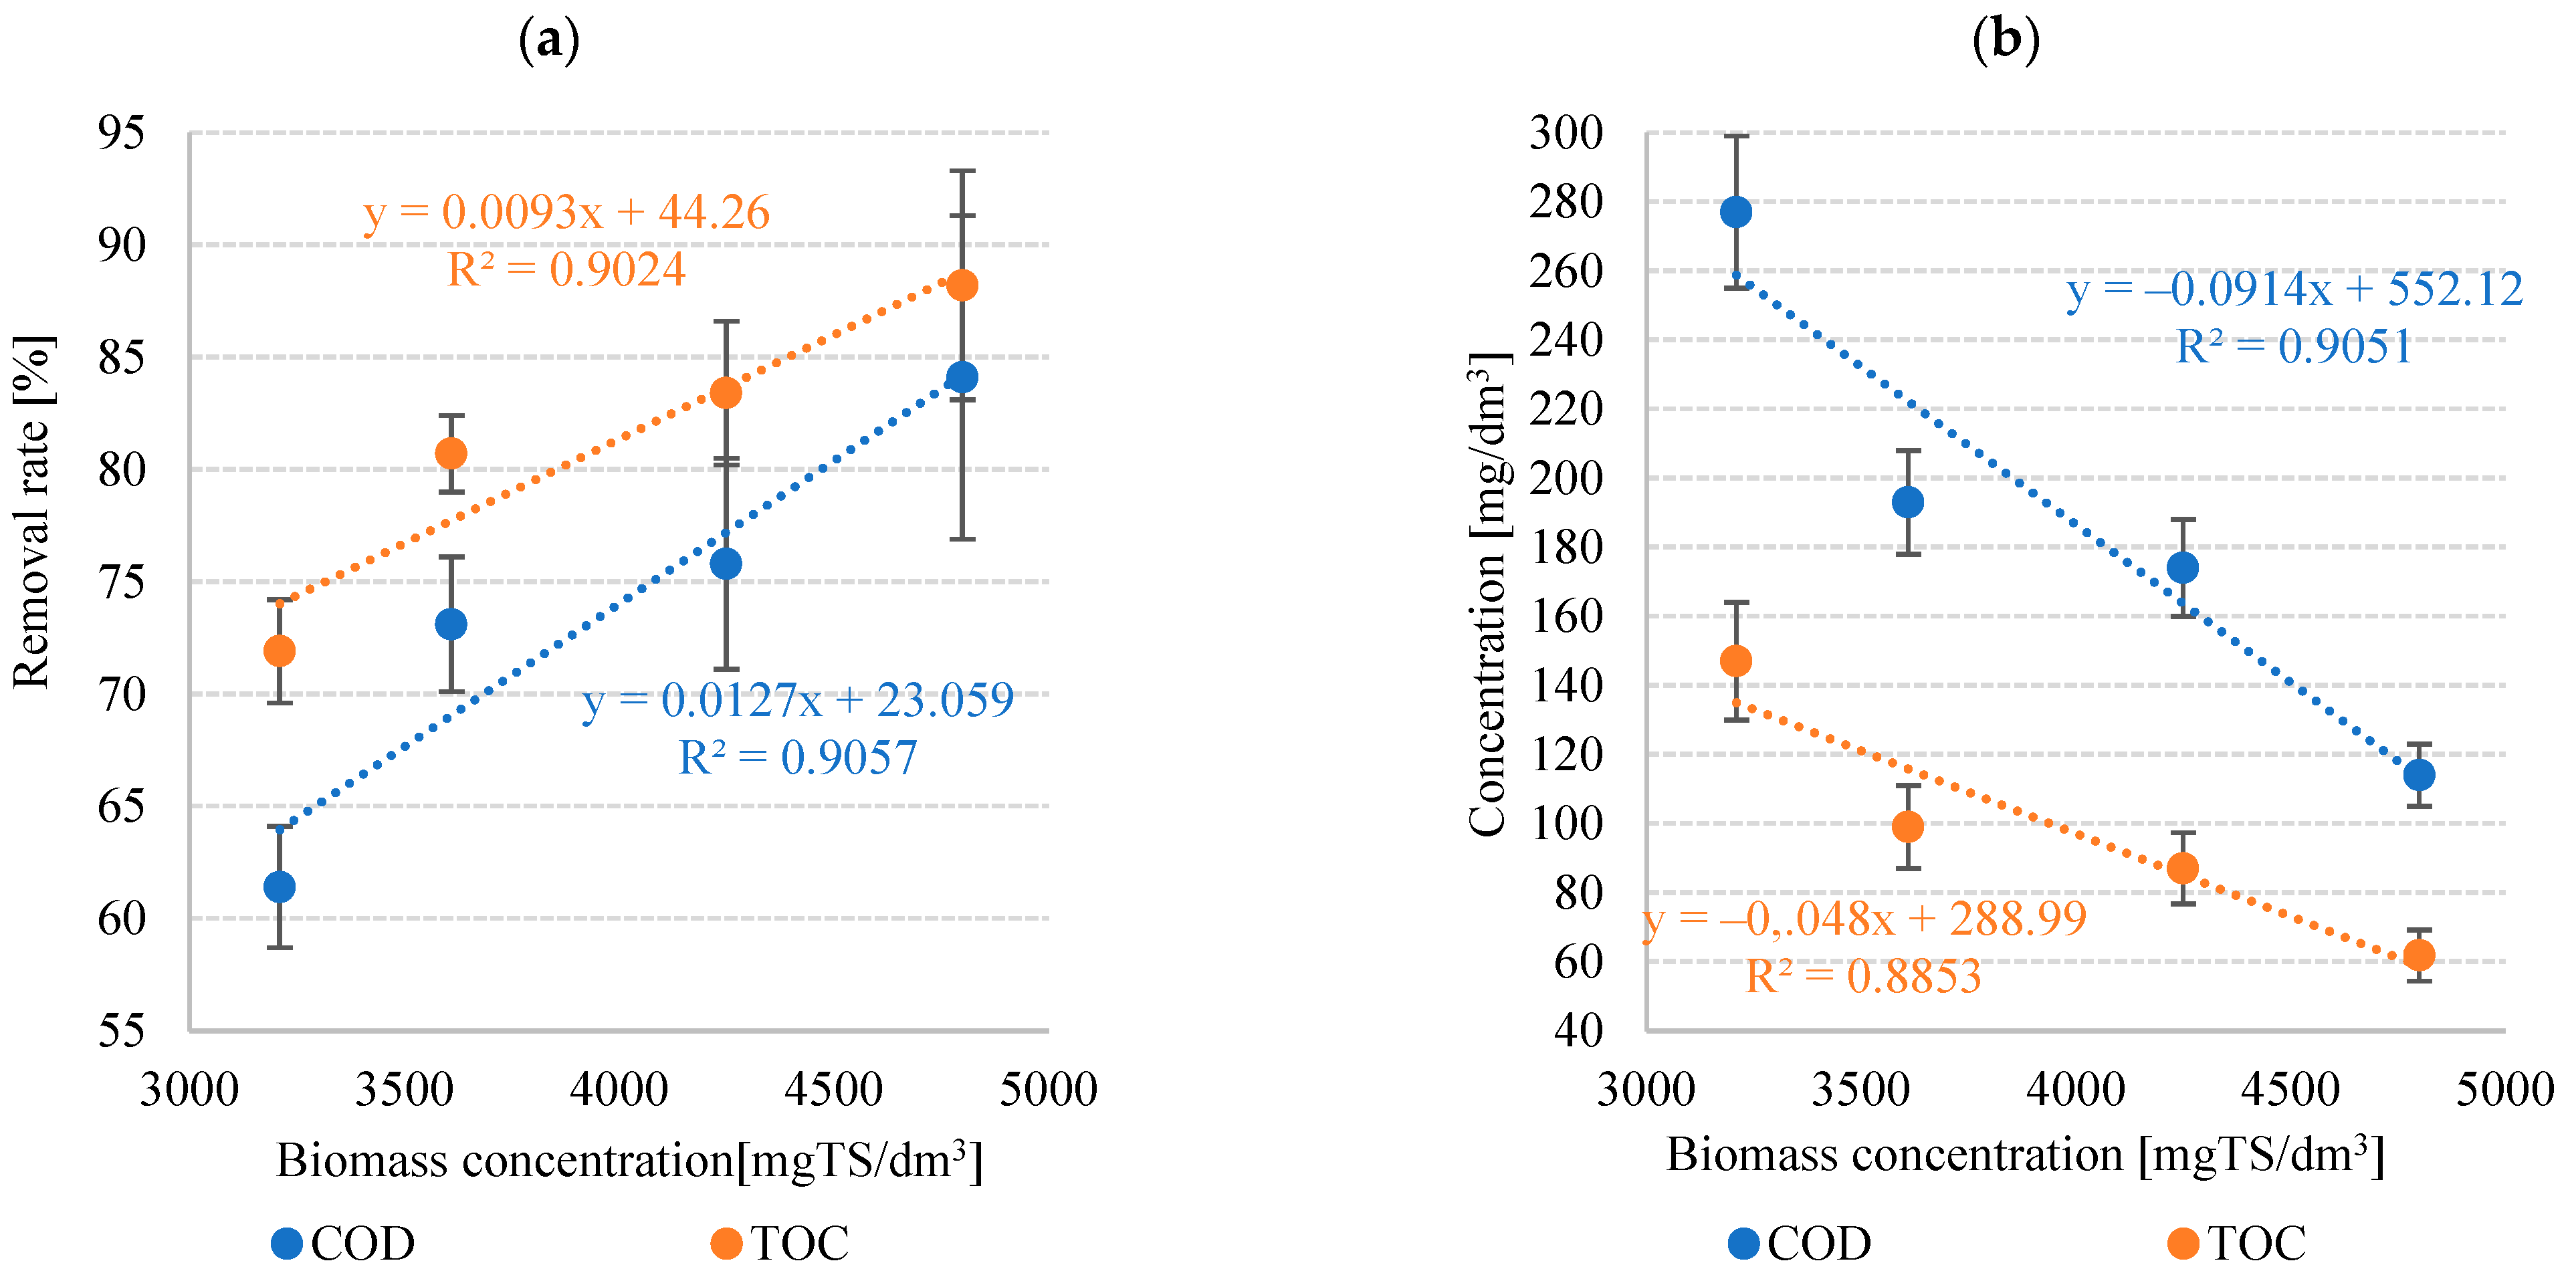
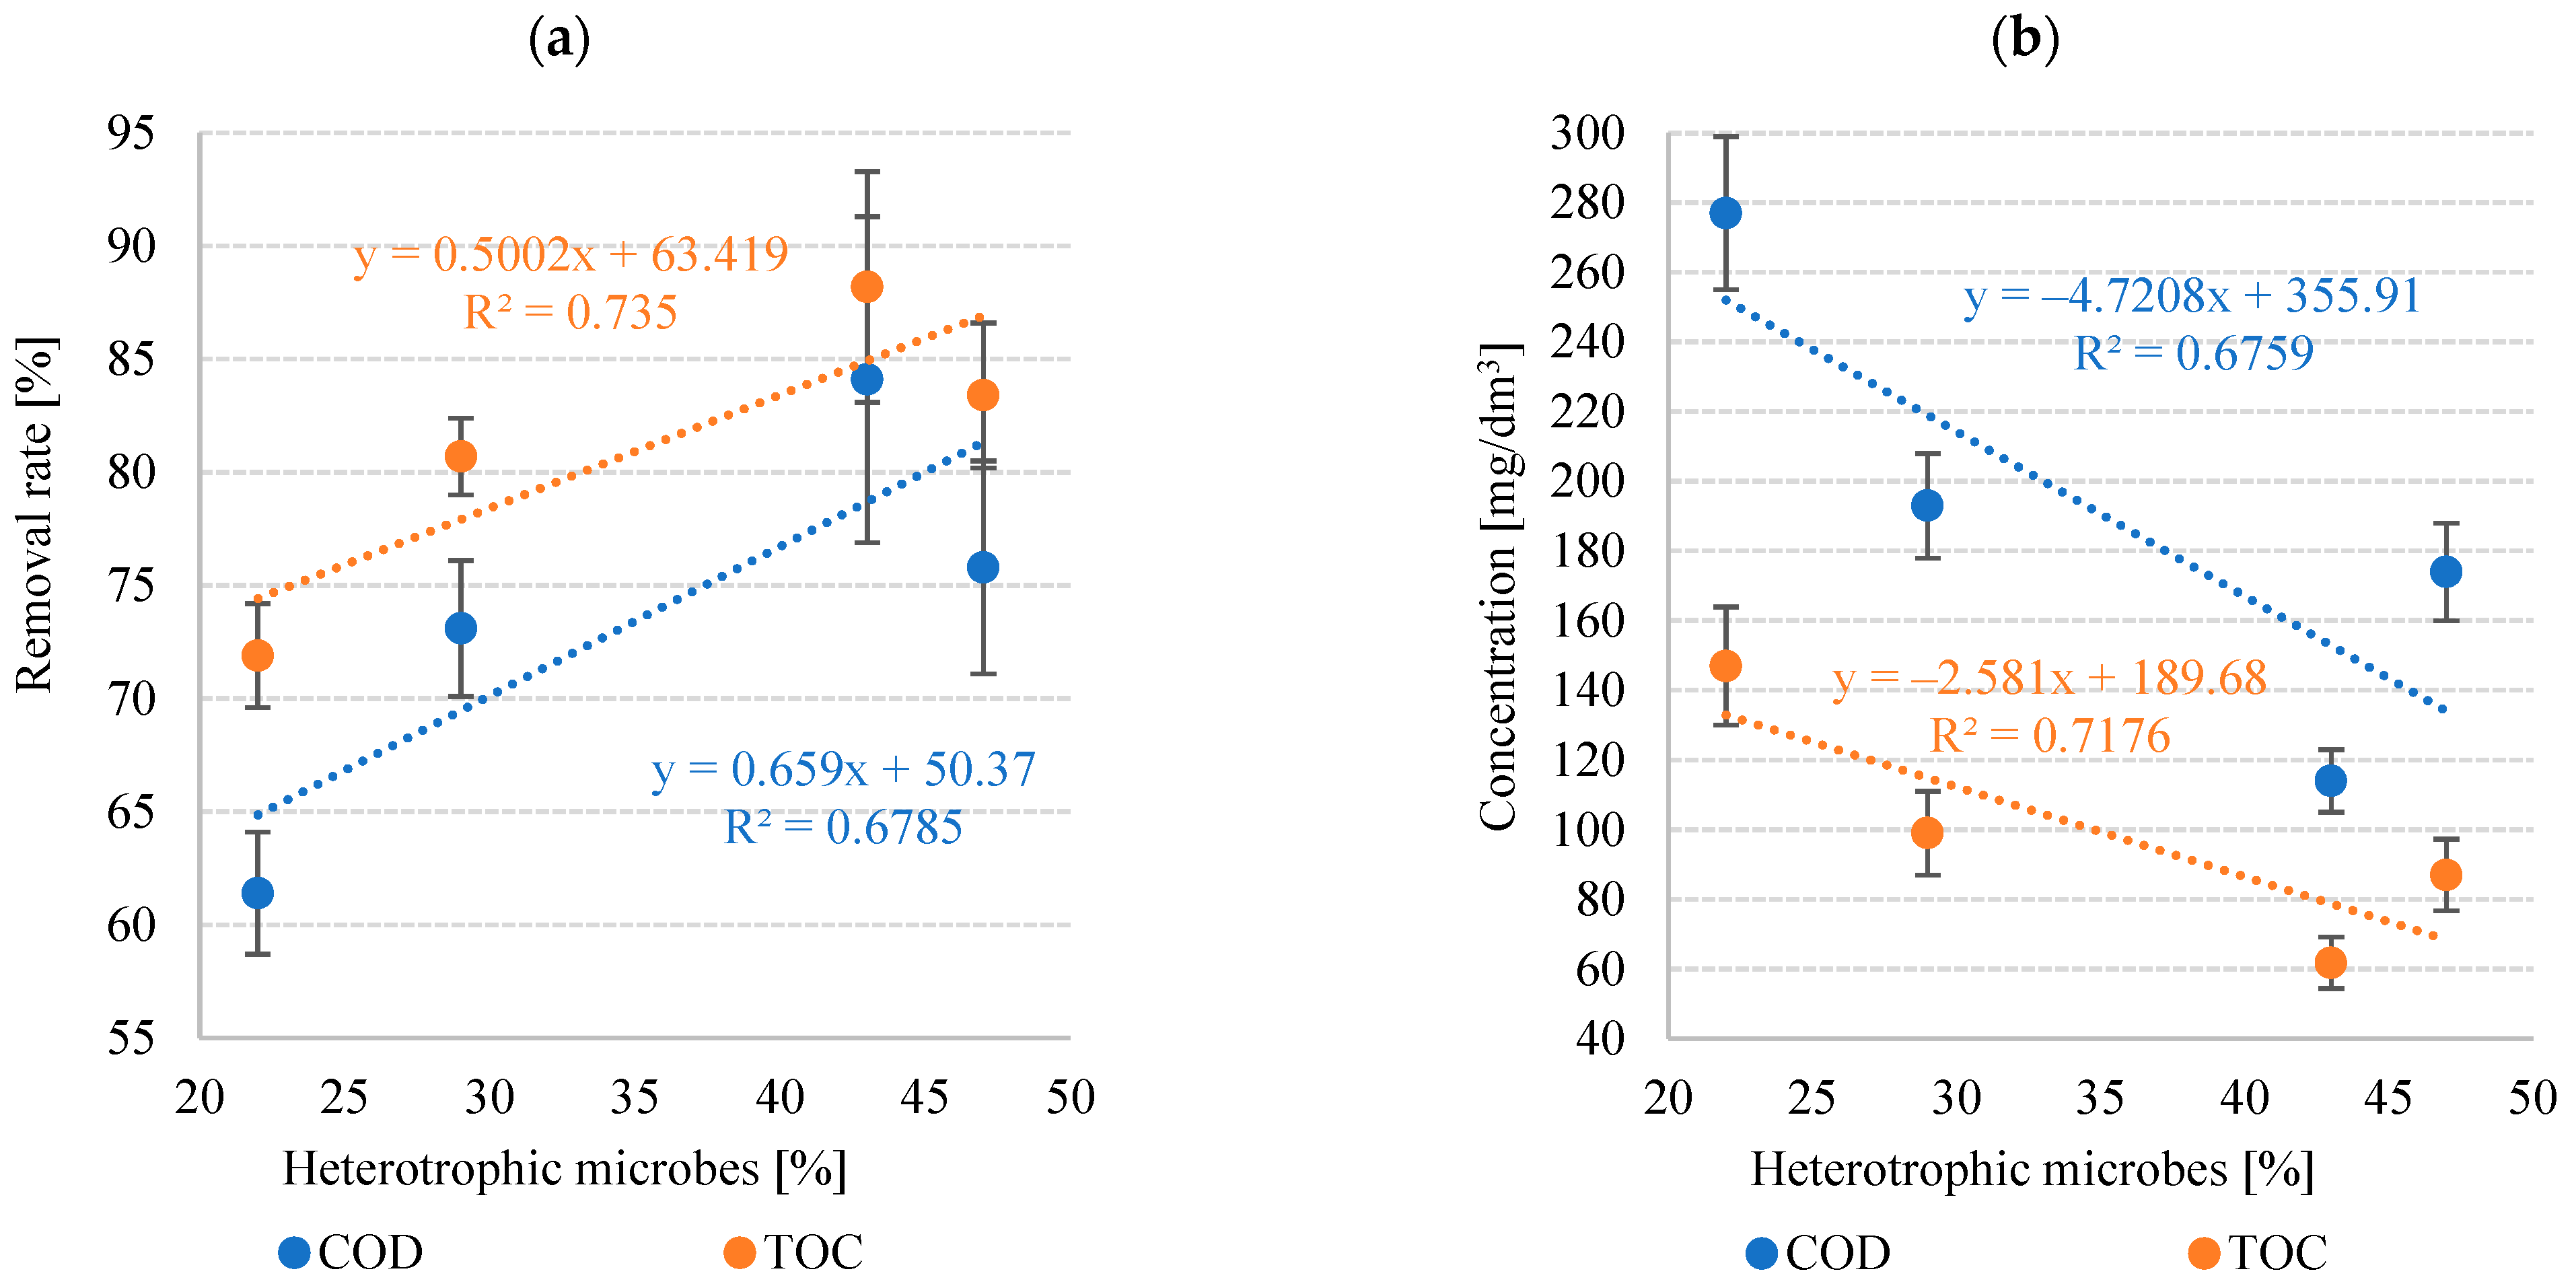
3.1.4. Pollutant Removal Rate
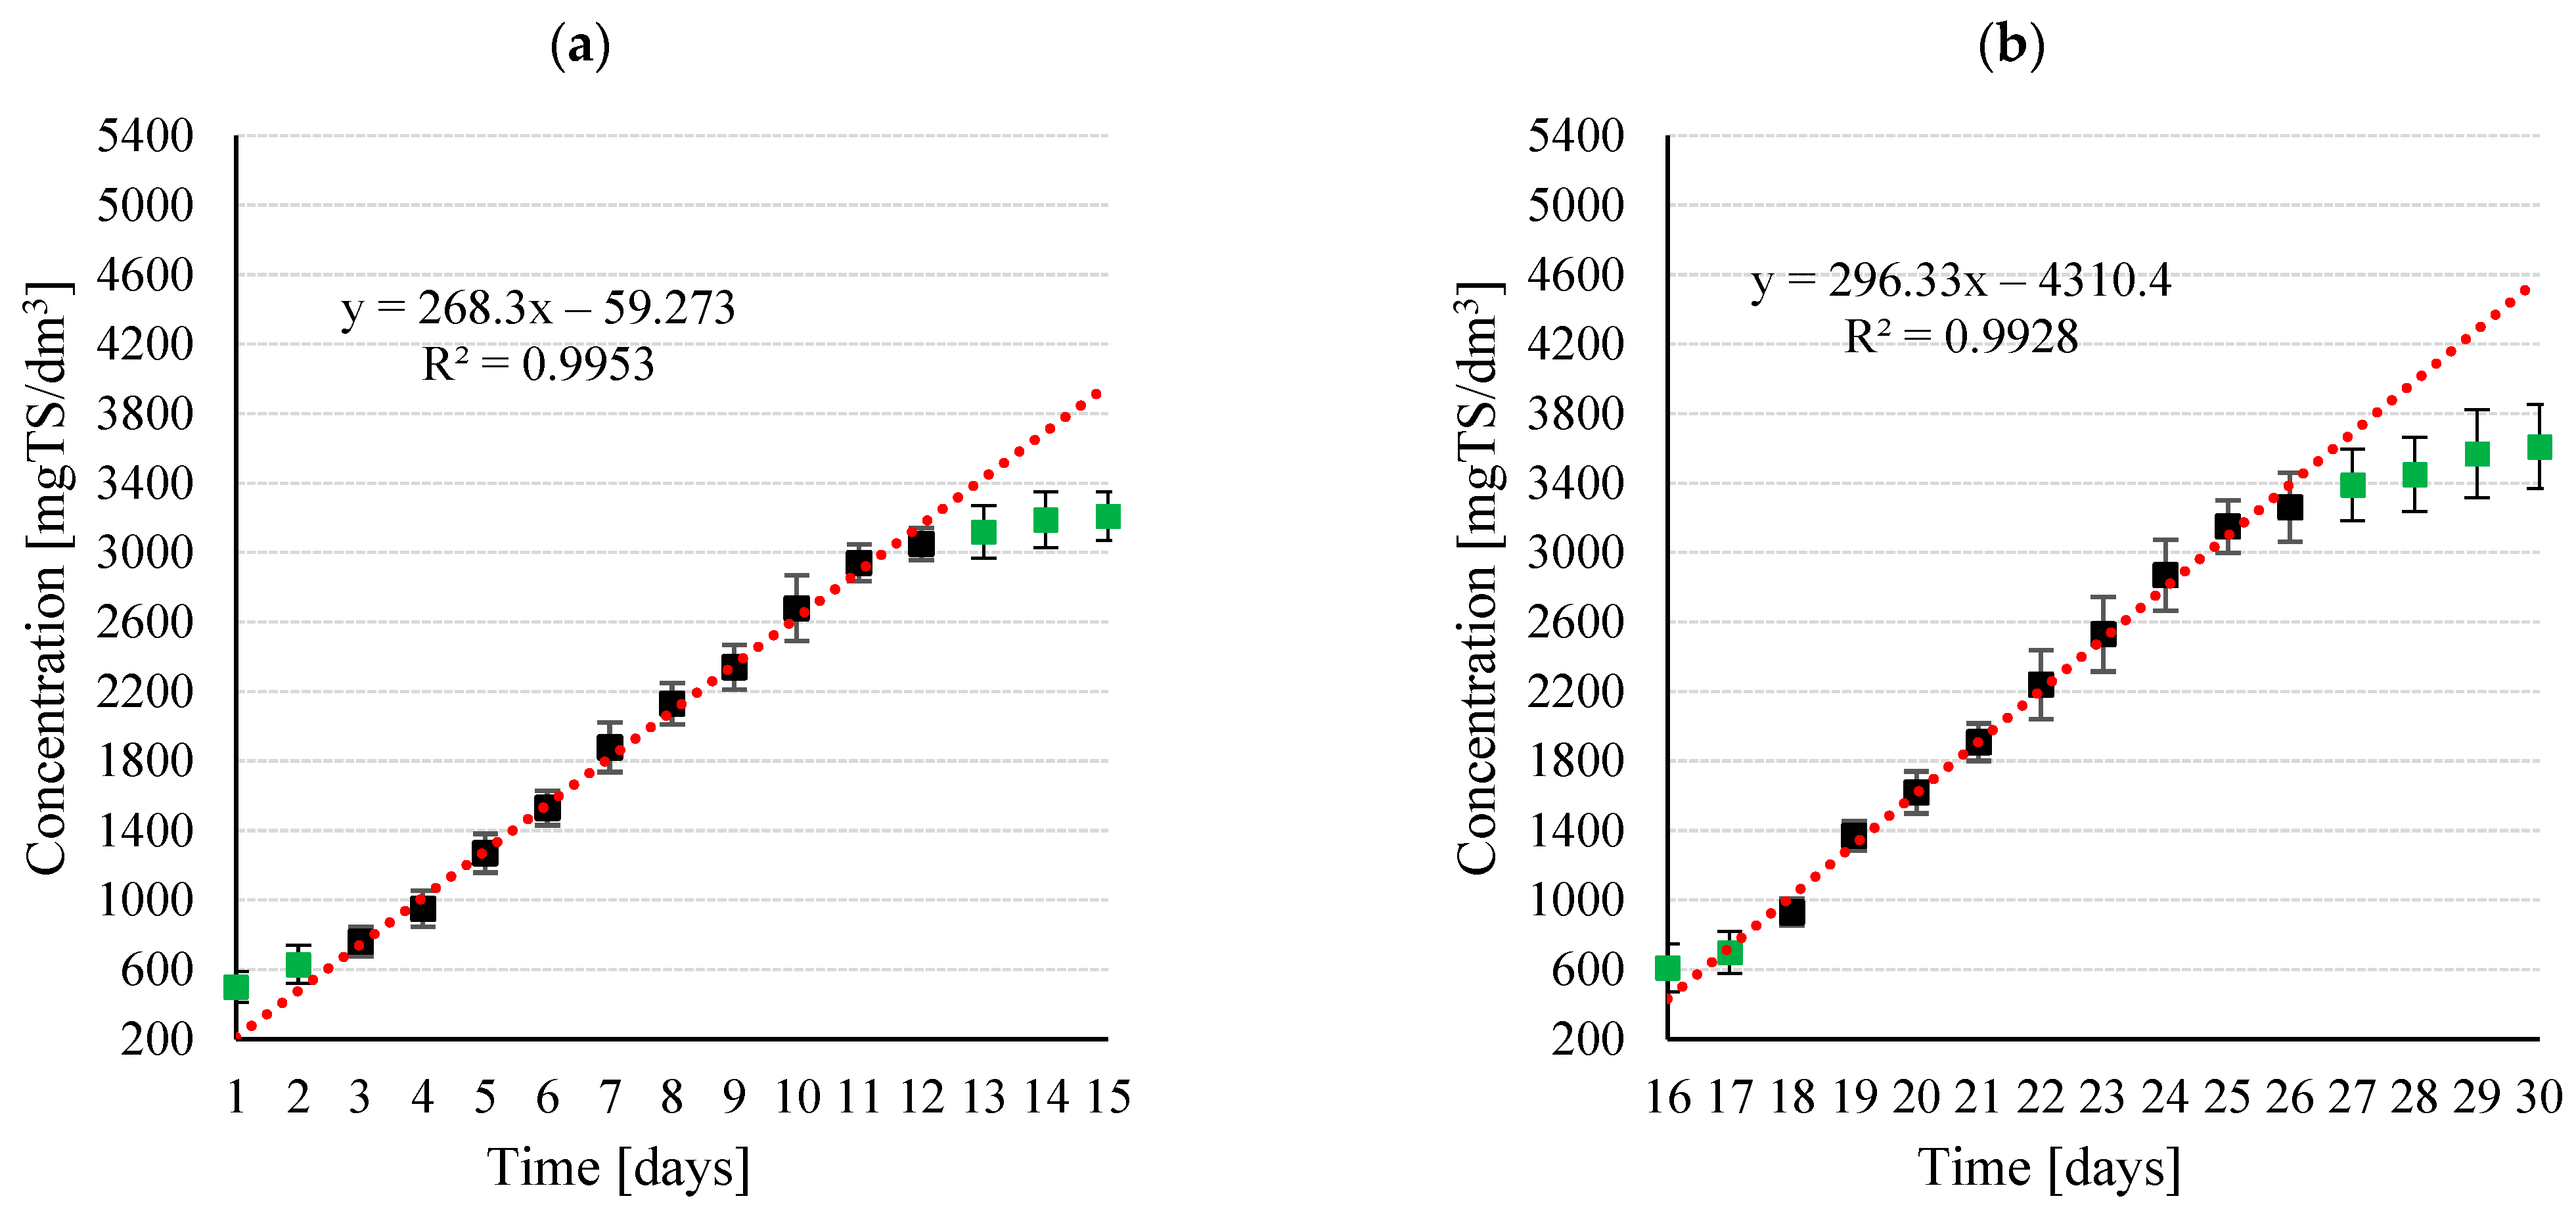
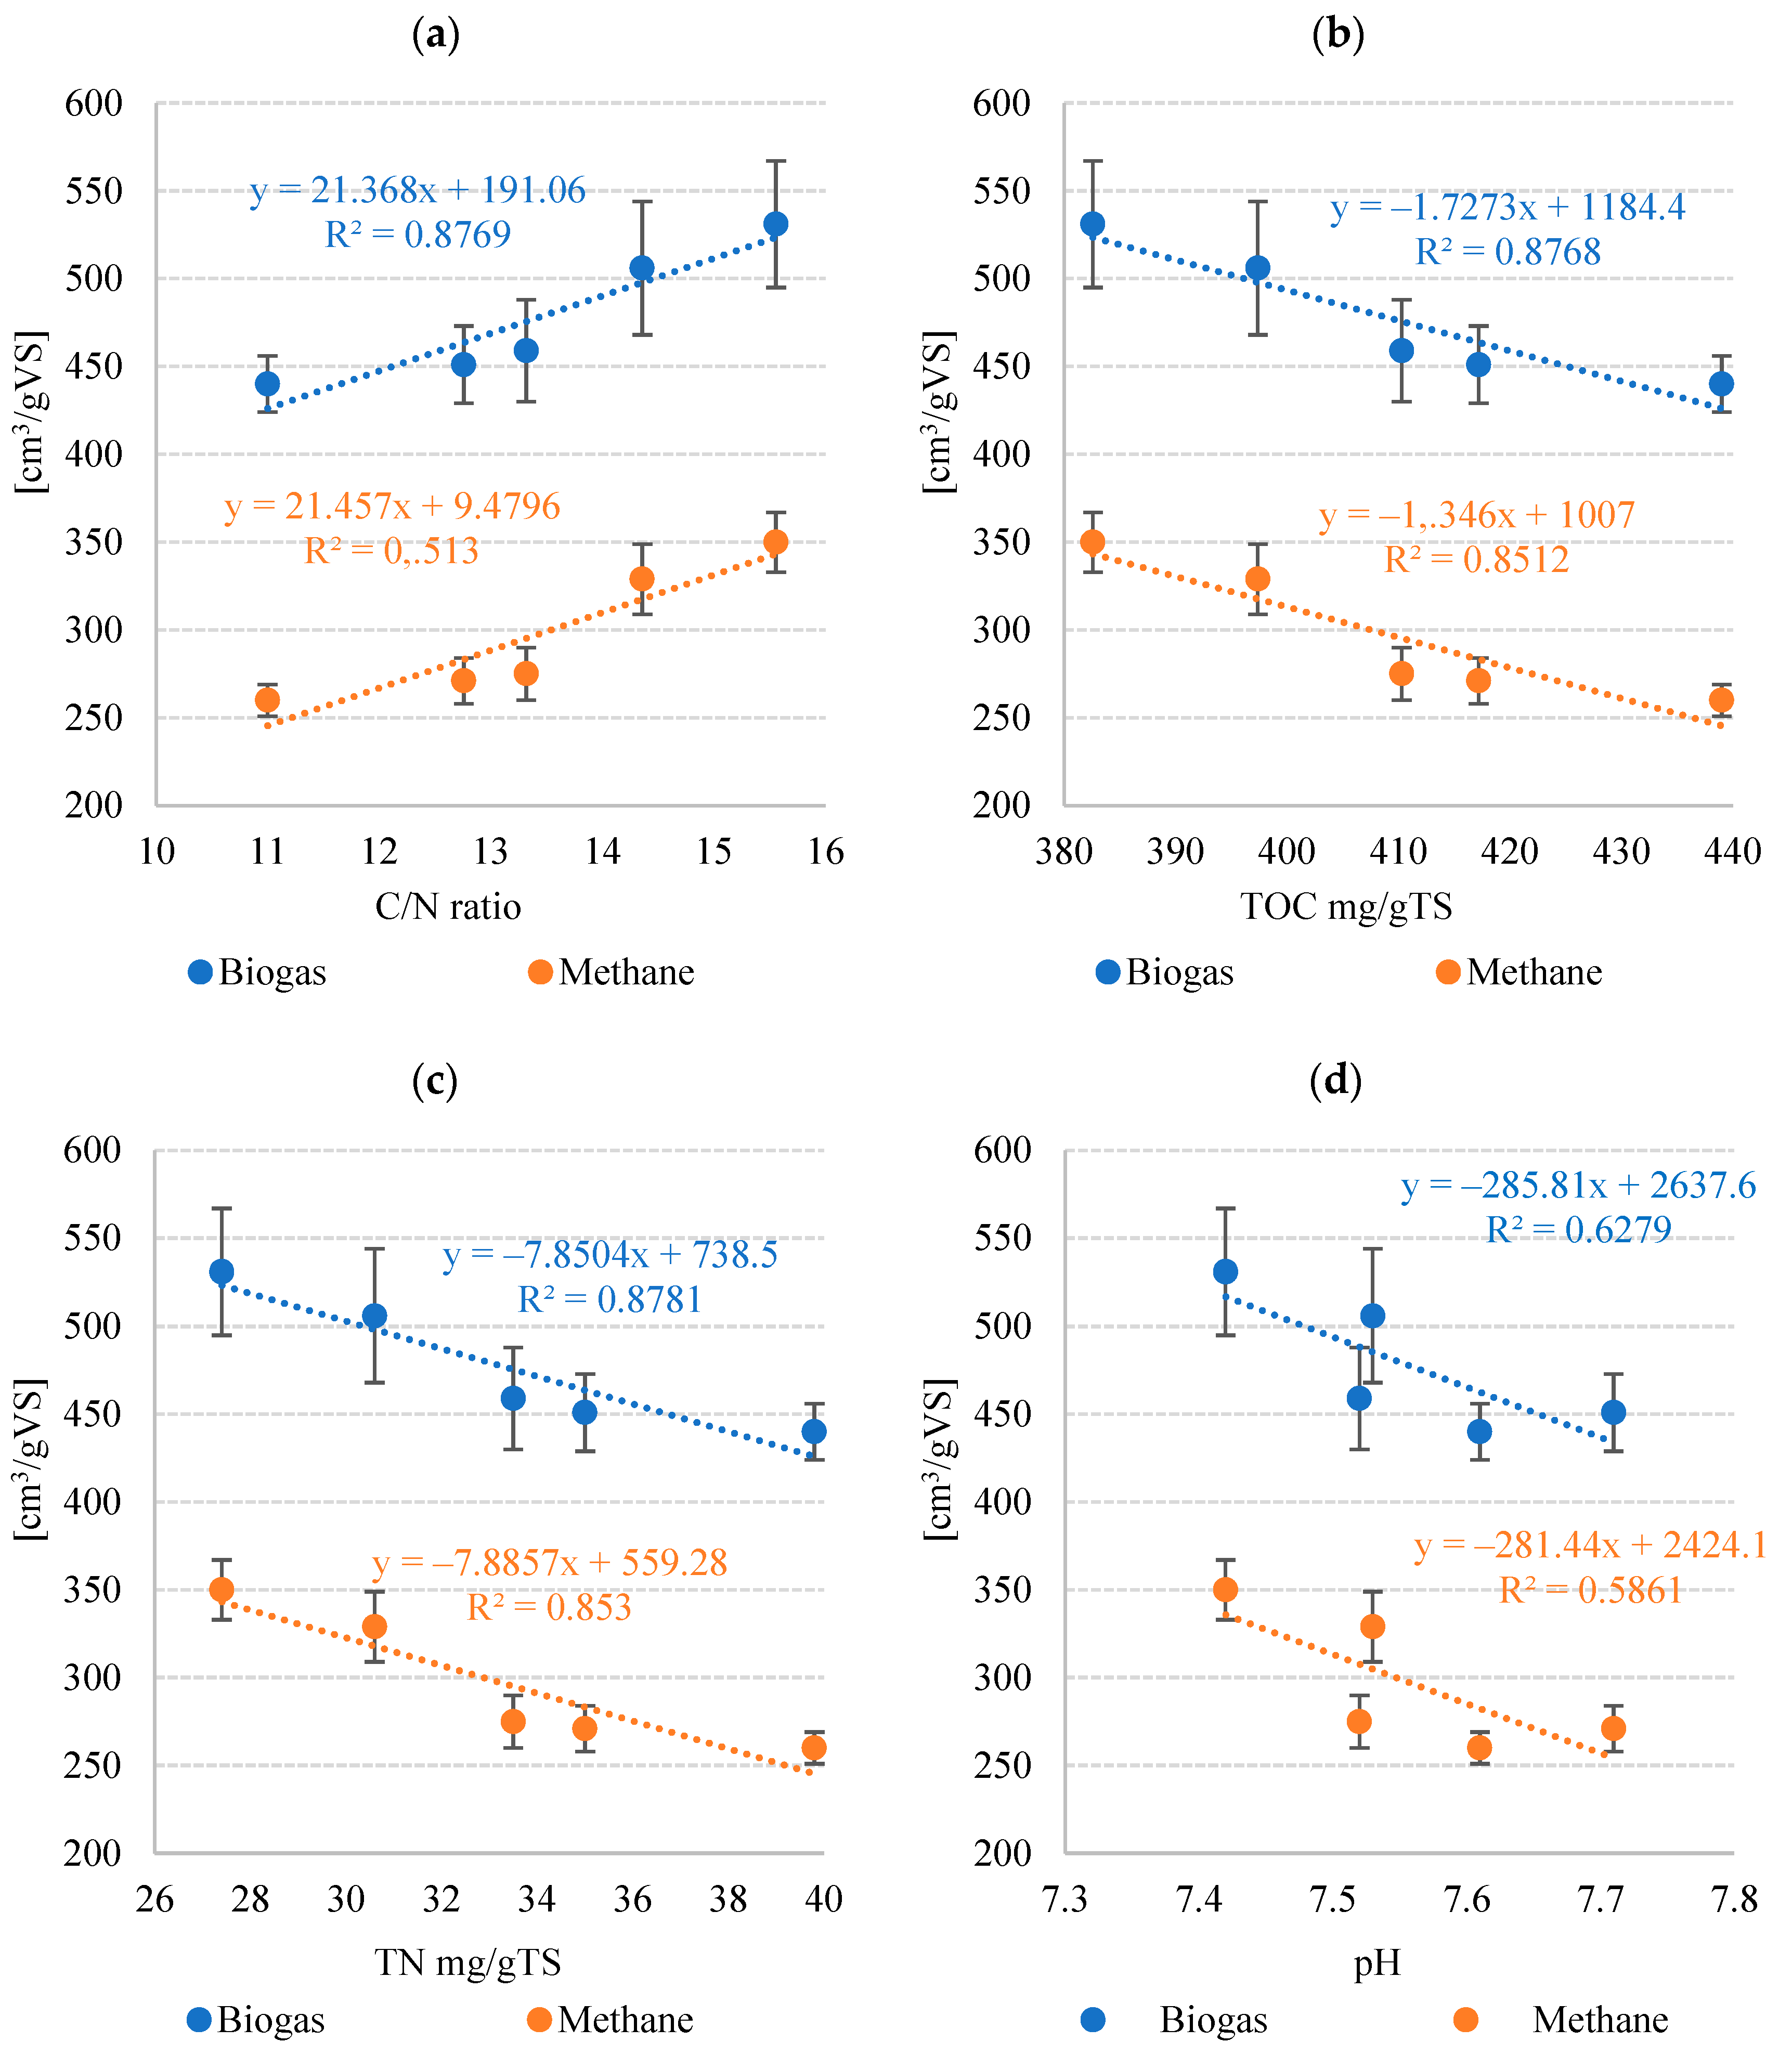
3.2. Stage 2—M-BGS Anaerobic Digestion
4. Conclusions
Author Contributions
Funding
Institutional Review Board Statement
Informed Consent Statement
Data Availability Statement
Conflicts of Interest
References
- Jóźwiakowski, K.; Bugajski, P.; Kurek, K.; de Fátima Nunes de Carvalho, M.; Almeida, M.A.A.; Siwiec, T.; Borowski, G.; Czekała, W.; Dach, J.; Gajewska, M. The Efficiency and Technological Reliability of Biogenic Compounds Removal during Long-Term Operation of a One-Stage Subsurface Horizontal Flow Constructed Wetland. Sep. Purif. Technol. 2018, 202, 216–226. [Google Scholar] [CrossRef]
- Nihemaiti, M.; Miklos, D.B.; Hübner, U.; Linden, K.G.; Drewes, J.E.; Croué, J.P. Removal of Trace Organic Chemicals in Wastewater Effluent by UV/H2O2 and UV/PDS. Water Res. 2018, 145, 487–497. [Google Scholar] [CrossRef] [PubMed]
- Xu, L.; Wu, C.; Liu, P.; Bai, X.; Du, X.; Jin, P.; Yang, L.; Jin, X.; Shi, X.; Wang, Y. Peroxymonosulfate Activation by Nitrogen-Doped Biochar from Sawdust for the Efficient Degradation of Organic Pollutants. Chem. Eng. J. 2020, 387, 124065. [Google Scholar] [CrossRef]
- Guven, H.; Dereli, R.K.; Ozgun, H.; Ersahin, M.E.; Ozturk, I. Towards Sustainable and Energy Efficient Municipal Wastewater Treatment by Up-Concentration of Organics. Prog. Energy Combust. Sci. 2019, 70, 145–168. [Google Scholar] [CrossRef]
- Zhang, J.; Qin, Q.; Li, G.; Tseng, C.H. Sustainable Municipal Waste Management Strategies through Life Cycle Assessment Method: A Review. J. Environ. Manag. 2021, 287, 112238. [Google Scholar] [CrossRef]
- Dudek, M.; Dębowski, M.; Kazimierowicz, J.; Zieliński, M.; Quattrocelli, P.; Nowicka, A. The Cultivation of Biohydrogen-Producing Tetraselmis Subcordiformis Microalgae as the Third Stage of Dairy Wastewater Aerobic Treatment System. Sustainability 2022, 14, 12085. [Google Scholar] [CrossRef]
- Smol, M.; Adam, C.; Preisner, M. Circular Economy Model Framework in the European Water and Wastewater Sector. J. Mater. Cycles. Waste Manag. 2020, 22, 682–697. [Google Scholar] [CrossRef] [Green Version]
- Rani, S.; Ojha, C.S.P. Chlorella Sorokiniana for Integrated Wastewater Treatment, Biomass Accumulation and Value-Added Product Estimation under Varying Photoperiod Regimes: A Comparative Study. J. Water Process. Eng. 2021, 39, 101889. [Google Scholar] [CrossRef]
- Sharma, R.; Mishra, A.; Pant, D.; Malaviya, P. Recent Advances in Microalgae-Based Remediation of Industrial and Non-Industrial Wastewaters with Simultaneous Recovery of Value-Added Products. Bioresour. Technol. 2022, 344, 126129. [Google Scholar] [CrossRef]
- Jamshidi, S. Value-Added Innovation in Infrastructure Systems, Lessons Learned from Wastewater Treatment Plants. TQM J. 2019, 31, 1049–1063. [Google Scholar] [CrossRef]
- Rene, E.R.; Ge, J.; Kumar, G.; Singh, R.P.; Varjani, S. Resource Recovery from Wastewater, Solid Waste, and Waste Gas: Engineering and Management Aspects. Environ. Sci. Pollut. Res. 2020, 27, 17435–17437. [Google Scholar] [CrossRef]
- Wilén, B.M.; Liébana, R.; Persson, F.; Modin, O.; Hermansson, M. The Mechanisms of Granulation of Activated Sludge in Wastewater Treatment, Its Optimization, and Impact on Effluent Quality. Appl. Microbiol. Biotechnol. 2018, 102, 5005–5020. [Google Scholar] [CrossRef] [Green Version]
- Ji, B. Towards Environment-Sustainable Wastewater Treatment and Reclamation by the Non-Aerated Microalgal-Bacterial Granular Sludge Process: Recent Advances and Future Directions. Sci. Total. Environ. 2022, 806, 150707. [Google Scholar] [CrossRef]
- Tan, X.; Xie, G.J.; Nie, W.B.; Xing, D.F.; Liu, B.F.; Ding, J.; Ren, N.Q. High Value-Added Biomaterials Recovery from Granular Sludge Based Wastewater Treatment Process. Resour. Conserv. Recycl. 2021, 169, 105481. [Google Scholar] [CrossRef]
- Chen, H.; Li, A.; Cui, D.; Cui, C.; Ma, F. Evolution of Microbial Community and Key Genera in the Formation and Stability of Aerobic Granular Sludge under a High Organic Loading Rate. Bioresour. Technol. Rep. 2019, 7, 100280. [Google Scholar] [CrossRef]
- Kazimierowicz, J.; Dębowski, M. Aerobic Granular Sludge as a Substrate in Anaerobic Digestion—Current Status and Perspectives. Sustainability 2022, 14, 10904. [Google Scholar] [CrossRef]
- Zhang, X.; Lei, Z.; Liu, Y. Microalgal-Bacterial Granular Sludge for Municipal Wastewater Treatment: From Concept to Practice. Bioresour. Technol. 2022, 354, 127201. [Google Scholar] [CrossRef]
- Ji, B.; Shi, Y.; Yılmaz, M. Microalgal-Bacterial Granular Sludge Process for Sustainable Municipal Wastewater Treatment: Simple Organics versus Complex Organics. J. Water Process. Eng. 2022, 46, 102613. [Google Scholar] [CrossRef]
- Sun, P.; Liu, C.; Li, A.; Ji, B. Using Carbon Dioxide-Added Microalgal-Bacterial Granular Sludge for Carbon-Neutral Municipal Wastewater Treatment under Outdoor Conditions: Performance, Granule Characteristics and Environmental Sustainability. Sci. Total. Environ. 2022, 848, 157657. [Google Scholar] [CrossRef]
- Fan, S.; Ji, B.; Abu Hasan, H.; Fan, J.; Guo, S.; Wang, J.; Yuan, J. Microalgal–Bacterial Granular Sludge Process for Non-Aerated Aquaculture Wastewater Treatment. Bioprocess. Biosyst. Eng. 2021, 44, 1733–1739. [Google Scholar] [CrossRef]
- Wang, S.; Zhu, L.; Ji, B.; Hou, H.; Ma, Y. Microalgal-Bacterial Granular Sludge Process in Non-Aerated Municipal Wastewater Treatment under Natural Day-Night Conditions: Performance and Microbial Community. Water 2021, 13, 1479. [Google Scholar] [CrossRef]
- Zhang, Y.; Zha, M.; Gao, M.; Wang, X. How Weak Static Magnetic Field Contributes to Rapid Granulation and Better Performance of Microalgal-Bacterial Granular Sludge? Chem. Eng. J. 2022, 450, 138162. [Google Scholar] [CrossRef]
- Cao, J.; Chen, F.; Fang, Z.; Gu, Y.; Wang, H.; Lu, J.; Bi, Y.; Wang, S.; Huang, W.; Meng, F. Effect of Filamentous Algae in a Microalgal-Bacterial Granular Sludge System Treating Saline Wastewater: Assessing Stability, Lipid Production and Nutrients Removal. Bioresour. Technol. 2022, 354, 127182. [Google Scholar] [CrossRef] [PubMed]
- Jiang, Q.; Chen, H.; Fu, Z.; Fu, X.; Wang, J.; Liang, Y.; Yin, H.; Yang, J.; Jiang, J.; Yang, X.; et al. Current Progress, Challenges and Perspectives in the Microalgal-Bacterial Aerobic Granular Sludge Process: A Review. Int. J. Environ. Res. Public. Health 2022, 19, 13950. [Google Scholar] [CrossRef] [PubMed]
- Ji, B.; Fan, S.; Liu, Y. A Continuous-Flow Non-Aerated Microalgal-Bacterial Granular Sludge Process for Aquaculture Wastewater Treatment under Natural Day-Night Conditions. Bioresour. Technol. 2022, 350, 126914. [Google Scholar] [CrossRef]
- Corominas, L.; Byrne, D.M.; Guest, J.S.; Hospido, A.; Roux, P.; Shaw, A.; Short, M.D. The Application of Life Cycle Assessment (LCA) to Wastewater Treatment: A Best Practice Guide and Critical Review. Water. Res. 2020, 184, 116058. [Google Scholar] [CrossRef]
- Aragón-Briceño, C.I.; Ross, A.B.; Camargo-Valero, M.A. Mass and Energy Integration Study of Hydrothermal Carbonization with Anaerobic Digestion of Sewage Sludge. Renew. Energy 2021, 167, 473–483. [Google Scholar] [CrossRef]
- Zieliński, M.; Dębowski, M.; Kazimierowicz, J. The Effect of Static Magnetic Field on Methanogenesis in the Anaerobic Digestion of Municipal Sewage Sludge. Energies 2021, 14, 590. [Google Scholar] [CrossRef]
- Dębowski, M.; Kazimierowicz, J.; Zieliński, M.; Bartkowska, I. Co-Fermentation of Microalgae Biomass and Miscanthus × Giganteus Silage—Assessment of the Substrate, Biogas Production and Digestate Characteristics. Appl. Sci. 2022, 12, 7291. [Google Scholar] [CrossRef]
- Dȩbowski, M.; Zieliński, M.; Dudek, M.; Grala, A. Acquisition Feasibility and Methane Fermentation Effectiveness of Biomass of Microalgae Occurring in Eutrophicated Aquifers on the Example of the Vistula Lagoon. Int. J. Green. Energy 2014, 13, 395–407. [Google Scholar] [CrossRef]
- Zhang, Y.; Dong, X.; Liu, S.; Lei, Z.; Shimizu, K.; Zhang, Z.; Adachi, Y.; Lee, D.J. Rapid Establishment and Stable Performance of a New Algal-Bacterial Granule System from Conventional Bacterial Aerobic Granular Sludge and Preliminary Analysis of Mechanisms Involved. J. Water Process. Eng. 2020, 34, 101073. [Google Scholar] [CrossRef]
- Wang, J.; Lei, Z.; Tian, C.; Liu, S.; Wang, Q.; Shimizu, K.; Zhang, Z.; Adachi, Y.; Lee, D.J. Ionic Response of Algal-Bacterial Granular Sludge System during Biological Phosphorus Removal from Wastewater. Chemosphere 2021, 264, 128534. [Google Scholar] [CrossRef] [PubMed]
- Dong, X.; Zhao, Z.; Yang, X.; Lei, Z.; Shimizu, K.; Zhang, Z.; Lee, D.J. Response and Recovery of Mature Algal-Bacterial Aerobic Granular Sludge to Sudden Salinity Disturbance in Influent Wastewater: Granule Characteristics and Nutrients Removal/Accumulation. Bioresour. Technol. 2021, 321, 124492. [Google Scholar] [CrossRef] [PubMed]
- Wu, X.; Li, H.; Lei, L.; Ren, J.; Li, W.; Liu, Y. Tolerance to Short-Term Saline Shocks by Aerobic Granular Sludge. Chemosphere 2020, 243, 125370. [Google Scholar] [CrossRef]
- Lyu, W.; Zhang, S.; Xie, Y.; Chen, R.; Hu, X.; Wang, B.; Guo, W.; Wang, H.; Xing, J.; Zhou, D. Effects of the Exogenous N-Acylhomoserine Lactones on the Performances of Microalgal-Bacterial Granular Consortia. Environ. Pollut. Bioavailab. 2022, 34, 407–418. [Google Scholar] [CrossRef]
- Liu, L.; Xin, Y.; Tong, Z.H.; Zheng, Y.M.; Xie, J.F.; Zhao, Q.B.; Yu, H.Q. Storage Strategy of Aerobic Algae-Bacteria Granular Consortia in Photo-Sequencing Batch Reactor. J. Clean. Prod. 2022, 363, 132410. [Google Scholar] [CrossRef]
- He, Q.; Chen, L.; Zhang, S.; Chen, R.; Wang, H.; Zhang, W.; Song, J. Natural Sunlight Induced Rapid Formation of Water-Born Algal-Bacterial Granules in an Aerobic Bacterial Granular Photo-Sequencing Batch Reactor. J. Hazard. Mater. 2018, 359, 222–230. [Google Scholar] [CrossRef]
- Shen, Y.; Zhu, L.; Ji, B.; Fan, S.; Xiao, Y.; Ma, Y. Reactivation of Frozen Stored Microalgal-Bacterial Granular Sludge under Aeration and Non-Aeration Conditions. Water 2021, 13, 1974. [Google Scholar] [CrossRef]
- Fan, S.; Zhu, L.; Ji, B. Deciphering the Effect of Light Intensity on Microalgal-Bacterial Granular Sludge Process for Non-Aerated Municipal Wastewater Treatment. Algal Res. 2021, 58, 102437. [Google Scholar] [CrossRef]
- Iqbal, K.; Saxena, A.; Pande, P.; Tiwari, A.; Chandra Joshi, N.; Varma, A.; Mishra, A. Microalgae-Bacterial Granular Consortium: Striding towards Sustainable Production of Biohydrogen Coupled with Wastewater Treatment. Bioresour. Technol. 2022, 354, 127203. [Google Scholar] [CrossRef]
- Kant Bhatia, S.; Ahuja, V.; Chandel, N.; Mehariya, S.; Kumar, P.; Vinayak, V.; Saratale, G.D.; Raj, T.; Kim, S.H.; Yang, Y.H. An Overview on Microalgal-Bacterial Granular Consortia for Resource Recovery and Wastewater Treatment. Bioresour. Technol. 2022, 351, 127028. [Google Scholar] [CrossRef]
- Rahimi, S.; Modin, O.; Mijakovic, I. Technologies for Biological Removal and Recovery of Nitrogen from Wastewater. Biotechnol. Adv. 2020, 43, 107570. [Google Scholar] [CrossRef]
- Di Capua, F.; de Sario, S.; Ferraro, A.; Petrella, A.; Race, M.; Pirozzi, F.; Fratino, U.; Spasiano, D. Phosphorous Removal and Recovery from Urban Wastewater: Current Practices and New Directions. Sci. Total. Environ. 2022, 823, 153750. [Google Scholar] [CrossRef]
- Petta, L.; De Gisi, S.; Casella, P.; Farina, R.; Notarnicola, M. Evaluation of the Treatability of a Winery Distillery (Vinasse) Wastewater by UASB, Anoxic-Aerobic UF-MBR and Chemical Precipitation/Adsorption. J. Environ. Manag. 2017, 201, 177–189. [Google Scholar] [CrossRef]
- Ji, B.; Liu, Y. Assessment of Microalgal-Bacterial Granular Sludge Process for Environmentally Sustainable Municipal Wastewater Treatment. ACS ES&T. Water 2021, 1, 2459–2469. [Google Scholar] [CrossRef]
- Hou, H.; Wang, S.; Ji, B.; Zhang, Y.; Pi, K.; Shi, Y. Adaptation Responses of Microalgal-Bacterial Granular Sludge to Polystyrene Microplastic Particles in Municipal Wastewater. Environ. Sci. Pollut. Res. 2022, 29, 59965–59973. [Google Scholar] [CrossRef]
- Van Nguyen, B.; Yang, X.; Hirayama, S.; Wang, J.; Zhao, Z.; Lei, Z.; Shimizu, K.; Zhang, Z.; Le, S.X. Effect of Salinity on Cr(VI) Bioremediation by Algal-Bacterial Aerobic Granular Sludge Treating Synthetic Wastewater. Process 2021, 9, 1400. [Google Scholar] [CrossRef]
- Chalima, A.; Oliver, L.; De Castro, L.F.; Karnaouri, A.; Dietrich, T.; Topakas, E. Utilization of Volatile Fatty Acids from Microalgae for the Production of High Added Value Compounds. Ferment 2017, 3, 54. [Google Scholar] [CrossRef] [Green Version]
- Choi, W.J.; Chae, A.N.; Song, K.G.; Park, J.; Lee, B.C. Effect of Trophic Conditions on Microalga Growth, Nutrient Removal, Algal Organic Matter, and Energy Storage Products in Scenedesmus (Acutodesmus) Obliquus KGE-17 Cultivation. Bioprocess. Biosyst. Eng. 2019, 42, 1225–1234. [Google Scholar] [CrossRef]
- Hidaka, T.; Takabe, Y.; Tsumori, J.; Minamiyama, M. Characterization of Microalgae Cultivated in Continuous Operation Combined with Anaerobic Co-Digestion of Sewage Sludge and Microalgae. Biomass. Bioenergy 2017, 99, 139–146. [Google Scholar] [CrossRef]
- Kim, J.; Kang, C.M. Increased Anaerobic Production of Methane by Co-Digestion of Sludge with Microalgal Biomass and Food Waste Leachate. Bioresour. Technol. 2015, 189, 409–412. [Google Scholar] [CrossRef] [PubMed]
- Beltrán, C.; Jeison, D.; Fermoso, F.G.; Borja, R. Batch Anaerobic Co-Digestion of Waste Activated Sludge and Microalgae (Chlorella Sorokiniana) at Mesophilic Temperature. J. Environ. Sci. Health Part A 2016, 51, 847–850. [Google Scholar] [CrossRef] [PubMed] [Green Version]
- Adewale, O.A. Enhancing Methane Production in the UK WWTP Via Co-Digestion of Microalgae and Sewage Sludge. Ph.D. Dissertation, University of Leeds, Leeds, UK, 2014. [Google Scholar]
- Thorin, E.; Olsson, J.; Schwede, S.; Nehrenheim, E. Co-Digestion of Sewage Sludge and Microalgae—Biogas Production Investigations. Appl. Energy 2018, 227, 64–72. [Google Scholar] [CrossRef]


| LF-DSS | ||
|---|---|---|
| Indicator | Unit | Value |
| COD | mgO2/dm3 | 719.3 ± 57 |
| TOC | mgC/dm3 | 524 ± 62 |
| TP | mgP/dm3 | 26.8 ± 1.8 |
| P-PO4 | mg P-PO4/dm3 | 21.1 ± 2.4 |
| TN | mgN/dm3 | 52.9 ± 4.7 |
| N-NH4 | mg N-NH4/dm3 | 46.3 ± 3.9 |
| pH | - | 7.24 ± 0.13 |
| Air | ||
| Indicator | Unit | Value |
| CO2 | ppm | 790 ± 70 |
| H2S | ppm | 120 ± 30 |
| O2 | % | 20.81 ± 0.12 |
| N2 | % | 77.94 ± 0.11 |
| Indicator | Unit | Value |
|---|---|---|
| TS | % FM | 4.7 ± 1.3 |
| VS | % TS | 70.9 ± 2.5 |
| TN | mg/gTS | 45.3 ± 3.1 |
| TP | mg/gTS | 4.0 ± 1.0 |
| TC | mg/gTS | 384 ± 29 |
| TOC | mg/gTS | 316 ± 30 |
| C:N | - | 6.9 ± 0.2 |
| pH | - | 6.7 ± 0.2 |
| protein | % TS | 28.3 ± 1.9 |
| lipids | % TS | 6.1 ± 0.8 |
| saccharides | % TS | 1.8 ± 0.5 |
| Parameter | Unit | Value | ||||
|---|---|---|---|---|---|---|
| Start | d 15 | d 30 | d 45 | d 60 | ||
| VS | % TS | 87.9 ± 1.3 | 85.0 ± 2.2 | 84.0 ± 2.7 | 80.3 ± 4.2 | 82.3 ± 3.5 |
| TN | mg/gTS | 39.8 ± 2.4 | 35.0 ± 1.7 | 33.5 ± 3.1 | 27.4 ± 3.9 | 30.6 ± 3.4 |
| TP | mg/gTS | 16.4 ± 1.1 | 14.8 ± 1.8 | 14.3 ± 2.0 | 12.1 ± 3.1 | 13.3 ± 2.9 |
| TC | mg/gTS | 502 ± 42 | 477.4 ± 56 | 469.5 ± 72 | 438.2 ± 81 | 455.0 ± 74 |
| TOC | mg/gTS | 439 ± 30 | 417.2 ± 61 | 410.3 ± 66 | 382.6 ± 65 | 397.4 ± 70 |
| C:N | - | 11.0 ± 1.4 | 12.8 ± 1.3 | 13.3 ± 1.8 | 15.6 ± 2.4 | 14.4 ± 2.0 |
| pH | - | 7.61 ± 0.08 | 7.71 ± 0.09 | 7.52 ± 0.11 | 7.42 ± 0.09 | 7.53 ± 0.07 |
| protein | % TS | 24.9 ± 1.5 | 21.9 ± 2.2 | 20.9 ± 1.9 | 17.1 ± 2.2 | 19.1 ± 2.1 |
| lipids | % TS | 13.2 ± 0.9 | 12.1 ± 1.1 | 11.7 ± 1.0 | 10.3 ± 0.9 | 11.1 ± 1.3 |
| Parameter | Unit | Reactor | 1st-Pass Filtrate | 1st-Pass Effluent | 2nd-Pass Filtrate | 2nd-Pass Effluent |
|---|---|---|---|---|---|---|
| Volume | dm3 | 1000 | 61 ± 4 | 939 ± 4 | 84 ± 2 | 855 ± 2 |
| Biomass concentration | gTS/dm3 | 4.8 ± 0.5 | 59 ± 3.1 | 1.3 ± 0.2 | 14 ± 1.3 | 0.029 ± 0.01 |
| Biomass quantity | gTS | 4800 ± 503 | 3600 ± 200 | 1200 ± 190 | 1175 ± 110 | 25 ± 0.8 |
| Water content | % | 99.52 ± 0.31 | 94.10 ± 0.24 | 99.76 ± 0.12 | 98.60 ± 0.22 | 99.98 ± 0.01 |
| Parameter | Final Concentration (mg/dm3) | Removal (%) | ||||||
| d 15 | d 30 | d 45 | d 60 | d 15 | d 30 | d 45 | d 60 | |
| COD | 277 ± 22 | 193 ± 15 | 174 ± 14 | 114 ± 9 | 61.4 ± 2.3 | 73.1 ± 1.7 | 75.8 ± 3.2 | 84.1 ± 5.1 |
| TOC | 147 ± 17 | 99.0 ± 12 | 87.0 ± 10.3 | 61.8 ± 7.4 | 71.9 ± 2.7 | 80.7 ± 3.0 | 83.4 ± 4.7 | 88.2 ± 7.2 |
| TP | 7.69 ± 0.82 | 7.54 ± 0.81 | 7.58 ± 0.81 | 7.36 ± 0.79 | 54.2 ± 4.1 | 55.1 ± 3.9 | 54.9 ± 3.8 | 56.2 ± 4.6 |
| P-PO4 | 0.98 ± 0.23 | 1.25 ± 0.30 | 1.19 ± 0.28 | 1.10 ± 0.26 | 90.3 ± 1.7 | 87.6 ± 1.2 | 88.2 ± 2.3 | 89.1 ± 1.1 |
| TN | 15.2 ± 1.3 | 15.6 ± 1.4 | 17.4 ± 1.6 | 16.5 ± 1.5 | 71.3 ± 3.1 | 70.5 ± 2.9 | 67.2 ± 2.4 | 68.9 ± 3.1 |
| N-NH4 | 5.00 ± 0.42 | 4.31 ± 0.36 | 5.93 ± 0.50 | 5.51 ± 0.46 | 89.2 ± 1.4 | 90.7 ± 1.7 | 87.2 ± 1.3 | 88.1 ± 1.6 |
| Parameter | Load in | Load removed | ||||||
| d 15 | d 30 | d 45 | d 60 | d 15 | d 30 | d 45 | d 60 | |
| COD | 71.9 ± 5.7 | 44.1 ± 3.5 | 52.6 ± 4.2 | 54.5 ± 4.3 | 60.5 ± 4.8 | |||
| TOC | 52.4 ± 6.2 | 37.7 ± 4.4 | 42.3 ± 5.0 | 43.7 ± 5.2 | 46.2 ± 5.5 | |||
| TP | 2.68 ± 0.18 | 1.45 ± 0.14 | 1.48 ± 0.11 | 1.47 ± 0.09 | 1.51 ± 0.16 | |||
| P-PO4 | 2.11 ± 0.24 | 1.91 ± 0.22 | 1.85 ± 0.20 | 1.86 ± 0.18 | 1.88 ± 0.32 | |||
| TN | 5.29 ± 0.47 | 3.77 ± 0.33 | 3.73 ± 0.45 | 3.55 ± 0.24 | 3.64 ± 0.32 | |||
| N-NH4 | 4.63 ± 0.39 | 4.13 ± 0.47 | 4.20 ± 0.71 | 4.04 ± 0.62 | 4.08 ± 0.91 | |||
| Parameter | Biomass gained [gTS/gin] | Biomass gained [TS/grem] | ||||||
| d 15 | d 30 | d 45 | d 60 | d 15 | d 30 | d 45 | d 60 | |
| COD | 3.73 ± 0.39 | 6.70 ± 0.51 | 6.03 ± 0.72 | 7.74 ± 0.93 | 6.07 ± 0.22 | 5.63 ± 0.47 | 5.82 ± 0.64 | 6.98 ± 0.88 |
| TOC | 5.11 ± 0.68 | 5.65 ± 0.43 | 6.05 ± 0.88 | 8.05 ± 1.02 | 7.11 ± 0.83 | 7.00 ± 0.63 | 7.25 ± 1.01 | 9.13 ± 1.14 |
| TP | 100 ± 12 | 110 ± 11 | 118 ± 14 | 157 ± 17 | 184 ± 19 | 200 ± 23 | 215 ± 18 | 280 ± 22 |
| P-PO4 | 127 ± 16.1 | 140 ± 12.9 | 150 ± 17.3 | 200 ± 21.5 | 141 ± 18.9 | 160 ± 14.6 | 170 ± 17.9 | 224 ± 23.8 |
| TN | 50.7 ± 5.2 | 56.0 ± 3.1 | 59.9 ± 5.4 | 79.8 ± 5.9 | 71.1 ± 6.3 | 79.4 ± 4.8 | 89.2 ± 9.1 | 115.8 ± 11.0 |
| N-NH4 | 57.9 ± 5.9 | 63.9 ± 4.0 | 68.5 ± 5.8 | 91.1 ± 8.1 | 64.9 ± 7.2 | 70.5 ± 5.5 | 78.5 ± 6.1 | 103 ± 9.9 |
| Indicator | Unit | Phase of Experiment | |||||
|---|---|---|---|---|---|---|---|
| Start | 15 Days | 30 Days | 45 Days | 60 Days | |||
| Biogas | Output | cm3/gVS | 440 ± 16 | 451 ± 22 | 459 ± 29 | 531 ± 36 | 506 ± 38 |
| cm3/gTS | 501 ± 18 | 530 ± 26 | 546 ± 34 | 661 ± 45 | 615 ± 46 | ||
| r rate | cm3/gVS· d | 57.2 ± 1.4 | 63.14 ± 2.6 | 59.7 ± 3.4 | 79.7 ± 5.1 | 75.9 ± 4.3 | |
| Rate constant (k) | 1/day | 0.13 ± 0.01 | 0.14 ± 0.02 | 0.13 ± 0.02 | 0.15 ± 0.03 | 0.15 ± 0.03 | |
| Methane | Methane fraction | % | 59.1 ± 2.0 | 60.2 ± 2.1 | 60.7 ± 3.1 | 66.2 ± 2.7 | 65.5 ± 3.0 |
| Output | cm3/gVS | 260 ± 9 | 271 ± 13 | 275 ± 15 | 350 ± 17 | 329 ± 20 | |
| cm3/gTS | 295 ± 10 | 318 ± 15 | 327 ± 18 | 436 ± 21 | 400 ± 24 | ||
| r rate | cm3/gVS· d | 36.3 ± 0.8 | 37.9 ± 1.4 | 38.6 ± 1.8 | 52.5 ± 2.6 | 49.3 ± 2.4 | |
| Rate constant (k) | 1/day | 0.14 ± 0.01 | 0.14 ± 0.02 | 0.14 ± 0.02 | 0.15 ± 0.03 | 0.15 ± 0.03 | |
Disclaimer/Publisher’s Note: The statements, opinions and data contained in all publications are solely those of the individual author(s) and contributor(s) and not of MDPI and/or the editor(s). MDPI and/or the editor(s) disclaim responsibility for any injury to people or property resulting from any ideas, methods, instructions or products referred to in the content. |
© 2023 by the authors. Licensee MDPI, Basel, Switzerland. This article is an open access article distributed under the terms and conditions of the Creative Commons Attribution (CC BY) license (https://creativecommons.org/licenses/by/4.0/).
Share and Cite
Kazimierowicz, J.; Dębowski, M.; Zieliński, M. Taxonomic Structure Evolution, Chemical Composition and Anaerobic Digestibility of Microalgae-Bacterial Granular Sludge (M-BGS) Grown during Treatment of Digestate. Appl. Sci. 2023, 13, 1098. https://doi.org/10.3390/app13021098
Kazimierowicz J, Dębowski M, Zieliński M. Taxonomic Structure Evolution, Chemical Composition and Anaerobic Digestibility of Microalgae-Bacterial Granular Sludge (M-BGS) Grown during Treatment of Digestate. Applied Sciences. 2023; 13(2):1098. https://doi.org/10.3390/app13021098
Chicago/Turabian StyleKazimierowicz, Joanna, Marcin Dębowski, and Marcin Zieliński. 2023. "Taxonomic Structure Evolution, Chemical Composition and Anaerobic Digestibility of Microalgae-Bacterial Granular Sludge (M-BGS) Grown during Treatment of Digestate" Applied Sciences 13, no. 2: 1098. https://doi.org/10.3390/app13021098