
Analysis of Mechanical Excavation Characteristics by Pre-Cutting Machine Based on Linear Cutting Tests

Abstract
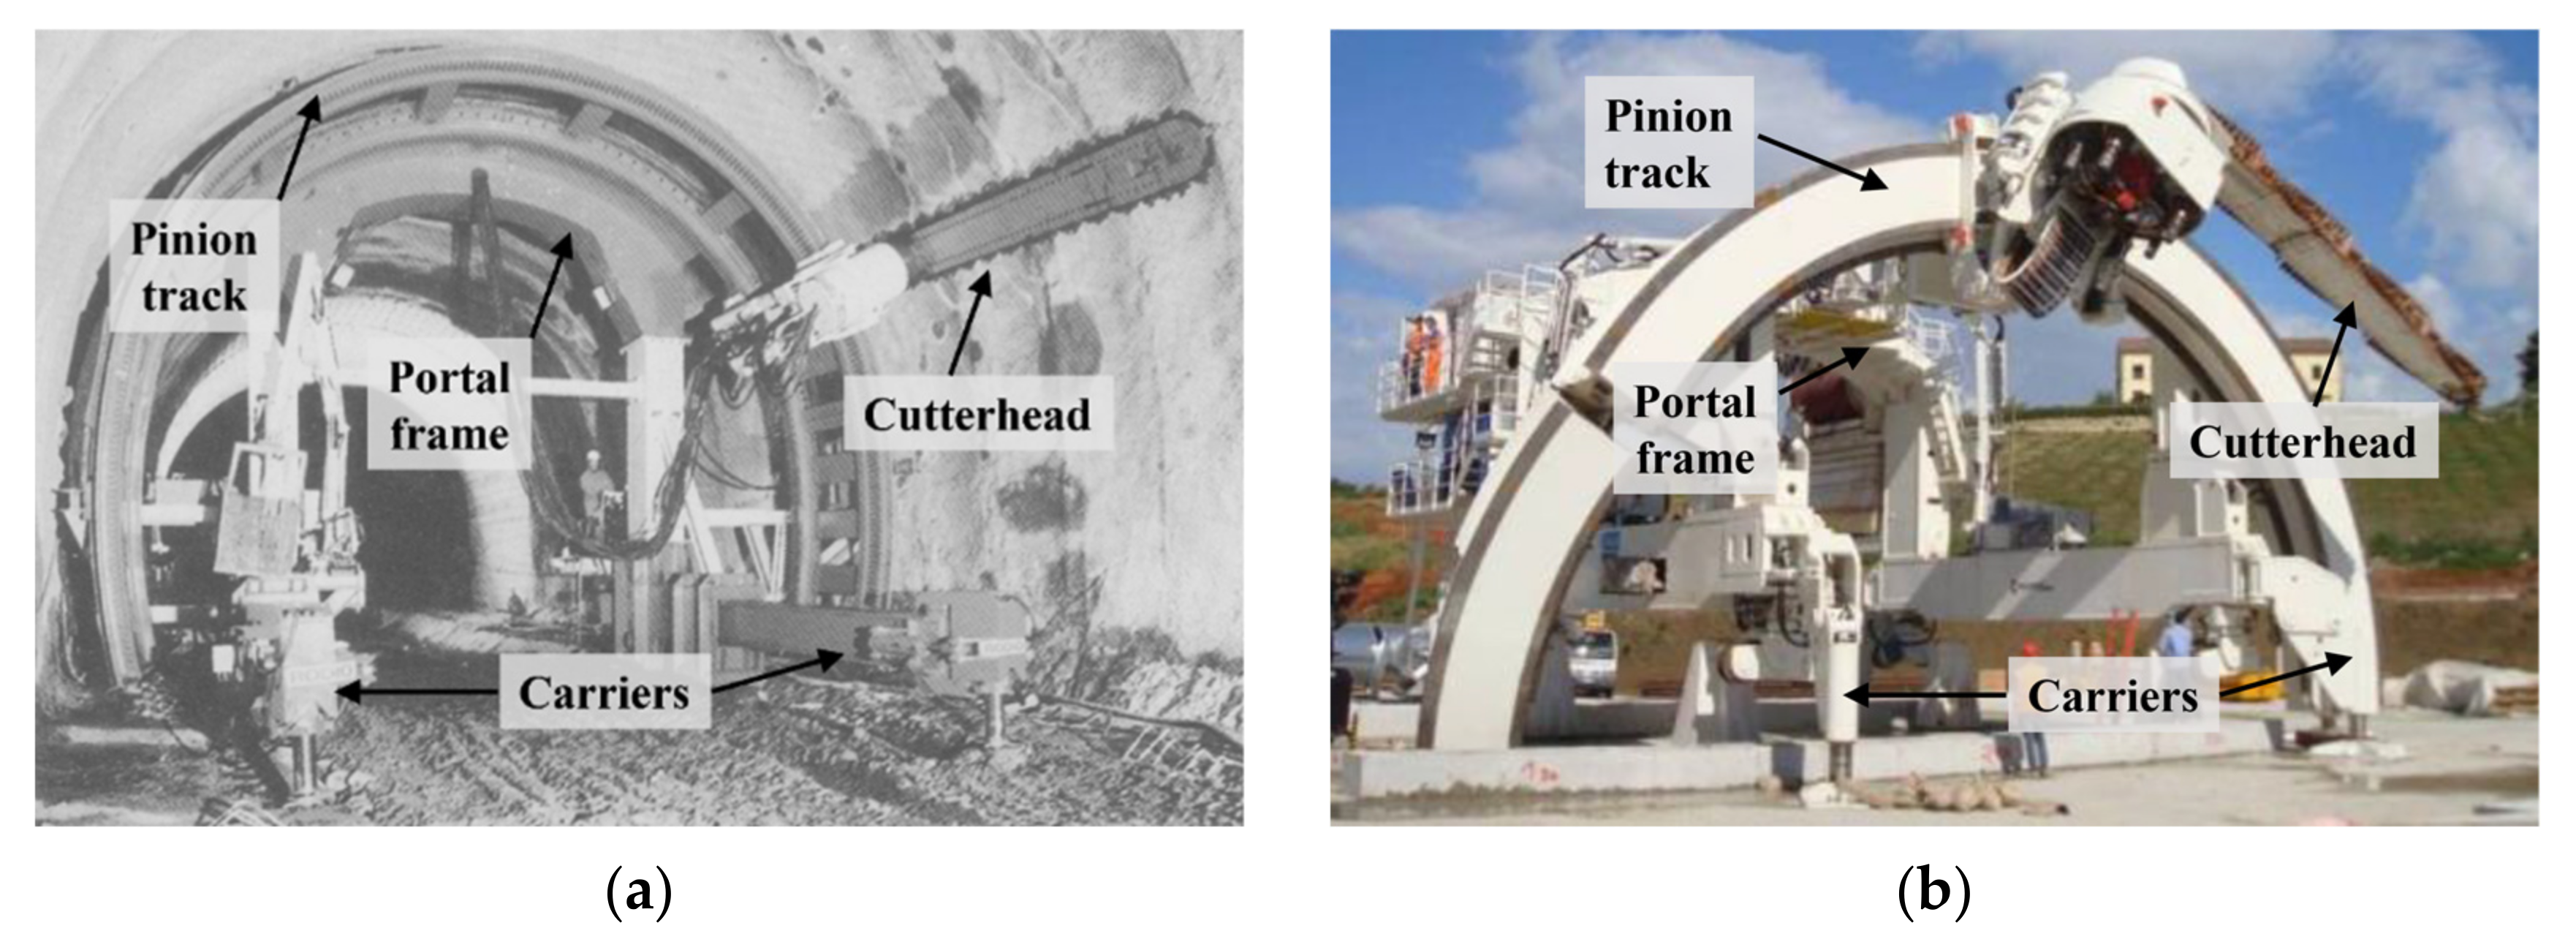
:1. Introduction
2. Experimental Setup and Procedures
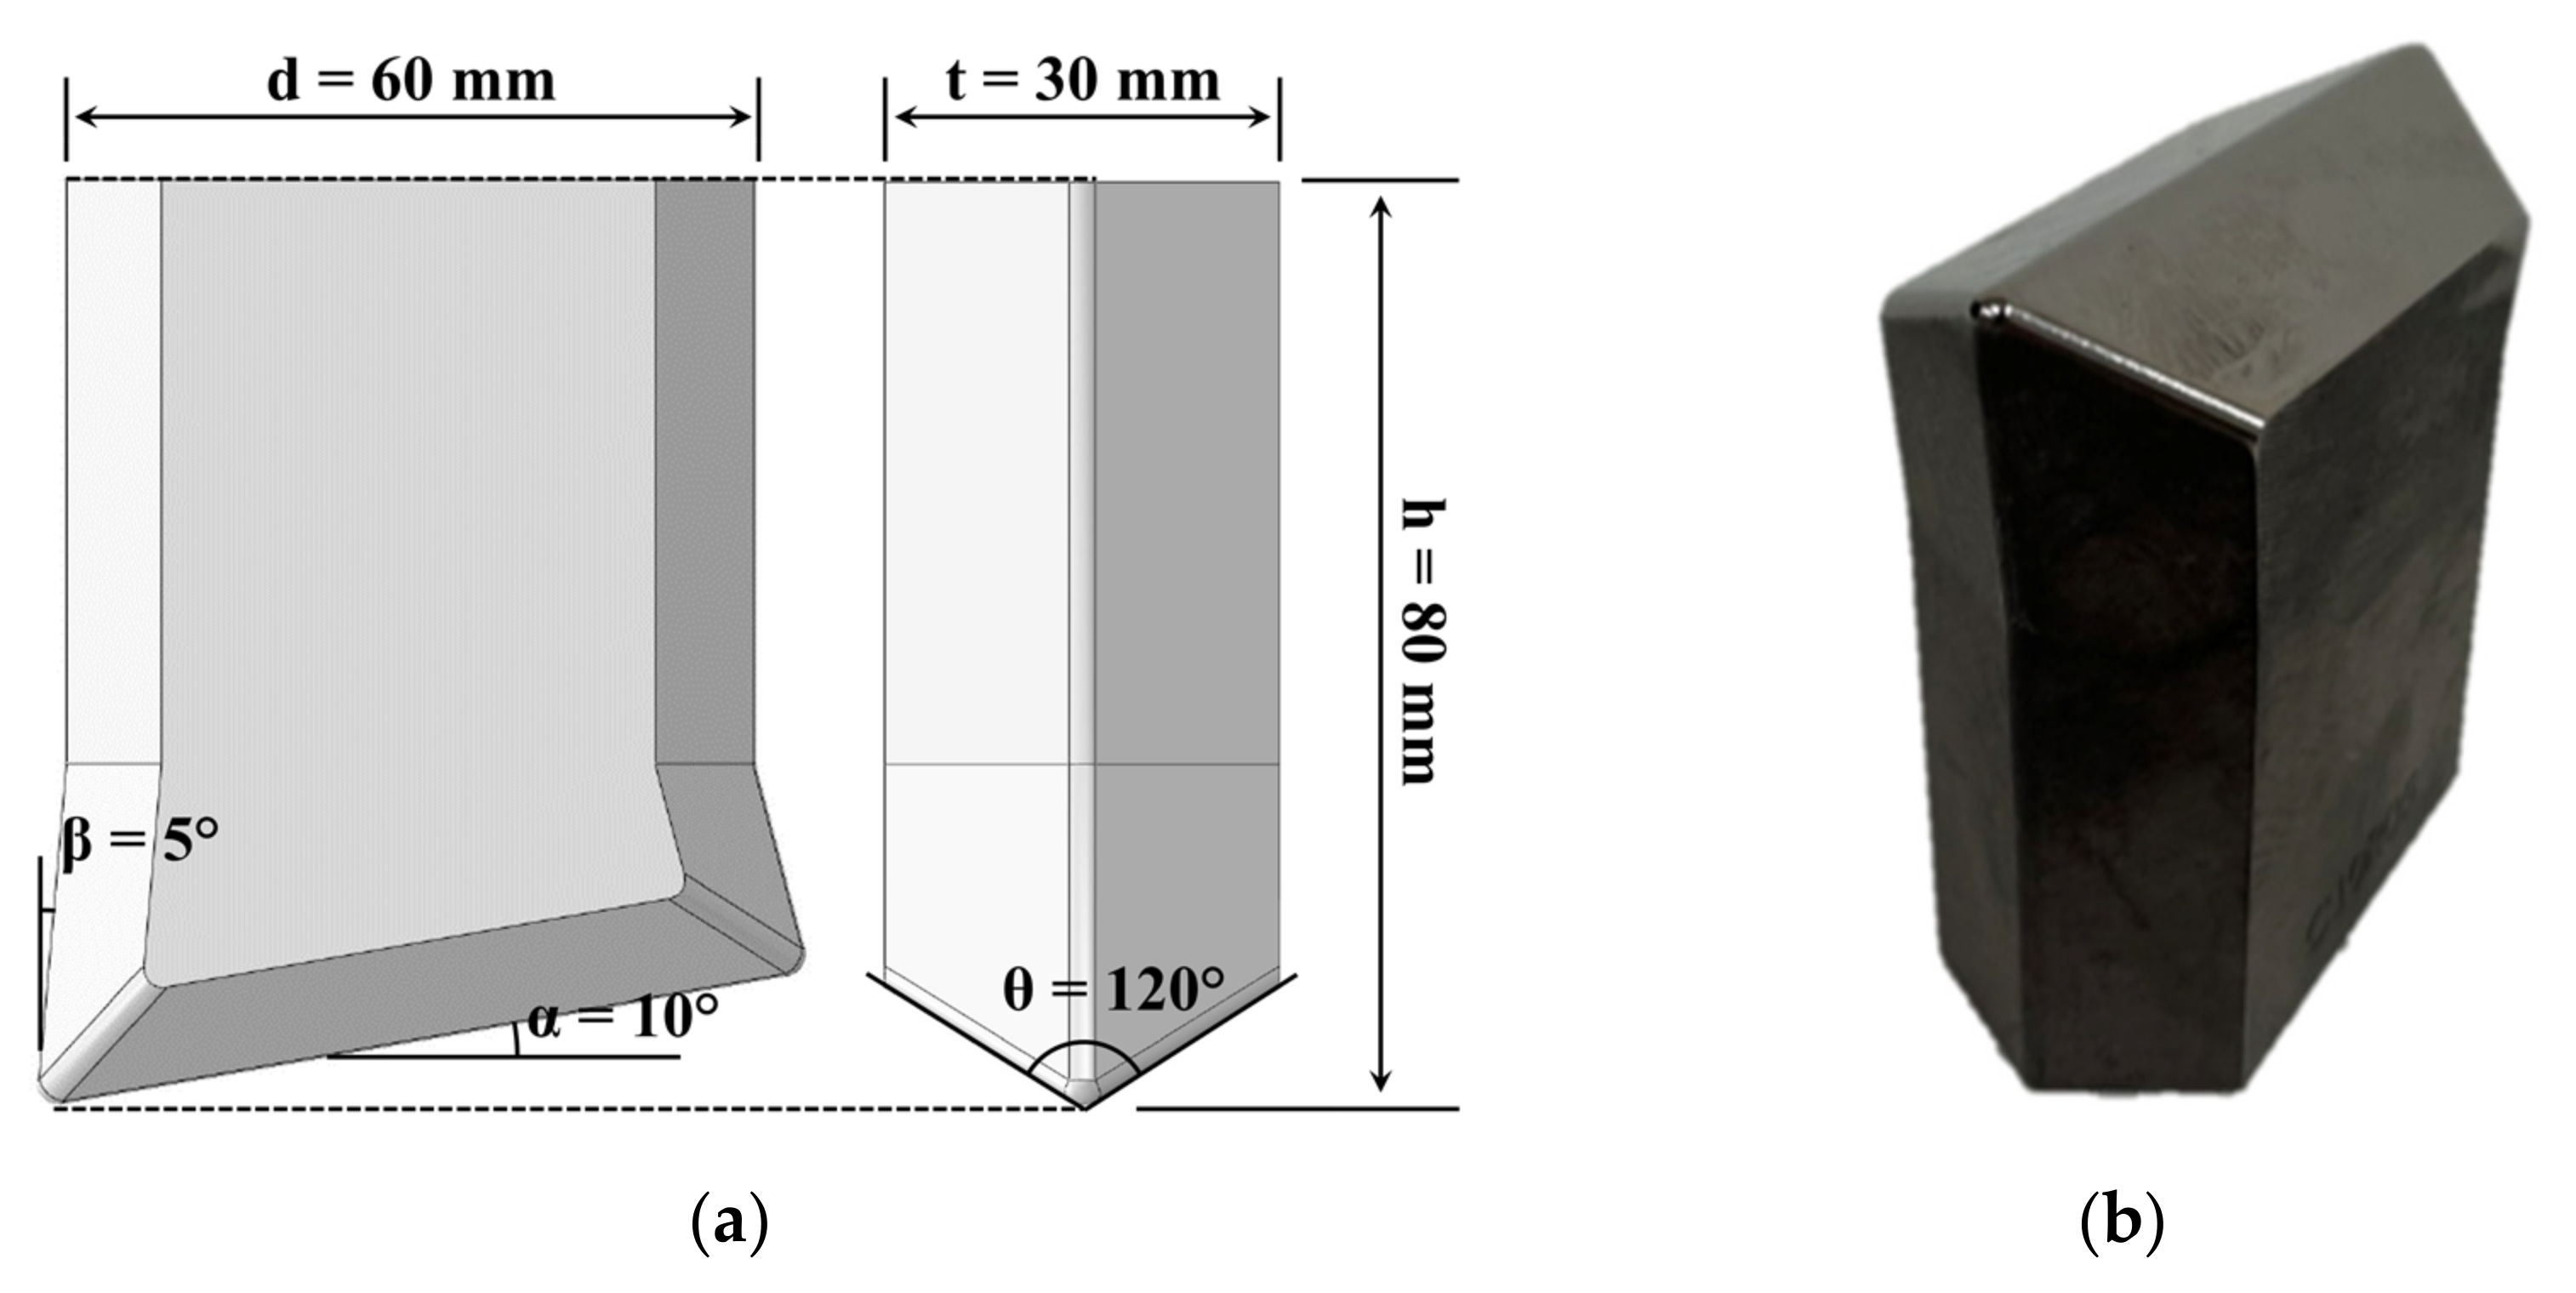
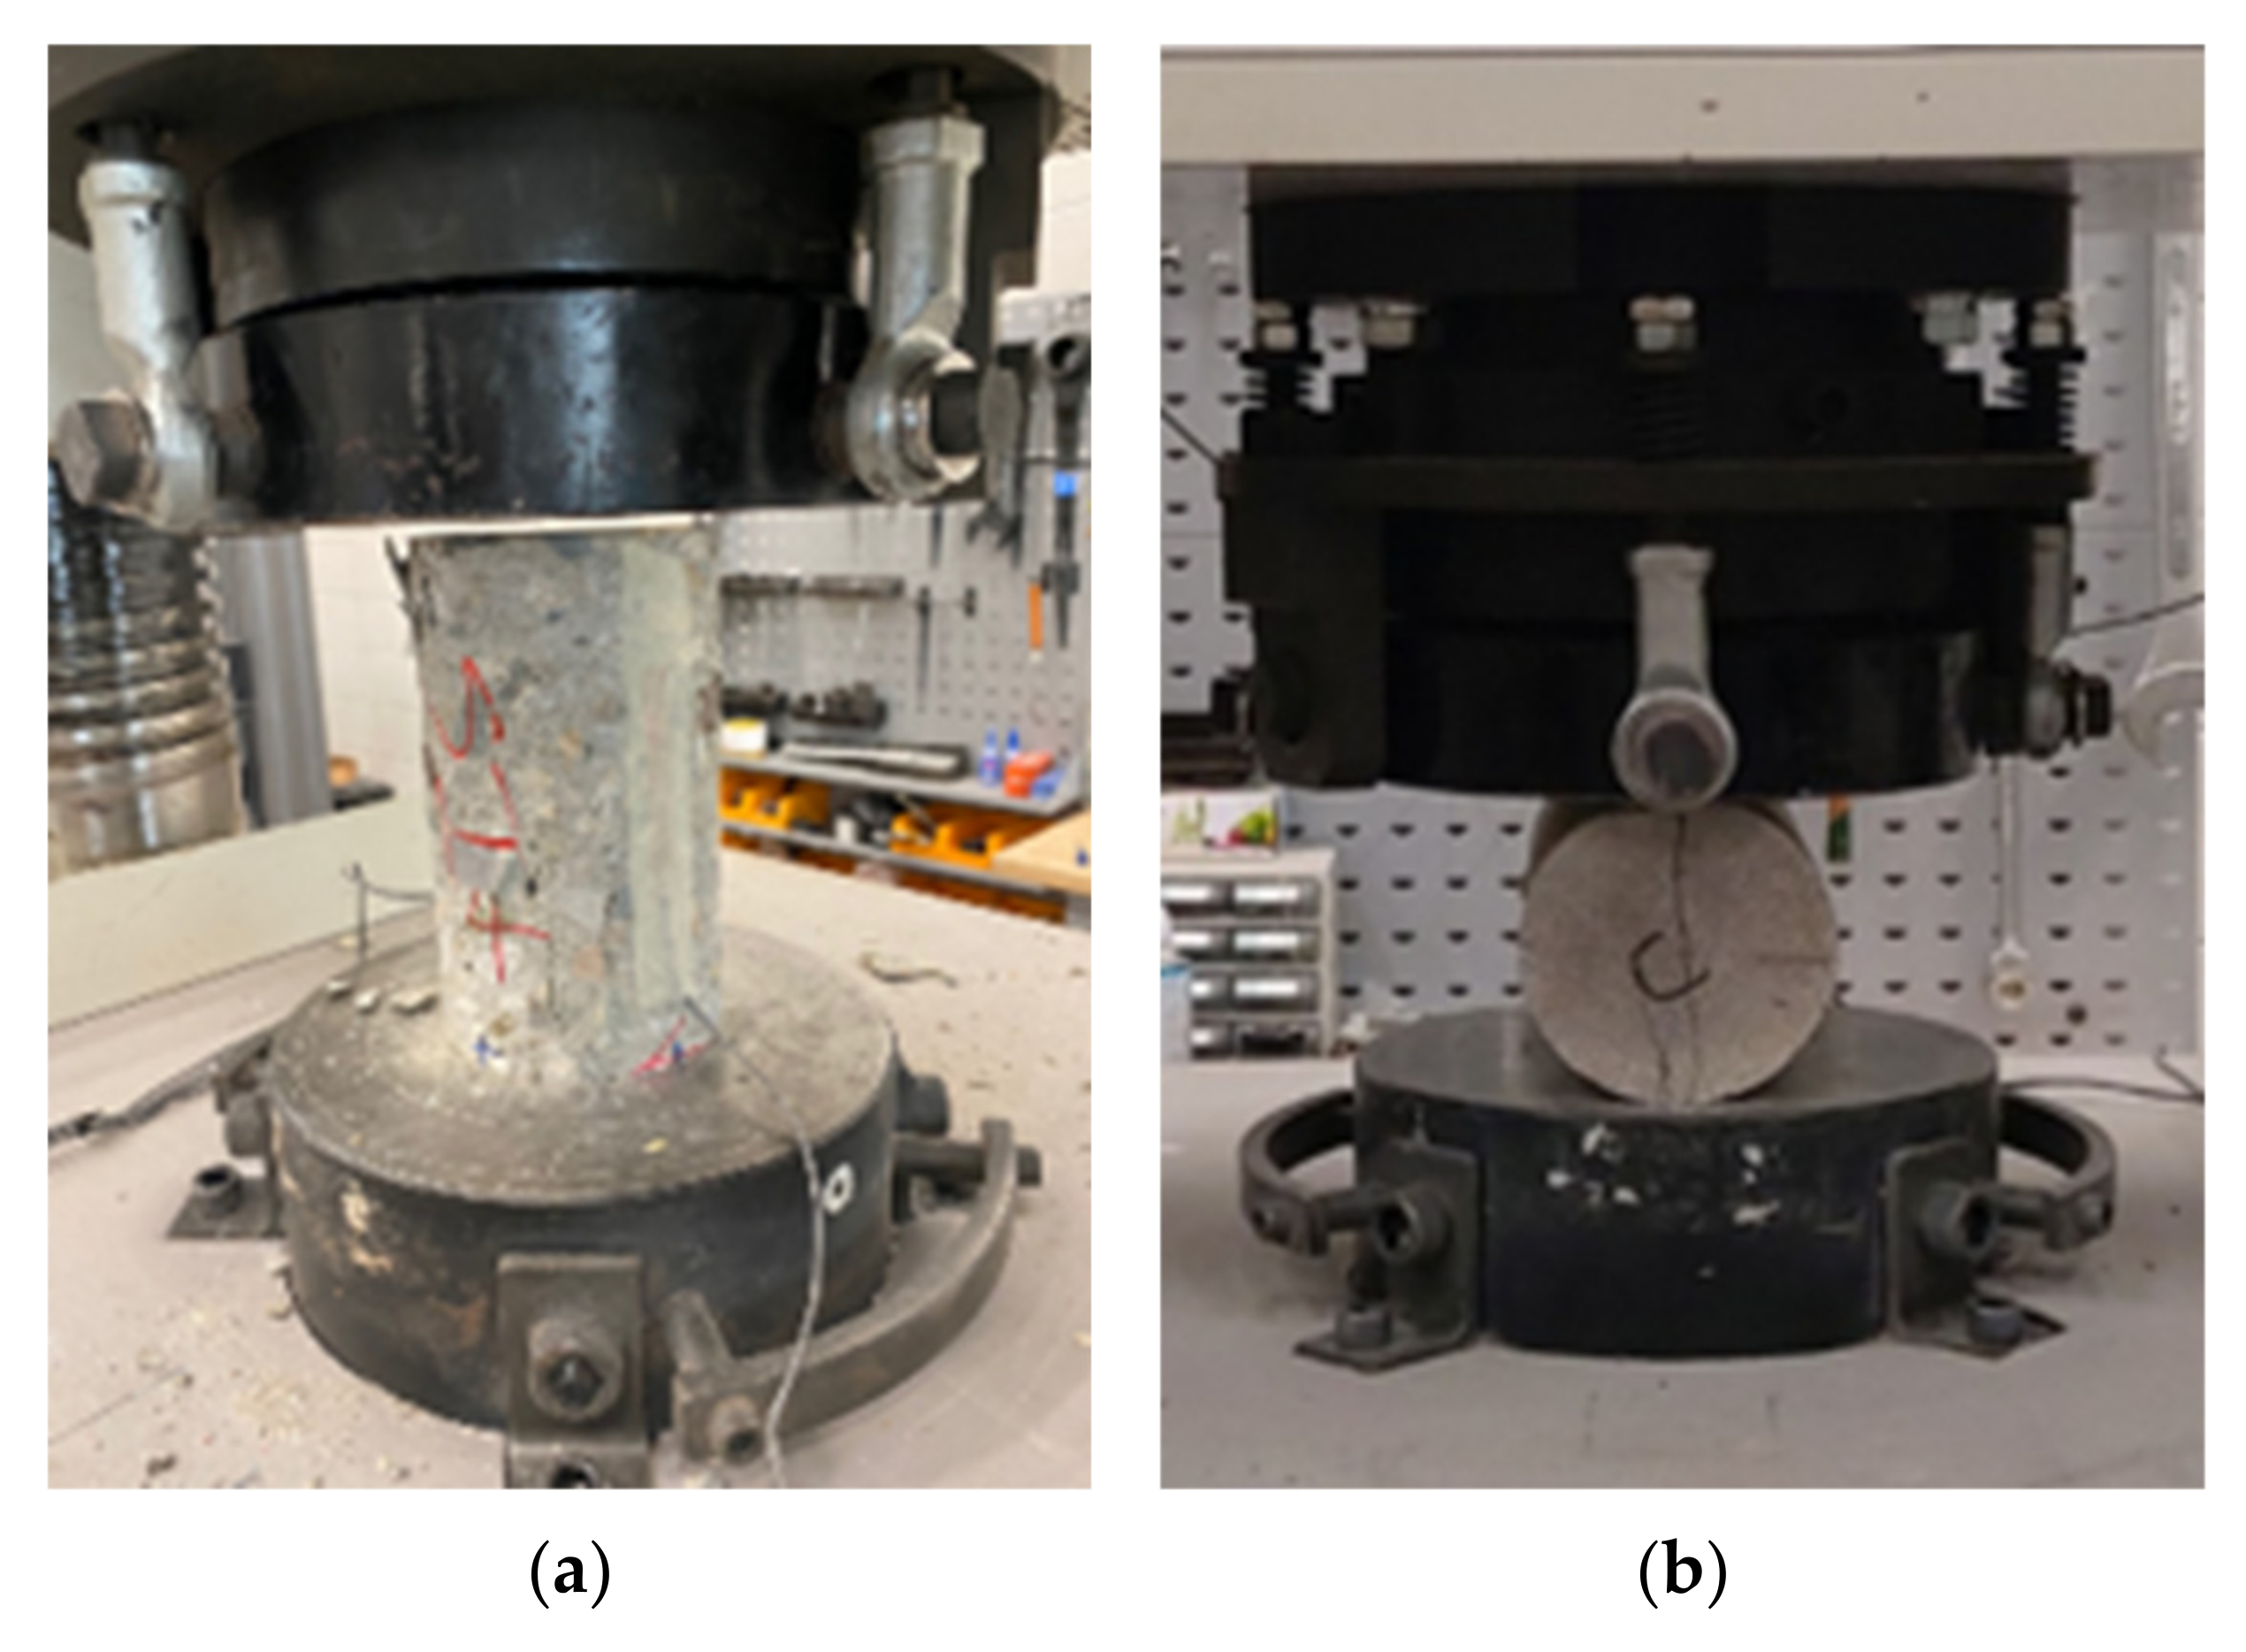
2.1. Cutting Tool and Rock Specimens
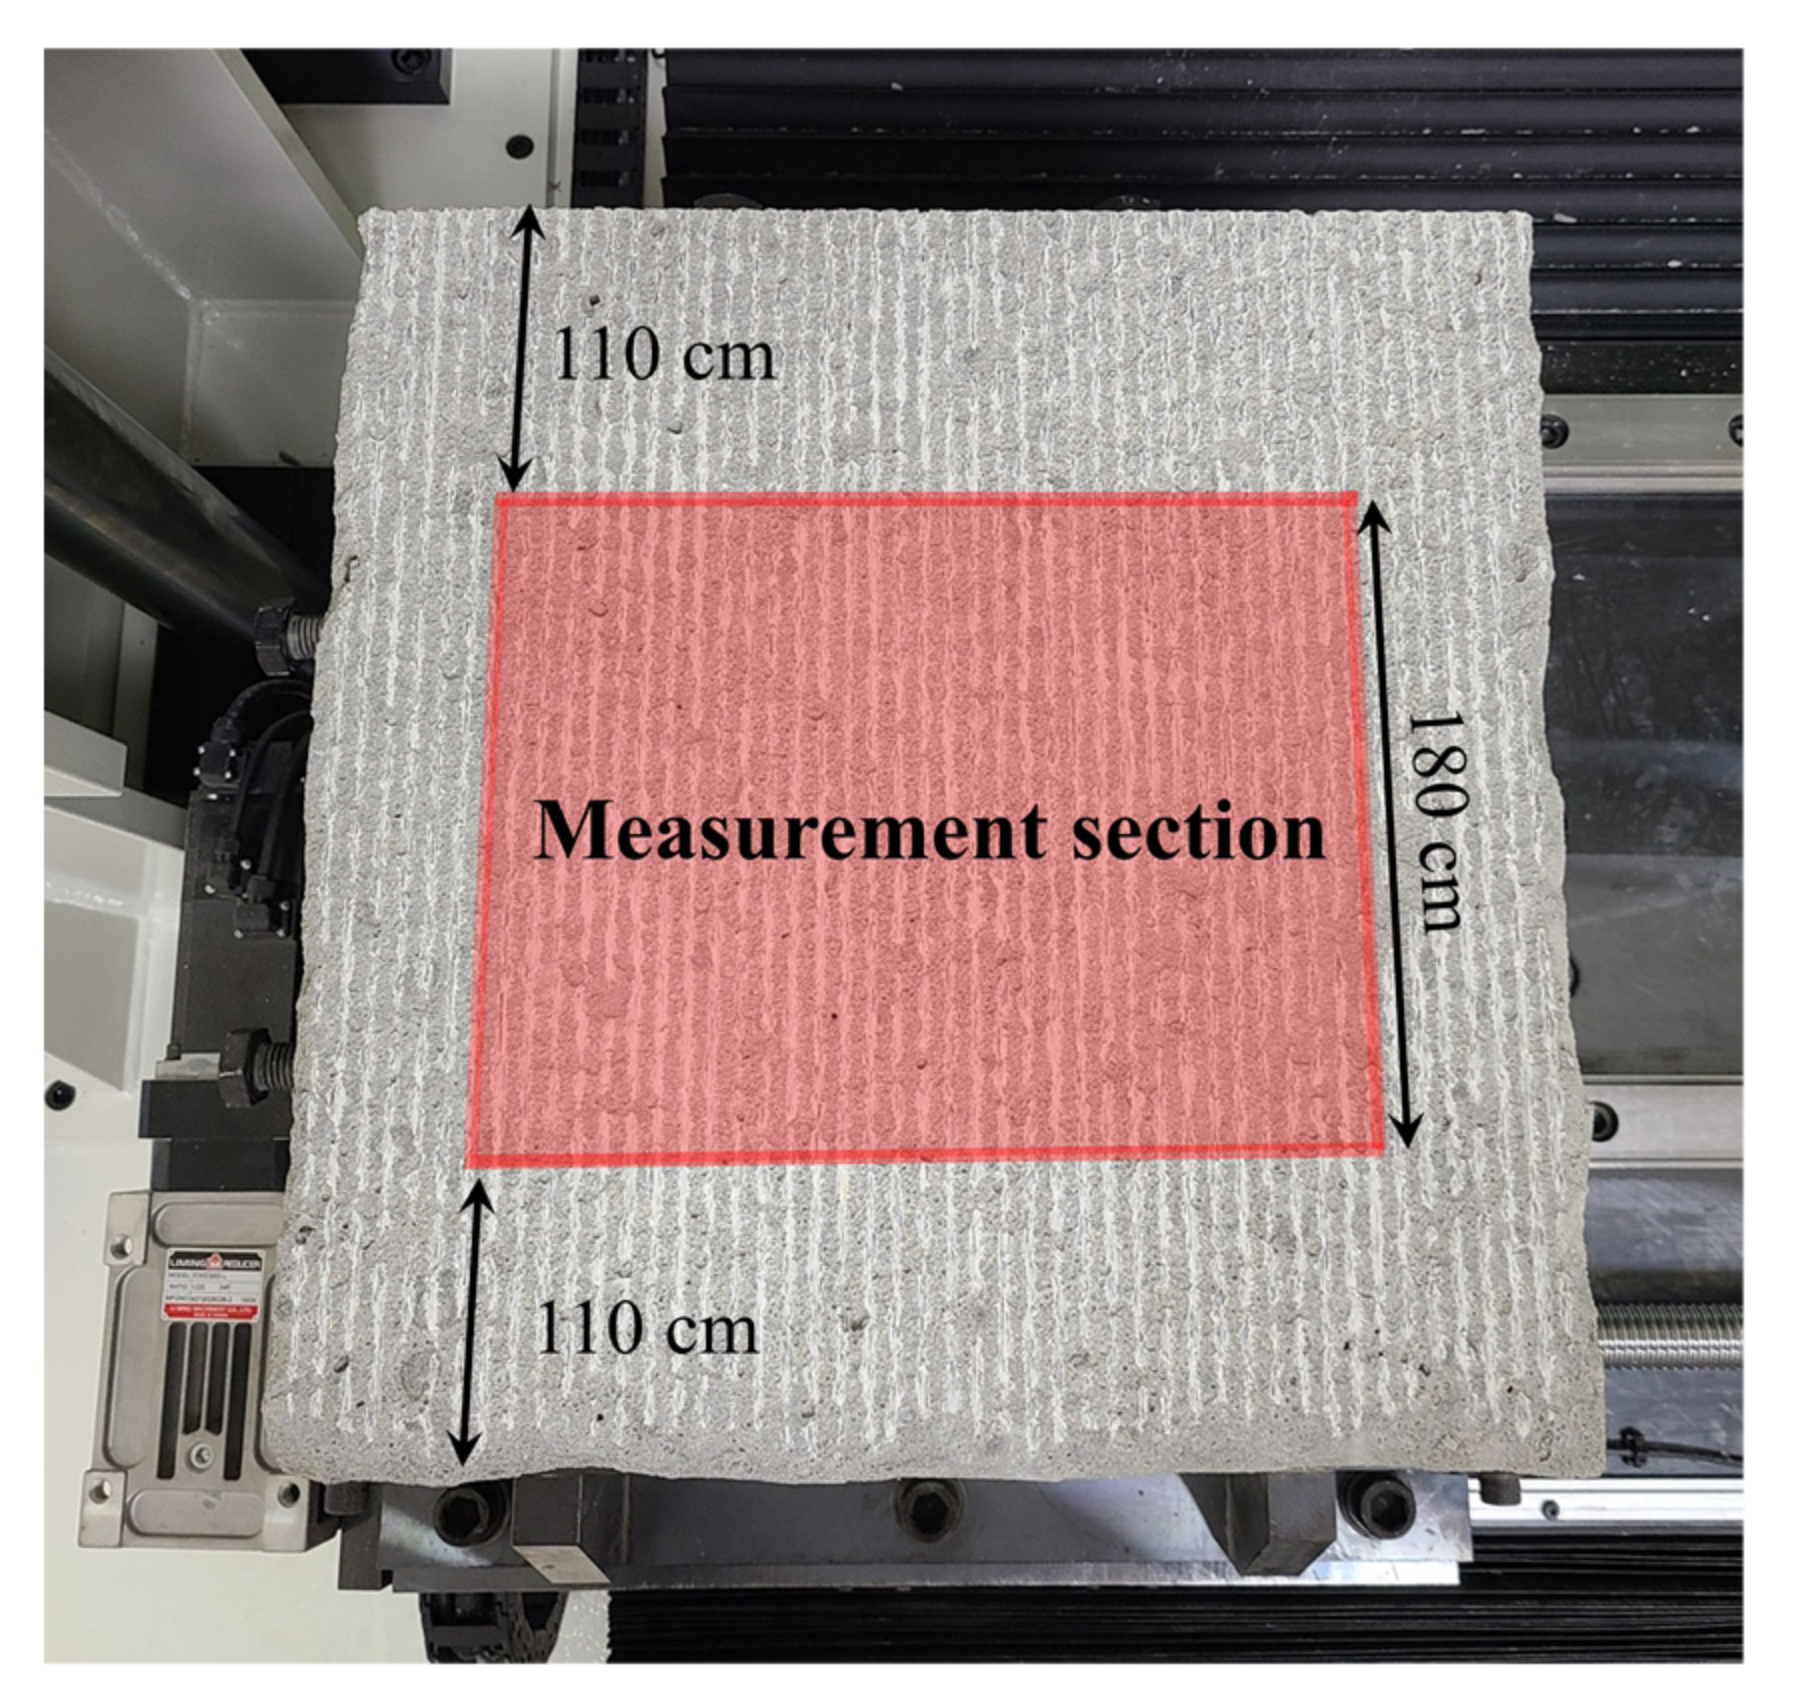
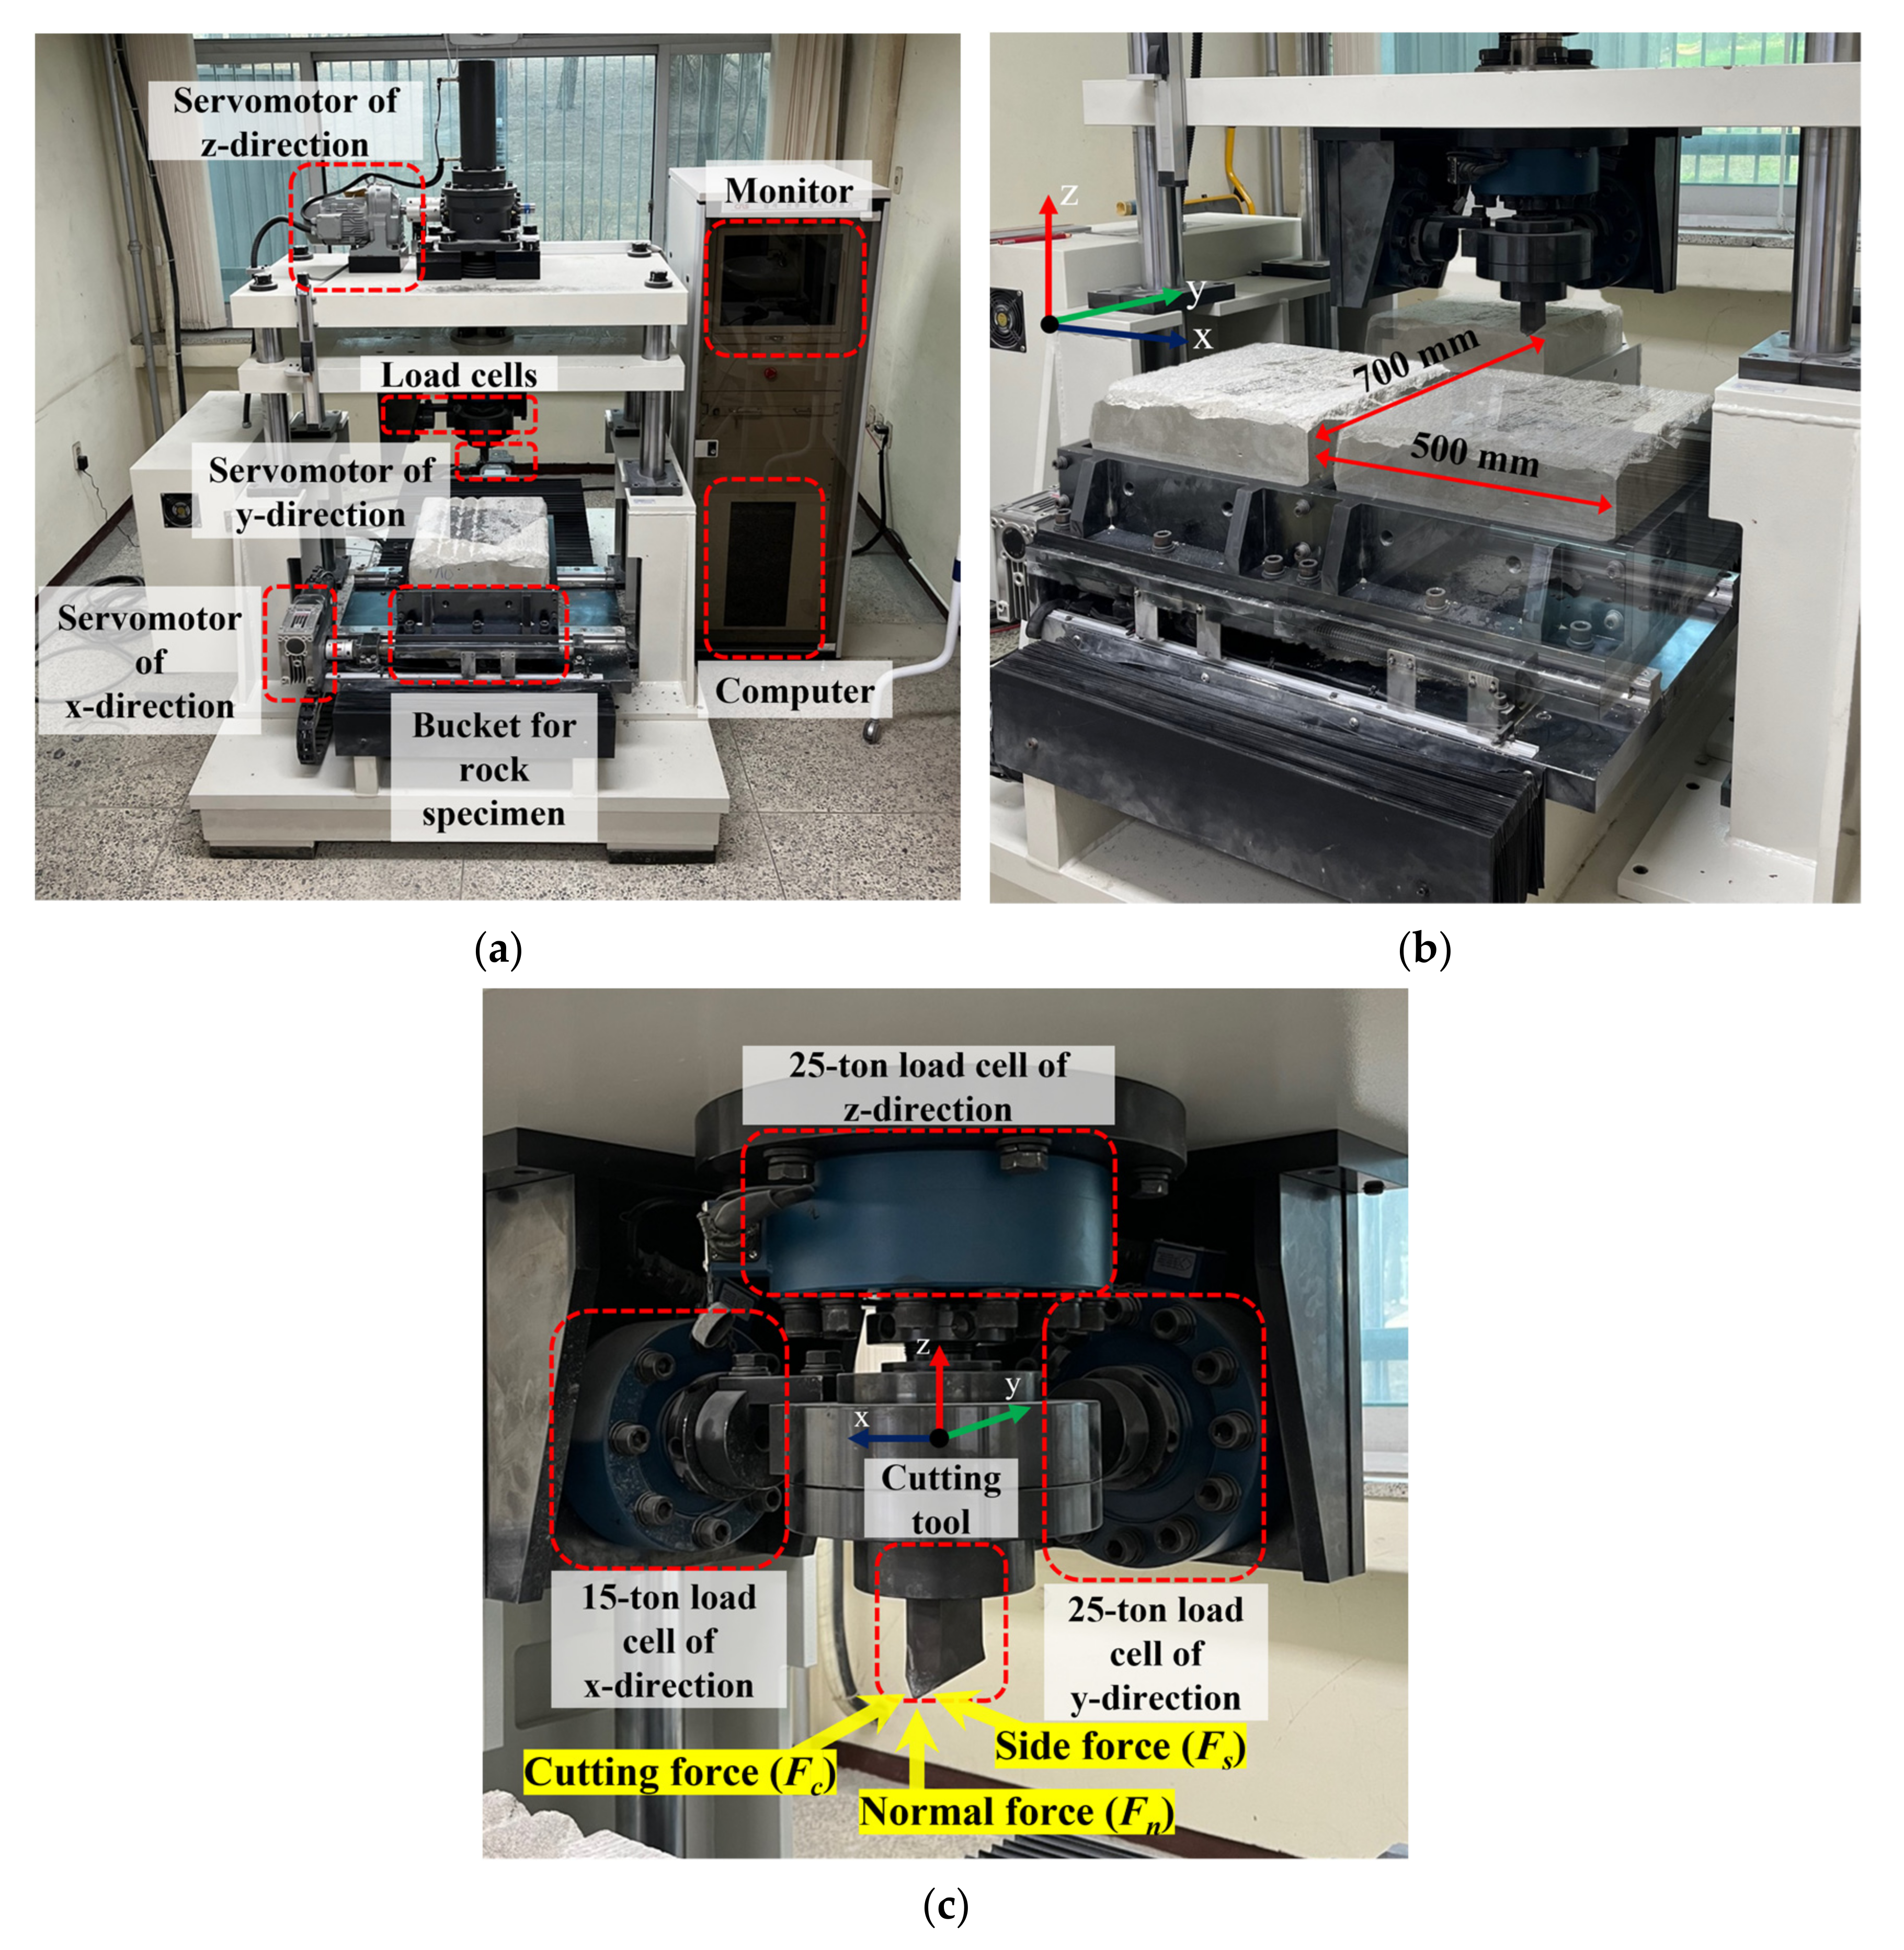
2.2. Linear Cutting Machine
2.3. Cutting Scheme
3. Results
3.1. Analysis of Characteristics of Tool Forces by Cutting Conditions
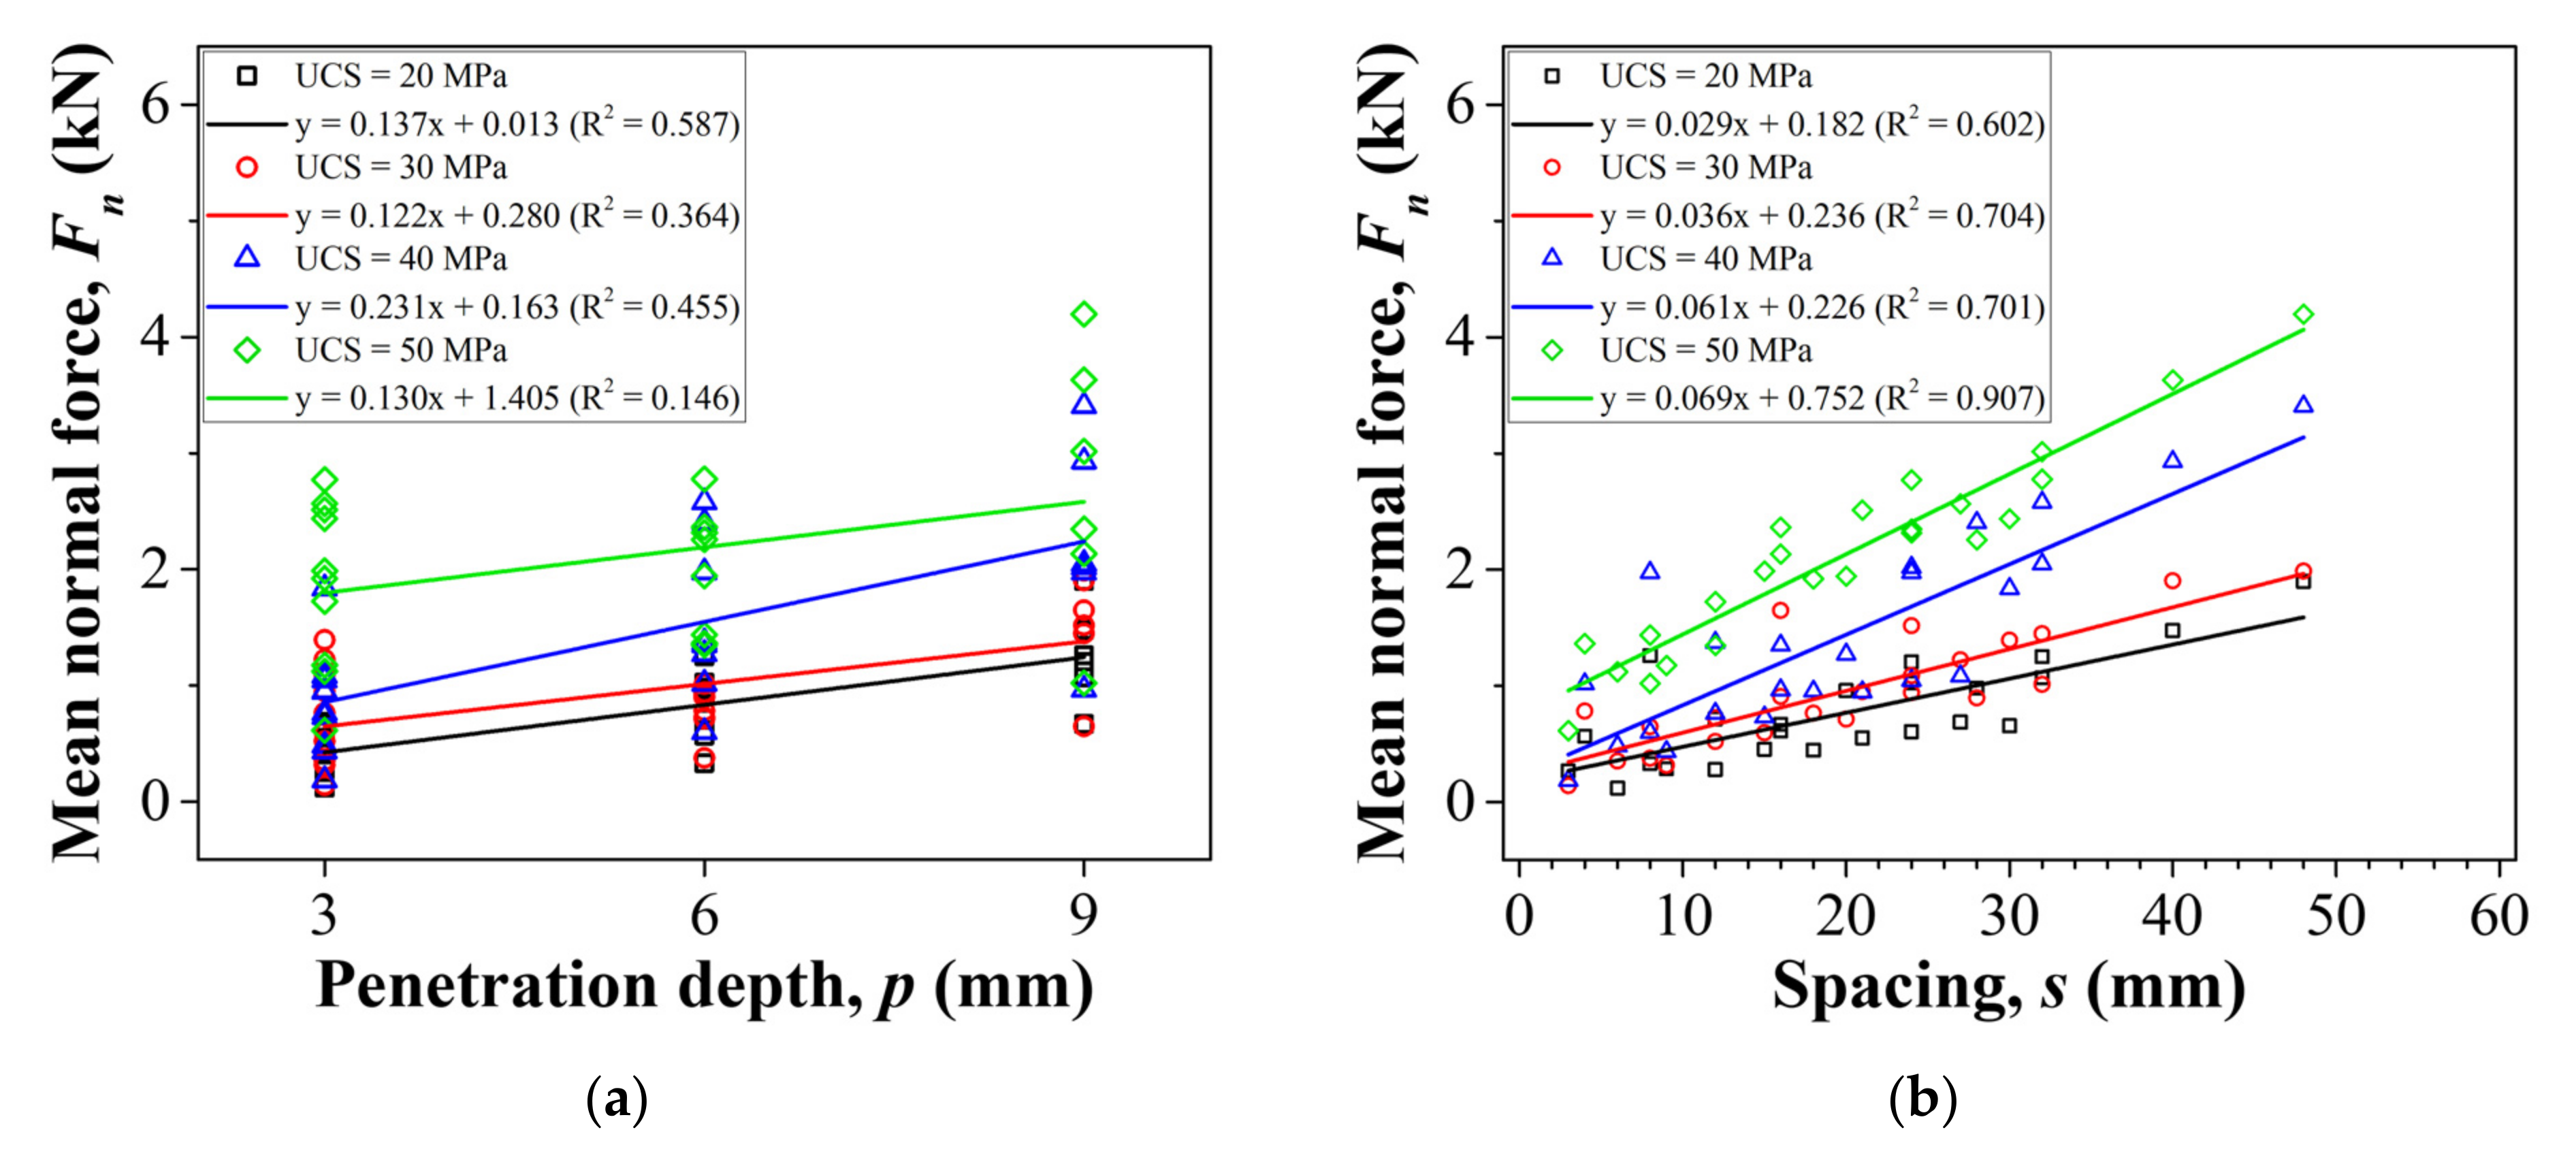
3.1.1. Effect of Penetration Depth and Spacing on Normal Force
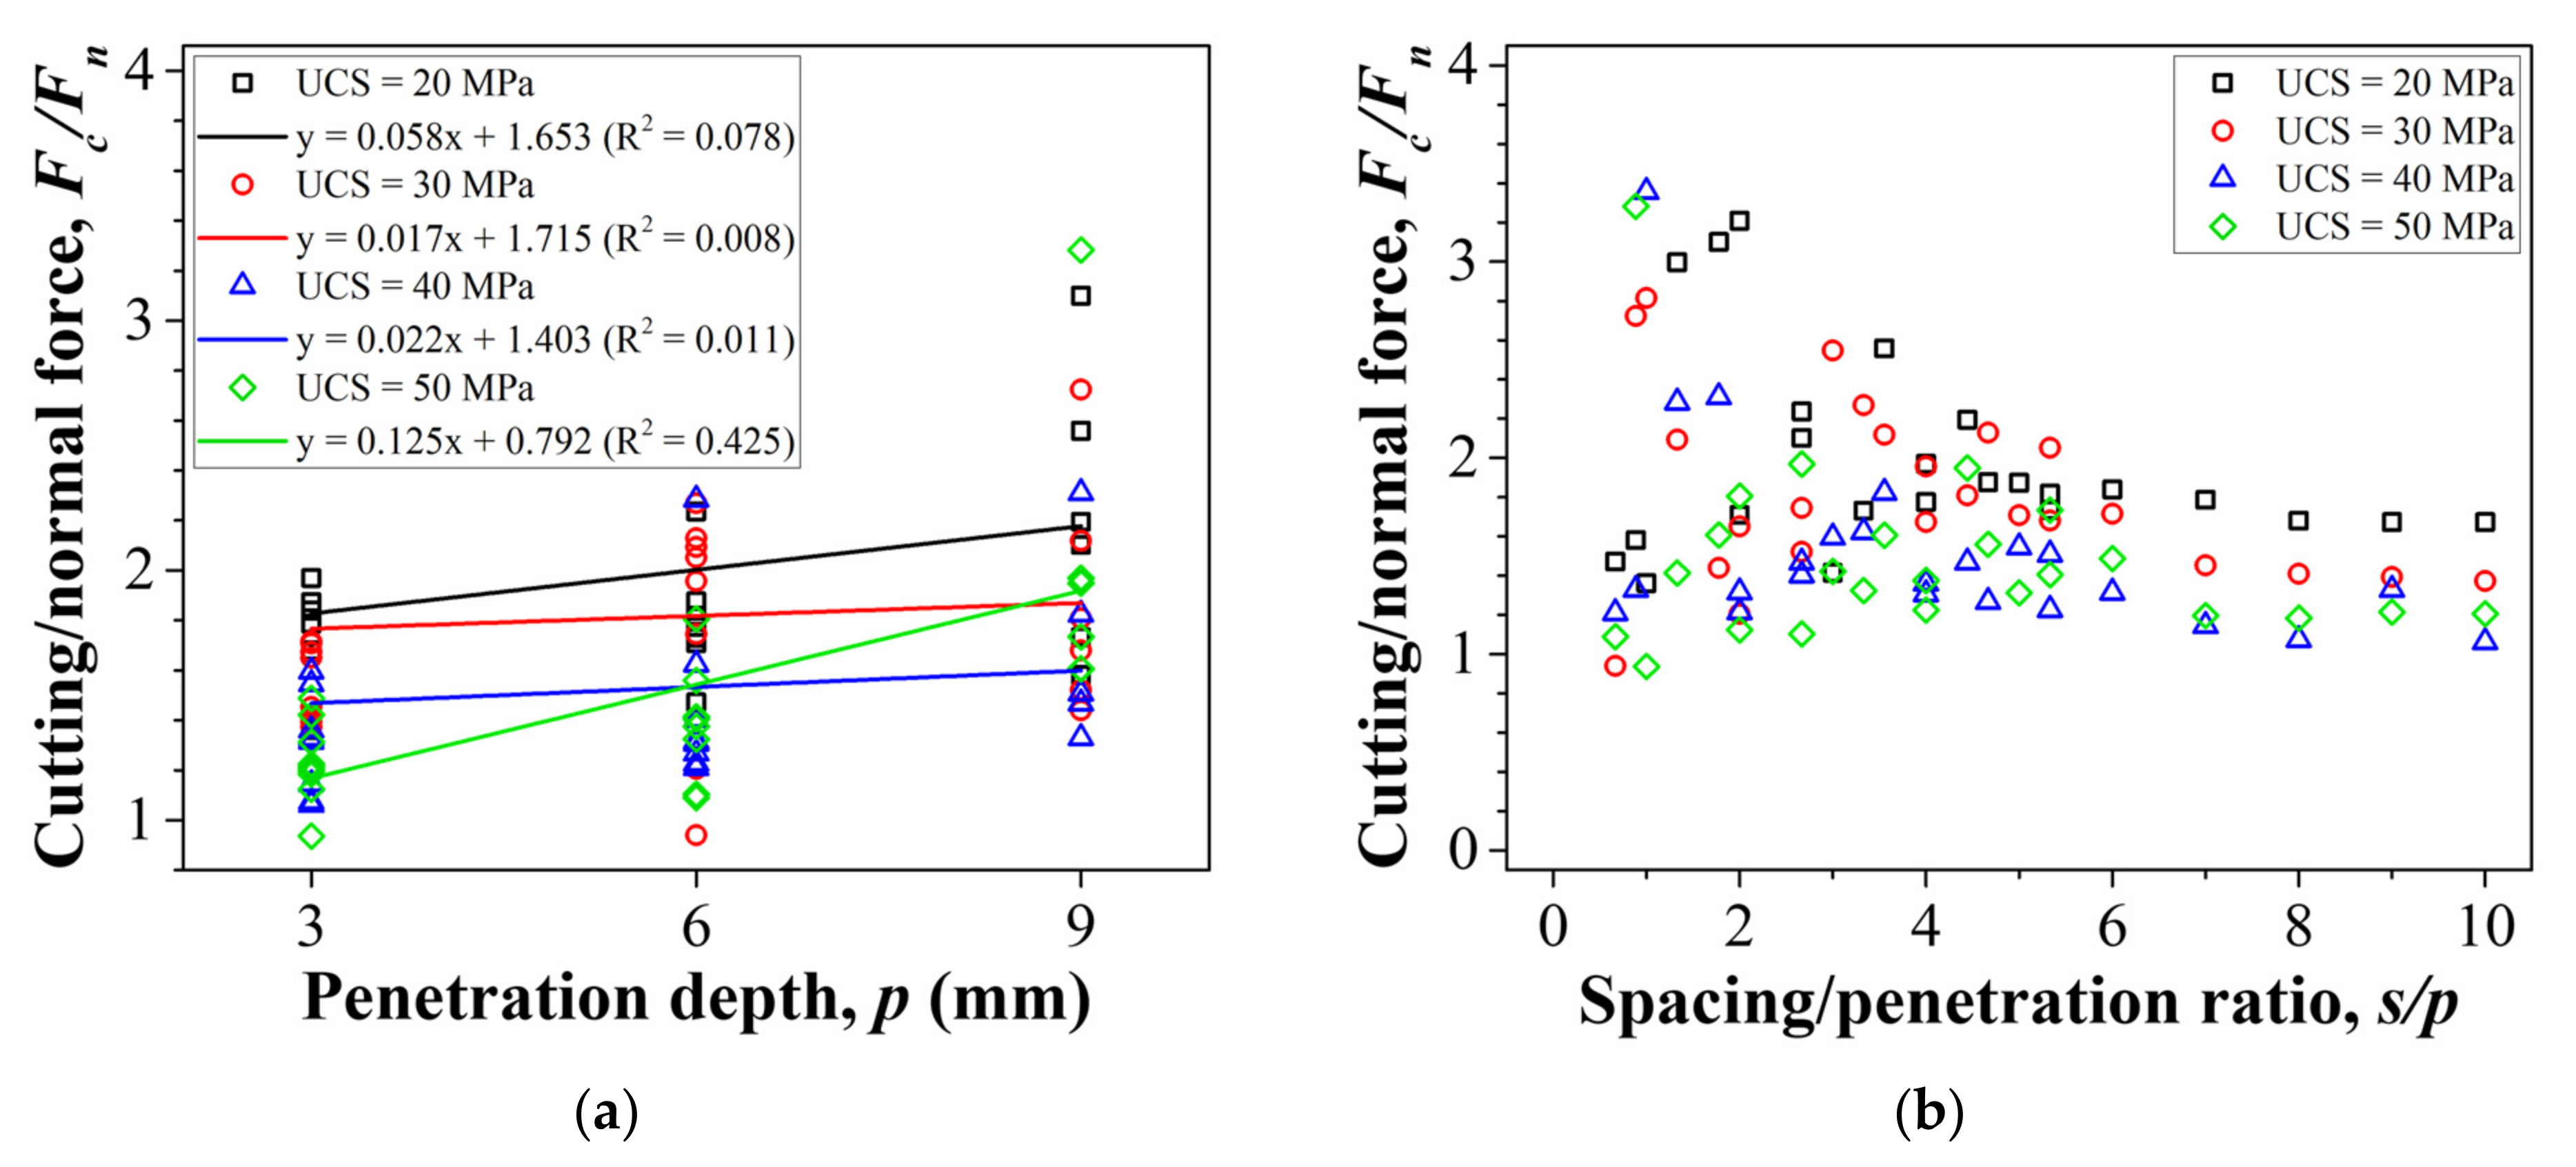
3.1.2. Effect of Penetration Depth and Spacing on Cutting Force
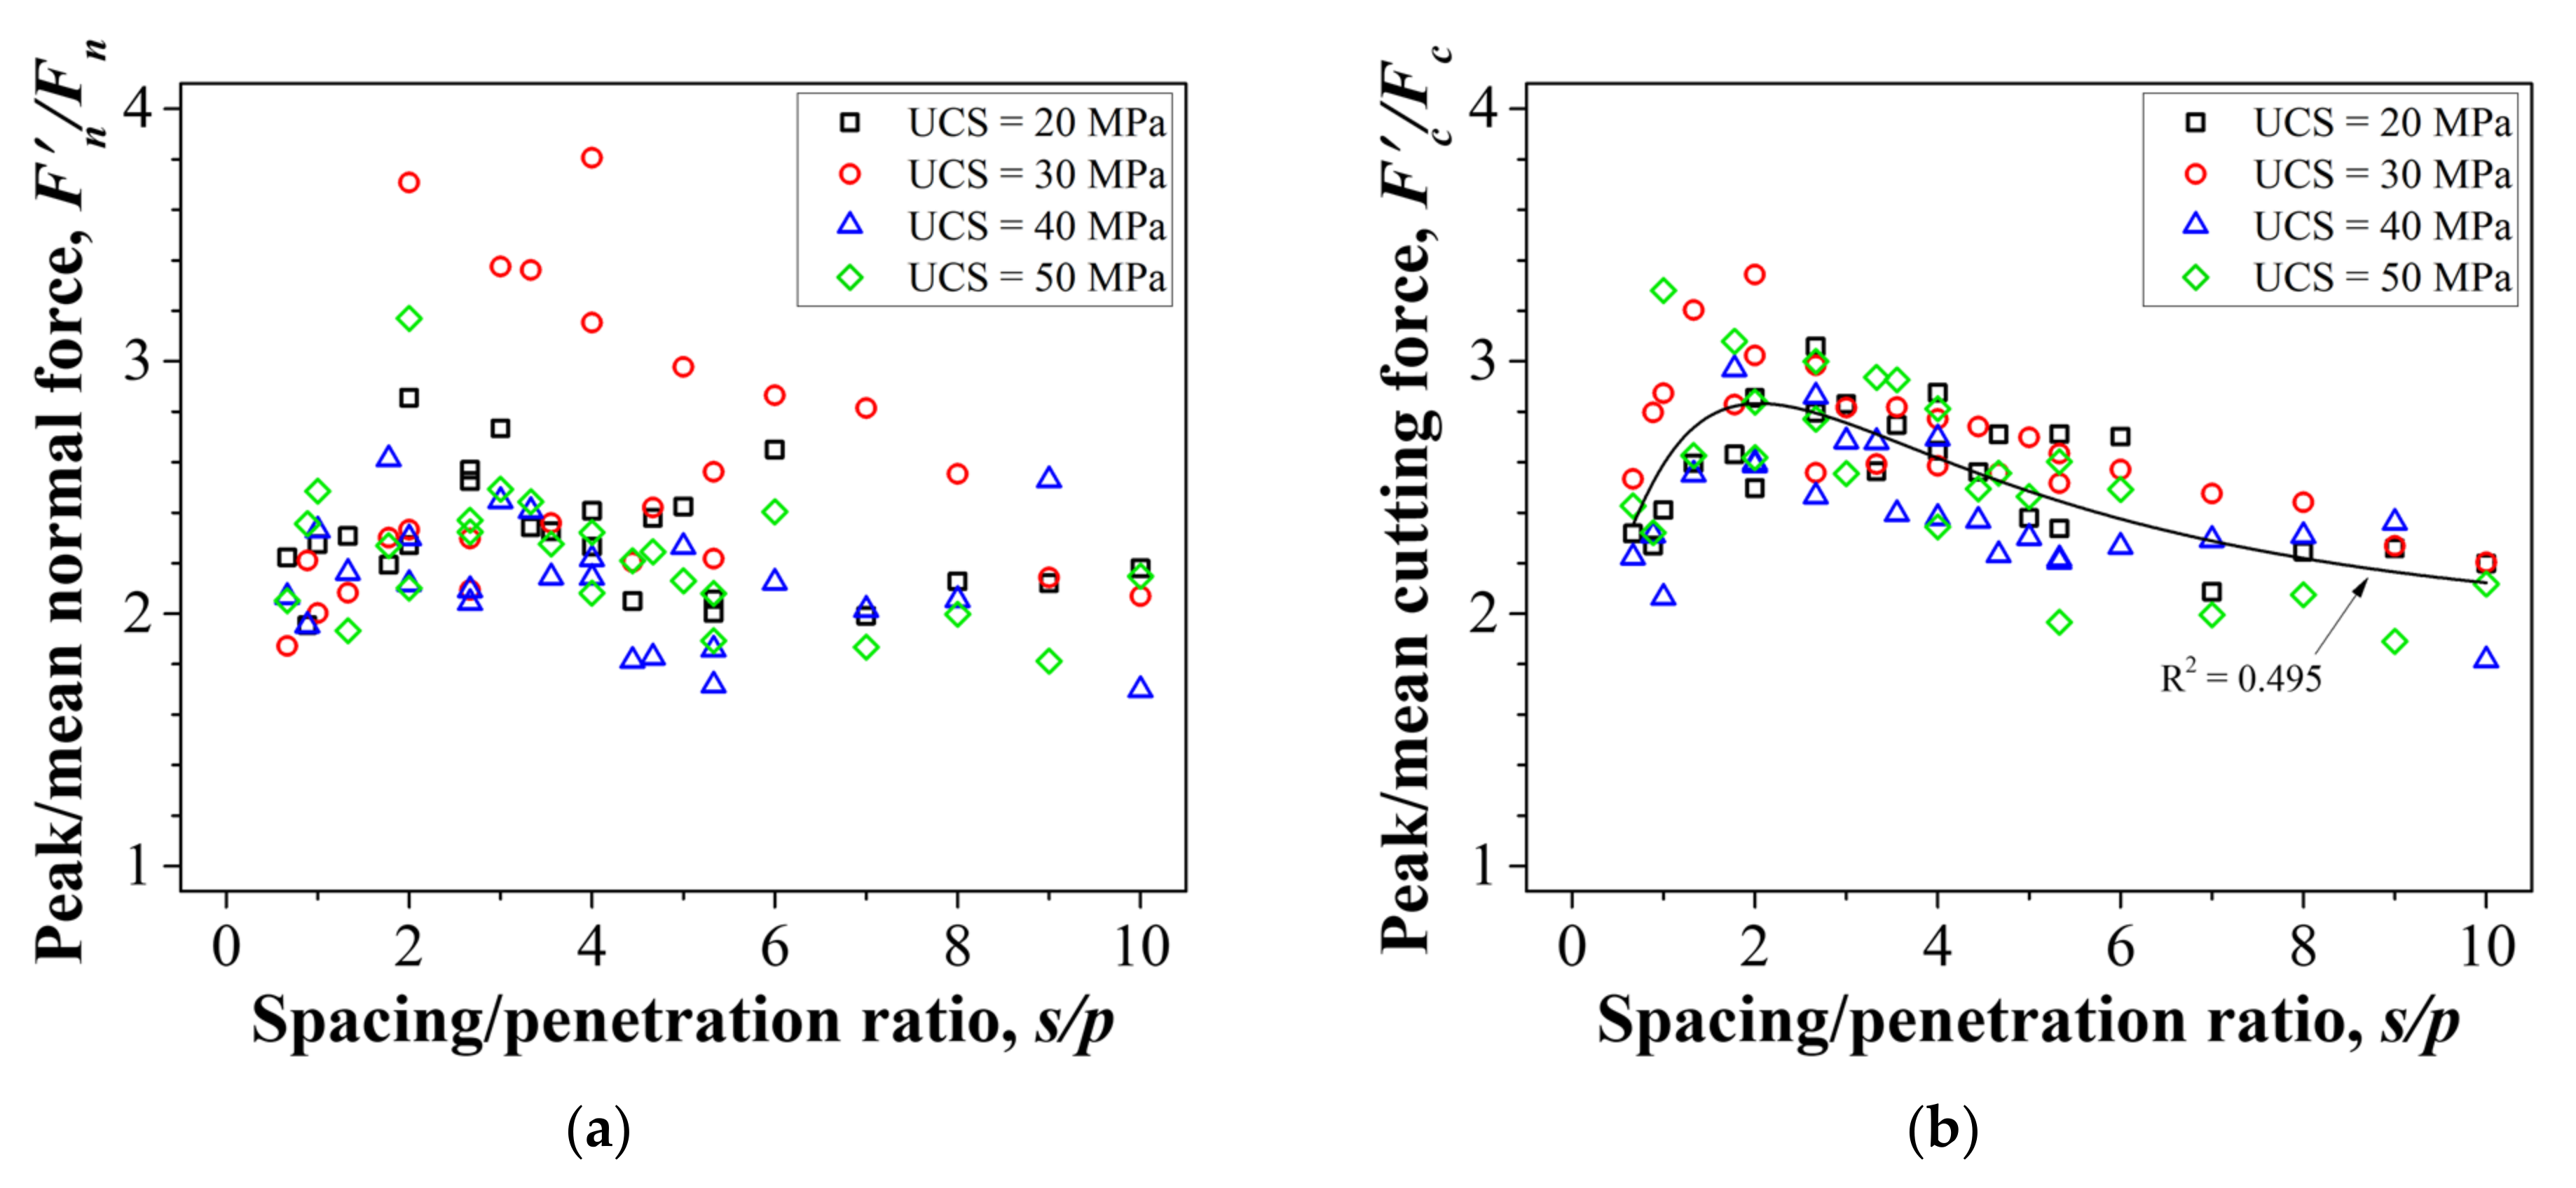
3.1.3. Analysis of Peak to Mean Tool Forces Ratio
3.1.4. Analysis of Peak to Mean Tool Forces Ratio
3.2. Analysis of Characteristics of Cutting Volume by Cutting Conditions
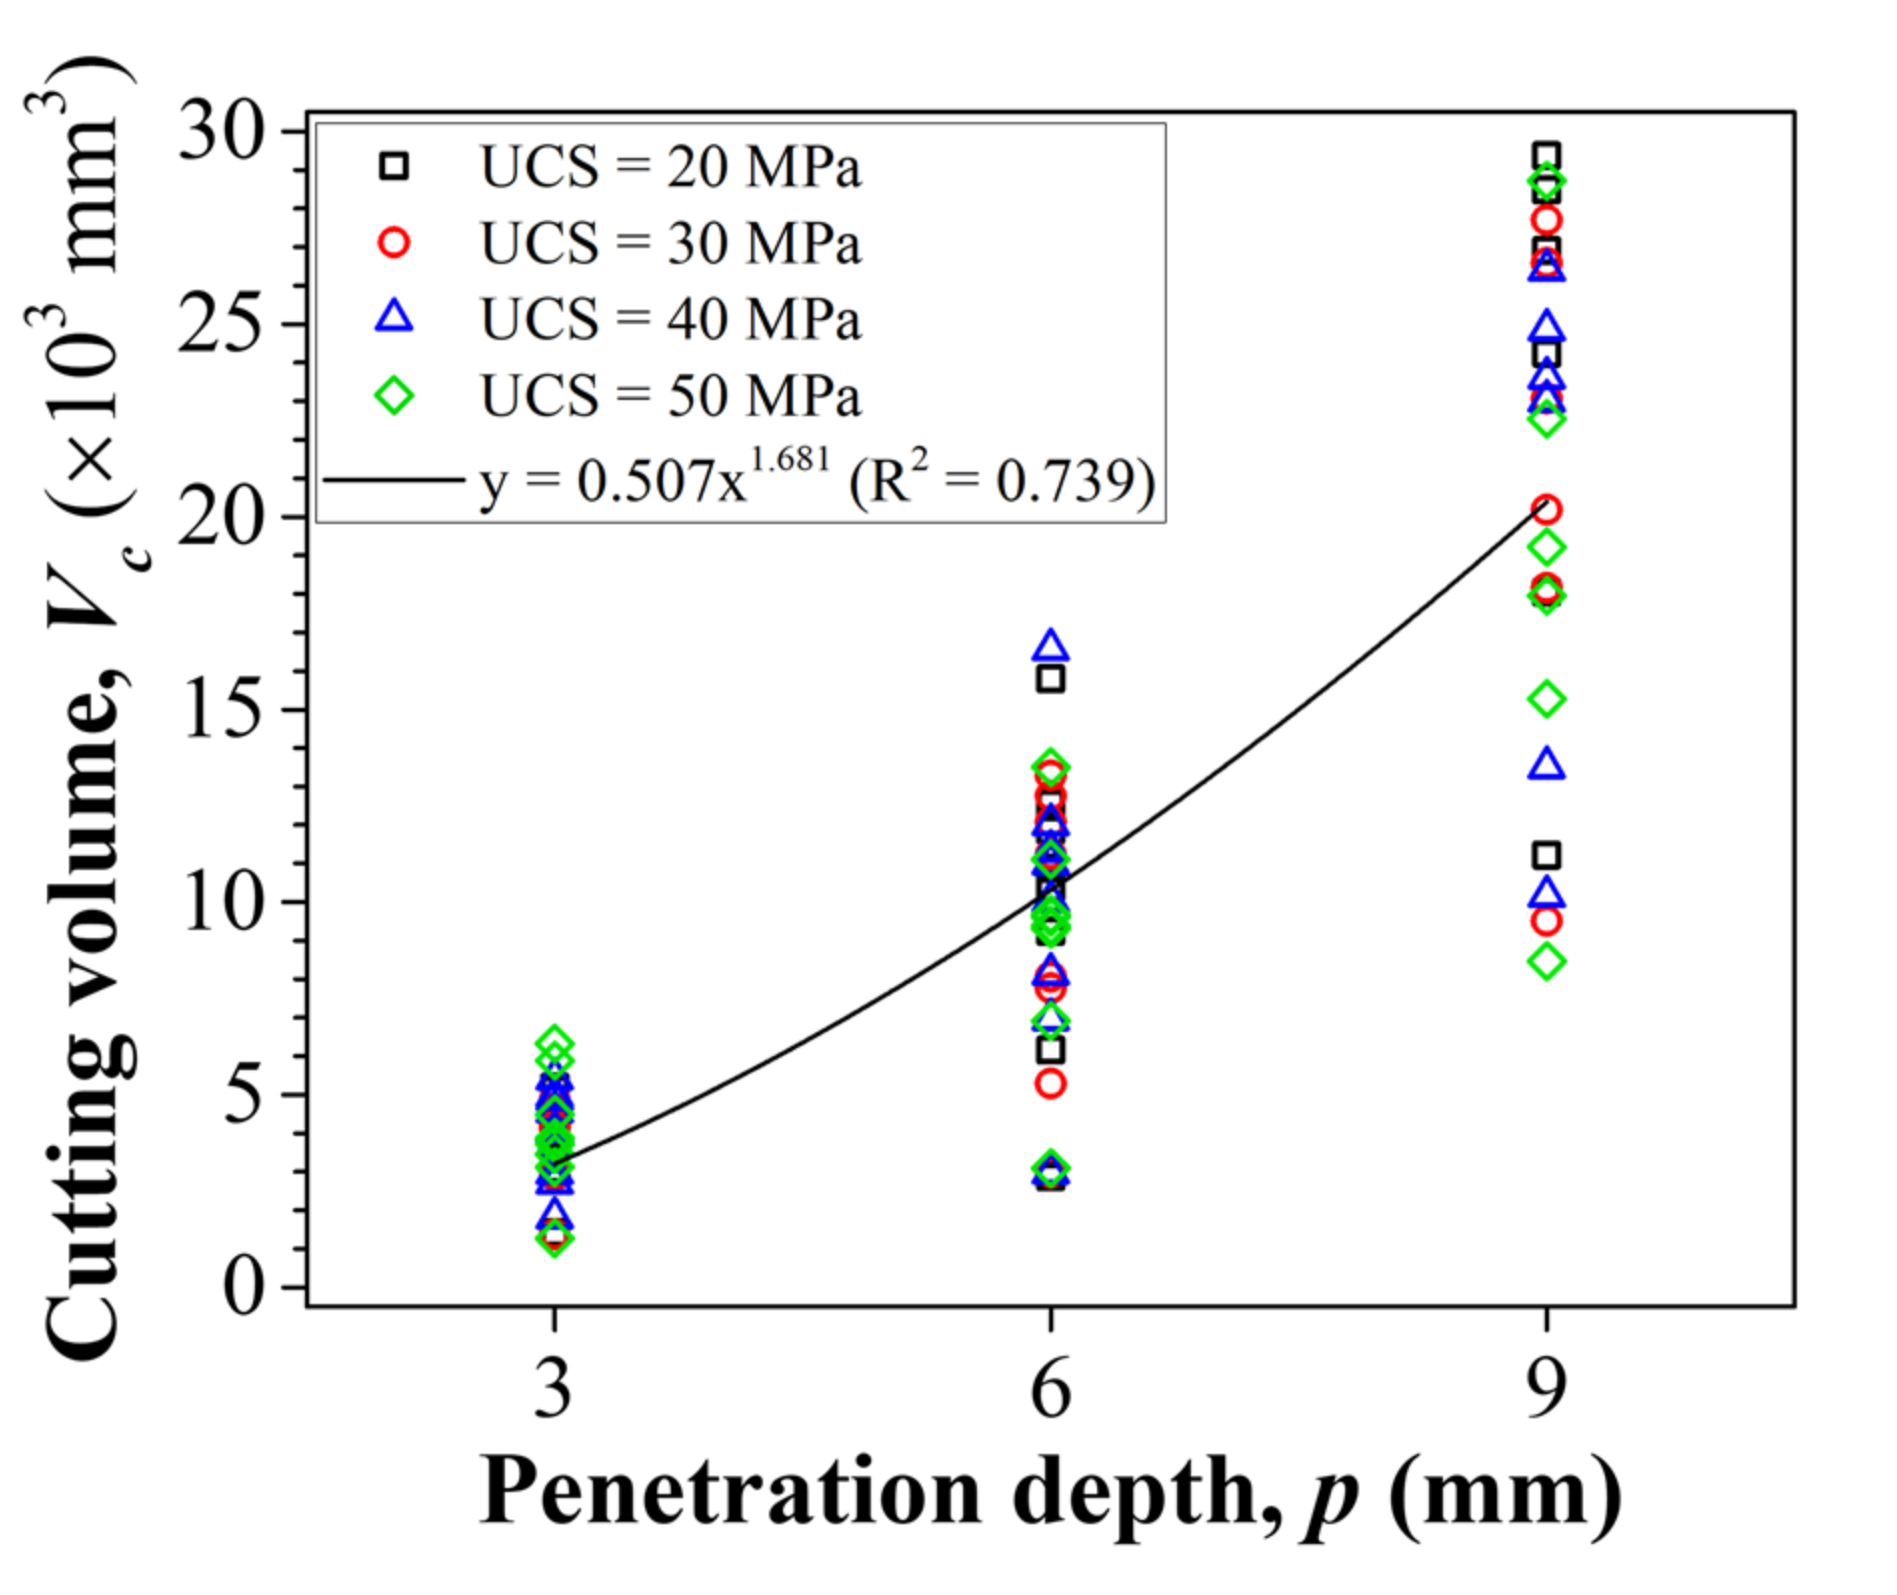
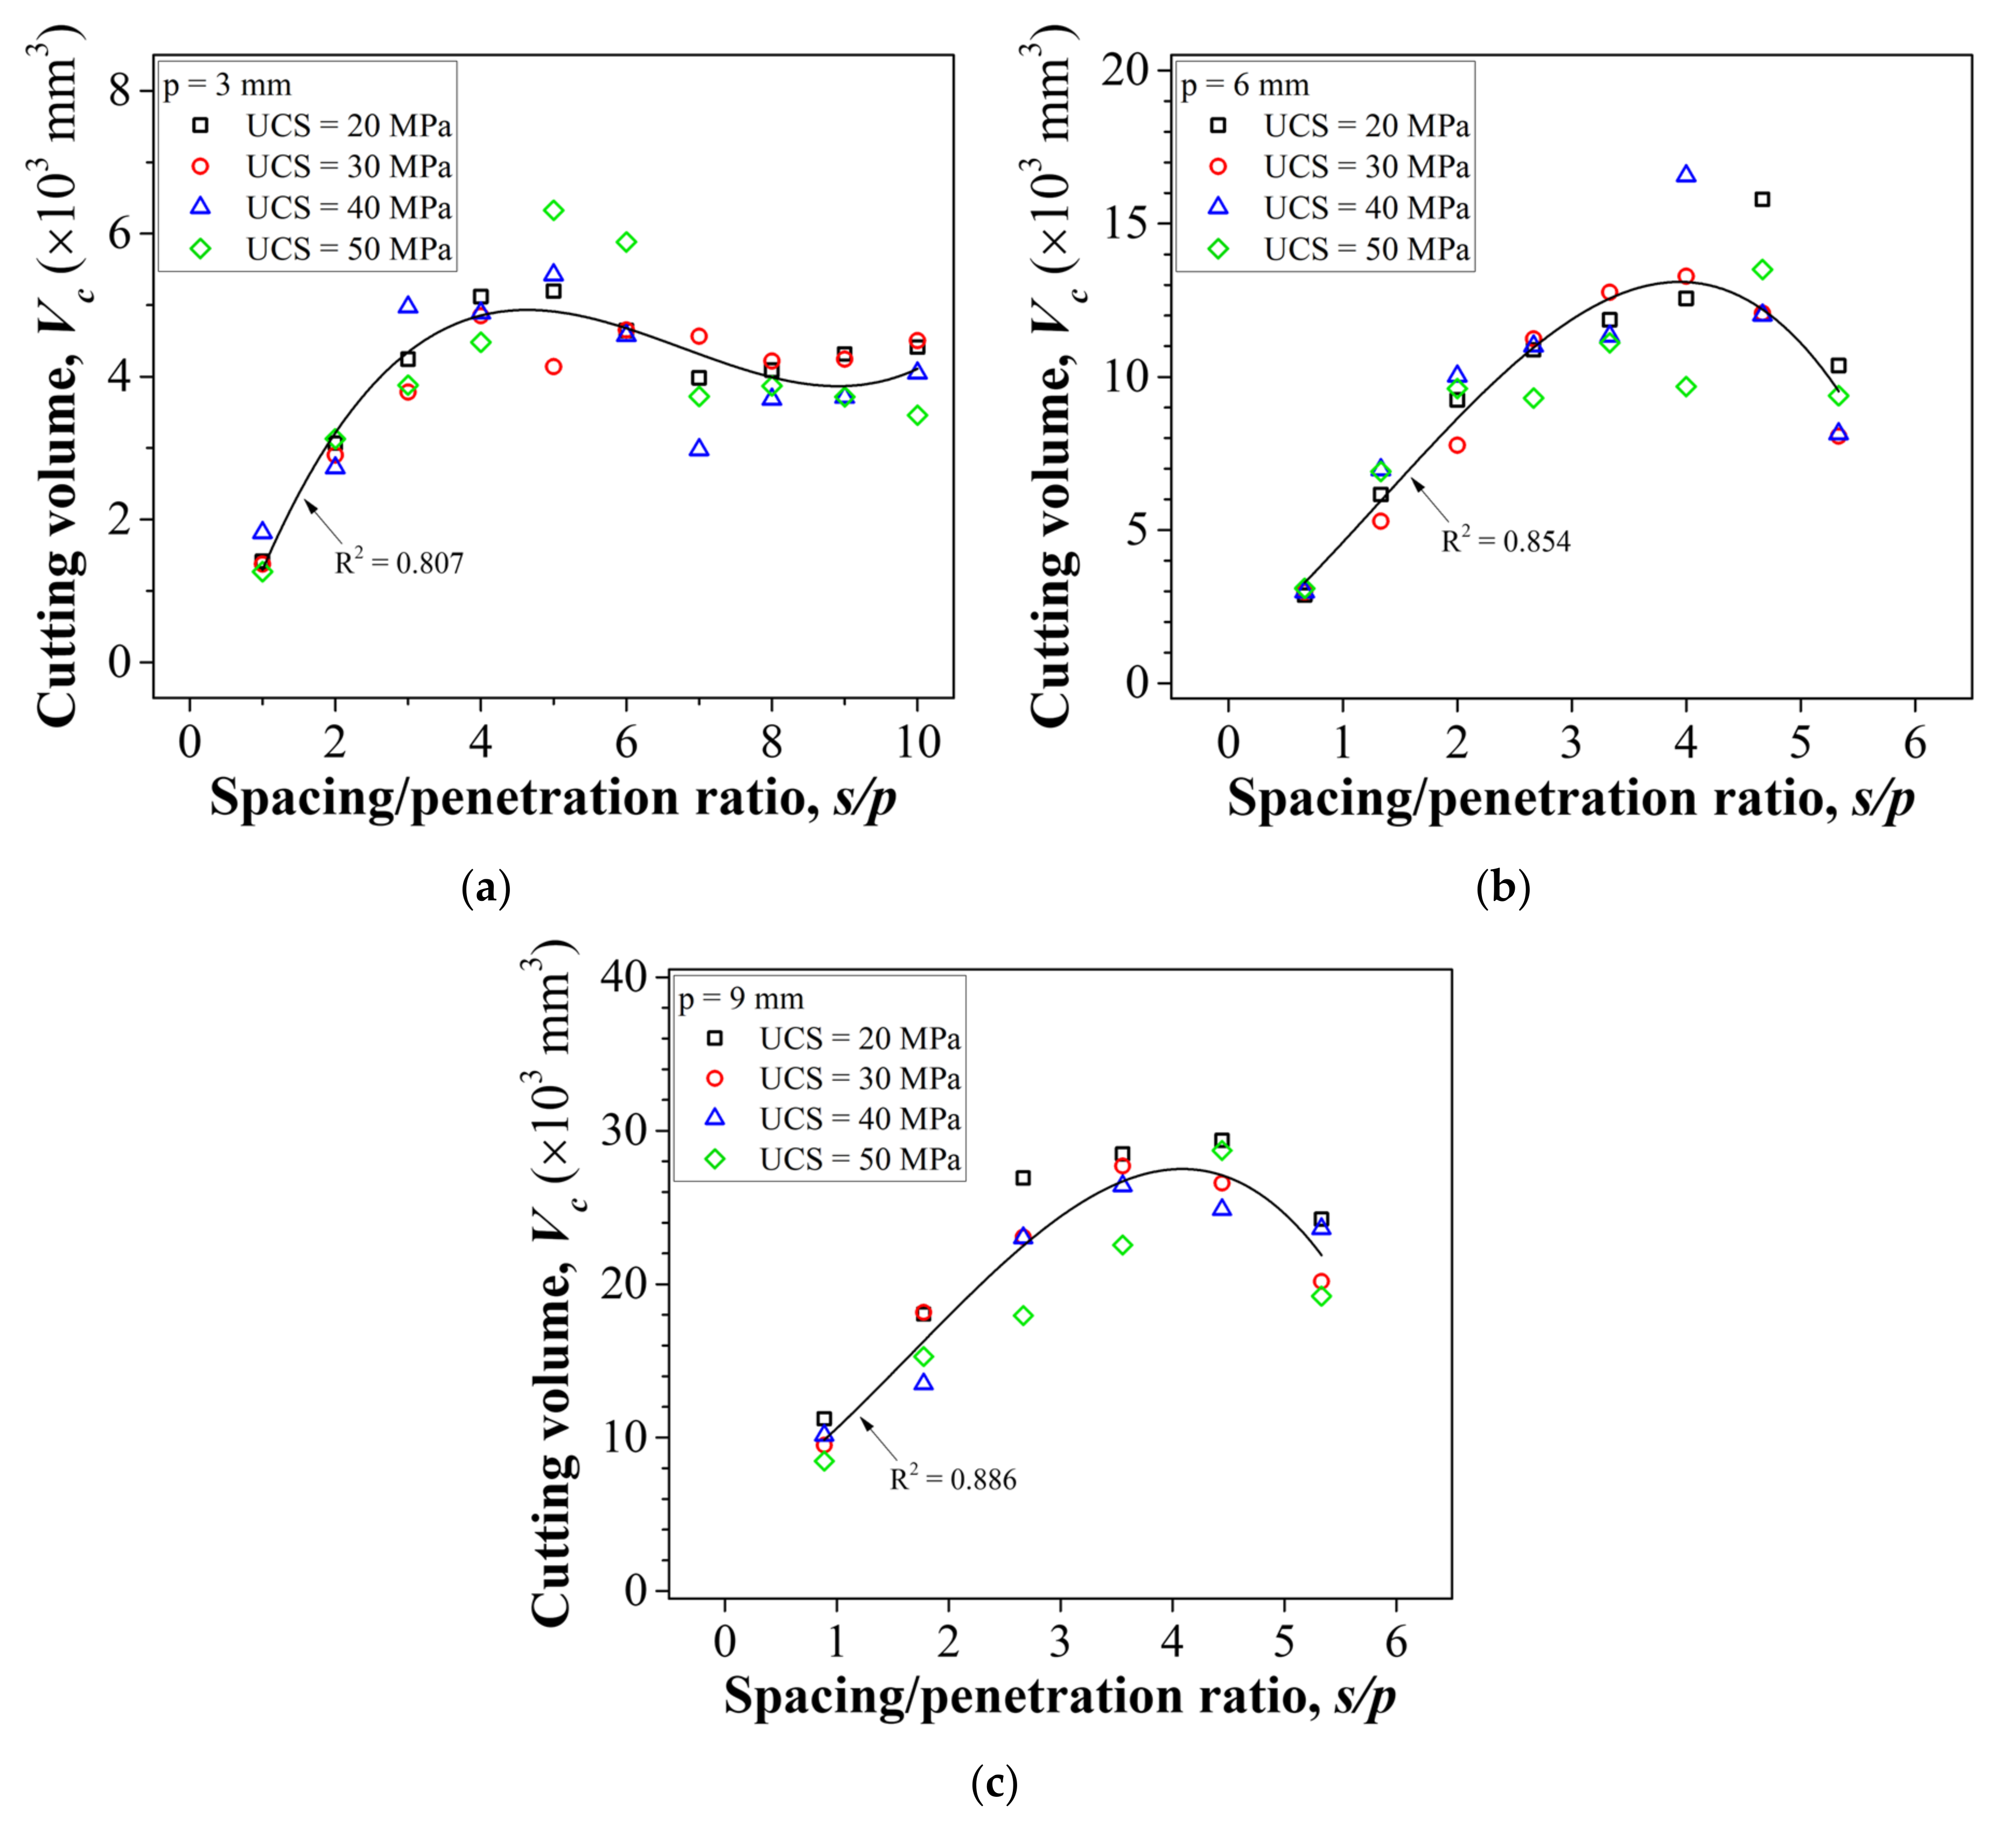
3.2.1. Effect of Penetration Depth on Cutting Volume
3.2.2. Effect of Penetration Depth on Cutting Volume
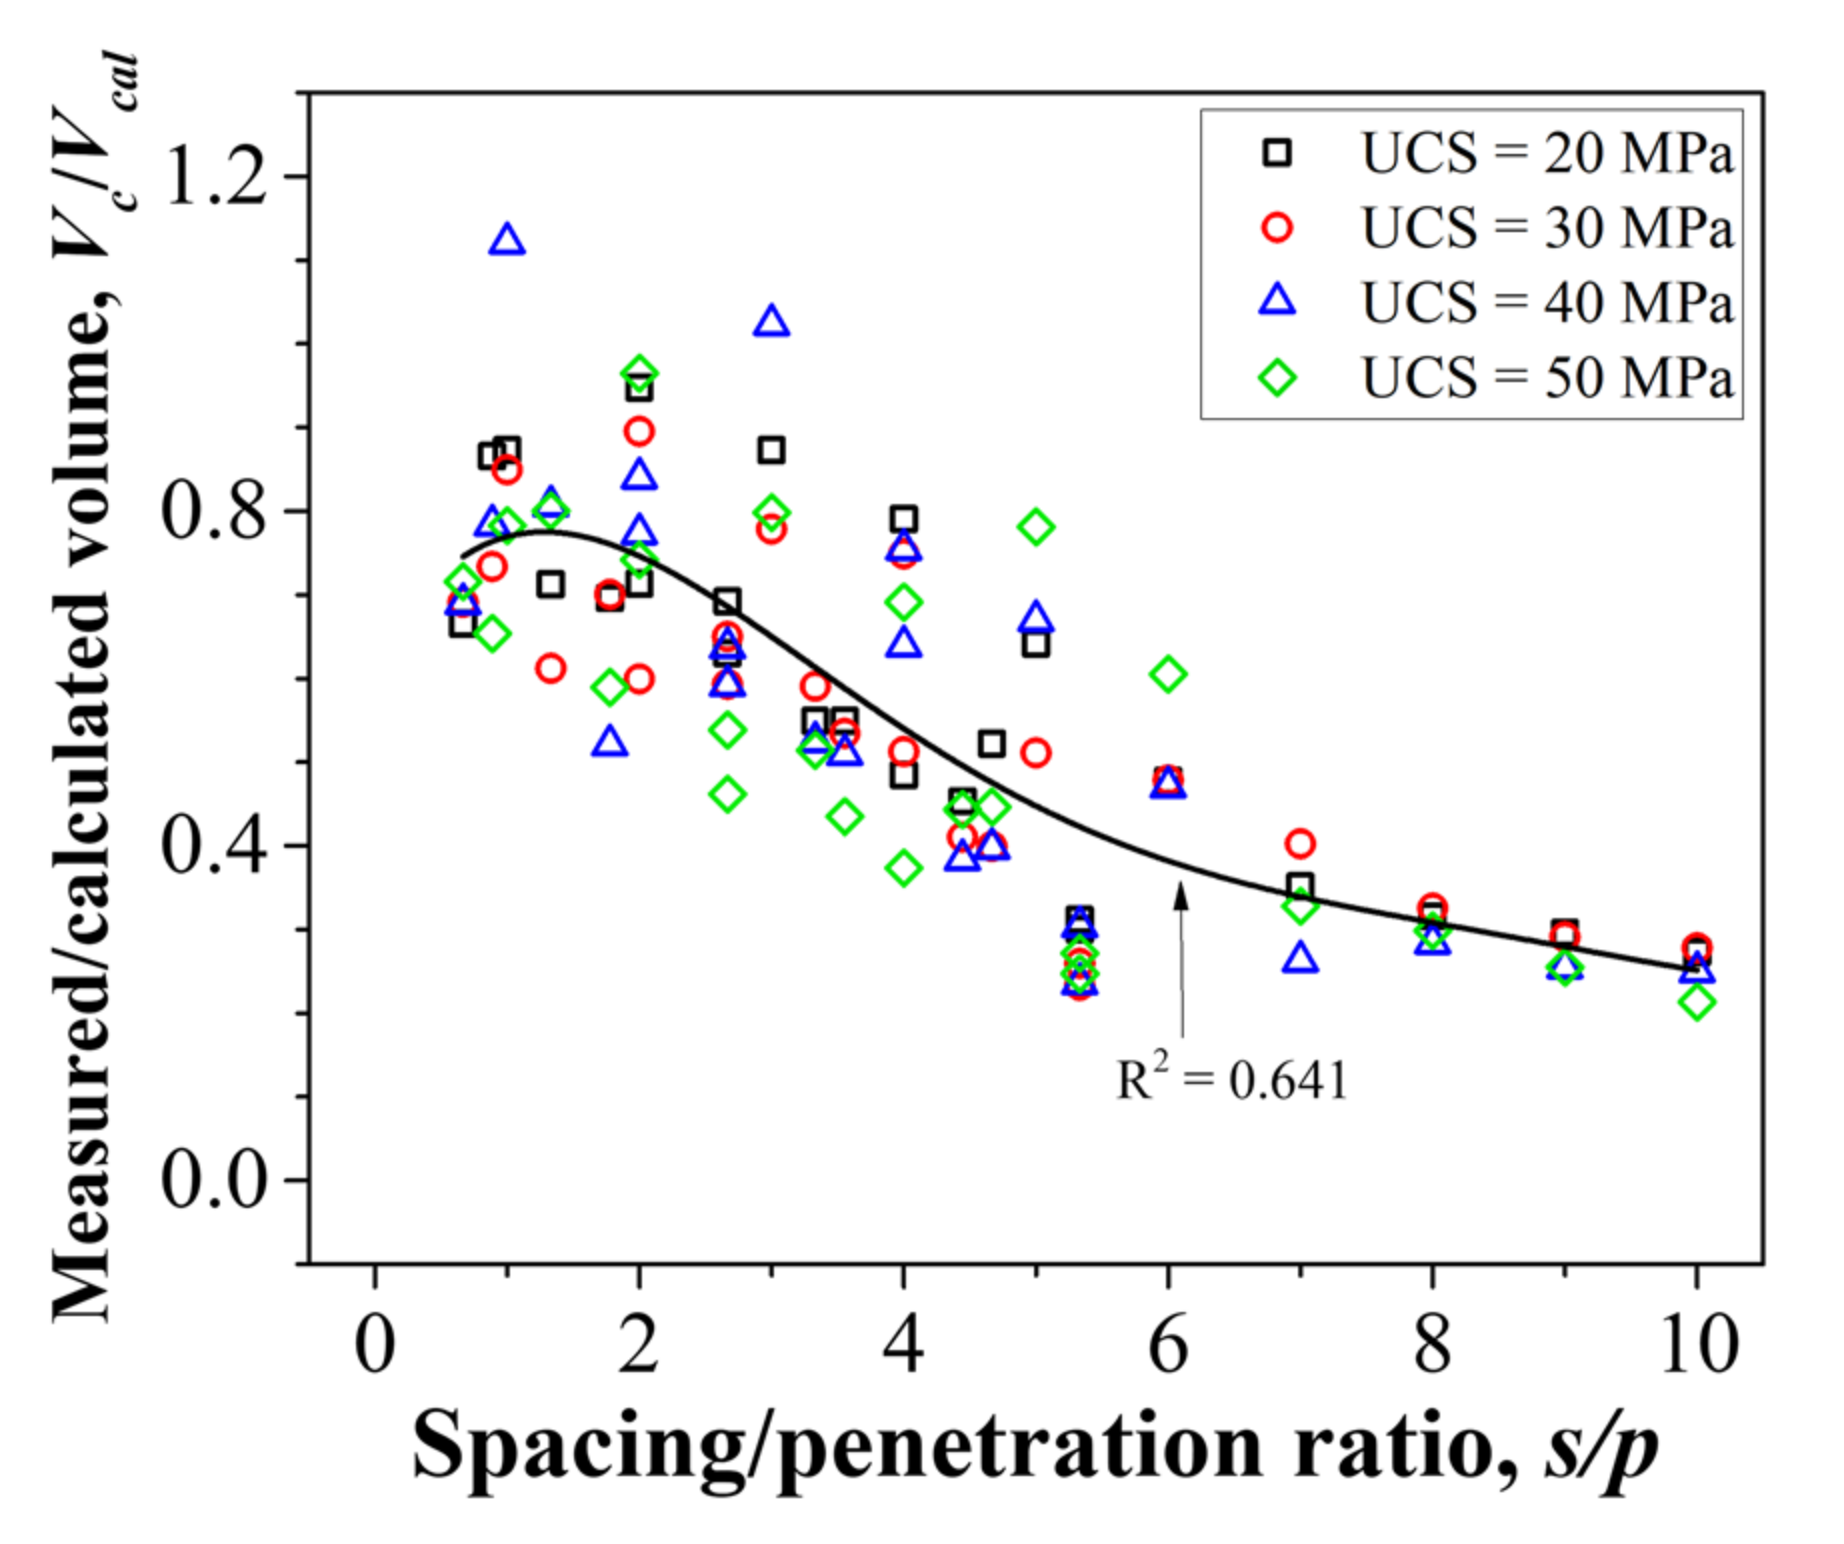
3.2.3. Comparison of Measured Cutting Volume and Calculated Cutting Volume
3.3. Analysis of the Characteristics of Ridge Formation
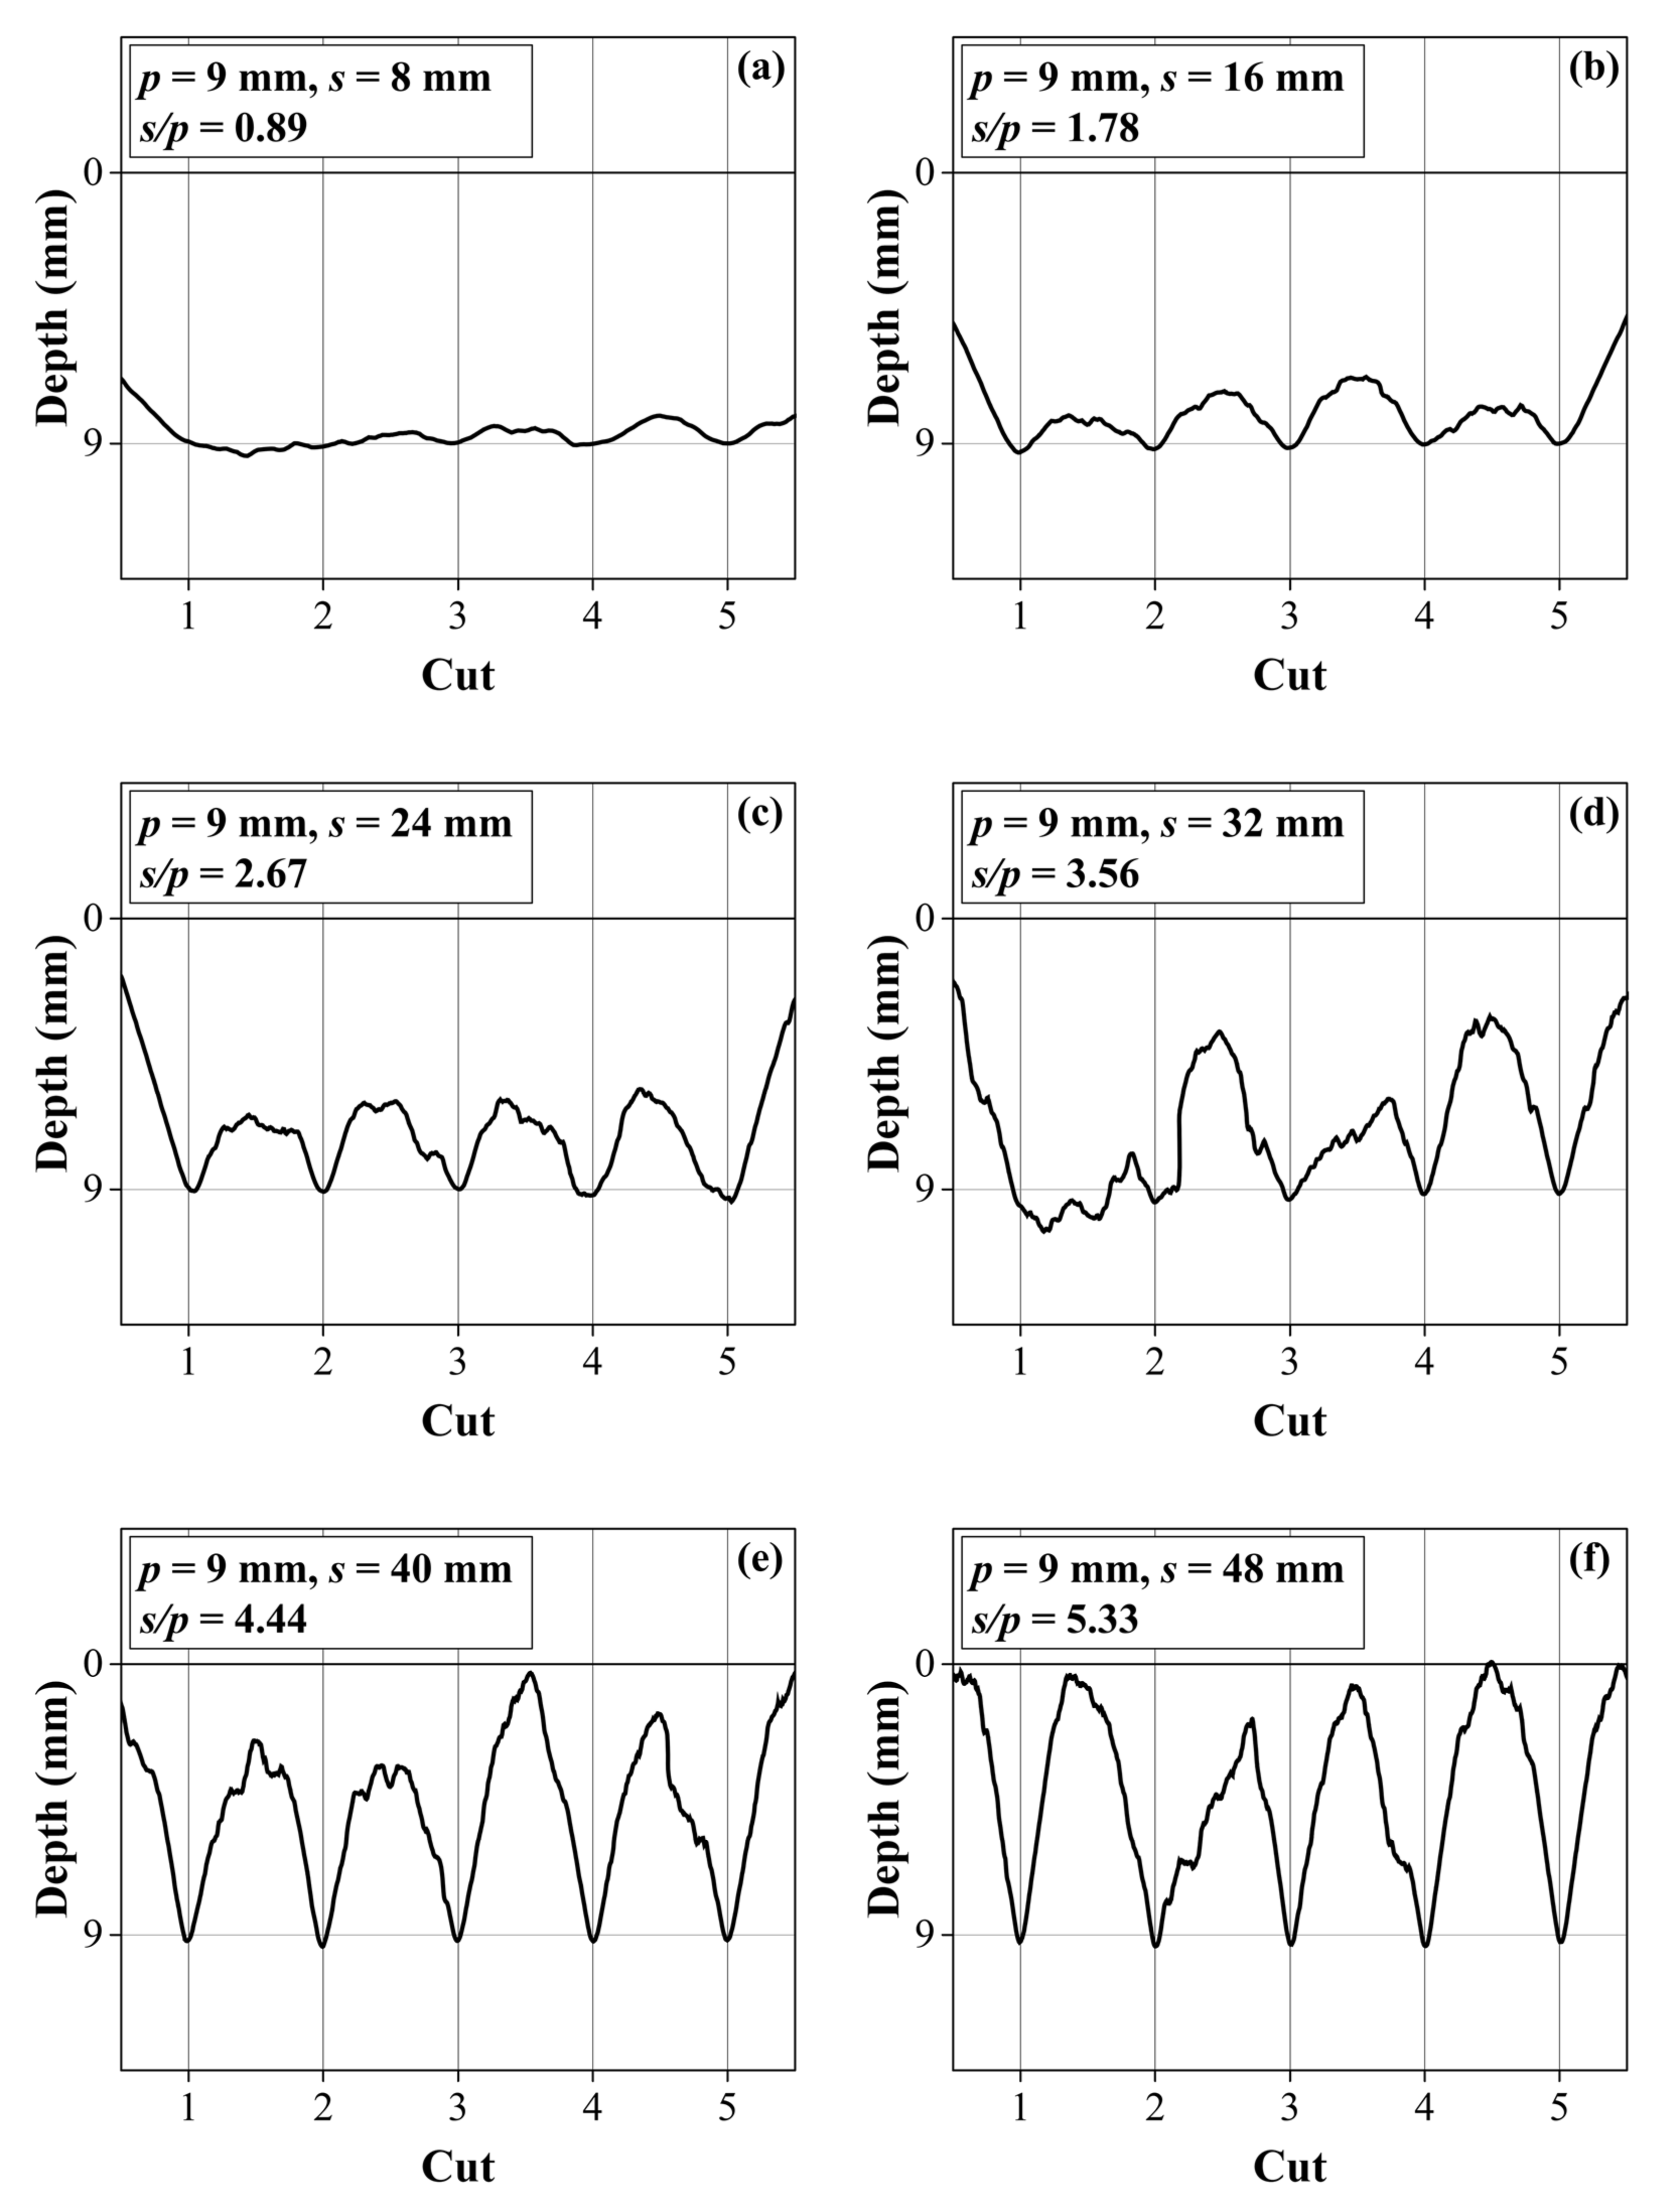
3.3.1. Effect of Penetration Depth on Ridge Formation
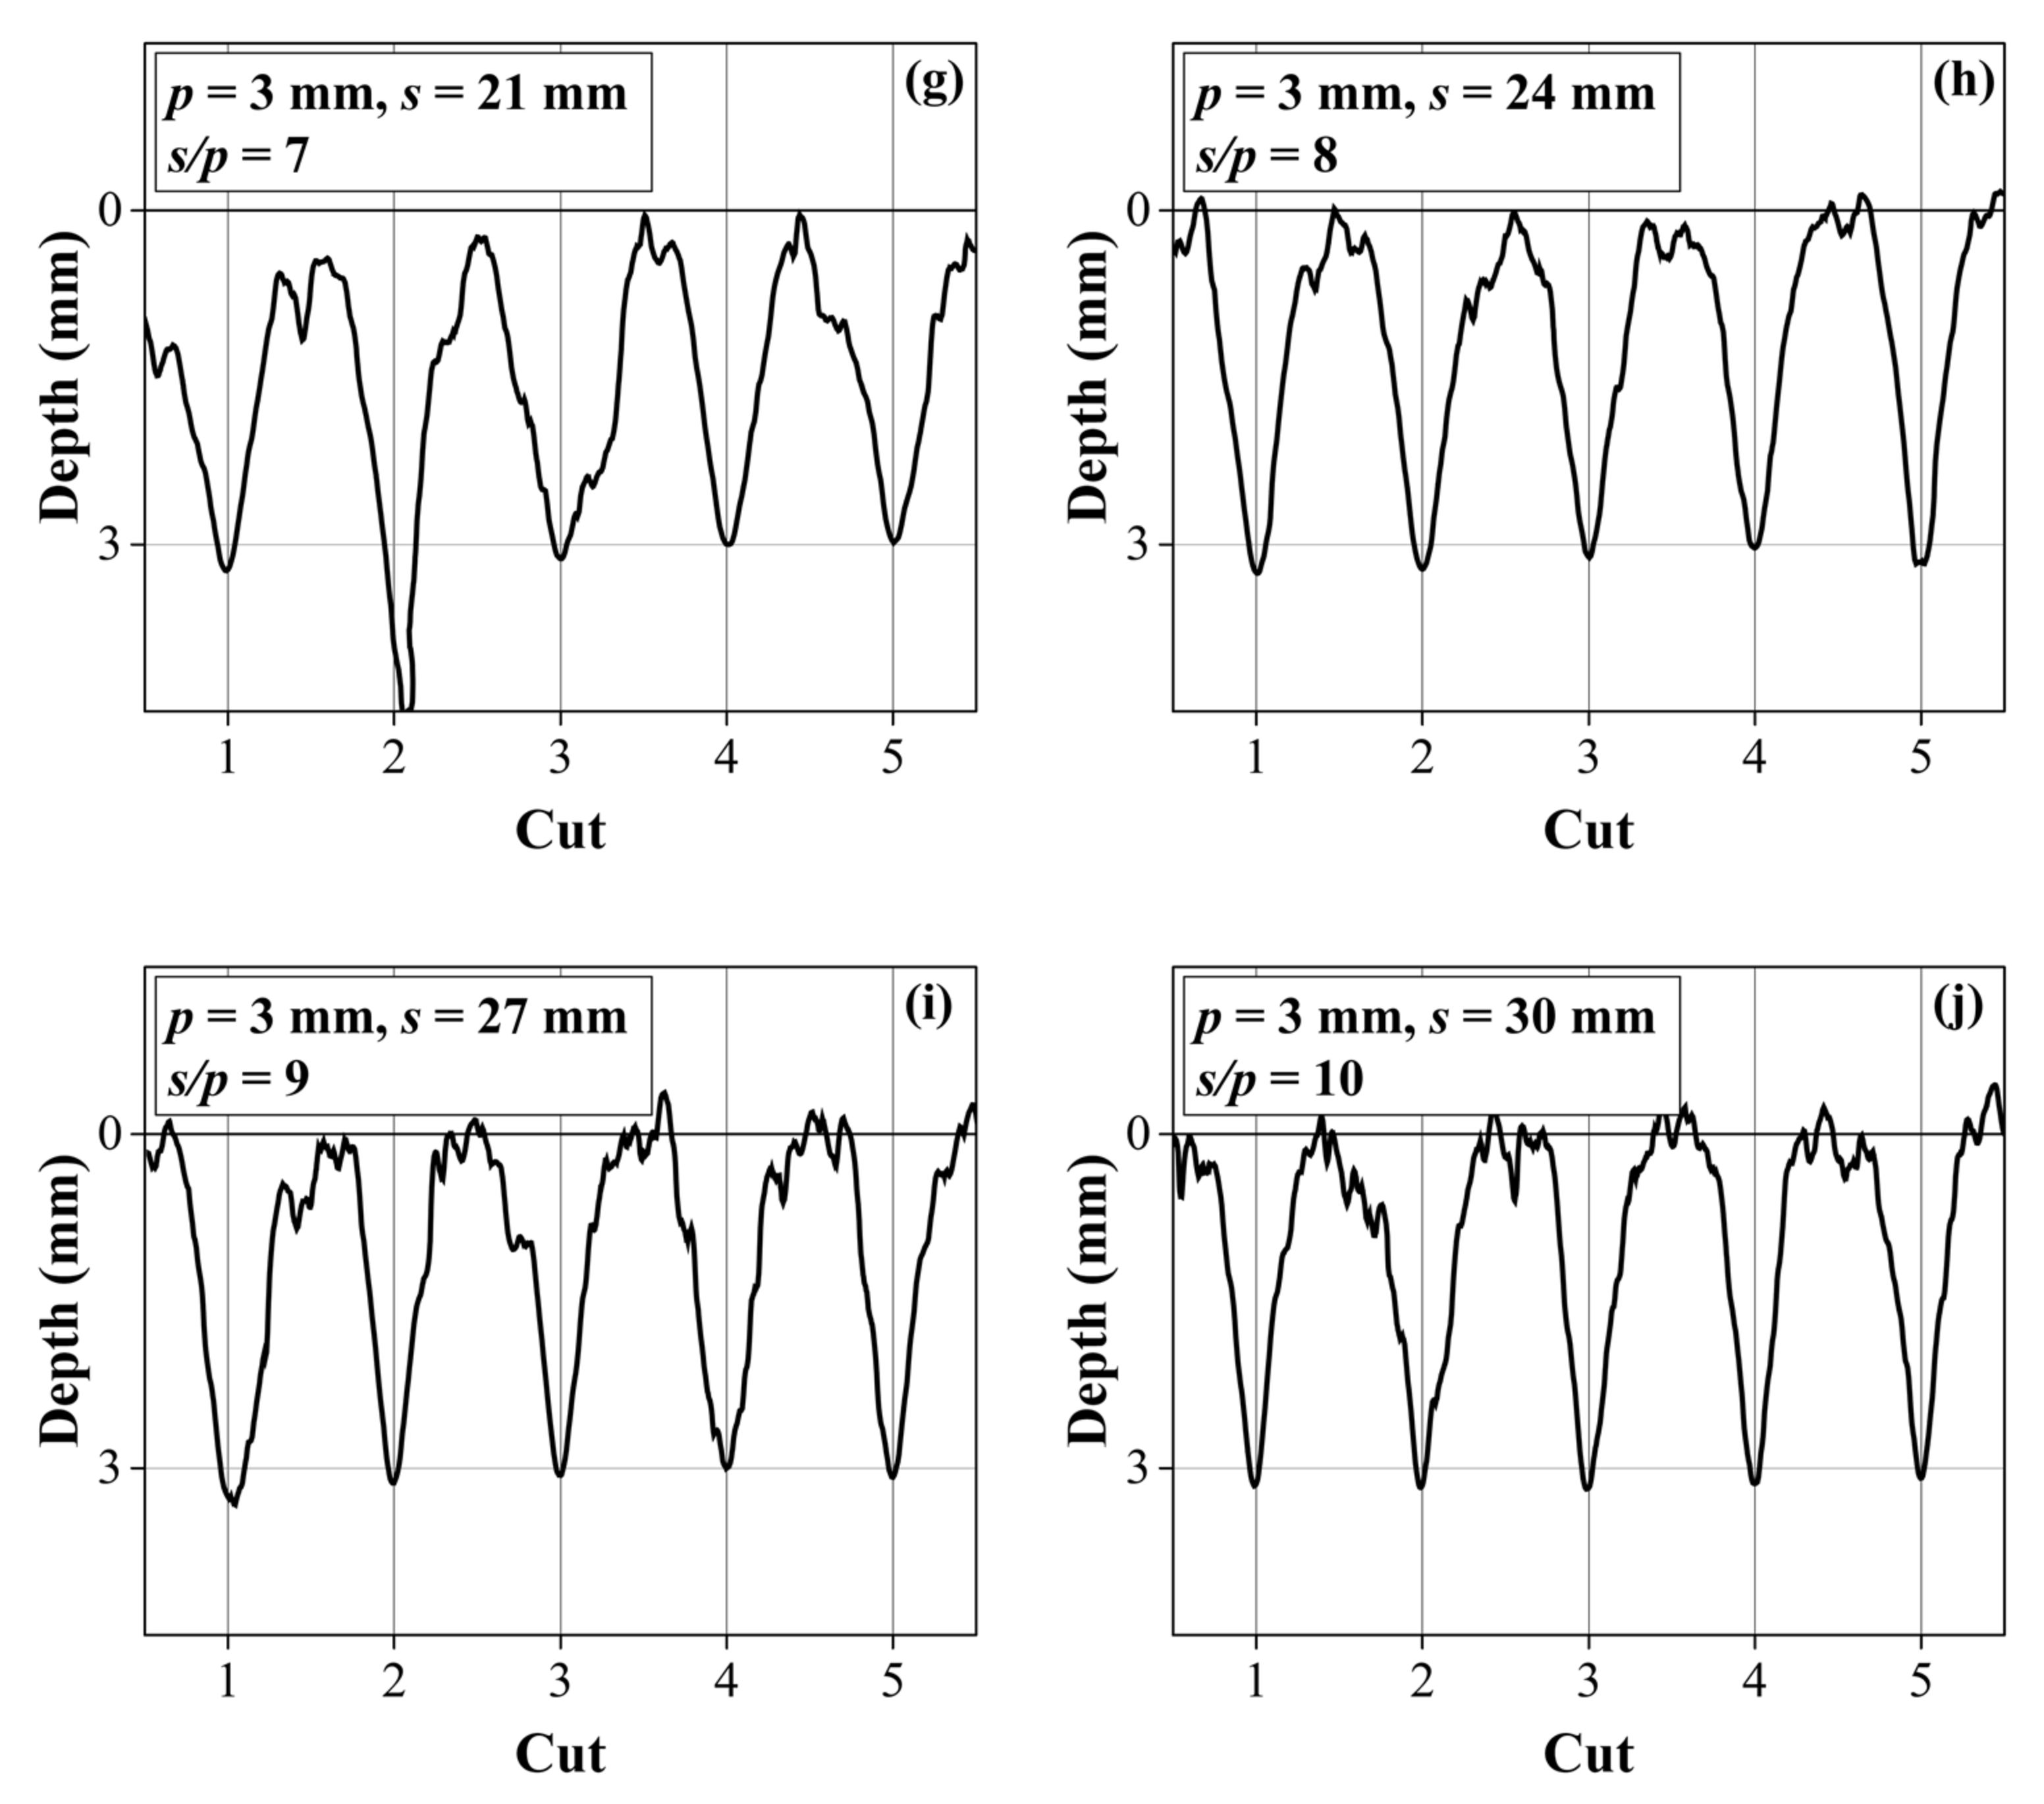
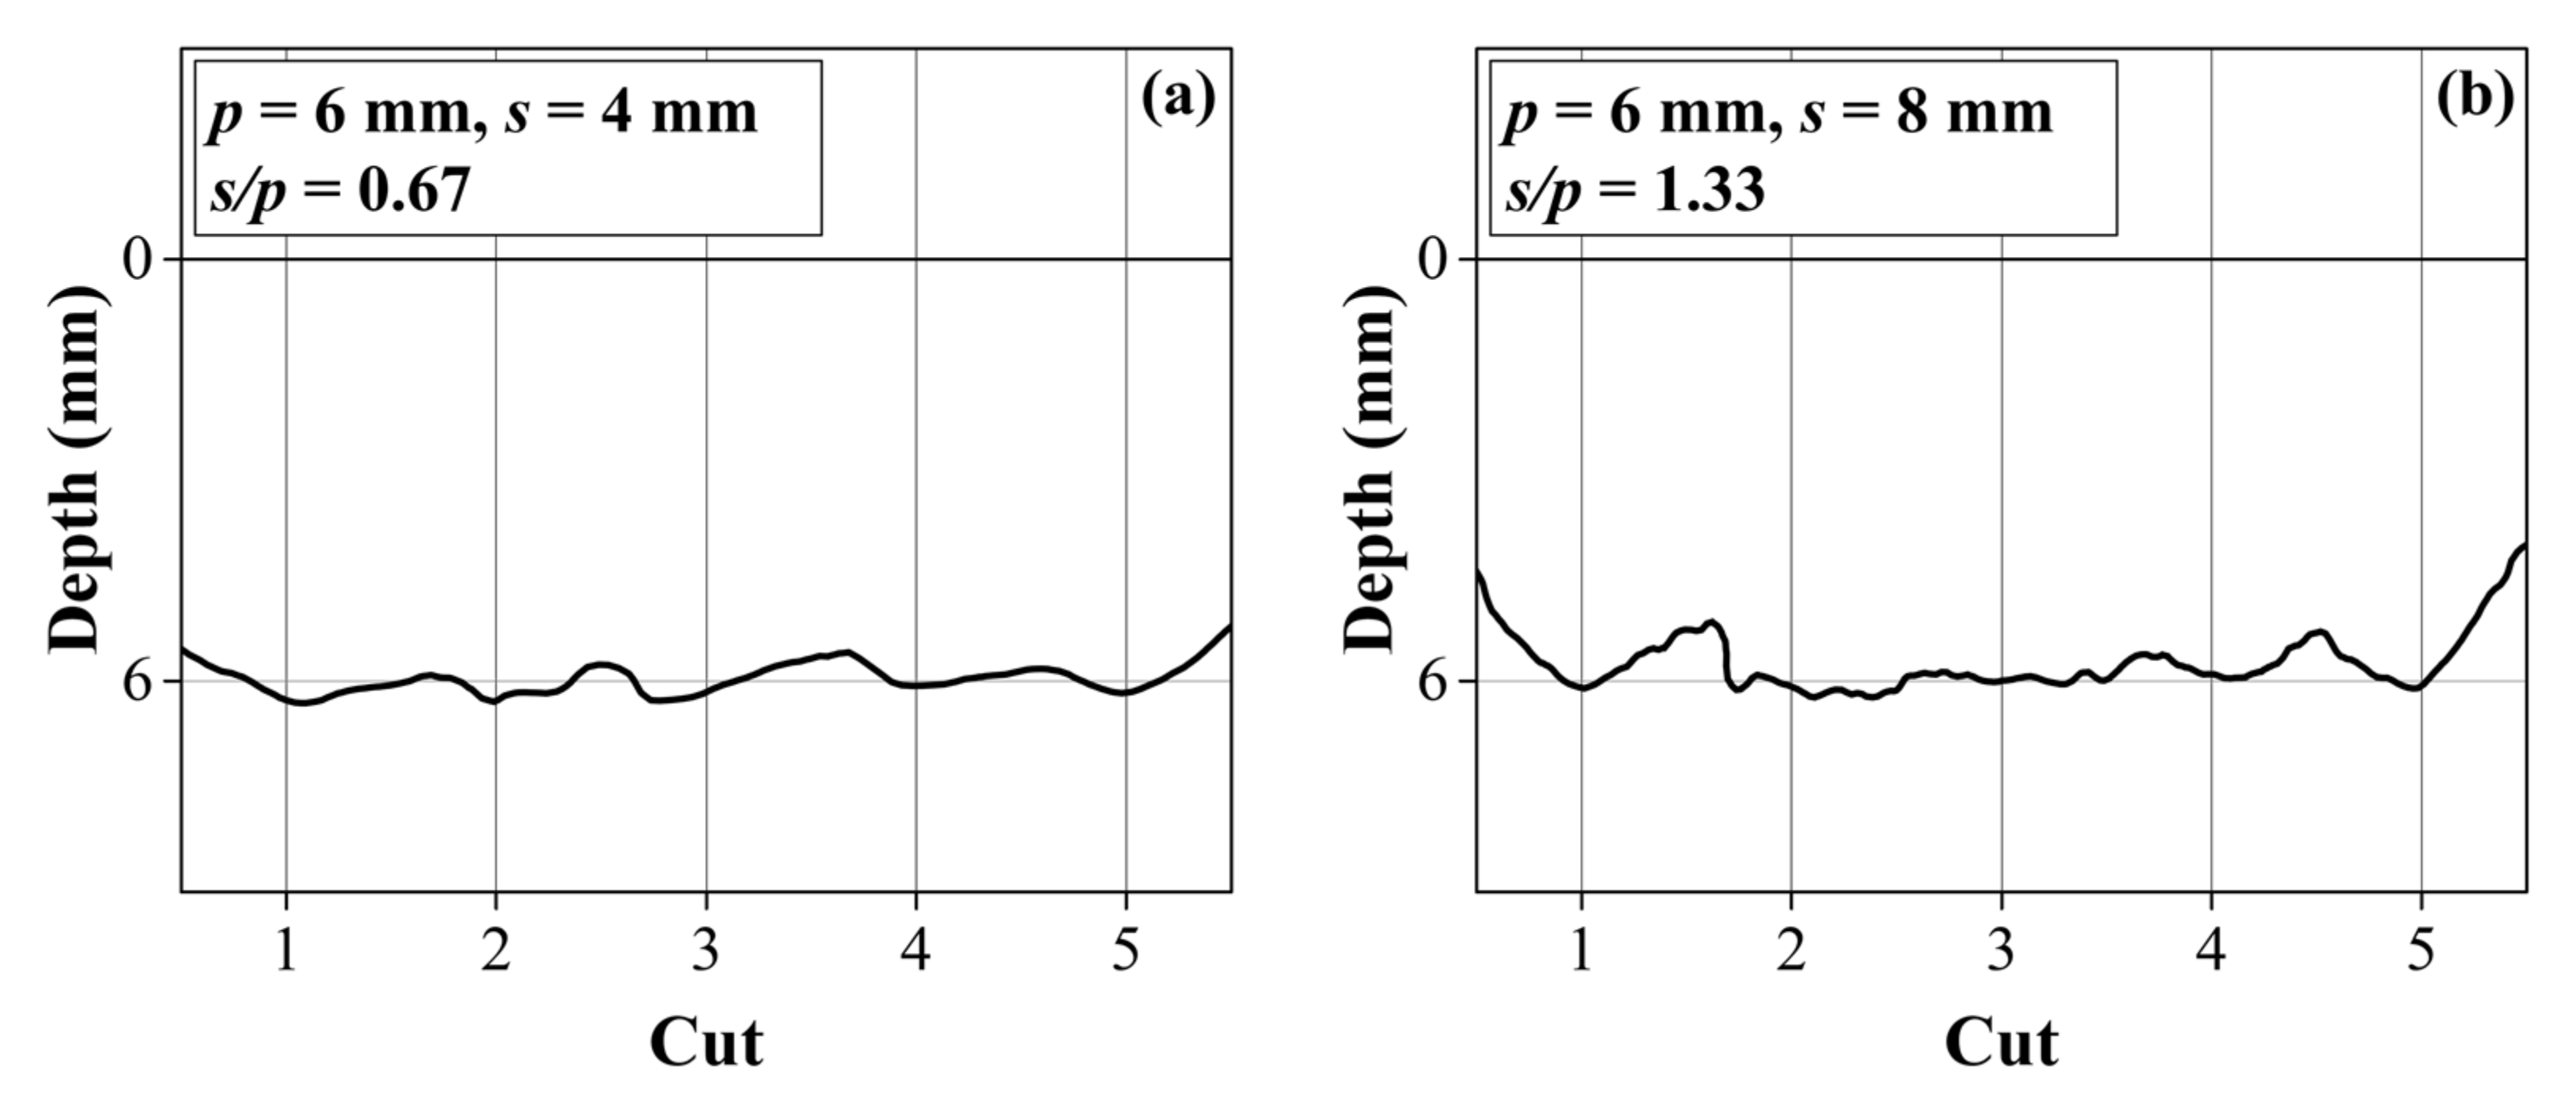
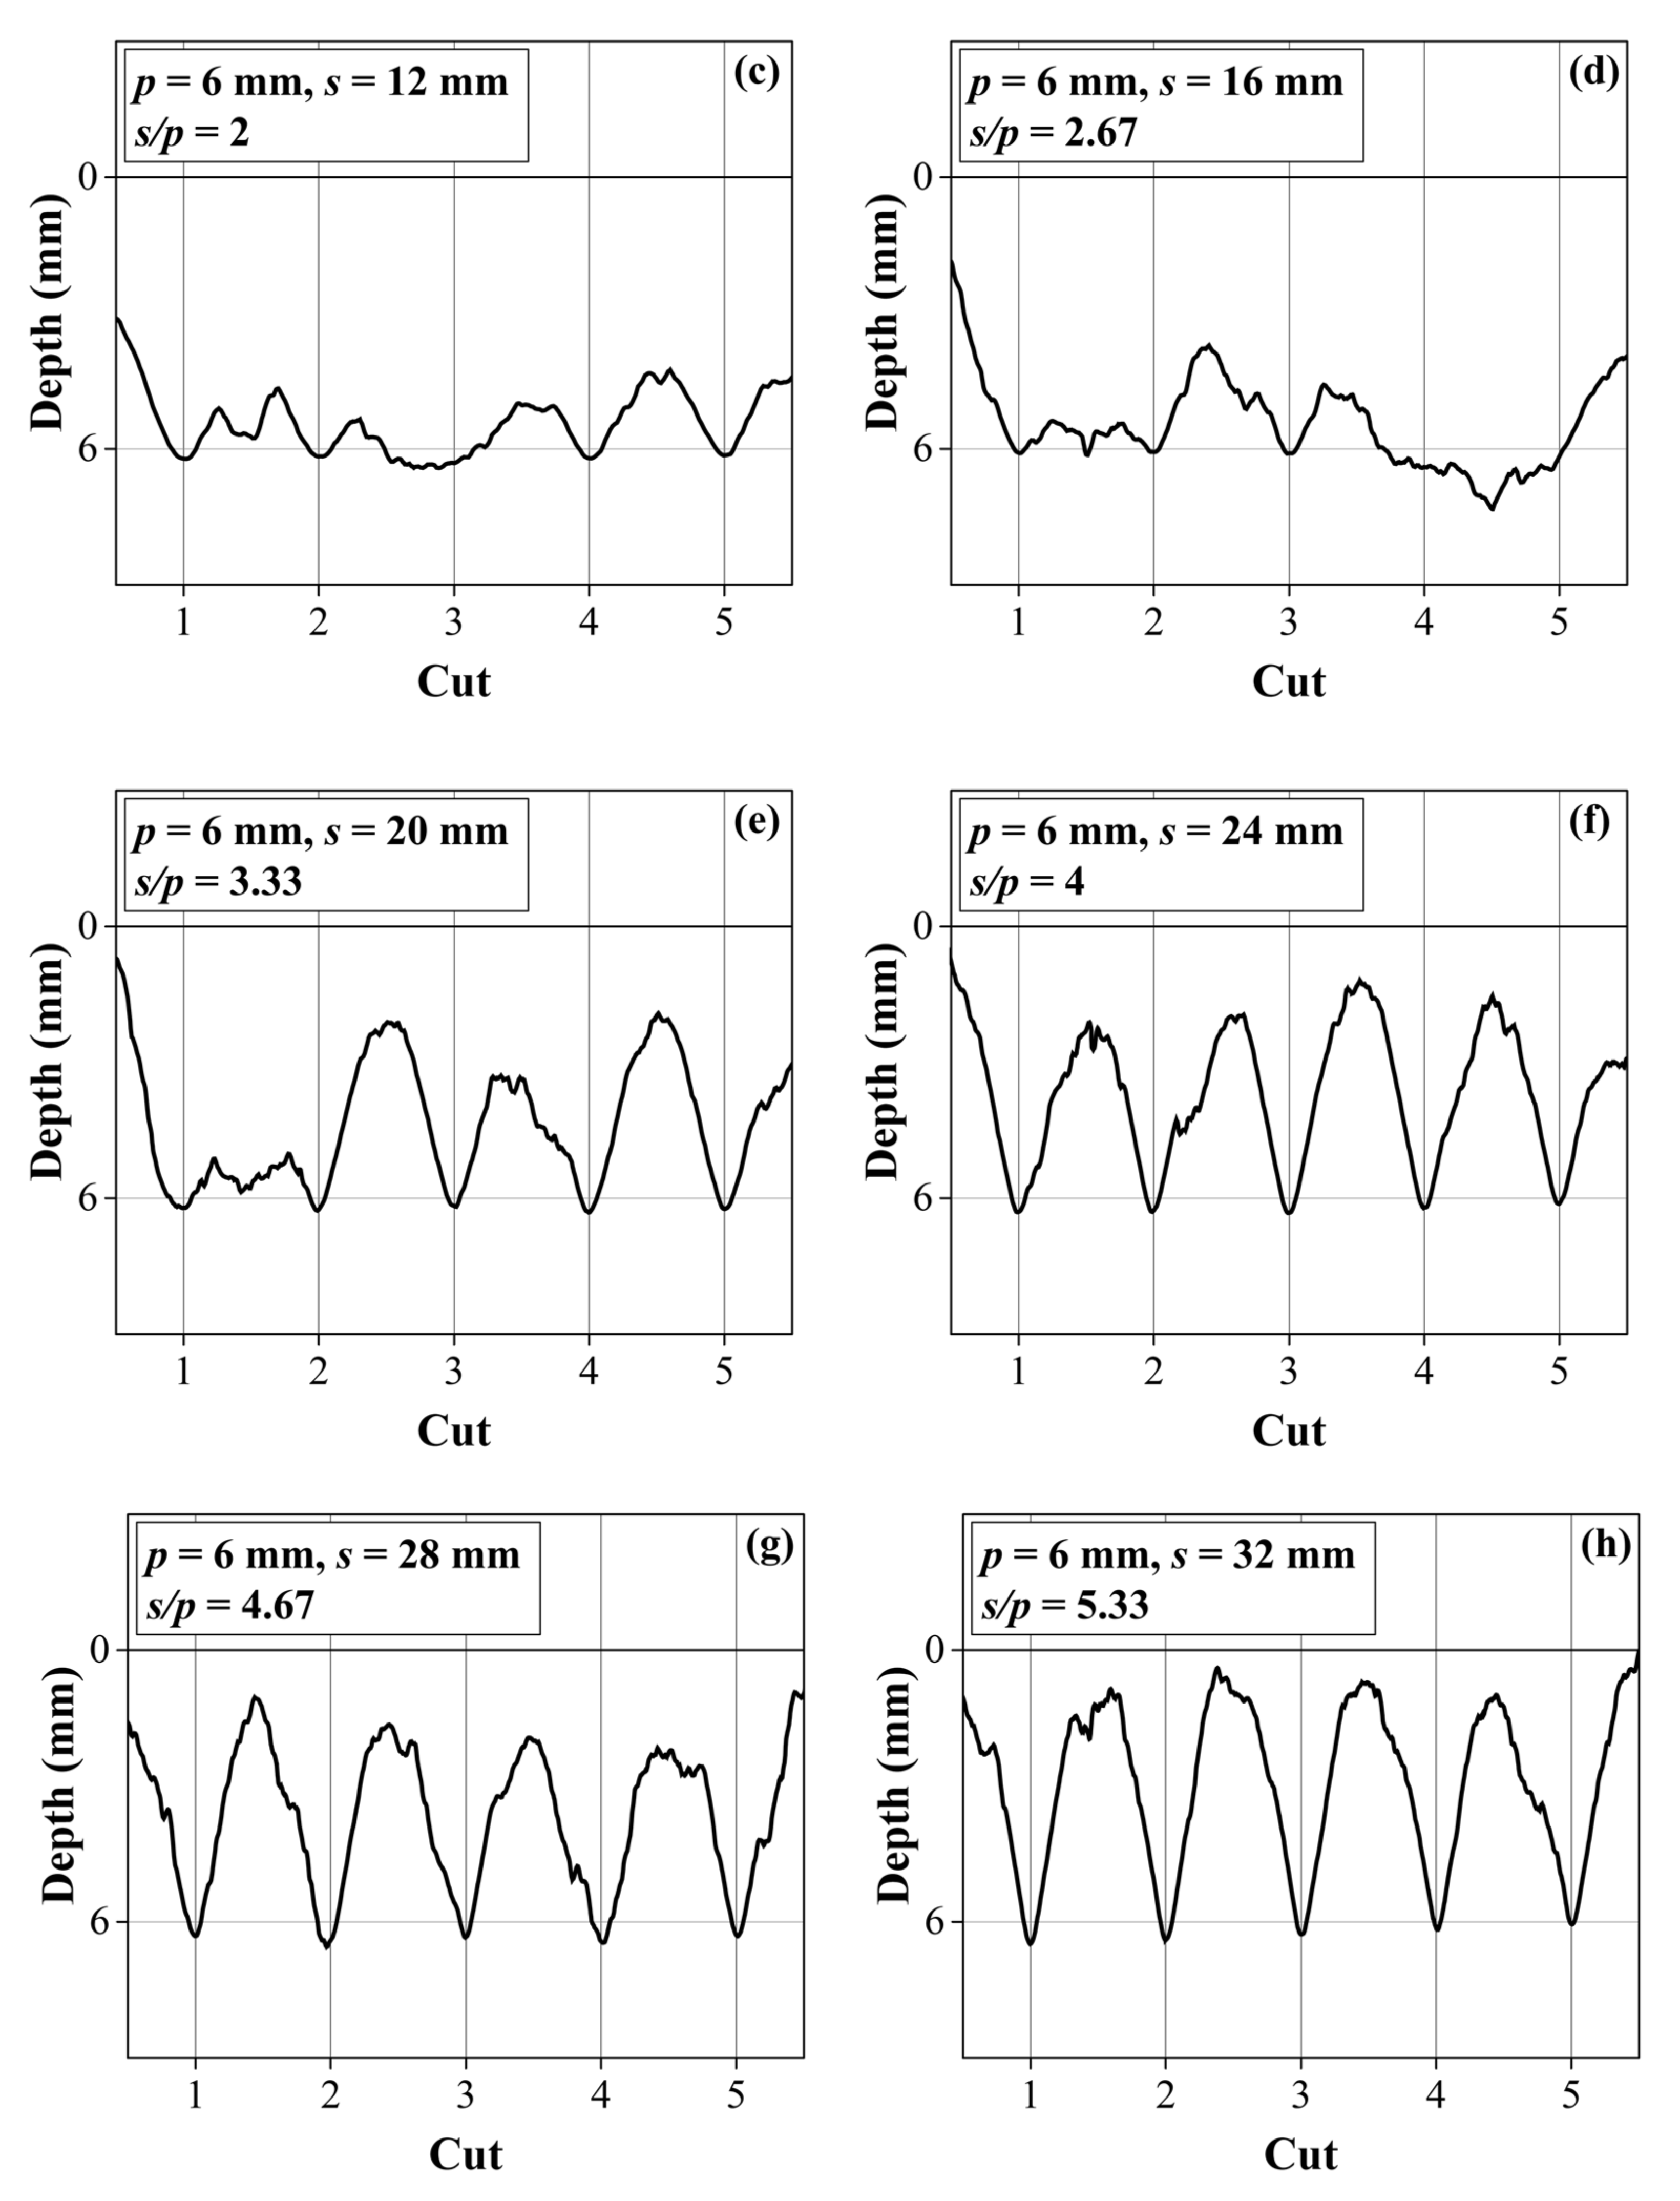
3.3.2. Effect of Spacing on Ridge Formation
3.4. Effect on Specific Energy
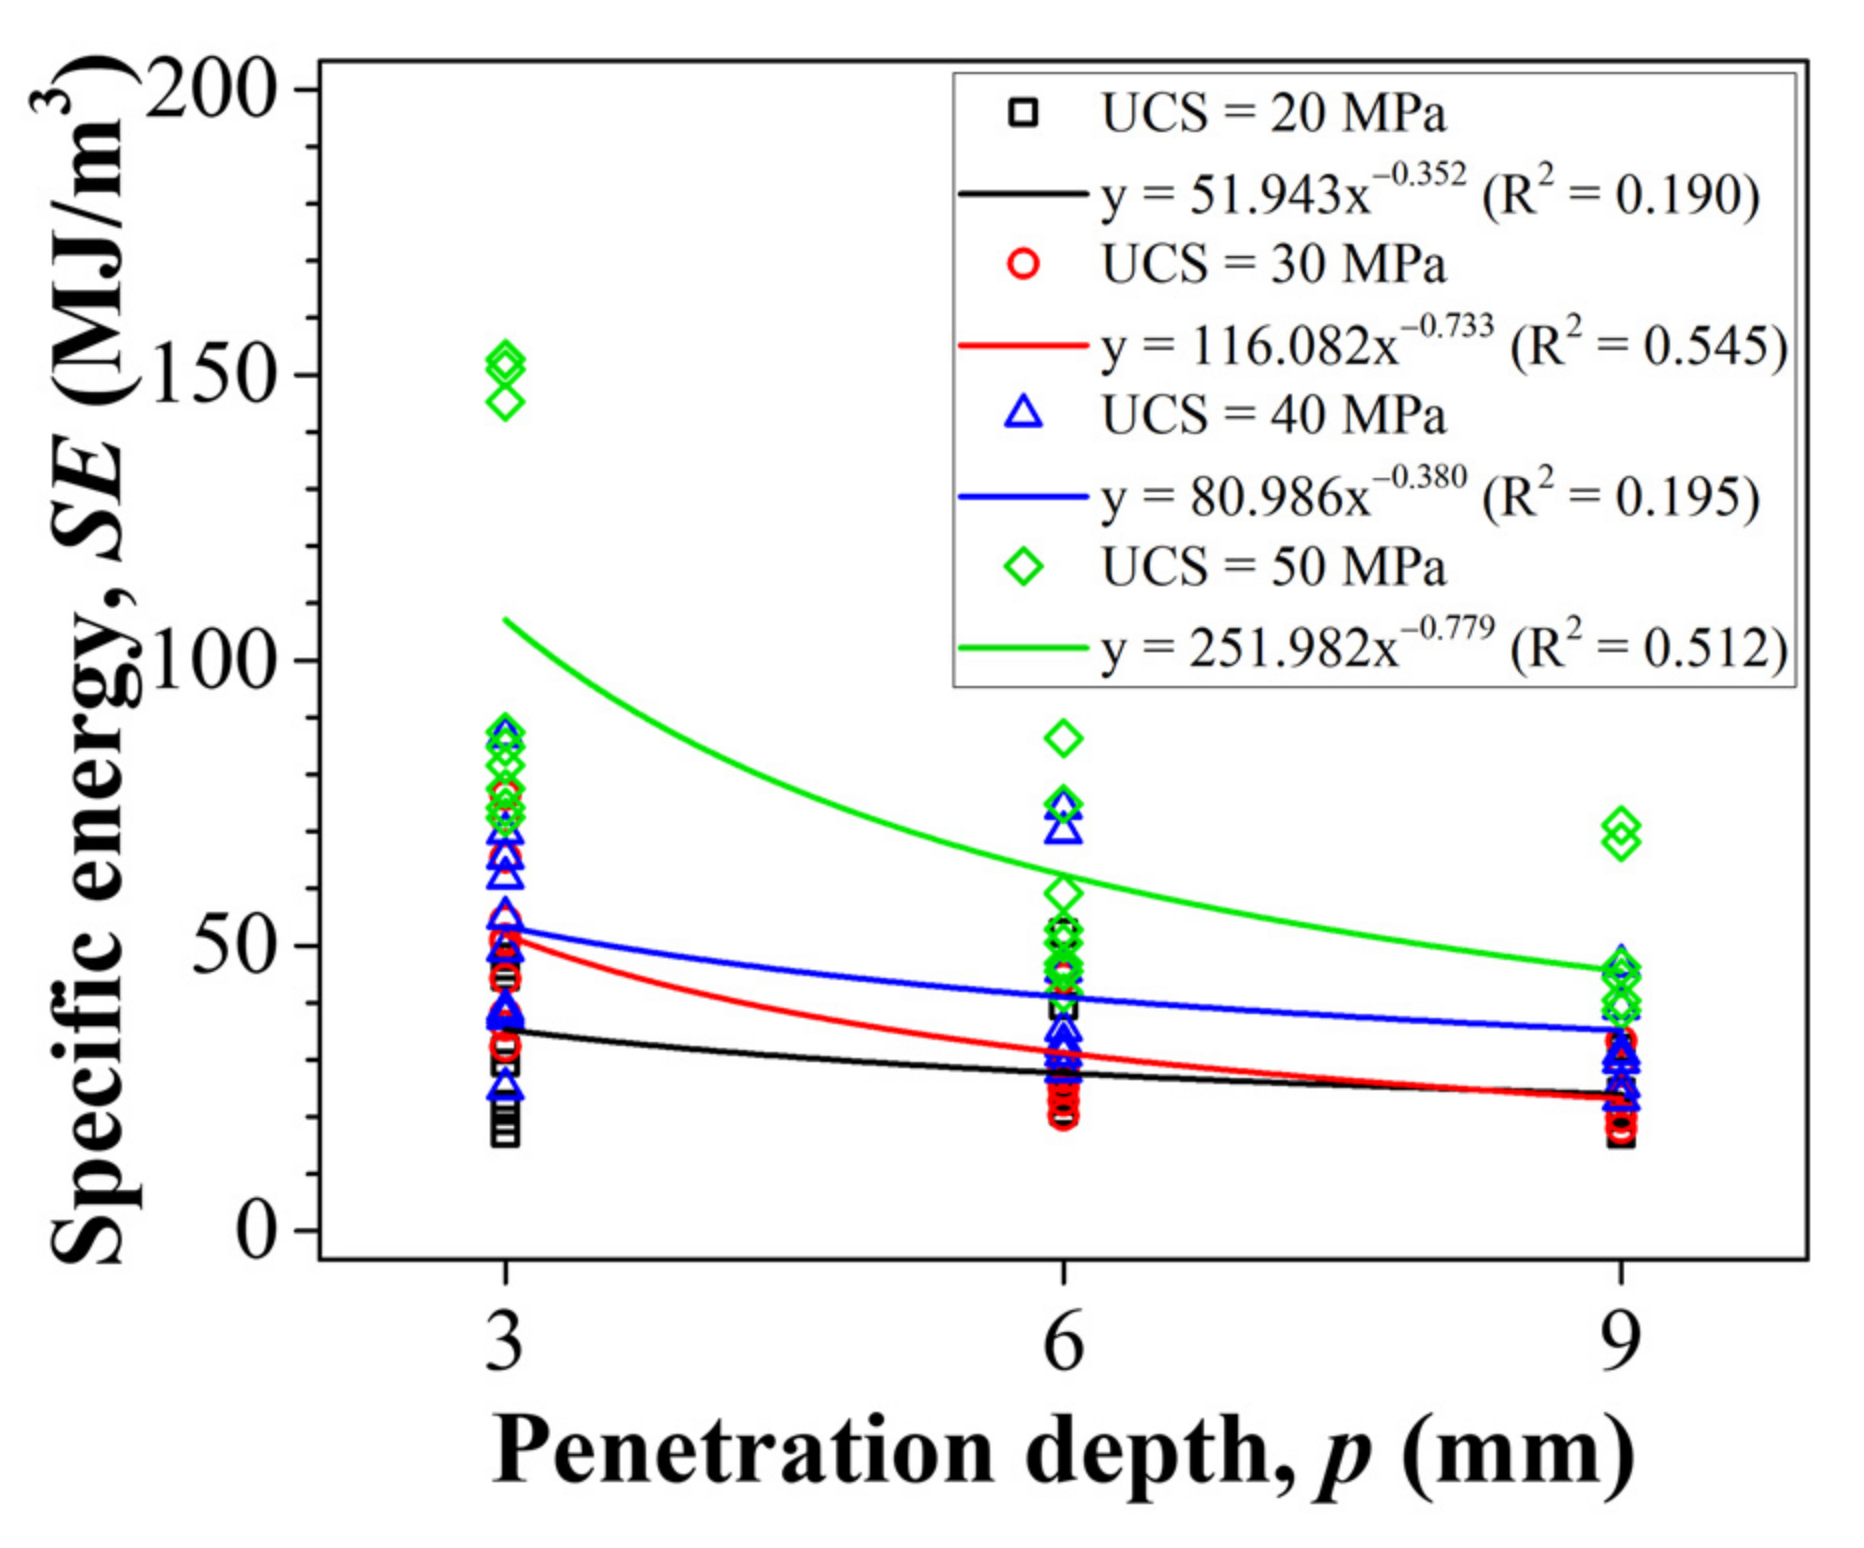
3.4.1. Effect of Penetration Depth on Specific Energy
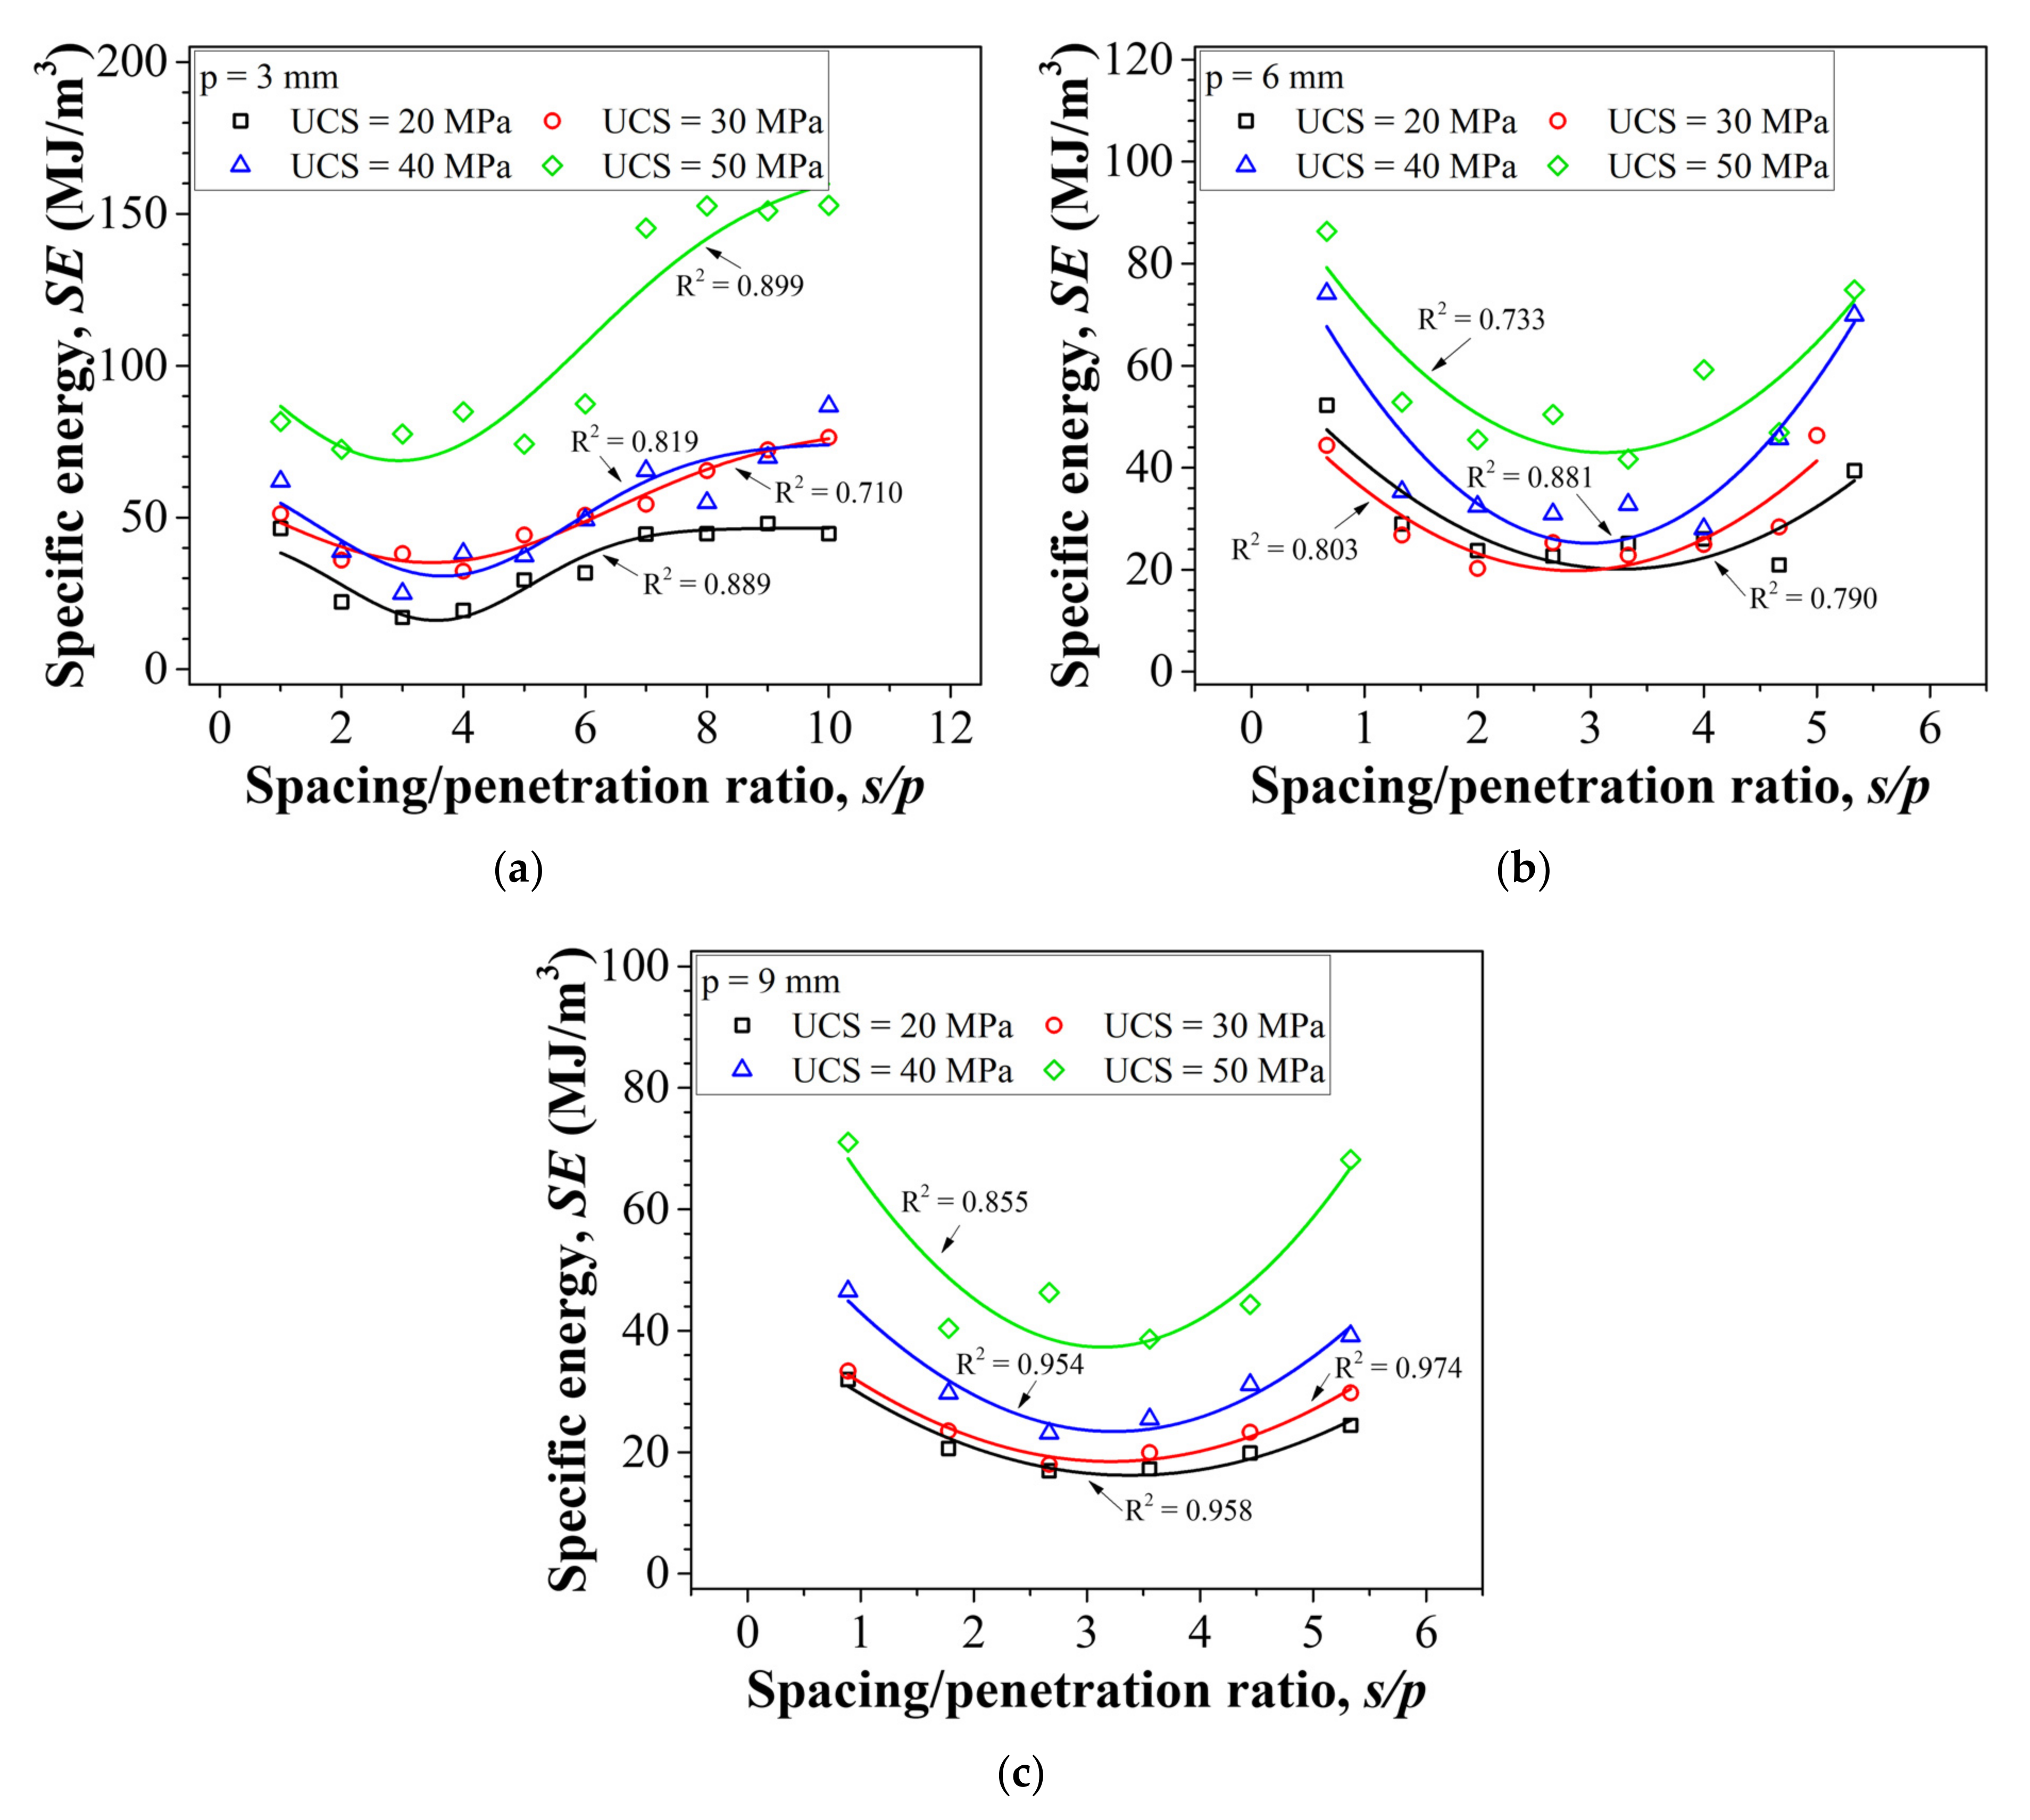
3.4.2. Effect of Spacing on Specific Energy
4. Conclusions
- The tool forces increased as the penetration depth and spacing increased, similar to TBMs and roadheaders. However, information for predicting optimal cutting conditions can be obtained from the ratio of tool forces. The ratio of the peak cutting force to the mean cutting force was the maximum near 2 for s/p, and the ratio of the cutting force to the normal force was also the maximum near 2 for s/p. In conclusion, when s/p is near 2, larger rock chips are obtained, and the wear of the tool is minimized.
- The cutting volume increased in the power relationship as the penetration depth increased, and was not affected by the rock strength. This volume reached a maximum at a specific s/p, and the specific s/p was the same, regardless of the penetration depth. This result is similar to the case of the TBMs and roadheaders. Additionally, the cutting volume was constant as s/p became greater than 8, and the ratio of the measured cutting volume to the calculated cutting volume reached a maximum when s/p was close to 1.5. This result shows that ridges start to form between the cutting grooves as s/p becomes larger than 1.5, and the cutting is performed in the unrelieved mode if it becomes larger than 8.
- The ridge between the cutting grooves decreased as the penetration depth increased and increased with spacing. In particular, when s/p was 1.5, ridges started to form, and as s/p became larger than 8, the ridges reached the height of the rock surface before cutting. This supports the results obtained from the analysis of cutting volume.
- The specific energy decreased in a power relationship as the penetration depth increased, similar to the case of the TBMs and roadheaders. In addition, the specific energy reached a minimum when s/p was between 2 and 4, regardless of the penetration depth and rock strength, similar to that of a roadheader using a drag tool.
Author Contributions
Funding
Institutional Review Board Statement
Informed Consent Statement
Data Availability Statement
Conflicts of Interest
References
- Rehman, H.; Naji, A.M.; Ali, W.; Junaid, M.; Abdullah, R.A.; Yoo, H.-K. Numerical evaluation of new Austrian tunneling method excavation sequences: A case study. Int. J. Min. Sci. Technol. 2020, 30, 381–386. [Google Scholar] [CrossRef]
- Rehman, H.; Naji, A.M.; Nam, K.; Ahmad, S.; Muhammad, K.; Yoo, H.-K. Impact of Construction Method and Ground Composition on Headrace Tunnel Stability in the Neelum–Jhelum Hydroelectric Project: A Case Study Review from Pakistan. Appl. Sci. 2021, 11, 1655. [Google Scholar] [CrossRef]
- Richart, F.E.; Hall, J.R.; Woods, R.D. Vibrations of Soils and Foundations; Prentice-Hall: Hoboken, NJ, USA, 1970. [Google Scholar]
- Santamarina, J.C.; Klein, K.A.; Fam, M.A. Soils and Waves; John Wiley & Sons: New York, NY, USA, 2001. [Google Scholar]
- Bougard, J. The mechanical pre-cutting method. Tunn. Undergr. Space Technol. 1988, 3, 163–167. [Google Scholar] [CrossRef]
- van Walsum, E. Mechanical pre-cutting, a rediscovered tunneling technique. Rock Mech. Rock Eng. 1991, 24, 65–79. [Google Scholar] [CrossRef]
- Wang, T.; Wang, X.; Tan, Z.; Li, K.; He, M. Studies on ground settlement and pre-arching stress of pre-cutting tunnelling method. Tunn. Undergr. Space Technol. 2018, 82, 199–210. [Google Scholar] [CrossRef]
- Lunardi, G.; Agresti, S.; Basta, D. The widening of the “Montedomini” A14 Motorway Tunnel in the presence of traffic. In Proceedings of the ITA-AITES World Tunnel Congress 2016 (WTC 2016), San Francisco, CA, USA, 22–28 April 2016; pp. 1–10. [Google Scholar]
- Lunardi, G.; Belfiore, A.; Selleri, A.; Trapasso, R. Widening the “Montedomini” tunnel in the presence of traffic: The evolution of the “Nazzano” method. In Proceedings of the ITA-AITES World Tunnel Congress 2014 (WTC 2014), Foz do Iguaçu, Brazil, 9–14 May 2014; pp. 1–10. [Google Scholar]
- Snowdon, R.A.; Ryley, M.D.; Temporal, J. A study of disc cutting in selected British rocks. Int. J. Rock Mech. Min. Sci. Géoméch. Abstr. 1982, 19, 107–121. [Google Scholar] [CrossRef]
- Sanio, H.P. Prediction of the performance of disc cutters in anisotropic rock. Int. J. Rock Mech. Min. Sci. Géoméch. Abstr. 1985, 22, 153–161. [Google Scholar] [CrossRef]
- Gertsch, R.; Gertsch, L.; Rostami, J. Disc cutting tests in Colorado Red Granite: Implications for TBM performance prediction. Int. J. Rock Mech. Min. Sci. 2007, 44, 238–246. [Google Scholar] [CrossRef]
- Balci, C.; Demircin, M.A.; Copur, H.; Tuncdemir, H. Estimation of optimum specific energy based on rock properties for assessment of roadheader performance. SIAMM—J. S. Afr. Inst. Min. Metall. 2004, 104, 633–642. [Google Scholar]
- Bilgin, N.; Demircin, M.A.; Copur, H.; Balci, C.; Tuncdemir, H.; Akcin, N. Dominant rock properties affecting the performance of conical picks and the comparison of some experimental and theoretical results. Int. J. Rock Mech. Min. Sci. 2005, 43, 139–156. [Google Scholar] [CrossRef]
- Tiryaki, B.; Dikmen, A.C. Effects of rock properties on specific cutting energy in linear cutting of sandstones by picks. Rock Mech. Rock Eng. 2006, 39, 89–120. [Google Scholar] [CrossRef]
- Wang, X.; Su, O.; Wang, Q.-F.; Liang, Y.-P. Effect of cutting depth and line spacing on the cuttability behavior of sandstones by conical picks. Arab. J. Geosci. 2017, 10, 525. [Google Scholar] [CrossRef]
- Yasar, S.; Yilmaz, A.O. Rock Cutting Tests with a Simple-Shaped Chisel Pick to Provide Some Useful Data. Rock Mech. Rock Eng. 2017, 50, 3261–3269. [Google Scholar] [CrossRef]
- Özşen, H.; Dursun, A.E.; Aras, A. Estimation of Specific Energy and Evaluation of Roadheader Performance Using Rock Properties and Bond Work Index. Min. Met. Explor. 2021, 38, 1923–1932. [Google Scholar] [CrossRef]
- Huang, D.; Wang, X.; Su, O.; Zheng, Z.-J.; Gao, M. Study on the cuttability characteristics of granites under conical picks by indentation tests. Bull. Eng. Geol. Environ. 2022, 81, 192. [Google Scholar] [CrossRef]
- Yasar, S.; Yilmaz, A.O. Drag pick cutting tests: A comparison between experimental and theoretical results. J. Rock Mech. Geotech. Eng. 2018, 10, 893–906. [Google Scholar] [CrossRef]
- Kim, H.-E.; Nam, K.-M.; Kyeon, T.-S.; Rehman, H.; Yoo, H.-K. Analysis of the Effect of the Tool Shape on the Performance of Pre-Cutting Machines during Tunneling Using Linear Cutting Tests. Appl. Sci. 2022, 12, 4489. [Google Scholar] [CrossRef]
- Aresh, B.; Khan, F.N.; Haider, J. Experimental investigation and numerical simulation of chip formation mechanisms in cutting rock-like materials. J. Pet. Sci. Eng. 2022, 209, 109869. [Google Scholar] [CrossRef]
- Zhang, X.; Li, J.; Xia, Y.; Lin, L.; Li, M.; Chen, L. Cutting characteristics and layout of pre-cutting machine cutter. Period. Polytech. Civ. Eng. 2020, 81, 192. [Google Scholar] [CrossRef]
- Li, X. A study on the influence of pick geometry on rock cutting based on full-scale cutting test and simulation. Adv. Mech. Eng. 2020, 12. [Google Scholar] [CrossRef]
- Rostami, J.; Ozdemir, L.; Nilson, B. Comparison between CSM and NTH hard rock TBM performance prediction models. In Proceedings of the Annual Technical Meeting of the Institute of Shaft Drilling Technology, Las Vegas, NV, USA, 1–3 May 1996; pp. 1–10. [Google Scholar]
- Ozdemir, L.; Nilsen, B. Recommended laboratory rock testing for TBM projects. AUA News 1999, 14, 21–35. [Google Scholar]
- Bilgin, N.; Copur, H.; Balci, C. Mechanical Excavation in Mining and Civil Industries; CRC Press: New York, NY, USA, 2014. [Google Scholar]
- Balci, C.; Bilgin, N. Correlative study of linear small and full-scale rock cutting tests to select mechanized excavation machines. Int. J. Rock Mech. Min. Sci. 2007, 44, 468–476. [Google Scholar] [CrossRef]
- Copur, H.; Bilgin, N.; Balci, C.; Tumac, D.; Avunduk, E. Effects of Different Cutting Patterns and Experimental Conditions on the Performance of a Conical Drag Tool. Rock Mech. Rock Eng. 2017, 50, 1585–1609. [Google Scholar] [CrossRef]
- Abu Bakar, M.Z.; Gertsch, L.S. Saturation effects on disc cutting of sandstone. In Proceedings of the 45th US Rock Mechanics/Geomechanics Symposium, San Francisco, CA, USA, 26–29 June 2011; pp. 1–10. [Google Scholar]
- Peng, X.; Liu, Q.; Pan, Y.; Lei, G.; Wei, L.; Luo, C. Study on the Influence of Different Control Modes on TBM Disc Cutter Performance by Rotary Cutting Tests. Rock Mech. Rock Eng. 2018, 51, 961–967. [Google Scholar] [CrossRef]
- Cho, J.-W.; Jeon, S.; Jeong, H.-Y.; Chang, S.-H. Evaluation of cutting efficiency during TBM disc cutter excavation within a Korean granitic rock using linear-cutting-machine testing and photogrammetric measurement. Tunn. Undergr. Space Technol. 2013, 35, 37–54. [Google Scholar] [CrossRef]
- Chang, S.H.; Choi, S.W.; Bae, G.J.; Jeon, S. Performance prediction of TBM disc cutting on granitic rock by the linear cutting test. In Proceedings of the ITA-AITES 2006 World Tunnel Congress and 32nd ITA General Assembly, Seoul, Republic of Korea, 22–27 April 2006; p. 271. [Google Scholar]
- Abu Bakar, M.Z.; Gertsch, L.S. Evaluation of saturation effects on drag pick cutting of a brittle sandstone from full scale linear cutting tests. Tunn. Undergr. Space Technol. 2013, 34, 124–134. [Google Scholar] [CrossRef]
- Barker, J.S. A laboratory investigation of rock cutting using large picks. Int. J. Rock Mech. Min. Sci. Géoméch. Abstr. 1964, 1, 519–534. [Google Scholar] [CrossRef]
- Tan, Q.; Yi, L.; Xia, Y.-M. Performance Prediction of TBM Disc Cutting on Marble Rock under Different Load Cases. KSCE J. Civ. Eng. 2018, 22, 1466–1472. [Google Scholar] [CrossRef]
- Bilgin, N. Investigations into the Mechanical Cutting Characteristics of Some Medium and High Strength Rocks. Ph.D. Thesis, Newcastle University, Newcastle, UK, 1977. [Google Scholar]
- Pan, Y.; Liu, Q.; Liu, J.; Liu, Q.; Kong, X. Full-scale linear cutting tests in Chongqing Sandstone to study the influence of confining stress on rock cutting efficiency by TBM disc cutter. Tunn. Undergr. Space Technol. 2018, 80, 197–210. [Google Scholar] [CrossRef]
- Teale, R. The concept of specific energy in rock drilling. Int. J. Rock Mech. Min. Sci. Géoméch. Abstr. 1965, 2, 57–73. [Google Scholar] [CrossRef]
- Wang, X.; Su, O. Specific energy analysis of rock cutting based on fracture mechanics: A case study using a conical pick on sandstone. Eng. Fract. Mech. 2019, 213, 197–205. [Google Scholar] [CrossRef]
- Copur, H. Linear stone cutting tests with chisel tools for identification of cutting principles and predicting performance of chain saw machines. Int. J. Rock Mech. Min. Sci. 2010, 47, 104–120. [Google Scholar] [CrossRef]


| Target Strength (MPa) | Elastic Modulus (Gpa) | Density (kg/m3) | Poisson’s Ratio | Uniaxial Compressive Strength, UCS (Mpa) | Brazilian Tensile Strength, BTS (Mpa) |
|---|---|---|---|---|---|
| 20 | 16.92 | 2214 | 0.3 | 18.0 | 2.06 |
| 30 | 33.35 | 2363 | 0.3 | 29.3 | 2.18 |
| 40 | 38.92 | 2382 | 0.3 | 42.0 | 2.51 |
| 50 | 44.47 | 2235 | 0.3 | 51.8 | 2.99 |
| Penetration Depth, (mm) | Spacing, (mm) | |||||||||
|---|---|---|---|---|---|---|---|---|---|---|
| 3 | 3 | 6 | 9 | 12 | 15 | 18 | 21 | 24 | 27 | 30 |
| 6 | 4 | 8 | 12 | 16 | 20 | 24 | 28 | 32 | ||
| 9 | 8 | 16 | 24 | 32 | 40 | 48 | ||||
| p (mm) | s (mm) | s/p | Fn (kN) | F’n (kN) | F’n/Fn | Fc (kN) | F’c (kN) | F’c/Fc | Fc/Fn |
|---|---|---|---|---|---|---|---|---|---|
| 3 | 3 | 1 | 0.27 | 0.61 | 2.28 | 0.36 | 0.88 | 2.41 | 1.44 |
| 6 | 2 | 0.12 | 0.34 | 2.86 | 0.38 | 1.08 | 2.86 | 3.21 | |
| 9 | 3 | 0.28 | 0.78 | 2.73 | 0.40 | 1.14 | 2.83 | 1.47 | |
| 12 | 4 | 0.28 | 0.67 | 2.41 | 0.55 | 1.46 | 2.65 | 2.16 | |
| 15 | 5 | 0.45 | 1.10 | 2.42 | 0.85 | 2.02 | 2.38 | 1.84 | |
| 18 | 6 | 0.45 | 1.18 | 2.65 | 0.82 | 2.22 | 2.70 | 1.88 | |
| 21 | 7 | 0.55 | 1.10 | 1.99 | 0.98 | 2.05 | 2.09 | 1.87 | |
| 24 | 8 | 0.60 | 1.29 | 2.13 | 1.02 | 2.28 | 2.25 | 1.77 | |
| 27 | 9 | 0.69 | 1.46 | 2.12 | 1.15 | 2.60 | 2.26 | 1.78 | |
| 30 | 10 | 0.65 | 1.43 | 2.18 | 1.09 | 2.41 | 2.20 | 1.69 | |
| 6 | 4 | 0.67 | 0.57 | 1.26 | 2.22 | 0.83 | 1.93 | 2.32 | 1.53 |
| 8 | 1.33 | 0.33 | 0.76 | 2.31 | 0.99 | 2.57 | 2.60 | 3.37 | |
| 12 | 2 | 0.71 | 1.62 | 2.27 | 1.22 | 3.05 | 2.50 | 1.88 | |
| 16 | 2.67 | 0.61 | 1.57 | 2.57 | 1.37 | 3.83 | 2.80 | 2.43 | |
| 20 | 3.33 | 0.96 | 2.24 | 2.34 | 1.66 | 4.25 | 2.57 | 1.89 | |
| 24 | 4 | 1.02 | 2.32 | 2.27 | 1.82 | 5.22 | 2.88 | 2.25 | |
| 28 | 4.67 | 0.98 | 2.33 | 2.38 | 1.83 | 4.97 | 2.71 | 2.14 | |
| 32 | 5.33 | 1.25 | 2.57 | 2.06 | 2.27 | 5.31 | 2.34 | 2.07 | |
| 9 | 8 | 0.89 | 1.26 | 2.46 | 1.95 | 1.99 | 4.52 | 2.27 | 1.84 |
| 16 | 1.78 | 0.67 | 1.46 | 2.19 | 2.07 | 5.44 | 2.63 | 3.72 | |
| 24 | 2.67 | 1.20 | 3.04 | 2.53 | 2.53 | 7.74 | 3.06 | 2.55 | |
| 32 | 3.56 | 1.07 | 2.48 | 2.33 | 2.73 | 7.50 | 2.75 | 3.02 | |
| 40 | 4.44 | 1.48 | 3.03 | 2.05 | 3.24 | 8.30 | 2.56 | 2.74 | |
| 48 | 5.33 | 1.90 | 3.80 | 2.00 | 3.29 | 8.92 | 2.71 | 2.35 |
| p (mm) | s (mm) | s/p | Fn (kN) | F’n (kN) | F’n/Fn | Fc (kN) | F’c (kN) | F’c/Fc | Fc/Fn |
|---|---|---|---|---|---|---|---|---|---|
| 3 | 3 | 1 | 0.14 | 0.28 | 2.00 | 0.39 | 1.13 | 2.87 | 4.04 |
| 6 | 2 | 0.35 | 1.30 | 3.71 | 0.58 | 1.75 | 3.02 | 1.35 | |
| 9 | 3 | 0.31 | 1.06 | 3.38 | 0.80 | 2.26 | 2.82 | 2.13 | |
| 12 | 4 | 0.52 | 1.98 | 3.81 | 0.87 | 2.41 | 2.77 | 1.22 | |
| 15 | 5 | 0.60 | 1.77 | 2.98 | 1.02 | 2.75 | 2.70 | 1.55 | |
| 18 | 6 | 0.76 | 2.19 | 2.87 | 1.31 | 3.37 | 2.57 | 1.54 | |
| 21 | 7 | 0.95 | 2.67 | 2.82 | 1.38 | 3.41 | 2.48 | 1.28 | |
| 24 | 8 | 1.09 | 2.78 | 2.55 | 1.53 | 3.74 | 2.44 | 1.35 | |
| 27 | 9 | 1.22 | 2.62 | 2.14 | 1.70 | 3.87 | 2.27 | 1.47 | |
| 30 | 10 | 1.39 | 2.88 | 2.07 | 1.91 | 4.21 | 2.20 | 1.46 | |
| 6 | 4 | 0.67 | 0.78 | 1.47 | 1.87 | 0.74 | 1.87 | 2.53 | 1.27 |
| 8 | 1.33 | 0.38 | 0.78 | 2.08 | 0.79 | 2.52 | 3.20 | 3.22 | |
| 12 | 2 | 0.72 | 1.69 | 2.33 | 0.87 | 2.92 | 3.34 | 1.73 | |
| 16 | 2.67 | 0.91 | 1.90 | 2.09 | 1.58 | 4.05 | 2.56 | 2.13 | |
| 20 | 3.33 | 0.71 | 2.40 | 3.36 | 1.62 | 4.20 | 2.59 | 1.75 | |
| 24 | 4 | 0.94 | 2.97 | 3.15 | 1.84 | 4.76 | 2.59 | 1.61 | |
| 28 | 4.67 | 0.89 | 2.17 | 2.42 | 1.90 | 4.87 | 2.56 | 2.25 | |
| 32 | 5.33 | 1.01 | 2.59 | 2.56 | 2.08 | 5.47 | 2.64 | 2.11 | |
| 9 | 8 | 0.89 | 0.65 | 1.43 | 2.21 | 1.76 | 4.93 | 2.80 | 3.45 |
| 16 | 1.78 | 1.65 | 3.79 | 2.30 | 2.37 | 6.71 | 2.83 | 1.77 | |
| 24 | 2.67 | 1.52 | 3.49 | 2.30 | 2.31 | 6.89 | 2.98 | 1.98 | |
| 32 | 3.56 | 1.45 | 3.42 | 2.36 | 3.07 | 8.64 | 2.82 | 2.53 | |
| 40 | 4.44 | 1.90 | 4.20 | 2.20 | 3.44 | 9.44 | 2.74 | 2.25 | |
| 48 | 5.33 | 1.99 | 4.41 | 2.22 | 3.34 | 8.40 | 2.52 | 1.91 |
| p (mm) | s (mm) | s/p | Fn (kN) | F’n (kN) | F’n/Fn | Fc (kN) | F’c (kN) | F’c/Fc | Fc/Fn |
|---|---|---|---|---|---|---|---|---|---|
| 3 | 3 | 1 | 0.19 | 0.43 | 2.33 | 0.63 | 1.29 | 2.06 | 2.97 |
| 6 | 2 | 0.48 | 1.11 | 2.30 | 0.59 | 1.52 | 2.60 | 1.37 | |
| 9 | 3 | 0.43 | 1.06 | 2.45 | 0.69 | 1.86 | 2.68 | 1.75 | |
| 12 | 4 | 0.76 | 1.63 | 2.14 | 1.04 | 2.47 | 2.38 | 1.51 | |
| 15 | 5 | 0.73 | 1.65 | 2.27 | 1.13 | 2.59 | 2.30 | 1.57 | |
| 18 | 6 | 0.95 | 2.02 | 2.12 | 1.25 | 2.84 | 2.27 | 1.40 | |
| 21 | 7 | 0.95 | 1.91 | 2.02 | 1.08 | 2.48 | 2.29 | 1.30 | |
| 24 | 8 | 1.05 | 2.15 | 2.06 | 1.12 | 2.59 | 2.31 | 1.21 | |
| 27 | 9 | 1.08 | 2.74 | 2.53 | 1.44 | 3.40 | 2.36 | 1.24 | |
| 30 | 10 | 1.84 | 3.12 | 1.70 | 1.95 | 3.54 | 1.82 | 1.14 | |
| 6 | 4 | 0.67 | 1.02 | 2.10 | 2.07 | 1.23 | 2.73 | 2.22 | 1.30 |
| 8 | 1.33 | 0.60 | 1.30 | 2.16 | 1.37 | 3.49 | 2.55 | 2.70 | |
| 12 | 2 | 1.37 | 2.91 | 2.12 | 1.81 | 4.68 | 2.59 | 1.61 | |
| 16 | 2.67 | 1.35 | 2.82 | 2.09 | 1.89 | 4.66 | 2.47 | 1.65 | |
| 20 | 3.33 | 1.27 | 3.06 | 2.41 | 2.07 | 5.54 | 2.68 | 1.81 | |
| 24 | 4 | 1.98 | 4.38 | 2.22 | 2.58 | 6.96 | 2.70 | 1.59 | |
| 28 | 4.67 | 2.40 | 4.39 | 1.83 | 3.05 | 6.80 | 2.23 | 1.55 | |
| 32 | 5.33 | 2.58 | 4.79 | 1.86 | 3.16 | 6.98 | 2.21 | 1.46 | |
| 9 | 8 | 0.89 | 1.98 | 3.86 | 1.95 | 2.63 | 6.07 | 2.31 | 1.57 |
| 16 | 1.78 | 0.96 | 2.52 | 2.61 | 2.23 | 6.62 | 2.97 | 2.63 | |
| 24 | 2.67 | 2.02 | 4.12 | 2.04 | 2.96 | 8.47 | 2.86 | 2.06 | |
| 32 | 3.56 | 2.05 | 4.39 | 2.15 | 3.74 | 8.95 | 2.40 | 2.04 | |
| 40 | 4.44 | 2.93 | 5.31 | 1.81 | 4.30 | 10.19 | 2.37 | 1.92 | |
| 48 | 5.33 | 3.41 | 5.85 | 1.72 | 5.14 | 11.39 | 2.22 | 1.95 |
| p (mm) | s (mm) | s/p | Fn (kN) | F’n (kN) | F’n/Fn | Fc (kN) | F’c (kN) | F’c/Fc | Fc/Fn |
|---|---|---|---|---|---|---|---|---|---|
| 3 | 3 | 1 | 0.61 | 1.53 | 2.49 | 0.58 | 1.89 | 3.28 | 0.58 |
| 6 | 2 | 1.12 | 2.35 | 2.10 | 1.26 | 3.30 | 2.62 | 1.26 | |
| 9 | 3 | 1.18 | 2.93 | 2.49 | 1.67 | 4.27 | 2.56 | 1.67 | |
| 12 | 4 | 1.72 | 3.59 | 2.08 | 2.11 | 4.95 | 2.34 | 2.11 | |
| 15 | 5 | 1.99 | 4.23 | 2.13 | 2.61 | 6.43 | 2.46 | 2.61 | |
| 18 | 6 | 1.92 | 4.62 | 2.40 | 2.86 | 7.12 | 2.49 | 2.86 | |
| 21 | 7 | 2.51 | 4.69 | 1.87 | 3.00 | 5.99 | 2.00 | 3.00 | |
| 24 | 8 | 2.77 | 5.54 | 2.00 | 3.28 | 6.81 | 2.07 | 3.28 | |
| 27 | 9 | 2.57 | 4.65 | 1.81 | 3.12 | 5.89 | 1.89 | 3.12 | |
| 30 | 10 | 2.44 | 5.23 | 2.15 | 2.94 | 6.22 | 2.12 | 2.94 | |
| 6 | 4 | 0.67 | 1.36 | 2.80 | 2.05 | 1.48 | 3.60 | 2.43 | 1.48 |
| 8 | 1.33 | 1.44 | 2.78 | 1.93 | 2.03 | 5.33 | 2.63 | 2.03 | |
| 12 | 2 | 1.35 | 4.27 | 3.17 | 2.43 | 6.90 | 2.84 | 2.43 | |
| 16 | 2.67 | 2.36 | 5.49 | 2.32 | 2.61 | 7.82 | 3.00 | 2.61 | |
| 20 | 3.33 | 1.94 | 4.75 | 2.44 | 2.57 | 7.56 | 2.94 | 2.57 | |
| 24 | 4 | 2.32 | 5.37 | 2.32 | 3.18 | 8.96 | 2.81 | 3.18 | |
| 28 | 4.67 | 2.26 | 5.06 | 2.25 | 3.52 | 8.99 | 2.56 | 3.52 | |
| 32 | 5.33 | 2.78 | 5.78 | 2.08 | 3.90 | 10.15 | 2.60 | 3.90 | |
| 9 | 8 | 0.89 | 1.02 | 2.40 | 2.36 | 3.34 | 7.76 | 2.32 | 3.34 |
| 16 | 1.78 | 2.13 | 4.84 | 2.27 | 3.43 | 10.56 | 3.08 | 3.43 | |
| 24 | 2.67 | 2.35 | 5.56 | 2.37 | 4.62 | 12.80 | 2.77 | 4.62 | |
| 32 | 3.56 | 3.02 | 6.86 | 2.28 | 4.84 | 14.16 | 2.93 | 4.84 | |
| 40 | 4.44 | 3.63 | 8.02 | 2.21 | 7.08 | 17.65 | 2.50 | 7.08 | |
| 48 | 5.33 | 4.20 | 7.95 | 1.89 | 7.28 | 14.32 | 1.97 | 7.28 |
| p (mm) | s (mm) | s/p | l (mm) | Vcal (mm3) | UCS (MPa) | |||||||
|---|---|---|---|---|---|---|---|---|---|---|---|---|
| 20 | 30 | 40 | 50 | |||||||||
| Vc (mm3) | Vc/Vcal | Vc (mm3) | Vc/Vcal | Vc (mm3) | Vc/Vcal | Vc (mm3) | Vc/Vcal | |||||
| 3 | 3 | 1 | 180 | 1620 | 1414 | 0.87 | 1376 | 0.85 | 1376 | 0.85 | 1268 | 0.78 |
| 6 | 2 | 180 | 3240 | 3070 | 0.95 | 2901 | 0.90 | 2901 | 0.90 | 3126 | 0.96 | |
| 9 | 3 | 180 | 4860 | 4242 | 0.87 | 3783 | 0.78 | 3783 | 0.78 | 3880 | 0.80 | |
| 12 | 4 | 180 | 6480 | 5121 | 0.79 | 4851 | 0.75 | 4851 | 0.75 | 4480 | 0.69 | |
| 15 | 5 | 180 | 8100 | 5195 | 0.64 | 4139 | 0.51 | 4139 | 0.51 | 6328 | 0.78 | |
| 18 | 6 | 180 | 9720 | 4646 | 0.48 | 4651 | 0.48 | 4651 | 0.48 | 5883 | 0.61 | |
| 21 | 7 | 180 | 11,340 | 3982 | 0.35 | 4563 | 0.40 | 4563 | 0.40 | 3720 | 0.33 | |
| 24 | 8 | 180 | 12,960 | 4091 | 0.32 | 4218 | 0.33 | 4218 | 0.33 | 3868 | 0.30 | |
| 27 | 9 | 180 | 14,580 | 4314 | 0.30 | 4245 | 0.29 | 4245 | 0.29 | 3716 | 0.25 | |
| 30 | 10 | 180 | 16,200 | 4411 | 0.27 | 4504 | 0.28 | 4504 | 0.28 | 3459 | 0.21 | |
| 6 | 4 | 0.67 | 180 | 4320 | 2873 | 0.67 | 2985 | 0.69 | 2985 | 0.69 | 3093 | 0.72 |
| 8 | 1.33 | 180 | 8640 | 6159 | 0.71 | 5288 | 0.61 | 5288 | 0.61 | 6915 | 0.80 | |
| 12 | 2 | 180 | 12,960 | 9241 | 0.71 | 7766 | 0.60 | 7766 | 0.60 | 9616 | 0.74 | |
| 16 | 2.67 | 180 | 17,280 | 10,885 | 0.63 | 11,237 | 0.65 | 11,237 | 0.65 | 9306 | 0.54 | |
| 20 | 3.33 | 180 | 21,600 | 11,860 | 0.55 | 12,761 | 0.59 | 12,761 | 0.59 | 11,111 | 0.51 | |
| 24 | 4 | 180 | 25,920 | 12,560 | 0.48 | 13,284 | 0.51 | 13,284 | 0.51 | 9680 | 0.37 | |
| 28 | 4.67 | 180 | 30,240 | 15,791 | 0.52 | 12,077 | 0.40 | 12,077 | 0.40 | 13,506 | 0.45 | |
| 32 | 5.33 | 180 | 34,560 | 10,366 | 0.30 | 8068 | 0.23 | 8068 | 0.23 | 9386 | 0.27 | |
| 9 | 8 | 0.89 | 180 | 12,960 | 11,218 | 0.87 | 9507 | 0.73 | 9507 | 0.73 | 8471 | 0.65 |
| 16 | 1.78 | 180 | 25,920 | 18,043 | 0.70 | 18,158 | 0.70 | 18,158 | 0.70 | 15,280 | 0.59 | |
| 24 | 2.67 | 180 | 38,880 | 26,906 | 0.69 | 23,066 | 0.59 | 23,066 | 0.59 | 17,956 | 0.46 | |
| 32 | 3.56 | 180 | 51,840 | 28,484 | 0.55 | 27,705 | 0.53 | 27,705 | 0.53 | 22,543 | 0.43 | |
| 40 | 4.44 | 180 | 64,800 | 29,367 | 0.45 | 26,586 | 0.41 | 26,586 | 0.41 | 28,715 | 0.44 | |
| 48 | 5.33 | 180 | 77,760 | 24,234 | 0.31 | 20,182 | 0.26 | 20,182 | 0.26 | 19,219 | 0.25 | |
| p (mm) | s (mm) | s/p | UCS (MPa) | |||
|---|---|---|---|---|---|---|
| 20 | 30 | 40 | 50 | |||
| SE (MJ/m3) | ||||||
| 3 | 3 | 1 | 46.4 | 51.2 | 61.9 | 81.6 |
| 6 | 2 | 22.2 | 36.0 | 38.8 | 72.5 | |
| 9 | 3 | 17.0 | 38.1 | 25.0 | 77.5 | |
| 12 | 4 | 19.3 | 32.3 | 38.2 | 84.8 | |
| 15 | 5 | 29.4 | 44.2 | 37.4 | 74.2 | |
| 18 | 6 | 31.8 | 50.7 | 49.2 | 87.4 | |
| 21 | 7 | 44.5 | 54.4 | 65.4 | 145.3 | |
| 24 | 8 | 44.6 | 65.4 | 54.9 | 152.7 | |
| 27 | 9 | 48.0 | 72.3 | 69.8 | 151.0 | |
| 30 | 10 | 44.6 | 76.4 | 86.7 | 152.8 | |
| 6 | 4 | 0.67 | 52.2 | 44.4 | 74.2 | 86.3 |
| 8 | 1.33 | 28.9 | 26.8 | 35.3 | 52.9 | |
| 12 | 2 | 23.8 | 20.2 | 32.4 | 45.5 | |
| 16 | 2.67 | 22.6 | 25.3 | 30.9 | 50.4 | |
| 20 | 3.33 | 25.1 | 22.8 | 32.8 | 41.7 | |
| 24 | 4 | 26.0 | 25.0 | 28.0 | 59.2 | |
| 28 | 4.67 | 20.9 | 28.4 | 45.6 | 46.9 | |
| 32 | 5.33 | 39.4 | 46.3 | 69.9 | 74.8 | |
| 9 | 8 | 0.89 | 31.9 | 33.4 | 46.5 | 71.1 |
| 16 | 1.78 | 20.6 | 23.5 | 29.7 | 40.4 | |
| 24 | 2.67 | 16.9 | 18.0 | 23.2 | 46.3 | |
| 32 | 3.56 | 17.2 | 19.9 | 25.5 | 38.6 | |
| 40 | 4.44 | 19.9 | 23.3 | 31.1 | 44.4 | |
| 48 | 5.33 | 24.4 | 29.8 | 39.2 | 68.2 | |
| p (mm) | UCS (MPa) | Opt. s/p | Min. SE (MJ/m3) |
|---|---|---|---|
| 3 | 20 | 3.55 | 16.1 |
| 30 | 3.48 | 35.2 | |
| 40 | 3.67 | 30.7 | |
| 50 | 2.94 | 68.7 | |
| 6 | 20 | 3.26 | 20.1 |
| 30 | 2.85 | 19.8 | |
| 40 | 2.99 | 25.2 | |
| 50 | 3.11 | 43.0 | |
| 9 | 20 | 3.38 | 16.2 |
| 30 | 3.21 | 18.5 | |
| 40 | 3.23 | 23.4 | |
| 50 | 3.14 | 37.3 |
Disclaimer/Publisher’s Note: The statements, opinions and data contained in all publications are solely those of the individual author(s) and contributor(s) and not of MDPI and/or the editor(s). MDPI and/or the editor(s) disclaim responsibility for any injury to people or property resulting from any ideas, methods, instructions or products referred to in the content. |
© 2023 by the authors. Licensee MDPI, Basel, Switzerland. This article is an open access article distributed under the terms and conditions of the Creative Commons Attribution (CC BY) license (https://creativecommons.org/licenses/by/4.0/).
Share and Cite
Kim, H.-e.; Ha, S.-g.; Rehman, H.; Yoo, H.-k. Analysis of Mechanical Excavation Characteristics by Pre-Cutting Machine Based on Linear Cutting Tests. Appl. Sci. 2023, 13, 1205. https://doi.org/10.3390/app13021205
Kim H-e, Ha S-g, Rehman H, Yoo H-k. Analysis of Mechanical Excavation Characteristics by Pre-Cutting Machine Based on Linear Cutting Tests. Applied Sciences. 2023; 13(2):1205. https://doi.org/10.3390/app13021205
Chicago/Turabian StyleKim, Han-eol, Sang-gui Ha, Hafeezur Rehman, and Han-kyu Yoo. 2023. "Analysis of Mechanical Excavation Characteristics by Pre-Cutting Machine Based on Linear Cutting Tests" Applied Sciences 13, no. 2: 1205. https://doi.org/10.3390/app13021205