Article

X-ray-Induced Heating in the Vicinity of the X-ray Interaction Point

1
Pohang Accelerator Laboratory, Pohang University of Science and Technology, Pohang 37673, Republic of Korea
2
Department of Life Science, Pohang University of Science and Technology, Pohang 37673, Republic of Korea
3
POSTECH Biotech Center, Pohang University of Science and Technology, Pohang 37673, Republic of Korea
*
Authors to whom correspondence should be addressed.
Appl. Sci. 2023, 13(2), 717; https://doi.org/10.3390/app13020717
Submission received: 12 December 2022 / Revised: 29 December 2022 / Accepted: 1 January 2023 / Published: 4 January 2023
(This article belongs to the Special Issue Synchrotron Radiation for Medical Applications)

Abstract

:
When X-rays pass through a material, radiation damage occurs, and heat is generated at the X-ray interaction point, which can then be transferred around the X-ray irradiation site. This X-ray-induced heat transfer can affect the temperature of the sample and consequently the experimental environment in serial crystallography (SX) experiments. Here, we investigated radiation damage and measured the level of heating in the vicinity of the X-ray interaction point. In our experimental setup, when water, crystallization solution, and crystal suspension in a glass tube were exposed to X-rays, a temperature increase of approximately 1.0 °C occurred in the vicinity of the X-ray interaction point, with the heat generated by both the sample and the capillary. When Cu and Al/Zn plates were exposed to X-rays, the temperature around the X-ray exposure point increased by approximately 0.3 and 0.4 °C, respectively. The range of temperature rise decreased as the distance from the X-ray exposure point on the Al plate increased. The heat generated by the X-rays and the rise of the heat could be reduced by discontinuously transmitting the X-rays using the shutter. Our results provide useful information for obtaining more accurate experimental parameters.

1. Introduction

Intense X-ray sources can cause radiation damage to samples, creating undesirable artifacts [1,2,3,4]. In macromolecular crystallography, radiation can cause specific chemical and structural damage and errors in the interpretation of the resulting structure [2]. In addition, the energy absorbed by the X-rays increases the temperature of the sample [5]. In particular, dose-rate-dependent damage can have the effect of heating a crystal sample [6]. The X-ray-induced temperature increase of a sample can have a significant effect on the structural data collection at room temperature [7].
Serial crystallography (SX) using X-ray free electron lasers (XFEL) or synchrotron X-rays enables the determination of the room-temperature structure of macromolecules [8,9,10]. In serial femtosecond crystallography (SFX) using XFEL, crystal samples are exposed to X-ray pulses for several tens of femtoseconds [9,11,12]. In serial synchrotron crystallography (SSX) using synchrotron X-rays, crystals are exposed to X-rays for several picoseconds to hundreds of milliseconds [13,14,15]. SX techniques have reduced X-ray radiation damage compared to conventional macromolecular crystallography (MX) because the exposure time to the crystal is shorter [15,16]. In addition, SX techniques with pump-probe experiments using optical lasers or mix-and-inject experiments can visualize time-resolved molecular reactions, providing a more detailed structure-based molecular mechanism [17,18]. Therefore, SX provides structural information with higher biological accuracy than conventional MX [19].
In SX experiments, a large number of crystals are continuously delivered to the X-ray point using a sample delivery method, such as a liquid injector [20,21,22], injector/syringe with a viscous medium [23,24,25,26,27], fixed-target scanning method [28,29,30,31,32], and hybrid methods [33,34,35,36,37]. For liquid jet injection methods, such as a gas dynamic virtual nozzle (GDVN) or liquid jet injectors, the crystal suspension is delivered at a high flow rate (0.1–10 μL/min) to generate a stable injection stream [38]. For injector/syringes with a viscous medium, crystals embedded in the viscous medium provide a stable injection stream at a low flow rate, which is useful for applications in synchrotron or XFEL facilities with low repetition rates [23,24,25,26,27]. When SX sample delivery method uses an injector or syringe, one location in the injection stream is continuously exposed to X-rays.
In a fixed-target scanning method, diffraction data are collected when the sample holder containing the crystal sample is raster-scanned [28,29,30,31,32]. Sample holders made of silicon [39], silicon nitride [28,40], Mylar [41], nylon mesh [31], and polyimide [31,42] or polymers [43,44] have been used previously. In a fixed-target SFX experiment, the sample holder is exposed to X-rays according to the XFEL repetition rate [31,41,43]. In a fixed-target SSX, the sample holder is continuously exposed to X-rays if the shutter is not used [45].
During an SX experiment, crystal samples are exposed only once as they continuously pass through the X-ray interaction point; however, because one point is continuously exposed to the X-rays, it is expected that energy absorption by the sample or its container would affect the temperature around the sample when the speed of the sample delivery is low. Several investigations have been conducted on radiation damage and the effect of heating at sample locations exposed to X-rays [5,7], but little is known about the heating effect in the vicinity of the X-ray interaction point.
Here, we investigated the temperature change near the X-ray interaction point. An increase in temperature was observed in the solutions in the capillary or on metal plates when in the vicinity of the X-ray-exposed area. Additionally, the effect of distance to the X-ray exposure point on heat transfer and the reduction in the rise of the temperature using the shutter were investigated. Our results provide useful insights into the heat-related optimization of the sample environment that is crucial for efficient data collection using serial crystallography and other X-ray sciences.

2. Materials and Methods

2.1. Sample Preparation

Capillary tubes (inner diameter: 1.1–1.2 mm, outer diameter: 1.5–1.6 mm) were purchased from Marienfeld (Germany). A quartz capillary (HR6-146, wall thickness: 10 μm) was purchased from Hampton Research (Aliso Viejo, CA, USA). Cu, Al, and Zn plates (thickness: 300 μm) were purchased from KM Science (Republic of Korea). White chicken egg lysozyme (L0036) was purchased from Sigma-Aldrich (St. Louis, MO, USA). The lysozyme was crystallized using the batch crystallization method as previously reported [12]. Briefly, the lysozyme solution (50 mg/mL) was mixed with a crystallization solution containing 0.1 M sodium acetate, pH 4.0–4.4, 3.5 M NaCl, and 5% (w/v) polyethylene glycol 8000 in a 1.5 mL microtube. The mixture was immediately vortexed for 30 sec and incubated at 20 °C for over 30 min. The dimensions of the lysozyme crystals were approximately 5 × 5 × 5 μm3 (at pH 4.0) or 20 × 20 × 20 μm3 (at pH 4.4).

2.2. X-ray Data Collection

X-ray experiments were performed at the 7A beamline of the Pohang Light Source II (PLS-II, Republic of Korea). The X-ray energy and photon flux were 12,660 eV and 3 × 10¹¹ phs/s, respectively. The vertical and horizontal beam sizes of the X-rays were 100 and 300 μm (full width at half maximum, FWHM), respectively. The temperature was measured using the Pt 100 Ohm RTD (Resistance Temperature Detector: 2 mm × 2 mm × 0.8 mm) temperature sensors acquired from OMEGA Engineering (Norwalk, CT, USA). The X-ray transmission was calculated using the CRXO site (https://cxro.lbl.gov/, accessed on 12 December 2022).

2.2.1. Radiation Damage on Capillary Tubes

The crystallization solution [0.1 M sodium acetate, pH 4.4, 3.5 M NaCl, and 5% (w/v) polyethylene glycol 8000] or lysozyme crystal suspension (20 μL, crystal size: 20 × 20 × 20 μm3) was loaded into a capillary tube using a pipette. A capillary tube containing crystallization solution or lysozyme crystals was mounted using a magnetic base on the goniometer. The center of the capillary tube was aligned to the X-ray beam path. The X-rays were exposed to center of the capillary tube for 5 min.

2.2.2. Temperature Measurement with Capillary Tubes

A quartz capillary containing the water, crystallization solution [0.1 M sodium acetate, pH 4.0, 3.5 M NaCl, and 5% (w/v) polyethylene glycol 8000], crystal suspension (crystal size: 5 × 5 × 5 μm3), or an empty quartz capillary was mounted using a magnetic base on the goniometer. The RTD was soaked in the solution in the quartz capillary, and the X-rays were aligned 250 μm from the tip of the RTD installed in the oblique direction of the X-ray. A continuous X-ray exposure of 3 min was provided, and the temperature was measured. The temperature inside the experimental hutch was 24.5 ± 0.1 °C.

2.2.3. Temperature Measurement on Metal Plates

The RTD was closely attached to the Cu, Al, or Zn plate using tape and clips. The metal plate attached to RTD was mounted using magnets on the goniometer. The center of the X-rays were aligned 250 μm from the tip of the RTD installed in the horizontal direction of the X-ray. A continuous X-ray exposure of 3 min was provided, and the temperature was measured. The temperature inside the experimental hutch was 24.7 ± 0.1 °C.

2.2.4. Temperature Measurement on Metal Plates at Different Distances

The center of the X-rays was aligned at distances of 500, 750, 1000, 1250, 1500, and 1750 μm from the RTD installed in the horizontal direction of the X-ray when attached to the Al plate. The X-ray exposure point was moved through the sample viewer program using a goniometer. A continuous X-ray exposure of 3 min was provided, and the temperature was measured.

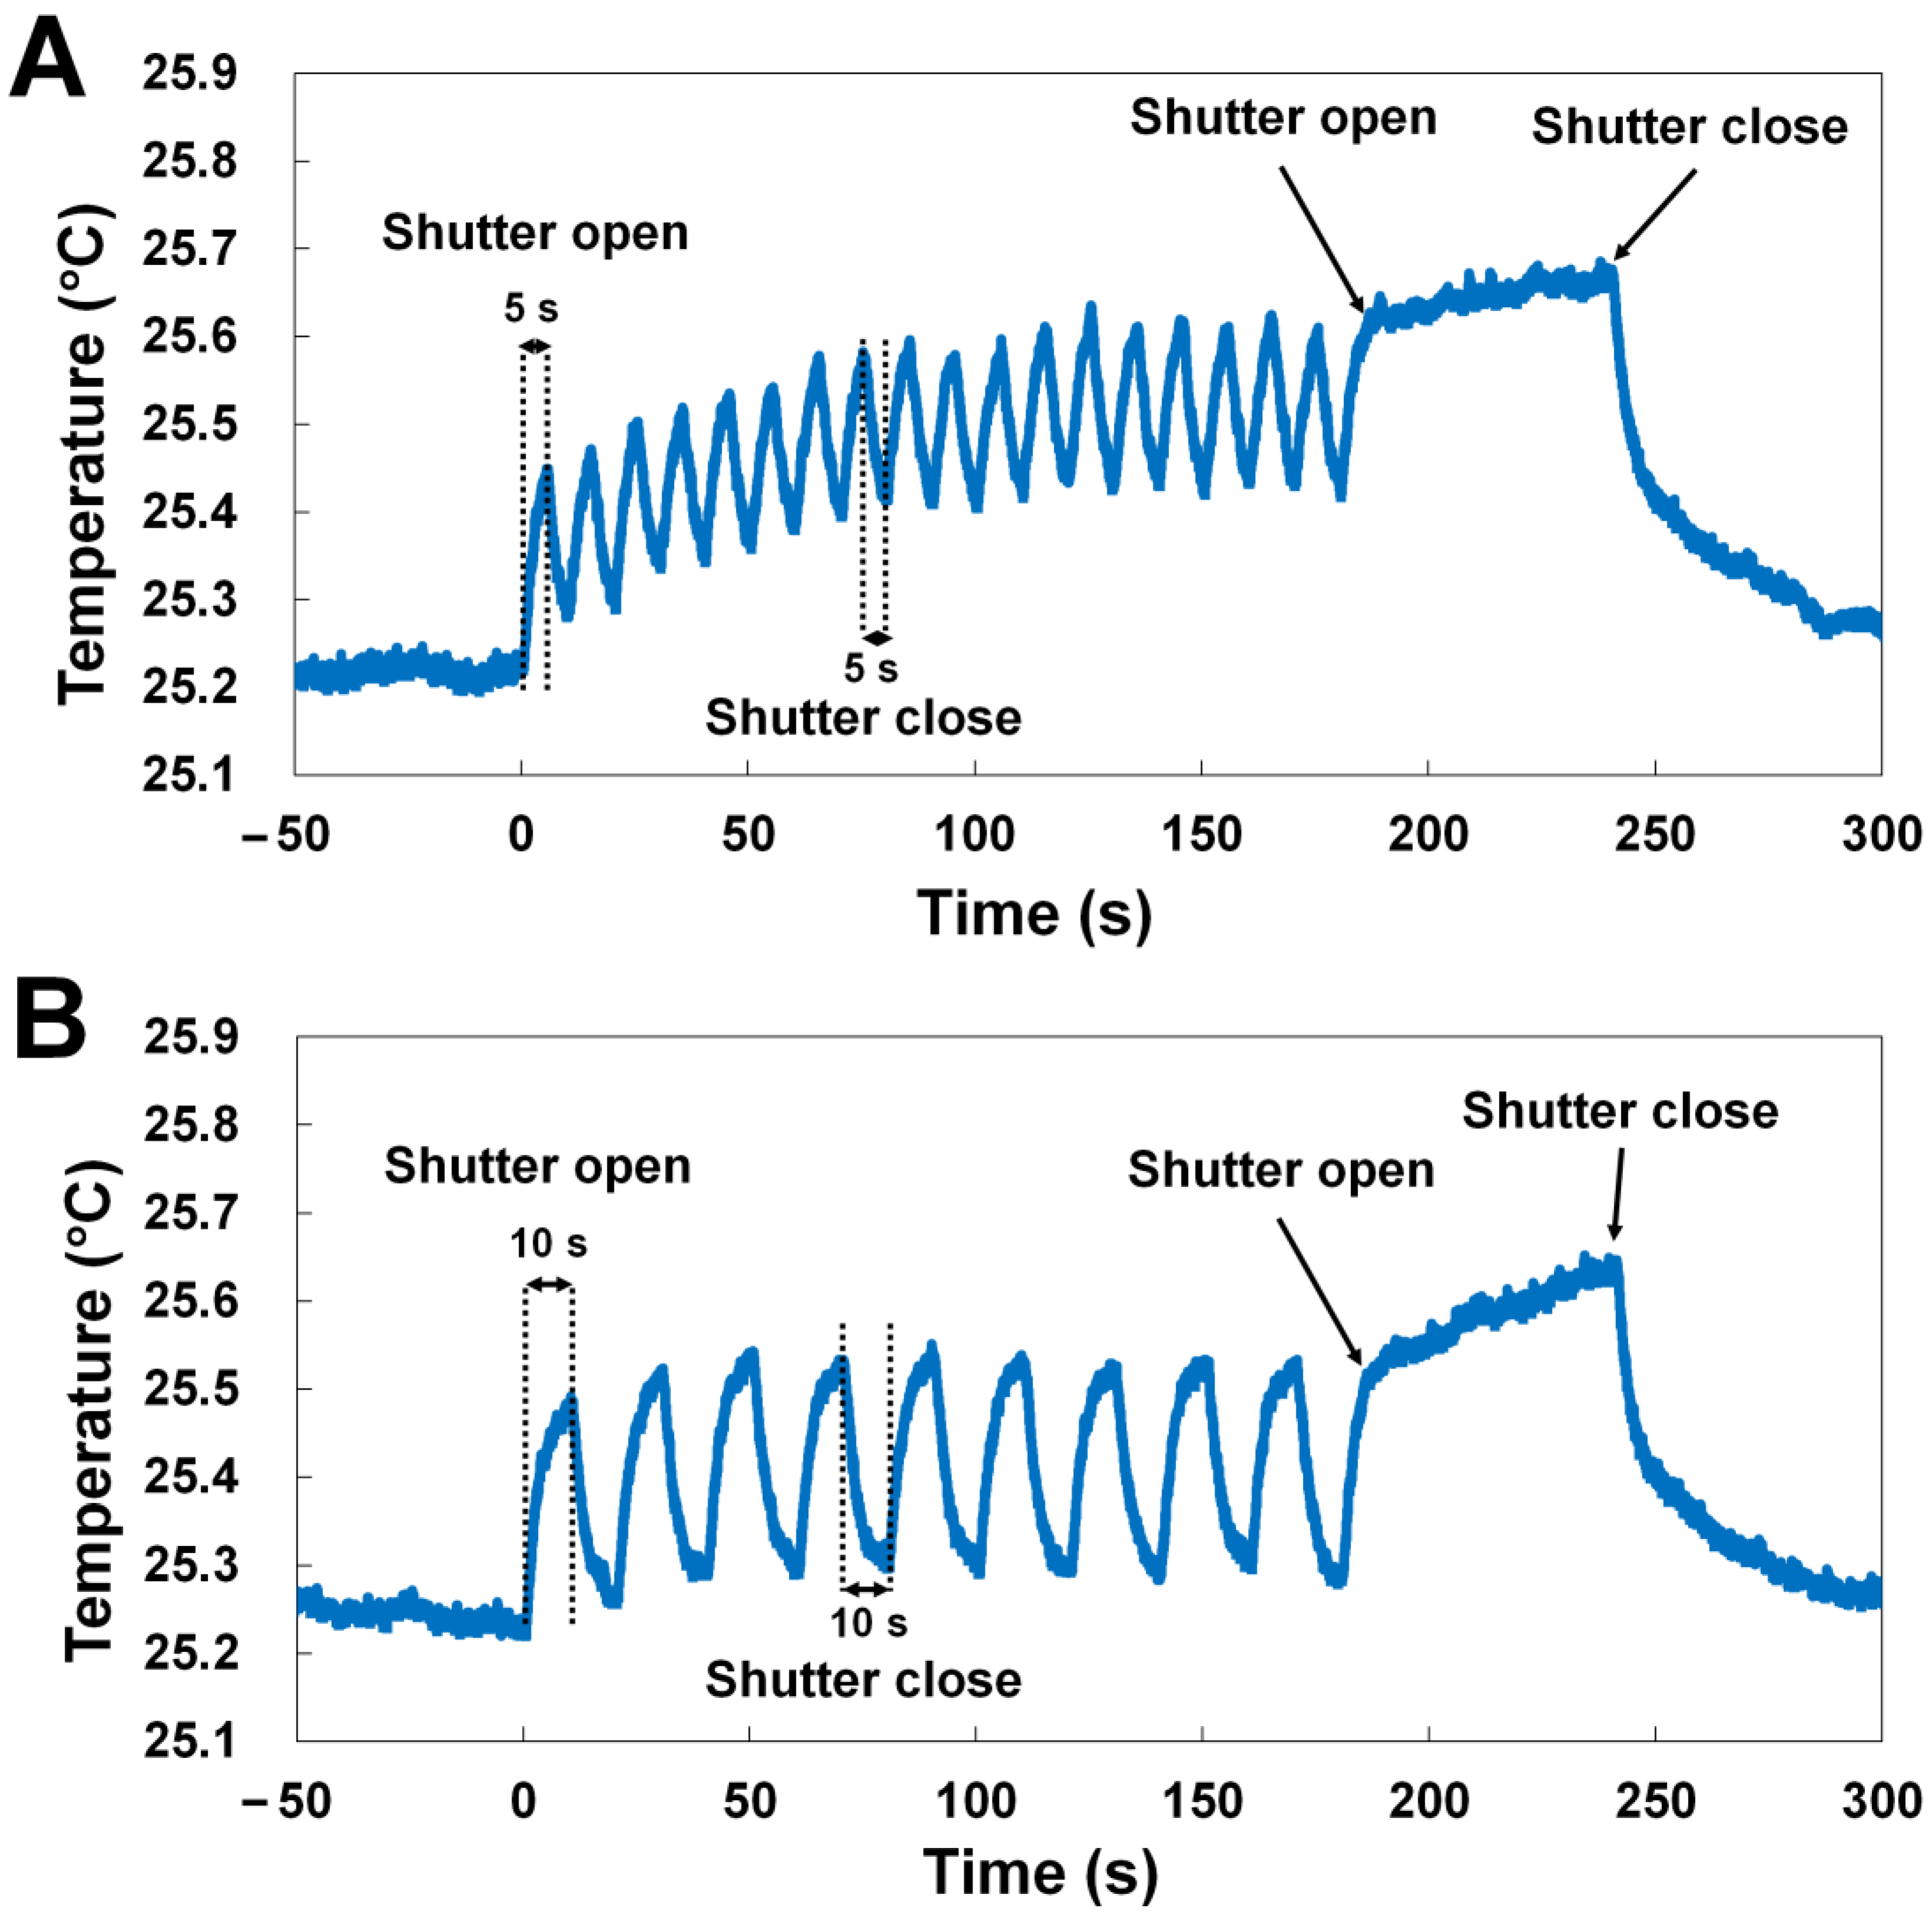
2.2.5. Temperature Measurement on Metal Plates Depends on X-ray Shutter Use

The center of the X-rays was aligned 250 μm from the RTD installed in the horizontal direction of the X-ray when attached to the Al plate. A continuous X-ray exposure of 3 min was provided, with the shutter opening and closing at intervals of 5 and 10 s, respectively.

3. Results

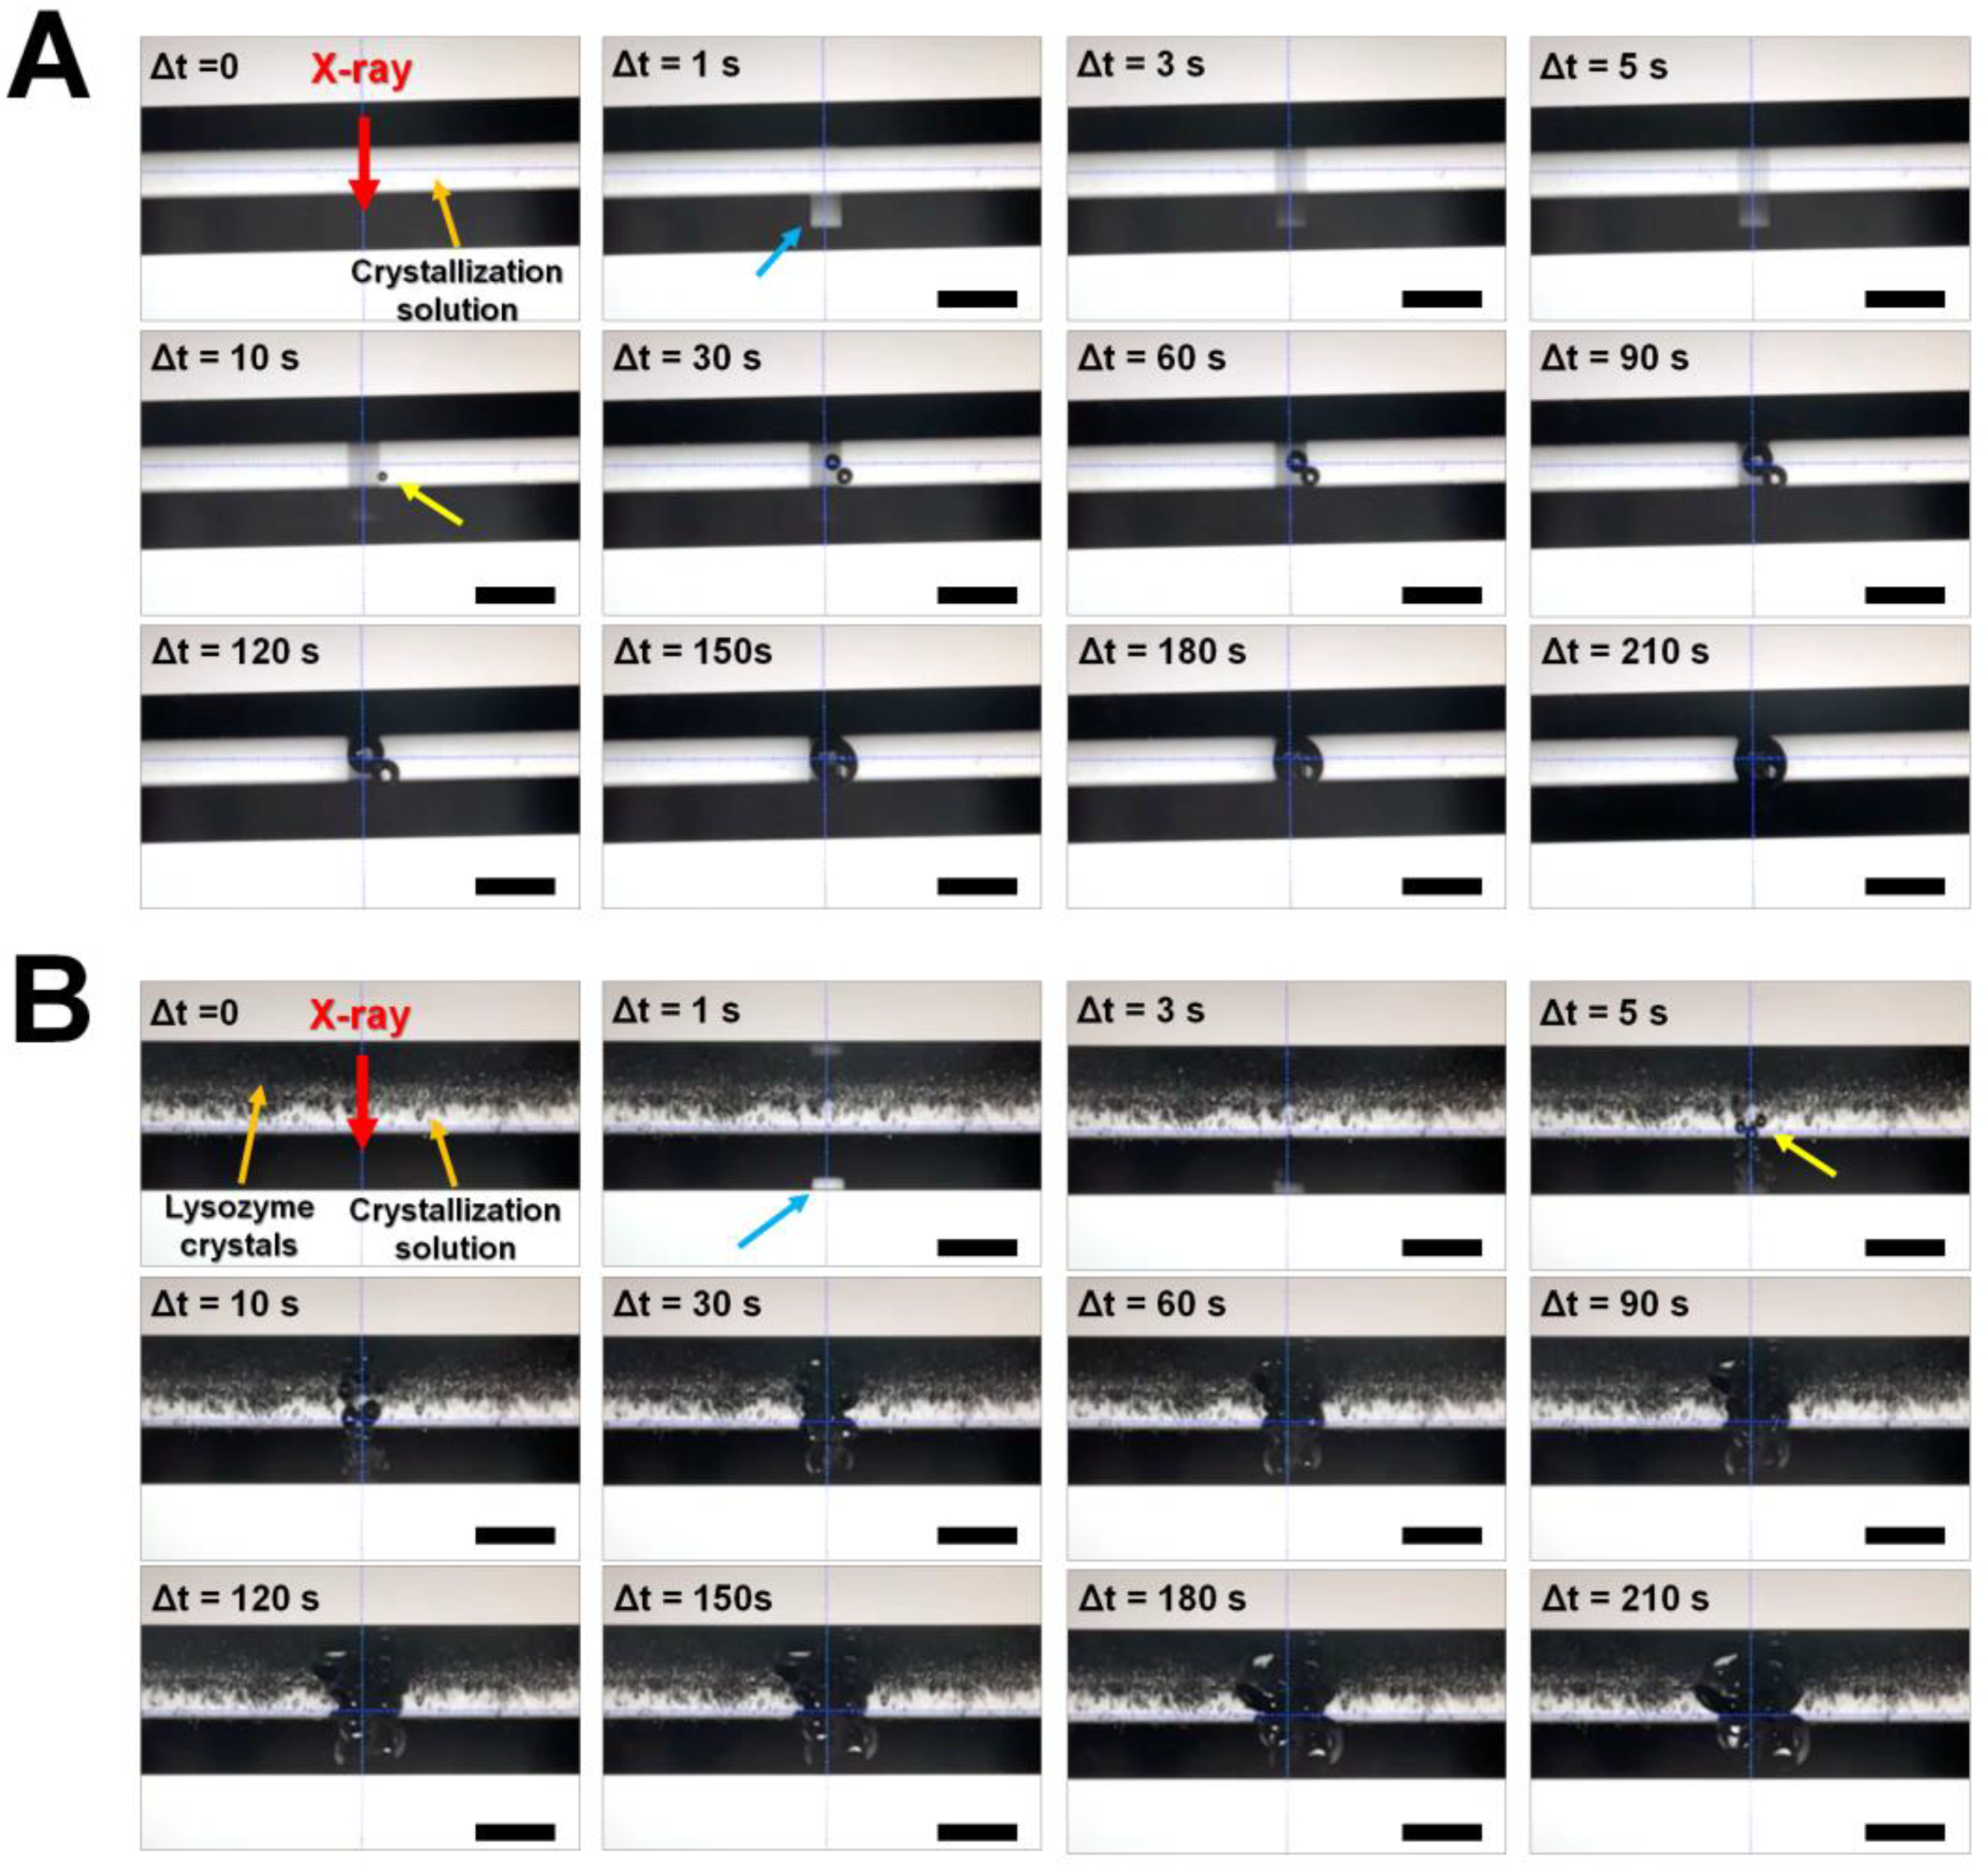
3.1. Observation of Radiation Damage on Crystal Suspension

Radiation damage caused by the X-rays may vary depending on the number of photons or the photon density provided by the beamline in an X-ray facility. In order to confirm that the PLS-II 7A beamline used in this experiment provided enough photons to study radiation damage and heating, X-ray radiation damage to the material was first investigated. The capillary tube containing the crystallization solution was exposed to X-rays at room temperature (Figure 1A). When the shutter was opened, the brightness changes on the capillary along the X-ray beam path were observed clearly (Figure 1A). Approximately 10 s after X-ray exposure, gas bubbles with a size of 20 μm were observed in the crystallization solution due to radiation damage. As the X-rays continued to beam, gas bubbles were generated at different locations along the X-ray path after approximately 20–30 s (Figure 1A). The size of the gas bubbles started to increase gradually, with those gas bubbles in the initial X-ray path expanding to a size wider than the X-ray path itself after 120 s (Figure 1A).
The lysozyme crystal suspension in the capillary tube was then exposed to X-rays at room temperature. When the shutter was opened, the brightness changed along the X-ray transmission path, as in the previous experiment (Figure 1B). After 5 s had elapsed after X-ray exposure, three gas bubbles, regarded as radiation damage, were clearly observed. Gas bubbles appeared faster in the capillary tube than the crystallization solution. As the X-rays continued to beam, the gas bubbles gradually grew larger, and after 10 s they occupied a wider space than the beam path.
Overall, faster and more intense radiation damage occurred in the crystal suspension than in the crystallization solution. However, repeated experiments confirmed that the formation time and size of gas bubbles in the same sample were not always the same. Therefore, based on this phenomenon of radiation damage, we confirm that future studies on radiation damage and the measurement of X-ray-induced heating can be performed using the synchrotron X-ray source at the 7A beamline at PLS-II.

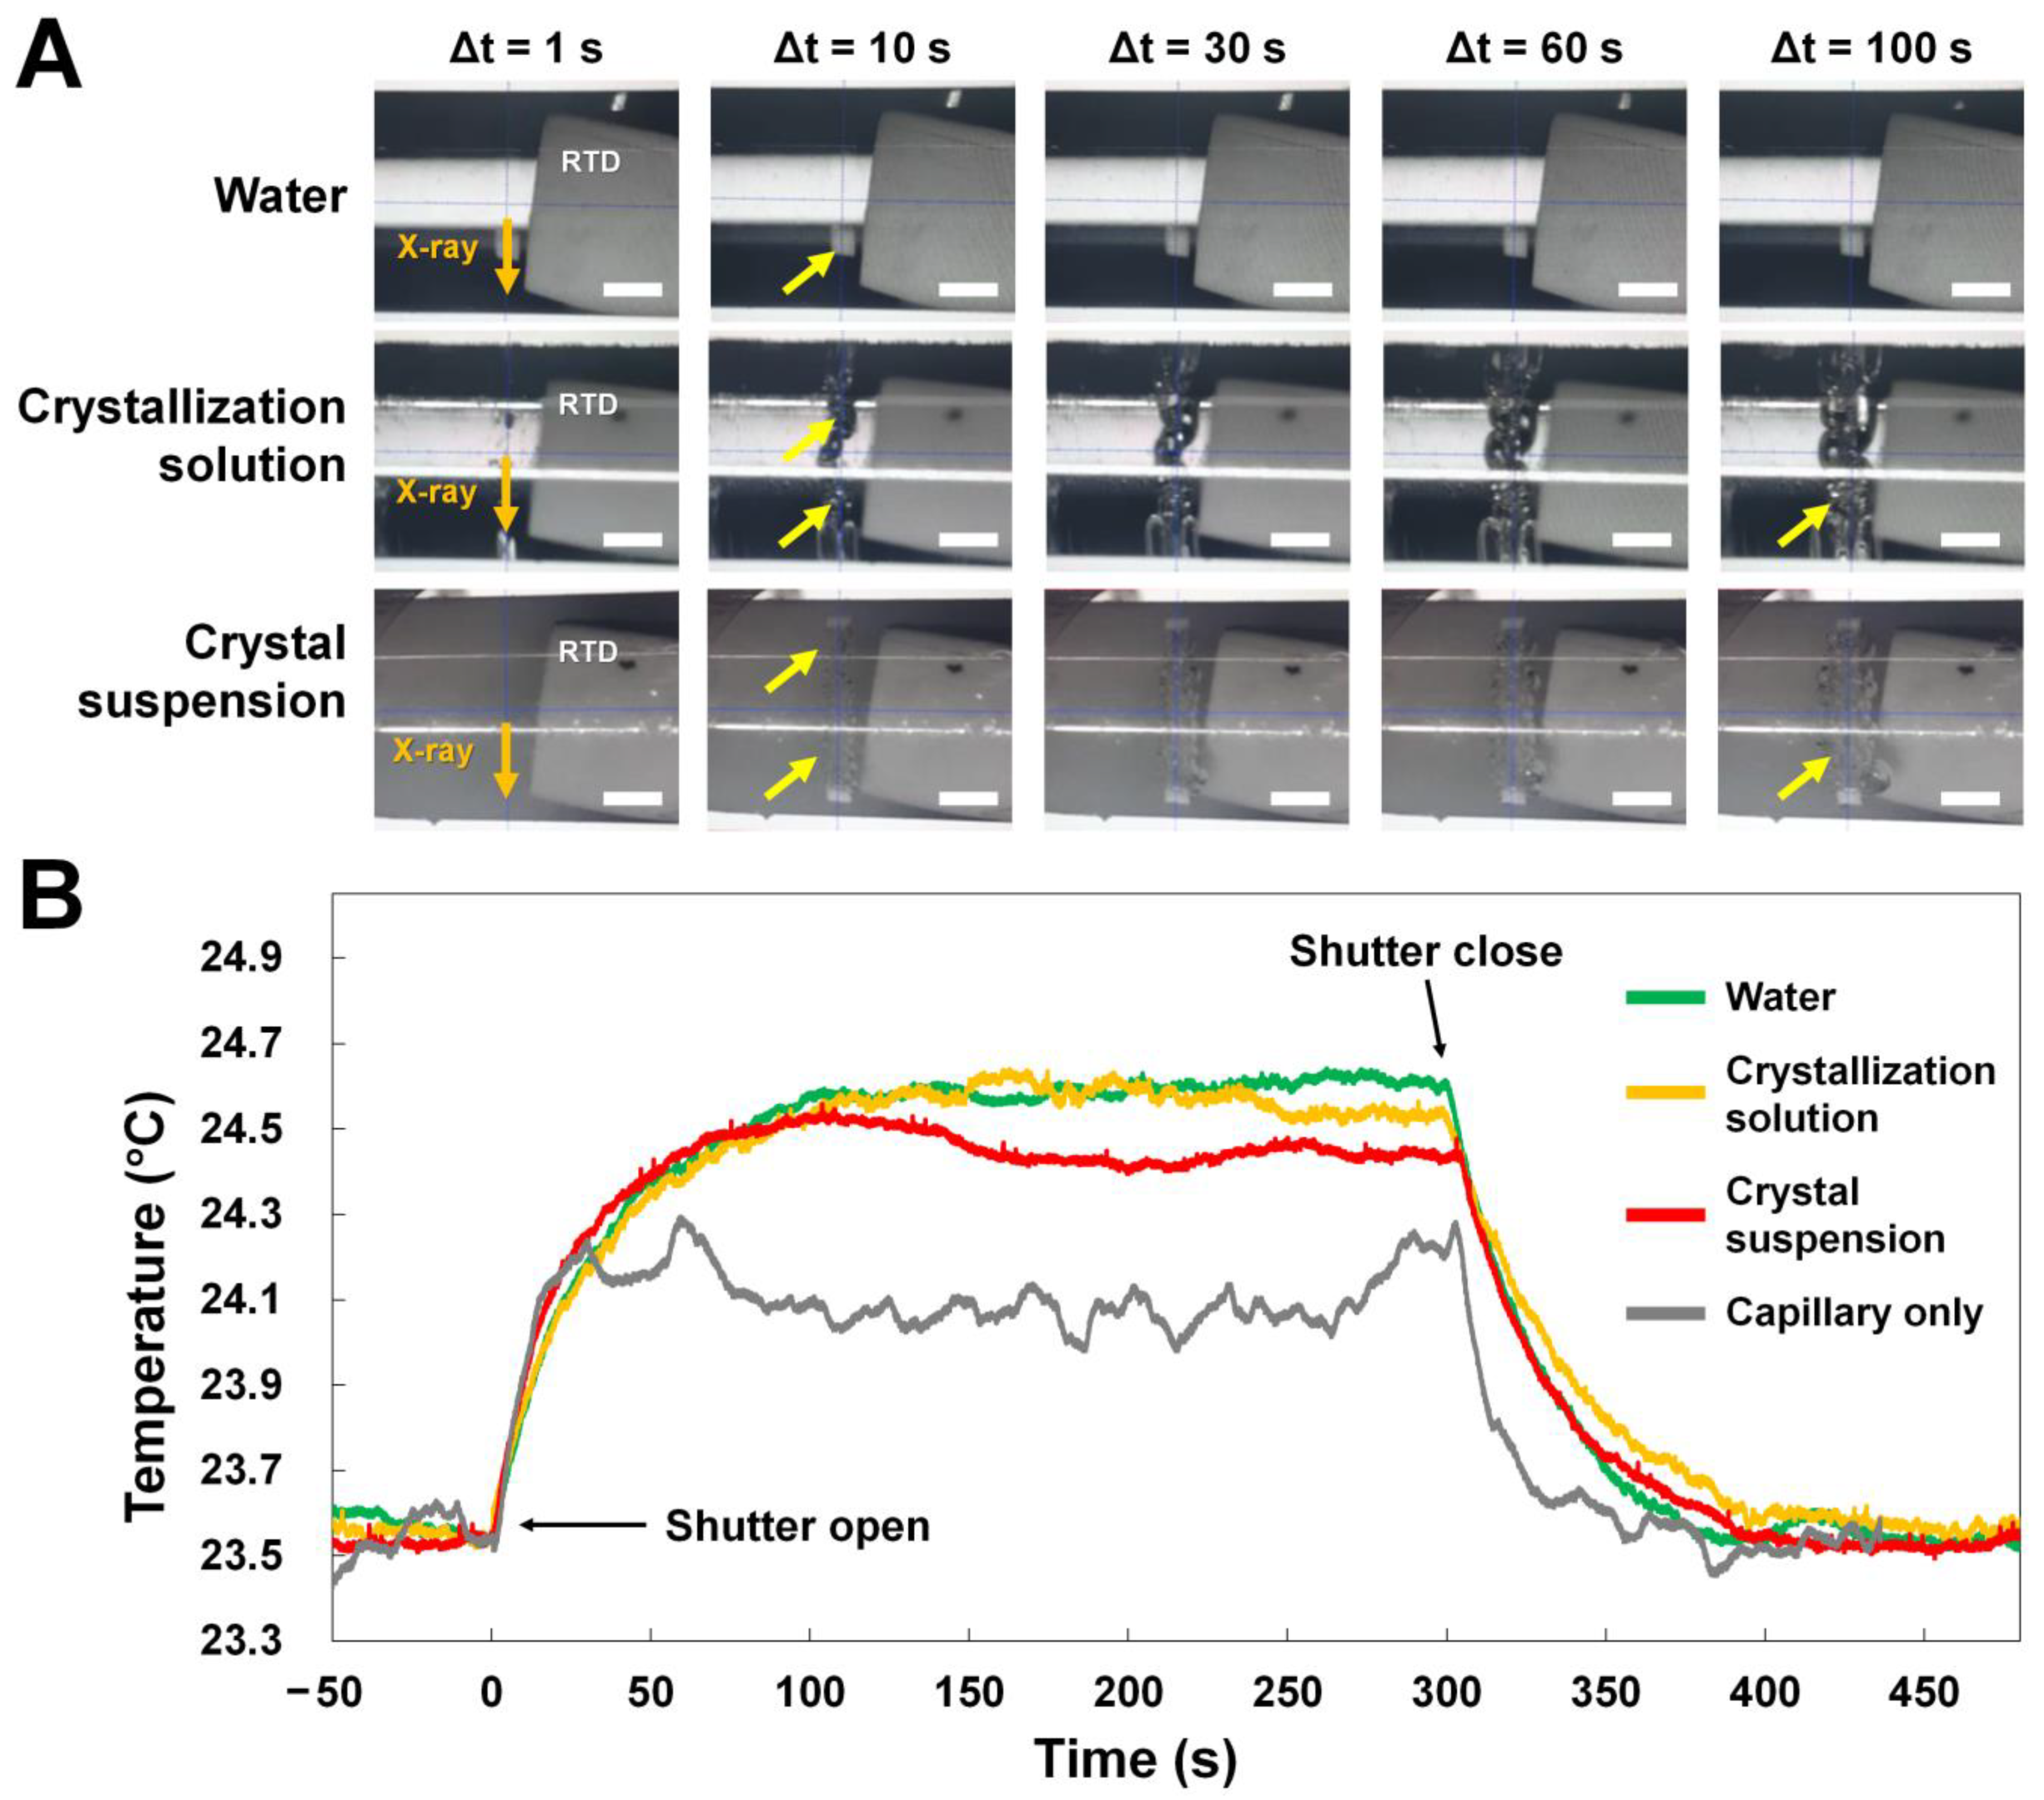
3.2. Temperature Measurement in Glass Capillary

During X-ray exposure, the change in temperature around the X-ray exposure point was investigated. The tip of the RTD was aligned at a distance of approximately 250–300 μm from the point where the X-rays were exposed to the quartz capillary filled with water, crystallization solution, or lysozyme crystal suspension (Figure 2). The X-rays were beamed continuously, and temperature changes were observed for 5 min. For water, an X-ray beam path was clearly observed; however, gas bubbles corresponding to radiation damage were not observed (Figure 2A). The temperature baseline was approximately 23.5 °C, and began to increase when exposed to X-rays, increasing to 24.0 °C in approximately 20 s. The rate of increase then slowed as temperature gradually rose by 1 °C every 100 s (Figure 2A). Afterwards, the temperature remained stable with a deviation in the range of approximately 0.15 °C (Figure 2A). When the X-ray shutter was closed, the water temperature gradually decreased and approached the initial temperature after approximately 100 s (Figure 2A).
In the crystallization solution, a number of gas bubbles were clearly observed after 10 s, and the size of the gas bubbles increased with X-ray exposure time (Figure 2A). Although the formation of gas bubbles by radiation damage was a phenomenon that did not occur in water, in terms of temperature change, the crystallization solution showed a trend similar to that of water (Figure 2B).
For the lysozyme crystal suspension, the formation of gas bubbles corresponding to radiation damage was also observed on the X-ray beam path, with the gas bubble size increasing as X-ray exposure time increased (Figure 2A). The increase in temperature of the crystal suspension was similar to that of water or crystallization solution, but the temperature remained approximately 0.15 °C lower after the maximum temperature increase (Figure 2B).
These results were tentatively attributed to the temperature increase during the X-ray absorption and emission processes as X-rays penetrated the materials. This indicates that the temperature change according to X-ray transmission can be affected by the X-ray absorption of the solutions, as well as the quartz capillary. The thickness of the capillary we used was 10 μm, indicating that when X-rays pass through both walls of the capillary, the X-ray transmission of a 20 μm thick quartz capillary was approximately 0.96 at 12.66 keV. Consequently, approximately 4% of the photons (and 1.2 × 10¹⁰ phs/s) were absorbed by a quartz capillary with a thickness of 20 μm. This figure potentially indicates that the capillary may contain the heat generated from the absorption of X-rays. Accordingly, an RTD was inserted into the capillary without solution. When X-rays were transmitted through the capillary, the temperature of the RTD rose to a maximum of 24.3 °C and then showed a change of 24 °C ± 0.1 °C. This indicates that the temperature change of approximately 0.6 °C in the capillary includes both the heat generated from the capillary and the material inside.

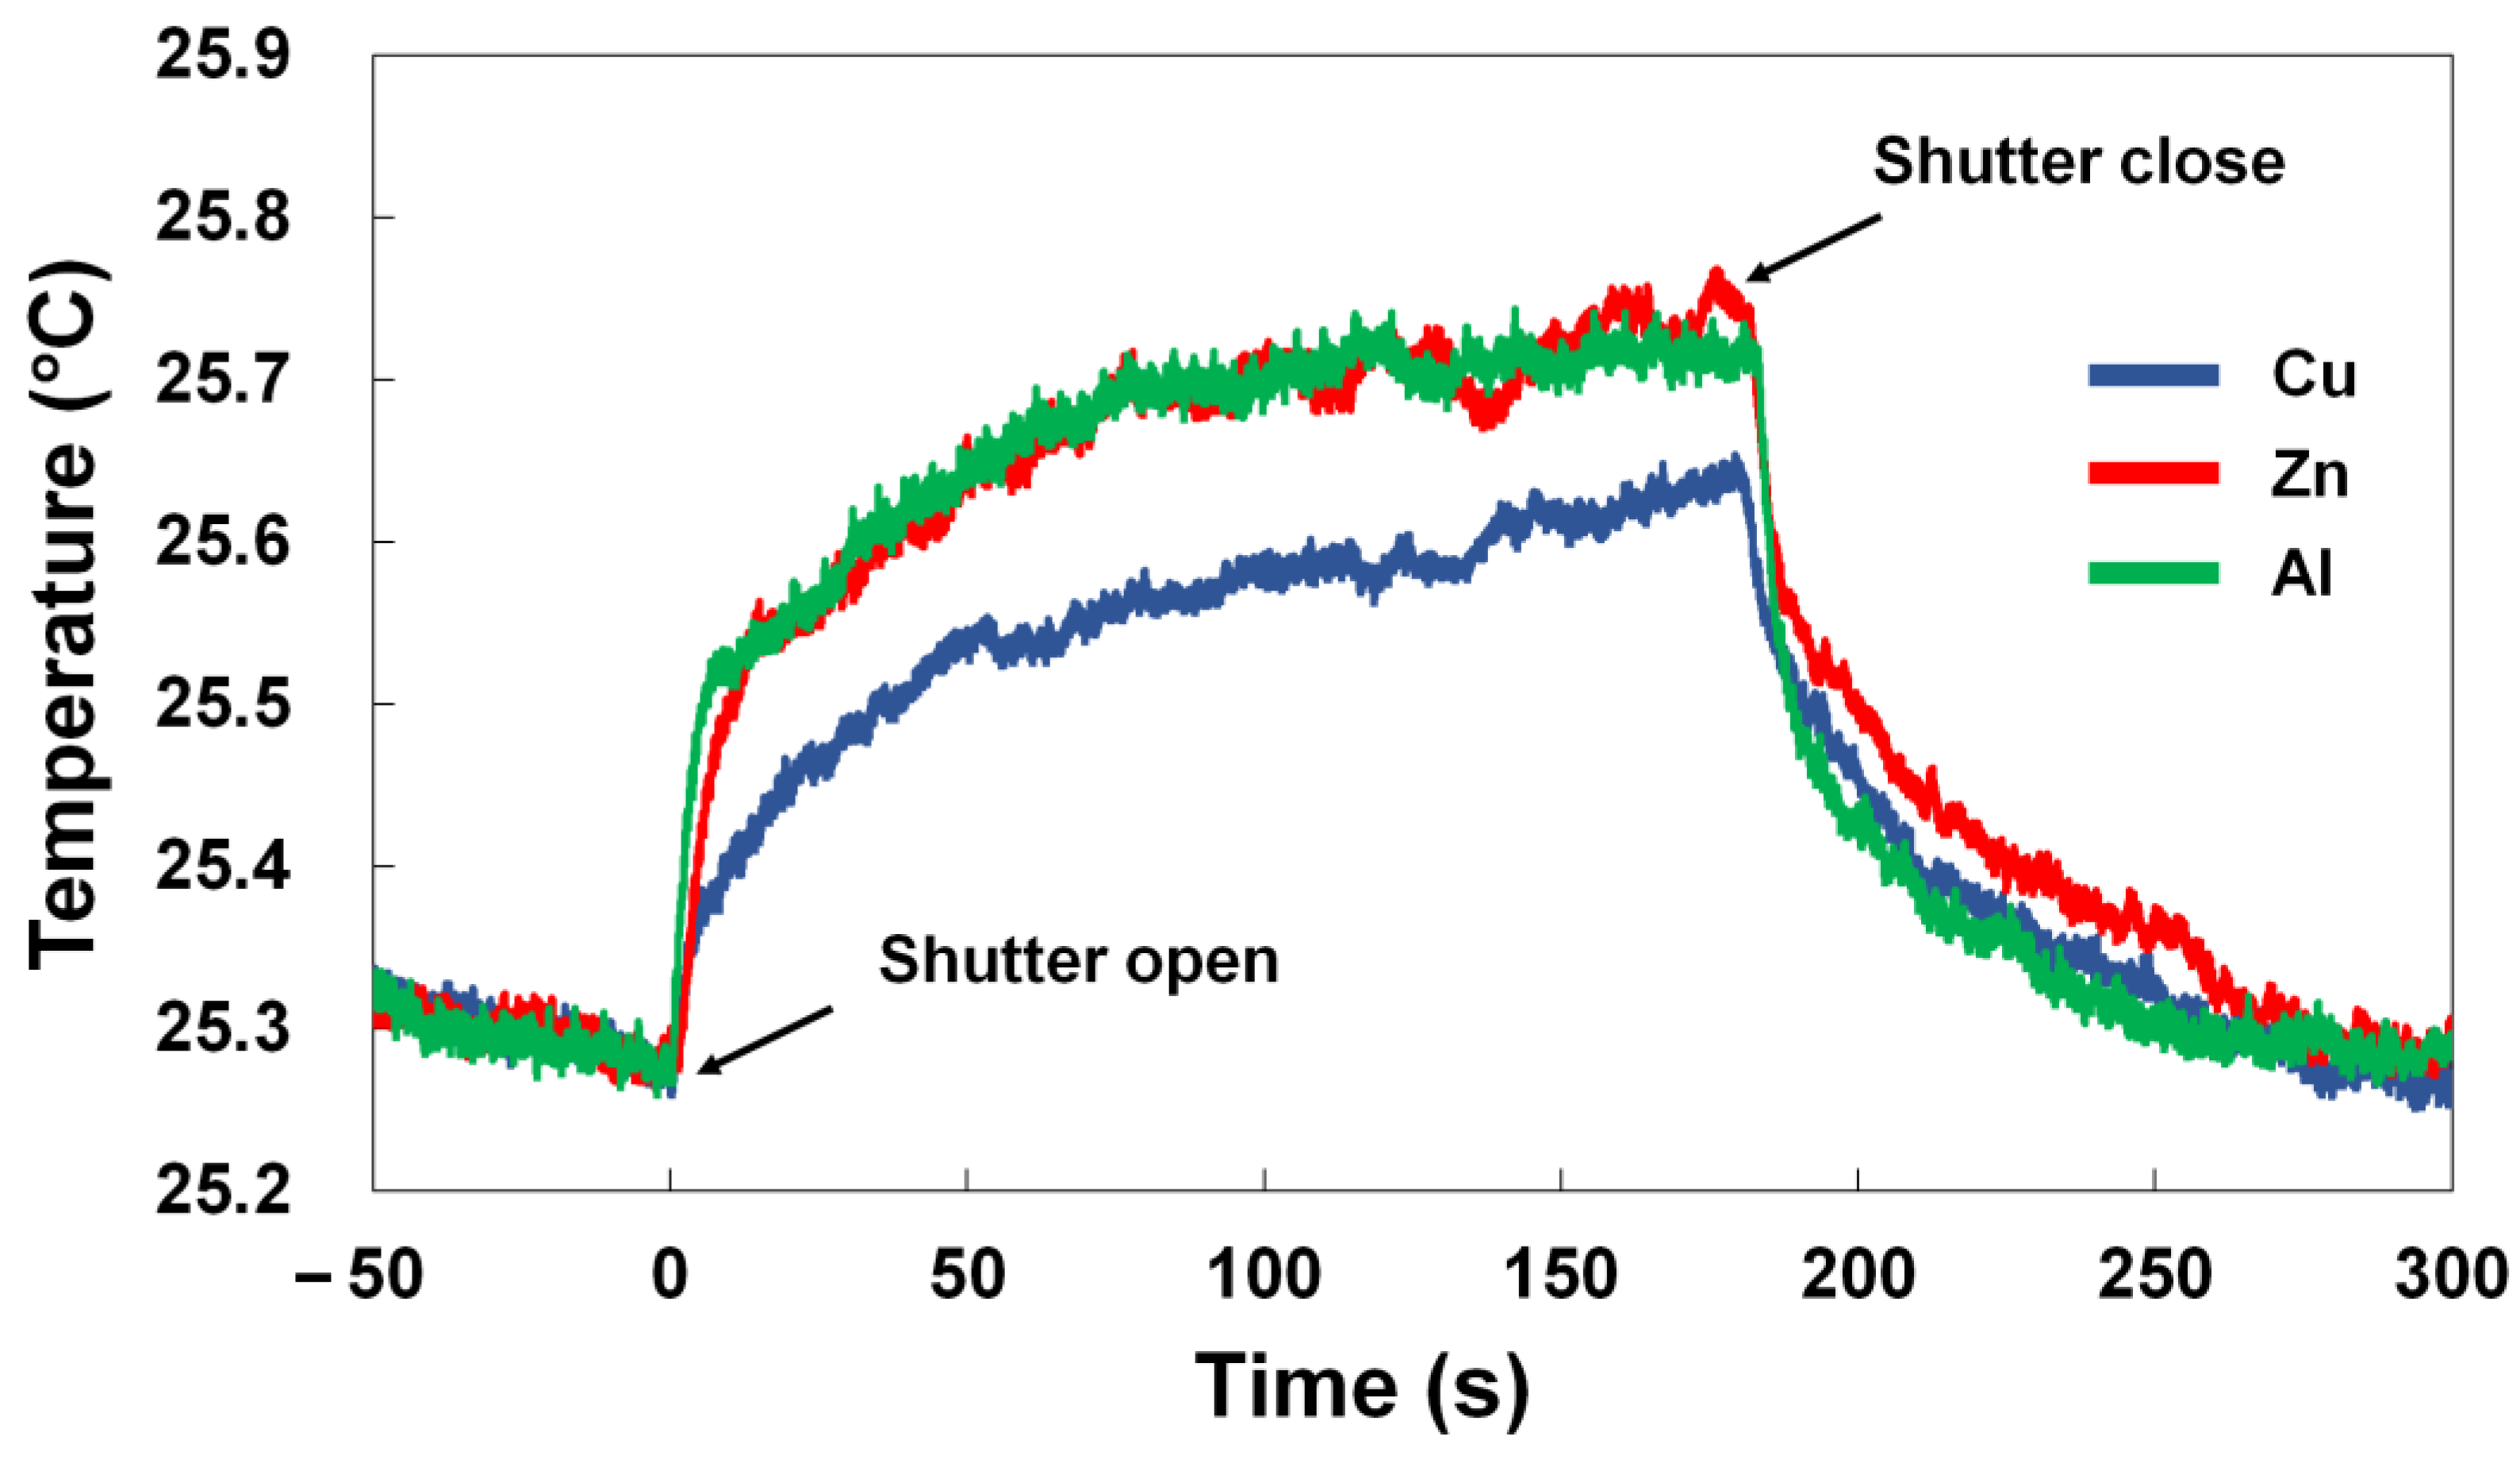
3.3. Temperature Measurement on Metal Plate

Based on the previous literature, we assumed that X-ray-induced heat transfer to the surrounding environment would be material-dependent [5,7]. To verify this assumption, the temperature change in the vicinity of the X-ray interaction was measured while exposing Cu, Al, or Zn plates to X-rays, as these have a higher thermal conductivity than the solutions used. In this experiment, 300 μm thick Cu, Zn, and Al plates were used, and the calculated X-ray transmittances at 12.66 keV were 1.87 × 10⁻¹⁴, 9.67 × 10⁻¹³, and 0.36, respectively. Accordingly, Cu and Zn can absorb most of the X-rays, while Al absorbs approximately 63%.
The temperature was measured 250 μm from the tip of the RTD. We accurately showed a temperature increase for all metal plates the moment the X-ray shutter was opened and a decrease when the shutter was closed (Figure 3). There was a difference among metal plates in temperature increase. The temperature of all metals before X-ray exposure was approximately 25.25 ± 0.01 °C. For Cu, the temperature rose to 25.5–25.6 °C after 100 s of X-ray exposure, with a range of approximately 0.3 °C (Figure 3 and Supplementary Figure S1). For Zn, the data were relatively consistent, showing a temperature rise to 25.7 °C after 100 s of X-ray exposure, with a range of 0.4 °C (Figure 3 and Supplementary Figure S1). For Al, the maximum ranged from approximately 25.5 to 25.7 °C, with a corresponding increase of 0.3–0.7 °C (Figure 3 and Supplementary Figure S1).
The temperature measured near the X-ray position on the metal plate not only showed a different temperature increase range depending on the metal plate, but was also smaller than that in the capillary containing the solution.

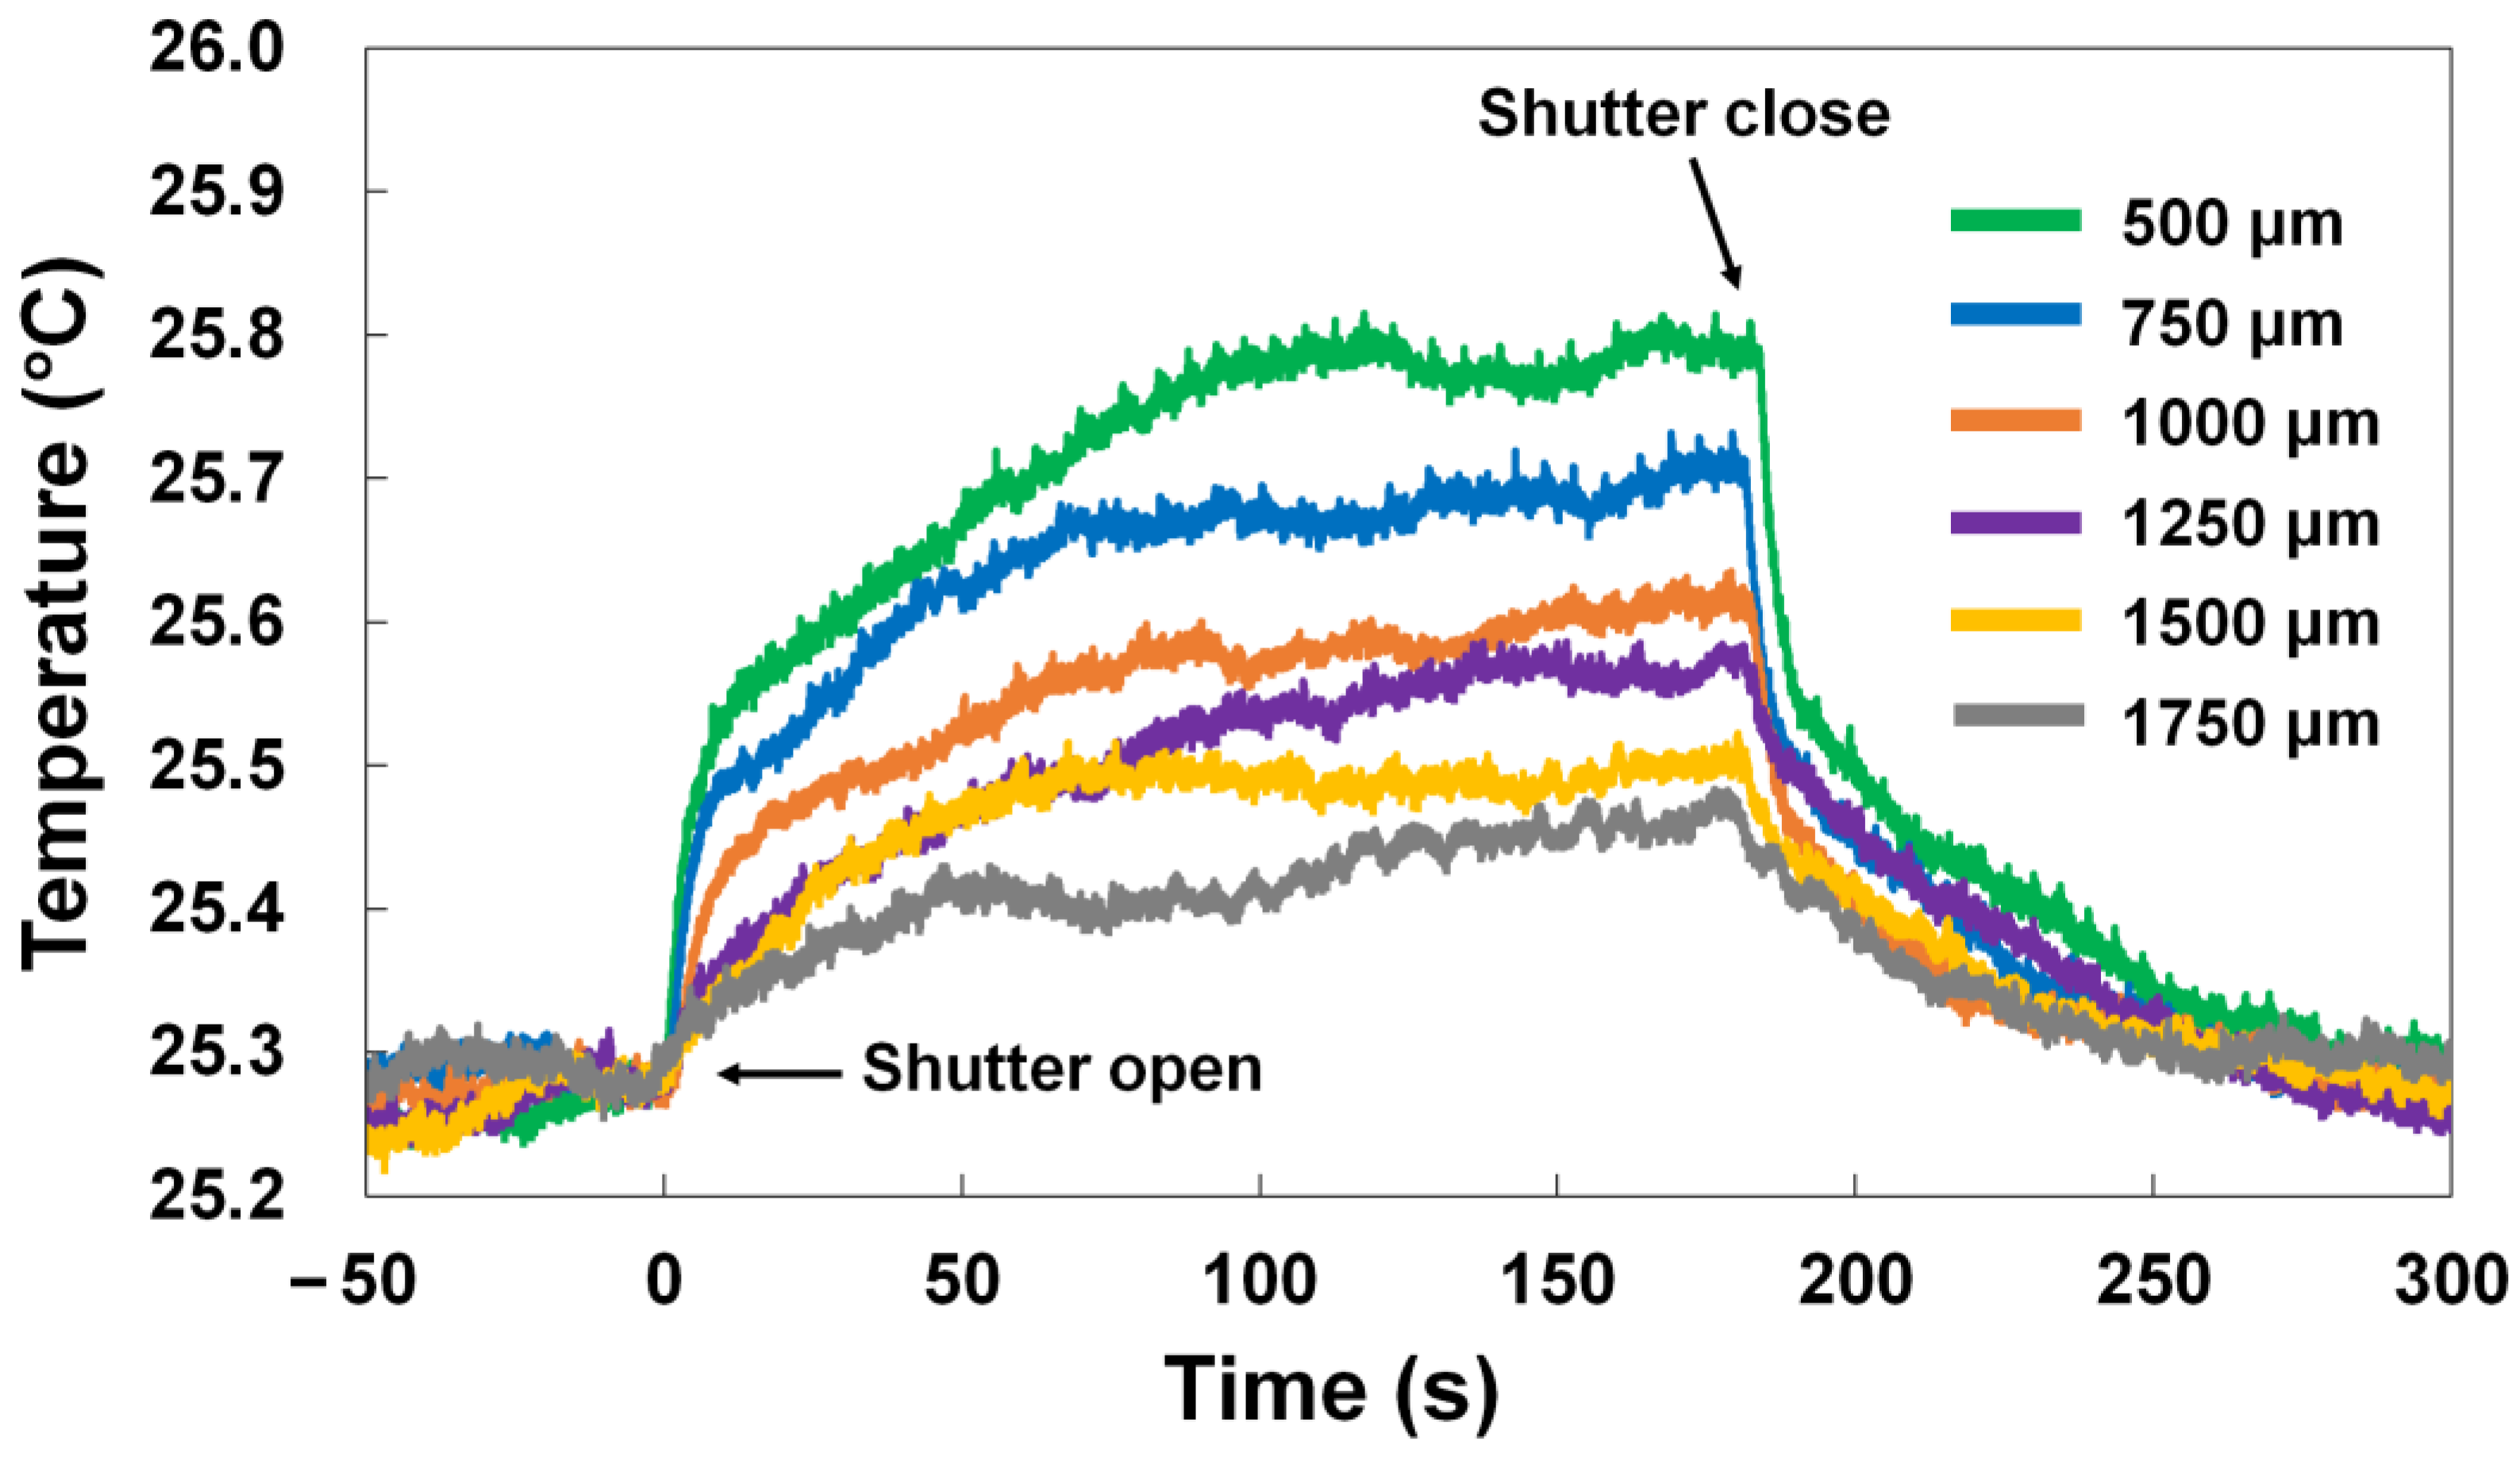
3.4. Temperature Measurement at Different Distances on Al Plate

The highest amount of heat was generated at the point where X-rays penetrate, and this heat is transferred to the surrounding material or air. Accordingly, it is expected that the temperature increase would be lower as the RTD moves farther away from the X-ray beam. To prove this, temperature measurements were performed while varying the distance between the X-ray and the RTD. Temperature changes were investigated while exposing the Al plate to X-rays at intervals of 500, 750, 1000, 1250, 1500, and 1750 μm between the X-ray interaction point and the RTD. The results showed that changes in temperature on the Al plate when the X-ray shutter was opened and closed did not vary significantly. However, the range of temperature change decreased as the distance between the X-ray interaction point and the RTD increased, as expected. In all experiments, the temperature increased with the highest slope in the initial 10 s, then gradually increased and reached the maximum temperature after approximately 70–100 s.
When the distance interval between the X-ray interaction point and the RTD was 500, 750, 1000, 1250, 1500, and 1750 μm, the temperatures at the initial 50 s point were approximately 25.67, 25.62, 25.53, 25.47, 25.47, and 25.41, respectively (Figure 4). When the distances between the X-ray interaction point and the RTD were 500, 750, 1000, 1250, 1500, and 1750 μm, the maximum temperature increases were 25.82, 25.75, 25.64, 25.59, 25.54, and 25.48 °C, respectively. Consequently, we experimentally confirmed that temperature decreased as the distance from the point exposed to X-rays increased.

3.5. X-ray Shutter on/off Control

As the X-ray beam was continuous, the temperature near the X-ray interaction point gradually increased. For temperature-sensitive samples or experiments that must be performed at a fixed temperature, a method to minimize or eliminate the temperature increase induced by X-rays is therefore required. Our experimental results clearly indicate that the temperature gradually increased over time at the point of continuous exposure to X-rays and decreased when the X-ray shutter was closed. Accordingly, we expected that the increase in temperature could be reduced by repeatedly opening and closing the shutter for a certain period of time.
To verify this, the X-ray shutter was repeatedly opened and closed for intervals of 5 or 10 s. When X-rays were continuously exposed to the Al plate, the temperature reached 25.5 °C after approximately 100 s, which was 0.35 °C higher than before exposure to X-rays. As a result of repeatedly opening and closing the X-ray shutter for 5 s, the temperature measured on the Al plate also repeatedly rose and fell at 5 s intervals. The temperatures reached at the high and low points after 100 s were approximately 25.6 and 25.4 °C, respectively (Figure 5A).
This experiment was repeated using a 10 s interval, and similarly the temperature rose and fell repeatedly at 5 s intervals. The temperatures reached at the high and low points after 100 s were 25.5 and 25.3 °C, respectively (Figure 5B). Accordingly, it was confirmed that it was possible to minimize the temperature change by shortening the shutter opening time and lengthening the closing time, while continuing to collect data.

4. Discussion

Herein, we investigated X-ray-induced heating in the vicinity of the X-ray interaction point. When a solution or metal plate was exposed to X-rays, the temperature increased around the X-ray-exposed site.
No appreciable radiation damage, such as gas bubbles, was observed in the water in the capillary tube. However, the generation of gas bubbles was observed in crystallization solutions and crystal suspensions. This large difference is considered to be due to the generation of gases after the ionization of a crystallization solution or protein crystals. Despite the distinct compositional differences of the water, crystallization solution, and crystal suspension in the capillary, they all showed similar trends of temperature increase.
Similar to the solution inside the quartz capillary, the temperature increase showed a similar trend for all metals exposed to X-rays. However, the increase in temperature around the X-ray-exposed area in the metal was lower than that in the solution in capillary, while the temperature increase and decrease for X-ray exposure and non-exposure showed similar trends for Cu, Al, and Zn metal plates, the temperature increase was different. In particular, the temperature increase of Cu was lower than that of Al or Zn. Factors that may be involved in the measurement of temperature include X-ray transmittance, thermal conductivity (368, 239, and 113 W/(m·K) for Cu, Al, and Zn, respectively, at 20 °C and 1 bar [46]), and X-ray absorptivity. We conclude that X-rays can cause a temperature increase in the surroundings of a material, with differences in temperature depending on the type of material. Although, in our experiment, we observed a similar trend in temperature change between the capillary solutions and metal plates, the precise temperature difference between the solutions in capillaries or on the Al and Zn plate could not be distinguished experimentally. To measure the temperature more precisely in future, it will be necessary to conduct measurements in a controlled environment, such as a thermal enclosure.
Meanwhile, we were unable to measure the temperature at the X-ray interaction point in this experiment because the RTD could not be directly exposed to the X-rays. Instead, based on the result that the temperature increased as the temperature sensor was closer to the X-ray exposed area, we estimate that the temperature at the X-ray exposed location is higher than the temperature we measured.
Based on our results, the structures previously determined at room temperature using capillaries in MX have the potential to be determined at temperatures higher than the actual room temperature [47]. Similarly, in previous SSX studies, diffraction data were collected at room temperature by delivering crystals at a low flow rate via a capillary [48] or through a viscous medium [49,50,51,52]. During SSX data collection at room temperature, if X-ray exposure raises the temperature around the X-ray beam point on the capillary or viscous material, the crystal itself will increase in temperature before the X-ray interaction. Accordingly, as the crystal at the X-ray interaction point reached elevated temperatures, the actual structure is likely to have an even higher temperature. The possibility of such a temperature increase during these SSX experiments needs to be investigated experimentally in the future.
Furthermore, temperature is an important factor for the stability of macromolecule crystals [53,54]. In previous SSX experiments using capillaries, a lysozyme solution was used as a model sample, due to its high crystal stability and excellent diffraction intensity [48,49,50,51,52]. Accordingly, it is presumed that the crystal stabilizes even when the temperature increases. If a temperature-sensitive sample is used, the diffraction quality of the crystal is affected by an increase in temperature. Here, we conducted an experiment to reduce the extent of the temperature increase during exposure and non-exposure to X-rays by using an X-ray shutter. Future experiments will be able to lower the effect of temperature by adjusting the on/off ratio of the shutter.
Meanwhile, in the case of the injector or fixed-target scan method among the SSX sample delivery methods, the heating effect on the sample is expected to be negligible because the X-rays pass through the sample quickly. In contrast, in the case of the sample delivery method using a viscous material in which the sample is delivered at a very low flow rate, it is expected that the sample can be exposed to the X-rays for a long time, and thereby significantly affected by the head.
In this experiment, we observed the X-ray radiation damage and demonstrated that the temperature increases during X-ray exposure at the 7A beamline at PLS-II. The radiation damage and temperature increase caused by these X-rays vary depending on the flux and density of the beam used. In addition, there will be a difference in the phenomenon of radiation damage and temperature change depending on the medium of the material and the type of solution that is exposed to the X-rays [55,56]. Hence, it is expected that if the experiment that we conducted at the 7A beamline of PLS-II is conducted at a beamline with different X-ray properties such as photon flux, photon density, and the X-ray pulse, the range of temperature rise around the X-ray exposed area may be different. Therefore, to obtain a more accurate temperature parameter of the sample environment during SX data collection, it will be necessary to measure the temperature of the X-ray-exposed area using a sample delivery device used in the beamline. Our results provide novel insight into the sample configuration of MX and SX experiments, as well as other X-ray studies where temperature is an important experimental parameter.

Supplementary Materials

The following supporting information can be downloaded at: https://www.mdpi.com/article/10.3390/app13020717/s1, Figure S1: Temperature measurement in the vicinity of the X-ray interaction point on (A) Cu, (B) Zn and (C) Al plates. All experiments were performed in triplicate (#1-3) at room temperature.

Author Contributions

Conceptualization: J.K. and K.H.N.; methodology: J.K. and K.H.N.; software: J.K. and K.H.N.; validation: J.K. and K.H.N.; formal analysis: J.K. and K.H.N.; investigation: J.K. and K.H.N.; data curation: J.K. and K.H.N.; writing—original draft preparation: K.H.N.; writing—review and editing: J.K. and K.H.N.; visualization: J.K. and K.H.N.; funding acquisition: J.K. and K.H.N. All authors have read and agreed to the published version of the manuscript.

Funding

This work was funded by the National Research Foundation of Korea (NRF) (NRF-2017M3A9F6029736 and NRF-2021R1I1A1A01050838 to K.H.N, the NRF-2021R1F1A1046067 to J.K.) and the Korea Initiative for Fostering University of Research and Innovation (KIURI) Program of the NRF (NRF-2020M3H1A1075314 to K.H.N.). This study was supported by ProGen (to K.H.N.).

Data Availability Statement

Not applicable.

Acknowledgments

We would like to thank Sung Chul Ha at the 7A beamline at the Pohang Accelerator Laboratory for their assistance with data collection.

Conflicts of Interest

The authors declare no conflict of interest. The funders had no role in the study design; collection, analyses, or interpretation of data; writing of the manuscript; or decision to publish the results.

References

  1. Holton, J.M. A beginner’s guide to radiation damage. J. Synchrotron Radiat. 2009, 16, 133–142. [Google Scholar] [CrossRef] [PubMed] [Green Version]
  2. Weik, M.; Ravelli, R.B.G.; Kryger, G.; McSweeney, S.; Raves, M.L.; Harel, M.; Gros, P.; Silman, I.; Kroon, J.; Sussman, J.L. Specific chemical and structural damage to proteins produced by synchrotron radiation. Proc. Natl. Acad. Sci. USA 2000, 97, 623–628. [Google Scholar] [CrossRef] [Green Version]
  3. Yamamoto, M.; Hirata, K.; Yamashita, K.; Hasegawa, K.; Ueno, G.; Ago, H.; Kumasaka, T. Protein microcrystallography using synchrotron radiation. IUCrJ 2017, 4, 529–539. [Google Scholar] [CrossRef] [Green Version]
  4. Lee, K.; Lee, D.; Baek, S.; Kim, J.; Park, J.; Lee, S.J.; Park, S.; Kim, J.; Lee, J.-L.; Chung, W.K.; et al. Radiation Damage of Polydimethylsiloxane and Polyimide by X-ray Free-Electron Laser. Appl. Sci. 2022, 12, 8431. [Google Scholar] [CrossRef]
  5. Snell, E.H.; Bellamy, H.D.; Rosenbaum, G.; van der Woerd, M.J. Non-invasive measurement of X-ray beam heating on a surrogate crystal sample. J. Synchrotron Radiat. 2006, 14, 109–115. [Google Scholar] [CrossRef] [PubMed]
  6. Leiros, H.-K.S.; Timmins, J.; Ravelli, R.B.G.; McSweeney, S.M. Is radiation damage dependent on the dose rate used during macromolecular crystallography data collection? Acta Crystallogr. D Biol. 2006, 62, 125–132. [Google Scholar] [CrossRef]
  7. Warren, A.J.; Axford, D.; Owen, R.L. Direct measurement of X-ray-induced heating of microcrystals. J. Synchrotron Radiat. 2019, 26, 991–997. [Google Scholar] [CrossRef] [Green Version]
  8. Hough, M.A.; Owen, R.L. Serial synchrotron and XFEL crystallography for studies of metalloprotein catalysis. Curr. Opin. Struct. Biol. 2021, 71, 232–238. [Google Scholar] [CrossRef]
  9. Boutet, S.; Lomb, L.; Williams, G.J.; Barends, T.R.M.; Aquila, A.; Doak, R.B.; Weierstall, U.; DePonte, D.P.; Steinbrener, J.; Shoeman, R.L.; et al. High-Resolution Protein Structure Determination by Serial Femtosecond Crystallography. Science 2012, 337, 362–364. [Google Scholar] [CrossRef] [Green Version]
  10. Nam, K.H. Room-temperature structure of xylitol-bound glucose isomerase by serial crystallography: Xylitol binding in the M1 site induces release of metal bound in the M2 site. Int. J. Mol. Sci. 2021, 22, 3892. [Google Scholar] [CrossRef]
  11. Kang, H.S.; Min, C.K.; Heo, H.; Kim, C.; Yang, H.; Kim, G.; Nam, I.; Baek, S.Y.; Choi, H.J.; Mun, G.; et al. Hard X-ray free-electron laser with femtosecond-scale timing jitter. Nat. Photonics 2017, 11, 708–713. [Google Scholar] [CrossRef]
  12. Park, J.; Park, S.; Kim, J.; Park, G.; Cho, Y.; Nam, K.H. Polyacrylamide injection matrix for serial femtosecond crystallography. Sci. Rep. 2019, 9, 2525. [Google Scholar] [CrossRef] [PubMed] [Green Version]
  13. Stellato, F.; Oberthür, D.; Liang, M.; Bean, R.; Gati, C.; Yefanov, O.; Barty, A.; Burkhardt, A.; Fischer, P.; Galli, L.; et al. Room-temperature macromolecular serial crystallography using synchrotron radiation. IUCrJ 2014, 1, 204–212. [Google Scholar] [CrossRef]
  14. Weinert, T.; Olieric, N.; Cheng, R.; Brunle, S.; James, D.; Ozerov, D.; Gashi, D.; Vera, L.; Marsh, M.; Jaeger, K.; et al. Serial millisecond crystallography for routine room-temperature structure determination at synchrotrons. Nat. Commun. 2017, 8, 542. [Google Scholar] [CrossRef] [Green Version]
  15. Mehrabi, P.; Bücker, R.; Bourenkov, G.; Ginn, H.M.; von Stetten, D.; Müller-Werkmeister, H.M.; Kuo, A.; Morizumi, T.; Eger, B.T.; Ou, W.L.; et al. Serial femtosecond and serial synchrotron crystallography can yield data of equivalent quality: A systematic comparison. Sci. Adv. 2021, 7, eabf1380. [Google Scholar] [CrossRef]
  16. Nass, K. Radiation damage in protein crystallography at X-ray free-electron lasers. Acta Crystallogr. D Struct. Biol. 2019, 75, 211–218. [Google Scholar] [CrossRef] [PubMed]
  17. Worrall, J.A.R.; Hough, M.A. Serial femtosecond crystallography approaches to understanding catalysis in iron enzymes. Curr. Opin. Struct. Biol. 2022, 77, 102486. [Google Scholar] [CrossRef] [PubMed]
  18. Aller, P.; Orville, A.M. Dynamic Structural Biology Experiments at XFEL or Synchrotron Sources. In Structural Proteomics; Methods in Molecular Biology; Springer: Berlin/Heidelberg, Germany, 2021; pp. 203–228. [Google Scholar]
  19. Schmidt, M. Macromolecular movies, storybooks written by nature. Biophys. Rev. 2021, 13, 1191–1197. [Google Scholar] [CrossRef] [PubMed]
  20. DePonte, D.P.; Weierstall, U.; Schmidt, K.; Warner, J.; Starodub, D.; Spence, J.C.H.; Doak, R.B. Gas dynamic virtual nozzle for generation of microscopic droplet streams. J. Phys. D 2008, 41, 195505. [Google Scholar] [CrossRef] [Green Version]
  21. Weierstall, U.; James, D.; Wang, C.; White, T.A.; Wang, D.; Liu, W.; Spence, J.C.; Bruce Doak, R.; Nelson, G.; Fromme, P.; et al. Lipidic cubic phase injector facilitates membrane protein serial femtosecond crystallography. Nat. Commun. 2014, 5, 3309. [Google Scholar] [CrossRef]
  22. Vakili, M.; Vasireddi, R.; Gwozdz, P.V.; Monteiro, D.C.F.; Heymann, M.; Blick, R.H.; Trebbin, M. Microfluidic polyimide gas dynamic virtual nozzles for serial crystallography. Rev. Sci. Instrum. 2020, 91, 085108. [Google Scholar] [CrossRef]
  23. Sugahara, M.; Mizohata, E.; Nango, E.; Suzuki, M.; Tanaka, T.; Masudala, T.; Tanaka, R.; Shimamura, T.; Tanaka, Y.; Suno, C.; et al. Grease matrix as a versatile carrier of proteins for serial crystallography. Nat. Methods 2015, 12, 61–63. [Google Scholar] [CrossRef] [Green Version]
  24. Berntsen, P.; Hadian Jazi, M.; Kusel, M.; Martin, A.V.; Ericsson, T.; Call, M.J.; Trenker, R.; Roque, F.G.; Darmanin, C.; Abbey, B. The serial millisecond crystallography instrument at the Australian Synchrotron incorporating the “Lipidico” injector. Rev. Sci. Instrum. 2019, 90, 085110. [Google Scholar] [CrossRef]
  25. Park, S.Y.; Nam, K.H. Sample delivery using viscous media, a syringe and a syringe pump for serial crystallography. J. Synchrotron Radiat. 2019, 26, 1815–1819. [Google Scholar] [CrossRef] [Green Version]
  26. Nam, K.H. Sample delivery media for serial crystallography. Int. J. Mol. Sci. 2019, 20, 1094. [Google Scholar] [CrossRef] [Green Version]
  27. Nam, K.H. Polysaccharide-based injection matrix for serial crystallography. Int. J. Mol. Sci. 2020, 21, 3332. [Google Scholar] [CrossRef]
  28. Hunter, M.S.; Segelke, B.; Messerschmidt, M.; Williams, G.J.; Zatsepin, N.A.; Barty, A.; Benner, W.H.; Carlson, D.B.; Coleman, M.; Graf, A.; et al. Fixed-target protein serial microcrystallography with an X-ray free electron laser. Sci. Rep. 2014, 4, 6026. [Google Scholar] [CrossRef] [Green Version]
  29. Cohen, A.E.; Soltis, S.M.; Gonzalez, A.; Aguila, L.; Alonso-Mori, R.; Barnes, C.O.; Baxter, E.L.; Brehmer, W.; Brewster, A.S.; Brunger, A.T.; et al. Goniometer-based femtosecond crystallography with X-ray free electron lasers. Proc. Natl. Acad. Sci. USA 2014, 111, 17122–17127. [Google Scholar] [CrossRef] [Green Version]
  30. Mueller, C.; Marx, A.; Epp, S.W.; Zhong, Y.; Kuo, A.; Balo, A.R.; Soman, J.; Schotte, F.; Lemke, H.T.; Owen, R.L.; et al. Fixed target matrix for femtosecond time-resolved and in situ serial micro-crystallography. Struct. Dyn. 2015, 2, 054302. [Google Scholar] [CrossRef] [Green Version]
  31. Lee, D.; Baek, S.; Park, J.; Lee, K.; Kim, J.; Lee, S.J.; Chung, W.K.; Lee, J.L.; Cho, Y.; Nam, K.H. Nylon mesh-based sample holder for fixed-target serial femtosecond crystallography. Sci. Rep. 2019, 9, 6971. [Google Scholar] [CrossRef]
  32. Tolstikova, A.; Levantino, M.; Yefanov, O.; Hennicke, V.; Fischer, P.; Meyer, J.; Mozzanica, A.; Redford, S.; Crosas, E.; Opara, N.L.; et al. 1 kHz fixed-target serial crystallography using a multilayer monochromator and an integrating pixel detector. IUCrJ 2019, 6, 927–937. [Google Scholar] [CrossRef] [PubMed]
  33. Beyerlein, K.R.; Dierksmeyer, D.; Mariani, V.; Kuhn, M.; Sarrou, I.; Ottaviano, A.; Awel, S.; Knoska, J.; Fuglerud, S.; Jonsson, O.; et al. Mix-and-diffuse serial synchrotron crystallography. IUCrJ 2017, 4, 769–777. [Google Scholar] [CrossRef] [PubMed]
  34. Butryn, A.; Simon, P.S.; Aller, P.; Hinchliffe, P.; Massad, R.N.; Leen, G.; Tooke, C.L.; Bogacz, I.; Kim, I.S.; Bhowmick, A.; et al. An on-demand, drop-on-drop method for studying enzyme catalysis by serial crystallography. Nat. Commun. 2021, 12, 4461. [Google Scholar] [CrossRef] [PubMed]
  35. Mehrabi, P.; Schulz, E.C.; Agthe, M.; Horrell, S.; Bourenkov, G.; von Stetten, D.; Leimkohl, J.P.; Schikora, H.; Schneider, T.R.; Pearson, A.R.; et al. Liquid application method for time-resolved analyses by serial synchrotron crystallography. Nat. Methods 2019, 16, 979–982. [Google Scholar] [CrossRef] [PubMed]
  36. Lee, K.; Kim, J.; Baek, S.; Park, J.; Park, S.; Lee, J.-L.; Chung, W.K.; Cho, Y.; Nam, K.H. Combination of an inject-and-transfer system for serial femtosecond crystallography. J. Appl. Crystallogr. 2022, 55, 813–822. [Google Scholar] [CrossRef] [PubMed]
  37. Lee, K.; Lee, D.; Park, J.; Lee, J.-L.; Chung, W.K.; Cho, Y.; Nam, K.H. Upgraded Combined Inject-and-Transfer System for Serial Femtosecond Crystallography. Appl. Sci. 2022, 12, 9125. [Google Scholar] [CrossRef]
  38. Weierstall, U. Liquid sample delivery techniques for serial femtosecond crystallography. Philos. Trans. R. Soc. B Biol. Sci. 2014, 369, 20130337. [Google Scholar] [CrossRef] [Green Version]
  39. Murray, T.D.; Lyubimov, A.Y.; Ogata, C.M.; Vo, H.; Uervirojnangkoorn, M.; Brunger, A.T.; Berger, J.M. A high-transparency, micro-patternable chip for X-ray diffraction analysis of microcrystals under native growth conditions. Acta Crystallogr. D Biol. Crystallogr. 2015, 71, 1987–1997. [Google Scholar] [CrossRef] [Green Version]
  40. Frank, M.; Carlson, D.B.; Hunter, M.S.; Williams, G.J.; Messerschmidt, M.; Zatsepin, N.A.; Barty, A.; Benner, W.H.; Chu, K.; Graf, A.T.; et al. Femtosecond X-ray diffraction from two-dimensional protein crystals. IUCrJ 2014, 1, 95–100. [Google Scholar] [CrossRef] [Green Version]
  41. Doak, R.B.; Nass Kovacs, G.; Gorel, A.; Foucar, L.; Barends, T.R.M.; Grunbein, M.L.; Hilpert, M.; Kloos, M.; Roome, C.M.; Shoeman, R.L.; et al. Crystallography on a chip-without the chip: Sheet-on-sheet sandwich. Acta Crystallogr. D Struct. Biol. 2018, 74, 1000–1007. [Google Scholar] [CrossRef]
  42. Nam, K.H.; Kim, J.; Cho, Y. Polyimide mesh-based sample holder with irregular crystal mounting holes for fixed-target serial crystallography. Sci. Rep. 2021, 11, 13115. [Google Scholar] [CrossRef] [PubMed]
  43. Lee, K.; Lee, D.; Baek, S.; Park, J.; Lee, S.J.; Park, S.; Chung, W.K.; Lee, J.L.; Cho, H.S.; Cho, Y.; et al. Viscous-medium-based crystal support in a sample holder for fixed-target serial femtosecond crystallography. J. Appl. Crystallogr. 2020, 53, 1051–1059. [Google Scholar] [CrossRef]
  44. Martiel, I.; Beale, J.H.; Karpik, A.; Huang, C.-Y.; Vera, L.; Olieric, N.; Wranik, M.; Tsai, C.-J.; Mühle, J.; Aurelius, O.; et al. Versatile microporous polymer-based supports for serial macromolecular crystallography. Acta Crystallogr. D Struct. Biol. 2021, 77, 1153–1167. [Google Scholar] [CrossRef] [PubMed]
  45. Park, S.Y.; Choi, H.; Eo, C.; Cho, Y.; Nam, K.H. Fixed-target serial synchrotron crystallography using nylon mesh and enclosed film-based sample holder. Crystals 2020, 10, 803. [Google Scholar] [CrossRef]
  46. Carvill, J. Thermodynamics and heat transfer. In Mechanical Engineer’s Data Handbook; Butterworth-Heinemann: Oxford, UK, 1993; pp. 102–145. [Google Scholar]
  47. Basavappa, R.; Petri, E.T.; Tolbert, B.S. A quick and gentle method for mounting crystals in capillaries. J. Appl. Crystallogr. 2003, 36, 1297–1298. [Google Scholar] [CrossRef]
  48. Nam, K.H. Stable sample delivery in viscous media via a capillary for serial crystallography. J. Appl. Crystallogr. 2020, 53, 45–50. [Google Scholar] [CrossRef]
  49. Nam, K.H. Shortening injection matrix for serial crystallography. Sci. Rep. 2020, 10, 107. [Google Scholar] [CrossRef] [Green Version]
  50. Nam, K.H. Lard injection matrix for serial crystallography. Int. J. Mol. Sci. 2020, 21, 5977. [Google Scholar] [CrossRef]
  51. Nam, K.H. Beef tallow injection matrix for serial crystallography. Sci. Rep. 2022, 12, 694. [Google Scholar] [CrossRef]
  52. Kim, Y.; Nam, K.H. Pink-Beam Serial Synchrotron Crystallography at Pohang Light Source II. Crystals 2022, 12, 1637. [Google Scholar] [CrossRef]
  53. Jiang, B.; Jain, A.; Lu, Y.; Hoag, S.W. Probing Thermal Stability of Proteins with Temperature Scanning Viscometer. Mol. Pharm. 2019, 16, 3687–3693. [Google Scholar] [CrossRef] [PubMed]
  54. Wiedersich, J.; Köhler, S.; Skerra, A.; Friedrich, J. Temperature and pressure dependence of protein stability: The engineered fluorescein-binding lipocalin FluA shows an elliptic phase diagram. Proc. Natl. Acad. Sci. USA 2008, 105, 5756–5761. [Google Scholar] [CrossRef] [PubMed] [Green Version]
  55. Atakisi, H.; Conger, L.; Moreau, D.W.; Thorne, R.E. Resolution and dose dependence of radiation damage in biomolecular systems. IUCrJ 2019, 6, 1040–1053. [Google Scholar] [CrossRef] [PubMed] [Green Version]
  56. Shimizu, N.; Hirata, K.; Hasegawa, K.; Ueno, G.; Yamamoto, M. Dose dependence of radiation damage for protein crystals studied at various X-ray energies. J. Synchrotron Radiat. 2006, 14, 4–10. [Google Scholar] [CrossRef] [PubMed]
Figure 1. Observation of X-ray-induced radiation damage at the beamline 7A at PLS-II. Time-lapse view of the radiation damage of (A) crystal suspension and (B) crystallization solution. The X-ray beam path and the gas bubbles are indicated by blue and yellow arrows, respectively. Scale bar indicates 250 μm.
Applsci 13 00717 g001
Figure 2. X-ray-induced radiation damage and temperature increase. (A) Time-lapse of the radiation damage for water, crystallization solution, and crystal suspension. (B) Two-dimensional profile of the temperature rising due to X-ray exposure. The gas bubbles corresponding to the radiation damage are indicated by yellow arrows. Scale bar indicates 250 μm.
Applsci 13 00717 g002
Figure 3. Temperature measurement in the vicinity of the X-ray interaction point on Zn, Cu and Al plates.
Applsci 13 00717 g003
Figure 4. Difference in temperature change according to the distance between the X-ray interaction point and the RTD.
Applsci 13 00717 g004
Figure 5. Temperature change measurement in the vicinity of the X-ray interaction point under repeated X-ray exposure and non-exposure for (A) 5 s and (B) 10 s.
Applsci 13 00717 g005
Disclaimer/Publisher’s Note: The statements, opinions and data contained in all publications are solely those of the individual author(s) and contributor(s) and not of MDPI and/or the editor(s). MDPI and/or the editor(s) disclaim responsibility for any injury to people or property resulting from any ideas, methods, instructions or products referred to in the content.

