Article

Temporal Variations of Sediment Provenance in a Karst Watershed, China

1
Key Laboratory of Geochemical Exploration, Institute of Geophysical and Geochemical Exploration, Langfang 065000, China
2
International Centre on Global-Scale Geochemistry, Langfang 065000, China
*
Author to whom correspondence should be addressed.
Appl. Sci. 2023, 13(2), 771; https://doi.org/10.3390/app13020771
Submission received: 5 December 2022 / Revised: 26 December 2022 / Accepted: 27 December 2022 / Published: 5 January 2023

Abstract

:
The environmental quality of the sediments in karst areas is a common concern, and it is of great significance to analyze the sources of the sediments. This study investigates the sources and its temporal variations of catchment sediments in a typical small karst watershed area. Toxic metal concentrations in the catchment area were monitored via three geochemical baseline projects in China. The sediment identification fingerprint tool (SIFT) was used to establish a geochemical model for tracing the main source contributions and its temporal variations of catchment sediments over the past 28 years (1992–2019). The catchment sediments in the small karst catchment area were mainly sourced from the background lithologies, among which limestone contributed the most, followed by dolomite, sand-shale, and mudstone; however, the anthropogenic lead–zinc tailings contributed the least. The contributions and temporal variations of each source were closely related to the lithology, topography, and landform, as well as the change in land-use and vegetation cover and the degree of rocky desertification. Moreover, the implementation of vegetation restoration and control of rocky desertification decreased the contributions of the upstream geological bodies, and the toxic metal content of the catchment sediment decreased accordingly. This study is of great significance for environmental governance in karst areas.

1. Introduction

In Southwest China, large-scale carbonates are distributed over a total area of 550,000 km2. Because carbonate rock is highly soluble, it commonly leads to the formation of karst areas. In most karst areas of Southwest China, the soil has been severely eroded, exposing the bedrock, resulting in rocky desertification. Studies suggest that karst areas suffer from many problems, such as soil erosion, frequent disasters, ecological system degradation, and land productivity decline [1,2,3].
During the weathering process, carbonates exposed in a surface karst area are easily broken down, and most toxic metals in the carbonates will be adsorbed by, and concentrated in, secondary clay minerals, resulting in elevated toxic metals in the surface karst area [4,5,6]. The low-temperature metallogenic domain of Southwest China, which forms a production base for metal minerals, is mostly located within a karst area. Extensive mining, disordered tailings, sewage, and waste gas emissions may introduce toxic metals into soil, water, and other environmental medium [7]. Therefore, karst areas are at risk of serious toxic metal pollution, due to multiple factors. Toxic metal pollution is not only irreversible, but also does not degrade over time, seriously endangering human health [8,9]. The unique geological setting of karst areas commonly results in toxic metal pollution being spread over a wide area. As such, it is difficult to manage and can result in great harm to inhabitants of the area [10].
In order to continuously monitor changes in the geochemical environment and elemental spatial distributions in China, three geochemical baseline projects were implemented in 1992–1996, 2008–2012, and 2015–2019, respectively. From 1992 to 1996, the Environmental Geochemical Monitoring Networks and Dynamic Geochemical Maps (EGMON) project was implemented, 845 topsoil samples were collected, and 39 geochemical indexes were analyzed [11,12]. In 2008–2012, the first round of China’s Geochemical Baselines project (CGB1) was conducted, and a nationwide geochemical baseline network was established with a total of 3382 surface samples collected in the catchment area. In 2015–2019, the second round of China’s Geochemical Baselines project (CGB2) was completed with 1589 representative surface samples collected. A total of 81 geochemical indexes were analyzed in CGB1 and CGB2 [13]. Accordingly, through the successful implementation of these three projects, China has realized the dynamic monitoring of national scale environmental changes to surface catchment sediments.
Catchment sediments may originate from multiple sources, reflecting changes in natural sources and anthropogenic activities. Studies on the provenance of fine-grained sediments began in the 1970s [14]. An unmixing model was introduced to quantitatively calculate the contributions of different sources. Many physical, chemical, and biological properties of sediments have been used as tracers, including color and grain size, clay mineral characteristics, the characteristics of magnetic minerals, geochemical indicators, radioisotopes, cosmogenic radionuclides, and soil enzymes and pollens [15,16,17].
Geochemical tracing has been used to determine the source and evolution of elements, minerals, and rocks in geological and geochemical processes, and is an important means of exploring material sources and revealing geochemical processes. Elemental geochemical tracing is based on the varying proportions and properties of elements in different geological bodies [18]. In the process of rock weathering, alkali and alkaline earth metal compounds that are more reactive, such as K2O and Na2O, are easily released to the dissolved phase, while other elements or oxides that are more stable such as SiO2, TiO2, Al2O3, and Fe2O3, the high field strength elements Nb, Ta, Zr, Hf, and rare earth elements, behave conservatively. These conservative elements and oxides can reflect the characteristics of parent rock weathering products, which are often used as geochemical tracers [19,20,21,22,23].
This study examined a typical small karst catchment area in Guangxi Province as an example. Catchment sediment samples were collected from the same site as part of the three geochemical baseline projects (EGMON, CGB1, and CGB2). These samples likely reflect the temporal variations in the catchment sediments. In order to trace the sources of the sediments, representative rock and soil profile samples were collected from the upstream catchment, and geochemical indexes were calculated for each one. Accordingly, the dynamic variations of toxic metal concentration in the small karst catchment were studied. Moreover, a geochemical provenance model was established for the catchment, using the Sediment Identification Fingerprint Tool (SIFT) [24] to explore temporal variations of sediment provenance in a typical small karst catchment area over the past 28 years (1992–2019). In this research, temporal variations of sediment provenance in a karst watershed supply for a long period of time was explored, aiming to provide information on the sources and changing trends of sediments and a geochemical basis for the prevention and controlling of toxic metal pollution in Guangxi.

2. Methodology

2.1. Study Area

The Huanjiang River catchment, upstream of the Pearl River, is located between the Yunnan-Guizhou Plateau and the Guangxi hilly region and includes parts of Libo County and Congjiang County of Guizhou Province, as well as Huanjiang County, Jinchengjiang district, and Yizhou City of Guangxi Province, with a total area of 2819.88 km2 (Figure 1). The study area has a transitional monsoon climate, with the region ranging from south subtropical to middle subtropical zone. There are various geomorphic features including mountains, hills, peak forest valleys, and feather shaped valleys. The strata in the study area are mainly Carboniferous and Devonian, with a small proportion of Lower Cambrian, Sinian, and Permian units. The main lithologies are limestone, dolomite, sand shale, and mudstone. Moreover, the study area is known as the hometown of nonferrous metals in China, as it contains many lead-zinc deposits in the upstream region, which may be the potential toxic metal sources.

2.2. Sampling and Analysis Methods

2.2.1. Sampling

In view of recognizing the need of global-scale geochemical baselines against which can quantify future human-induced or natural changes to the chemistry of the Earth, based on Global Reference Network grid sampling of the Earth’s surficial materials (Darnley et al., 1995) [25], China initiated the Environmental Geochemical Monitoring Networks (EGMON) project from 1992 to 1996 [9]. Most of the samples were collected in 1995. Alluvia soil samples formed by flood sediments were collected from 529 locations in eastern plains of China and steam sediment samples from 314 locations in western mountainous terrains. The sampling locations were mostly located on the floodplains of large-catchment basins ranging from 1000 to 10,000 km2.
The first China Geochemical Baselines Project (CGB1), as a part of the Global Geochemical Baselines project [25], was carried out from 2008 to 2014 [13,26], most samples were collected in 2010–2012. China mainland was divided into many grids, the size of which is 80 km × 80 km, and two typical alluvial soil samples were collected from each grid. Sample locations are designed at outlet plains of drainage catchments ranging in area from about 1000 to 5000 km2, with most being 2000–3000 km2 in area. Finally, alluvial soils formed by drainage sediments were collected from 3382 locations according to A Global Reference Networks (GRN) grid cell in the whole mainland China (9.6 million km2).
The second China Geochemical Baselines Project (CGB2), as a part of the Global Geochemical Baselines project [25], was carried out from 2015 to 2019 [13,26]. Samples were collected based on the same grids as CGB1. Alluvial soils formed by drainage sediments were collected from 1741 locations from the typical catchments.
Surface samples ranging from 0 to 25 cm were collected, and three sub-samples were collected at each sampling site for combination, which the litter was scraped. The three sites were roughly equilateral triangles, and each of the two sites was within 50 m (usually within 5 m) apart. The weight of each combined sample was about 5 kg. The alluvial soil samples studied in this paper are located at the outlet of watershed, which are marked by triangles in the Figure 1.
The temporal change of toxic metal concentrations may increase or decrease, a major issue is whether these changes are detectable by soil monitoring taking. Sampling materials and monitoring sites have to be indicate that contaminations can build quickly enough to be revisited on a second and subsequent occasions [27]. The sample media from the EGMON and the CGB are the same, both of them are alluvial soils formed from catchment sediments (overbank/floodplain/delta sediments) by river transportation. All runoff materials are transported to the same outlet or plains to form soils through the drainage network channels. The transported samples collected from the outlet of large drainage catchments are excellent media representing the natural background and anthropogenic emission. Contamination in catchment sediments can build relatively quickly. Pollution comes from diffuse sources such as natural weathering, mining, industries, residents, pesticides and fertilizers. Rain falling on the land picks up pollutants into watercourses and deposited in the low-reach plains or overbank or fluvial terrace.
In June and July of 2020, 6 profile samples (profile YDK, LMG, XRD, BX, SHL and DA in Figure 1) as well as lead-zinc tailings (BS in Figure 1) were collected from upstream of the Huanjiang River. The sampling sites of the soil profiles are shown as black circles in Figure 1. In the field, typical representative profile samples were collected according to the color of profiles, cracks or joints, particle morphology and physical properties, which mainly includes regolith, saprock, weathered rock and bedrock.
The bedrock of profile YDK is a thick layer of grayish-white dolomite, and the height of the profile is about 3 m. A total of 8 profile samples were collected. The bedrock of profile LMG is composed of limestone. The profile is about 4.2 m, a total of 7 samples were collected. The bedrock of profile XRD is gray-black limestone mixed with argillaceous limestone. The profile is 5 m high, a total of 6 representative profile samples were collected. The bedrock of profile BX is a gray-black dolomitic limestone with a height of 2 m and 5 samples were collected. The bedrock of profile SHL is a gray-black thin layer mudstone mixed with siliceous rocks and shale with a height of 2.3 m and a total of 6 samples were collected. Profile DA consists of gray-black mudstone and sandstone with a height of 2.6 m and 7 samples were collected.

2.2.2. Laboratory Analysis

The samples were air-dried and passed through a 10 mesh (2 mm) nylon sieve to remove stones, plant roots and litter and homogenised, each raw sample is split into two sub-samples, one by sieving to less than 10 mesh (<2 mm) for laboratory analysis and the other for storage and future investigation. A sieved sample is ground to less than 200 mesh (<74 μm) in an agate mill for laboratory analysis.
An aliquot of 0.25 g was weighed and placed into test tube and a 10 mL HF, 5 mL HNO3, 2 mL HClO4 was added for degestion the samples. The test tube was heated in a boiling water bath until dryness. After cooling, 8 mL of 1:1 aqua regia [aqua regia (1 HNO3 + 3 HCl): pure water = 1:1 vol.] was added for decompose the residue. Then the solution was diluted with 2% HNO3 [28]. The analysis method and detection limit (DL) are listed in Table 1. The accuracy of the method was assessed by analysing the soil reference materials (GSS-1, GSS-2, GSS-17, GSS-19, GSS-25, GSS-26, GSS-27) 34 times, respectively, and the ∆lgC is less than 0.10 (∆lgC =|lgCi − lgCs|, Ci is the average of measured values; Cs is the standard reference value). Detailed sample collection and analysis methods were described in [11,12,13].

2.3. Catchment Sediment Provenance Discrimination Method

The sediment source provenance method was proposed based on the assumption that tracers are measurable, stable, and representative, and can provide robust estimates of different sediment sources [29,30,31].
Collins et al., 2018 developed SIFT using the software R; the main processes involved in implementing this method are as follows: (1) setting of model parameters; (2) selection of tracers with strong identification abilities using initial discriminant analysis, evaluation of misclassified samples, tracer conservatism, and the percentage difference of tracers for each source evaluation; (3) linear discriminant analysis to select combinations of three tracers (basic, conservative, and high variability tracers) based on their conservatism and discriminant abilities; (4) creation of a diagram of two maximum discriminant functions for tracers from different sources and sediment samples, followed by testing of the SIFT for accuracy using virtual mixing samples, testing the model weights to improve the accuracy, evaluating their goodness-of-fit, and rejecting those with poor results; (5) evaluating the results of sediment source provenance analysis and the associated model uncertainty, and finally combining the results of all acceptable models to give the contributions of each source. For a detailed explanation of the model, see Pulley and Collins 2018.

3. Results

3.1. Properties of Catchment Sediments

The catchment sediment samples collected in different periods were all very fine-grained and brownish-yellow in color. The CGB1 and CGB2 catchment sediment samples had pH values of 4.83 and 4.64, respectively (pH was not measured in EGMON). The enrichment factor (EF) of toxic metals of catchment sediments (Figure 2) were calculated using the mean contents of toxic metals in catchment sediments in China [32] as denominator, with Al as the reference element to eliminate the grain-size effect. Concentrations of Cr in all three periods were below the background level, while Ni and Cu were depleted and other elements, including As, Cd, Hg, Pb, and Zn, were enriched. In EGMON (1992–1996), Hg and Cd were enriched to a relatively high level with enrichment factors of 3.3 and 5.4, respectively. In CGB1 (2008–2012), Pb, Hg, and Cd showed strong enrichment and in CGB2 (2015–2019), Hg and Cd were moderately enriched. In general, the environmental quality of soil in the study area, in terms of toxic metals, was the best during 1992–1996, followed by 2015–2019, and the worst during 2008–2012.

3.2. Properties of Profile Samples

The LMG, BX, and XRD profiles were situated in limestone. The LMG profile comprises 7 samples, including 4 rock and 3 soil samples, BX comprises 2 rock and 3 soil samples, and XRD comprises 3 rock and 3 soil samples. The rocks were gray-black, while the soils were red in color with a mean pH of 4.52. YDK is a dolomitic profile, comprising 4 soil and 4 rock samples. In YDK, the rocks were gray-white, and the soils were yellow brown with a mean pH value of 4.79. The SHL and DA profiles were taken from mudstone and sand-shale, respectively. SHL comprises 4 soil and 2 rock samples, while DA comprises 3 soil and 4 rock samples. The rocks were gray-black and the soils were red with a mean pH value of 6.4. The statistical parameters of toxic metals were listed in Table 2.

3.3. Sediment Provenance Process

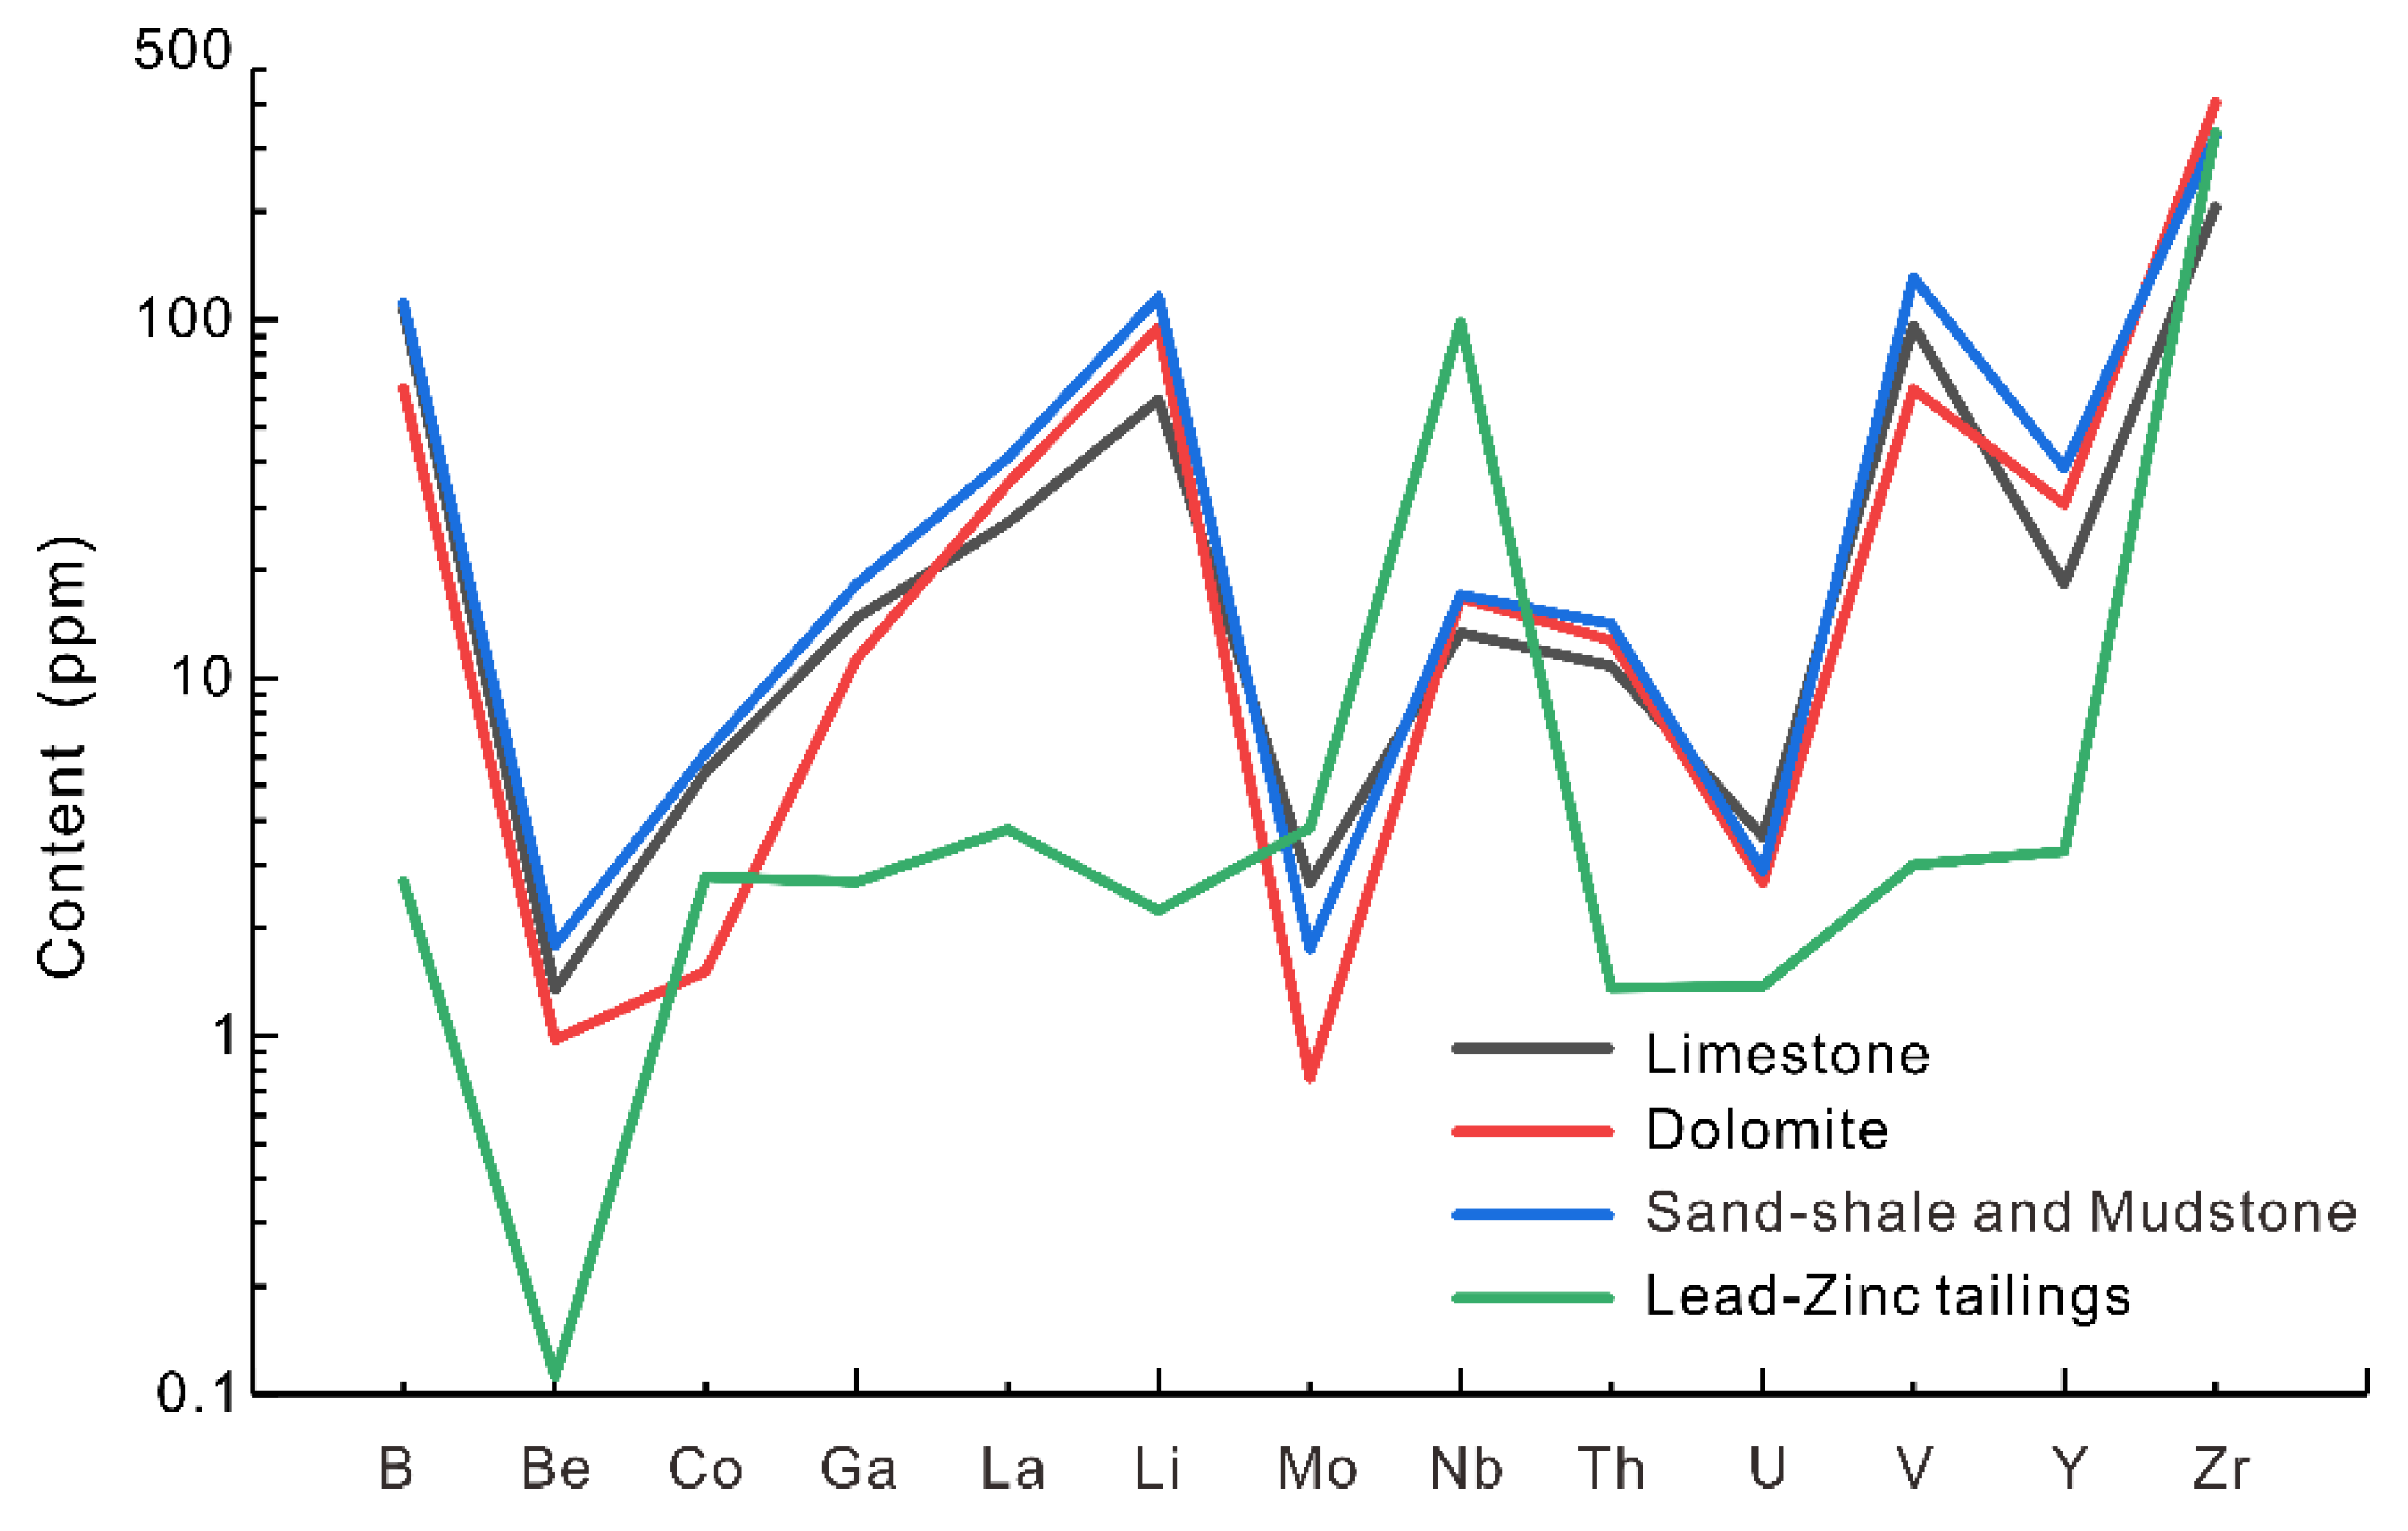
From the geological background of the study area, four major sources (limestone, dolomite, sand-shale and mudstone, and lead-zinc tailings) were identified as possible contributors of catchment sediments. Based on the elements/oxides identified in the sources, and those measured in all three baseline projects, 28 geochemical indexes were selected as tracers, namely: Al2O3, B, Ba, Be, CaO, Ce, Co, Cr, Cu, Fe2O3, Ga, La, Li, MgO, Mn, Mo, Nb, Ni, P, Rb, S, SiO2, Th, Ti, U, V, Y, and Zr. Through a series of evaluations described in Section 2.2, 16 elements (Al, B, Be, Co, Ga, La, Li, Mo, Nb, Ni, Si, Th, U, V, Y, Zr) were identified as conservative tracers. The mean contents of geochemical tracers in the four major sources (limestone, dolomite, sand-shale and mudstone, and lead-zinc tailings) are shown in Figure 3. The average element concentration characteristics of tracers in the lead-zinc tailings (shown in green line) were significantly different from others, while the limestone, dolomite, and sand-shale and mudstone as background lithologies exhibited relatively similar tracer variations trends, with some obvious differences in typical element contents.
The selected tracers exhibited an identification accuracy of 100% by testing the SIFT for accuracy using virtual mixing samples (step 4 as described in 2.2), so the geochemical tracers were used for sediment provenance. Because there were slight differences between each fitting result, the average result of 5 fittings was used as the final result of this research. The goodness-of-fit of the model reached 93.5%, indicating that the selected tracers can indeed trace the sediment sources with high reliability. Figure 4 shows the contributions of individual tracers to the model’s goodness-of-fit. Li, Co, Nb, Al2O3, and Be were the major contributors to the model’s goodness-of-fit, with the sum of these accounting for more than 50% of all tracer contributions.

3.4. Sediment Provenance Results

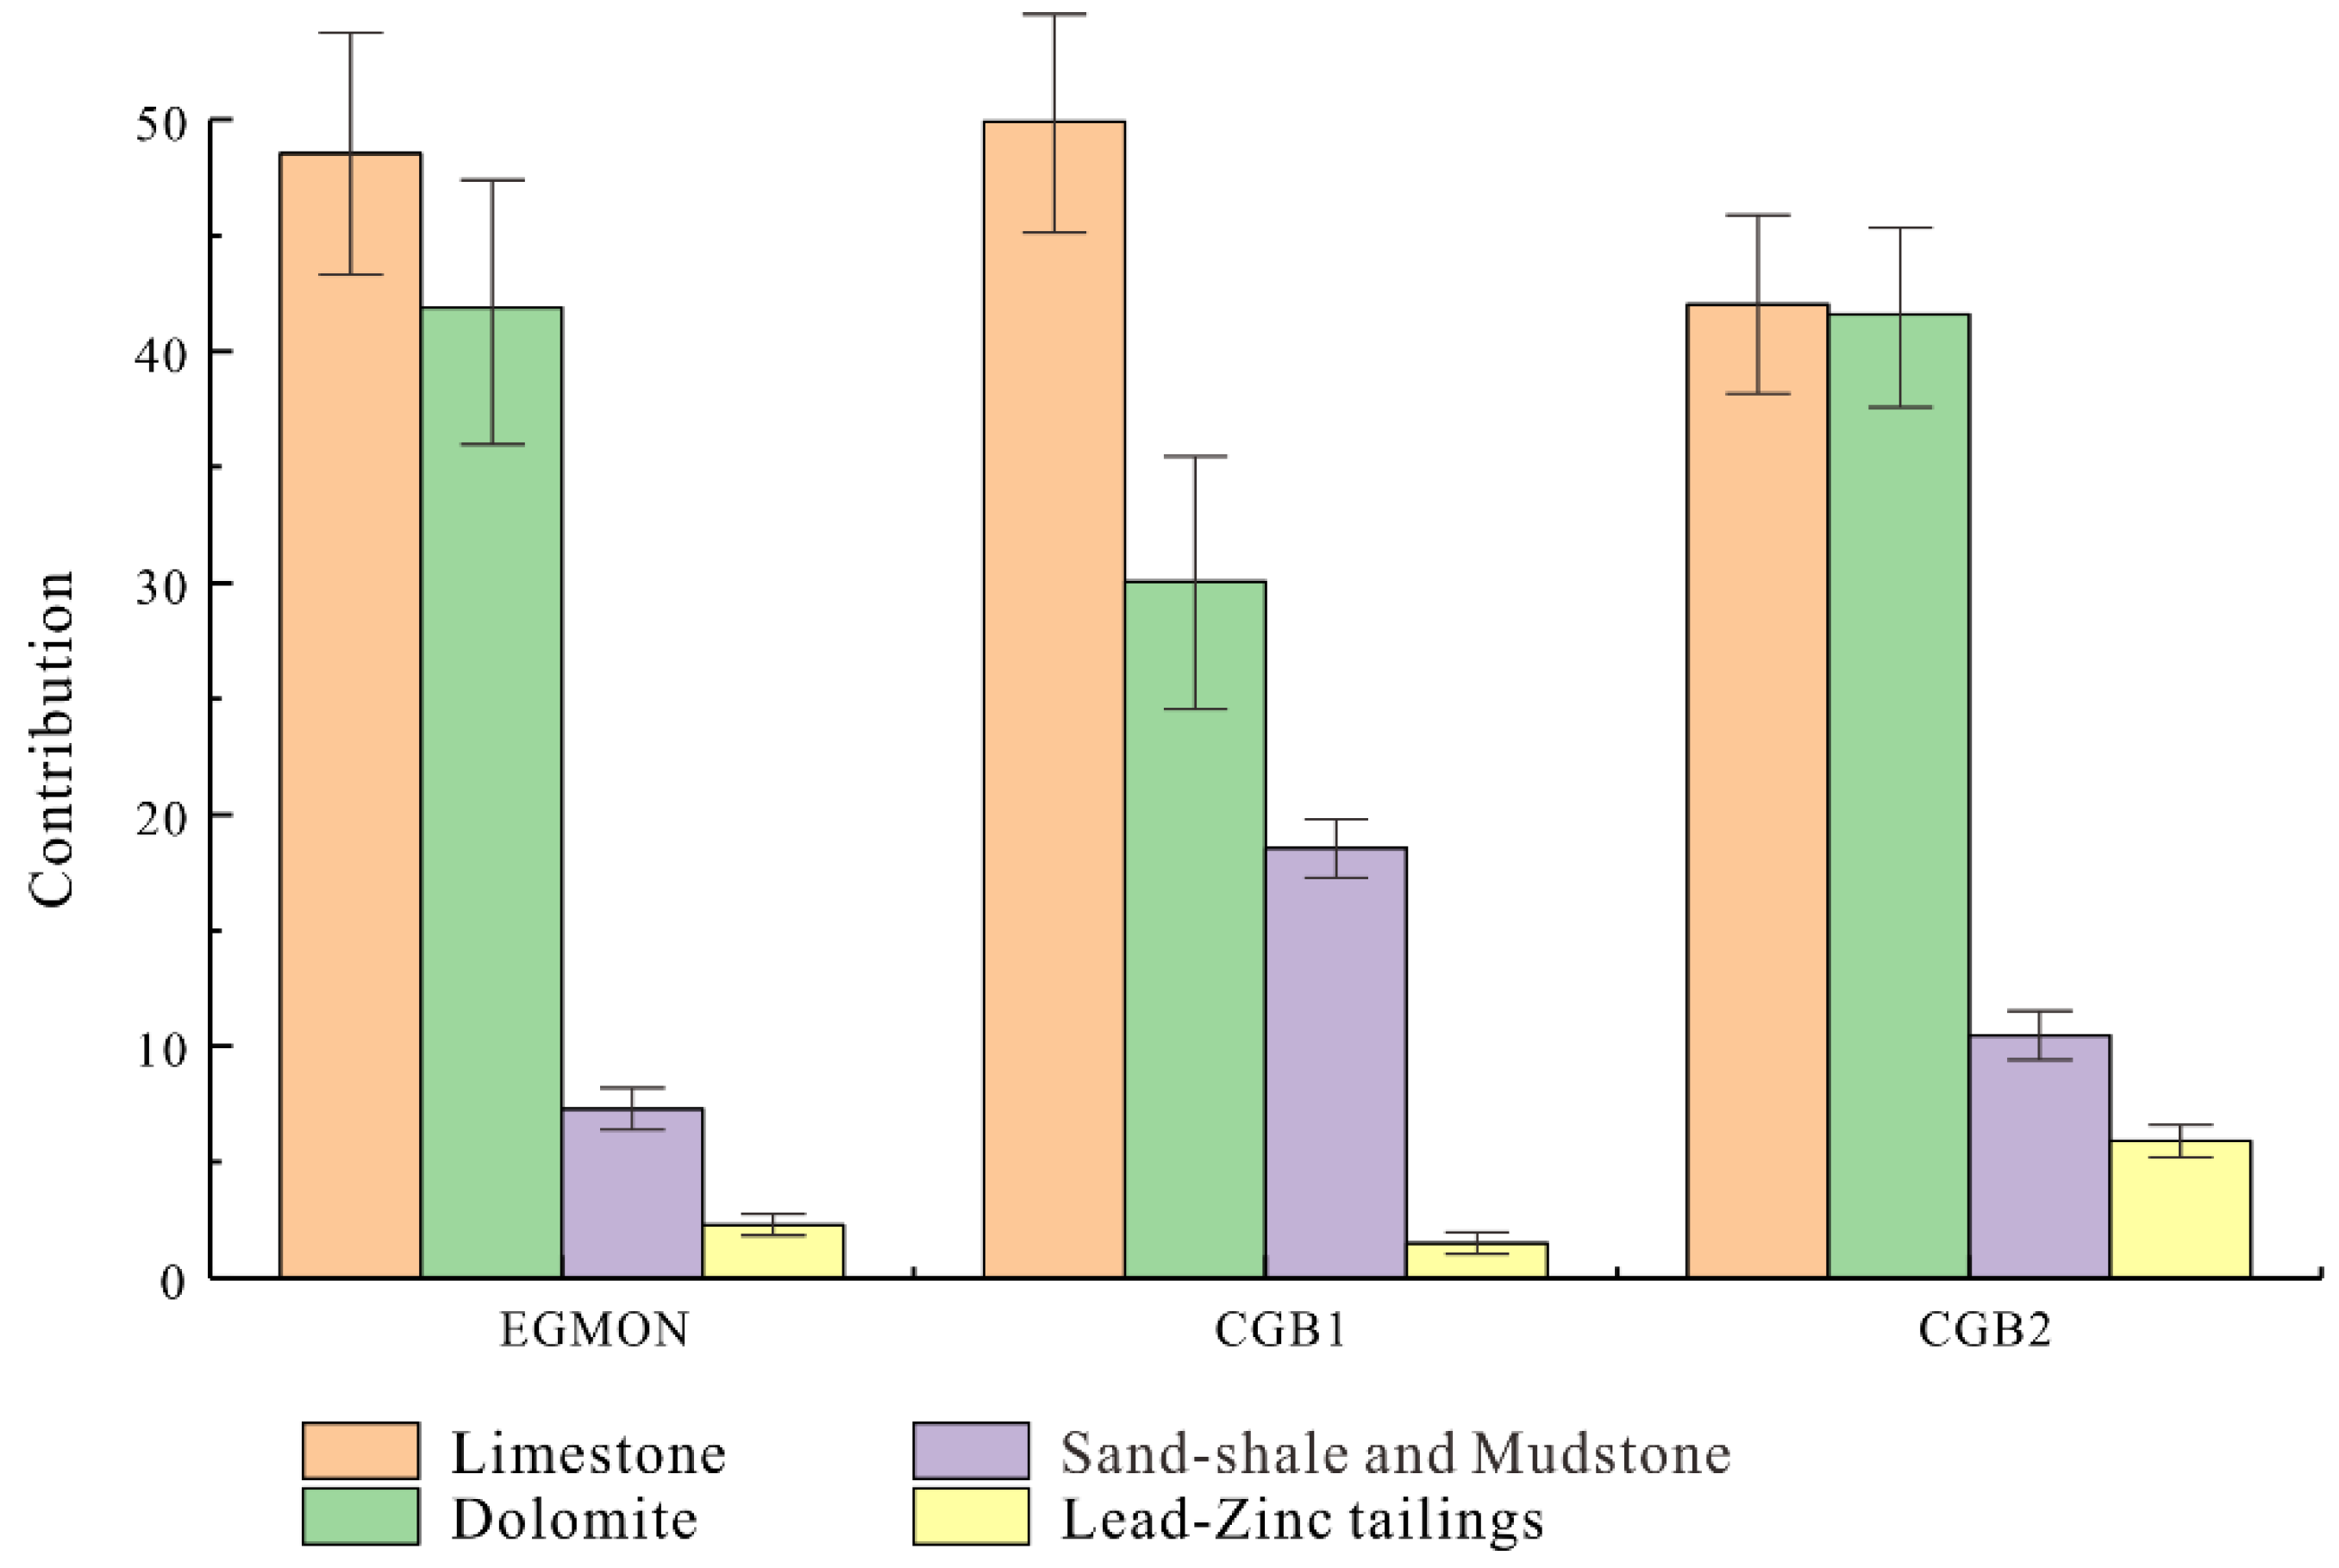
The contributions of the four sources to the catchment sediment samples, in each of the baseline project periods, were shown in Figure 5. Overall, the contributions of limestone and dolomite weathering were the most significant in the three periods, and the sum of their contributions was more than 80%. In EGMON, the contributions of limestone and dolomite were 48.5% and 41.9%, respectively, 49.9% and 30% in CGB1, and 42% and 41.6% in CGB2. By comparison, in EGMON and CGB1, the contributions of limestone was significantly higher than that of dolomite, although the contributions of the two were almost equal in CGB2. The contributions of limestone and sand-shale and mudstone increased between EGMON and CGB1, and then decreased from CGB1 to CGB2, while the opposite trend was exhibited by dolomite. The contributions of lead-zinc tailings pollution (5.9%) reached its highest level in CGB2. Since the contributions from all sources add up to 100%, the reduction of background lithology contributions leads to an increase in the contributions of lead-zinc tailings from CGB1 to CGB2. However, the results show that catchment sediments in the catchment mostly originated from regional background lithologies, while the contributions of lead-zinc tailings was relatively small.

4. Discussion

Ref. [33] studied the spatial correlations between lithology and rocky desertification in the karst area of Guizhou, and found that the degree of rocky desertification was obviously correlated with lithology, but did not consider the influence of human factors. The incidence of rocky desertification is highest for continuous carbonate rock, and the degree of desertification is serious [34]. With an increase in argillaceous content of carbonate rock, the percentage of acid-insoluble content in rock increases, the rate of soil formation speeds up, the occurrence rate of rocky desertification declines, and the degree of rocky desertification is gradually lessened. Continuous limestone bodies are the most prone to rocky desertification, followed by dolomite, and the sand-shale and mudstone units [35].
Relevant studies have been carried out on the temporal and spatial variation characteristics of rocky desertification in Guangxi [36,37]. The largest area of rocky desertification occurred in Hechi, Guangxi Province in 2002, the second in 1988, and the smallest in 2015. In the past 32 years, the area of rocky desertification in Guangxi exhibited an increasing trend, followed by a decreasing trend [38]. This study shows that the contribution of background lithologies (limestone, dolomite, sand-shale and mudstone) to the entire catchment area was the highest in CGB1 (2008–2012), followed by EGMON (1992–1996) and CGB2 (2015–2019), which may closely related to the degree of rocky desertification in the region during these periods. Therefore, the results of this study could also be interpreted as indicating that, after years of governance in China, the degree of rocky desertification in karst areas has been greatly reduced. In the last ten years, the contribution of background geology to the sediments in the catchment area has decreased.
Generally, limestone is very easily weathered compared to other rock types [39,40]. More importantly, as shown in Figure 1, most limestone in this region is located in mountainous areas with strong hydrodynamic conditions, where a large amount of sediment will be carried downstream by water flow. Limestone therefore makes the largest contribution to the catchment sediments. In addition, 45% of the total study area is comprised of limestone (Figure 1), which certainly leads to a greater contribution. The second largest contributor is dolomite, whose weathering capacity is lower than that of limestone but higher than that of sand-shale and mudstone. Although dolomite accounts for only 12% of the total study area, it occupies the steepest areas with the strongest hydrodynamic conditions; thus, its contribution is relatively high. Although sand-shale and mudstone occupy about 45% of the study area, they are more resistant to weathering. Moreover, as can be seen from the topographic map (Figure 1), these lithologies are located in a region with relatively flat terrain and poor hydrodynamics, so they contribute less to the catchment sediments than other rock types in the catchment.
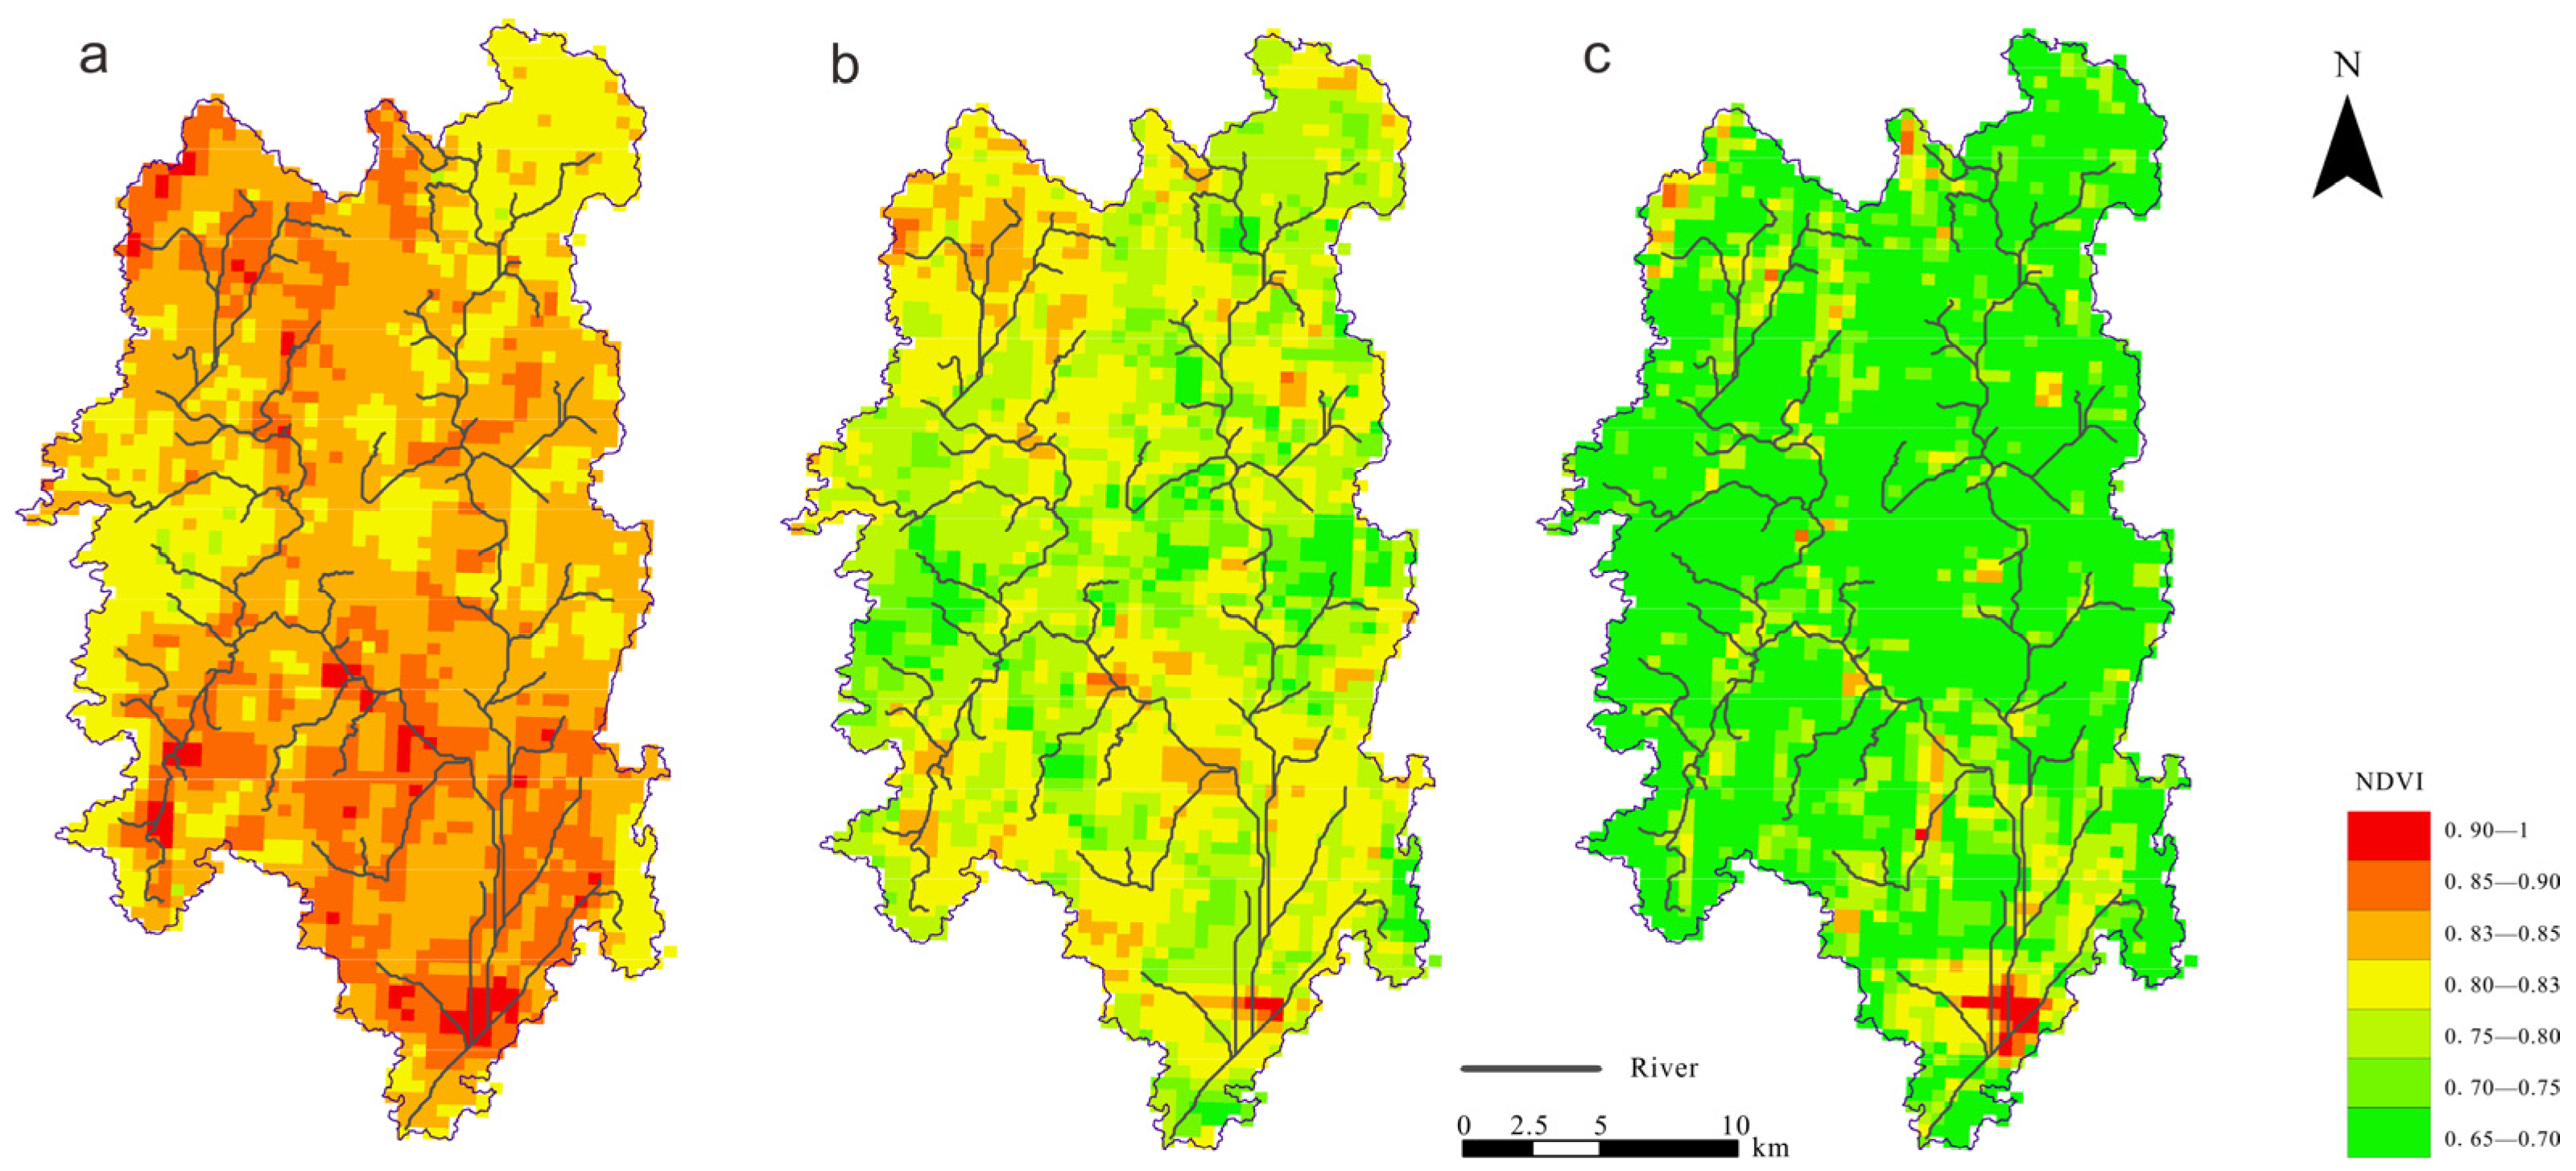
In addition to the background geology and geomorphology already discussed, land-use/vegetation change also plays an important role in the source changes of catchment sediments in karst areas. [41] studied the spatial and temporal variation of vegetation in the Guangxi Xijiang River catchment from 2007 to 2016, using MODIS EVI data, and found that the elevated vegetation index (EVI) generally declined during 2007–2011. One reason for this trend may be that during this time period, many severe natural disasters caused serious destruction of vegetation and crops, resulting in lower vegetation coverage. The EVI increased during 2011–2016, mostly due to vegetation protection measures such as afforestation and rocky desertification control projects in Guangxi (as shown in Figure 6). While human activities have little impact on high-altitude and steep terrain, soil loss in low-lying areas is vulnerable to changes caused by human activities involving land-use and vegetation [42]. Therefore, the contributions of the sand-shale, mudstone, and limestone, which are situated in relatively flat and moderately steep terrain, changed consistently with the land-use/vegetation in the study area, but the contribution of dolomite in the steep terrain areas did not. Consequently, the changes in sediment contributions between different time periods are closely correlated with the change in local land-use and vegetation cover.
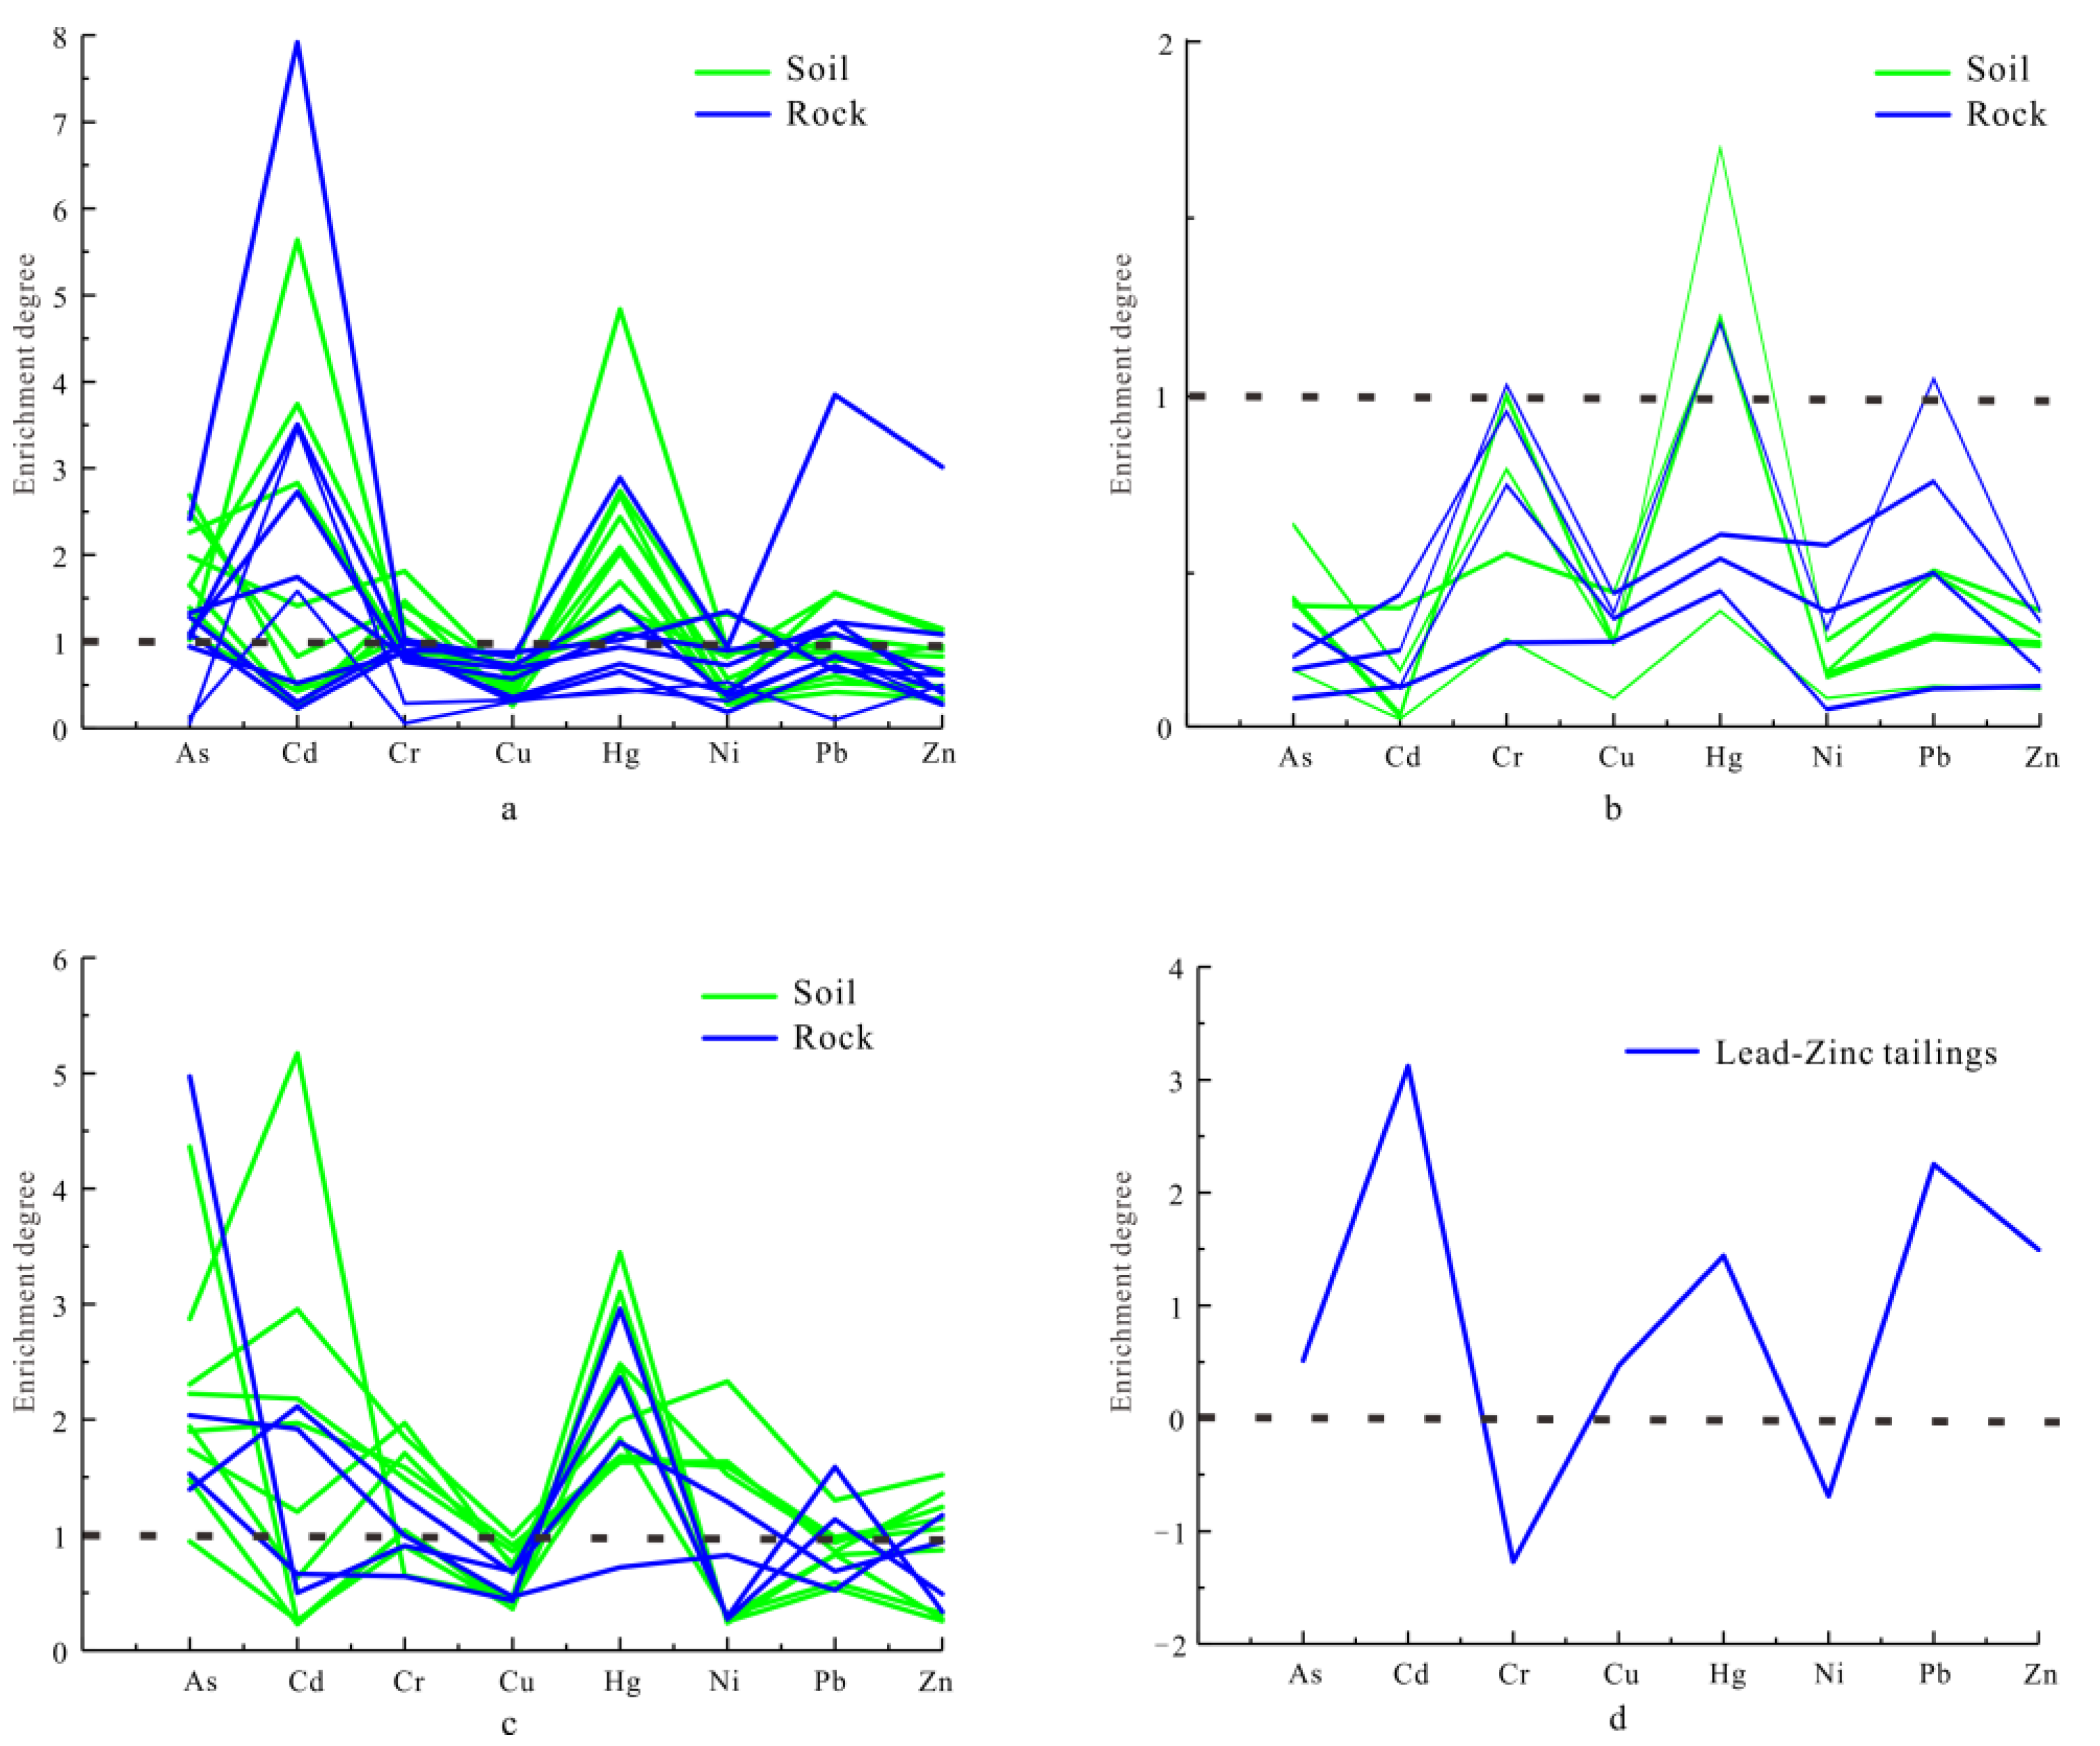
Karst areas are facing another environmental problem, that of elevated toxic metals [4,43]. Many studies have examined the status of toxic metal pollution in karst areas and its possible causes [44,45]. In this study area, all catchment sediment samples from the three projects were found to be enriched in Cd, Hg, Pb, and Zn, with a clear order in the degree of toxic metal enrichment: CGB1 > CGB2 > EGMON. Catchment sediment samples from EGMON showed the most enrichment (in Hg, Cd, As, and Zn) followed by CGB1 samples, enriched in Pb, Cd, Hg, As, and Zn, while CGB2 samples contained elevated Hg, Cd, Pb, As, and Zn. Figure 6 shows the degree of toxic metal enrichment in each source lithology (relative to the average contents of elements in Chinese catchment sediments). Limestone is significantly enriched in Cd, Pb, Zn, Hg, and As (Figure 7), while limestone regolith is significantly enriched in Hg, Cd, and As. The dolomite regolith was only slightly enriched in Hg. Sand-shale and mudstone were significantly enriched in Hg, As, Cd, Ni, Cr, and Pb, while the regolith of these lithologies showed concentrated Hg, As, and Cd, with moderately-concentrated Cr, Ni, and Zn. Lead-zinc tailings were significantly enriched in Cd, Pb, Zn, and Hg, while As and Cu were only slightly concentrated in these sediments.
The background geology contributes more than 95% of the catchment sediments; in contrast, lead-zinc tailings contribute only a small amount. Therefore, the elevated toxic metals in the catchment sediments of the study catchment mainly originate from the contributions of the background geology. In addition, while the highest toxic metal content was found in CGB1 samples the contribution of lead-zinc tailings to CGB1 catchment sediments was the smallest, which also indicates that lead-zinc tailings were not the main source of toxic metals in the catchment sediments of the study area. Furthermore, lead-zinc tailings are rich in Cu, but the catchment sediments from the different periods were all depleted in Cu, implying that background lithologies were the more important sources of toxic metals.

5. Conclusions

The catchment sediments in the small karst catchment area mainly originate from the background lithologies, of which limestone contributes the most, followed by dolomite, sand-shale, and mudstone. By comparison, anthropogenic lead–zinc tailings contribute the least to catchment sediments. The limestone contributed the most to catchment sediments collected during CGB1(2008–2012), followed by EGMON (1992–1996) and CGB2 (2015–2019). Sand-shale and mudstone contributed the most to CGB1 sediment samples, followed by those of CGB2 and EGMON. Dolomite contributed the least to CGB1 samples. The contributions and its temporal variations of each source were closely related to the background lithology, topography and landform, the change in land-use and vegetation cover, and the degree of rocky desertification. Our study shows that in the past ten years, through the implementation of vegetation restoration and control measures, the degree of rocky desertification in the karst areas of China has been significantly reduced and soil erosion has been alleviated, which resulted in decreased toxic metal concentrations in the catchment area.

Author Contributions

Conceptualization, M.T. and X.W.; methodology, M.T.; software, M.T. and Y.Q; validation, M.T., X.W. and Y.Q.; formal analysis, D.L. and Q.C.; investigation, D.L., Q.C., H.L. and B.Z.; resources, D.L., Q.C., H.L. and W.W.; data curation, W.W.; writing—original draft preparation, M.T.; writing—review and editing, M.T. and Y.Q.; visualization, M.T. and W.W.; supervision, X.W.; project administration, X.W.; funding acquisition, X.W. All authors have read and agreed to the published version of the manuscript.

Funding

This work was supported by the National Natural Science Foundation (41907290), Surplus Funds of Institute of Geophysical and Geochemical Exploration (JY201909), National Nonprofit Institute Research Grant of IGGE (AS2022P03) and the Global Geochemical Baselines Project (DD20190450, DD 20160116, Sinoprobe-04). Comments by anonymous reviewers considerably improved the paper.

Institutional Review Board Statement

Not applicable.

Informed Consent Statement

Not applicable.

Data Availability Statement

Not applicable.

Conflicts of Interest

The authors declare no conflict of interest.

References

  1. Xiong, K.; Yin, C.; Ji, H. Soil erosion and chemical weathering in a region with typical karst topography. Environ. Earth Sci. 2018, 77, 500. [Google Scholar] [CrossRef]
  2. Cao, Z.; Zhang, Z.; Zhang, K.; Wei, X.; Yang, Z. Identifying and estimating soil erosion and sedimentation in small karst watersheds using a composite fingerprint technique. Agric. Ecosyst. Environ. 2020, 294, 106881. [Google Scholar] [CrossRef]
  3. Zcan, A.U.; Ayta, B. Effects of soil erosion on doline lake degradation within karst landscapes: Bakkal Lake, Turkey. Environ. Monit. Assess. 2020, 192, 140. [Google Scholar]
  4. Wen, Y.; Li, W.; Yang, Z.; Zhuo, X.; Ji, J. Evaluation of various approaches to predict cadmium bioavailability to rice grown in soils with high geochemical background in the karst region, southwestern china. Environ. Pollut. 2020, 258, 113645. [Google Scholar] [CrossRef]
  5. Sullivan, P.L.; Macpherson, G.L.; Martin, J.B.; Price, R.M. Evolution of carbonate and karst critical zones. Chem. Geol. 2019, 527, 119–223. [Google Scholar] [CrossRef]
  6. Zhang, Y.; Long, Y.; Zhang, X.; Pei, Z.; Cheng, P. Using depression deposits to reconstruct human impact on sediment yields from a small karst catchment over the past 600 years. Geoderma 2020, 363, 114168. [Google Scholar] [CrossRef]
  7. Hasan, O.; Miko, S.; Ilijani, N.; Brunovi, D.; Peh, Z. Discrimination of topsoil environments in a karst landscape: An outcome of a geochemical mapping campaign. Geochem. Trans. 2020, 21, 1. [Google Scholar] [CrossRef] [Green Version]
  8. Hao, L.B.; Tian, M.; Zhao, X.Y.; Zhao, Y.Y.; Lu, J.L.; Bai, R.J. Spatial distribution and sources of trace elements in surface soils, Changchun, China: Insights from stochastic models and geostatistical analyses. Geoderma 2016, 273, 54–63. [Google Scholar] [CrossRef]
  9. Zhao, L.; Hou, R. Human causes of soil loss in rural karst environments: A case study of Guizhou, China. Sci. Rep. 2019, 9, 3225. [Google Scholar] [CrossRef] [PubMed]
  10. Liu, C.Q. Biogeochemical Processes and Surface Material Cycle: Erosion and Biogenic Element Cycle in Southwest Karst Watershed; Science Press: Beijing, China, 2007; (In Chinese with English abstract). [Google Scholar]
  11. Xie, X.J.; Cheng, H.X. The suitability of floodplain sediment as a global sampling medium: Evidence from China. J. Geochem. Explor. 1997, 58, 51–62. [Google Scholar] [CrossRef]
  12. Xie, X.J.; Ma, X.Z.; Ren, T.X. Geochemical mapping in China. J. Geochem. Explor. 1997, 60, 99–113. [Google Scholar]
  13. Wang, X.Q. China geochemical baselines: Sampling methodology. J. Geochem. Explor. 2015, 148, 25–39. [Google Scholar] [CrossRef]
  14. Walling, D.E.; Peart, M.R.; Oldfield, F.; Thompson, R. Suspended sediment sources identified by magnetic measurements. Nature 1979, 281, 110–113. [Google Scholar] [CrossRef]
  15. Collins, A.L.; Pulley, S.; Foster, I.D.L.; Gellis, A.; Porto, P.; Horowitz, A.J. Sediment source fingerprinting as an aid to catchment management: A review of the current state of knowledge and a methodological decision-tree for end-users. J. Environ. Manag. 2017, 194, 86–108. [Google Scholar] [CrossRef] [PubMed] [Green Version]
  16. Gaspar, L.; Blake, W.H.; Smith, H.G.; Lizaga, I.; Navas, A. Testing the sensitivity of a multivariate mixing model using geochemical fingerprints with artificial mixtures. Geoderma 2019, 337, 498–510. [Google Scholar] [CrossRef]
  17. Tiecher, T.; Ramon, R.; Laceby, J.P.; Evrard, O.; Minella, J.P.G. Potential of phosphorus fractions to trace sediment sources in a rural catchment of southern brazil: Comparison with the conventional approach based on elemental geochemistry. Geoderma 2019, 337, 1067–1076. [Google Scholar] [CrossRef]
  18. Yan, T.T.; Wu, X.; Quan, Y.K.; Gong, Q.J.; Li, X.L.; Wang, P. Heredity, Inheritance and Similarity of Element Behaviors Among Parent Rocks and Their Weathered Products: A Geochemical Lithogen. Geoscience 2018, 3, 453–467, (In Chinese with English abstract). [Google Scholar]
  19. Gong, Q.; Deng, J.; Yang, L.; Zhang, J.; Wang, Q.; Zhang, G. Behavior of major and trace elements during weathering of sericite–quartz schist. J. Asian Earth Sci. 2011, 42, 1–13. [Google Scholar] [CrossRef]
  20. Tian, M.; Wang, X.; Nie, L.; Zhang, C. Recognition of geochemical anomalies based on geographically weighted regression: A case study across the boundary areas of China and Mongolia. J. Geochem. Explor. 2018, 190, 381–389. [Google Scholar] [CrossRef]
  21. Tian, M.; Hao, L.B.; Zhao, X.Y.; Lu, J.L.; Zhao, Y.Y. The study of stream sediment geochemical data processing by using k-means algorithm and centered logratio transformation—An example of a district in Hunan, China. Geochem. Int. 2018, 56, 1233–1244. [Google Scholar] [CrossRef]
  22. Gong, Q.; Liu, N.; Wu, X.; Yan, T.; Albanese, S. Using regional geochemical survey data to trace anomalous samples through geochemical genes: The tieshanlong tungsten deposit area (southeastern china) case study. J. Geochem. Explor. 2020, 219, 106637. [Google Scholar] [CrossRef]
  23. Gong, Q.; Yan, T.; Wu, X.; Li, R.; Wang, X.; Liu, N.; Li, X.; Wu, Y.; Li, J. Geochemical gene: A promising concept in discrimination and traceability of geological materials. Appl. Geochem. J. Int. Assoc. Geochem. Cosmochem. 2022, 136, 105133. [Google Scholar] [CrossRef]
  24. Pulley, S.; Collins, A.L. Tracing catchment fine sediment sources using the new sift (sediment fingerprinting tool) open source software. Sci. Total Environ. 2018, 635, 838–858. [Google Scholar] [CrossRef]
  25. Darnley, A.G.; Björklund, A.; Bölviken, B.; Gustavsson, N.; Koval, P.V.; Plant, J.A.; Hall, G.E.M. A Global geochemical database for environmental and resource management. Final report of IGCP Project 259. Earth Sci. 1995, 19, 122. [Google Scholar]
  26. Wang, X.Q.; Zhou, J.; Xu, S.F.; Chi, Q.H.; Nie, L.S.; Zhang, B.M.; Yao, W.S.; Wang, W.; Liu, H.L.; Liu, D.S.; et al. China soil geochemical baselines networks: Data characteristics. Geol. China. 2016, 43, 1469–1480. [Google Scholar]
  27. Lark, R.M.; Bellamy, P.H.; Rawlins, B.G. Spatio-temporal variability of some metal concentrations in the soil of eastern England, and implications for soil monitoring. Geoderma 2006, 133, 363–379. [Google Scholar] [CrossRef]
  28. Zhang, Q.; Bai, J.; Wang, Y. Analytical scheme and quality monitoring system for China Geochemical Baselines. Earth Sci. Front. 2012, 19, 33–42, (In Chinese with English abstract). [Google Scholar]
  29. Collins, A.L.; Walling, D.E.; McMellin, G.K.; Zhang, Y.; Gray, J.; McGonigle, D.; Cherrington, R. A preliminary investigation of the efficacy of riparian fencing schemes for reducing contributions from eroding channel banks to the siltation of salmonid spawning gravels across the south west UK. J. Environ. Manag. 2010, 91, 1341–1349. [Google Scholar] [CrossRef]
  30. Collins, A.L.; Walling, D.E.; Webb, L.; King, P. Apportioning catchment scale sediment sources using a modified composite fingerprinting technique incorporating property weightings and prior information. Geoderma 2010, 155, 249–261. [Google Scholar] [CrossRef]
  31. Pulley, S.; Foster, I.D.L.; Collins, A.L. The impact of catchment source group classification on the accuracy of sediment fingerprinting outputs. J. Environ. Manag. 2016, 15, 16–26. [Google Scholar] [CrossRef] [Green Version]
  32. Chi, Q.H. Data Manual on Applied Geochemical Element Abundance; Geological Publishing House: Beijing, China, 2007; (In Chinese with English abstract). [Google Scholar]
  33. Li, R.L.; Wang, S.J.; Xiong, K.N.; Li, F.Q. A study on rocky desertification evaluation index system—A case study of Guizhou Province. Trop. Geogr. 2004, 24, 145–149, (In Chinese with English abstract). [Google Scholar]
  34. Chen, H.; Bai, X.; Li, Y.; Luo, G.; Xi, H.; Ran, C.; Luo, X. The evolution of rocky desertification and its response to land use changes in Wanshan Karst area, Tongren City, Guizhou Province, China. J. Agric. Resour. Environ. 2020, 37, 24–35. [Google Scholar]
  35. Cheng, Y.S. Discussion on the Classification of Karst rocky desertification. Chin. J. Geol. Hazard Control. 2009, 20, 122–127, (In Chinese with English abstract). [Google Scholar]
  36. Luo, X.; Wang, S.; Bai, X.; Tan, Q.; Ran, C.; Chen, H.; Xi, H.P.; Chen, F.; Cao, Y.; Wu, L.H. Analysis on the spatio-temporal evolution process of rocky desertification in southwest karst area. Acta Ecol. Sin. 2020, 41, 680–693. [Google Scholar]
  37. Wei, W.; Zhou, G.; Mao, G.; Shi, Y.; Su, C. Change analysis of karst rocky desertification for almost 40 years: A case study of Guangxi, China. In Proceedings of the International Conference on Intelligent Earth Observing & Applications, Guilin, China, 23–24 October 2015. [Google Scholar]
  38. Chen, Y.L.; Mo, J.F.; Mo, W.H.; Zhong, S.Q.; Wang, J.H.; Ding, M.H. Temporal and Spatial Distributions of Rocky Desertification in Guangxi Karst Area in the Past 30 Years. Guangxi Sci. 2018, 25, 625–631, (In Chinese with English abstract). [Google Scholar]
  39. Liu, G.N.; Feng, J.L.; Li, D.W.; Cao, J.; Cui, J.Z. Formation and evolution of karst weathering crust on limestone and its cyclic significance. Carsologica Sin. 2001, 20, 183–188, (In Chinese with English abstract). [Google Scholar]
  40. Wang, S.J.; Sun, C.X.; Liu, X.M.; Feng, Z.G. Geochemical characteristics and formation mechanism of rock-soil interface in limestone weathering crust at Huaxi, Guizhou province. Acta Mineral. Sin. 2002, 22, 7, (In Chinese with English abstract). [Google Scholar]
  41. Su, J.L.; Luo, W.Q.; Wang, G.Z.; Yang, Q.Y.; Zhou, Y.H.; Huang, J. Spatiotemporal Variation of Vegetation and Its Influencing Factors in Xijiang River Basin of Guangxi Based on MODIS-EVI. Res. Soil Water Conserv. 2019, 26, 232–238, (In Chinese with English abstract). [Google Scholar]
  42. Zhao, K.; Zhang, L.; Dong, J.; Wu, J.; Fu, W. Risk assessment, spatial patterns and source apportionment of soil heavy metals in a typical Chinese hickory plantation region of southeastern china. Geoderma 2019, 360, 114011. [Google Scholar] [CrossRef]
  43. Ji, W.; Yang, Z.; Yu, T.; Yang, Q.; Wen, Y.; Wu, T. Potential ecological risk assessment of heavy metals in the Fe–Mn nodules in the karst area of Guangxi, southwest China. Bull. Env. Contam. Toxicol. 2021, 106, 51–56. [Google Scholar] [CrossRef]
  44. Tang, M.; Lu, G.; Fan, B.; Xiang, W.; Bao, Z. Bioaccumulation and risk assessment of heavy metals in soil-crop systems in liujiang karst area, southwestern China. Environ. Sci. Pollut. Res. 2020, 28, 9657–9669. [Google Scholar] [CrossRef] [PubMed]
  45. Wu, W.; Qu, S.; Nel, W.; Ji, J. The impact of natural weathering and mining on heavy metal accumulation in the karst areas of the pearl river basin, china. Sci. Total Environ. 2020, 734, 139480. [Google Scholar] [CrossRef] [PubMed]
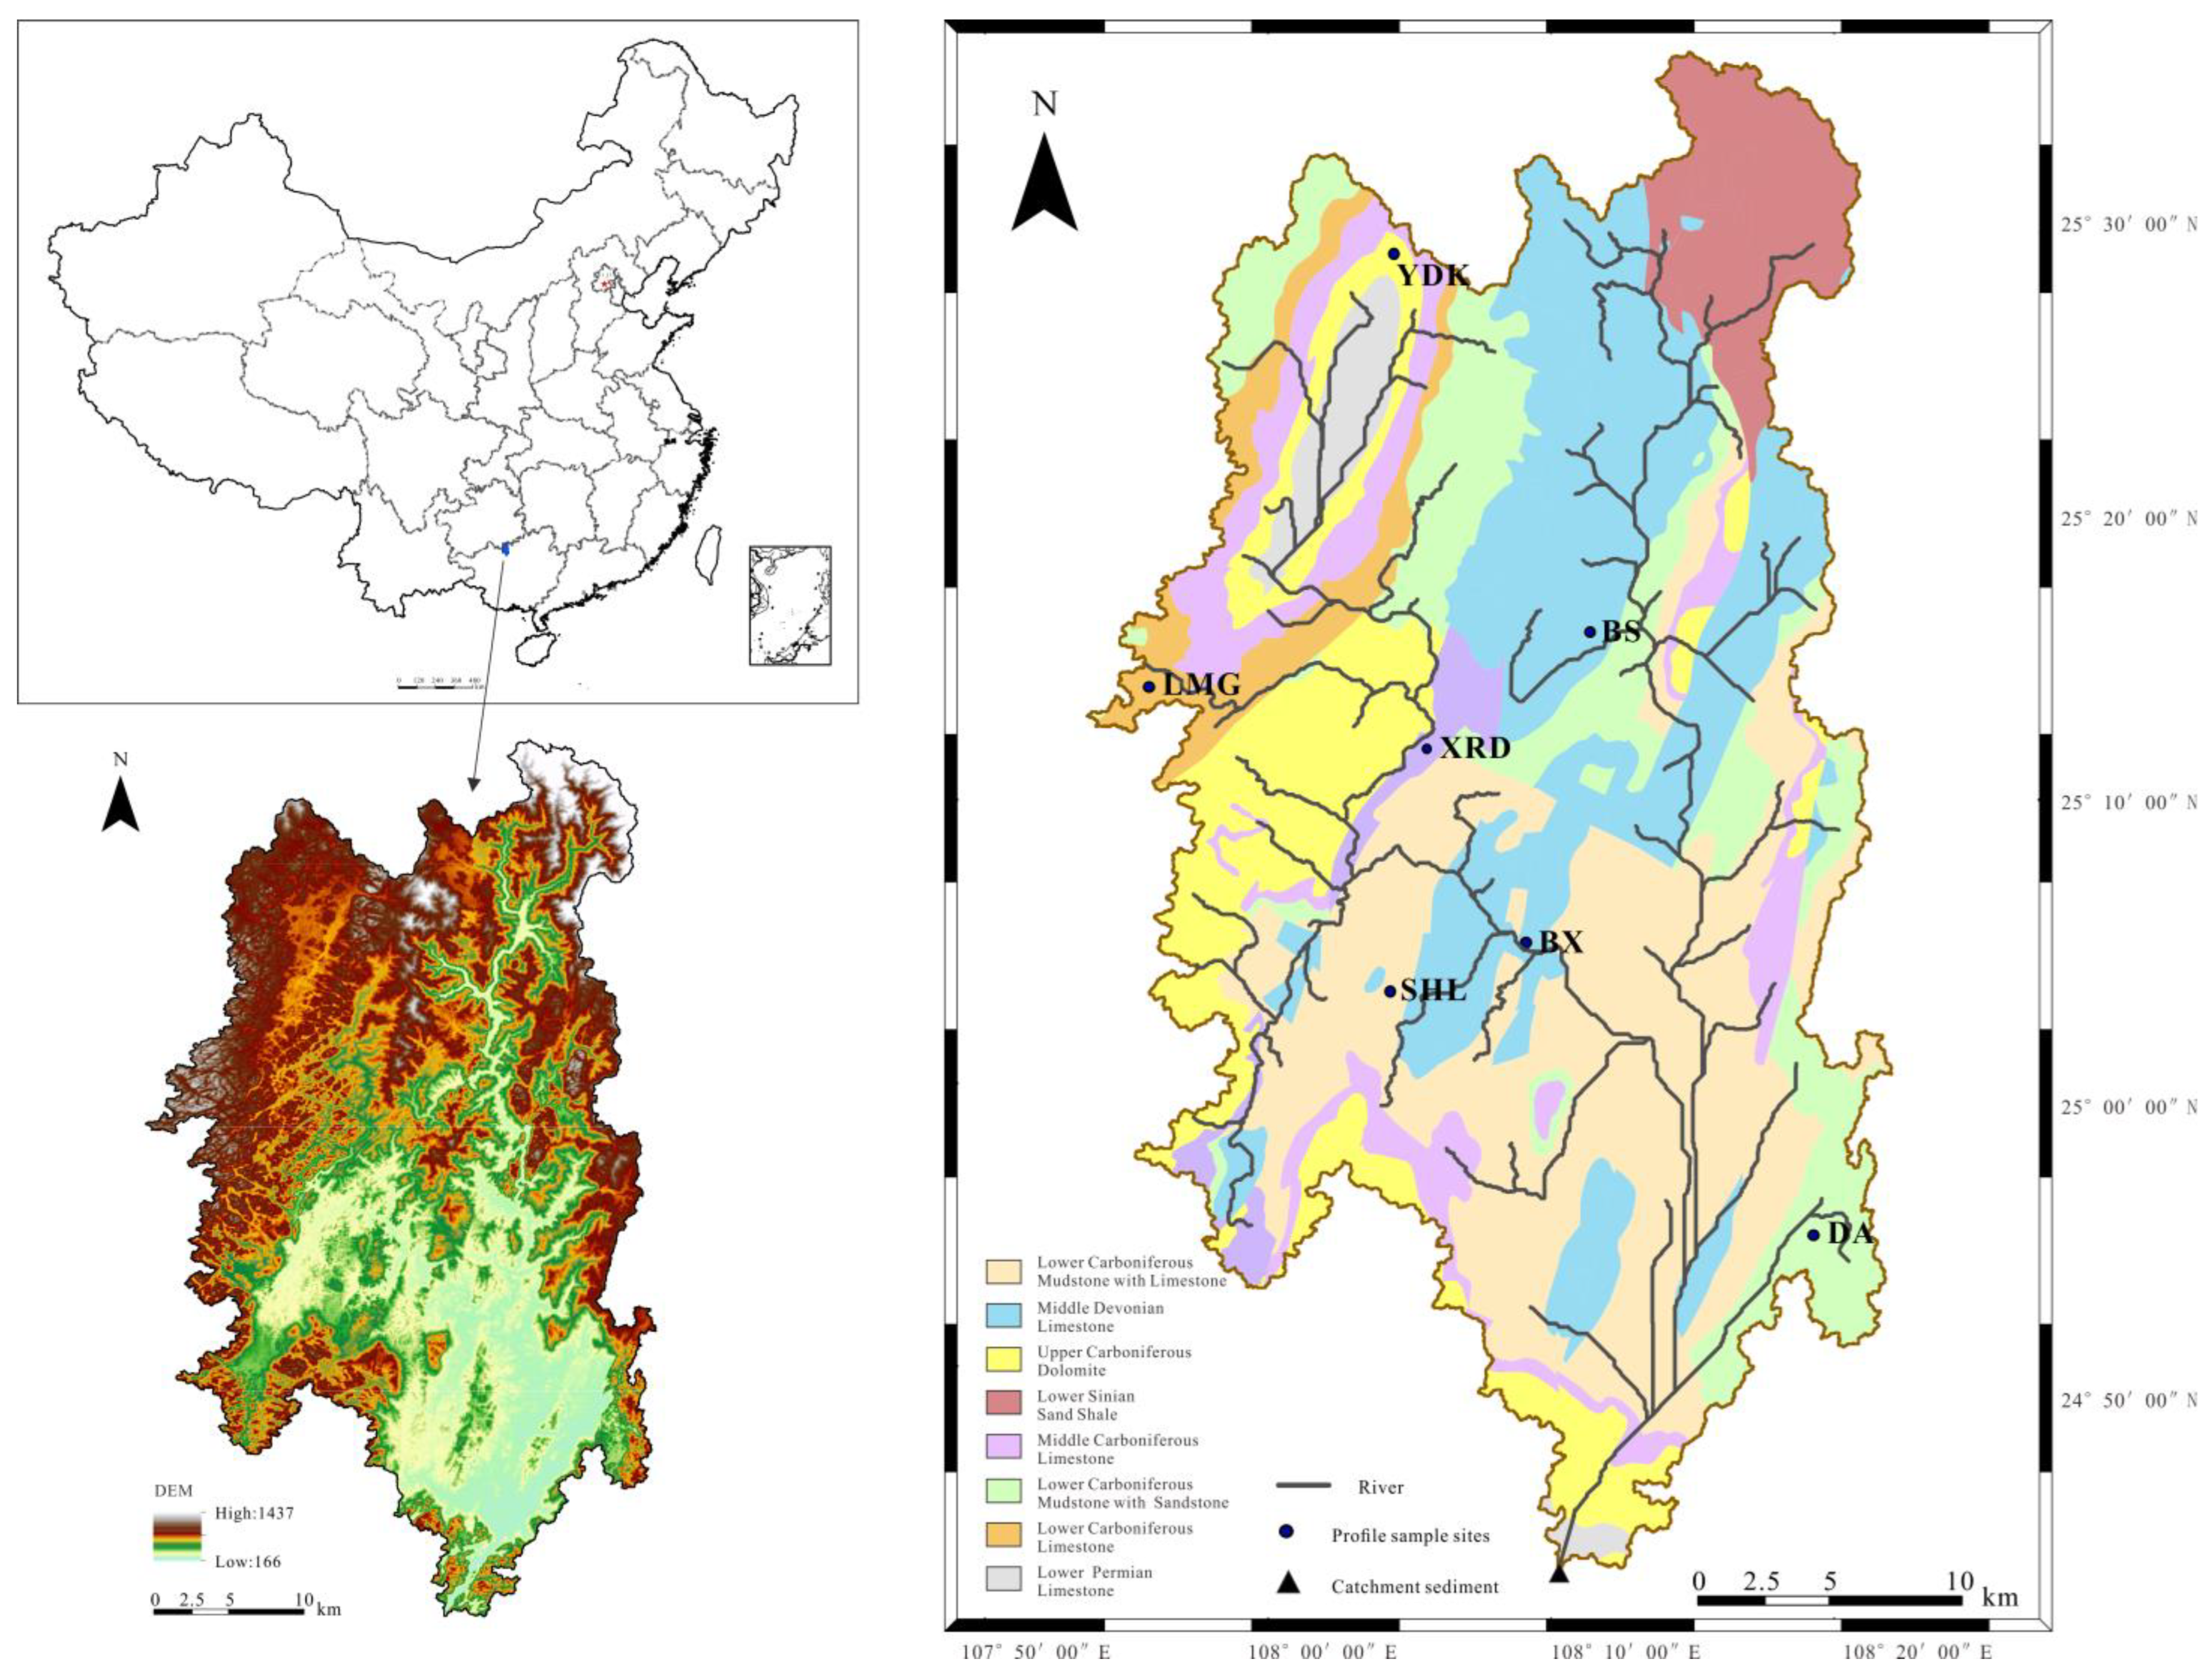
Figure 1. Study catchment area and the location of sampling sites.
Applsci 13 00771 g001
Figure 2. Degree of enrichment of toxic metals in catchment sediments.
Applsci 13 00771 g002
Figure 3. Mean tracer concentrations of different sources.
Applsci 13 00771 g003
Figure 4. Contributions of individual tracers to the goodness-of-fit of the sediment provenance model.
Applsci 13 00771 g004
Figure 5. Contributions of each source to the catchment sediment samples collected during the three baseline project periods.
Applsci 13 00771 g005
Figure 6. EVI of the study area (a): EGMON 1992–1996; (b): CGB1 2008–2012; (c): CGB2 2015–2019.
Applsci 13 00771 g006
Figure 7. Degree of toxic metal enrichment in each sediment source. (a): Limestone; (b): Dolomite; (c): Sand-shale and mudstone; (d): Lead-zinc tailings (with logarithmic scale).
Applsci 13 00771 g007
Table 1. Element analysis method and detection limit.
Analysis MethodDetection Limit
AsHydride atomic fluorescence spectrometry1
CdICP-MS0.02
CrX-ray fluorescence spectrometry5
CuX-ray fluorescence spectrometry1
HgCold Vapour Atomic Fluorescence Spectrometry0.0005
NiICP-MS2
PbX-ray fluorescence spectrometry2
ZnX-ray fluorescence spectrometry4
BEmission spectrometry1
BeICP-MS0.5
CoX-ray fluorescence spectrometry1
GaX-ray fluorescence spectrometry2
LaICP-MS1
LiICP-MS1
MoEmission spectrometry0.2
NbICP-MS2
NiICP-MS2
ThX-ray fluorescence spectrometry2
UICP-MS0.1
VX-ray fluorescence spectrometry5
YX-ray fluorescence spectrometry1
ZrX-ray fluorescence spectrometry2
Unit: mg/kg.
Table 2. Statistical parameters of toxic metals.
AsCdCrCuHgNiPbZn
LimestoneSoilMin10.260.03648.85.740.26.710.521.9
Median27.170.902101.516.4174.031.739.075.1
Max16.660.15163.99.981.412.120.051.9
CV33.2108.826.731.346.754.3 45.541.6
RockMin0.570.0363.06.814.94.42.318.7
Median11.000.27948.612.633.712.721.234.4
Max24.391.26757.019.3104.032.496.2208.0
CV66.798.945.541.970.658.990.8107.6
DolomiteSoilMin4.100.01131.05.536.35.07.920.5
Median4.640.02643.56.643.65.610.622.4
Max6.410.06455.99.861.27.412.727.2
CV21.2 76.9 23.4 26.1 22.9 17.7 23.2 12.4
RockMin1.460.02817.06.716.12.84.412.5
Median2.500.03747.78.320.68.815.720.3
Max3.570.07057.69.743.313.826.127.3
CV34.945.643.014.948.953.459.935.8
Mudstone and
sand-shale
SoilMin9.540.03636.47.959.45.713.417.5
Median19.570.10158.210.188.37.420.859.9
Max44.060.827110.221.9124.155.932.5104.9
CV50.1122.939.941.827.492.730.065.1
RockMin14.100.08035.99.526.06.513.123.3
Median19.870.31164.814.962.825.322.768.9
Max50.200.34988.820.1106.539.339.793.7
CV56.649.031.829.540.562.739.244.7
Pb-Zn TailingsContent148527.6948.2144.4342.630.611681890.0
Unit: mg/kg; CV: Coefficient of variation.
Disclaimer/Publisher’s Note: The statements, opinions and data contained in all publications are solely those of the individual author(s) and contributor(s) and not of MDPI and/or the editor(s). MDPI and/or the editor(s) disclaim responsibility for any injury to people or property resulting from any ideas, methods, instructions or products referred to in the content.