Article

Experimental Study of Vertical Tail Model Flow Control Based on Oscillating Jet

1
College of Aerospace Engineering, Nanjing University of Aeronautics and Astronautics, Nanjing 210016, China
2
State Key Laboratory of Mechanics and Control of Mechanical Structures, Nanjing 210016, China
3
Key Laboratory of Unsteady Aerodynamics and Flow Control, Ministry of Industry and Information Technology, Nanjing 210016, China
4
Science and Technology on Space Physics Laboratory, Beijing 100076, China
*
Authors to whom correspondence should be addressed.
Appl. Sci. 2023, 13(2), 786; https://doi.org/10.3390/app13020786
Submission received: 8 December 2022 / Revised: 31 December 2022 / Accepted: 4 January 2023 / Published: 5 January 2023

Abstract

:
In this paper, wind tunnel experiments are conducted to study the control law and mechanism of oscillating jet flow control to improve the aerodynamic characteristics of the vertical tail when a civil aircraft encounters left side gust or significant crosswind during takeoff and landing. We measured the vertical tail scaling model’s aerodynamics, spatial flow field, and surface pressure when the Reynolds number was 2.12 × 10⁵. The maximum momentum coefficient of the oscillating jet actuator reaches 0.332%. In addition, we studied the flow control effect of the three-dimensional vertical tail scaled model in different spanwise positions. The experimental results show that the oscillating jet at the rear edge of the stabilizer can significantly increase the lateral force of the vertical tail, and the increment of the lateral force can reach 36.5% under the worst condition of the negative side slip angle of the vertical tail. We can improve the lateral force coefficient of the vertical tail model by applying flow control alone at different spanwise locations. The wing root’s control effect and the vertical tail’s middle section are better than the wing tip’s. The oscillating jet can effectively restrain the flow separation on the rudder. In addition, the input of a high-energy jet “ejects” the mainstream, which increases the flow velocity at the side of the vertical tail actuator. It increases the circulation of the vertical tail. The oscillating jet flow control technology can effectively improve the vertical tail’s steering efficiency and increase the vertical tail’s lateral force, which is of great significance in improving the safety and economy of civil aircraft.

1. Introduction

The vertical tail is essential for aircraft lateral stability and yaw damping, crosswind landing, and resistance to asymmetric dynamics [1,2]. To ensure the aircraft’s controllability and meet the flight quality requirements in the case of asymmetric engine failure, the vertical tail size of most commercial aircraft is larger than the size required for static heading stability [3]. In addition, the aircraft has low airspeed and steering efficiency during takeoff and landing, so it is necessary to design a large vertical tail to provide sufficient lateral force. However, the large area of the vertical tail will increase the weight and resistance of the aircraft, fuel consumption, and the burden of the control mechanism.
Flow control changes the flow state by applying force, mass, heat, electromagnetic, and other physical quantities to the moving fluid, thereby changing the moving object’s force state or motion state. Using active flow control technology to improve steering efficiency, reduce the size of the vertical tail, and provide the same control capability as the large vertical tail can enhance the safety and economy of civil aircraft. Active flow control traditionally enables the smaller vertical tail to provide the required control capability in an emergency while operating in the rest of the flight envelope [4].
An oscillating jet flow control technology is one of the most popular active flow control technologies. The self-excited oscillating jet actuator [4] has the advantages of a fixed and reliable structure, strong control ability, and wide control frequency band. It is widely used in separation flow control, enhanced mixing, and other aspects. The self-excited oscillating jet actuator causes the main flow in the mixing chamber to swing due to the control of the feedback channel, and the periodic unsteady jet sweeping will be generated at the outlet of the actuator.
Many scholars have made a lot of research achievements regarding the oscillating jet and its application. Scholars such as Damian Hirsch [5] and Daniel Portillo [6] have used high-speed schlieren to study the coupling relationship between the internal flow structure of the oscillating jet actuator and the actuator’s performance. Katz et al., (1989) [7] studied the separation flow control of a two-dimensional airfoil upper surface using a periodic perturbation active flow control method. Tenzin Choephel et al., (2012) [8] of Pennsylvania State University conducted an experimental study on improving the S903 airfoil’s aerodynamic performance with an oscillating jet actuator. Mehti Koklu et al., (2014, 2017) [9,10,11,12] of the National Aeronautics and Space Administration (NASA) Langley Research Center conducted a comparative study on oscillating jet, micro vortex generator, steady blowing, and other flow control methods on the pressure gradient slope model in the 15-inch wind tunnel. The experimental results show that the momentum utilization efficiency of the steady direct jet is the lowest. An unsteady oscillating jet has the best control efficiency by increasing the pressure recovery and reducing downstream flow separation. Bartosz Jurewicz et al., (2016, 2018) [13,14,15] of the University of Halifa studied the change in the height and width of the feedback channel and the influence of the mass flow rate on the jet velocity distribution and jet span. The two-dimensional Unsteady Reynolds Averaged Navier Stokes (2D-URANS) simulation of the unsteady flow field generated by the oscillating jet actuator was carried out using Fluent software. They studied the unstable flow fields on several internal Coanda surfaces. They gave the effects of different Coanda surfaces and mass flow rates on the jet velocity and spanwise distribution. Under the sponsorship of NASA ERA project, Roman Seele et al., (2015, 2019) [1,16,17,18] carried out active flow control research on a general vertical tail model with a relative thickness of 12%. The experimental results show that the jet from the vertical stabilizer’s trailing edge significantly improves the vertical tail’s lateral force coefficient. A 2% blowing momentum coefficient increases the lateral force by more than 50% at the maximum rudder deflection angle without yaw. Julien Dandois et al., (2020) [19] of Thackeray University studied the effect of active flow control technology on delayed rudder flow separation in two different models. The experimental results show that the impact of an unsteady jet on restraining flow separation is better than that of a steady jet. The scholars Loeffler and Scholz et al., (2020) [20,21,22] in Germany carried out active flow control at the leading edge and stabilizer hinge increasing the vertical tail lateral force, the under different slip angles and rudder deflection angles. The experimental results show that active flow control at the front edge of the vertical tail stabilizer can significantly improve the flow separation on the stabilizer surface at large lateral slip angles, while reducing resistance. Singh and Scholz et al., (2020) [23] investigated steady tangential blowing on a vertical tail experimentally. The experimental results show that the discrete slot configuration demanded 34% less of the momentum coefficient than a continuous slot at a similar side force. NASA and Boeing [24] installed an oscillating jet actuator on the vertical tail of the full-size Boeing 757 aircraft and conducted a flow control study. The wind tunnel test results showed that when the rudder deflected 30°, the opening of the actuator increased the vertical tail lateral force by more than 20%. NASA and Boeing (2015) conducted flight test verification using an aircraft called the Boeing 757 Environmental Demonstrator [2,4]. The purpose of the flight test was to demonstrate the integration of the active flow control system with the fuselage and to measure the effect of the oscillating jet on the rudder efficiency.
The inherent physical mechanism for improving the aerodynamic characteristics of the vertical tail wing through an oscillating jet needs further investigation. Many scholars have measured the surface flow field of the vertical tail by the filament method and the oil flow technique, but have not focused on the spatial flow field above the rudder. The mechanism to achieve the enhanced rudder effect of the vertical tail is not obvious. In addition, there is no quantitative research on the control effects of different positions of three-dimensional vertical tail spans. There are differences in the control effect of different spanwise positions. Studying the control law of different positions can help improve the efficiency of active flow control and save air supply.
Therefore, in this paper, a scaled model of the vertical tail of a civil aircraft with an array of oscillating jet actuators is designed at 2.12 × 10⁵ Reynolds number. The flow control law and mechanism of the vertical tail based on an oscillating jet are studied through force measurement, pressure measurement, and particle image velocimetry experimental methods.

2. Experimental Setup and Methods

2.1. Actuator Structure and Vertical Tail Model Design

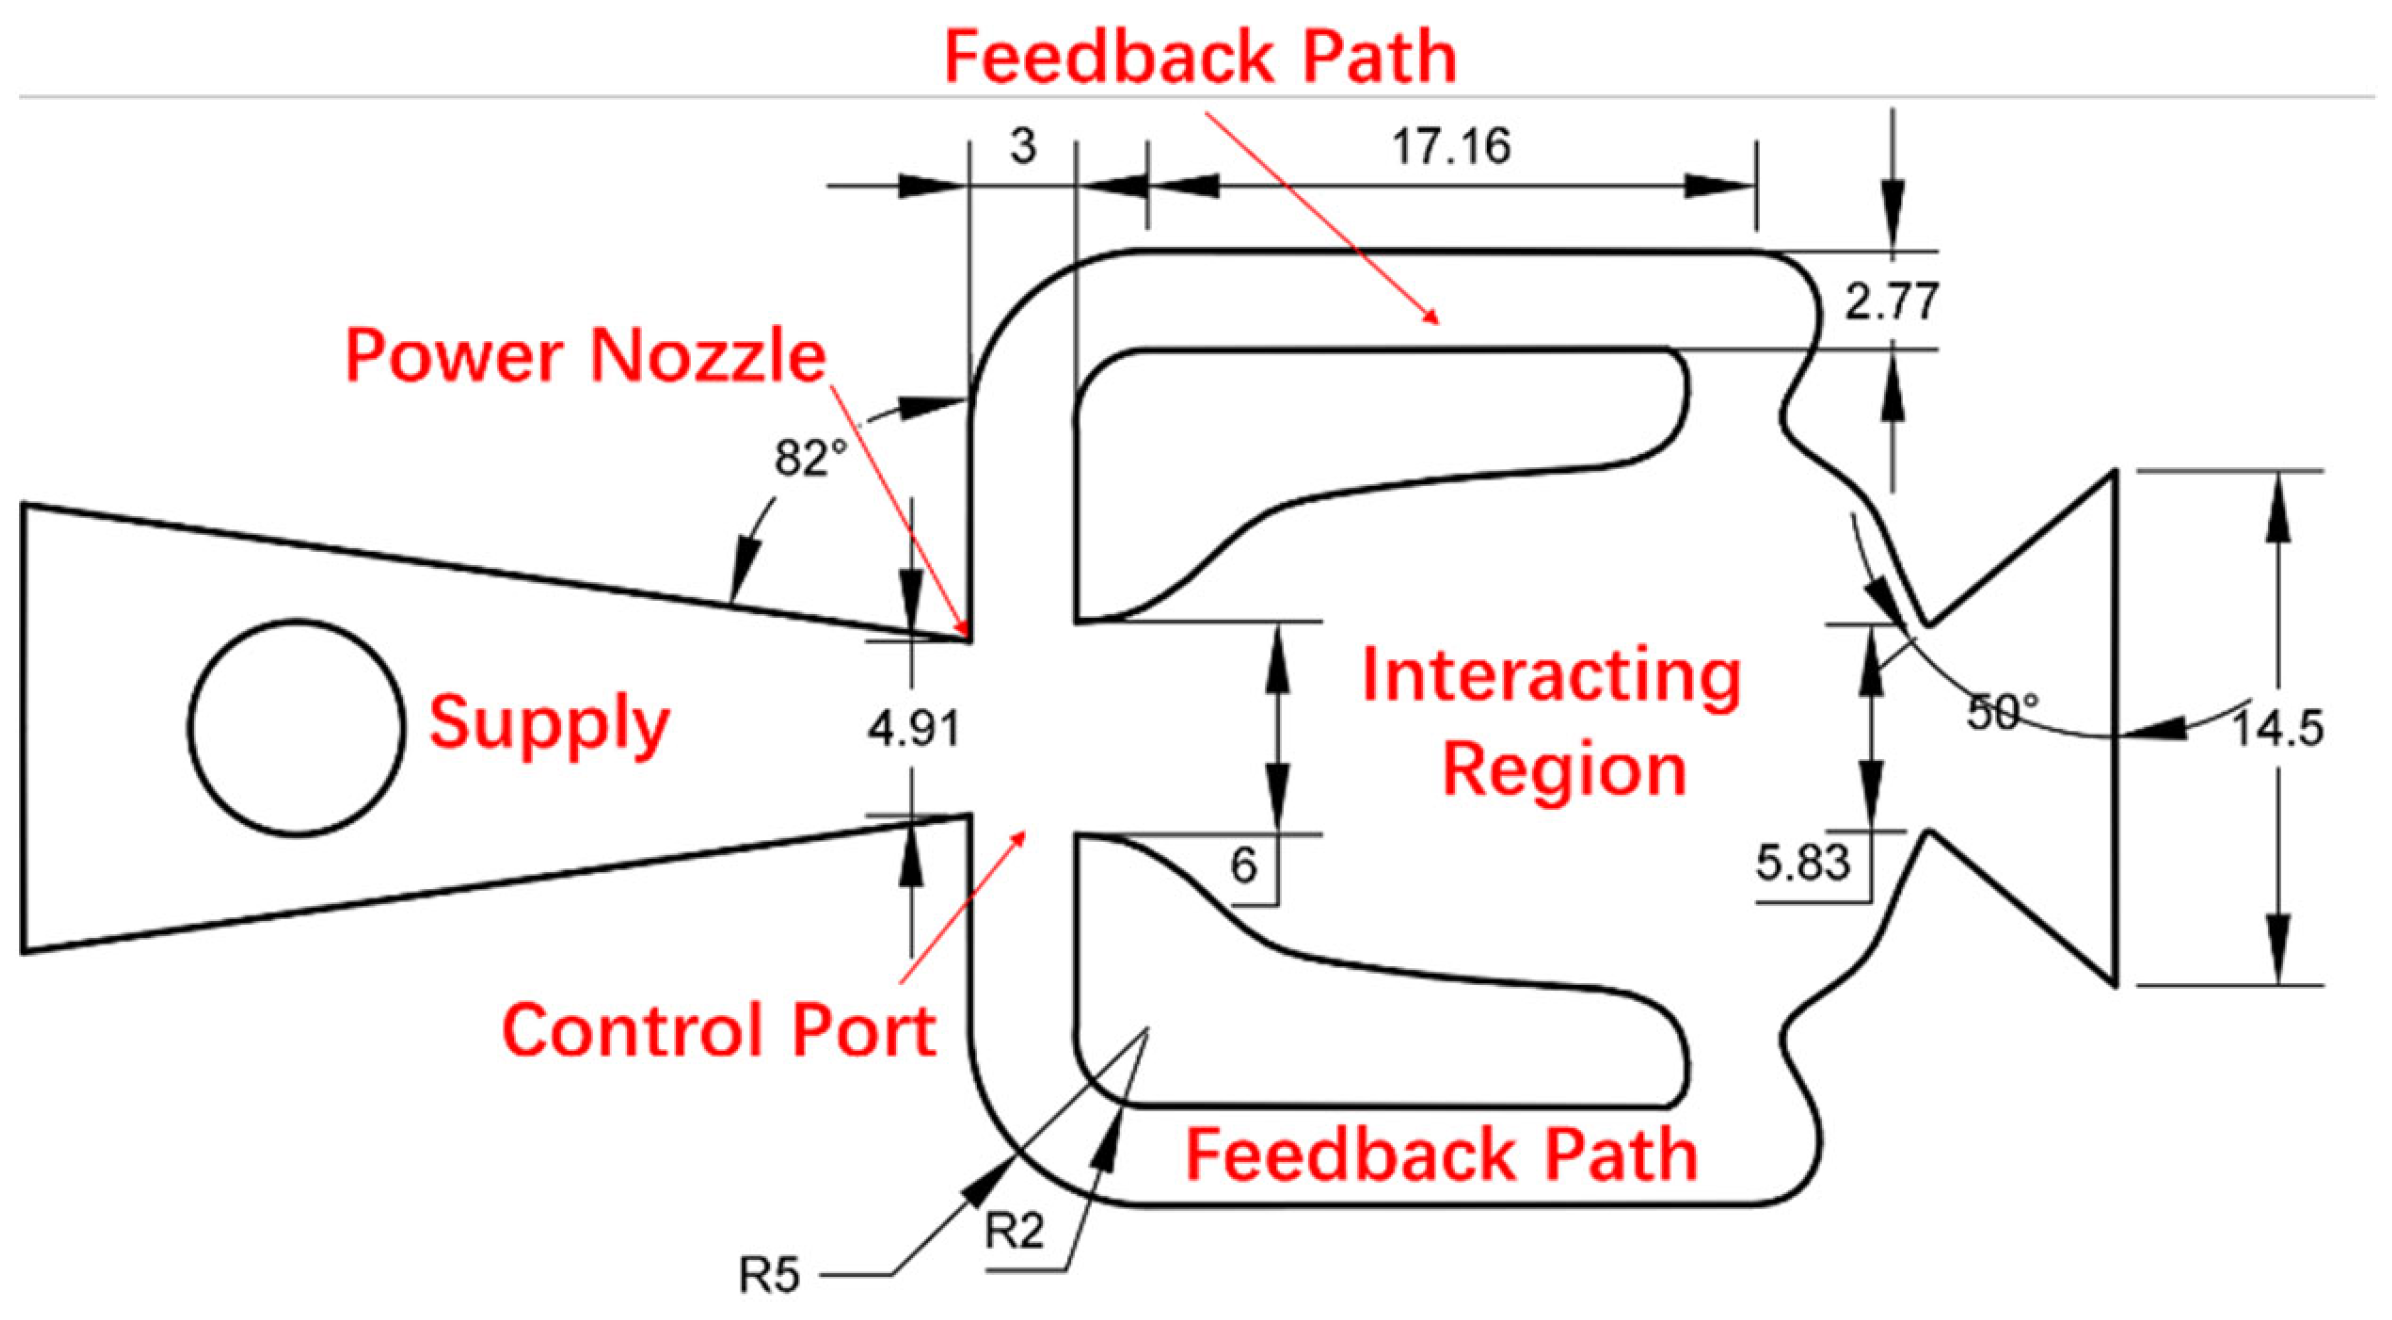
The internal structure of the self-excited oscillating jet actuator has been relatively mature. The actuator used in this paper has been modified based on the conceptual design drawing. The structure and size parameters are shown in Figure 1. The width of the actuator feedback channel is 3 mm, the width of the mixing chamber inlet is 6 mm, the width and height of the jet outlet are 14.5 mm × 2 mm, and the outlet sweep angle is 80°.
The vertical tail scale model is made of 3D printing resin material. The airfoil is NACA0012, with a span of 530 mm, a root tip ratio of 3.77, an average aerodynamic chord length of 281 mm, a leading-edge sweep angle of 45°, and a reference area of 0.134 m2. An equal percentage of rudder chord length is taken, accounting for 35% of the vertical tail chord length. The blockage percentage of the model in the wind tunnel is less than 3%. Nine oscillating jet actuators are arranged at the rear edge of the stabilizer in front of the hinge at an equal distance of 65 mm along the span direction. The air-blowing section of the actuator is parallel to the symmetrical plane of the vertical tail model, as shown in Figure 2. Nine actuators are numbered 1–9 from wing root to wing tip and divided into three groups, three for each group. Three for wing root are defined as group I, and three for the wing tip as group III. The air compressor’s three groups of actuators are supplied with air from the wing root separately to avoid insufficient air supply to the actuator at the wing tip due to the weakening of the air source along the span. The electric turntable controls the sideslip angle of the vertical tail and the rudder deflection angle. The turntable resolution and absolute positioning accuracy are 0.01°.
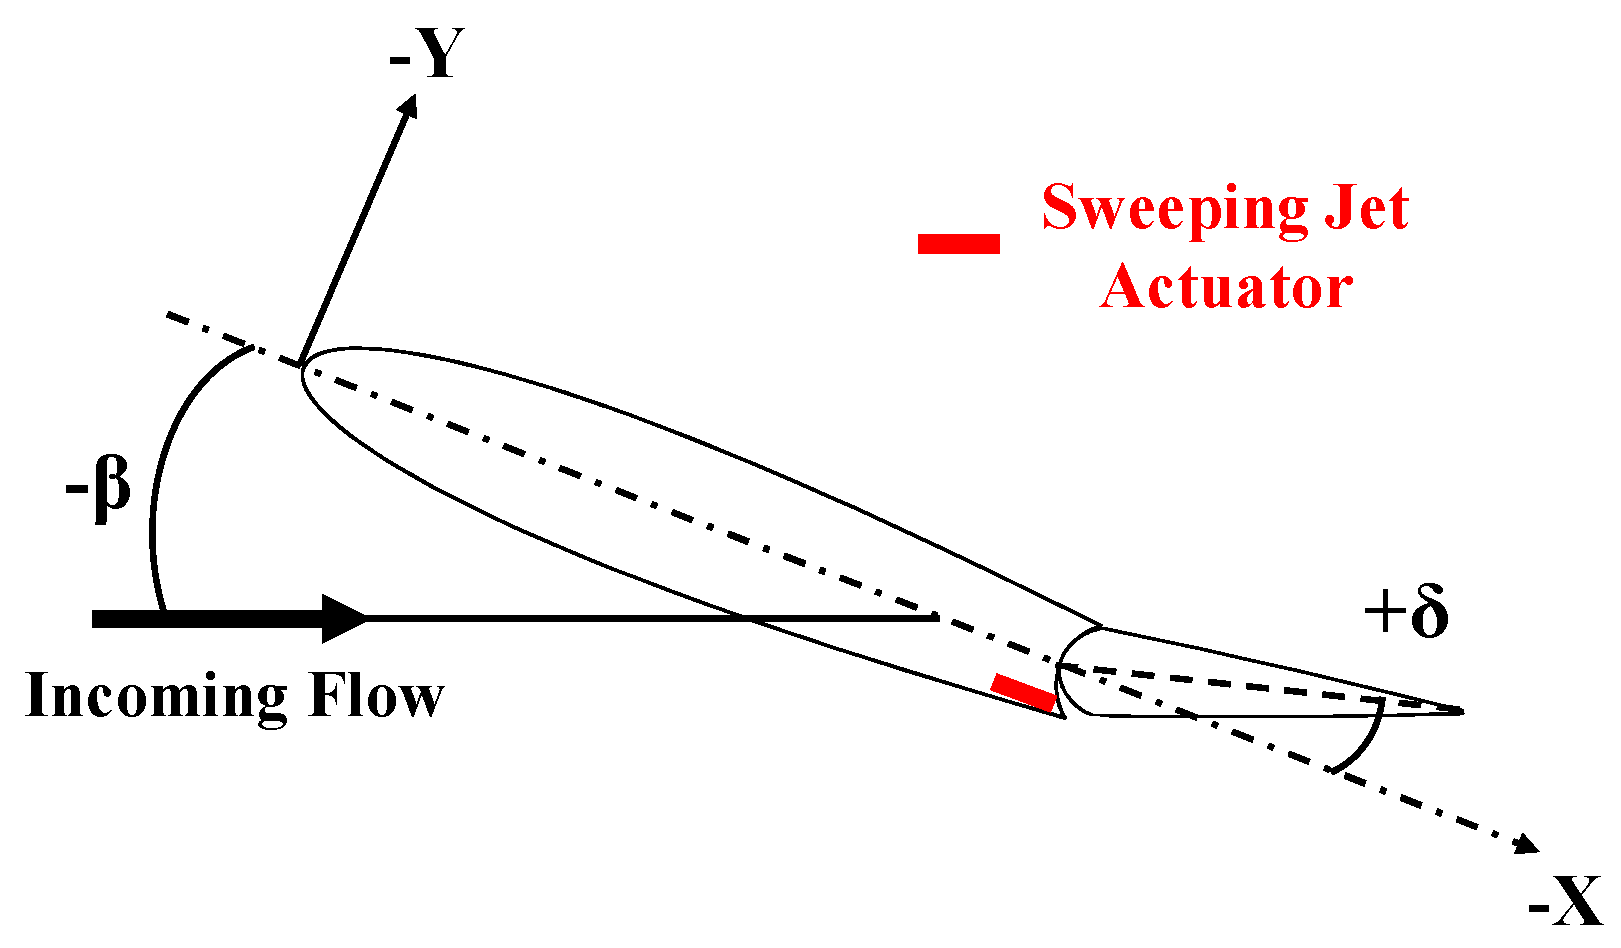
The definitions of the model sideslip angle and rudder deflection angle under typical working conditions are shown in Figure 3. This paper investigates typical problems with the takeoff or landing of civilian aircraft. When the aircraft encounters a left gust or a high-speed crosswind, the incoming flow will generate a force on the vertical tail to yaw the aircraft, resulting in an accident. In this case, +δ is the rudder deflection angle, and the actuator on the windward side of the vertical tail is turned on, making the vertical tail generate aerodynamic force in the positive Y direction. In this way, the vertical tail can provide positive lateral force at the negative sideslip angle, give the right yaw moment for the whole aircraft, and enable the aircraft to take off and land safely in significant crosswind conditions.

2.2. Experimental Equipment and Testing System

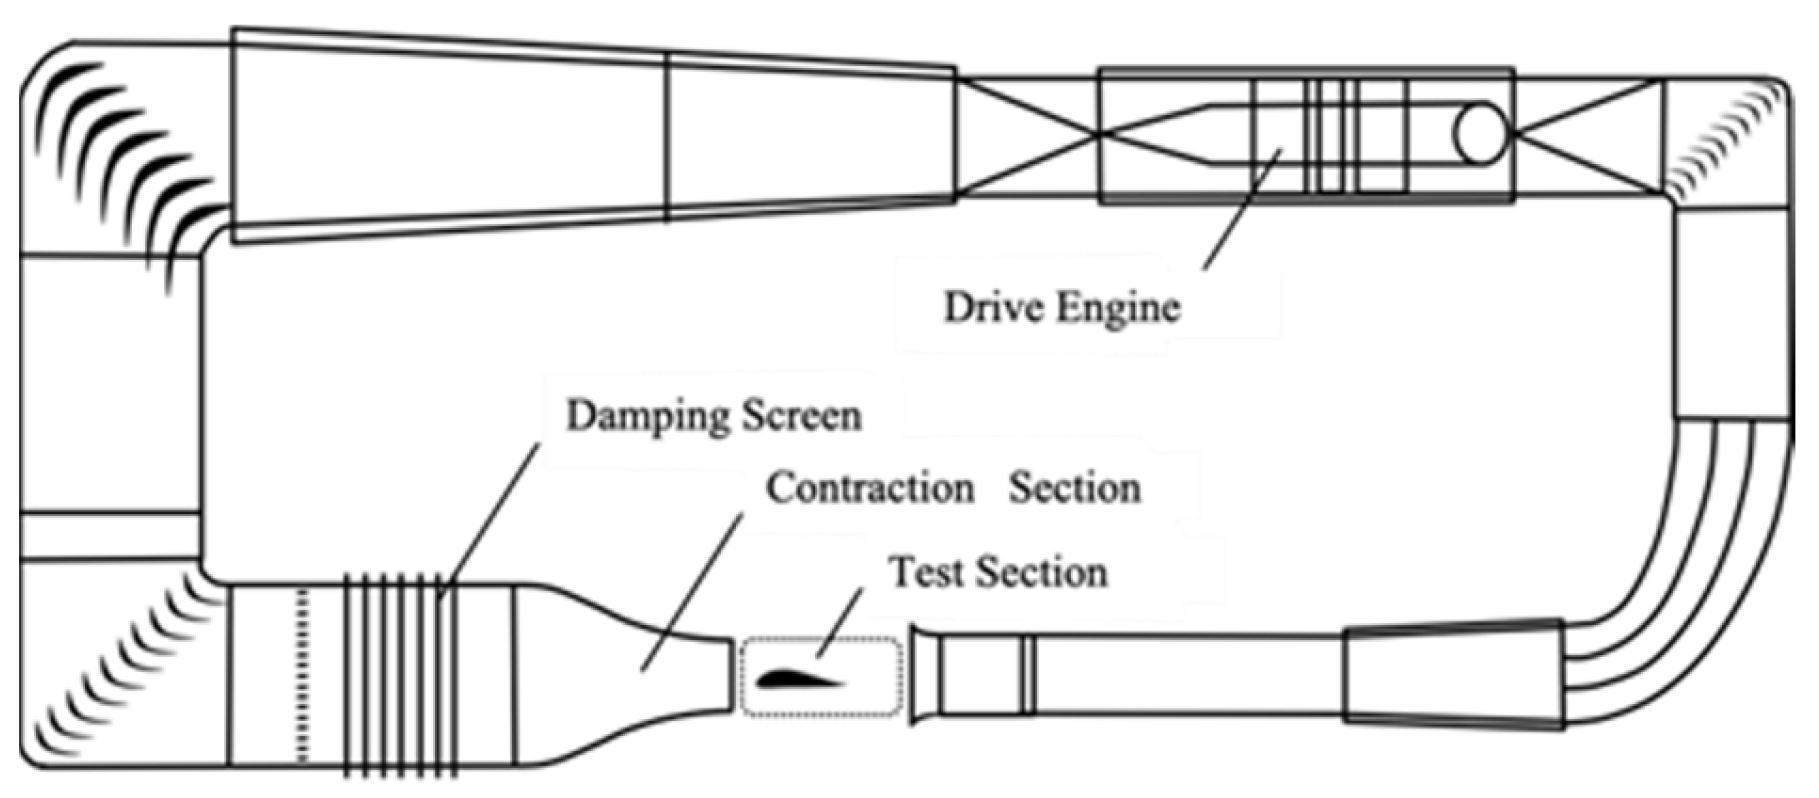
We experimented with vertical tail jet control in the return flow low-speed wind tunnel of Nanjing University of Aeronautics and Astronautics. As shown in Figure 4, this is an open jet wind tunnel. The length of the test section is 1.7 m, and the width-to-height ratio of its square cross-section is 1.5 m × 1 m, turbulence intensity in core area ε = 0.08%, noise less than 65 dB, and stable wind speed range of 5 m/s to 40 m/s.
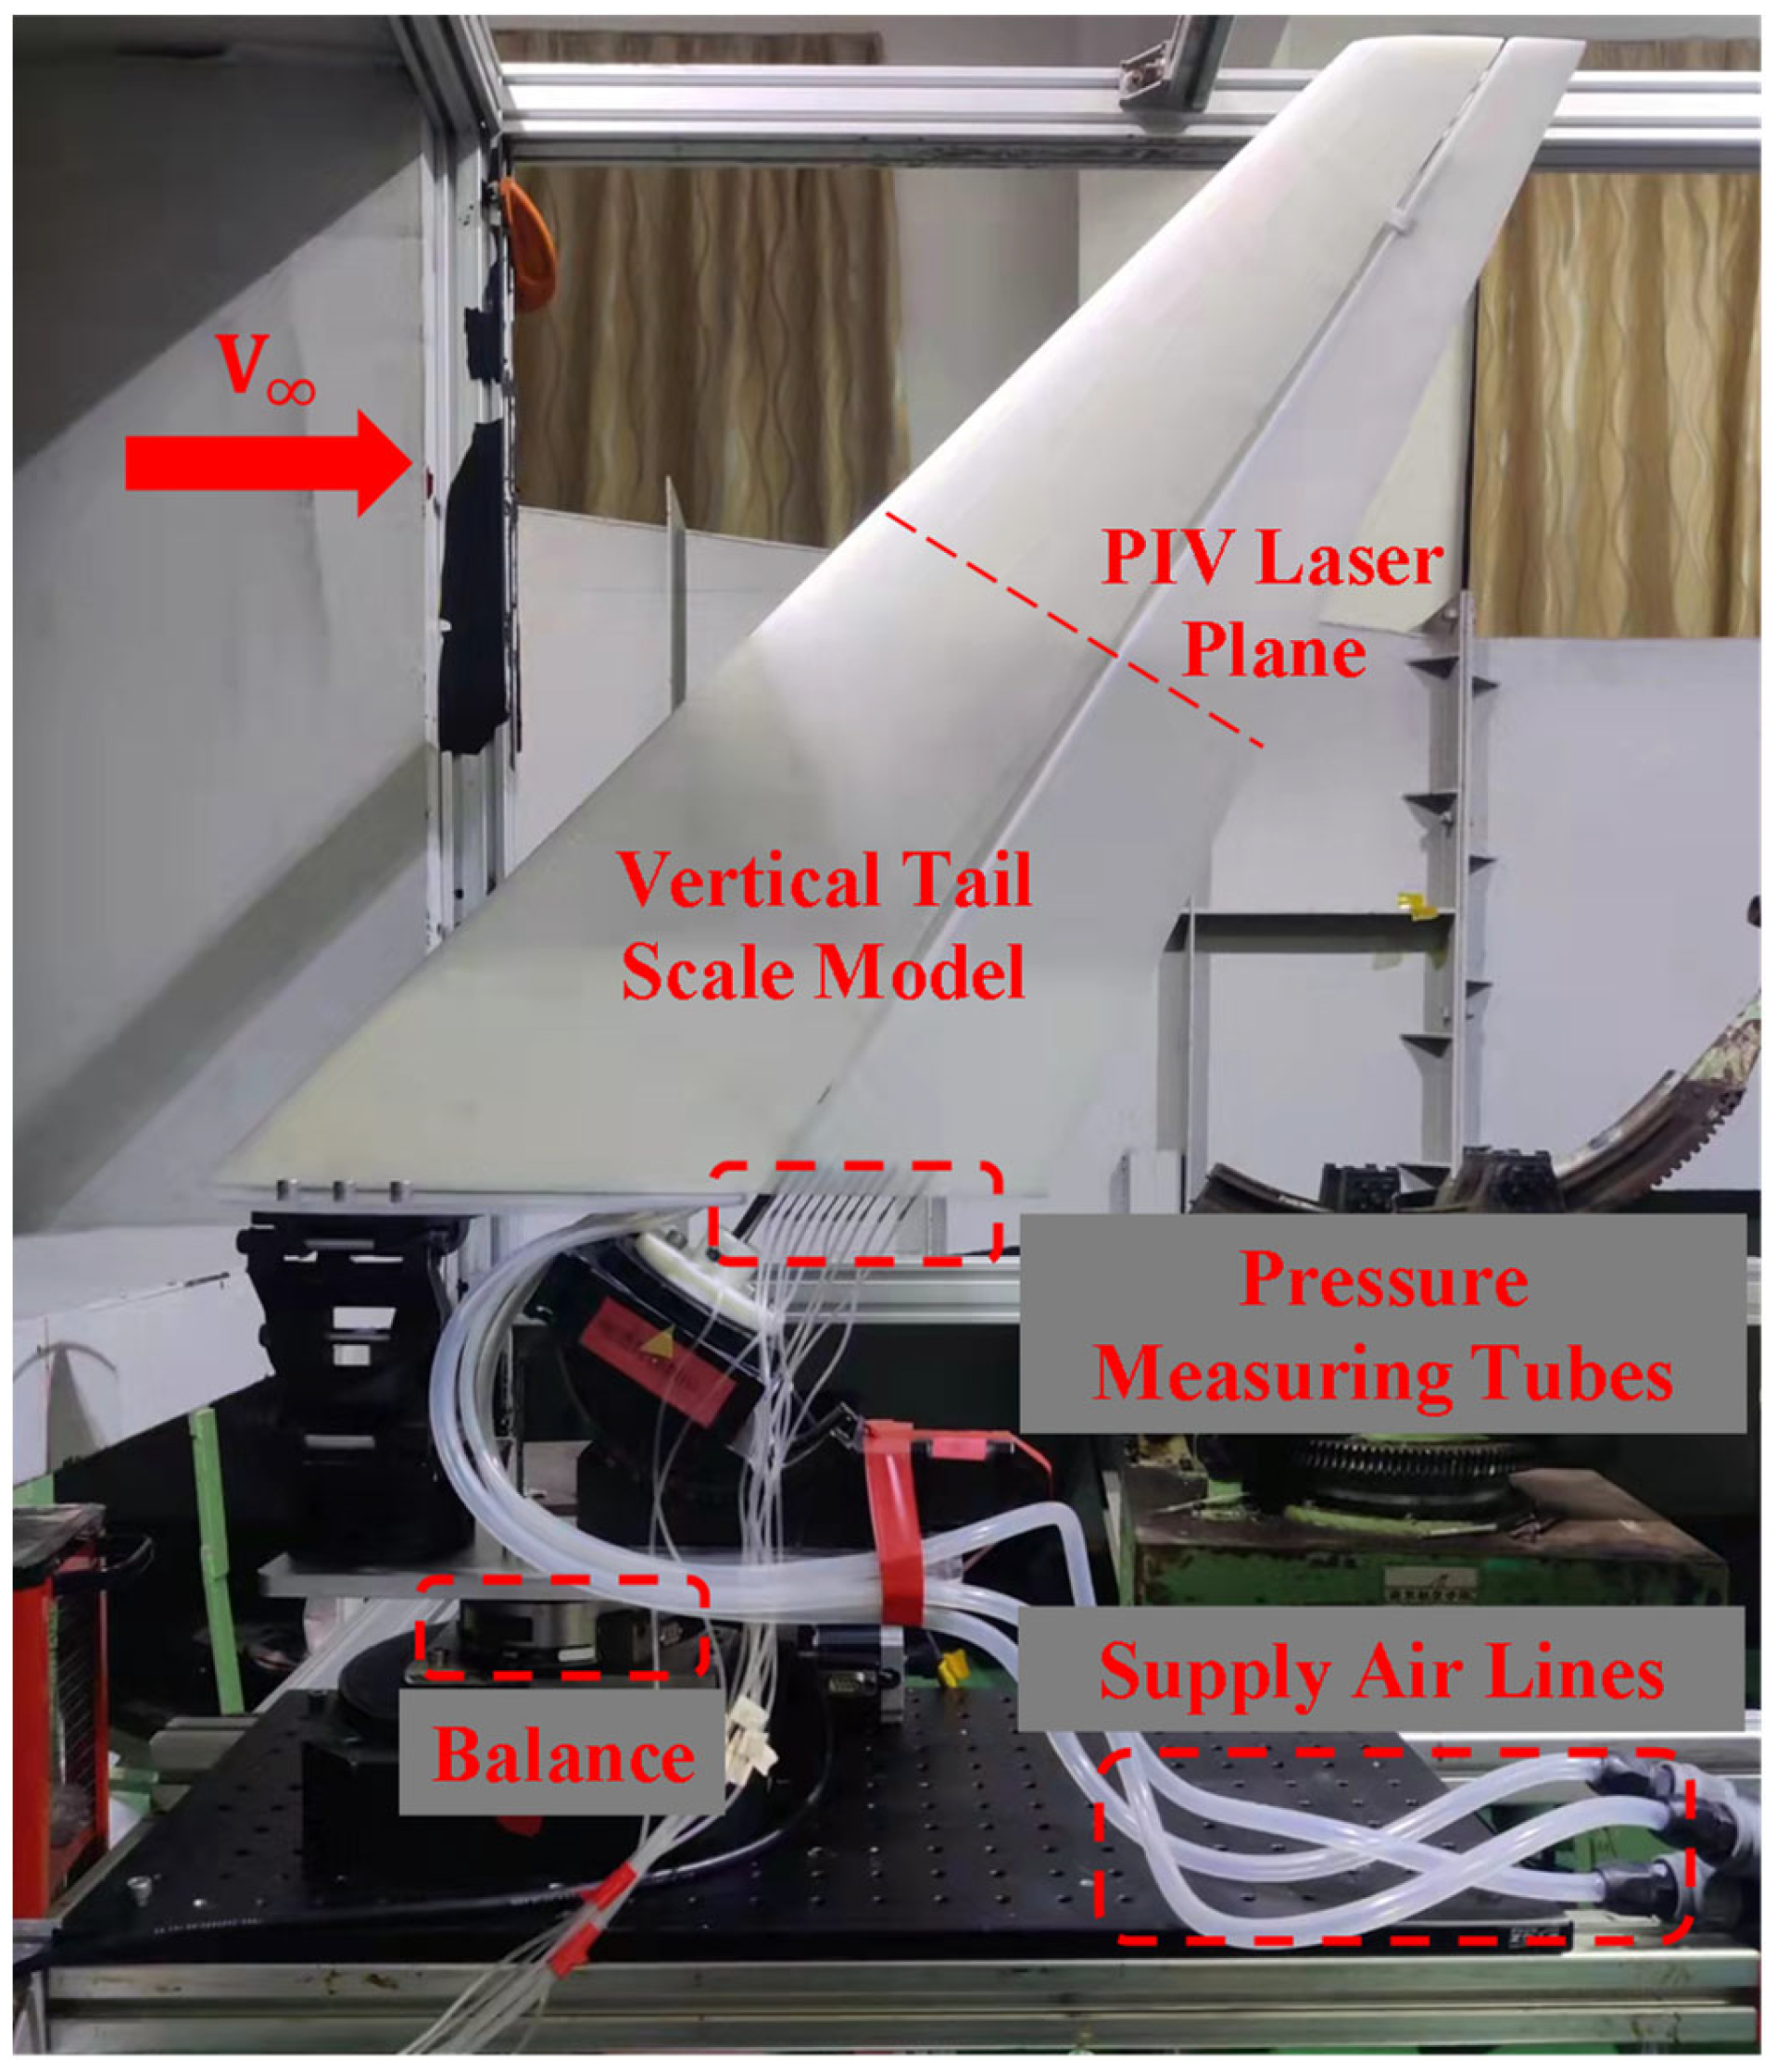
The experimental test system mainly includes a dynamic force and pressure measurement system and a particle image velocimetry (PIV) system. The measuring and PIV devices are shown in Figure 5. A base plate was set up in the experiment. In order to show the arrangement of the movement mechanism, the base plate was temporarily removed. The force measurement experiment of the vertical tail model uses the ATI-9610 six-component strain gauge balance. The relevant parameters of the balance are shown in Table 1, and the measurement accuracy is 1% FS. The balance acquisition frequency is set to 10 Hz, and the force data are processed for time averaging to obtain the state’s aerodynamic data. The lateral force coefficient is given by
C Y = Y 1 2 ρ U 2 A r e f ,
where Y is the vertical tail lateral force, ρ is the incoming flow density, U is the incoming flow velocity, and Aref is the reference area of the vertical tail model.
The main objective of the actuator in this paper is to improve the flow situation on the rudder and thus improve the efficiency of the vertical tail rudder surface, rather than to control the flow of the entire vertical tail model. Therefore, only one side of the rudder is provided with a pressure tap, which is located on the same side as the oscillating jet actuator. The pressure measuring tap is located at the center section of the actuator at the semi-span position, and the pressure measuring section is perpendicular to the trailing edge of the stabilizer. The distance from the pressure measuring point at the center section of the actuator to the leading edge of the pressure measuring section is x = 0.639c, x = 0.688c, x = 0.736c, x = 0.784c, x = 0.832c, and x = 0.904c.
The pressure measurement experiment uses the surface pressure measurement system independently developed by the Flight Measurement and Control Innovation Laboratory of the NUAA, which is composed of 64 channel pressure transmitters, a National Instruments (NI) data acquisition system, a pressure measurement pipeline, etc. The pressure measurement range is 0.15 PSI (about 1034.2 Pa), the acquisition accuracy can reach 0.1 Pa, the acquisition resolution can reach 0.3 Pa, and the dynamic frequency response can reach 3 KHz. The pressure coefficient is calculated after the time-averaged processing of the surface pressure data Ptap measured by the pressure tap. The pressure coefficient is given by
C p = p t a p p q ,
where Ptap is the surface pressure and P is the static pressure.
The PIV experimental laser plane coincides with the symmetric plane of the exciter in the middle. It is perpendicular to the symmetric plane of the vertical tail model and the trailing edge of the stabilizer. The camera is arranged from the tip to the root of the wing to avoid the stabilizer shielding the spatial flow field on the rudder during the flow field measurement. The Dantec Company developed the PIV system used in the experiment, mainly composed of a workstation, controller, particle generator, high-resolution CCD camera, and synchronizer. The double-pulse laser model is Beamtech Vliet-500. The maximum output power is 500 mJ/pulse, the pulse laser wavelength is 532 nm, and the pulse time is 15 ns. The beam waist thickness of the adjustable focal length sheet light source is 1 mm, and the focal length is adjustable within the range of 0.2 m~2 m. The CCD camera is Flowsense EO 4M with a pixel resolution of 2048 × 2048. The sampling rate was set at 10 Hz, and 100 snapshots were averaged to obtain a steady-state spatial flow field. The raw material of the tracer particle is DEHS (diethyl hexyl sebacate), and the particle diameter is less than 5 μm. It has good properties in the flow field, low toxicity, and noncorrosive and stable chemical properties.

3. Results and Discussion

3.1. Study on Exit Velocity Characteristics of Actuator

Three different actuator flow inputs are set in this paper. The flow input of each group of actuators includes 2 m3/h, 3 m3/h, and 4 m3/h. The average speed at the corresponding actuator outlet is about 30 m/s, 44 m/s, and 60 m/s. The momentum coefficient of the oscillating jet actuator is given by
C μ = 2 q m U j e t ρ U 2 A r e f ,
where q m ( kg · s 1 ) is the mass flow rate of the input actuator and Aref is the projected area of the vertical tail. According to the momentum coefficient formula, the corresponding momentum coefficients of the three input flows are 0.083%, 0.166%, and 0.332% (U = 10 m/s).

3.2. Study on Basic Aerodynamic Characteristics of Vertical Tail Model

At Reynolds number 2.12 × 10⁵, the flow measurement experiment of the vertical tail model without flow control was conducted. The sideslip angle range was 0°~−10°, and the rudder deflection angle range was 0°~40°.
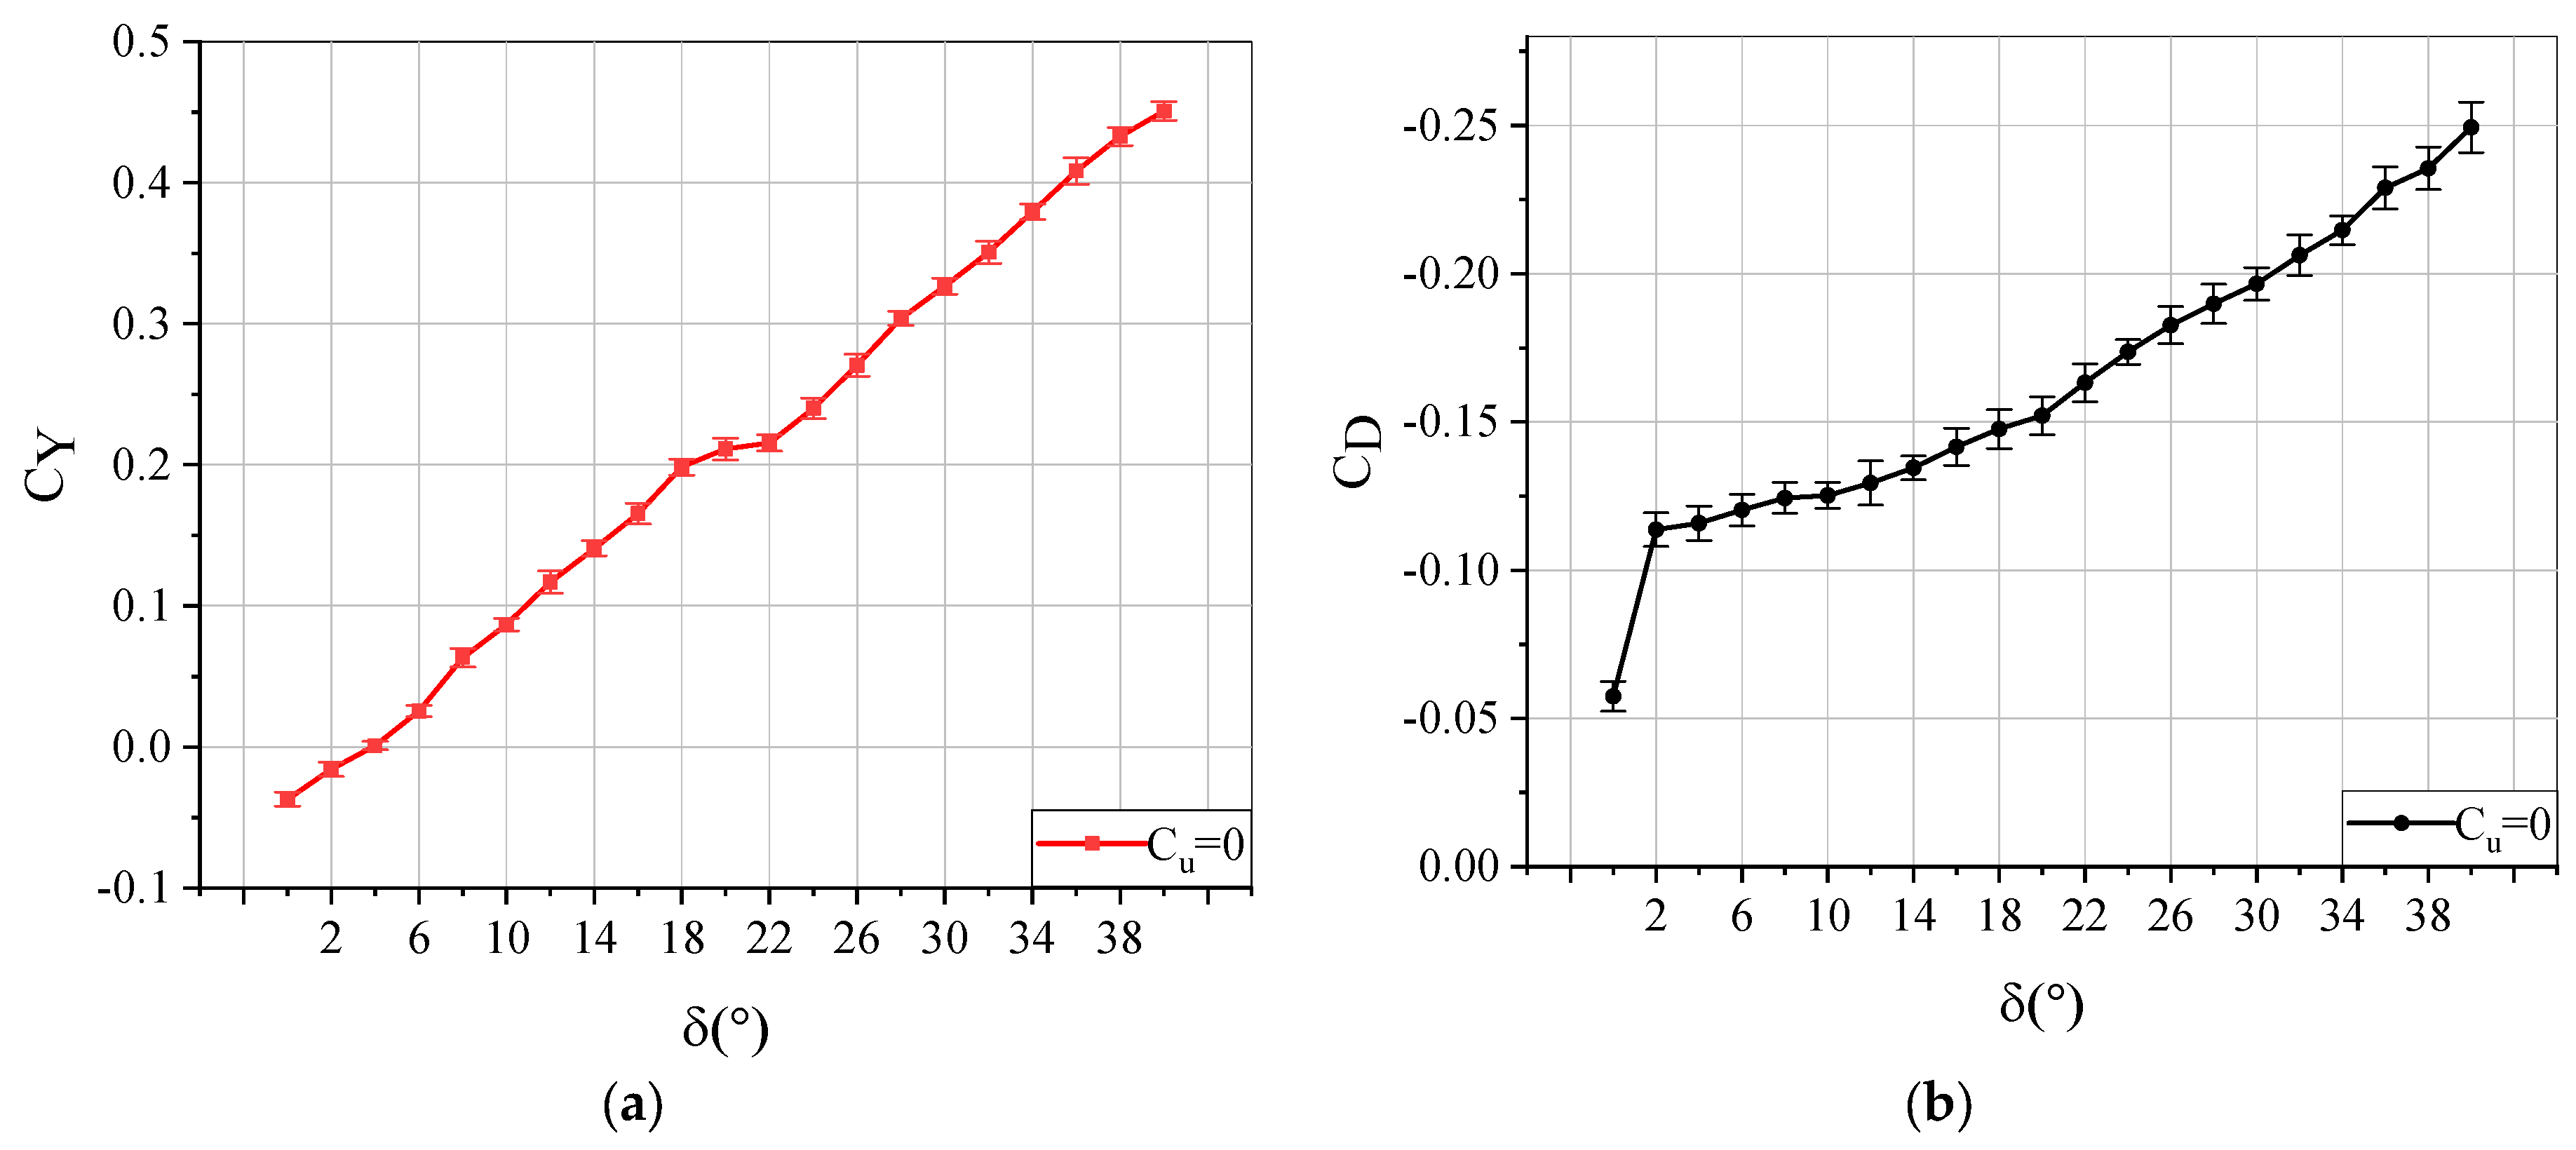
Figure 6 shows the curve of the vertical tail without control aerodynamics changing with the rudder deflection angle at β = 0°, and the rudder change step is 2°. Because of the possible declination of the wind tunnel’s airflow and the deviations in model making, the rudder deflection angle is hard to set at 0 degrees in the air flow coordinate system. This may be the cause of the non-zero force at 0 degrees yaw and 0 degrees rudder deflection. When the rudder deflection angle is less than 18°, the lateral force coefficient curve keeps the same slope. When the rudder deflection angle is in the range of 18°~22°, the slope of the lateral force coefficient curve decreases obviously, and the lateral force coefficient increases slowly. We can see from the drag coefficient curve that when the rudder deflection angle is less than 18°, the drag coefficient of the vertical tail model increases slowly, and the curve slope is slight. When the rudder deflection angle is greater than 20°, the drag coefficient of the vertical tail model rises significantly. While the rudder drag increases significantly, the direct force has a component in the positive Y direction, which is the main reason for the further increase in the lateral force coefficient when the rudder deflection angle is large.
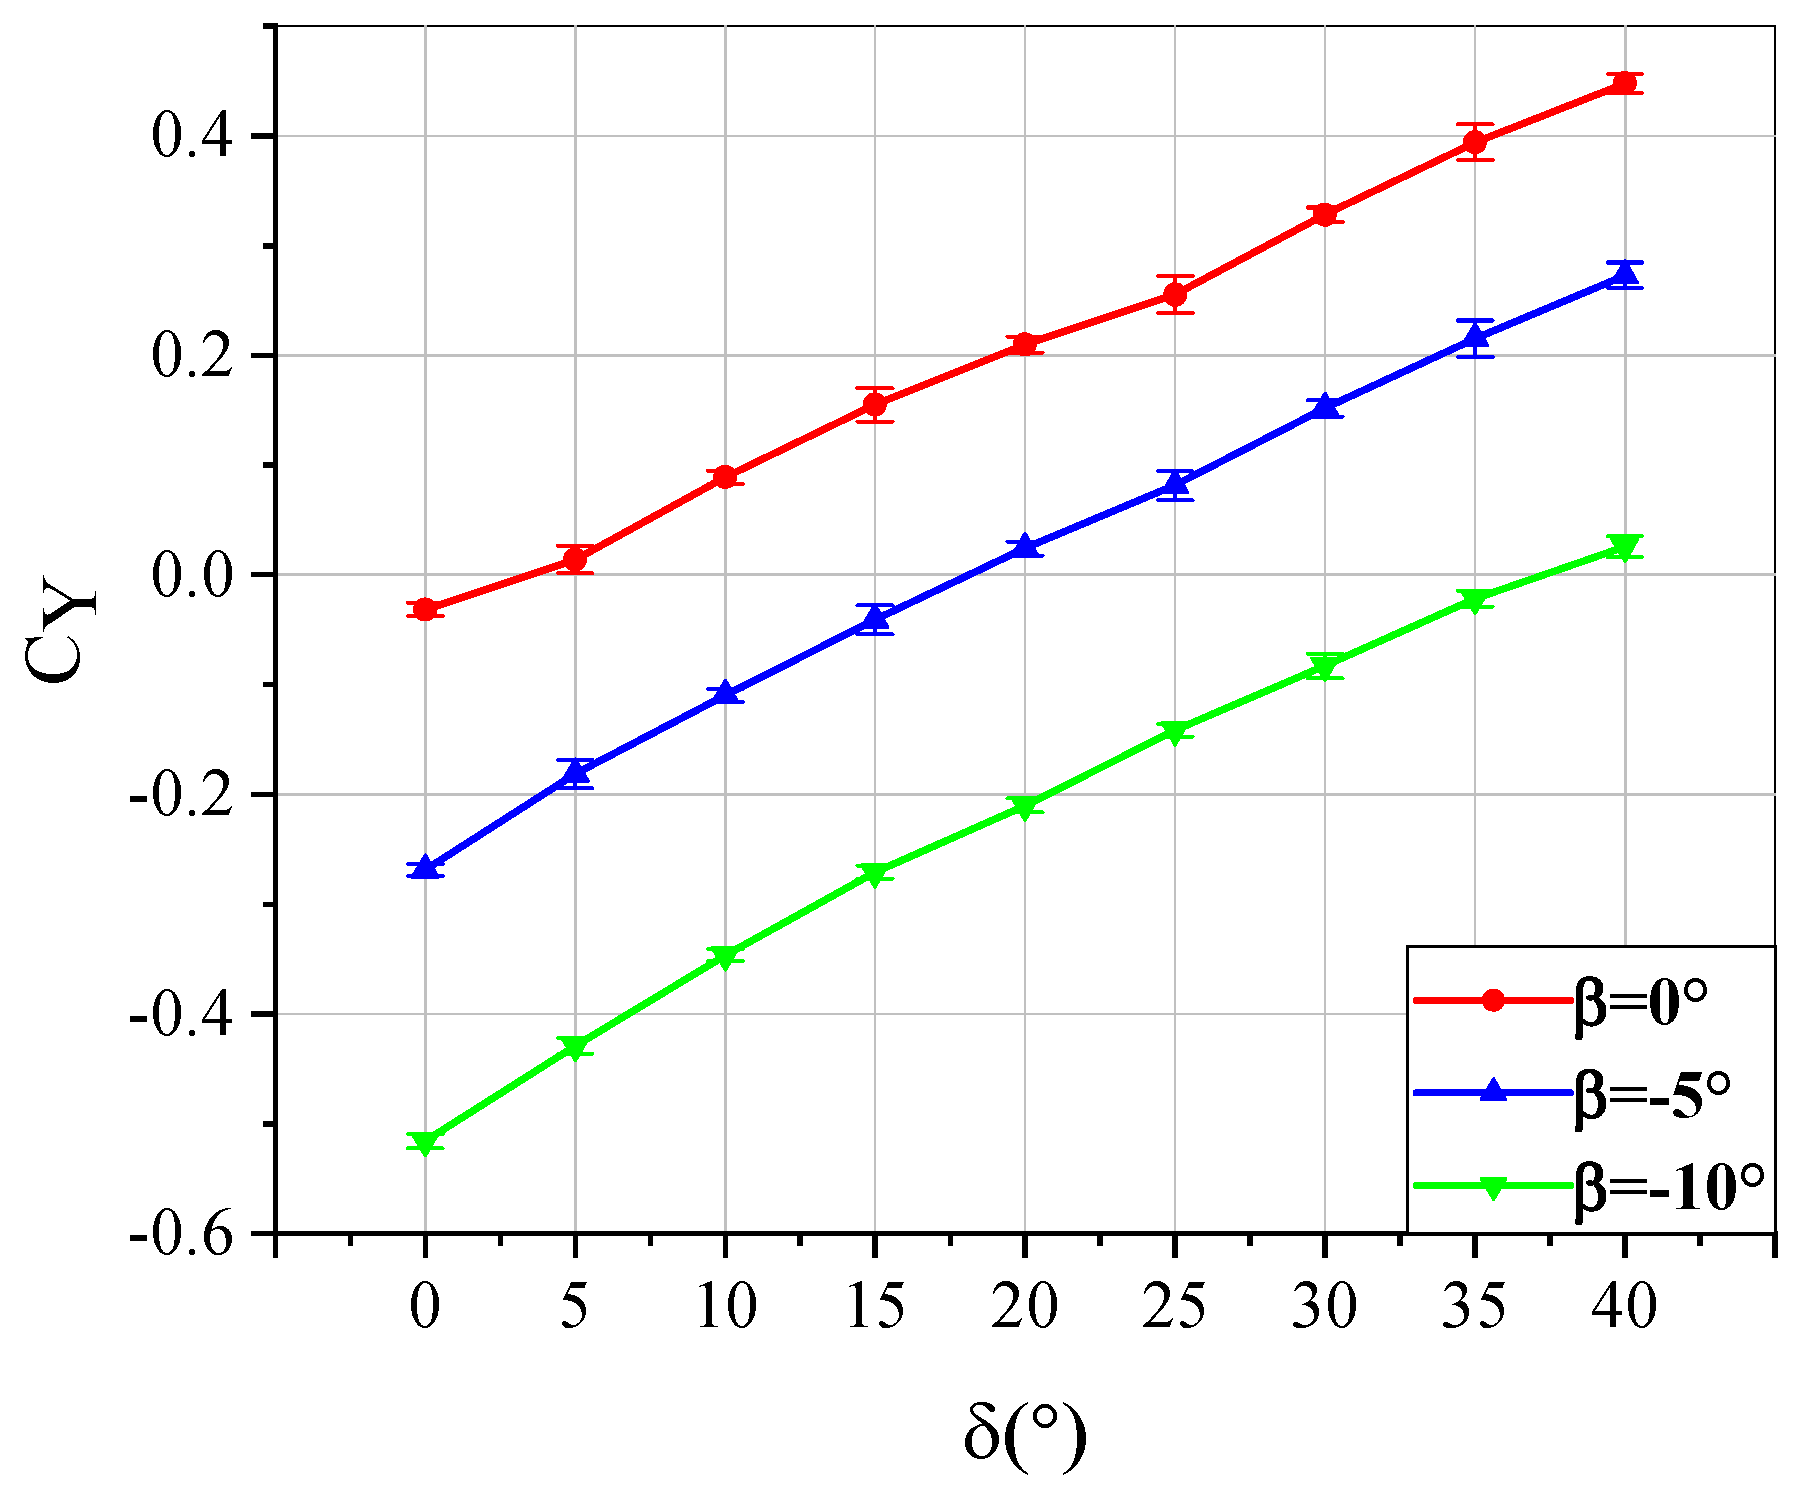
The study of the characteristics of the vertical tail lateral force under the typical conditions of −5° and −10° sideslip angles continued. Figure 7 shows the curve diagram of the lateral force coefficient of the vertical tail model under different sideslip angles when no control is applied. It can be seen that when the sideslip angle is −10°, the rudder deflection angle within the range of 0°~37° cannot produce the lateral force in the positive direction. This means that under this working condition, the vertical tail cannot balance the yaw moment caused by a large crosswind only by the rudder deflection, which is a huge threat to flight safety.
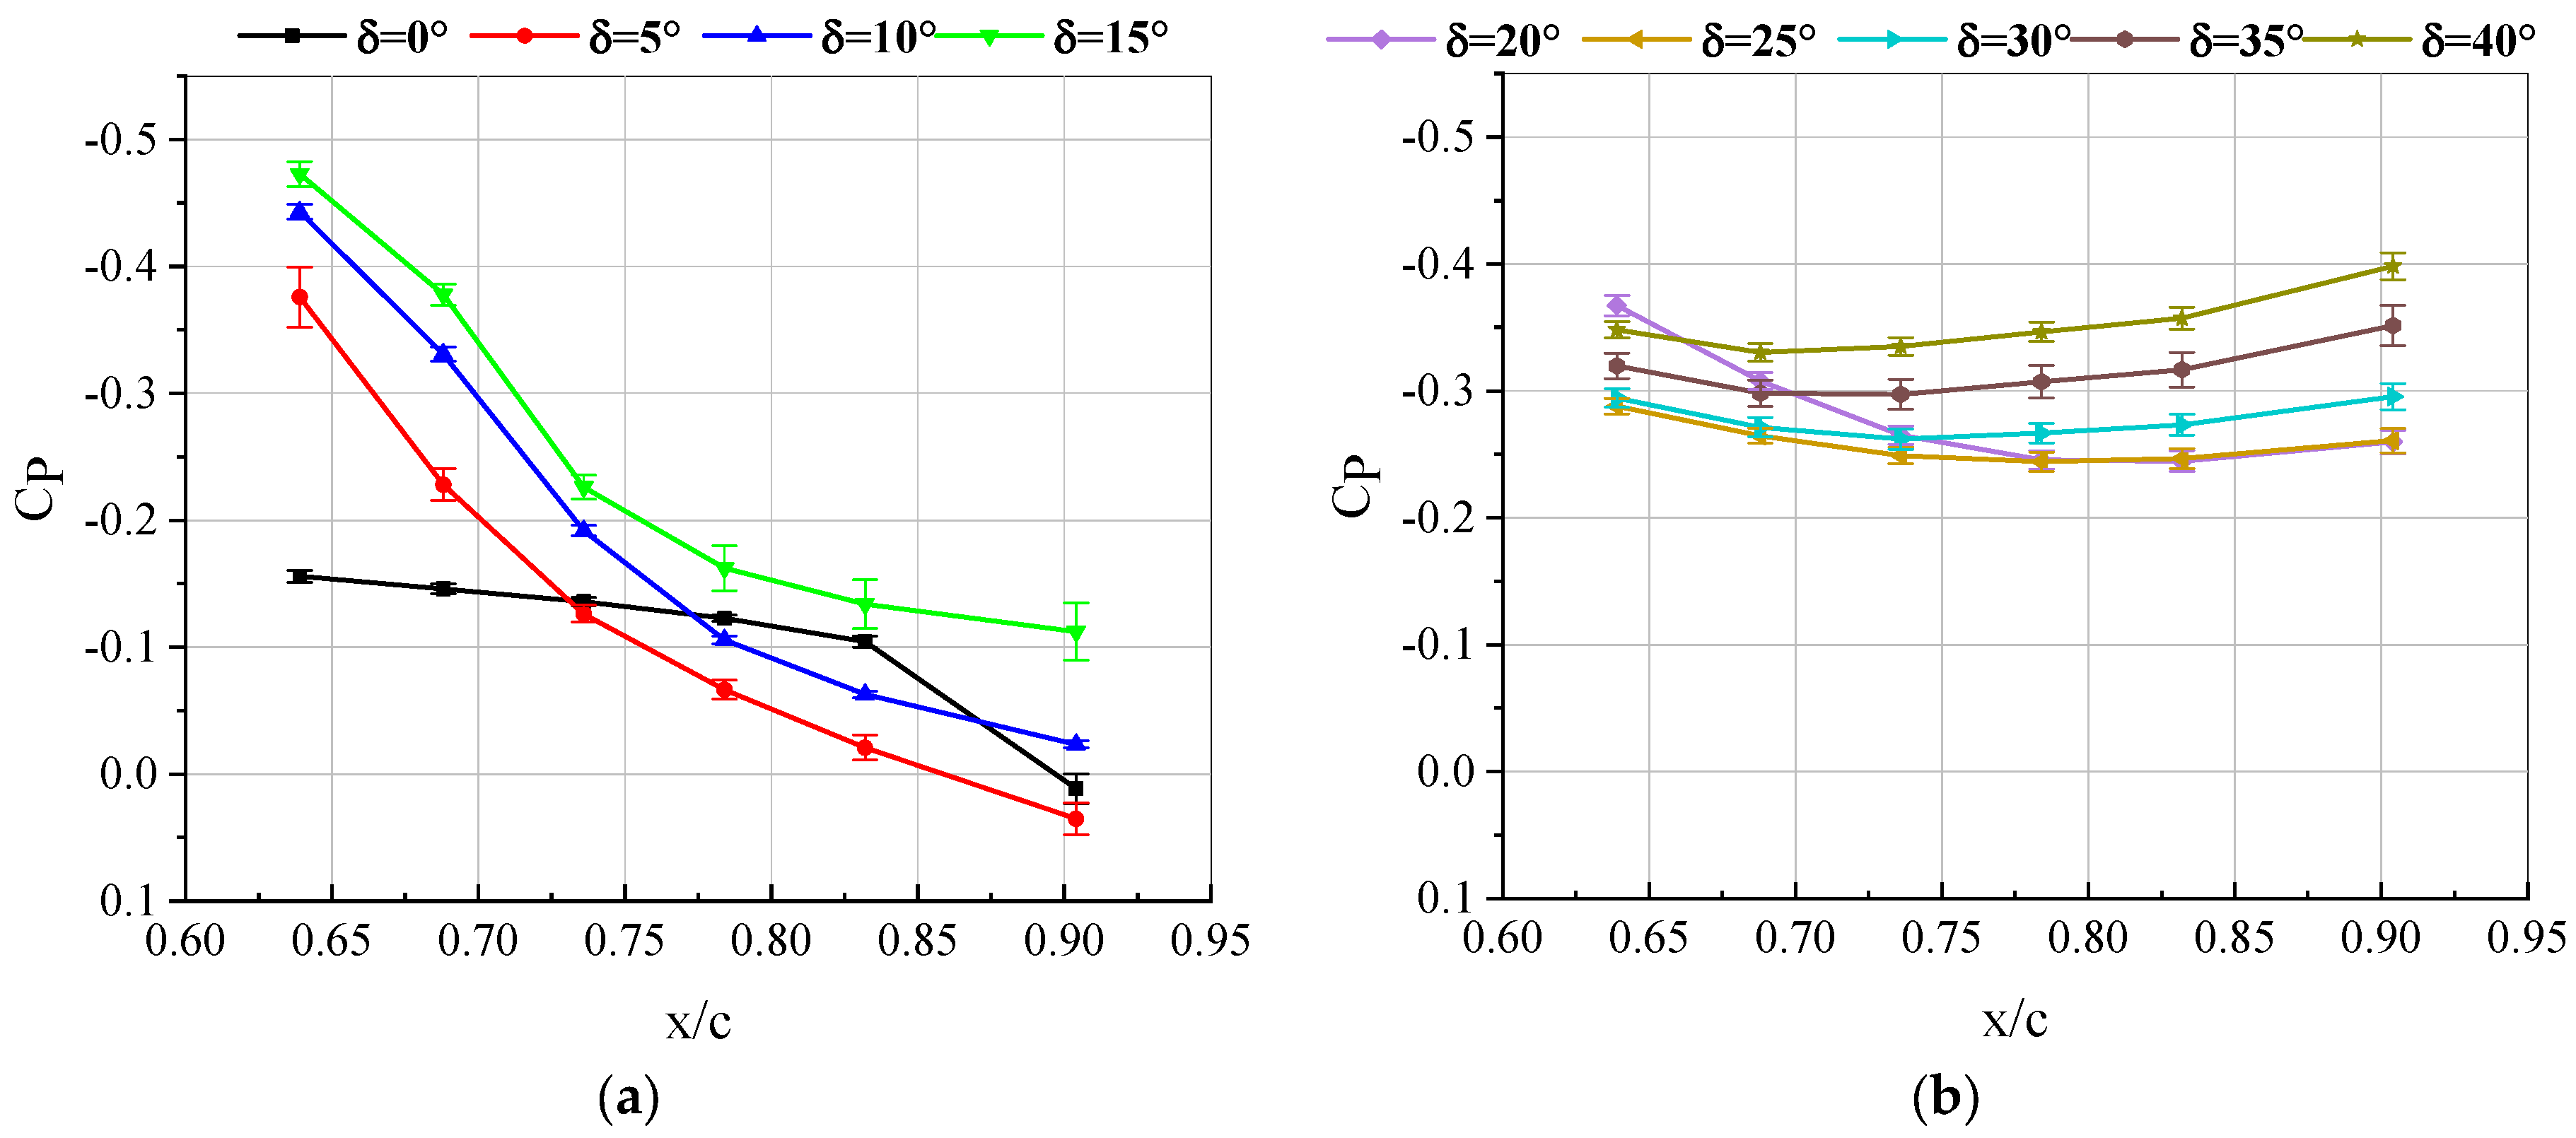
The reasons for the change of the lateral force coefficient are explored through the study of rudder surface pressure. Under the condition of β = 0° and Re = 2.12 × 10⁵, the pressure coefficient curve of the rudder surface at different rudder deflection angles is shown in Figure 8. It can be seen from the figure that when the rudder deflection angle is less than 15°, the surface pressure coefficient curve presents a significant “negative slope”, and the negative pressure gradually decreases along the flow direction. There is a pressure gradient due to the attached flow on the rudder. With the rudder deflection angle increase, the overall pressure coefficient curves “move up”. The negative pressure at the rudder trailing edge increases. However, when the rudder deflection angle is increased to 20°, especially after 25°, the slope of the pressure coefficient curve is entirely different from that when the rudder deflection angle is slight, showing a slope close to “0”. Flow separation occurs on the rudder, and the pressure taps are all in the flow separation zone. The change of the pressure data curve corresponds to the gradual slope of the lateral force coefficient curve above.
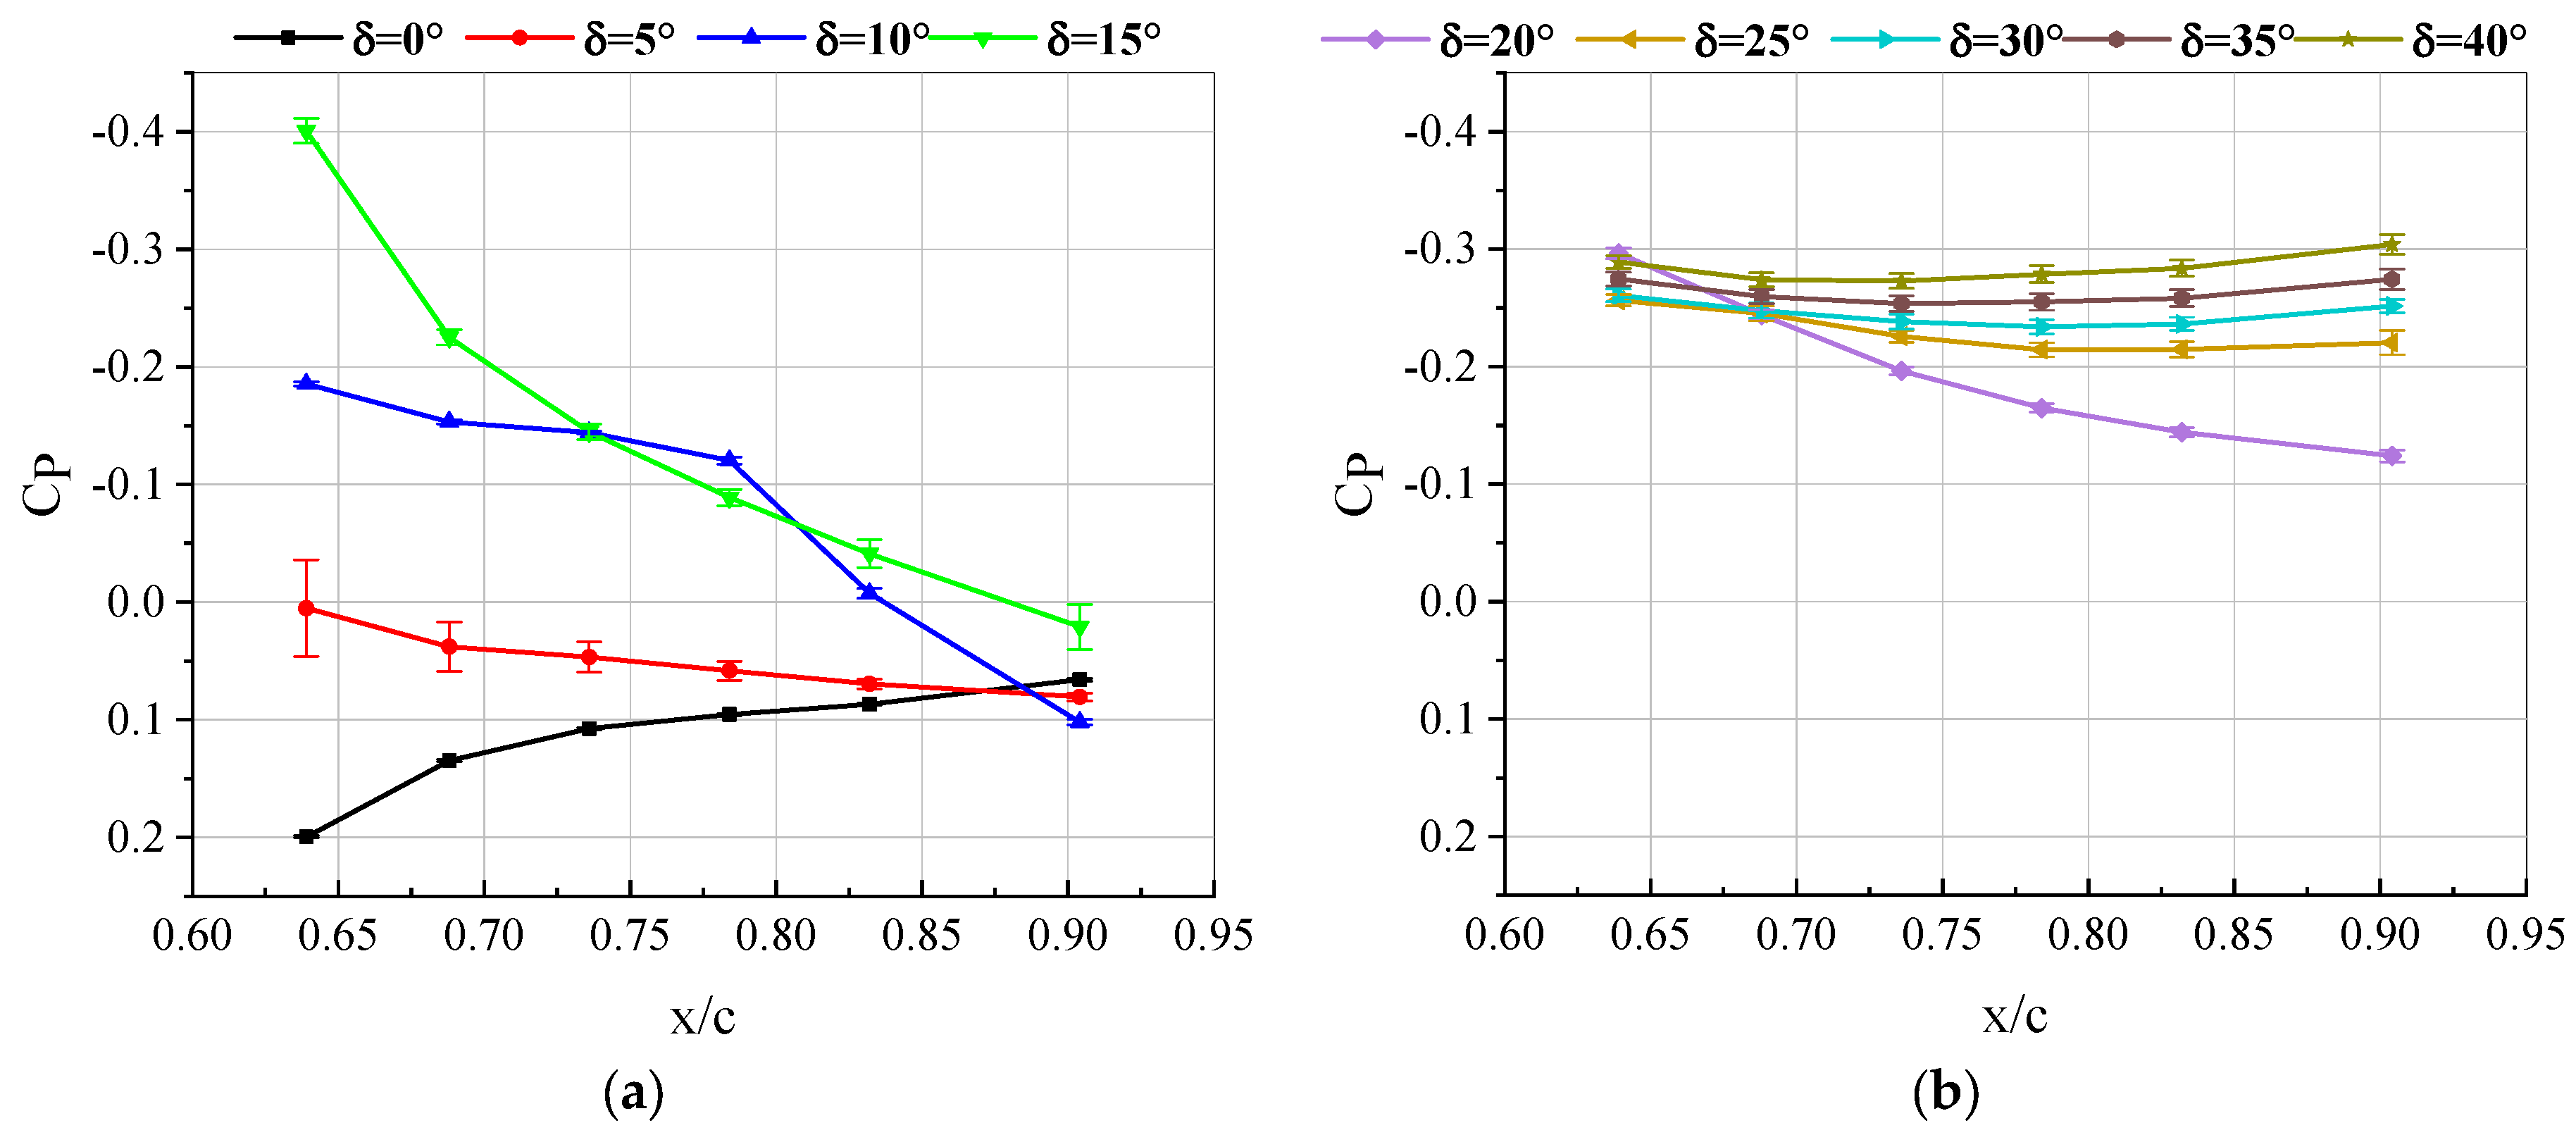
Under the condition of β = −10° and Re = 2.12 × 10⁵, the pressure coefficient curve of the rudder surface at different rudder deflection angles is shown in Figure 9. Since the preset sideslip angle is −10°, the upper surface of the rudder is windward when the rudder deflection angle is 0° and 5°, and the surface pressure is positive. When the rudder deflection angle is 15°, the pressure curve is consistent with that without the sideslip angle, and the surface pressure coefficient curve presents a “negative slope”. When the rudder deflection angle is greater than 20°, the curve of the rudder surface pressure coefficient is basically consistent with that without the sideslip. In addition, after the rudder deflection angle is greater than 25°, flow separation occurs on the rudder obviously. Each pressure-measuring hole is in the flow separation zone, and the measured pressure coefficient changes within the range of 0.1.
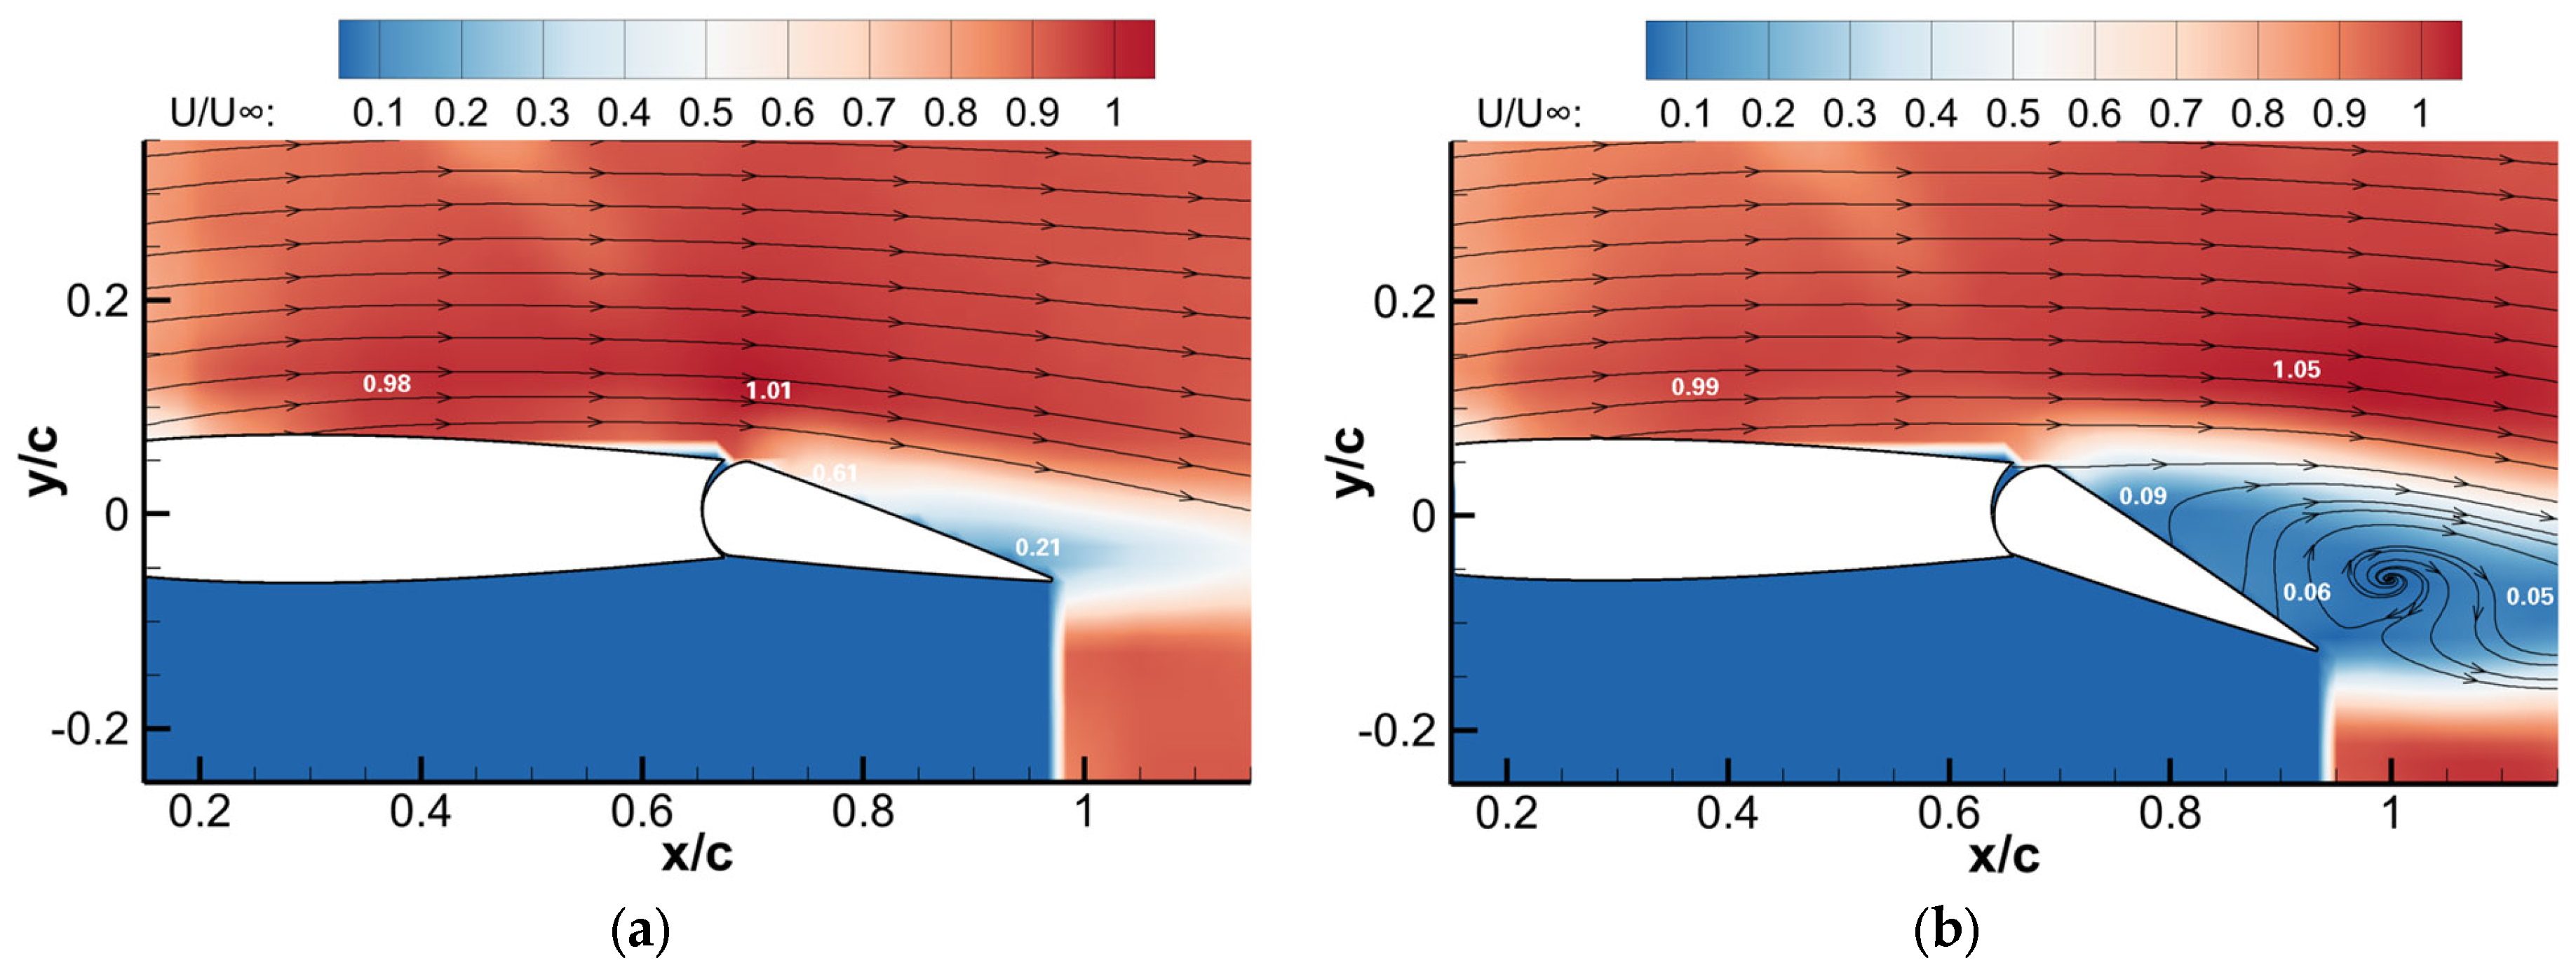
The rudder surface pressure data can only measure the surface flow field information and cannot measure the spatial flow field of the vertical tail model. The PIV experiment can determine the source of the vertical tail lateral force growth and obtain the control law of the vertical tail oscillating jet. Figure 10 is the velocity cloud diagram and streamline diagram of the upper wing surface of the vertical tail with different rudder deflection angles at a 0° sideslip angle. When the rudder deflection angle is 15°, the flow separation phenomenon can be observed on the rudder. The dimensionless velocity is 0.21 at the trailing edge of the rudder. The flow separation starts to develop from the trailing edge of the rudder. In addition, the wing space flow field has a partial acceleration area on the rudder hinge. This phenomenon is caused by the deflection of the rudder surface, which changes the flow field in space and is also unobservable in measuring the surface pressure. When the rudder deflection angle increases to 30°, the separated vortex structure on the upper surface of the rudder is more abundant. In addition, the separation area is extended to the full chord length of the rudder. We can be seen from the velocity cloud diagram that the velocity in the flow separation area on the rudder is close to 0. In contrast, the spatial flow field on the stabilizer is unchanged with the change of the rudder deflection angle.
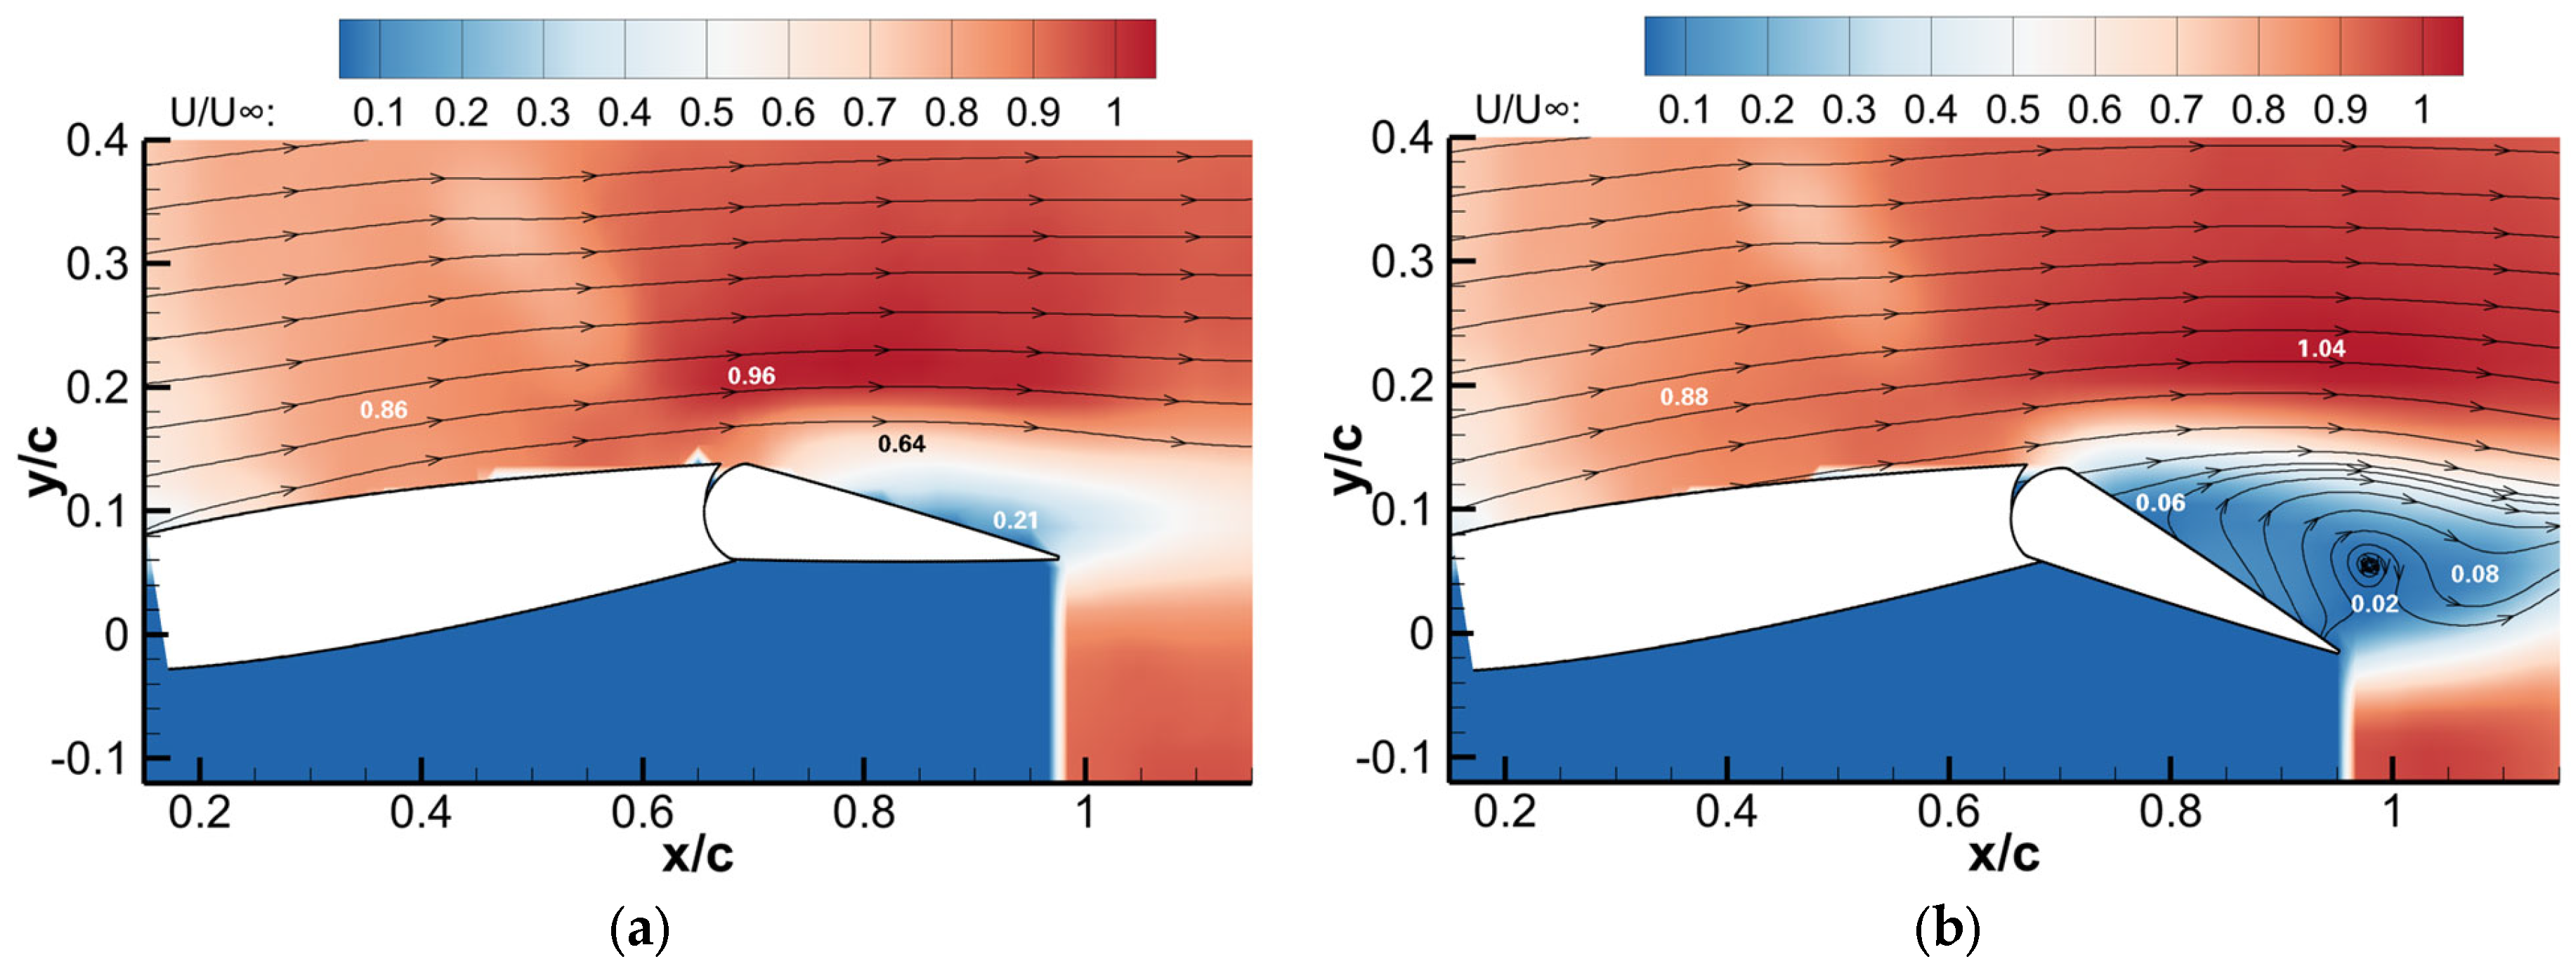
Figure 11 is the velocity cloud diagram and streamline diagram of the upper surface of the vertical tail with different rudder deflection angles at a −10° sideslip angle. The velocity of the mainstream on the stabilizer decreased significantly to about 0.86. When the rudder deflection angle is 15°, the flow separation phenomenon occurs on the upper surface of the rudder, and the near-wall streamline cannot cling to the rudder surface. Due to rudder deflection, the mainstream speed on the rudder increases to 0.96. When the rudder deflection angle is increased to 30°, the flow on the rudder is wholly separated, and the change law of the spatial flow field is consistent with that when the sideslip angle is 0°. However, the degree of flow separation on the rudder is lower than when the sideslip angle is 0°.

3.3. Study on Flow Control of Vertical Tail under Different Momentum Coefficients

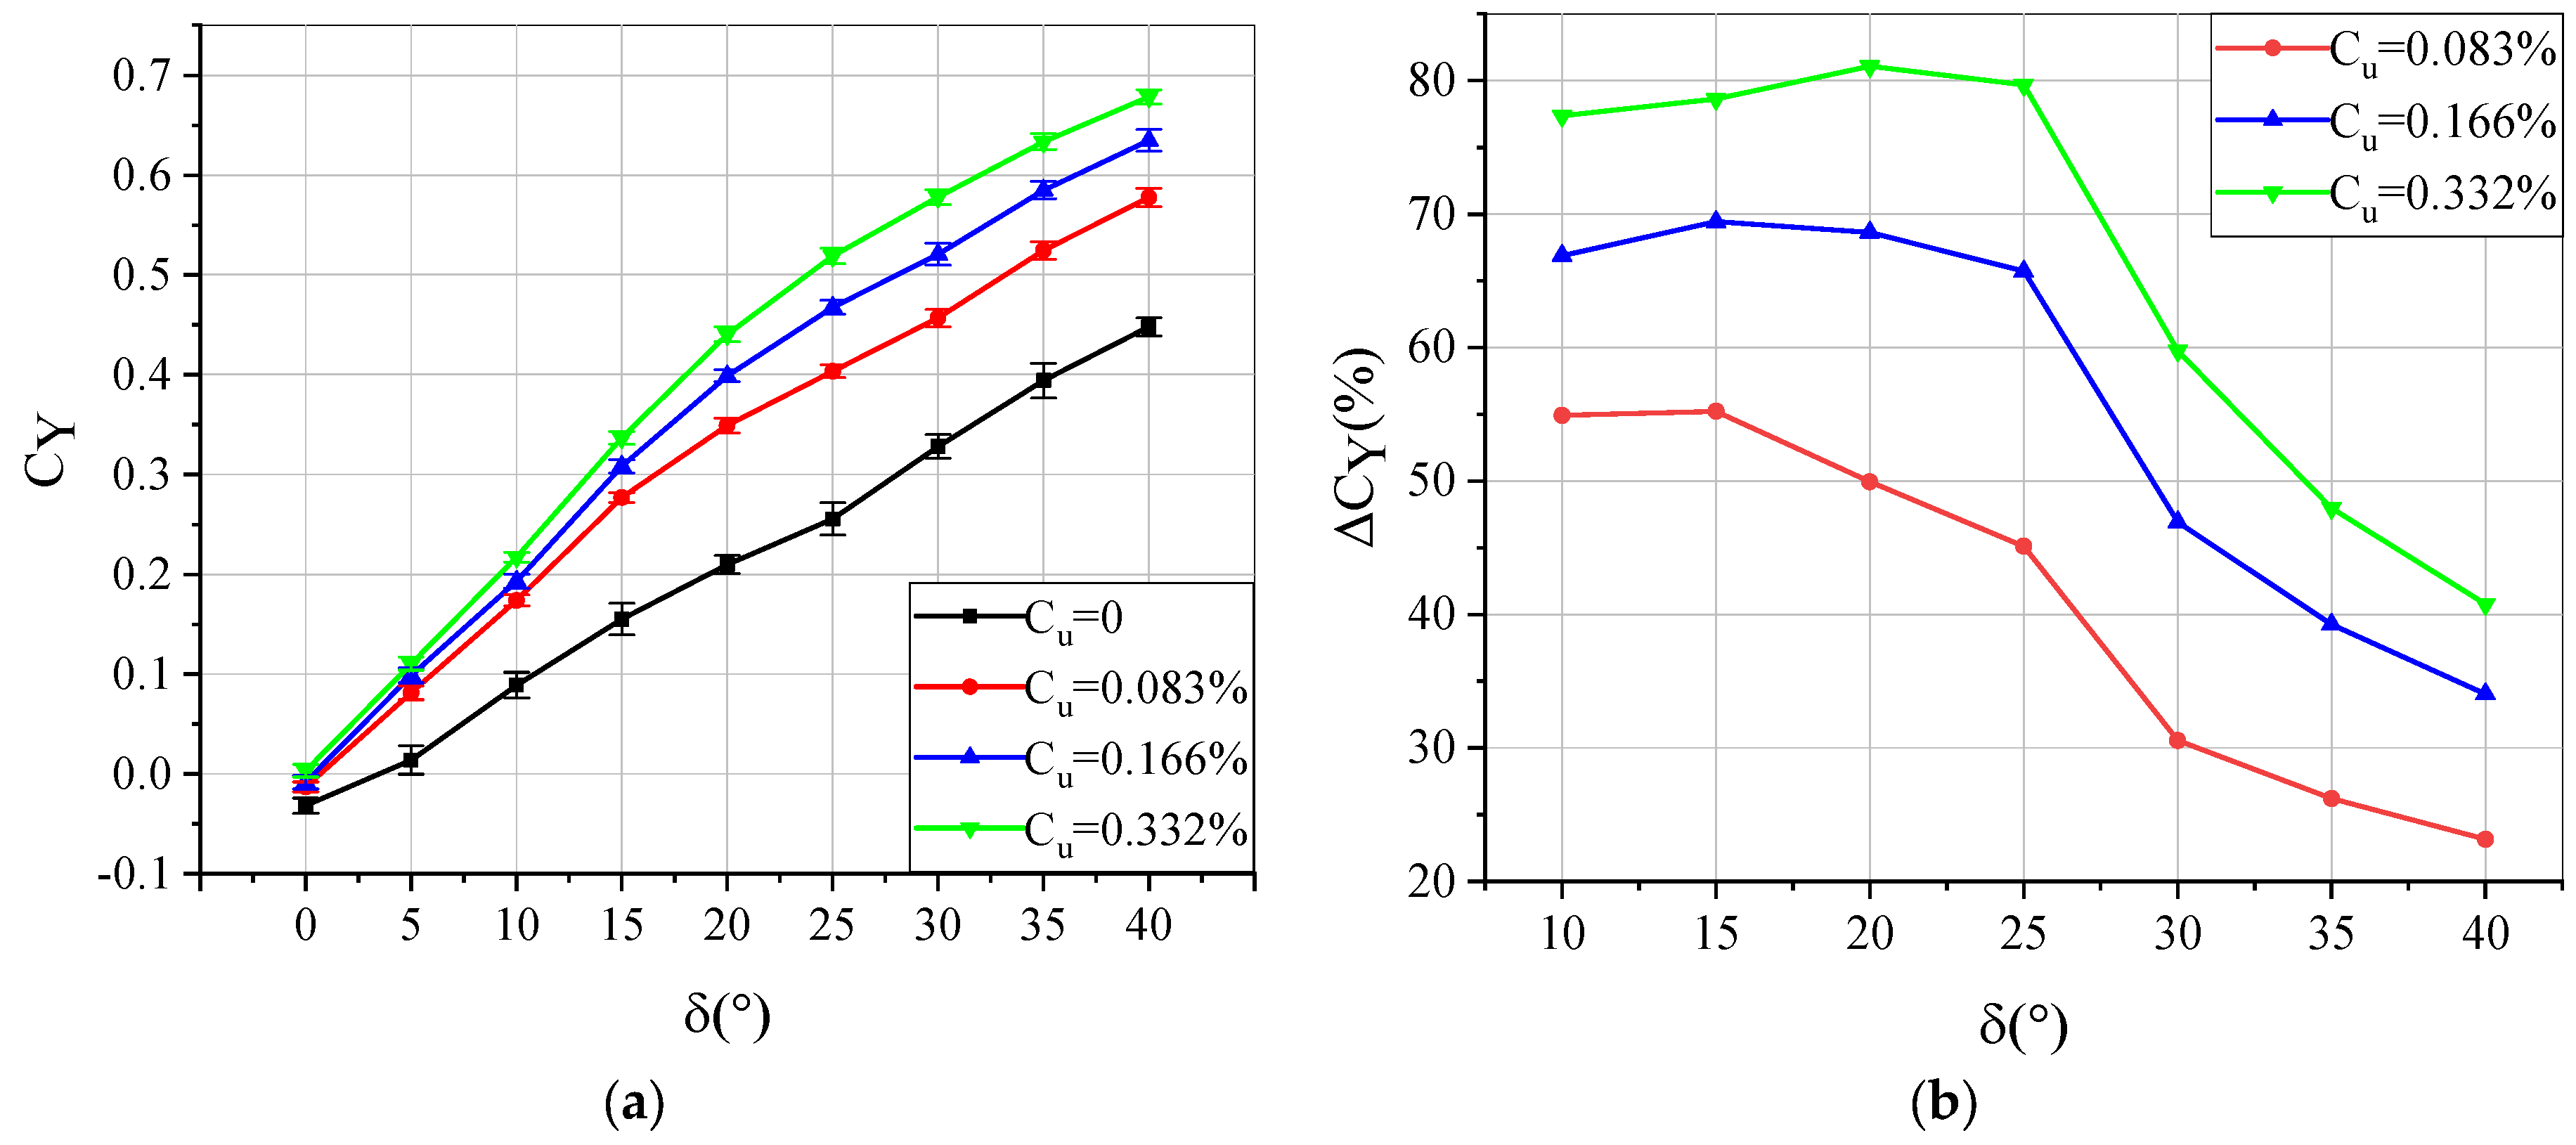
First, the gain of three gradually increasing momentum coefficients on the vertical tail lateral force coefficient is studied. Since the jet’s direction is perpendicular to the direction of the vertical tail’s lateral force, the jet does not directly increase the vertical tail’s lateral force. Figure 12 shows that when β = 0° and Re = 2.12 × 10⁵, the vertical tail model lateral force coefficient and lateral force coefficient increment under different momentum coefficient controls. After the oscillating jet flow control is applied to the vertical tail model, the lateral force coefficient is significantly increased, and the lateral force coefficient increases with the increase in the momentum coefficient of the actuator. Within the range of 0°~10° rudder deflection angle, the three curves applied with flow control are relatively close, because when the rudder deflection angle is small, flow separation does not occur on the rudder, and the oscillating jet flow control applied at this time obtains the lateral force increment by increasing the vertical tail circulation. When the momentum coefficient of the actuator is 0.083%, the maximum increment of the vertical tail lateral force coefficient is 55.2%. As can be seen from the baseline, the lateral force coefficient is low at a small rudder deflection angle. When a jet with a velocity much greater than the incoming velocity is applied, the lateral force increment is considerable compared to the baseline. Then, with the increase in the rudder deflection angle, the increment of the lateral force coefficient decreases gradually. When the rudder deflection angle is 40°, the increment of the lateral force coefficient is only 23.2%. When increasing the momentum coefficient of the actuator to 0.166%, the rudder deflection angle is 15°, and the maximum lateral force coefficient increment is 69.4%. When the momentum coefficient of the actuator is increased to 0.332%, the lateral force coefficient is further improved. When the rudder deflection angle is 20°, the maximum lateral force increment reaches 81.1%. Under the flow control of this momentum coefficient, when the rudder deflection angle is less than 25°, the lateral force coefficient increment can reach nearly 80%, which is a very ideal control effect.
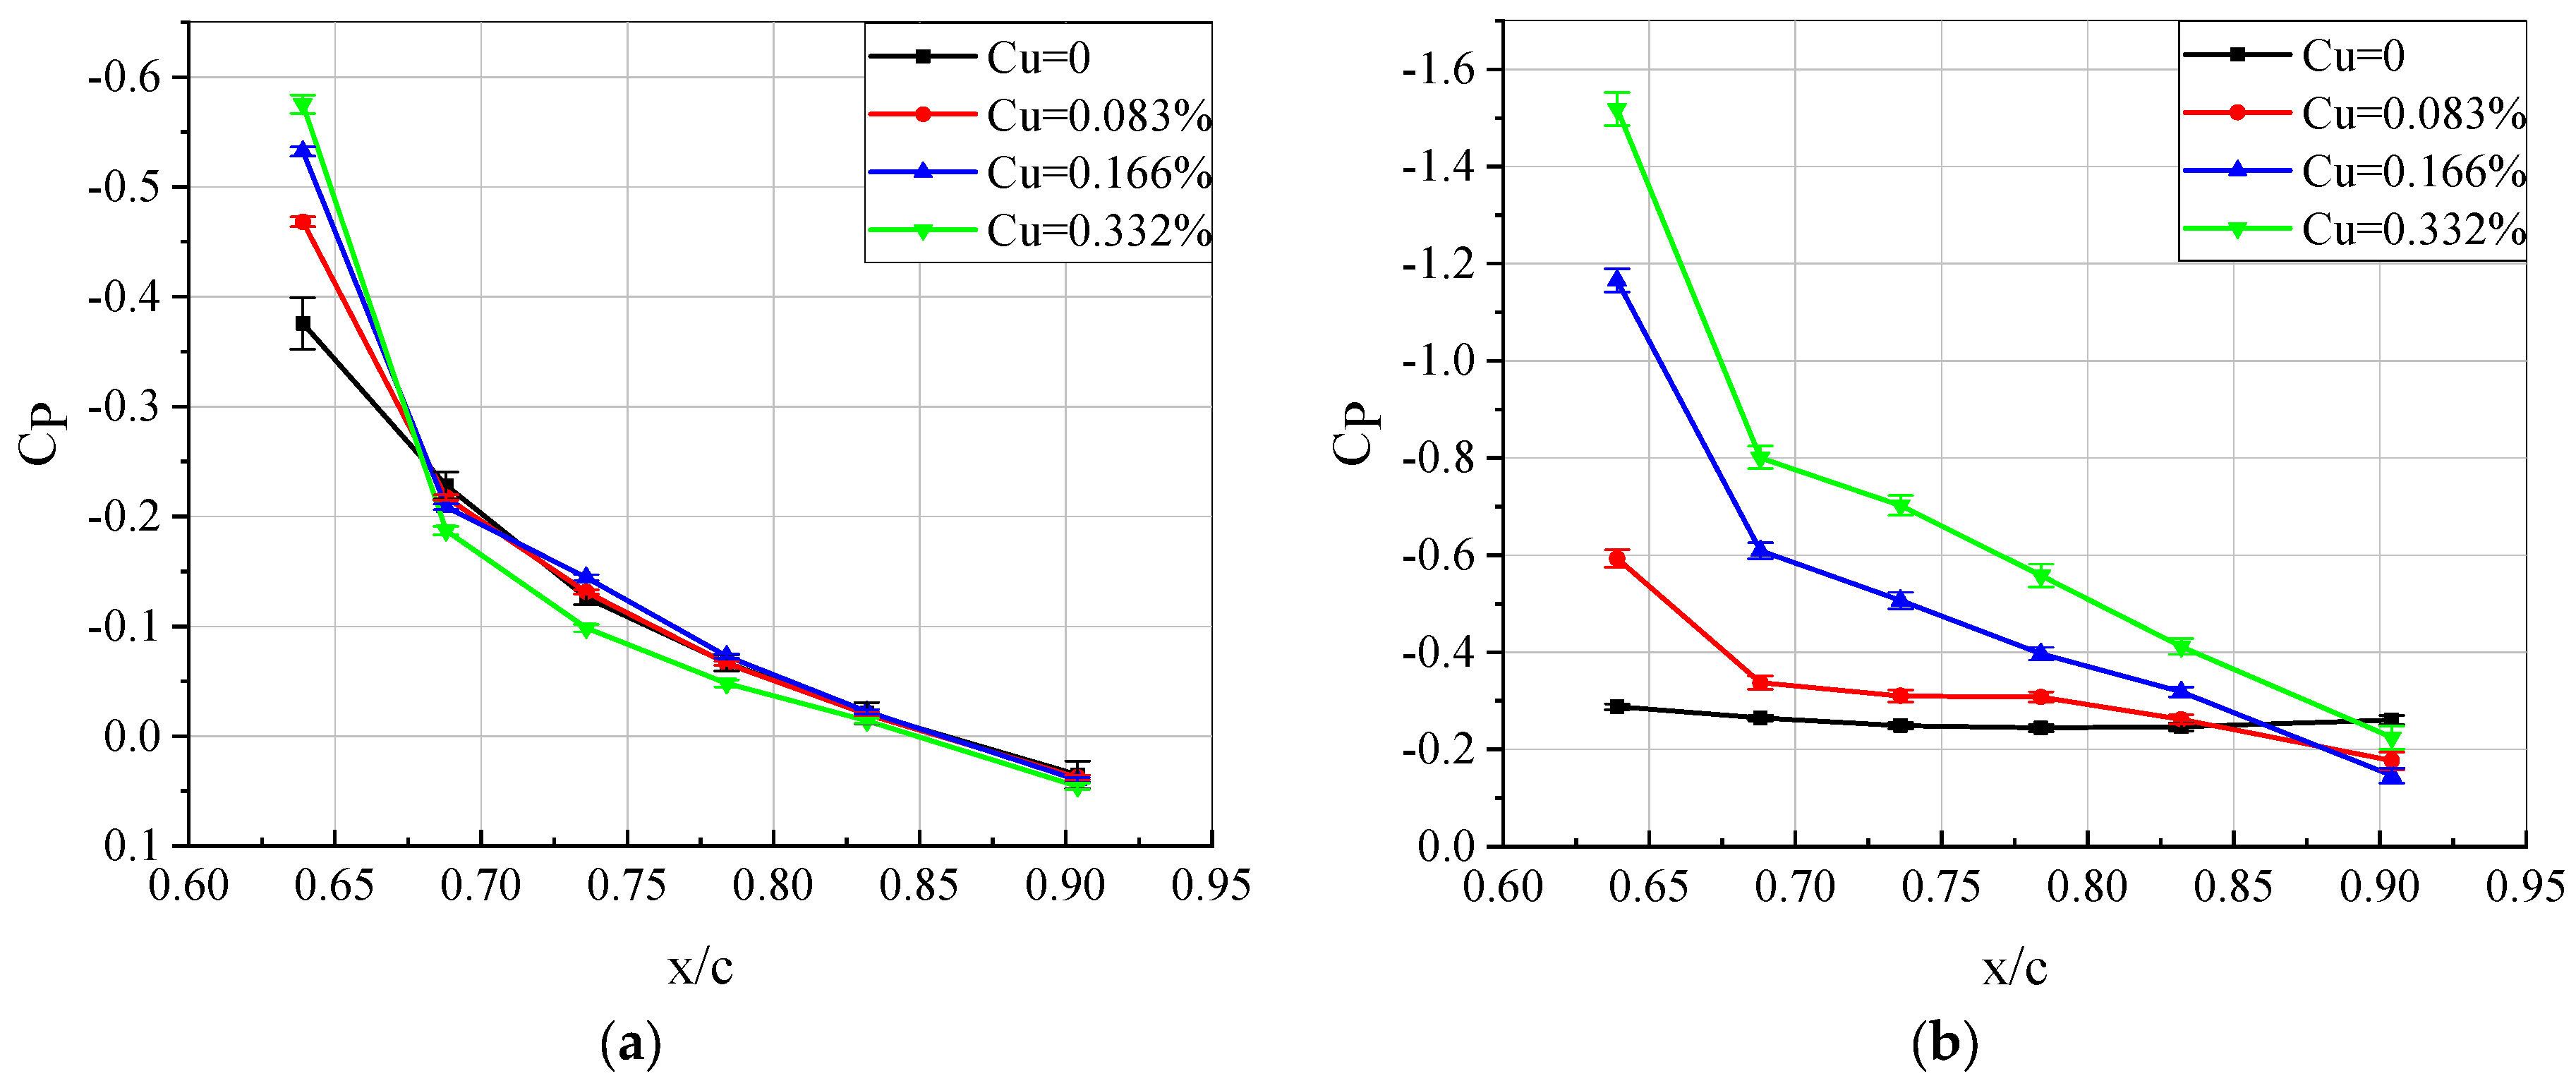
Figure 13 shows that β = 0° and Re = 2.12 × 10⁵, the pressure coefficient curves of the rudder surface under different momentum coefficient jet controls when the rudder deflection angle is 5° and 25°. When the rudder deflection angle is 5°, there is attached flow on the vertical tail rudder. With the increase in the applied oscillating jet momentum coefficient, except for the increase in the negative pressure measured by the pressure-measuring hole near the outlet of the actuator, the downstream pressure coefficient changes little, and the rudder is attached. When the rudder deflection angle is 25°, the pressure coefficient curve without flow control shows an obvious “platform”, indicating that the airflow on the rudder is completely separated at this time. After the flow control is applied, a significantly increased negative pressure is measured at the pressure-measuring hole at the outlet of the actuator, and a “suction peak” appears. With the increase in the momentum coefficient of the oscillating jet, the negative pressure measured by the pressure measuring hole closest to the outlet of the actuator continues to increase, and the whole pressure coefficient curve shows an obvious slope. The pressure coefficient curves of the upper wing surface of the vertical tail are more “full”, which is reflected in the force measurement results of the aerodynamic force obtained by the surface pressure integration. The pressure coefficient curve of Figure 13b is consistent with the results of Melton’s [25] research. It proves that the pressure tap arrangement in this paper is reasonable and reduces the collection of unnecessary data. That is, the lateral force of the vertical tail increases. The measured pressure data are consistent with the measured force results, which show that the oscillating jet flow control can slow down or even eliminate the flow separation on the upper surface of the rudder, thereby increasing the vertical tail lateral force.
According to the aerodynamic measurement results, when the vertical tail sideslip angle is 0° and the rudder deflection angle is 15°, the control effect of the oscillating jet is obvious, and the lateral force increment under the control of different momentum coefficients is different. Therefore, we have studied the space flow field distribution in the vertical tail controlled by the momentum coefficients of various actuators under this condition.
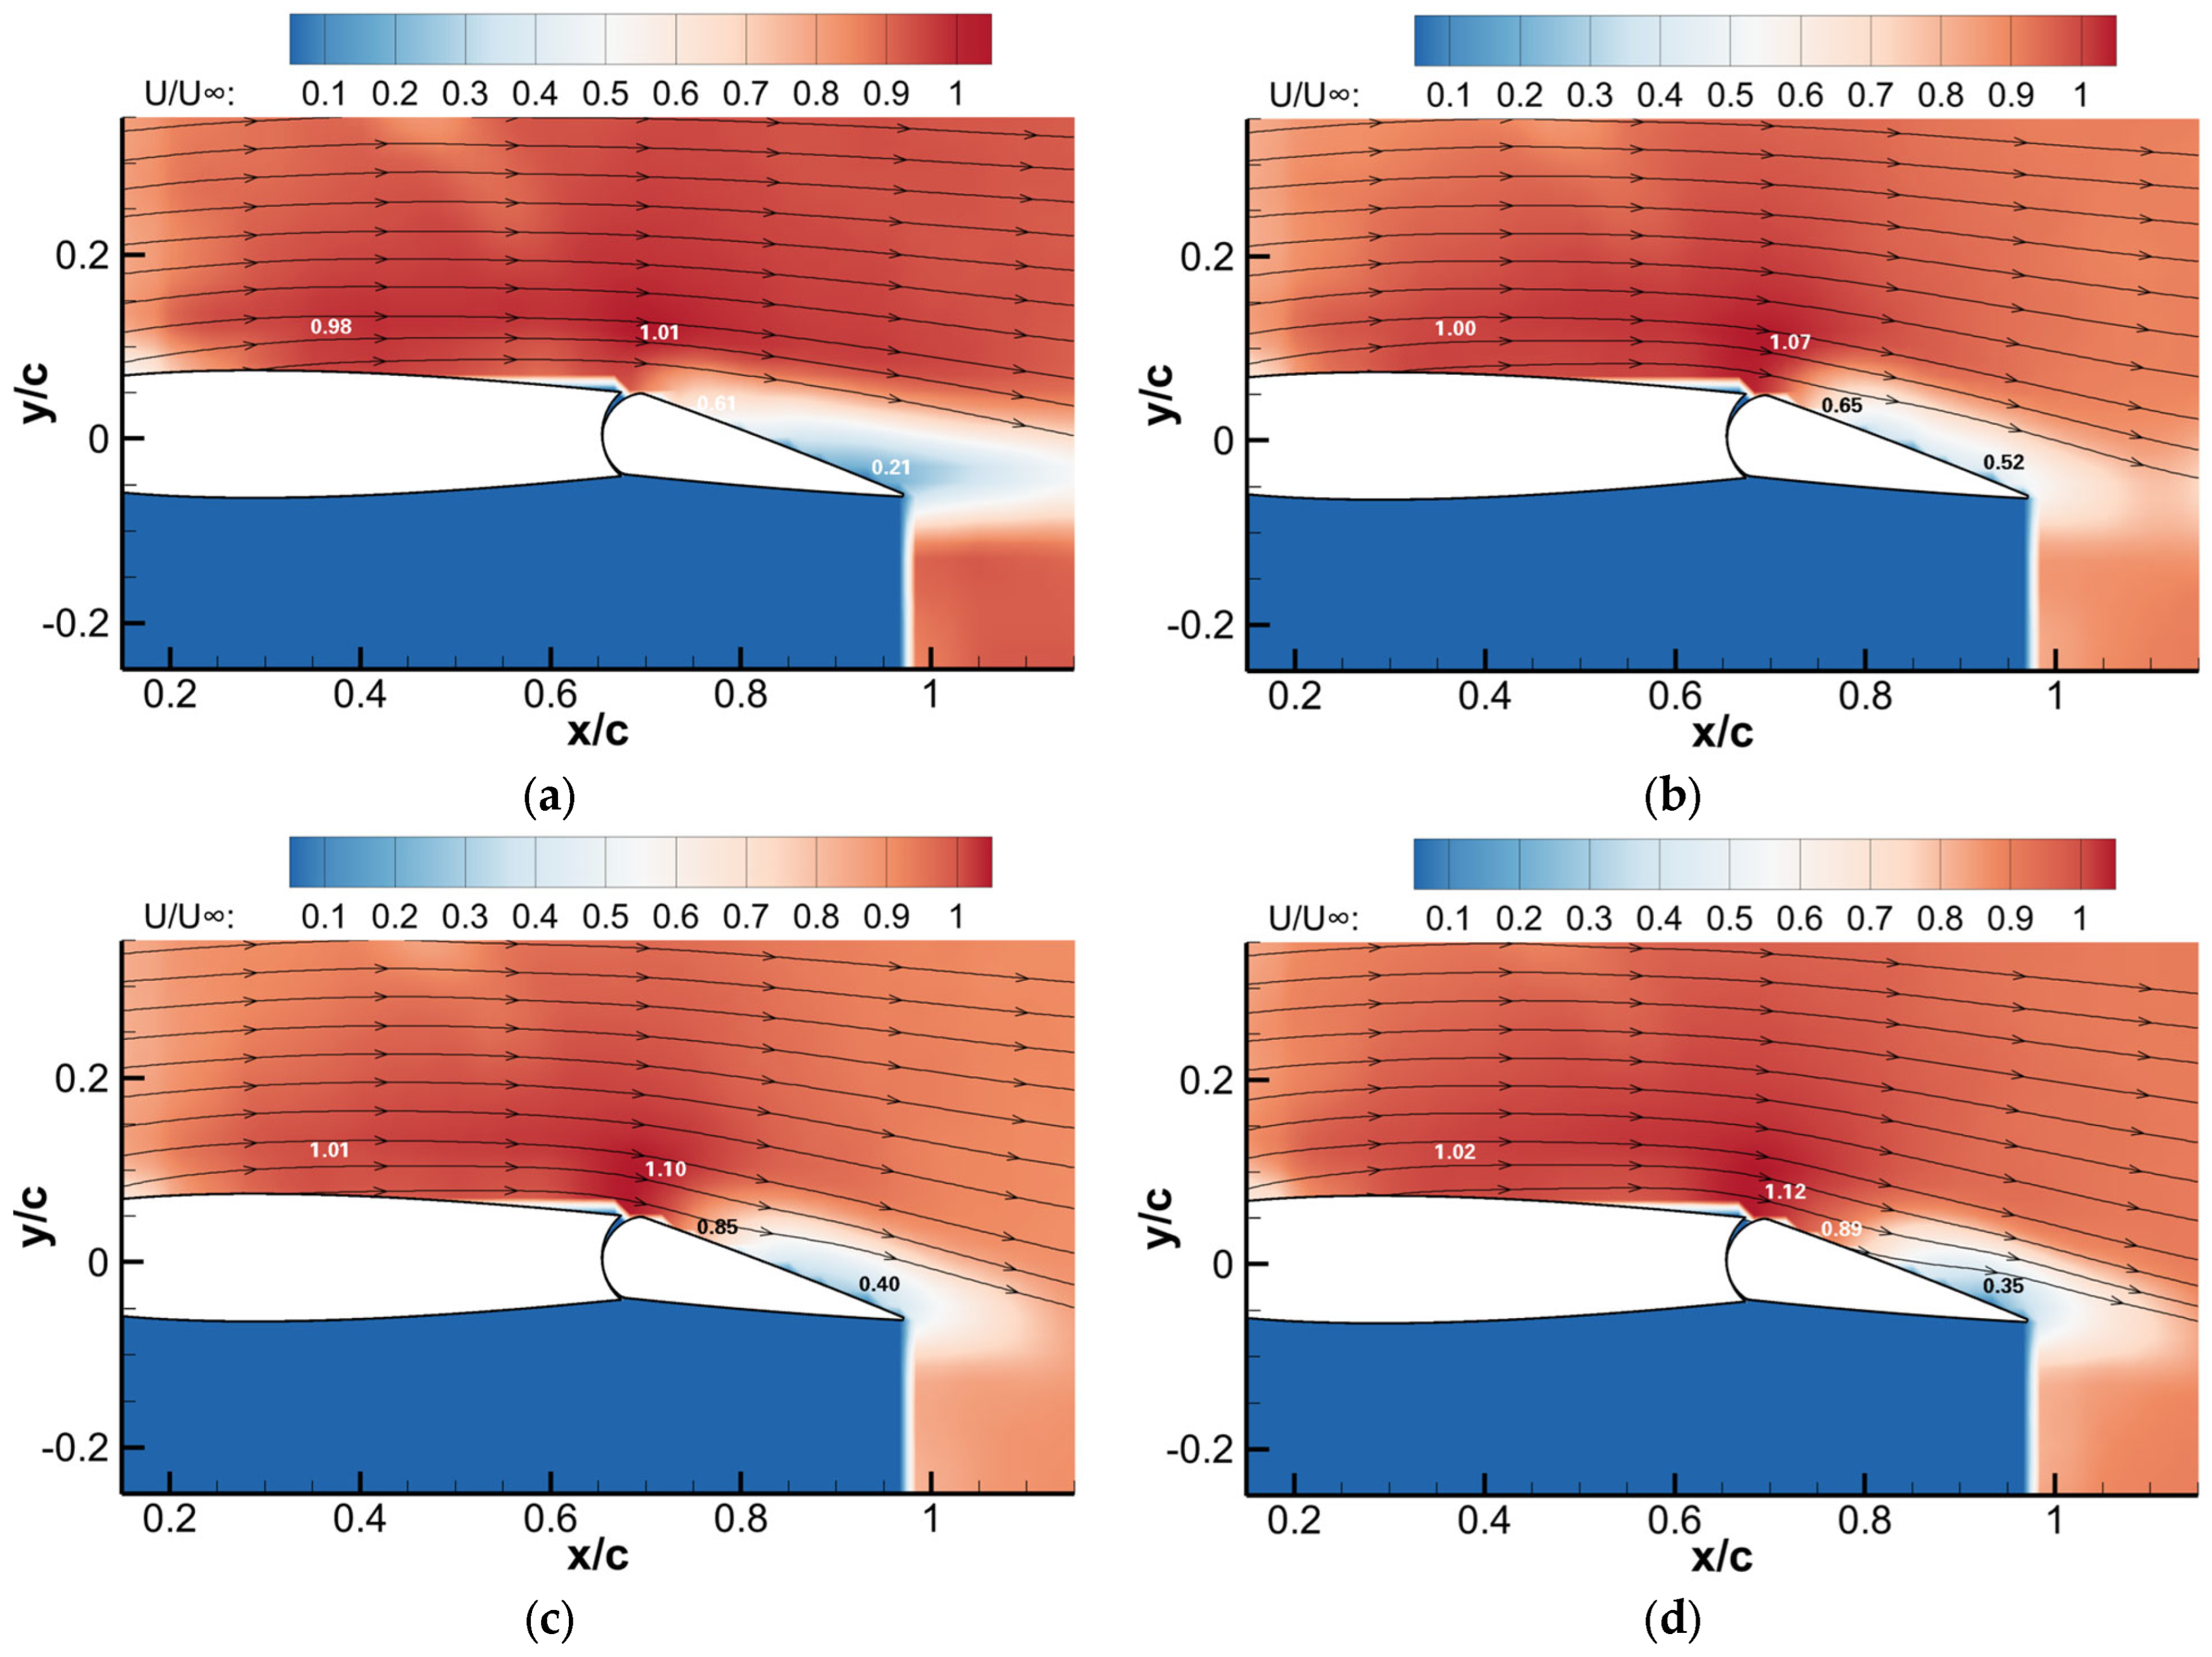
Figure 14 shows that β = 0°, δ = 15°, and Re = 2.12 × 10⁵, with the spatial flow field distribution of the vertical tail model under different momentum coefficient controls. When no flow control is applied, flow separation occurs on the vertical tail rudder from the trailing edge, and the streamline is far away from the rudder. When the momentum coefficient of the oscillating jet is 0.083%, the separation area on the rudder decreases, the streamline begins to come close to the rudder surface, and there is a noticeable flow acceleration area on the stabilizer in front of the hinge. When the momentum coefficient of the oscillating jet is increased to 0.166%, the separation area on the rudder and the flow acceleration area on the stabilizer do not change significantly, and the exit velocity of the former momentum coefficient actuator is slightly increased. When the momentum coefficient of oscillating jet continues to increase to 0.332%, the streamline comes in close to the rudder, and the velocity diagram and streamline diagram change little from the previous momentum coefficient. In general, as the jet’s momentum coefficient increases, the flow velocity on the stabilizer varies little in the range of 0.98 to 1.02. The application of the exciter has little effect on the upstream flow and the dimensionless mainstream velocity at the hinge increases from 1.01 to 1.12. The effect of the exciter is evident here and downstream.

3.4. Study on Flow Control of Vertical Tail under Different Sideslip Angles

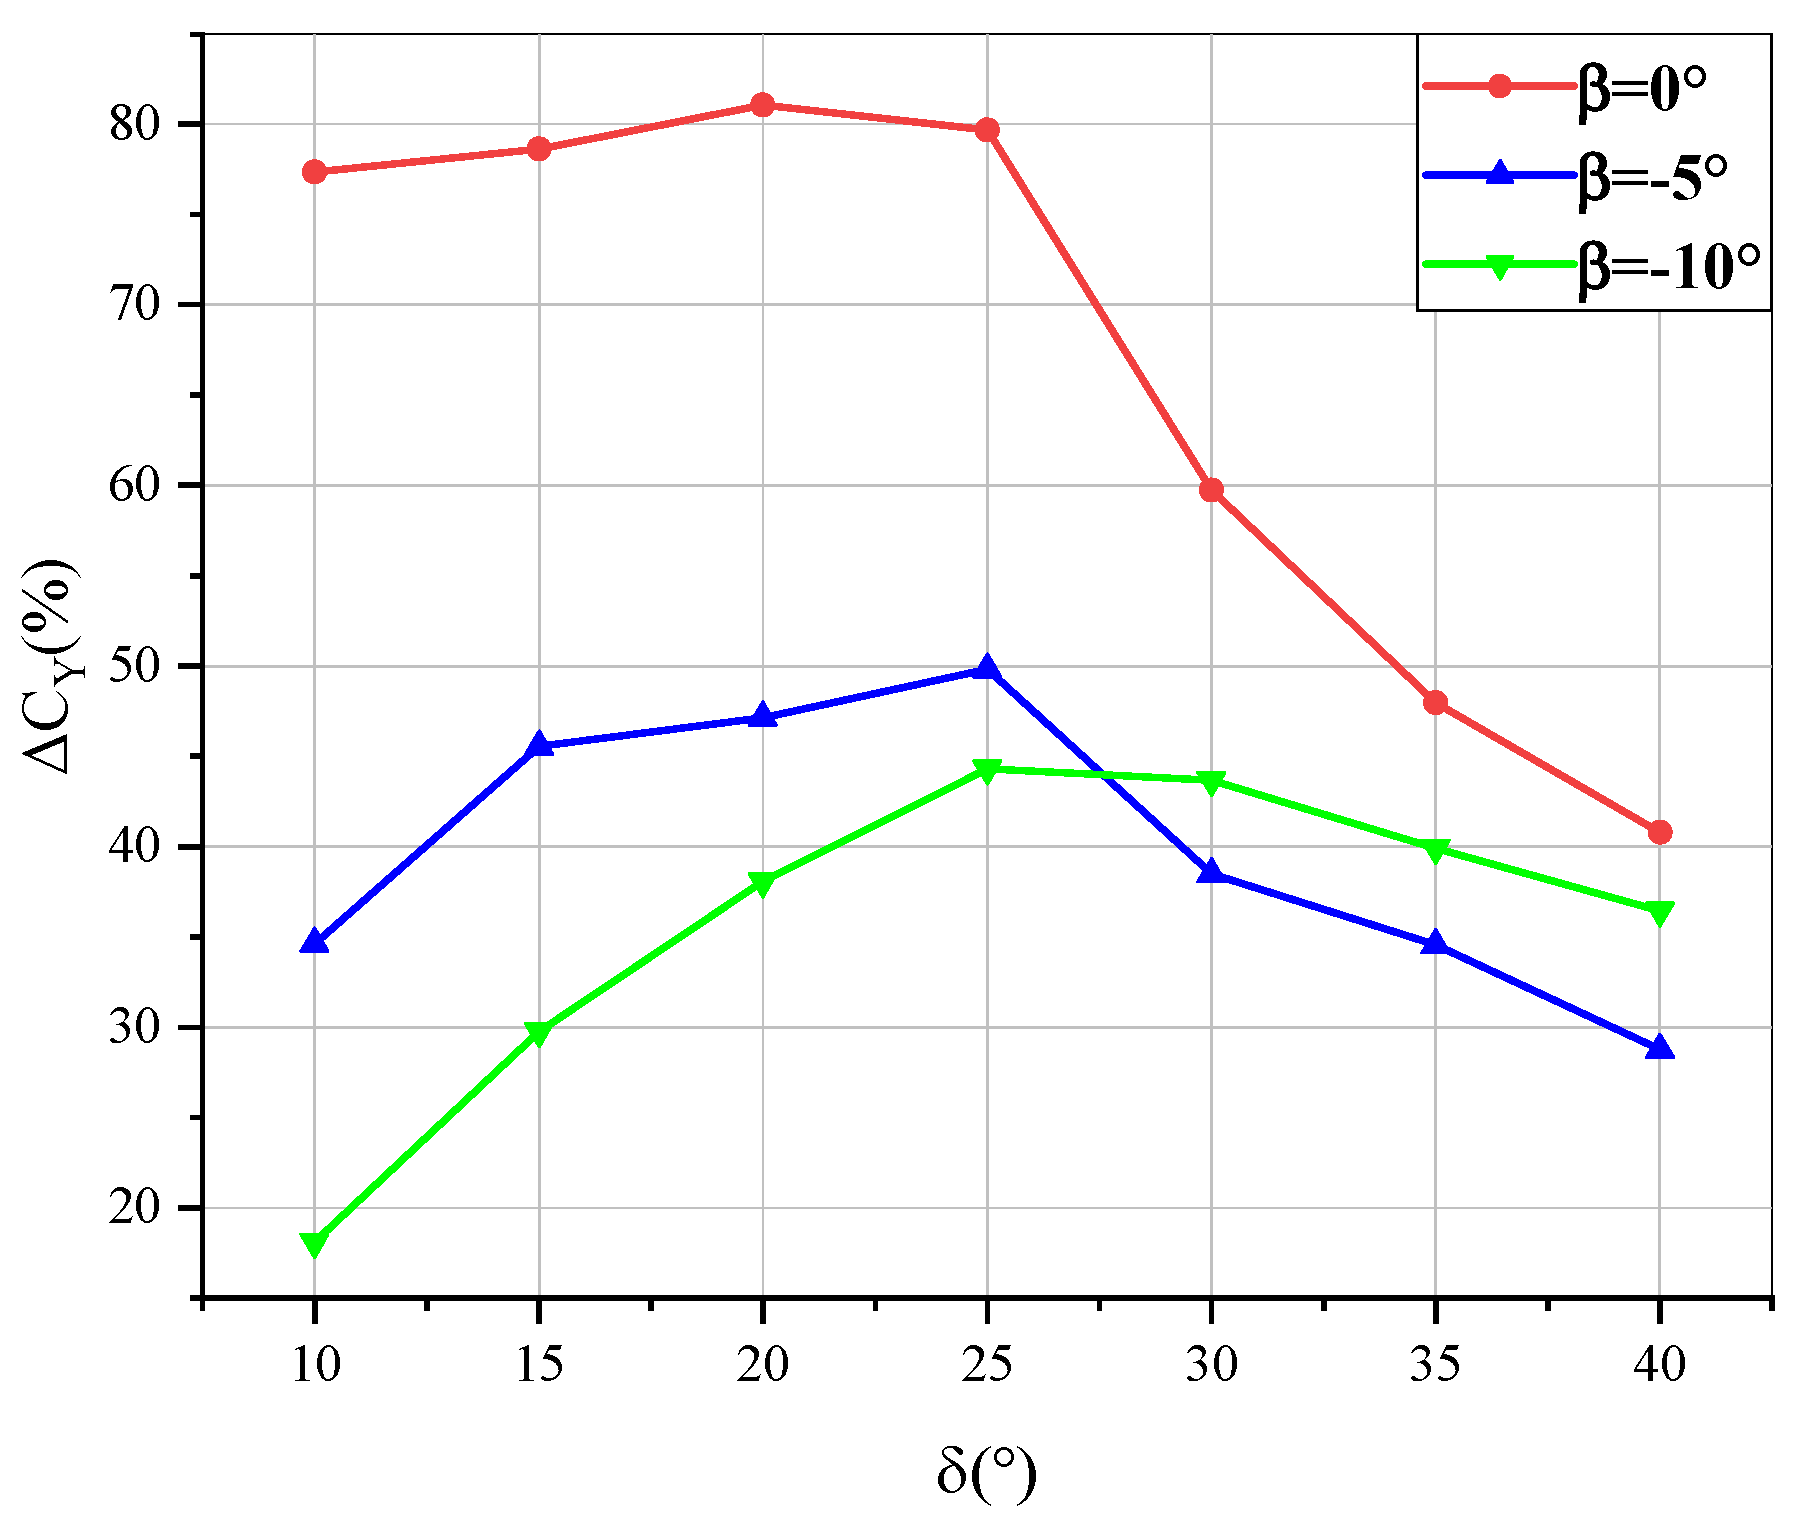
The flow control at a negative sideslip angle under typical working conditions is studied, and the increment and mechanism of flow control on the vertical tail lateral force coefficient under different sideslip angles from 0° to −10° are studied. Figure 15 shows the curve diagram of the lateral force increment of the vertical tail model under different sideslip angles after the flow control is applied. When the sideslip angle is negative, the lateral force increment brought by the actuator is significantly lower than that under zero sideslip, but the lateral force increment can basically reach 30%, which can significantly improve the yaw control capability of the aircraft at negative sideslip angles. When the sideslip angle is −10° and the rudder deflection angle is 40°, the maximum lateral force increment caused by the oscillating jet can reach 35.6%.
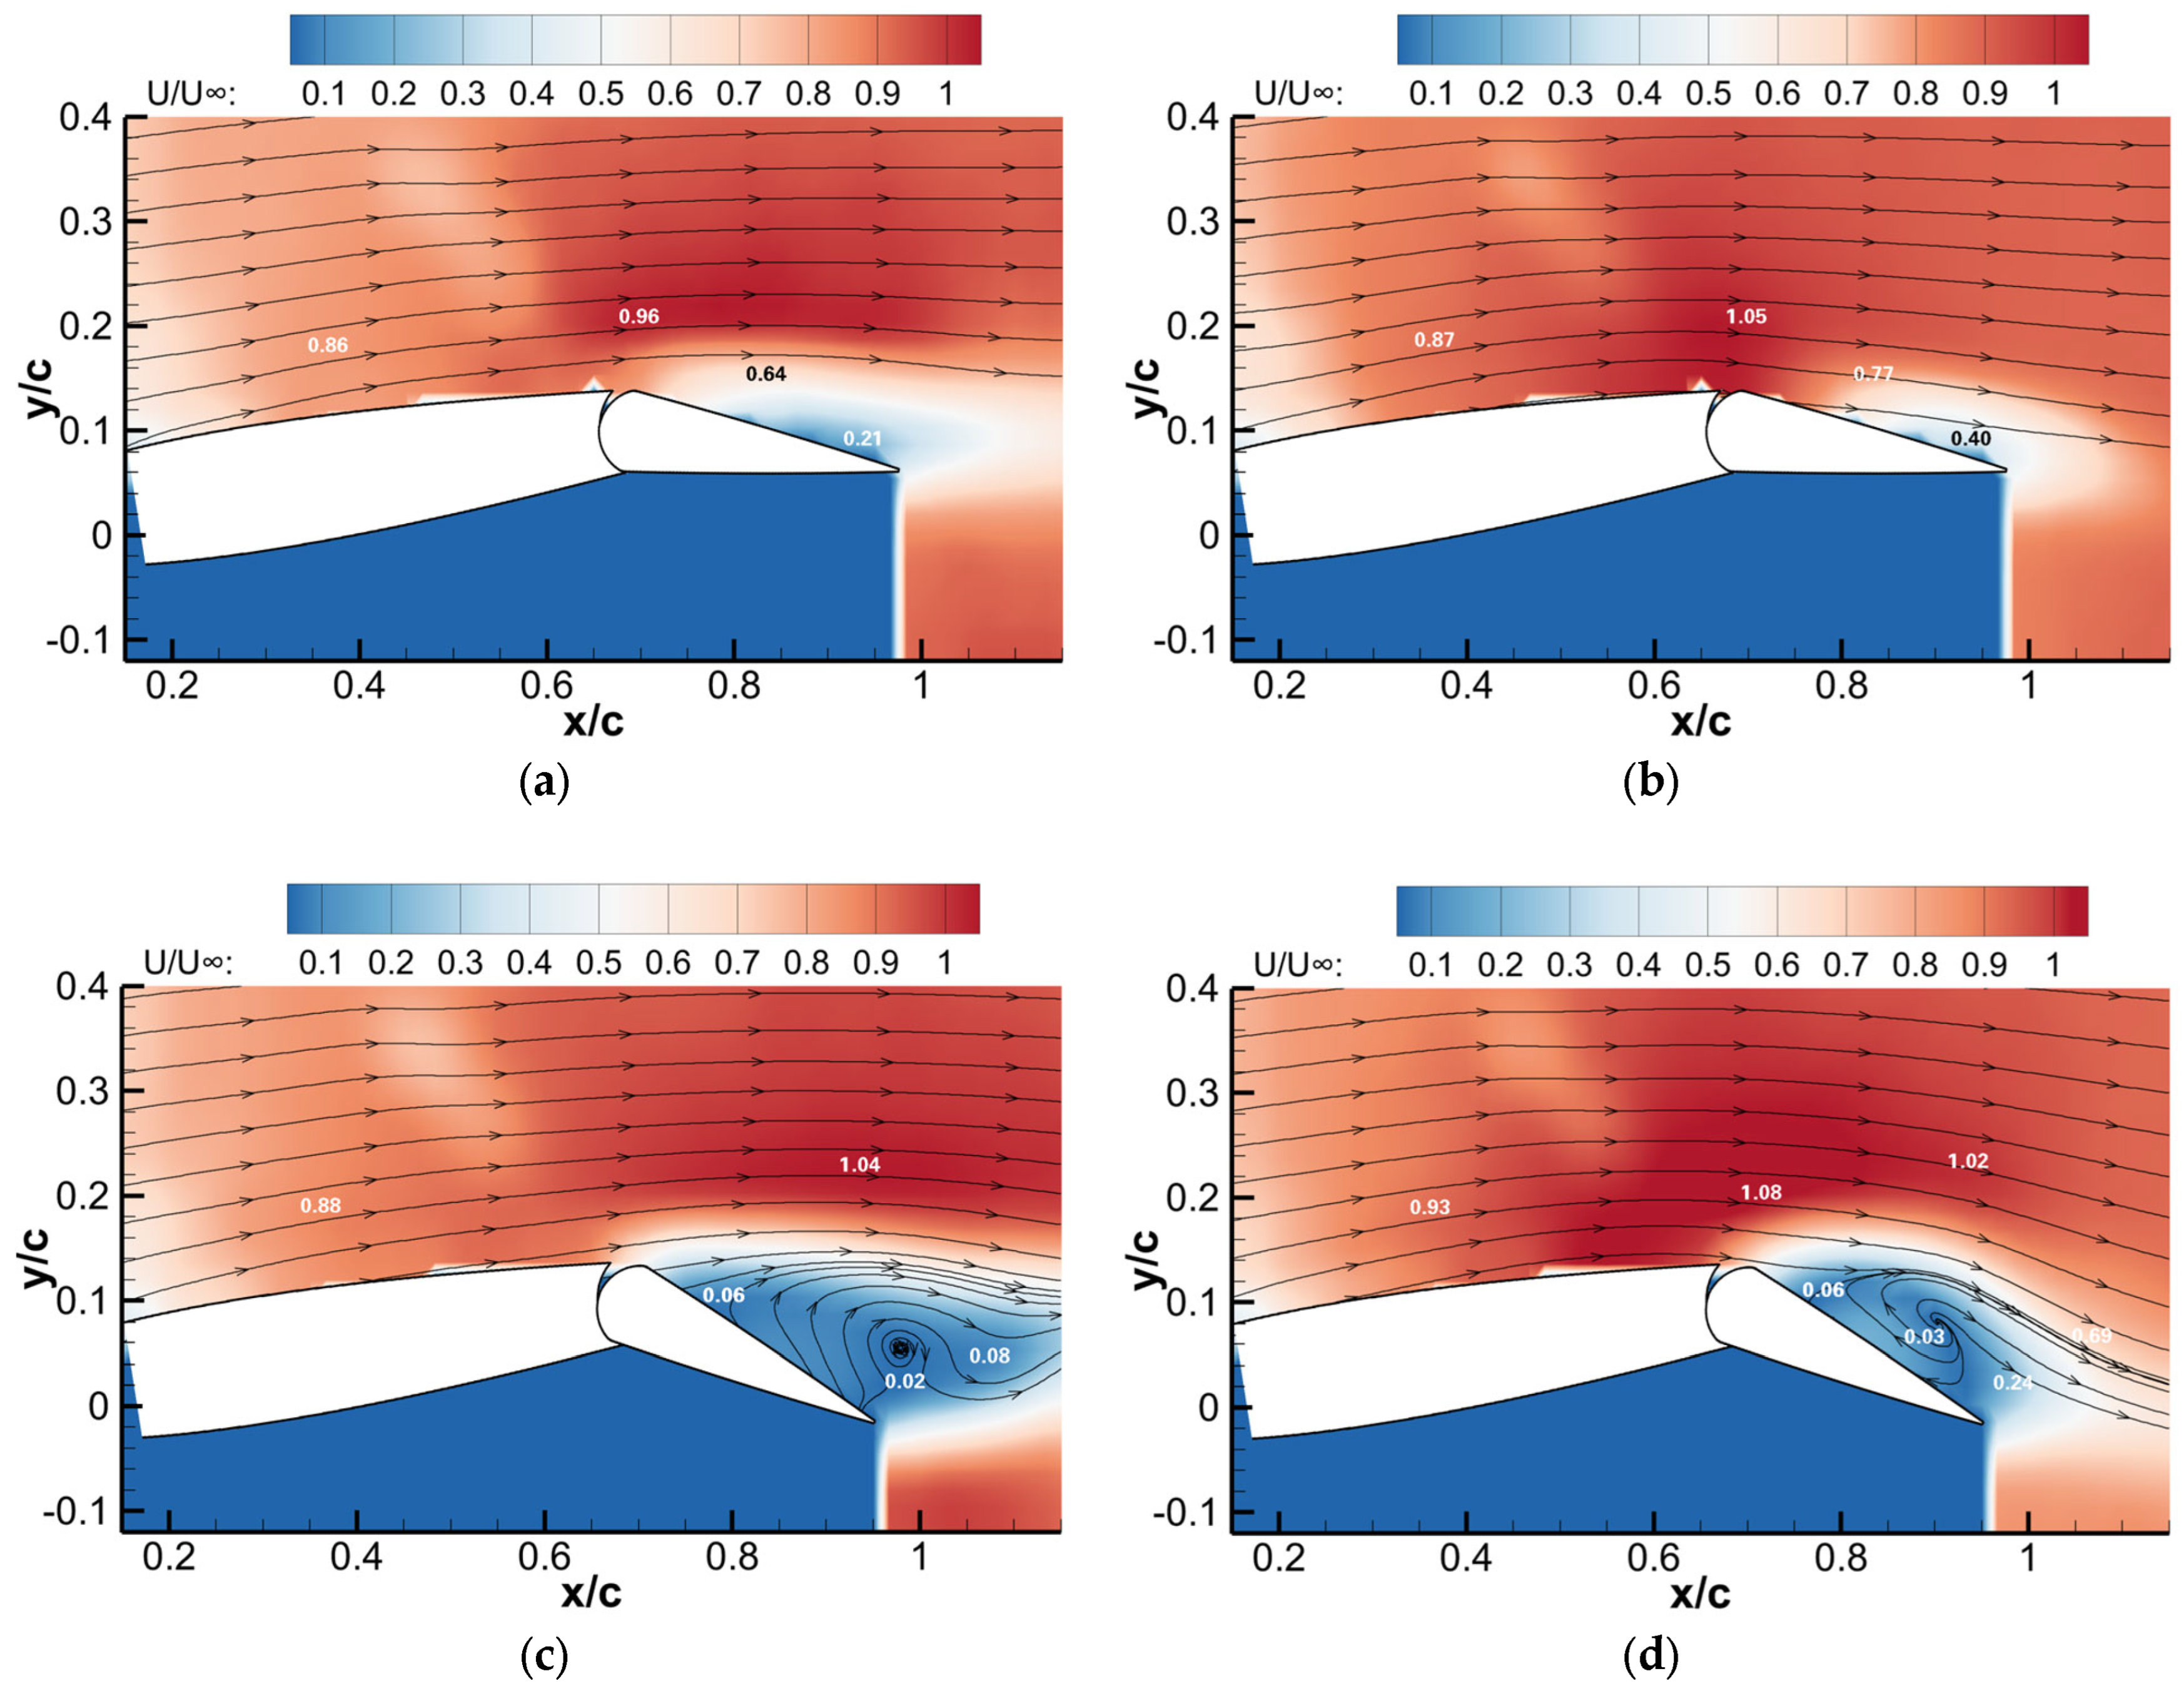
A negative sideslip angle is a typical condition for civil aircraft to take off and land in a crosswind, so the space flow field of the vertical tail at a −10° sideslip angle is measured and studied. Figure 16 shows the spatial flow field distribution of the vertical tail model, β = −10° and Re = 2.12 × 10⁵. The mainstream dimensionless velocity on the stability surface accelerates from 0.86 to 0.93. When the rudder deflection angle is 15°, partial flow separation occurs at the trailing edge of the rudder without control, but no vortex structure is observed, similar to the case when the sideslip angle is 0°. When the excitation is applied, the flow separation is suppressed, and the separation area on the rudder is reduced. The increase in the actuators’ velocity and the velocity of the rudder upper wing surface can improve the flow field characteristics of the vertical tail under the condition of a negative sideslip angle. When the rudder deflection angle is increased to 30°, the airflow on the upper wing surface of the rudder is completely separated. The velocity is close to 0, and a wholly separated vortex can be observed. The inhibition of flow separation after flow control is applied. Applying flow control does not eliminate the separation vortex in the rudder well, but it makes the separation vortex move upstream. The low-speed region downstream of the rudder is accelerated significantly, and the dimensionless velocity increases from 0.08 to 0.69. Compared with the zero sideslip angle, the flow acceleration area at the exit of the actuator and on the wing surface of the stabilizer is smaller at this sideslip angle, which is one of the factors that cause the vertical tail lateral force increment to be lower than the zero sideslip angle.
The PIV results explain the vertical tail lateral force variation and are consistent with the ground pressure data. They powerfully reveal the flow control mechanism of the jet.

3.5. Study on Flow Control of Vertical Tail in Different Spanwise Positions

The flow on the three-dimensional swept-back vertical tail model has an obvious three-dimensional effect. Because the chord length of each section is different, the control effect of the actuator in different spanwise positions must be different. The influence of the actuators in different spanwise positions of the vertical tail model is studied quantitatively. The experimental Reynolds number for the group-independent control study is 2.12 × 10⁵, and the sideslip angle of the vertical tail model is set to 0°. The force measurement is carried out on the model of group I, II, and III actuators when they are supplied with air separately.
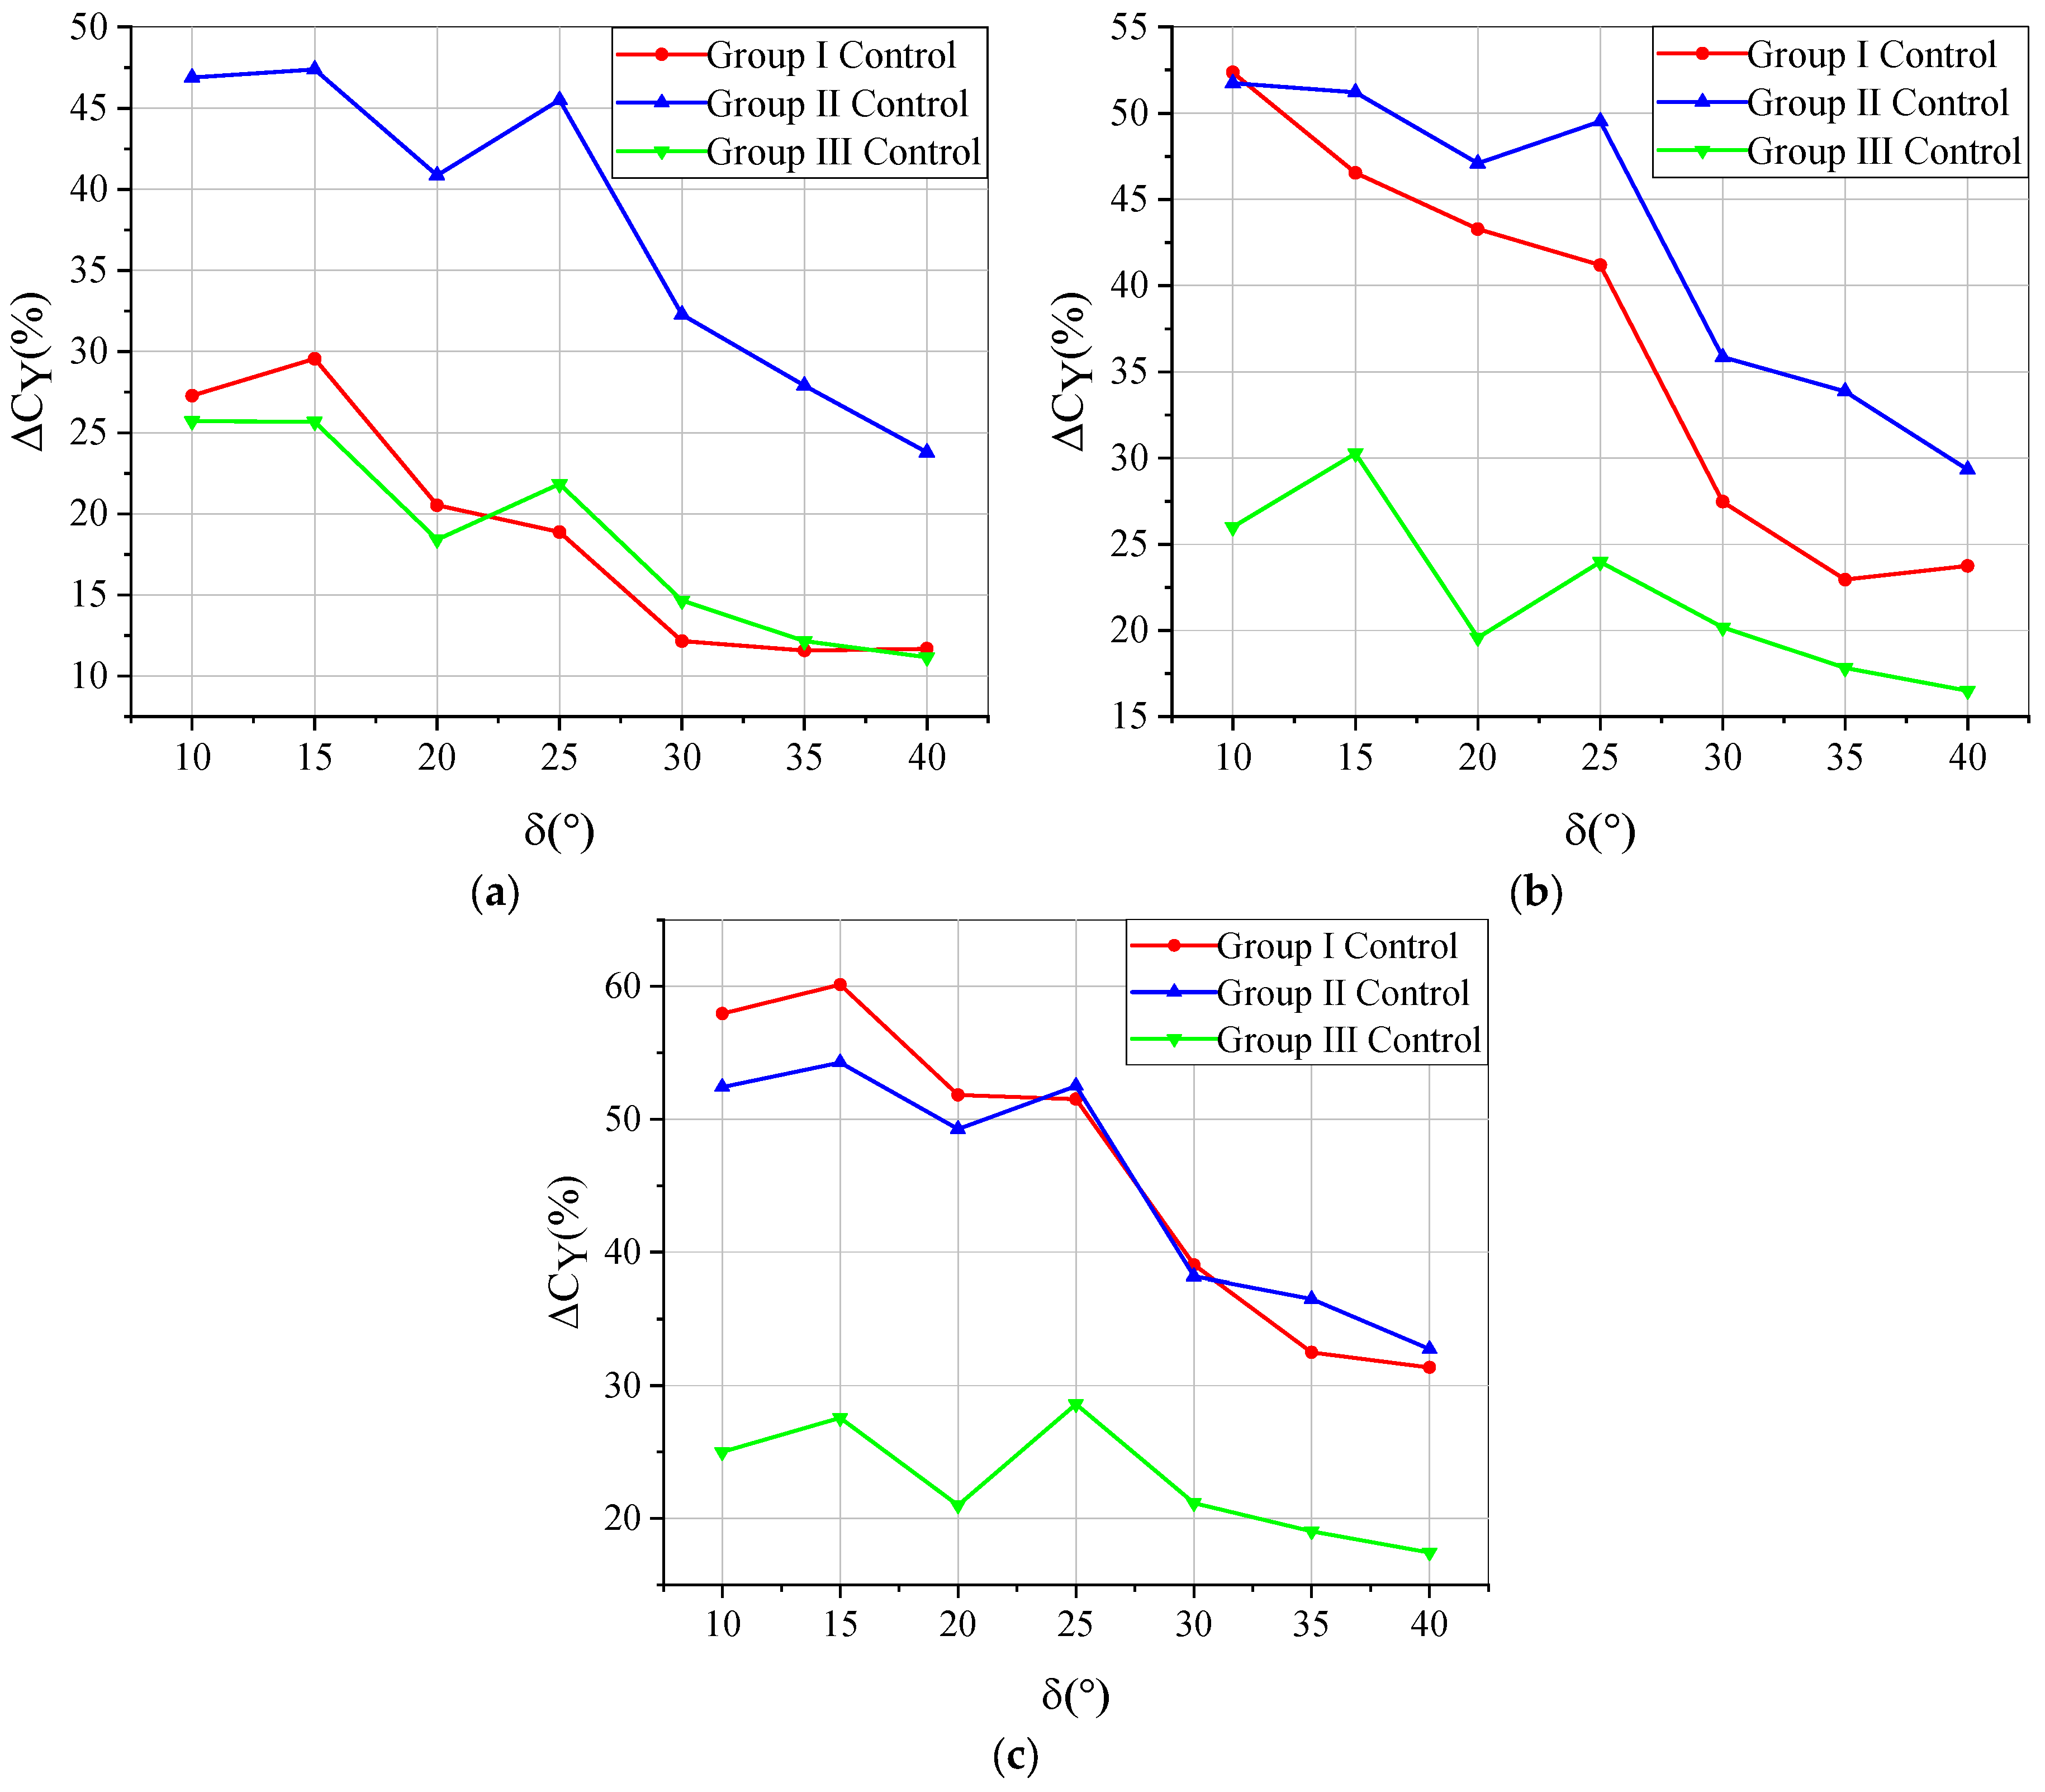
Figure 17 shows the lateral force coefficient increment curve under different momentum coefficients and different control positions. When the momentum coefficient of the actuator is 0.083%, it can be seen that the vertical tail lateral force increment when the actuator group II is controlled alone is significantly higher than that when the other two groups are controlled alone. Under this momentum coefficient, the control effect of the actuator at the wing tip position and the wing root position is close. When the momentum coefficient of the actuator is 0.166%, the control effect of the group II actuator at the middle section of the vertical tail is the best, and the control effect of the group I actuator at the wing root is slightly lower than that of the group II actuator. The control effect of the group III actuator at the wing tip is the worst. When the momentum coefficient of the actuator increases to 0.332%, the control effect of the actuator at the middle section of the vertical tail is close to that at the wing root, and the control effect at the wing tip is still the worst.
Regardless of the momentum coefficient input by the oscillating jet actuator, the actuator control at the wing tip has the worst effect on increasing the vertical tail lateral force. The actuator in the midspan can provide a stable and considerable increment for the vertical tail’s lateral force. As for the actuator at the wing root, the control effect is poor when the momentum coefficient is small. With the increase in the momentum coefficient, its impact on the vertical tail lateral force increases significantly. The above differences are mainly related to the chord lengths of airfoils at different spans of the 3D model. The chord length of the airfoil at the wing root is considerable, and the area of the vertical tail is much larger than that at the wing tip. When the momentum coefficient of the actuator is small, the flow separation in a large area cannot be wholly suppressed. We cannot achieve such a significant lateral force increase. However, with the rise of the momentum coefficient of the actuator, the separation area near the wing root on the rudder decreases gradually, and the lateral force increases significantly. Similarly, the rudder area at the wing tip is minimal, and the separation flow suppression here cannot significantly contribute to improving the vertical tail lateral force. The above is why the control effect is quite different when the control position is different. By studying the influence of spanwise control position on the flow control law of a vertical tail oscillating jet, we can optimize the flow control strategy to achieve a better flow control effect.
In conclusion, the oscillating jet can significantly improve the lateral force of the vertical tail under typical working conditions. Especially under harmful sideslip conditions, the oscillating jet flow control can substantially improve the heading control ability of the vertical tail. We can enhance the lateral force coefficient of the vertical tail model by applying flow control alone at different spanwise positions, but the control effect is different.

4. Conclusions

In this paper, the aerodynamic and flow characteristics of the vertical tail are studied utilizing wind tunnel experiments, starting from a series of problems such as flow field characteristics under typical conditions of the vertical tail scale model. The vertical tail’s essential aerodynamic characteristics and flow characteristics are studied when the control is not applied, and we investigate the influence of different parameters on the flow control law and control effect of the vertical tail when the oscillating jet control is used. The control mechanism of oscillating jet control on the vertical tail is summarized by studying the vertical tail surface, the spatial flow field distribution, and the pressure characteristics of the rudder surface. The specific conclusions are as follows:
  • The oscillating jet applied to the trailing edge of the stabilizer can significantly increase the vertical tail lateral force. At a −10° sideslip angle, 40° rudder deflection angle, and 2.12 × 10⁵ experimental Reynolds number conditions, the increment of the lateral force can reach 36.5% when flow control is applied.
  • With the increase in the deflection angle of the vertical tail rudder, apparent flow separation occurs on the rudder, which is the main reason for reducing the vertical tail rudder efficiency. After the oscillating jet flow control is applied, the flow separation on the rudder is suppressed, and the rudder effect of the vertical tail is restored. In addition, high-speed jet injection accelerates the flow on the vertical tail stabilizer, and the increase in the vertical tail circulation further improves the lateral force coefficient.
  • We can improve the lateral force coefficient of the vertical tail model by applying oscillating jet flow control alone at different spanwise positions. Because the rudder area and flow separation are different at different spanwise locations, the energy required for flow control and the flow control effect are different, which will provide a basis for the optimal layout of actuators and engineering practice.

Author Contributions

Data curation: H.D. and Y.G.; formal analysis: H.D. and K.C.; investigation: H.D. and Y.G.; supervision: Y.G. and K.C.; investigation, X.C. and F.Z.; writing, X.C. All authors have read and agreed to the published version of the manuscript.

Funding

This research was funded by the National Numerical Wind Tunnel Project of China number 0747-2266SCCMY003, the National Natural Science Foundation of China (NSFC) number 11872208, and Fundamental Research Funds for the Central Universities number NF2020001.

Institutional Review Board Statement

Not applicable.

Informed Consent Statement

Not applicable.

Data Availability Statement

Some or all data, models, or code that support the findings of this study are available from the corresponding author upon reasonable request.

Conflicts of Interest

The authors declare no conflict of interest.

Nomenclature

Arefreference area, m2
bspan, m
cchord, m
ReReynolds number
Cppressure coefficient
momentum coefficient
CYlateral force coefficient
Ptapsurface pressure, Pa
Pstatic pressure, Pa
qmmass flow, kg/s
Ujetjet velocity, m/s
Uvelocity, m/s
βsideslip angle, °
δrudder deflection angle, °
ρdensity, kg/m3
εturbulence intensity

References

  1. Seele, R.; Graff, E.; Lin, J.; Wygnanski, I. Performance Enhancement of a Vertical Tail Model with Sweeping Jet Actuators. In Proceedings of the 51st AIAA Aerospace Sciences Meeting Including the New Horizons Forum and Aerospace Exposition, Grapevine, TX, USA, 7–10 January 2013. [Google Scholar] [CrossRef] [Green Version]
  2. Whalen, E.A.; Shmilovich, A.; Spoor, M.; Tran, J.; Vijgen, P.; Lin, J.C.; Andino, M. Flight Test of an Active Flow Control Enhanced Vertical Tail. AIAA J. 2018, 56, 3393–3398. [Google Scholar] [CrossRef]
  3. Lin, J.C.; Whalen, E.A.; Andino, M.Y.; Graff, E.C.; Lacy, D.S.; Washburn, A.E.; Gharib, M.; Wygnanski, I.J. Full-Scale Testing of Active Flow Control Applied to a Vertical Tail. J. Aircr. 2019, 56, 1376–1386. [Google Scholar] [CrossRef]
  4. Lin, J.C.; Andino, M.Y.; Alexander, M.G.; Whalen, E.A.; Spoor, M.A.; Tran, J.T.; Wygnanski, I.J. An Overview of Active Flow Control Enhanced Vertical Tail Technology Development. In Proceedings of the 54th AIAA Aerospace Sciences Meeting, San Diego, CA, USA, 4–8 January 2016. [Google Scholar] [CrossRef] [Green Version]
  5. Hirsch, D.; Gharib, M. Schlieren Visualization and Analysis of Sweeping Jet Actuator Dynamics. AIAA J. 2018, 56, 2947–2960. [Google Scholar] [CrossRef]
  6. Portillo, D.J.; Hoffman, E.N.; Garcia, M.; LaLonde, E.; Hernandez, E.; Combs, C.S.; Hood, L. Modal Analysis of a Sweeping Jet Emitted by a Fluidic Oscillator. In Proceedings of the AIAA Aviation 2021 Forum, Virtual Event, 2–6 August 2021. [Google Scholar] [CrossRef]
  7. Katz, Y.; Nishri, B.; Wygnanski, I. The delay of turbulent boundary layer separation by oscillatory active control. Phys. Fluids A Fluid Dyn. 1989, 1, 179–181. [Google Scholar] [CrossRef]
  8. Choephel, T.; Coder, J.; Maughmer, M. Airfoil Boundary-Layer Flow Control Using Fluidic Oscillators. In Proceedings of the 30th AIAA Applied Aerodynamics Conference, New Orleans, LA, USA, 25–28 June 2012. [Google Scholar] [CrossRef]
  9. Koklu, M. The Effects of Sweeping Jet Actuator Parameters on Flow Separation Control. AIAA J. 2013, 56, 100–110. [Google Scholar] [CrossRef] [PubMed]
  10. Koklu, M.; Owens, L.R. Flow Separation Control Over a Ramp Using Sweeping Jet Actuators. In Proceedings of the 7th AIAA Flow Control Conference, Atlanta, GA, USA, 16–20 June 2014. [Google Scholar] [CrossRef]
  11. Koklu, M.; Owens, L.R. Comparison of Sweeping Jet Actuators with Different Flow-Control Techniques for Flow-Separation Control. AIAA J. 2017, 55, 848–860. [Google Scholar] [CrossRef]
  12. Melton, L.; Koklu, M. Active Flow Control Using Sweeping Jet Actuators on a Semi-Span Wing Model. In Proceedings of the 54th AIAA Aerospace Sciences Meeting, San Diego, CA, USA, 4–8 January 2016. [Google Scholar] [CrossRef] [Green Version]
  13. Slupski, B.J.; Kara, K. Effects of Feedback Channels and Coanda Surfaces on the Performance of Sweeping Jet Actuator. In Proceedings of the 55th AIAA Aerospace Sciences Meeting, Grapevine, TX, USA, 9–13 January 2017. [Google Scholar] [CrossRef]
  14. Slupski, B.Z.; Kara, K. Effects of Geometric Parameters on Performance of Sweeping Jet Actuator. In Proceedings of the 34th AIAA Applied Aerodynamics Conference, Washington, DC, USA, 13–17 June 2016. [Google Scholar] [CrossRef]
  15. Slupski, B.Z.; Kara, K.; Parezanovic, V.; Kyritsis, D. Experimental Inner Pressure Analysis of a Sweeping Jet Actuator. In Proceedings of the 36th AIAA Applied Aerodynamics Conference 2018, Atlanta, GA, USA, 25–29 June 2018. [Google Scholar] [CrossRef]
  16. Seele, R.; Graff, E.; Gharib, M.; Taubert, L.; Lin, J.; Wygnanski, I. Improving Rudder Effectiveness with Sweeping Jet Actuators. In Proceedings of the 6th AIAA Flow Control Conference, New Orleans, LA, USA, 25–28 June 2012. [Google Scholar] [CrossRef] [Green Version]
  17. Andino, M.Y.; Lin, J.C.; Washburn, A.E.; Whalen, E.A.; Graff, E.C.; Wygnanski, I.J. Flow Separation Control on a Full-Scale Vertical Tail Model Using Sweeping Jet Actuators. In Proceedings of the 53rd AIAA Aerospace Sciences Meeting, Kissimmee, FL, USA, 5–9 January 2015. [Google Scholar] [CrossRef] [Green Version]
  18. Andino, M.Y.; Lin, J.C.; Roman, S.; Graff, E.C.; Gharib, M.; Whalen, E.A.; Wygnanski, I.J. Active Flow Control on Vertical Tail Models. AIAA J. 2019, 57, 3322–3338. [Google Scholar] [CrossRef] [PubMed]
  19. Dandois, J.; Verbeke, C.; Ternoy, F. Performance Enhancement of a Vertical Tail Model with Sweeping Jets. AIAA J. 2020, 58, 5202–5215. [Google Scholar] [CrossRef]
  20. Löffler, S.; Staats, M.; Grund, T.; Weiss, J. Increasing the Effectiveness of a Vertical Stabilizer by Combining Pulsed Jet Actuation at the Leading Edge and the Rudder Hinge Line. In Proceedings of the 36th AIAA Applied Aerodynamics Conference 2018, Atlanta, GA, USA, 25–29 June 2018. [Google Scholar] [CrossRef]
  21. Loeffler, S.; Rohlfs, L.; Staats, M.; Weiss, J. Flow Field Investigation on a Vertical Stabilizer with Pulsed Jet Actuation by Means of PIV Measurements. In Proceedings of the AIAA Aviation 2019 Forum, Dallas, TX, USA, 17–21 June 2019. [Google Scholar] [CrossRef]
  22. Scholz, P.; Singh, V.M.; Gebhardt, A.; Löffler, S.; Weiss, J. The Efficiency of Different Flow Control Methods on a Vertical Tail. In Proceedings of the AIAA Scitech 2020 Forum, Orlando, FL, USA, 6–10 January 2020. [Google Scholar] [CrossRef]
  23. Singh, V.M.; Scholz, P. Circulation Control Experiments on a Vertical Tail. In Fundamentals of High Lift for Future Civil Aircraft; Springer: Cham, Switzerland, 2020. [Google Scholar] [CrossRef]
  24. Whalen, E.A.; Lacy, D.S.; Lin, J.C.; Andino, M.Y.; Washburn, A.E.; Graff, E.C.; Wygnanski, I.J. Performance Enhanced of a Full Scale Vertical Tail Model Equipped with Active Flow Control. In Proceedings of the 53rd AIAA Aerospace Sciences Meeting, Kissimmee, FL, USA, 5–9 January. [CrossRef] [Green Version]
  25. Melton, L.P. Active Flow Separation Control on a NACA 0015 Wing Using Fluidic Actuators. In Proceedings of the 7th AIAA Flow Control Conference, Atlanta, GA, USA, 16–20 June 2014. [Google Scholar] [CrossRef]
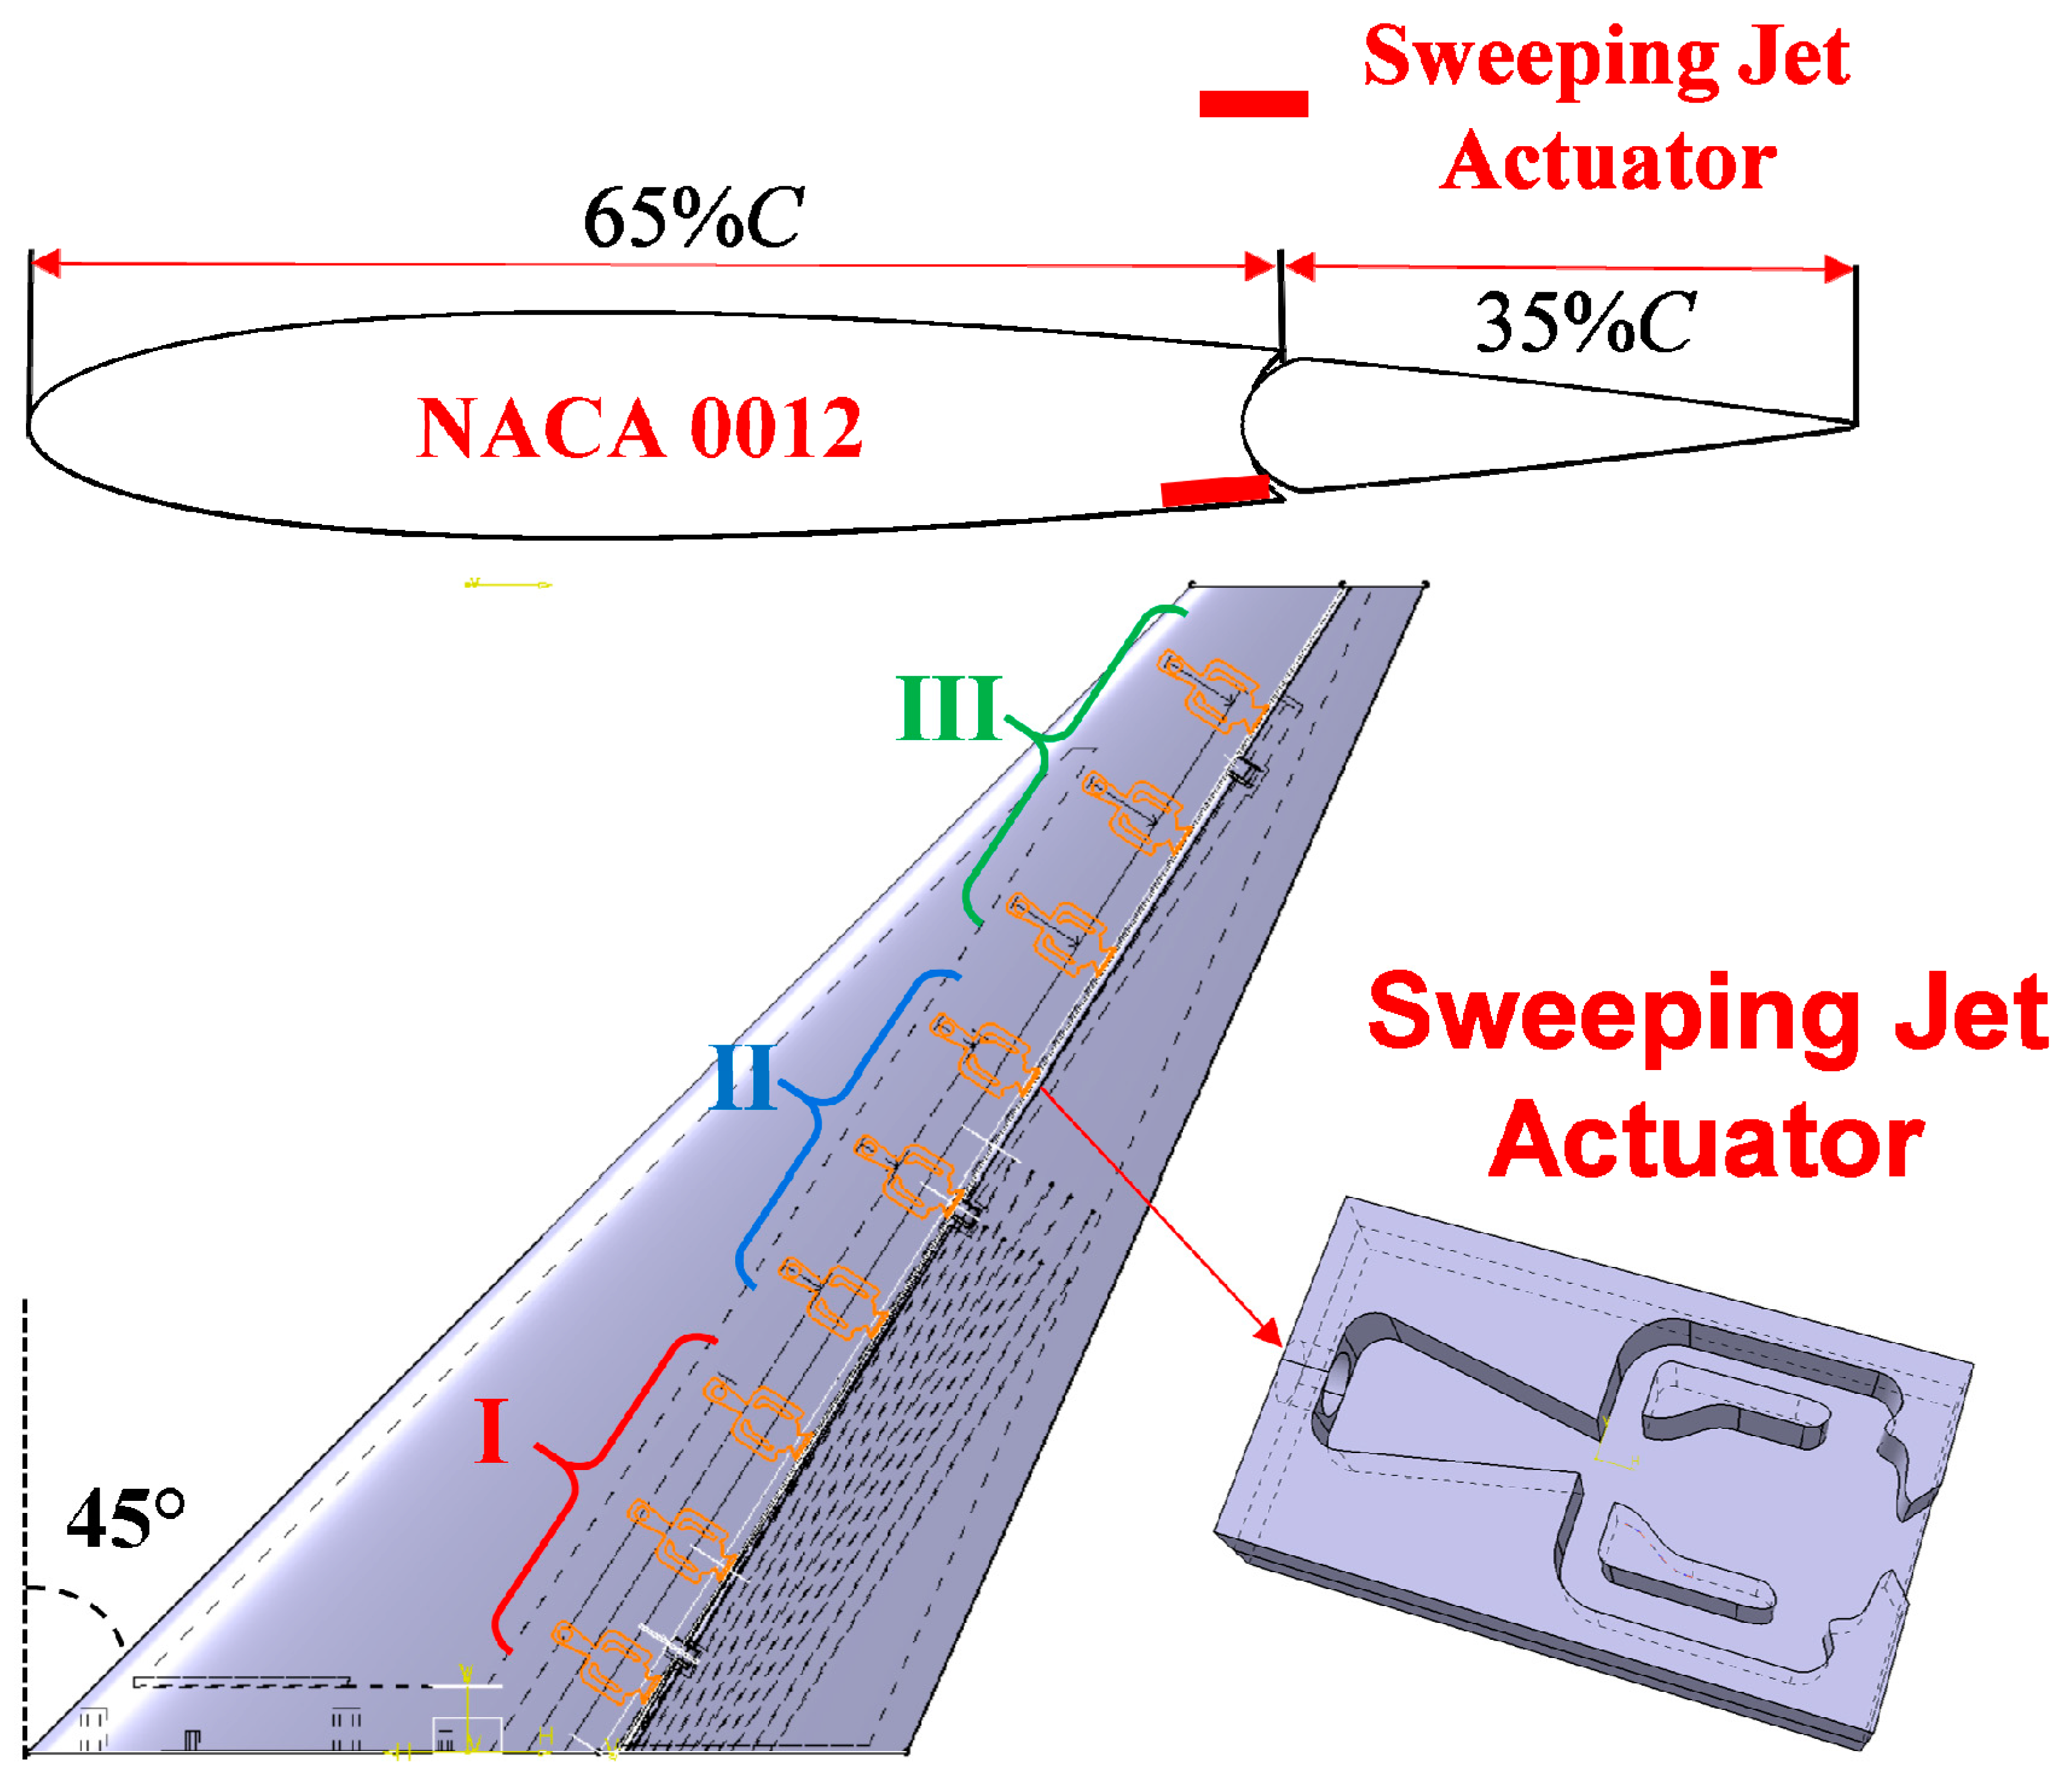
Figure 1. Structure and size of oscillating jet actuator.
Applsci 13 00786 g001
Figure 2. Vertical tail model and actuator layout diagram.
Applsci 13 00786 g002
Figure 3. Definition of vertical tail model sideslip angle and rudder deflection angle.
Applsci 13 00786 g003
Figure 4. Schematic diagram of return flow low-speed wind tunnel.
Applsci 13 00786 g004
Figure 5. Experimental layout.
Applsci 13 00786 g005
Figure 6. Aerodynamic curve of uncontrolled vertical tail model: (a) CY curve; (b) CD curve (β = 0°, Re = 2.12 × 10⁵).
Applsci 13 00786 g006
Figure 7. Lateral force coefficient of vertical tail model under different sideslip angles (Re = 2.12 × 10⁵).
Applsci 13 00786 g007
Figure 8. Rudder pressure distribution at different deflection angles: (a) δ = 0°~15°; (b) δ = 20°~40° (β = 0°, Re = 2.12 × 10⁵).
Applsci 13 00786 g008
Figure 9. Rudder pressure distribution at different deflection angles: (a) δ = 0°~15°; (b) δ = 20°~40° (β = −10°, Re = 2.12 × 10⁵).
Applsci 13 00786 g009
Figure 10. Velocity cloud diagram and streamline diagram of vertical tail upper surface without control: (a) δ = 15°; (b) δ = 30° (β = 0°, Re = 2.12 × 10⁵).
Applsci 13 00786 g010
Figure 11. Velocity cloud diagram and streamline diagram of vertical tail upper surface without control: (a) δ = 15°; (b) δ = 30° (β = −10°, Re = 2.12 × 10⁵).
Applsci 13 00786 g011
Figure 12. Lateral force coefficient and increment of vertical tail model under different momentum coefficient controls: (a) lateral force coefficient curves; (b) lateral force coefficient increment curves (β = 0°, Re = 2.12 × 10⁵).
Applsci 13 00786 g012
Figure 13. Rudder pressure distribution under different momentum coefficient controls: (a) δ = 5°; (b) δ = 25° (β = 0°, Re = 2.12 × 10⁵).
Applsci 13 00786 g013
Figure 14. Velocity cloud diagram and streamline diagram of vertical tail upper surface under different momentum coefficient controls: (a) Cμ = 0; (b) Cμ = 0.083%; (c) Cμ = 0.166%; (d) Cμ = 0.332% (β = 0°, δ = 15°, Re = 2.12 × 10⁵).
Applsci 13 00786 g014
Figure 15. Lateral force increment of vertical tail model under different sideslip angles (Cμ = 0.332%, Re = 2.12 × 10⁵).
Applsci 13 00786 g015
Figure 16. Velocity cloud diagram and streamline diagram of vertical tail upper surface: (a) Cμ = 0, δ = 15°; (b) Cμ = 0.332%, δ = 15°; (c) Cμ = 0, δ = 30°; (d) Cμ = 0.332%, δ = 30° (β = −10°, Re = 2.12 × 10⁵).
Applsci 13 00786 g016
Figure 17. Vertical tail model lateral force coefficient increment curves under different control positions: (a) Cμ = 0.083%; (b) Cμ = 0.166%; (c) Cμ = 0.332% (β = −10°, Re = 2.12 × 10⁵).
Applsci 13 00786 g017
Table 1. ATI balance parameters.
VariableRange Precision (FS)
Fx165 N1.00%
Fy165 N1.00%
Fz495 N1.00%
Mx15 N-m1.00%
My15 N-m1.00%
Mz15 N-m1.00%
Disclaimer/Publisher’s Note: The statements, opinions and data contained in all publications are solely those of the individual author(s) and contributor(s) and not of MDPI and/or the editor(s). MDPI and/or the editor(s) disclaim responsibility for any injury to people or property resulting from any ideas, methods, instructions or products referred to in the content.