Article

Seismic Characteristics of a Geotextile Tube-Reinforced Embankment and Shallow Foundations Laid on Liquefiable Soil

1
Department of Civil Engineering, Kunsan National University, Gunsan 573-701, Republic of Korea
2
Department of Civil and Environmental Engineering, Kunsan National University, Gunsan 573-701, Republic of Korea
3
Renewable Energy Research Institute, Gunsan 573-701, Republic of Korea
*
Author to whom correspondence should be addressed.
Appl. Sci. 2023, 13(2), 785; https://doi.org/10.3390/app13020785
Submission received: 16 December 2022 / Revised: 29 December 2022 / Accepted: 4 January 2023 / Published: 5 January 2023

Abstract

:
The ground in Saemangeum has a high water level and is mostly composed of silty soil and sand, which makes it susceptible to liquefaction and seepage effects. To investigate the seismic response of a geotextile tube-reinforced embankment and shallow foundations laid on a liquefiable soil, a simple spring type shaking table apparatus was developed. The variation in the response acceleration and shear stress-strain relationship were investigated, and the effect of soil improvement and reinforcement were explored, wherein one of the shallow foundations was laid on a coarse sand layer and reinforced by a polyester geotextile. The results showed that the main cause of damage to the embankment was seepage-induced liquefaction. Excessive surface accelerations were observed in the embankment soil due to lateral spreading, indicating the importance of analyzing the liquefaction potential of soils not only at the site area but also near embankments. Lastly, the inclusion of geotextile reinforcement and soil improvement only resulted in the slight reduction of shallow foundation settlement.

1. Introduction

An earthquake is a phenomenon that occurs when strain energy stored along the fault due to shearing between rocks is transformed into waves of energy. Its effects include ground rupture, landslides, fires, tsunami, floods, and soil liquefaction. Numerous research related to earthquakes has been performed in the literature, including hazard mapping or risk assessment [1,2,3,4], seismic response or performance of structures and materials [5,6], laboratory testing [7,8,9,10], numerical modeling [11,12,13], and others. Historically, South Korea was considered as a region of moderate seismicity. During the years 1992 to 2013, earthquakes that occurred in the country did not exceed a moment magnitude (Mw) of 5.0, except the 2004 Uljin earthquake, as shown in Figure 1. However, recent earthquake events have caused some distress in the country. The 2017 Pohang earthquake, with a moment magnitude of 5.4, has caused significant infrastructure damage to 2165 private properties, 227 school buildings, and 11 bridges. In addition, widespread liquefaction was reported around the Heunghae basin at Pohang, which was the first ever reported case of liquefaction in the modern seismic history of Korea [14]. In a recent study, Hong et al. [15] reported an increase in the seismicity rate, which was caused by an increase in seismic energy emissions. Due to these recent events, experts have voiced concerns that the Korean Peninsula may no longer be safe from strong shockwaves.
Liquefaction is a phenomenon caused by the loss of shear strength due to effective stress reduction in saturated or partially saturated ground during seismic activity. Due to liquefaction at shallow depths, sand and water could burst out onto the ground surface (boiling phenomenon) during repeated shearing. In the case of structures that are built near coastal areas, the liquefaction of sands beneath or near these structures can also increase seepage pressures, which could result in the spreading of the generated pore water pressures into larger areas that are less susceptible to liquefaction, further increasing the risk of large-scale destruction of coastal structures such as roads, ports, and embankments, as seen in the photo in Figure 2.
Several techniques have been developed to either prevent liquefaction from occurring or reduce its consequences on structures. Methods such as soil compaction [16,17,18], drain techniques [19,20], soil mixing [21,22], and grouting [23,24,25,26] are usually performed after liquefaction potential is evaluated. The liquefaction potential of soils is often evaluated using the simplified procedure originally proposed by Seed and Idriss [27] based on the standard penetration test (SPT), and it has been updated or extended including the development of new methods using the cone penetration test (CPT) and the Becker penetration test (BPT), as summarized by Youd et al. [28]. The simplified method then gave rise to many studies related to the improvement of liquefaction assessment methods, liquefaction vulnerability assessment and mapping, and the application of liquefaction mitigation techniques. Cetin et al. [29] were able to recommend new probabilistic and deterministic relationships for the assessment of the likelihood of initiation of liquefaction. After the development of the stochastic models, the relevant uncertainties including measurement errors, model imperfection, statistic uncertainty, and others, were addressed. Following the 2012 Emilia-Romagna earthquake in Italy, Lombardi and Bhattacharya [30] reported findings from field investigations conducted in the areas affected by the earthquake. It was concluded that despite the relatively low magnitudes of the shocks, the occurrence of liquefaction was mainly associated with the presence of saturated alluvial soil deposits. These highly liquefiable soils were mainly located in the proximity of ancient river courses that were artificially diverted in the eighteenth century to mitigate flooding and other hydrological risks. Ortiz-Hernández et al. [31] were able to generate a hazard map for the city of Chone in Ecuador for the evaluation of the probability of liquefaction using SPT data and indicated that the urban area of the city of Chone has a high probability of liquefaction, which was due to the presence of Holocene-aged soils developed in alluvial deposits, located in an alluvium mid catchment area. Following the 1989 Loma Prieta earthquake, Miller and Roycroft [23] conducted a detailed analysis on the liquefaction risk for an industrial site near the Pajaro River at Watsonville, California. Based on the risk assessment, a ground improvement project by grouting was proposed to prevent lateral spreading in which a compaction grout test program was undertaken to validate and refine the project design.
The Saemangeum Development Project [32] is a national project that aims to build a global city and an industrial zone in Korea as a frontrunner of green growth. Due to the ongoing land reclamation projects and the need for coastal erosion protection, dikes and embankments are to be constructed. Since geosynthetic materials are easy to transfer and set up in the field [33], geotextile tubes have been used as breakwaters, anti-erosion structures, and embankment reinforcement [34,35,36], and can be an efficient and economical solution for slurry waste disposal [10,37]. Because Saemangeum is a reclaimed area, the upper ground layer consists mostly of silty sand, dredged from river estuaries around the coastal cities near Saemangeum. Silty sand’s behavior can be complex as the amount of fines content could affect its liquefaction potential, as well as being highly susceptible to seepage effects. Monkul and Yamamuro [38] studied the influence of silt size and nonplastic fines content on the liquefaction of a sand using the undrained triaxial compression test and concluded that mean grain diameter ratio affects the liquefaction potential of the sand. In some cases, when the mean grain diameter ratio is large, clean sand may be more liquefiable than silty sand, and in some cases when the mean grain diameter ratio is small, the increase of fine content may result in the silty sand being more liquefiable than clean sand. The study by Monkul and Yamamuro [38] showed that the influence of fines content may be significantly affected by the nature of the fines. Hence, qualitative studies on Saemangeum silty sand during shaking and liquefaction could help provide better understanding on the systematic behavior of structures that are affected. The simplified method, which is calculated based on the maximum ground acceleration cannot fully predict the occurrence of liquefaction as the response of a system also depends on the period of shaking and frequency. In this study, a simple spring type shaking table apparatus is developed to investigate the seismic response of shallow foundations laid on an embankment that is reinforced by geotextile tubes, in which the embankment is composed of partially saturated soil that is highly susceptible to liquefaction and seepage effects. Numerous shaking table tests on the liquefaction of reduced scale models [7,19,39] have been conducted in the past for the reason that measurements from shaking table tests are easier to obtain and that the behaviour of the soil leading to liquefaction can be investigated directly in real time. Through the apparatus, the seismic response of Saemangeum dredged soil can be investigated for various conditions or scenarios, considering time-dependent behavior. In addition, the apparatus can be used to obtain parameters necessary in predicting the liquefaction of Saemangeum silty sand [40].
This study aims to analyze the interconnected behavior of the embankment structure during shaking, liquefaction, and seepage. The response of the shallow foundations laid on top of the embankment is explored, and the effect of the geotextile tubes on the embankment, due to weakening of the soil beneath the embankment, is also investigated. Also, the seepage-induced liquefaction of the embankment soil is examined. In an effort to propose methods for damage mitigation due to liquefaction, one of the shallow foundations was laid on a coarse sand mat, reinforced by a geotextile mat, and their effect was investigated as well.

2. Materials and Methods

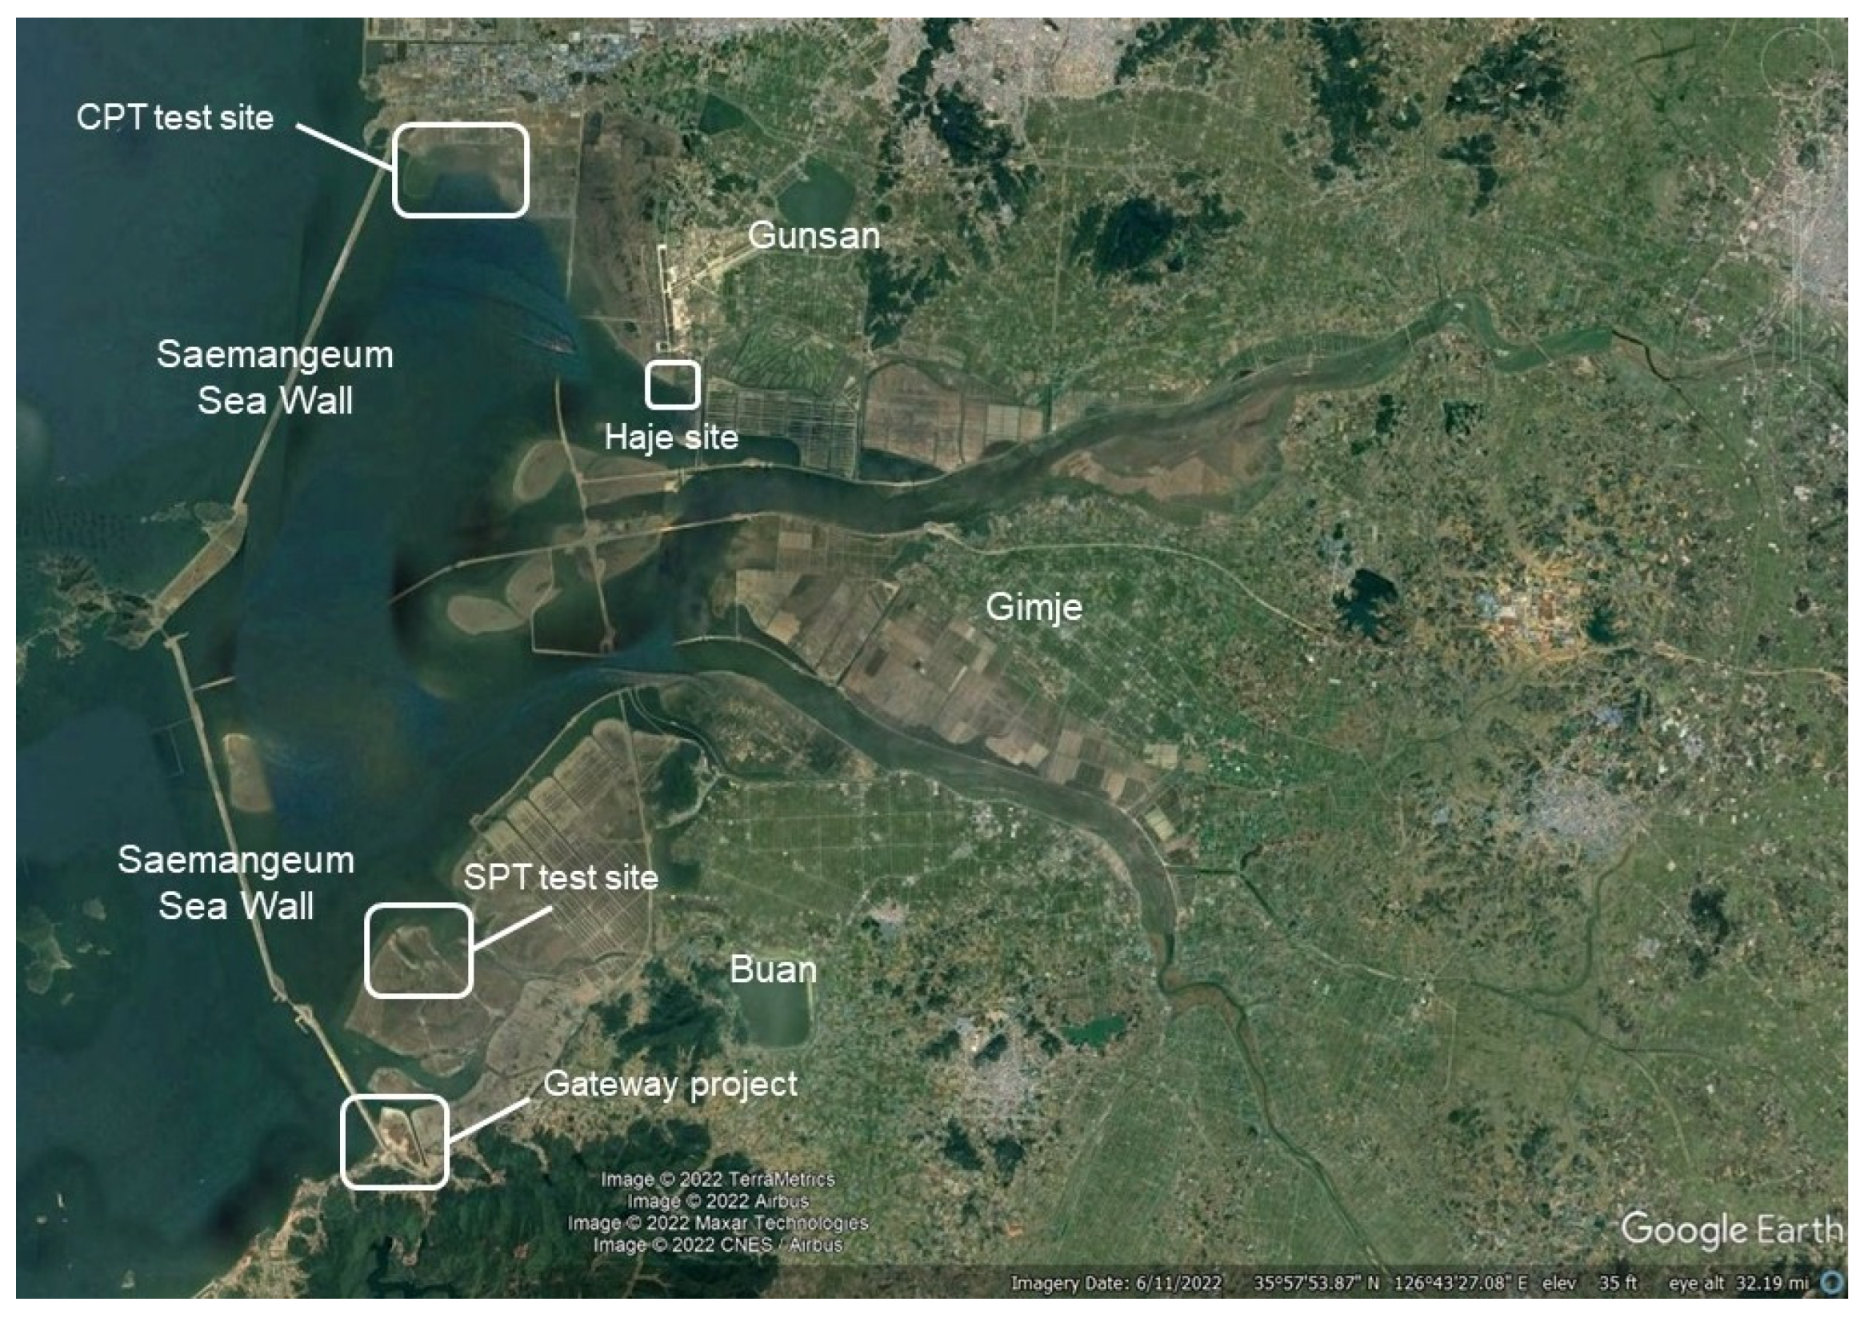
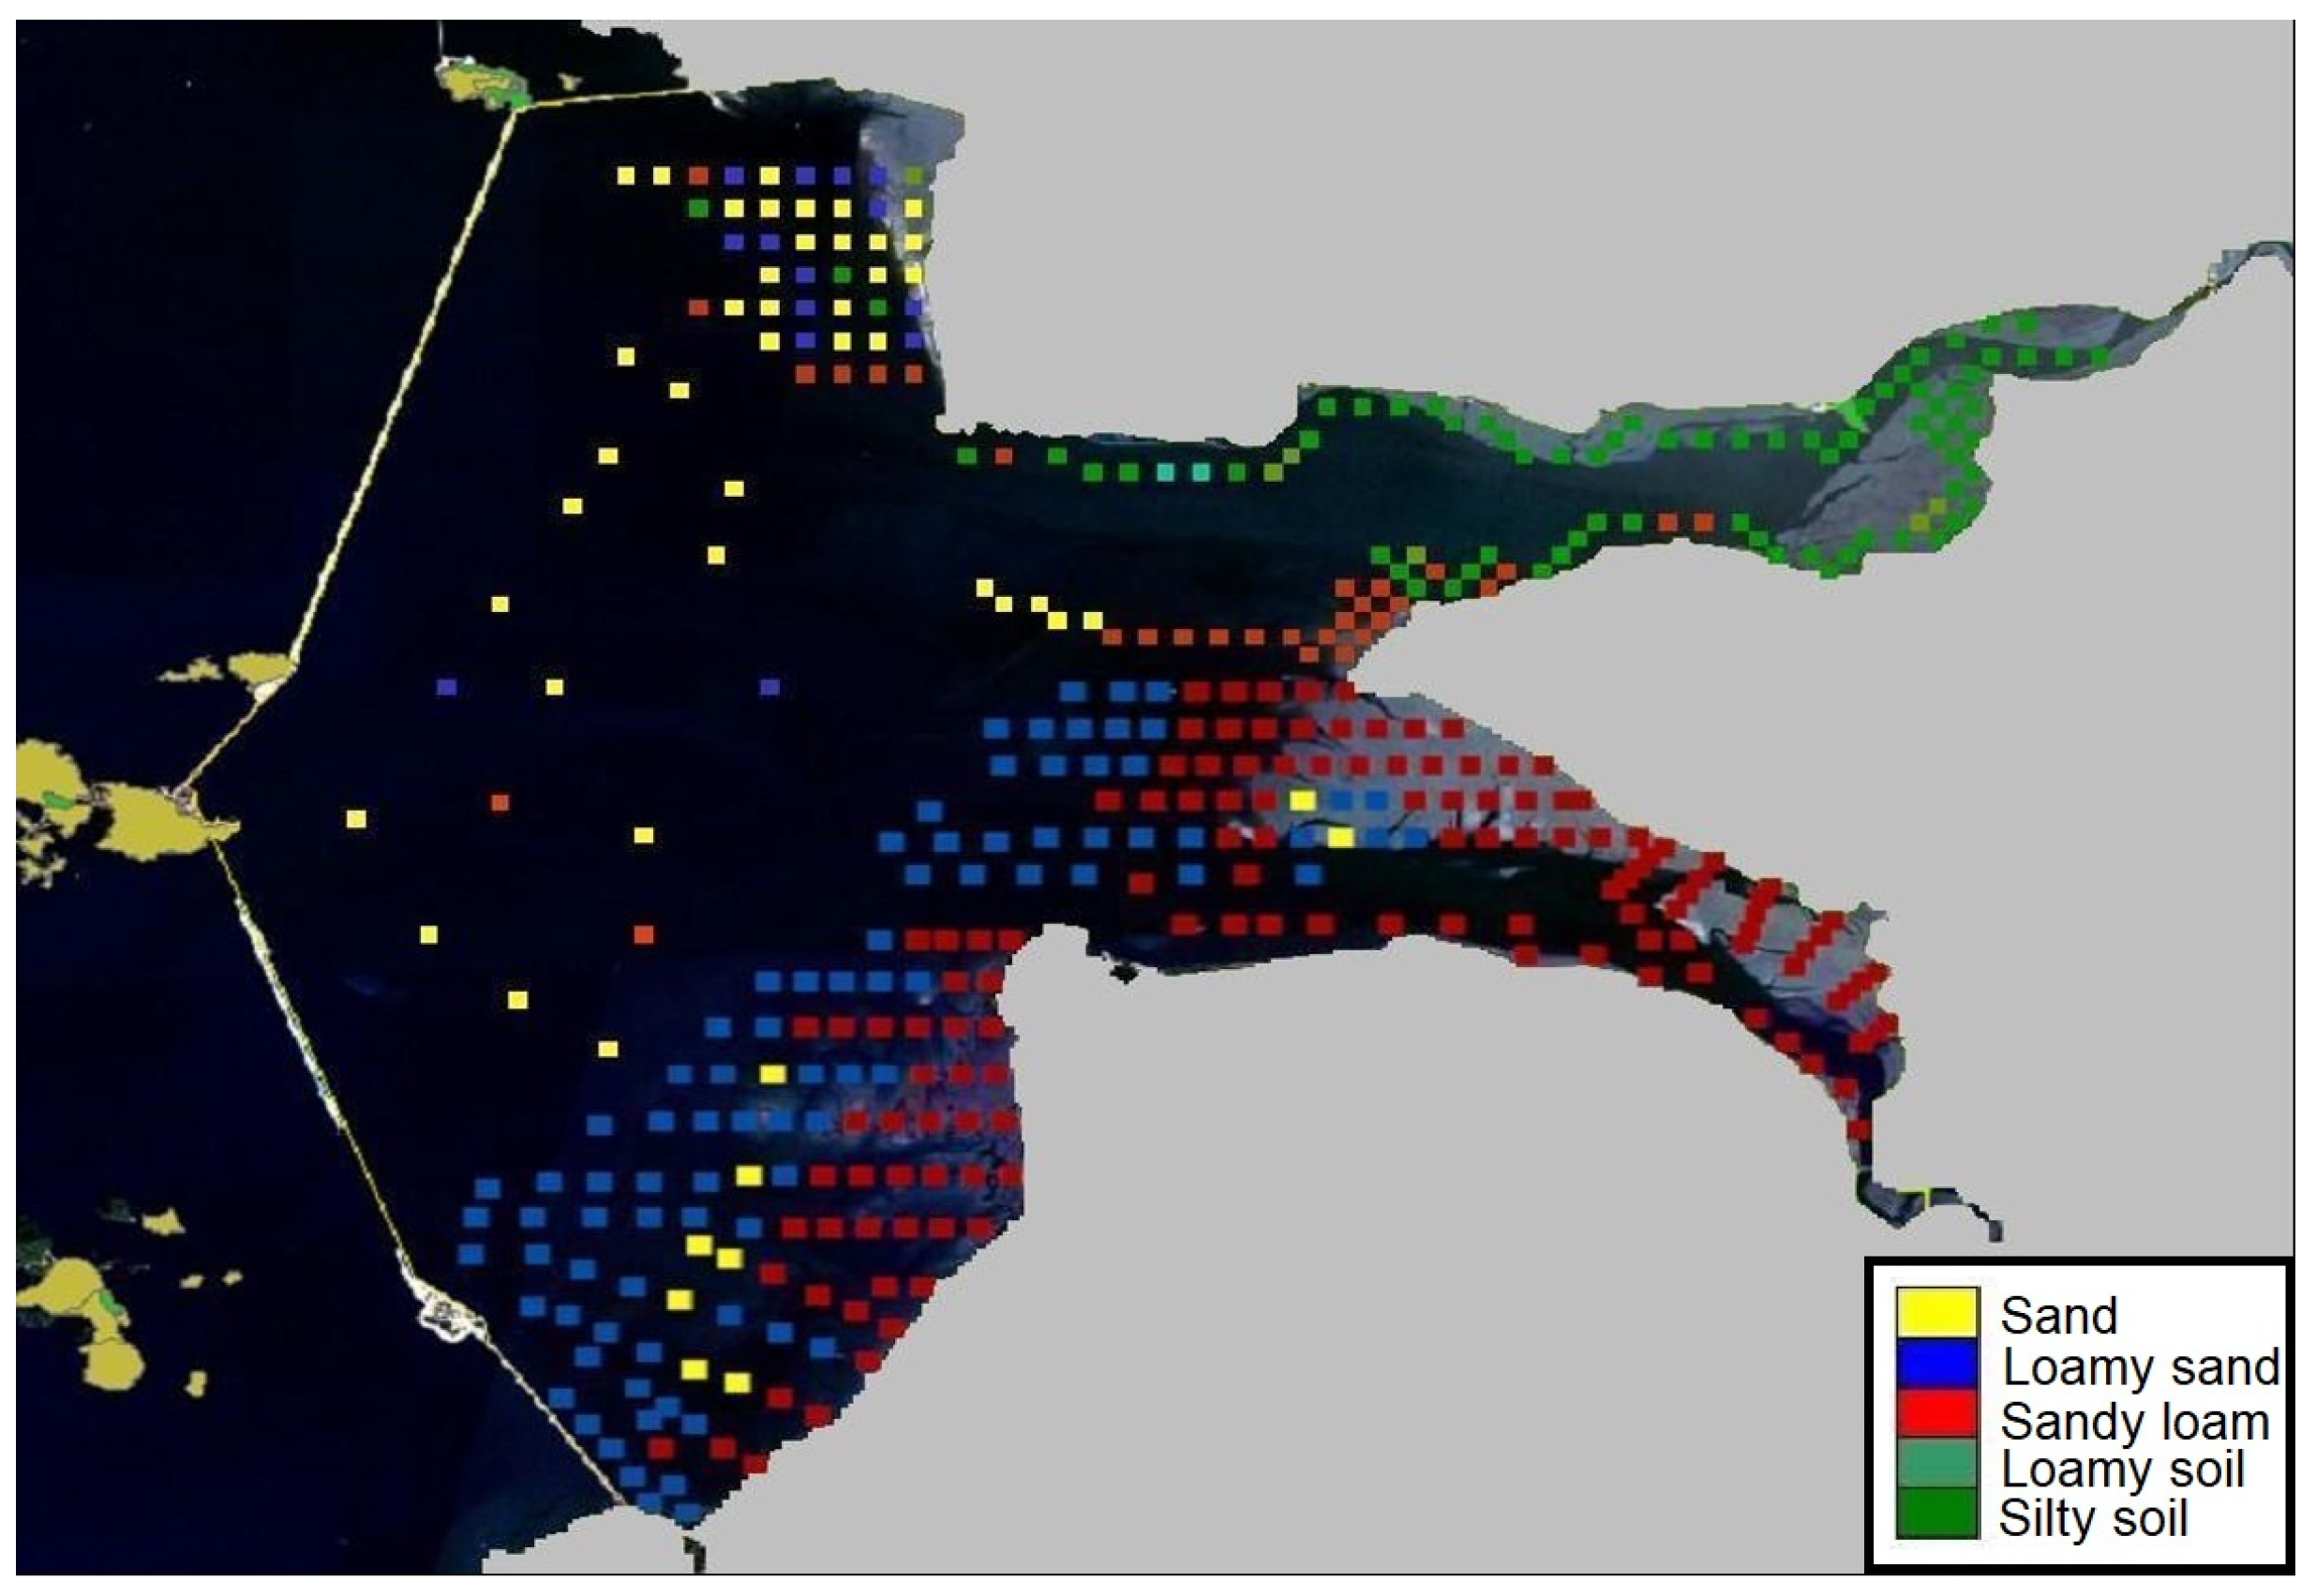
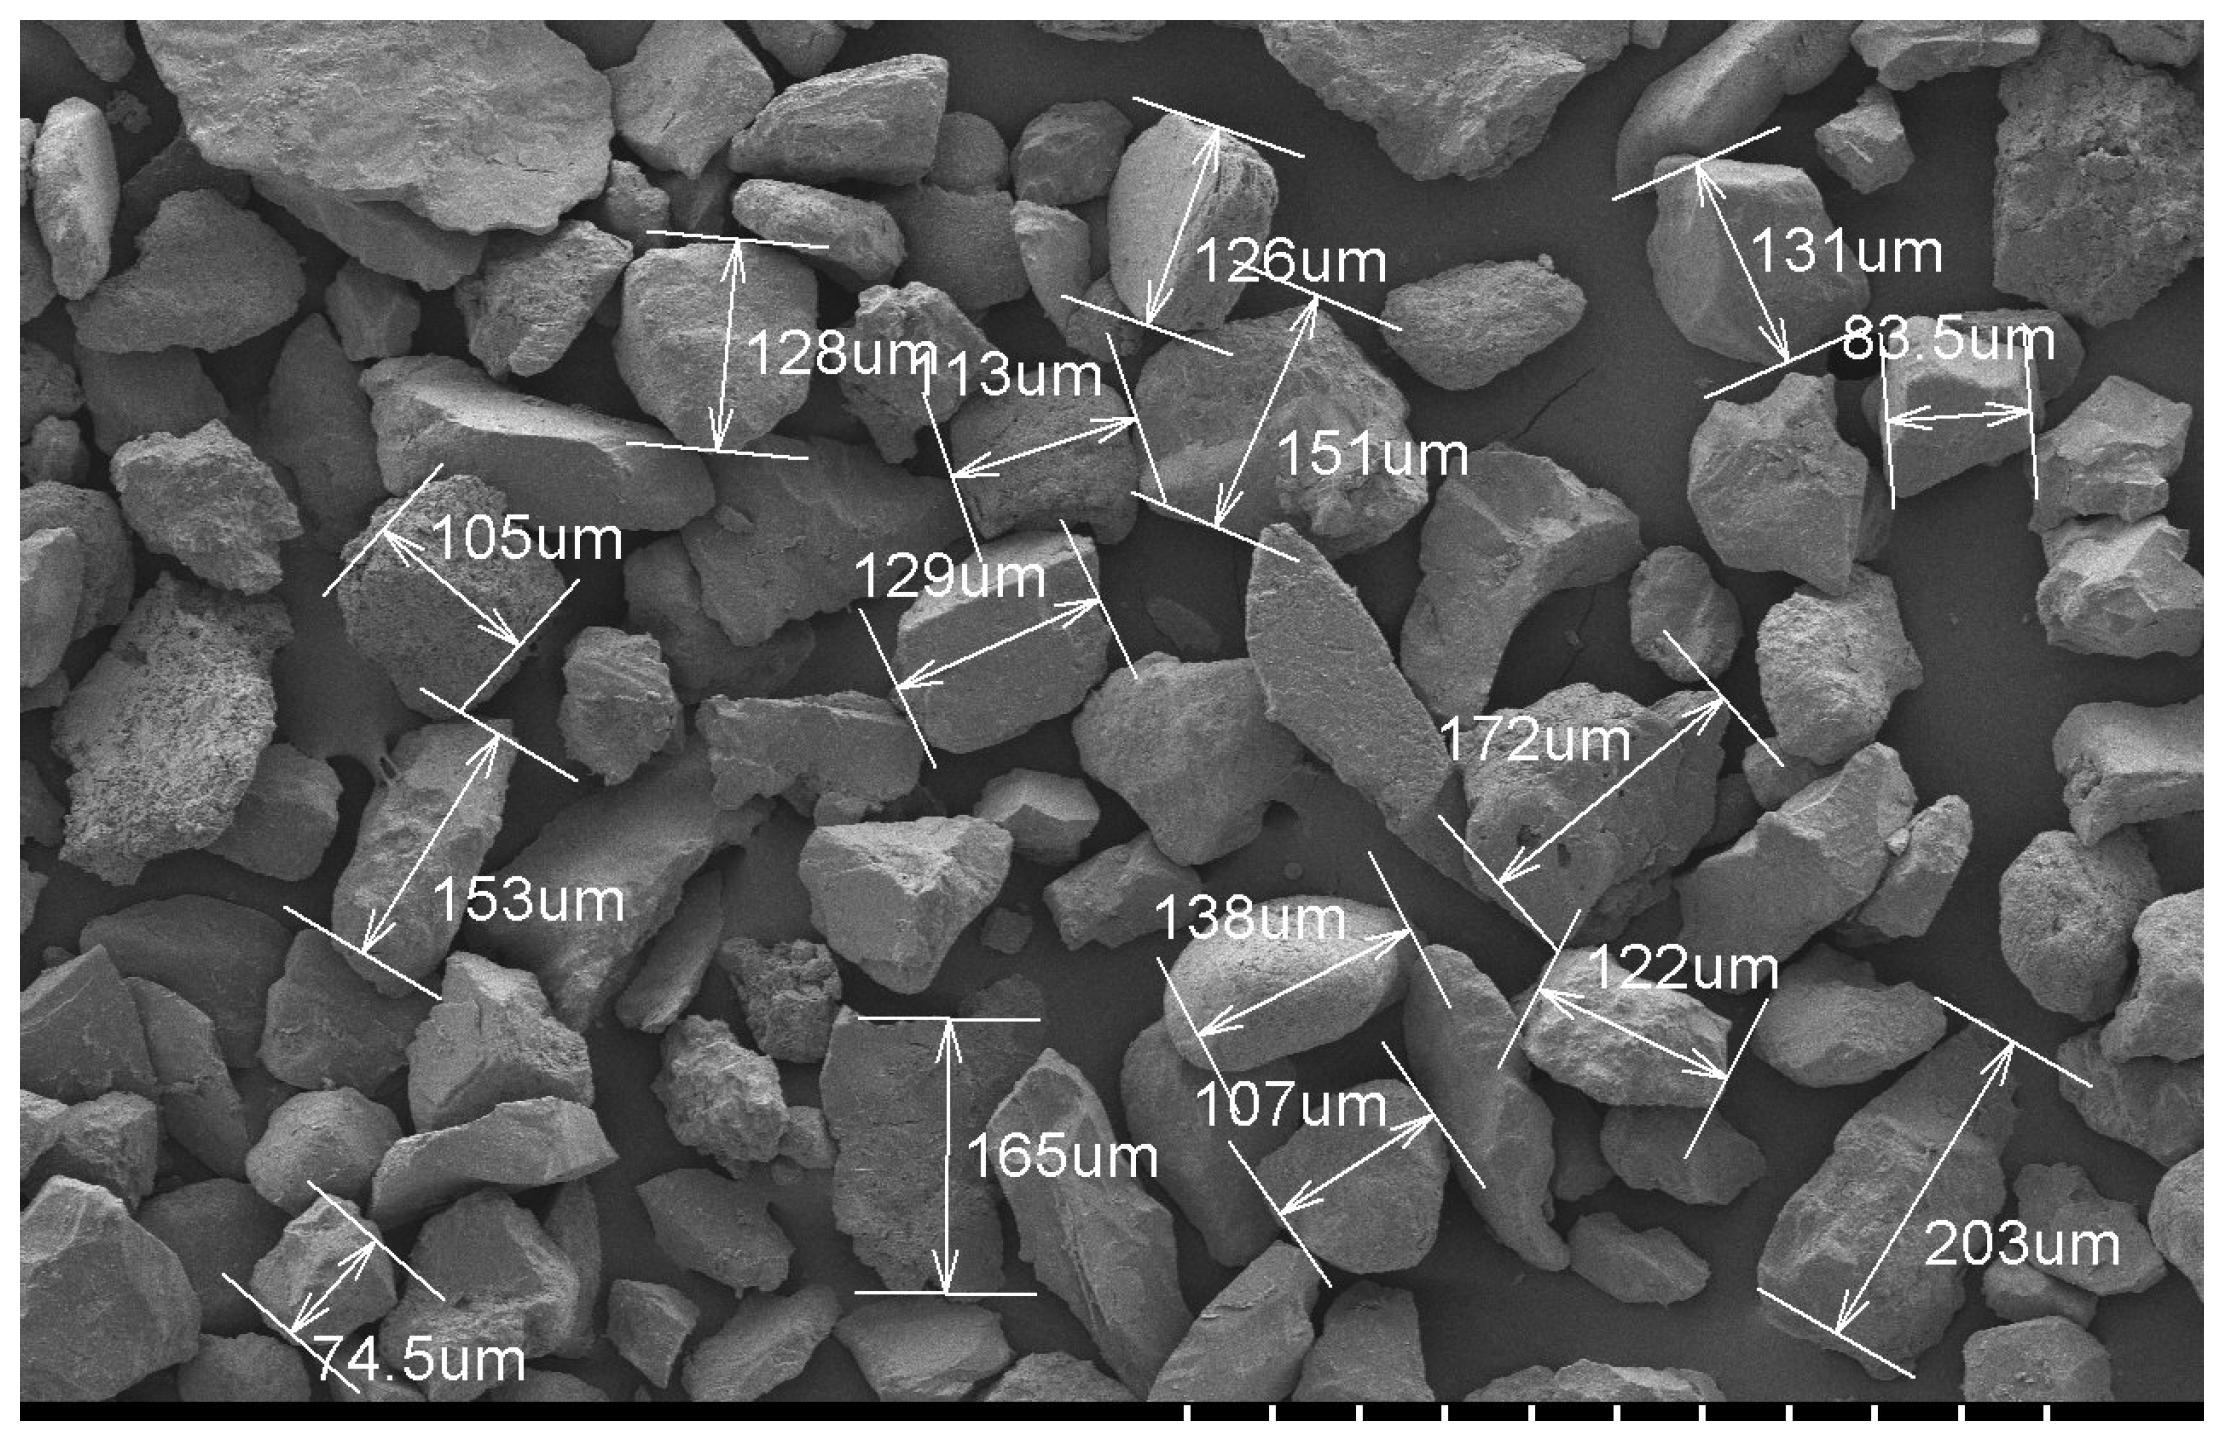
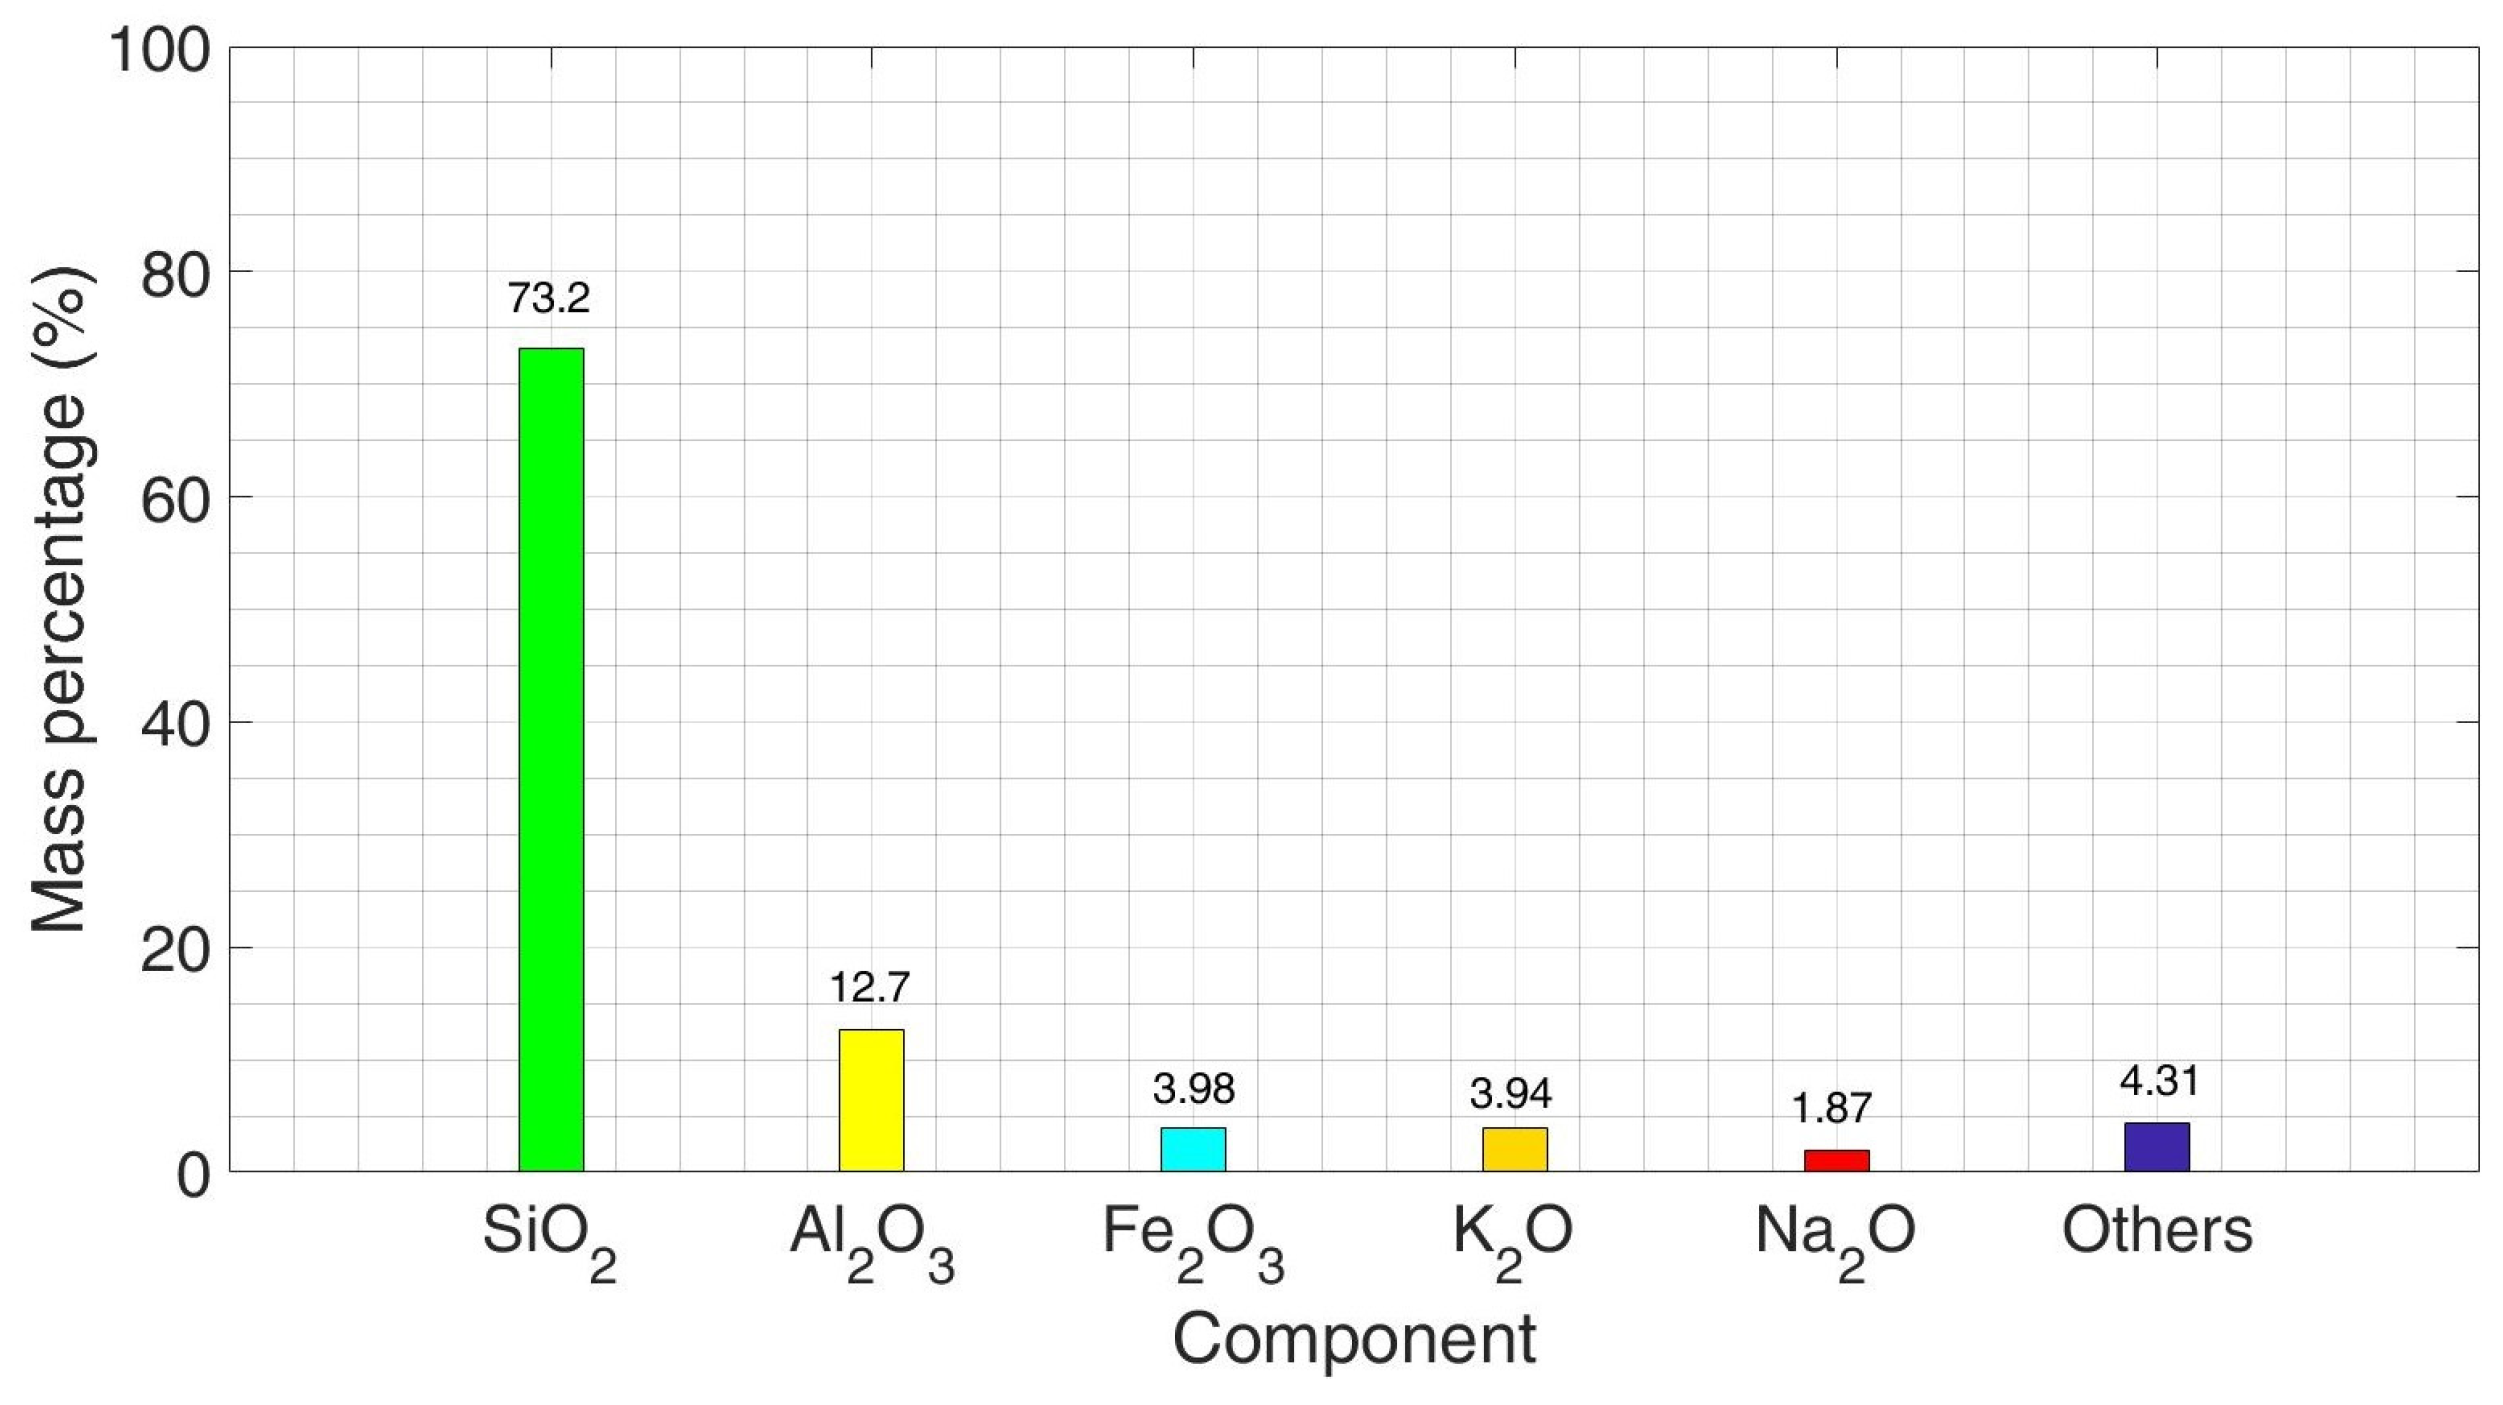
2.1. Soil Properties of Saemangeum Ground and Dreged Sand

Based on bathymetric and topographic data, the depth distribution of Saemangeum Lake ranges between EL(−) 45.0 m to EL(+) 4.0 m, and the terrain is mostly low due to the nature of deep-sea reclamation. In the lower reaches of the alluvial area of the Mangyeong River and the Dongjin River, the soil depth is deep with poor drainage. The electrical conductivity of the soil is in the range of 10 to 30 dS/m, which varies depending on the region. Several site investigations were conducted to assess the soil profile, soil distribution, and grain size. The soil profiles at a site in Saemangeum (Figure 3) based on the cone penetration test (CPT) are shown in Figure 4. The soil type was evaluated based on the method proposed by Robertson [41]. The soil profiles show that the Saemangeum ground at the area is composed of sand from the surface up to about a depth of 10.0 m. After a depth of about 10.0 m, the ground is mostly composed of clay. Liquefaction assessment based on CPT results showed that the sand at the top portion of the ground is susceptible to cyclic liquefaction. Further investigation of the soil distribution across Saemangeum is shown in Figure 5, and it can be seen that the ground surface is constituted of sand, loamy sand, sandy loam, loamy soil, and silty soil. In the Saemangeum gateway project (Figure 3), and after land reclamation of the area, the variation of the grain size distributions of the Saemangeum dredged soil was also investigated, as shown in Figure 6. In Figure 6, the Haje sample (Figure 3) is the soil used in the shaking table test conducted in this study. P-1 and P-2 are the samples obtained near the discharge point in the Saemangeum gateway project, and P-3 is the sample obtained near the spillway in the Saemangeum gateway project. As shown, the Haje silty sand, along with P-1 and P-2 of the reclaimed ground of the Saemangeum gateway project, is categorized as the most likely liquefiable soil based on the boundaries defined by Tsuchida [42]. For P-3, it is categorized as potentially liquefiable soil as it is composed of finer particles. P-3 is finer than P-1 and P-2 mainly due to the segregation of particles. Coarse particles tend to settle near the discharge point while large amounts of fine particles are being carried away into the direction of where the spillway is located. A standard penetration test (SPT) was also conducted at a site in Saemangeum (Figure 3), as shown in Figure 7. In Figure 7, BH-1, BH-2, and BH-3 are SPTs conducted near the gateway project, while BH-4 is conducted at the Haje port. Results show similar blow count distribution with depth for the four tests. Based on the SPTs, it can be seen that the soil at depths ranging between 0–2.5 m has low blow counts. In addition, the soil at depths ranging between 0–5 m was confirmed to be silty sand based on laboratory experiments. A summary of the properties of the Saemangeum silty sand used in the shaking table test are shown in Table 1.
Scanning Electron Microscopy (SEM) and X-Ray Diffraction (XRD) analysis were also conducted. Based on SEM, as shown in Figure 8, the soil consists of particles with sizes ranging from 74.5–203 μm, classifying it as very fine sand to fine sand based on the diameter limits given by the United States Department of Agriculture (USDA). In addition, it can be seen that the soil sample contains smooth and rough angular particles that are either near-spherical or cylindrical. The results of the XRD analysis, as shown in Figure 9, indicate that the Saemangeum silty sand contains 73.2% silica (SiO2), 12.7% aluminum oxide (Al2O3), 3.98% iron oxide (Fe2O3), and 3.94% potassium oxide. Silica is known for its ability to absorb moisture, which arises from the numerous small pores present in it. Since the soil mainly consists of silica, the soil sample has a chemical property that increases the attraction force between particles due to the energy generated by the capillary phenomenon. Hence, the soil sample used in the test is highly susceptible to seepage effects.

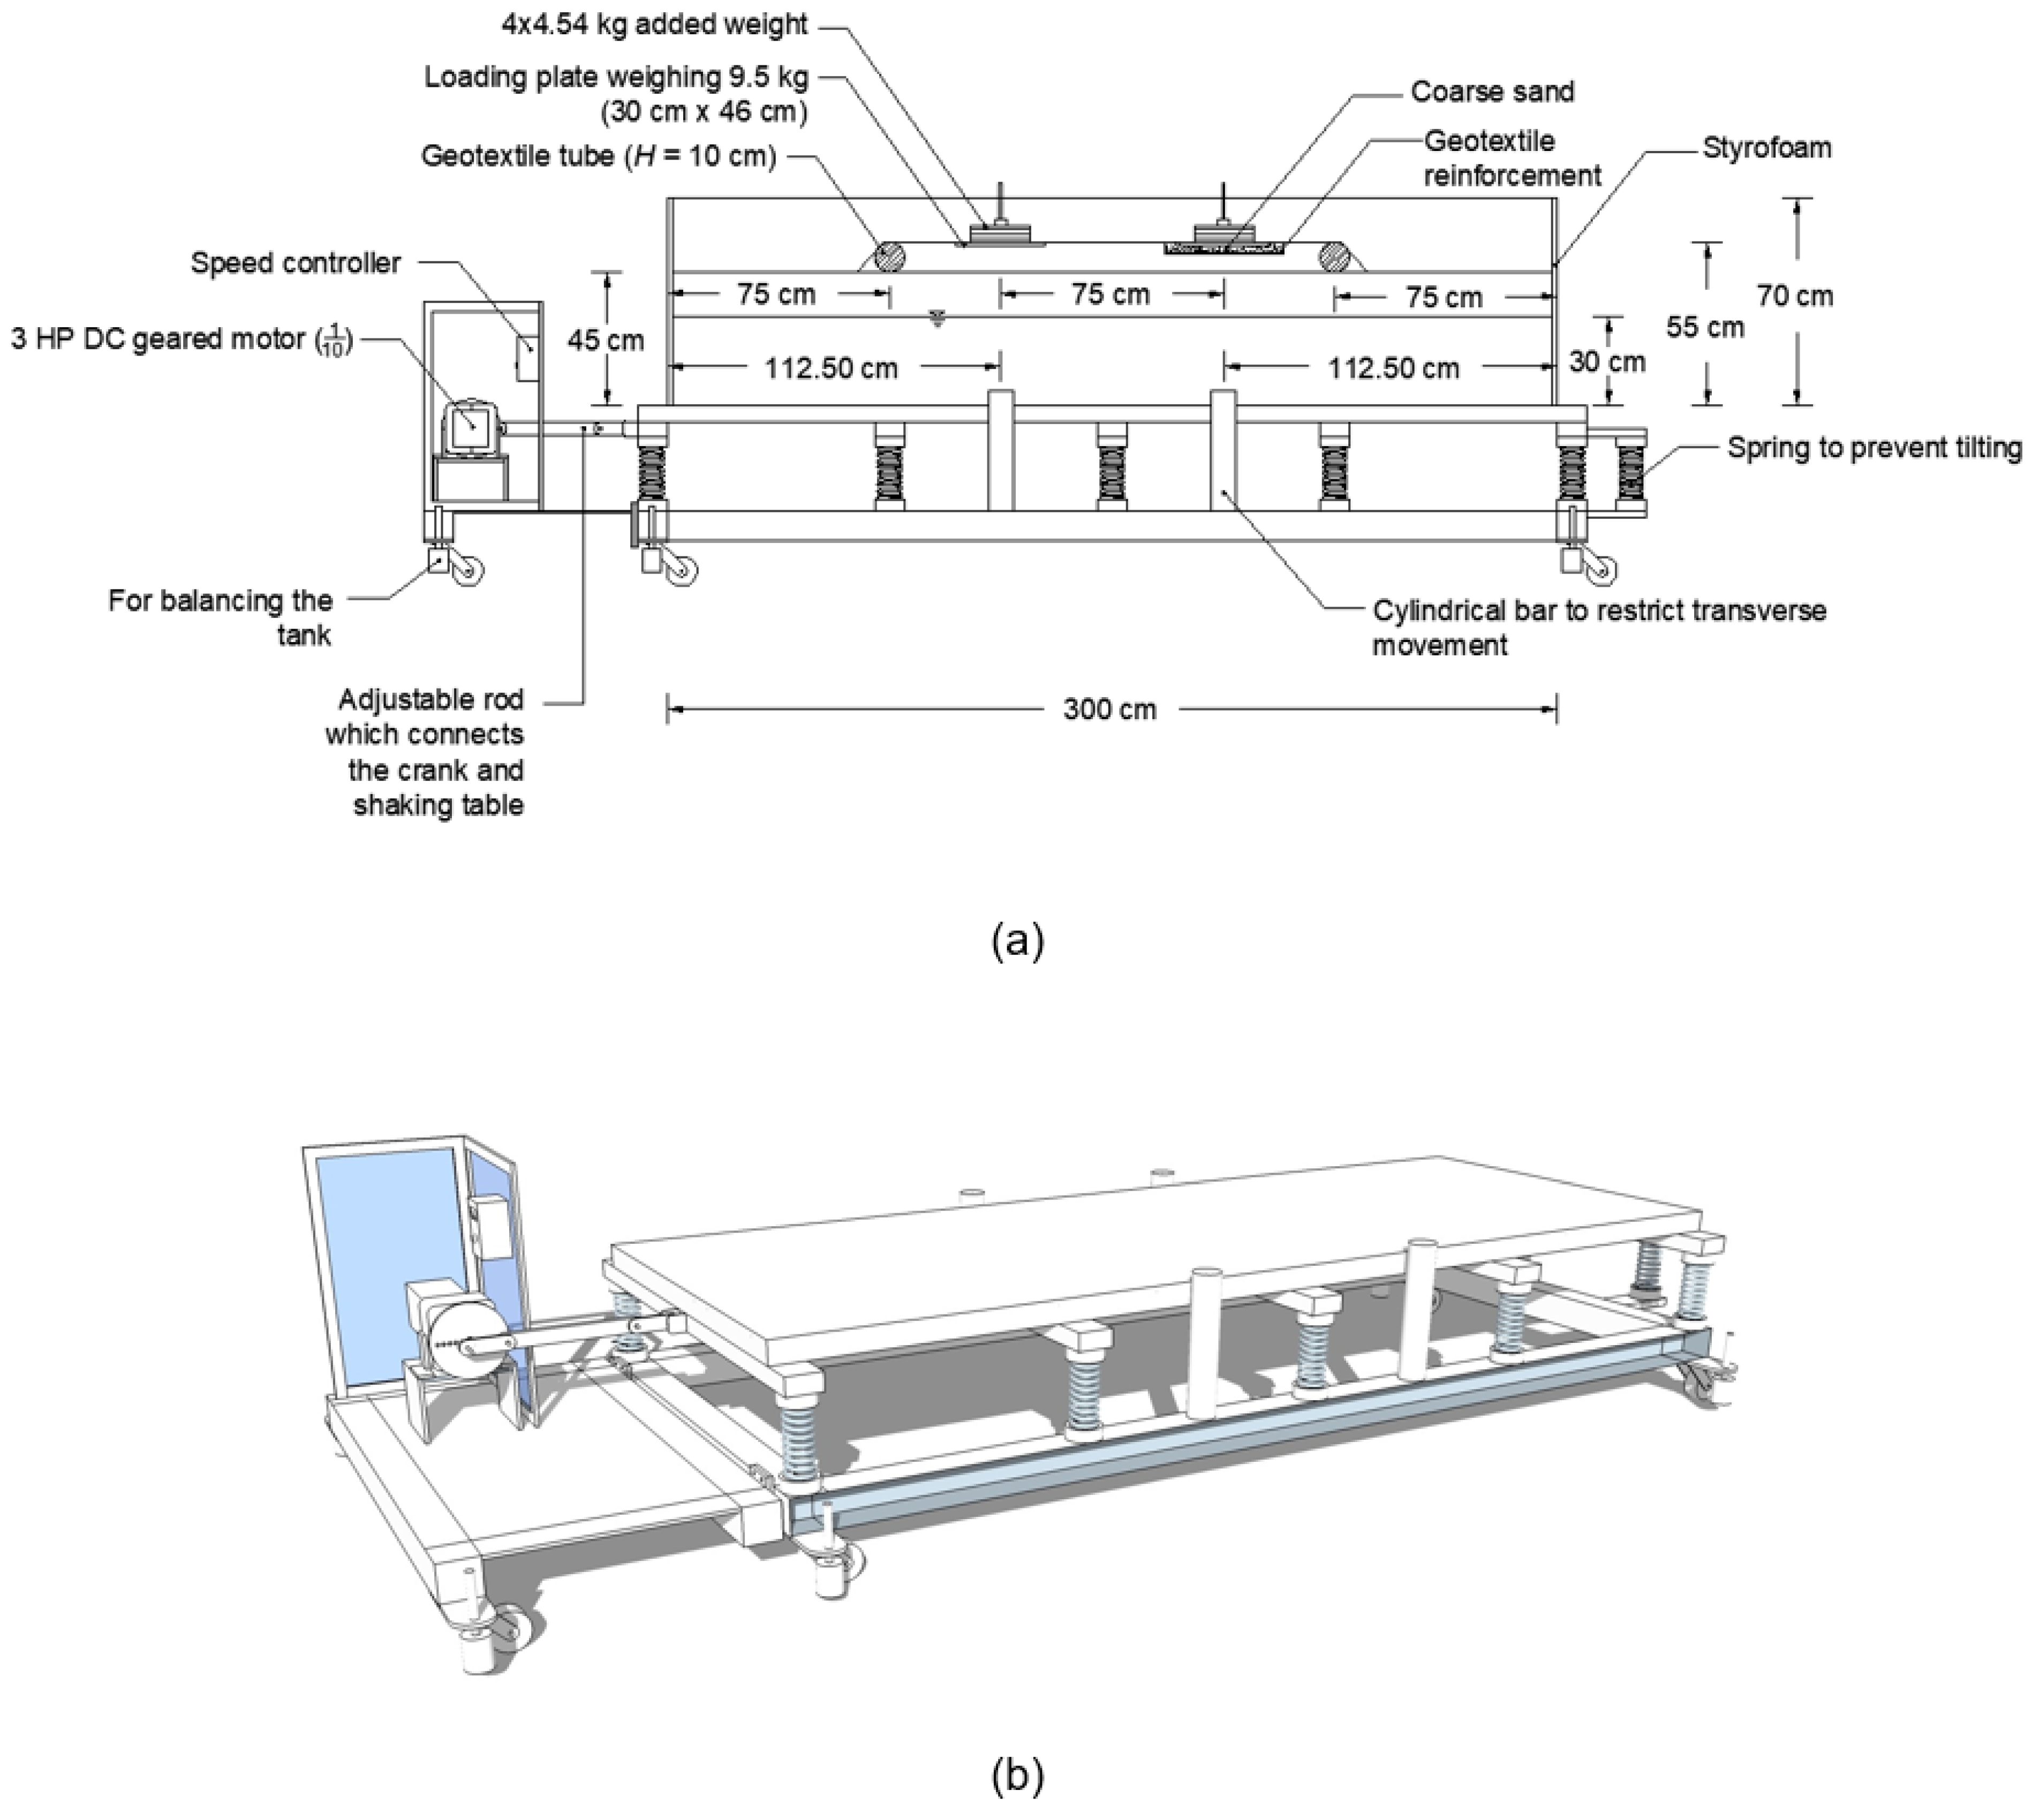
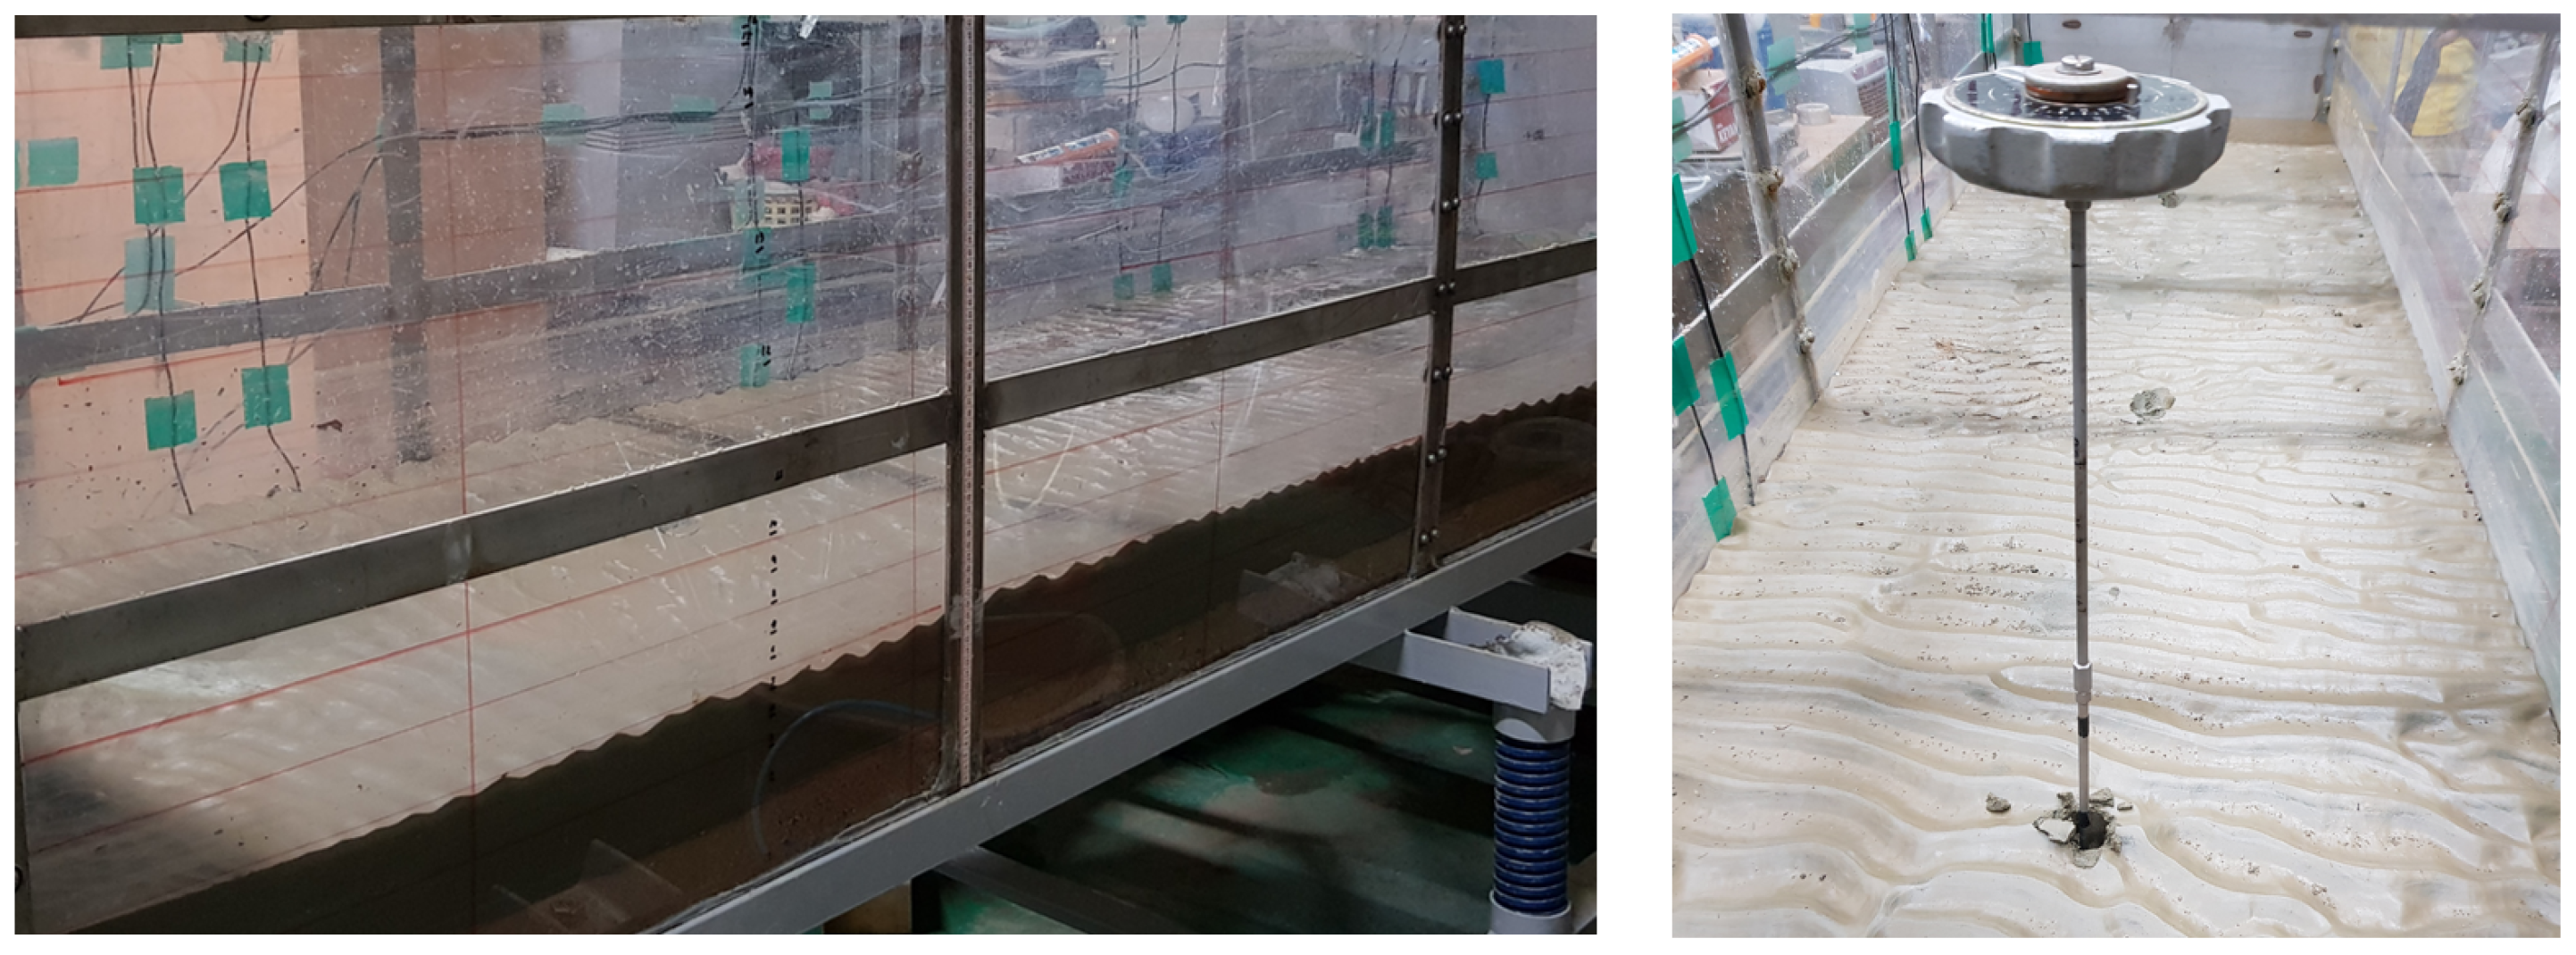
2.2. Shaking Table Apparatus and Scale Model Setup

The actual photo of the shaking table, the scale model test setup, and parts of the shaking table are shown in Figure 10 and Figure 11. Instead of rollers, the table is supported by 12 springs to allow vertical and horizontal movements. Two springs were also installed at the sides of the table to prevent rocking of the test tank, as shown in Figure 11a. The springs have a spring constant of 49.8 N/mm, a diameter of 7 cm, and a height of 30 cm. Although the table could move in three directions (x, y, z), transverse movement was restricted by installing cylindrical bars to achieve a plane strain condition. Glass strips were installed at the sides of the table near the location of the cylindrical bars to reduce friction between the bars and the table. For easy transportation or relocation of the apparatus, rollers or wheels were installed at the bottom of the shaking table. To secure the apparatus in place, as well as to balance or level the table, balance rods were also installed, as shown, which can be adjusted to be able to increase or decrease the elevation of the table. On top of the shaking table is a test tank with dimensions of 3.0 m in length, 0.7 m in height, and 0.7 m in width. At the bottom of the test tank, three translucent hoses were installed at equal space intervals to allow checking and adjustment of the water table. For easy viewing of the test specimen, the front and back of the test tank were made of transparent glass. Non-flexible Styrofoam with a thickness of 2 cm were placed within the box at the sides to reduce the reflection of energy associated with rigid boundary conditions.
As a preliminary experiment, a 5 cm thick coarse sand (2 mm in diameter) layer was added at the bottom of the tank, and a 10 cm thick silty sand layer was laid on the top of the coarse sand layer, as shown in Figure 12. Water was added until the water level was 30 cm above the silty sand layer. Thereafter, a shaking table test was conducted. Due to the waves formed by shaking, the upper soil layer was deformed, and a wavelike ground surface was formed. The deformation is caused particularly by Rayleigh waves, in which the surface layer of the ground experienced a combination of vertical and horizontal vibration. The preliminary test shows the difference in the seismic loading between conventional roller type shaking tables and the spring type shaking table used in the test.
Before placing the soil sample in the tank, the inner walls were lubricated to minimize soil adhesion. The method of preparing the model ground is similar to the methods by Miura and Toki [43] and Wichtmann et al. [44], in which dry sand is rained over the tank using a sieve. Sample preparation was done by initially filling the test tank with water to a depth of 5 cm. Thereafter, oven-dried sand was poured into a mesh screen that was placed at the very top of the test tank. The sample was sieved to maintain a uniform mass, and then was spread manually by hand as the sand deposit started to accumulate at the bottom of the test tank. The process was repeated until the height of the deposited soil was 45 cm. The embankment was then constructed using oven-dried sand, and pore pressure gauges (PP-B and PP-D) were installed 5 cm below the crest of the embankment. The embankment was reinforced by geotextile tubes with a height of 10 cm. The geotextile used was woven polyester, and its properties are summarized in Table 2. The scale of the embankment is 1:35. The scale is based on a single geotextile tube with a height of 3.5 m and a theoretical diameter of 5.0 m with the width of the embankment being 52.5 m. These dimensions are close to the dimensions of the geotextile tube-reinforced embankment simulated in the paper by Kim et al. [36], in which the height of the stacked geotextile tubes was 5.5 m and the width of the embankment without rock armor was 84.60 m.
Water was then added up to a height of 50 cm from the bottom of the tank and was maintained for 24 h to saturate the soil. The state of the soil in the embankment was initially in a dry state. However, water migrated to the dry embankment, causing the embankment soil to be in a moist state. Thereafter, the water level was lowered to a height of 30 cm using the hoses that were installed at the bottom of the tank. Moist soil samples were then taken at different locations for oven-dry testing. From the oven-dry test, the water content (ω) of the samples was about 30%, the dry unit weight (γdry) was approximately 13.13 kN/m3, the moist unit weight (γmoist) was 17 kN/m3, the saturated unit weight (γsat) was 18 kN/m3, and the relative density (Dr) was about 40%. Shallow foundations that were 75 cm apart from each other were then installed, as shown in Figure 11a. The shallow foundations consisted of a loading plate that weighed 9.5 kg. On top of the loading plates, 4 rectangular plates that weigh 4.54 kg were placed and secured using bolts. The soil located below the shallow foundation at the right side of the embankment was reinforced with a polyester (PET) geotextile that was placed 3 cm below the crest of the embankment. A coarse sand layer, which acts similarly like a drain zone or gravel mat, was placed on top of the reinforcement to reduce excess pore water pressure generation below the shallow foundation. The coarse sand is classified as poorly graded sand (SP). It has a specific gravity, permeability, D60, D30, and D10 of 2.72, 1.34 × 10⁻¹ cm/s, 0.63 mm, 0.51 mm, and 0.44 mm, respectively. The maximum and minimum dry unit weight of the coarse sand are 15.79 kN/m3 and 13.24 kN/m3, respectively.
A total of 2 pore water pressure gauges, 4 soil pressure gauges, and 5 accelerometers were used in the test. The sensors were placed in the manner as shown in Figure 13 and were connected to data loggers that transmitted the data readings into computers. The motion of the shaking table is powered by a DC geared motor in which the maximum frequency and horizontal displacement at the base of the table are 3 Hz and 5 cm, respectively. The speed of the motor is regulated via a speed controller while the horizontal displacement at the base can be varied by modifying the adjustable rod connected to the shaking table and the crank. In this study, the shaking table was excited in the longitudinal direction at a base motion of about 0.175 g. The predominant frequency and period in the shaking test were 1.25 Hz and 0.80 s, respectively. In this study, the earthquake load was applied until the occurrence of liquefaction was perceptible.

2.3. Calculation of the Initial Stress, Interpolated Acceleration, Shear Stress, and Shear Strain

To obtain the initial stresses of the test specimen, finite element analysis (FEA) was conducted using Plaxis 2D utilizing the unit weights of the soil obtained from the oven-dry test. The scale model was first analyzed by activating the embankment. Thereafter, surcharge loads A, which represented the shallow foundations, were activated with a load value of about 1 kPa. The initial effective stress distribution of the test specimen was then obtained, showing a maximum effective stress of about 7 kPa, located directly below the shallow foundations at exactly 55 cm from the crest of the embankment. The stress distribution was confirmed by comparing the measured total stresses and the predicted total stresses at SPV1 before the start of shaking. The measured total stress at SPV1-A and SPV1-B indicated a value of 9.0 kPa and 9.5 kPa, respectively, while the predicted total stresses at SPV1-A and SPV1-B were 8.1 kPa and 9.97 kPa, respectively. The stresses obtained using FEM were necessary in the analysis of the measured data.
Accelerometer A1-C was placed at the bottom of the shaking table to measure the input acceleration in the horizontal and vertical direction. Surface accelerometers (A2-A, A2-B, A2-C, and A2-D) were used to obtain the interpolated accelerations (az) at various depths of the soil using Equation (1). From the accelerations and the predicted initial total stresses (σv0) from FEA, the dynamic shear stresses (τd) and shear strains (γ) can be obtained using Equations (2) and (3), respectively. In Equations (1)–(3), asurface is the acceleration at the surface (accelerometers A2), ainput is the acceleration at the base of the test tank (accelerometer A1-C), z is depth, h is the height of soil from the base of the test tank to the surface, g is gravity, d1 is the horizontal displacement at the surface, and d2 is the horizontal displacement at the base of the test tank.
a z = a s u r f a c e + ( a i n p u t a s u r f a c e ) ( z / h )
τ d = 1 2 σ v 0 · ( a s u r f a c e + a z ) g
γ = d 1 d 2 h

3. Results

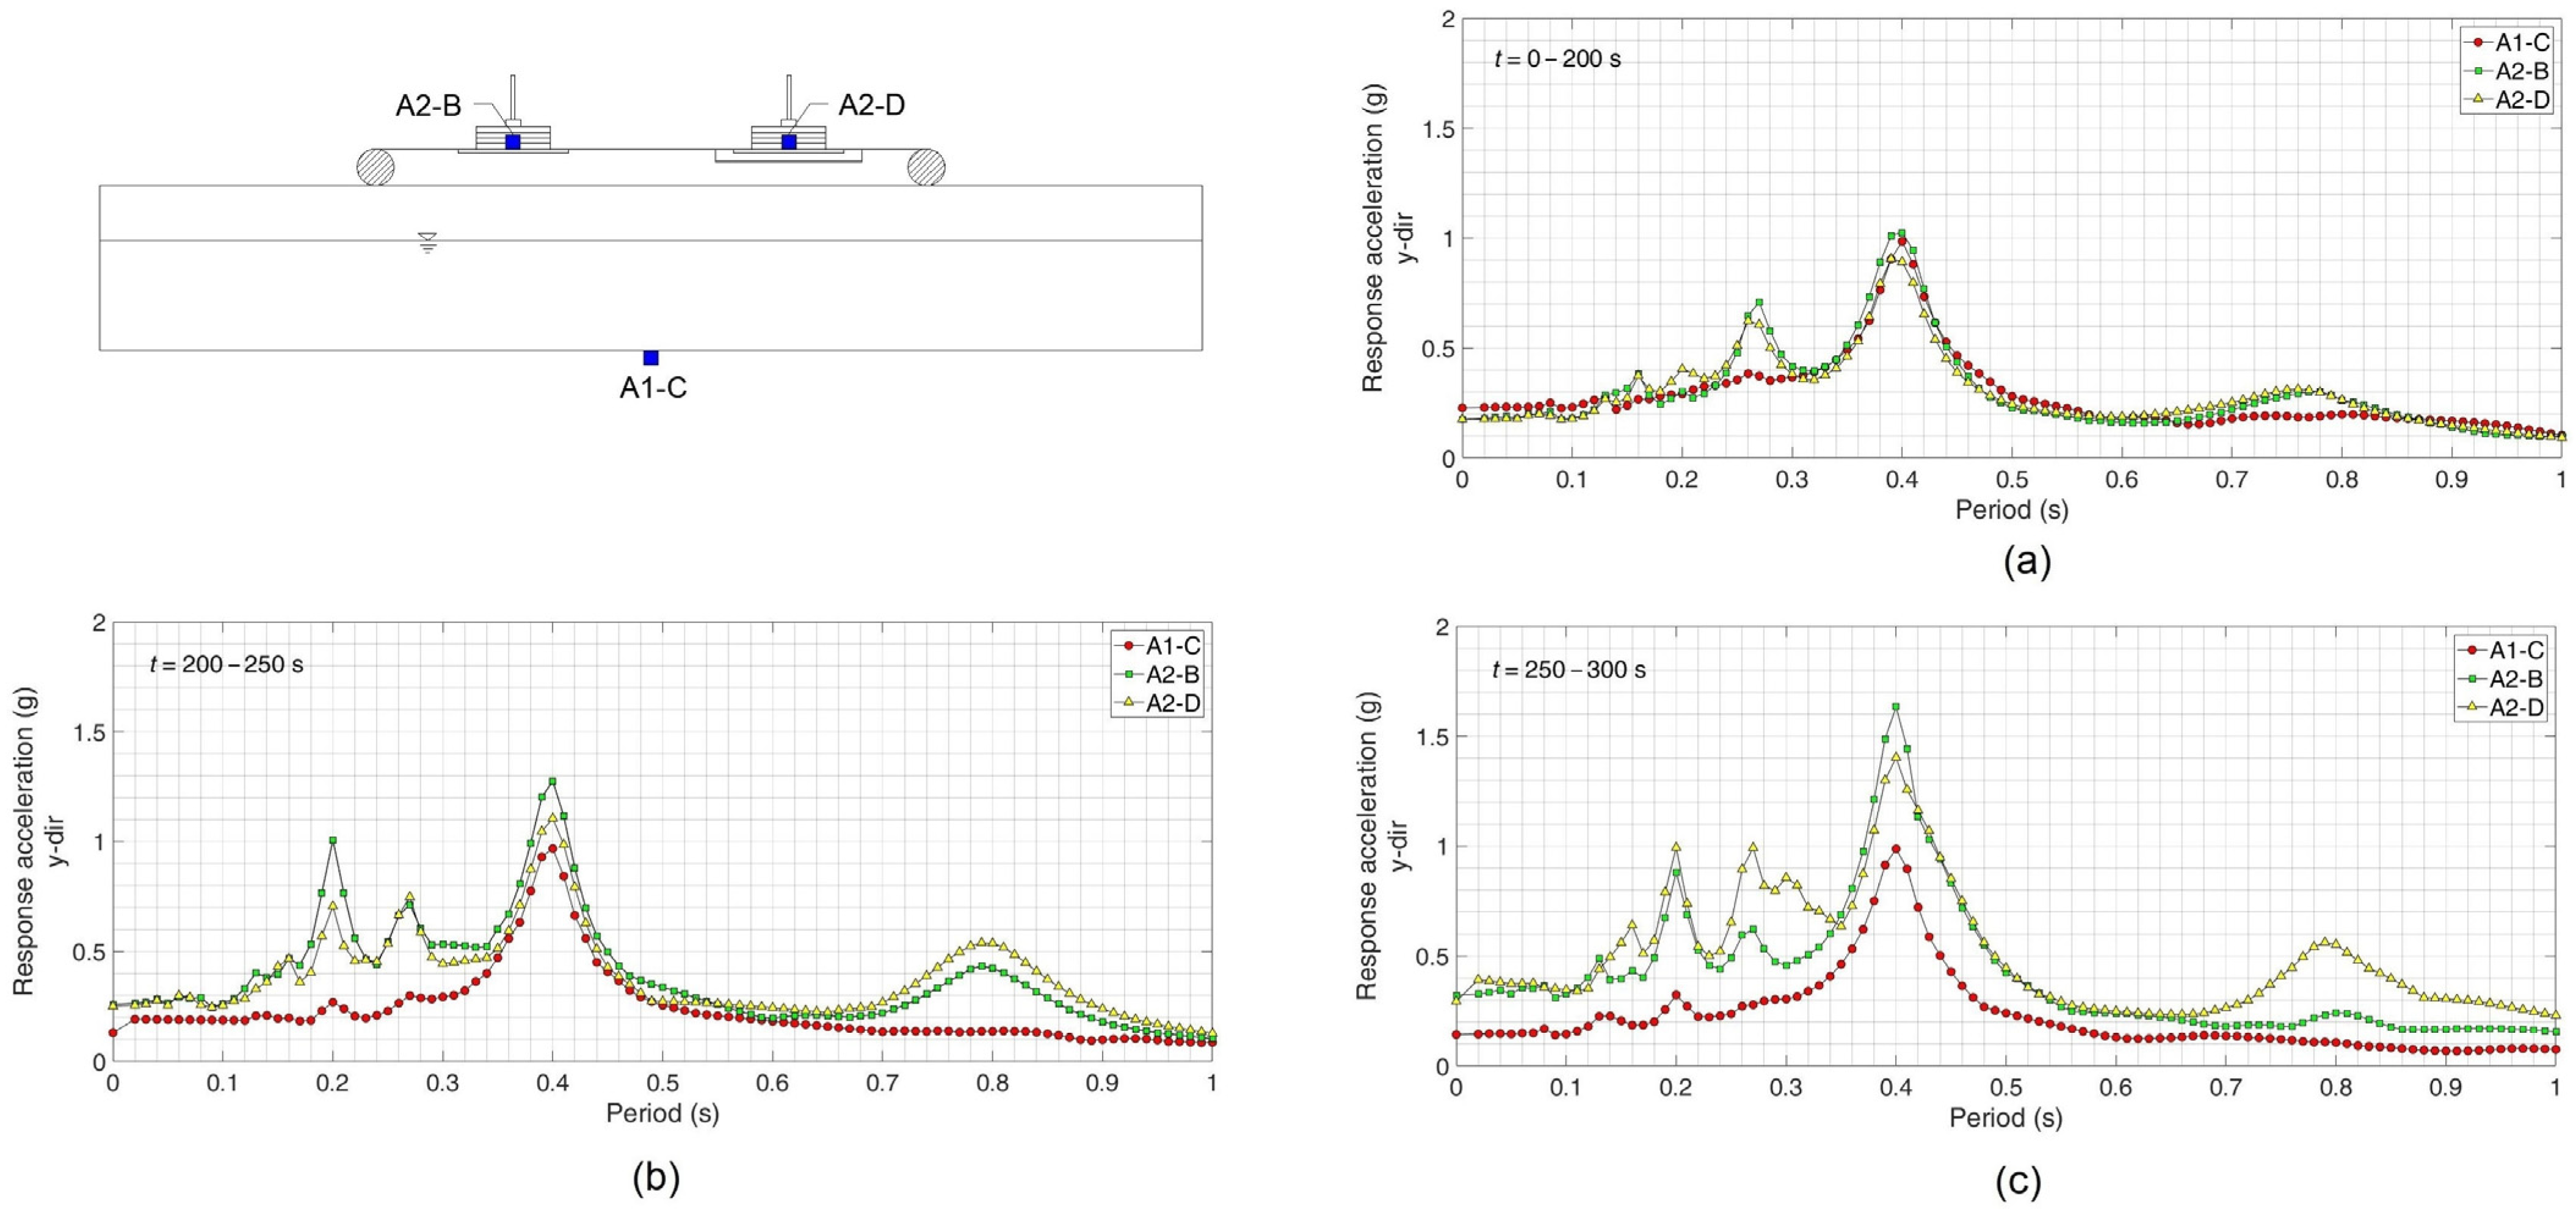
3.1. Recorded Accelarations and Response Spectra

The recorded horizontal and vertical acceleration during shaking are shown in Figure 14 and Figure 15, respectively. Looking at the surface accelerations (A2), sharp response accelerations occurred earlier at A2-A at about 190 s, indicating that liquefaction of the model occurred first outside of the embankment. The reason for this is that overburden pressure outside of the embankment is smaller in comparison to the soil under the embankment. Since the soil outside of the embankment started to weaken, triggering large displacements and the loss of bearing capacity, the geotextile tube reinforcement was also displaced horizontally as well as vertically. Larger surface accelerations were observed in the embankment soil in comparison to the soil outside of the embankment as the geotextile tube reinforcement was laterally displaced. Furthermore, the surface horizontal accelerations during shaking at A2-C, as shown in Figure 14d, were excessively large at about t = 250 s to 300 s in comparison to A2-B and A2-D, in which the peak surface acceleration at A2-C was about 6 times the peak input acceleration. The reason for this is that the accelerometer was placed in the open ground, allowing it to freely move horizontally in comparison to accelerometers A2-B and A2-D in which the distinct movements were in the vertical direction (settlement of the foundation). Comparing the surface accelerations A2-B and A2-D, large surface accelerations occurred at longer durations at A2-B than at A2-D. This could be due to the reinforcement and improvement of the foundation soil in A2-D. Sharp vertical accelerations were also observed starting at about 200 s, as shown in Figure 15b,c. It is evident that sharp vertical accelerations started to occur earlier at a longer duration at A2-B than at A2-D as sharp vertical accelerations only started to occur at about 250 s for A2-D. Sharp vertical accelerations indicate the occurrence of foundation subsidence due to liquefaction. A comparison of the state of the shallow foundations before and after shaking is shown in Figure 16, which exhibits large settlement of the shallow foundations. At the end of shaking, the foundation at location B settled to about 13 cm while the foundation at location D settled to about 10 cm. The slight reduction of the foundation settlement may have been a manifestation of the inclusion of a geotextile layer.
The variation of the horizontal elastic response spectra (5% damping) at A1-C, A2-A, A2-B, A2-C, and A2-D is shown in Figure 17. In Figure 17a, it can be seen that at t = 0–150 s the maximum response accelerations at all accelerometers are almost the same, with the maximum input response acceleration (A1-C) being slightly smaller than the surface response accelerations (A2). This means that at this time range, the surfaces of the scale model have not liquefied. However, at t = 150–200 s, as shown in Figure 17b, it can be observed that the response accelerations at A2-A, A2-B, and A2-D, have greatly deviated from the input response acceleration (A1-C) while the response acceleration at A2-C (accelerometer at center surface of embankment) only slightly increased. This response may be a result of liquefaction at A2-A (outside zone of embankment). Similar responses from A2-B and A2-D may be caused by the weakening of the ground in which the geotextile tubes were laid, causing the embankment soil near the outside zone to behave similarly to A2-A. The very small change in the response acceleration at A2-C gives the impression that the soil inside the embankment has not liquefied at the time range of t = 150–200 s. However, at t = 200–225 s, as shown in Figure 17c, it can be seen that the maximum response acceleration at A2-C (center surface of embankment) has exceeded all maximum response accelerations, which signifies that the embankment soil has started to liquefy, and that the excessive maximum response acceleration is a result of lateral spreading. It should be noted that the maximum response accelerations at A2-B and A2-D are almost similar to A2-A but are smaller than A2-C. This is because these two accelerometers were placed on the surface of the loading plates and not the ground surface. It can also be observed that A2-B has a higher maximum response acceleration than A2-D. Similar behavior can be seen in Figure 18, in which the maximum vertical elastic response acceleration at A2-B is greater than A2-D. This response may be a result of soil improvement and reinforcement at A2-D.

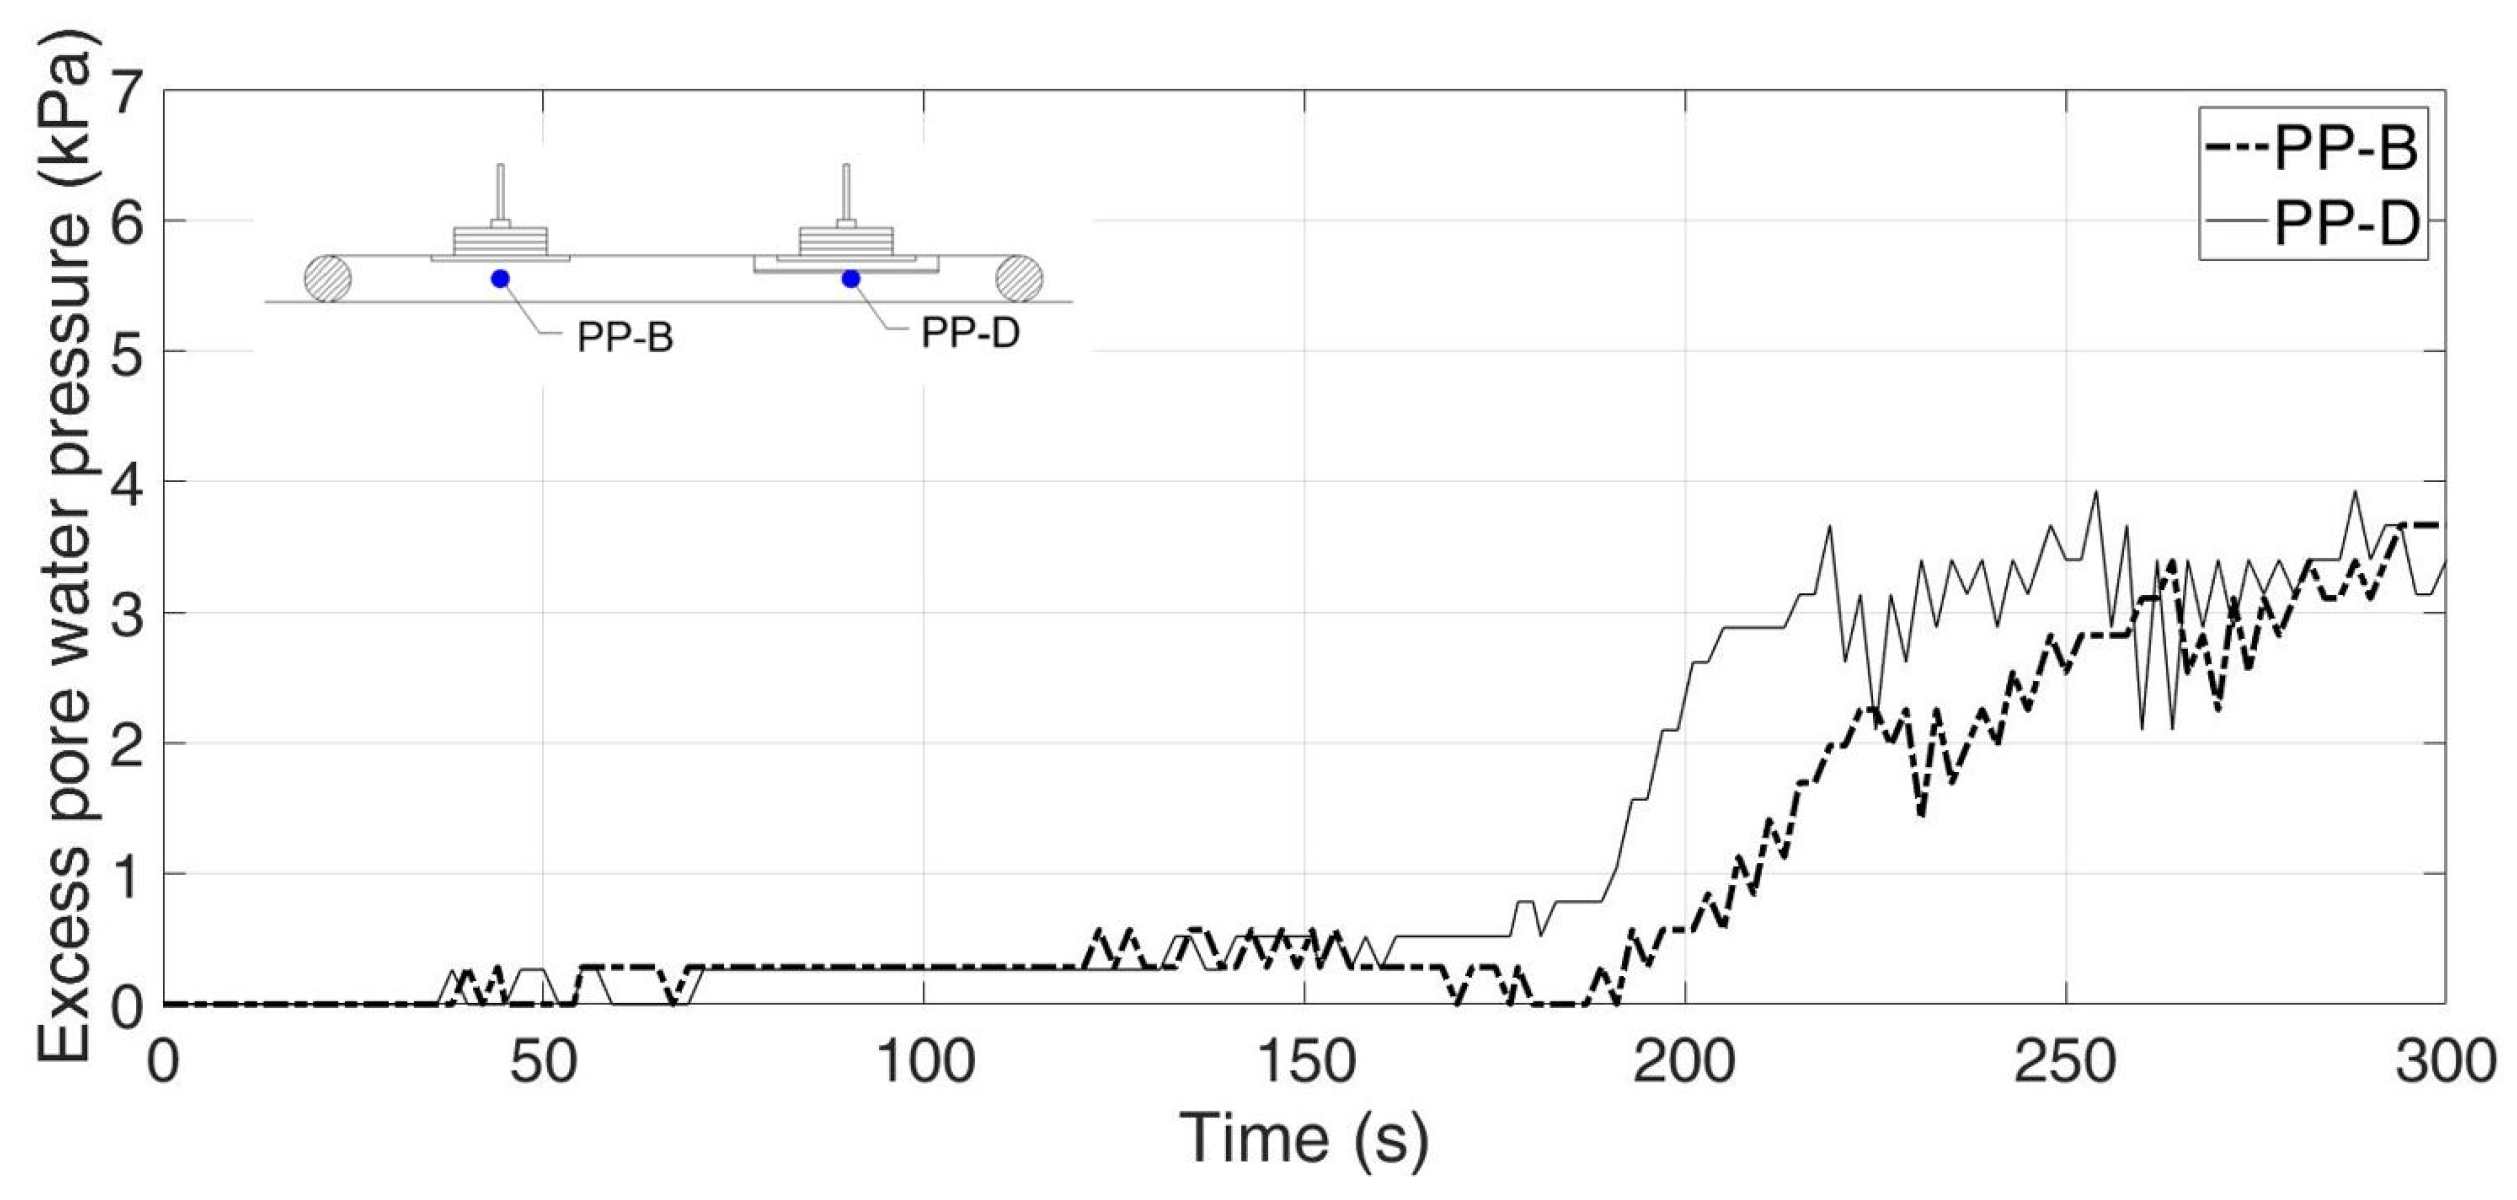
3.2. Excess Pore Water Pressures
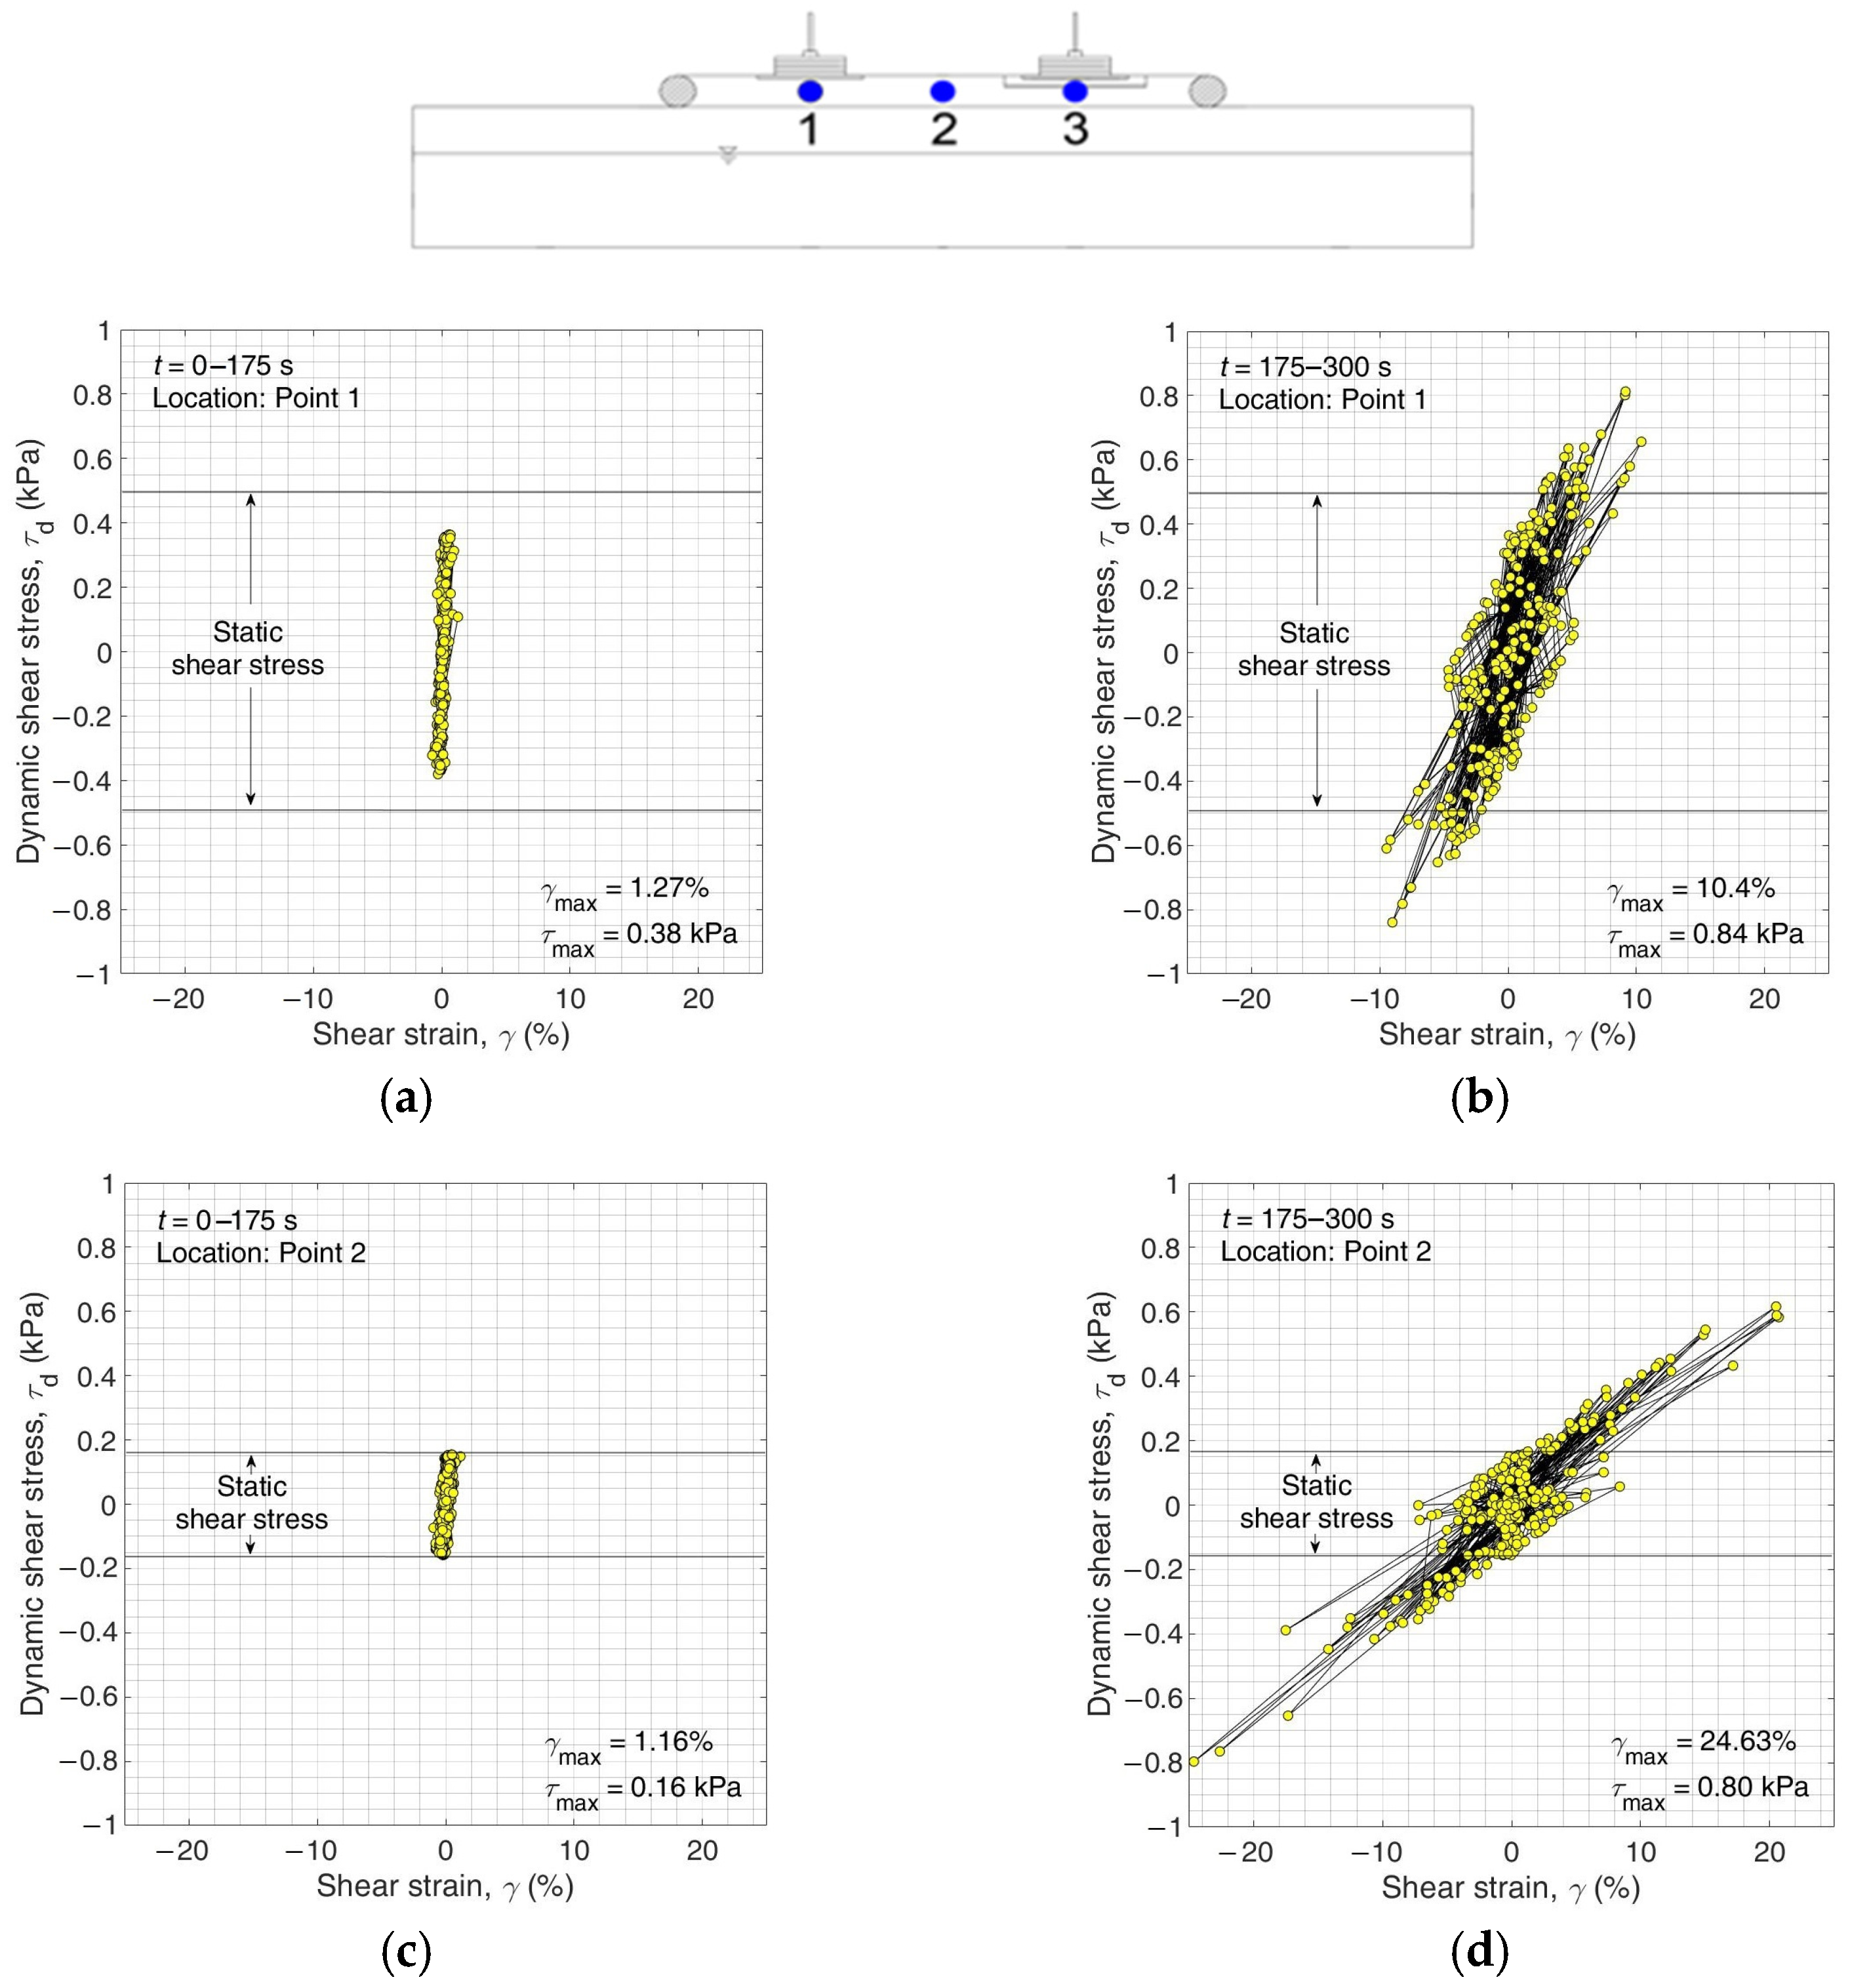
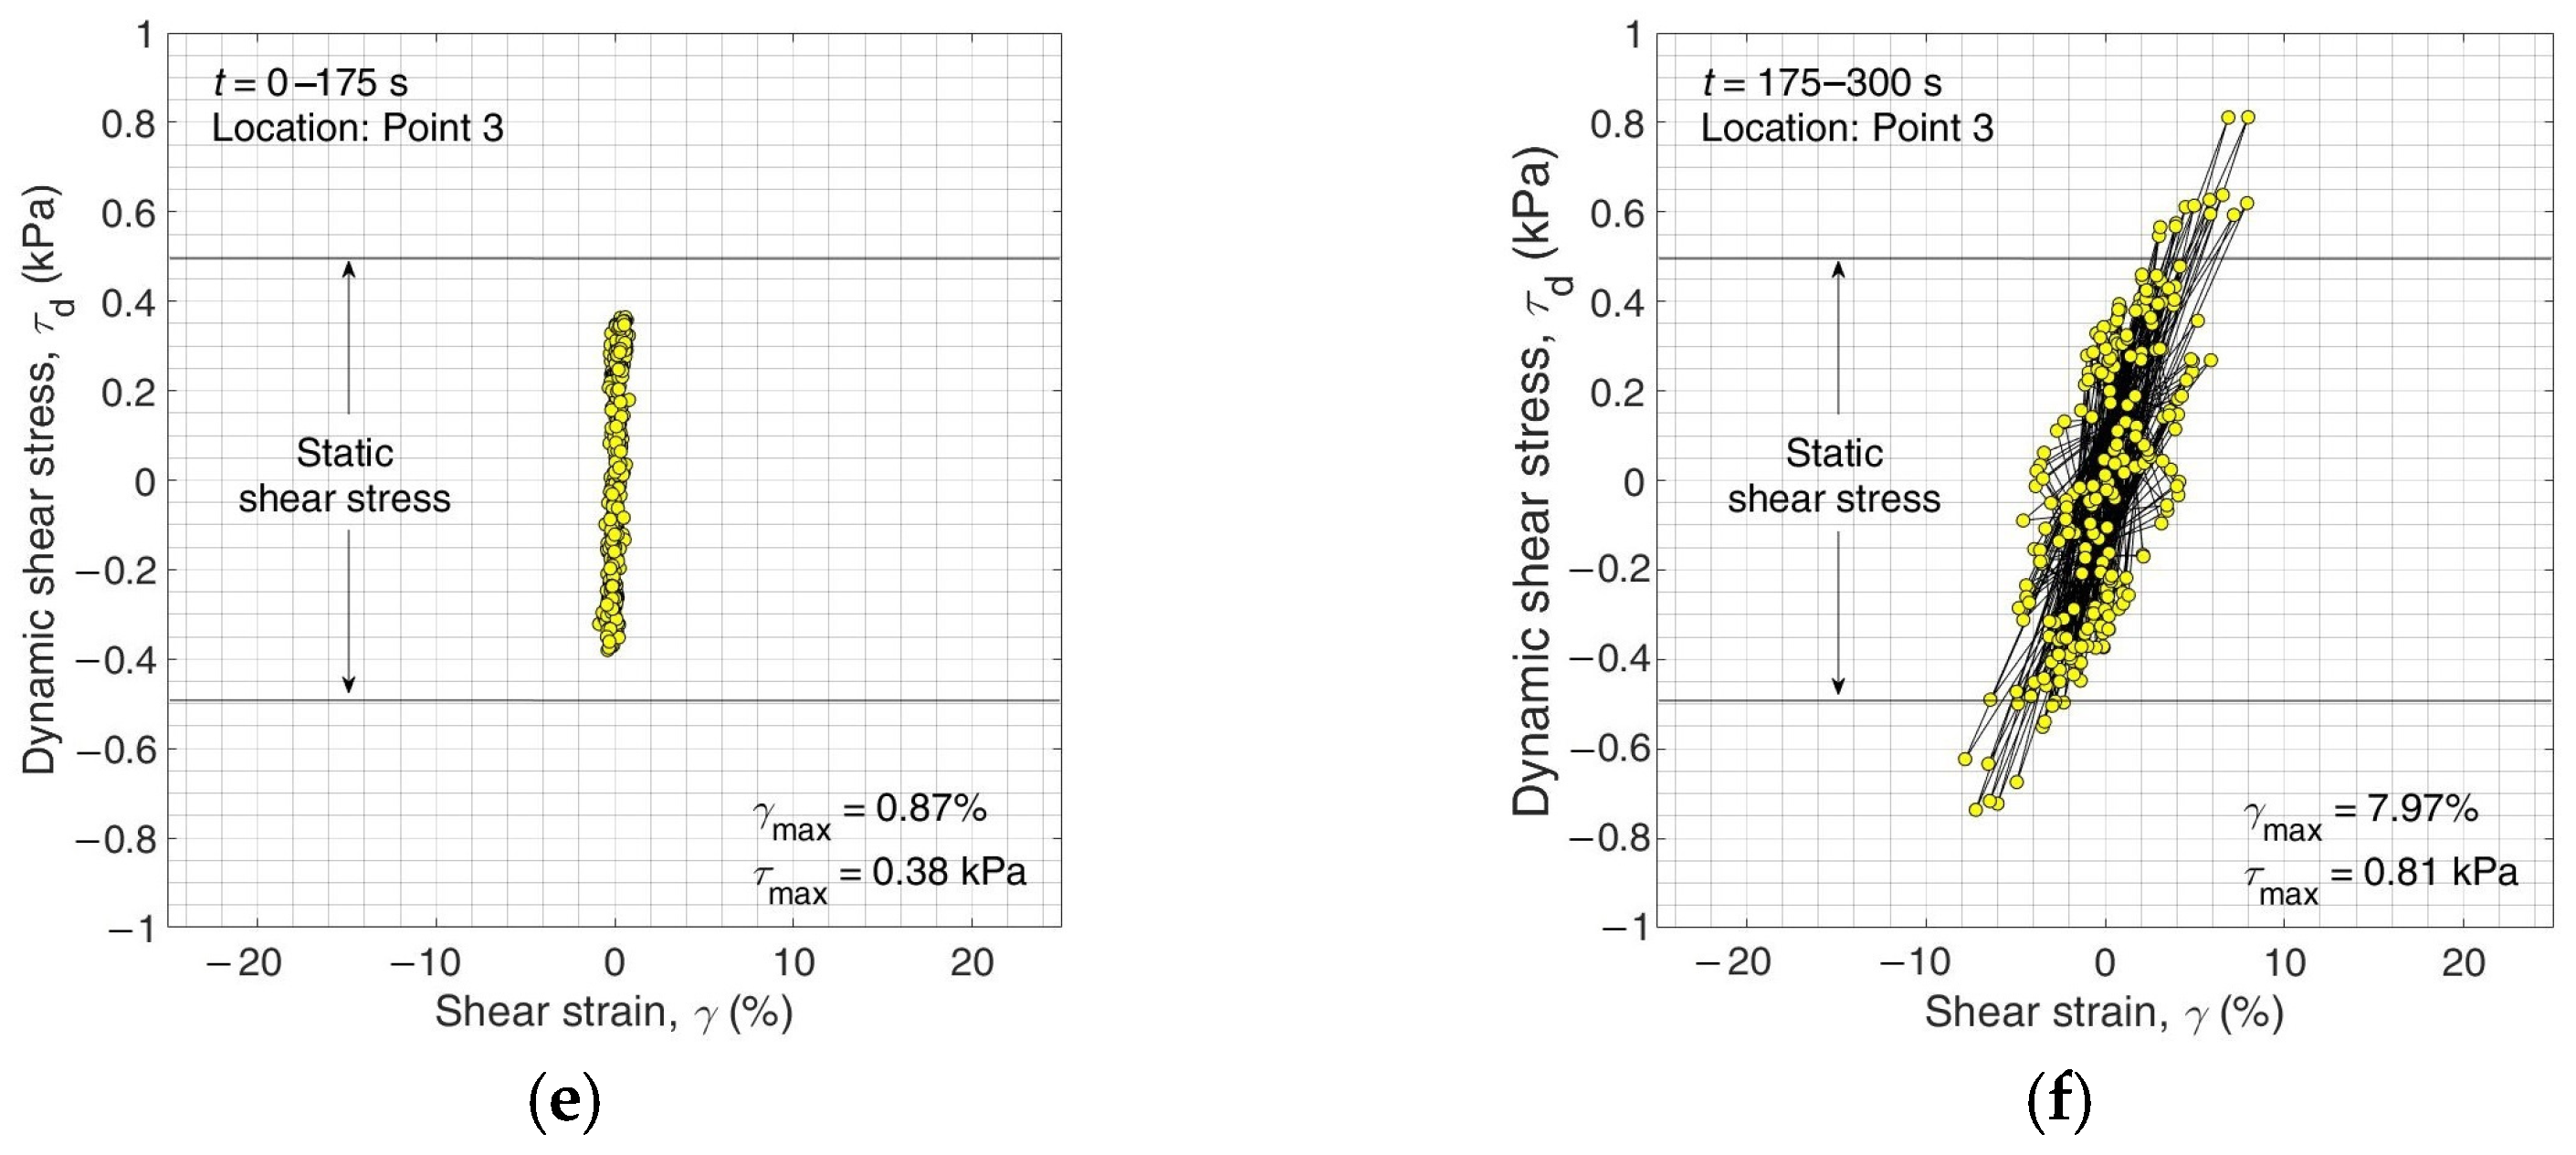
It should be noted that the results in Figure 14 and Figure 15 are from surface accelerations, and hence do not fully describe the behavior of the soil. Therefore, analyzing data from the pore pressure gauges could help in understanding the liquefaction mechanism of the scale model. Data readings from the pore pressure gauges are shown in Figure 19. As shown, the pore pressure rise was negligible at t = 0–190 s. However, as the soil outside the zone of the embankment started to liquefy, as indicated in Figure 17b, water seeped into the partially saturated embankment, which caused the sudden increase in the excess pore pressures. In addition, it can be seen in Figure 19 that the rise in pore pressure at PP-D reached peak values earlier than at PP-B. This might be due to inclusion of the less permeable woven polyester geotextile below the shallow foundation at location D, which resulted in the decrease of the system’s ability to dissipate water. Hence, materials like geogrids and others with better drainage are suggested to reduce the effects on the pore pressure rise. Although higher excess pore water pressures were experienced earlier at location D, the shallow foundation at location D sustained slightly lesser damage, which could be mainly due to the effect of the geotextile and soil improvement. Further studies regarding the cost-effectiveness and advantages of geosynthetics are recommended. In the papers by Unni Kartha et al. [45] and Pramaditya and Fathani [46], they concluded that geosynthetic reinforcement slightly helped against liquefaction. However, severe damage was still observed in their experiments. In the paper by Pramaditya and Fathani [46], the settlement of the embankment with gravel mat and geogrid was only reduced by 5 cm compared to an embankment with gravel mat only, which settled 31 cm into the ground.
The model in this study liquefied, and the geotextile tubes and shallow foundations settled into the ground. Due to extreme weakening of the soil and geotextile tube displacement, the entire embankment settled by about 5 cm and caused the soil outside of the embankment to increase by a height of 5 cm, as shown in Figure 20. Hence, after the experiment, the soil was almost level at a height of 50 cm. An experiment conducted on a dry embankment was also performed by the authors. If the embankment was not partially saturated before shaking, the embankment would not have liquefied excessively, and the shallow foundations would not have settled tremendously. The distinct damage would have been cracks and severe inertia-induced damage to the shallow foundations would have occurred, depending on the intensity of the earthquake, as shown in Figure 21. The cracking phenomenon was also observed in the experiment conducted by Koga and Matsuo [7]. In the experiment on the dry embankment, the geotextile tubes were also laterally displaced, and sunk into the weakened foundation soil.

3.3. Stress Paths

From Equations (2) and (3), the shear stress-shear strain relationships were obtained for points 1, 2, and 3, as shown in Figure 22. The static shear stress in the figure is the maximum shear stress before shaking, which was obtained from the initial stress analysis using FEM. The maximum static shear stress was calculated using Equation (4). As shown in Figure 22a,c,e, the dynamic shear stresses at points 1, 2, and 3, respectively, did not exceed the static shear stress, which may have been the reason why the excess pore pressure generation was small in Figure 19 for t = 0–175 s. If the initial dynamic stresses exceeded the static shear stress, pore pressure generation may have been significant, and liquefaction may have occurred before t = 175 s and the weakening of the soil in the embankment may not have been caused solely by seepage. For the time range of t = 0–175 s, the maximum shear strain at point 1 was 1.46 times larger than that at point 3, while for the time range of t = 175–300 s, the maximum shear strain at point 1 was 1.3 times larger than that at point 3, showing the slight effect of soil improvement and reinforcement. For the time range of t = 175–300 s, maximum shear strain was observed at point 2. The excessive shear strain at point 2 was a result of lateral spreading as the geotextile tube reinforcement was laterally displaced and as the embankment liquefied due to seepage. The shear strains at points 1 and 3 were not as large as point 2 due to the fact the accelerometers were placed on the structures and not on the ground.
τ s t a t i c = σ 1 σ 3 2

4. Conclusions

In this study, a simple shaking table apparatus was developed to investigate the behavior of shallow foundations laid on a liquefiable embankment. Based on the results of the experiment, the following conclusions are drawn:
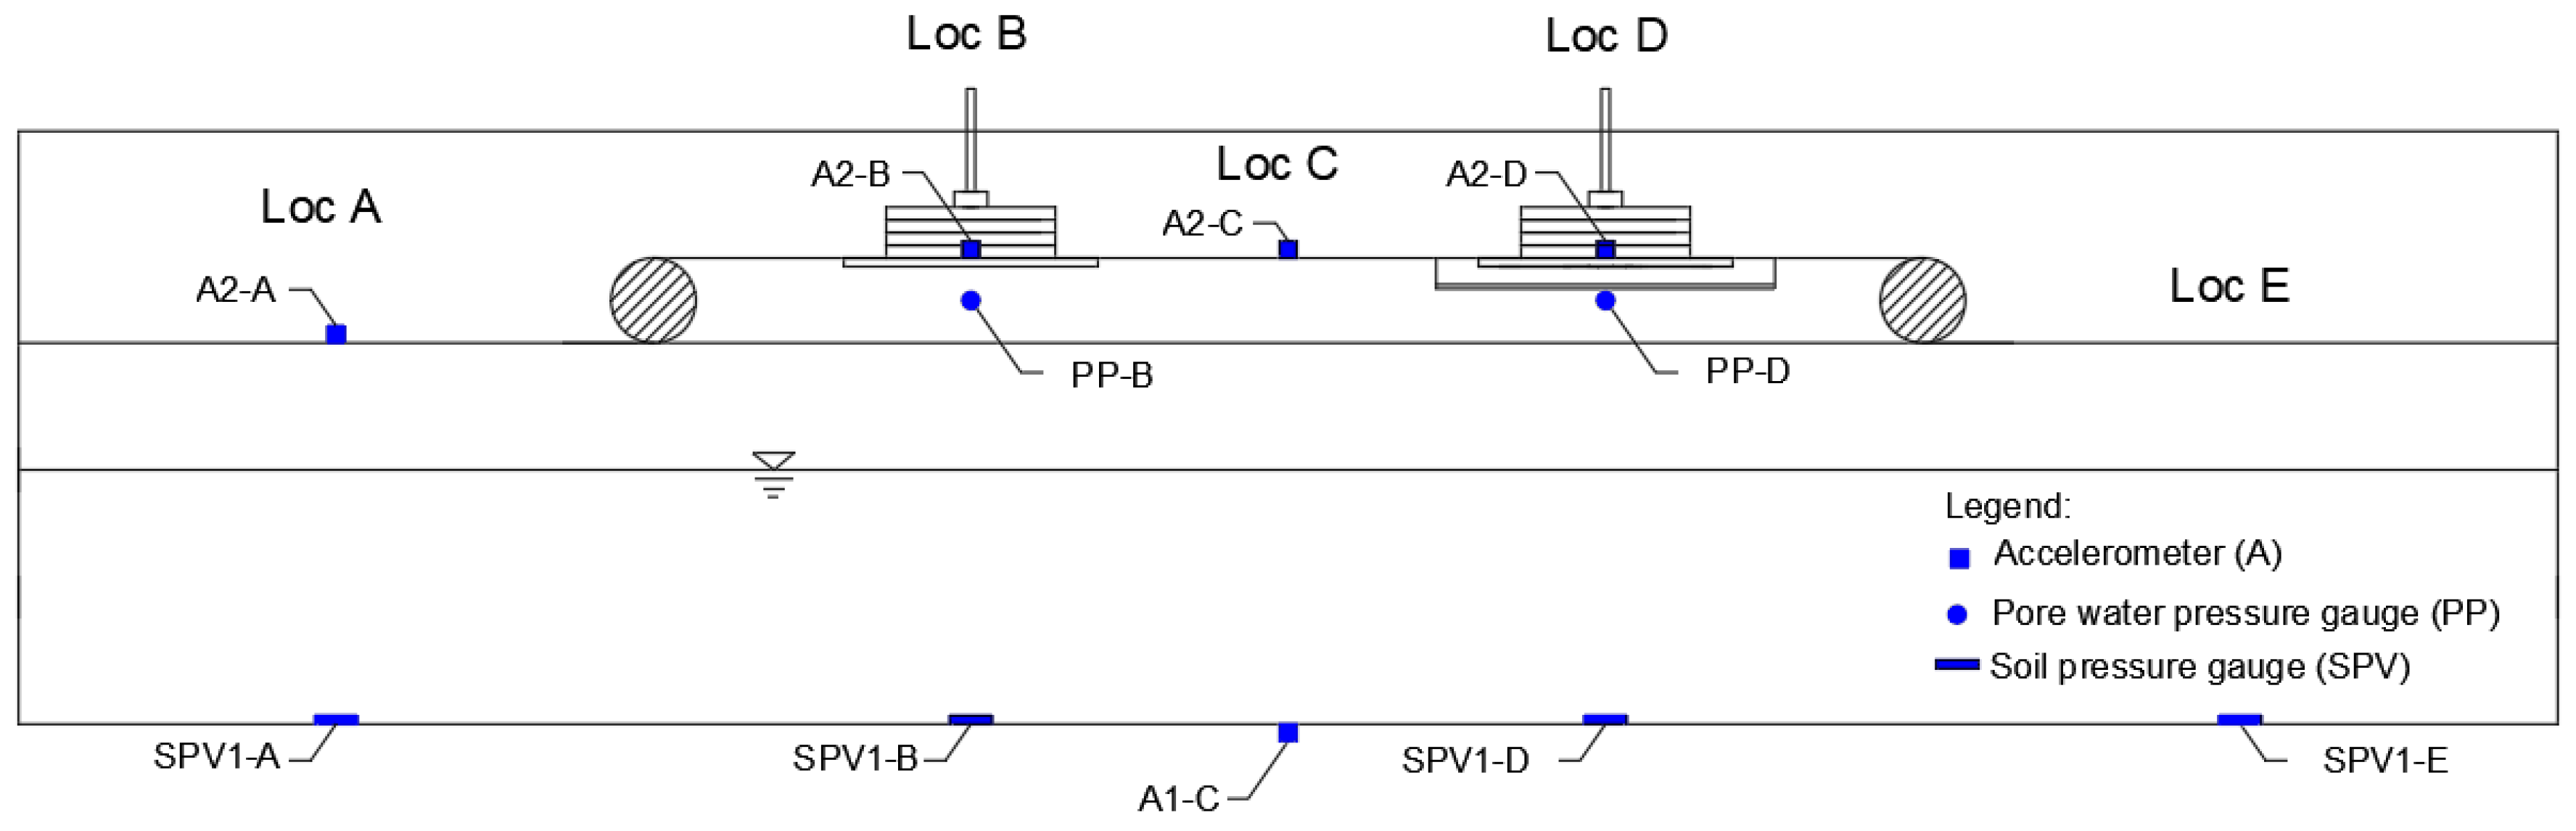
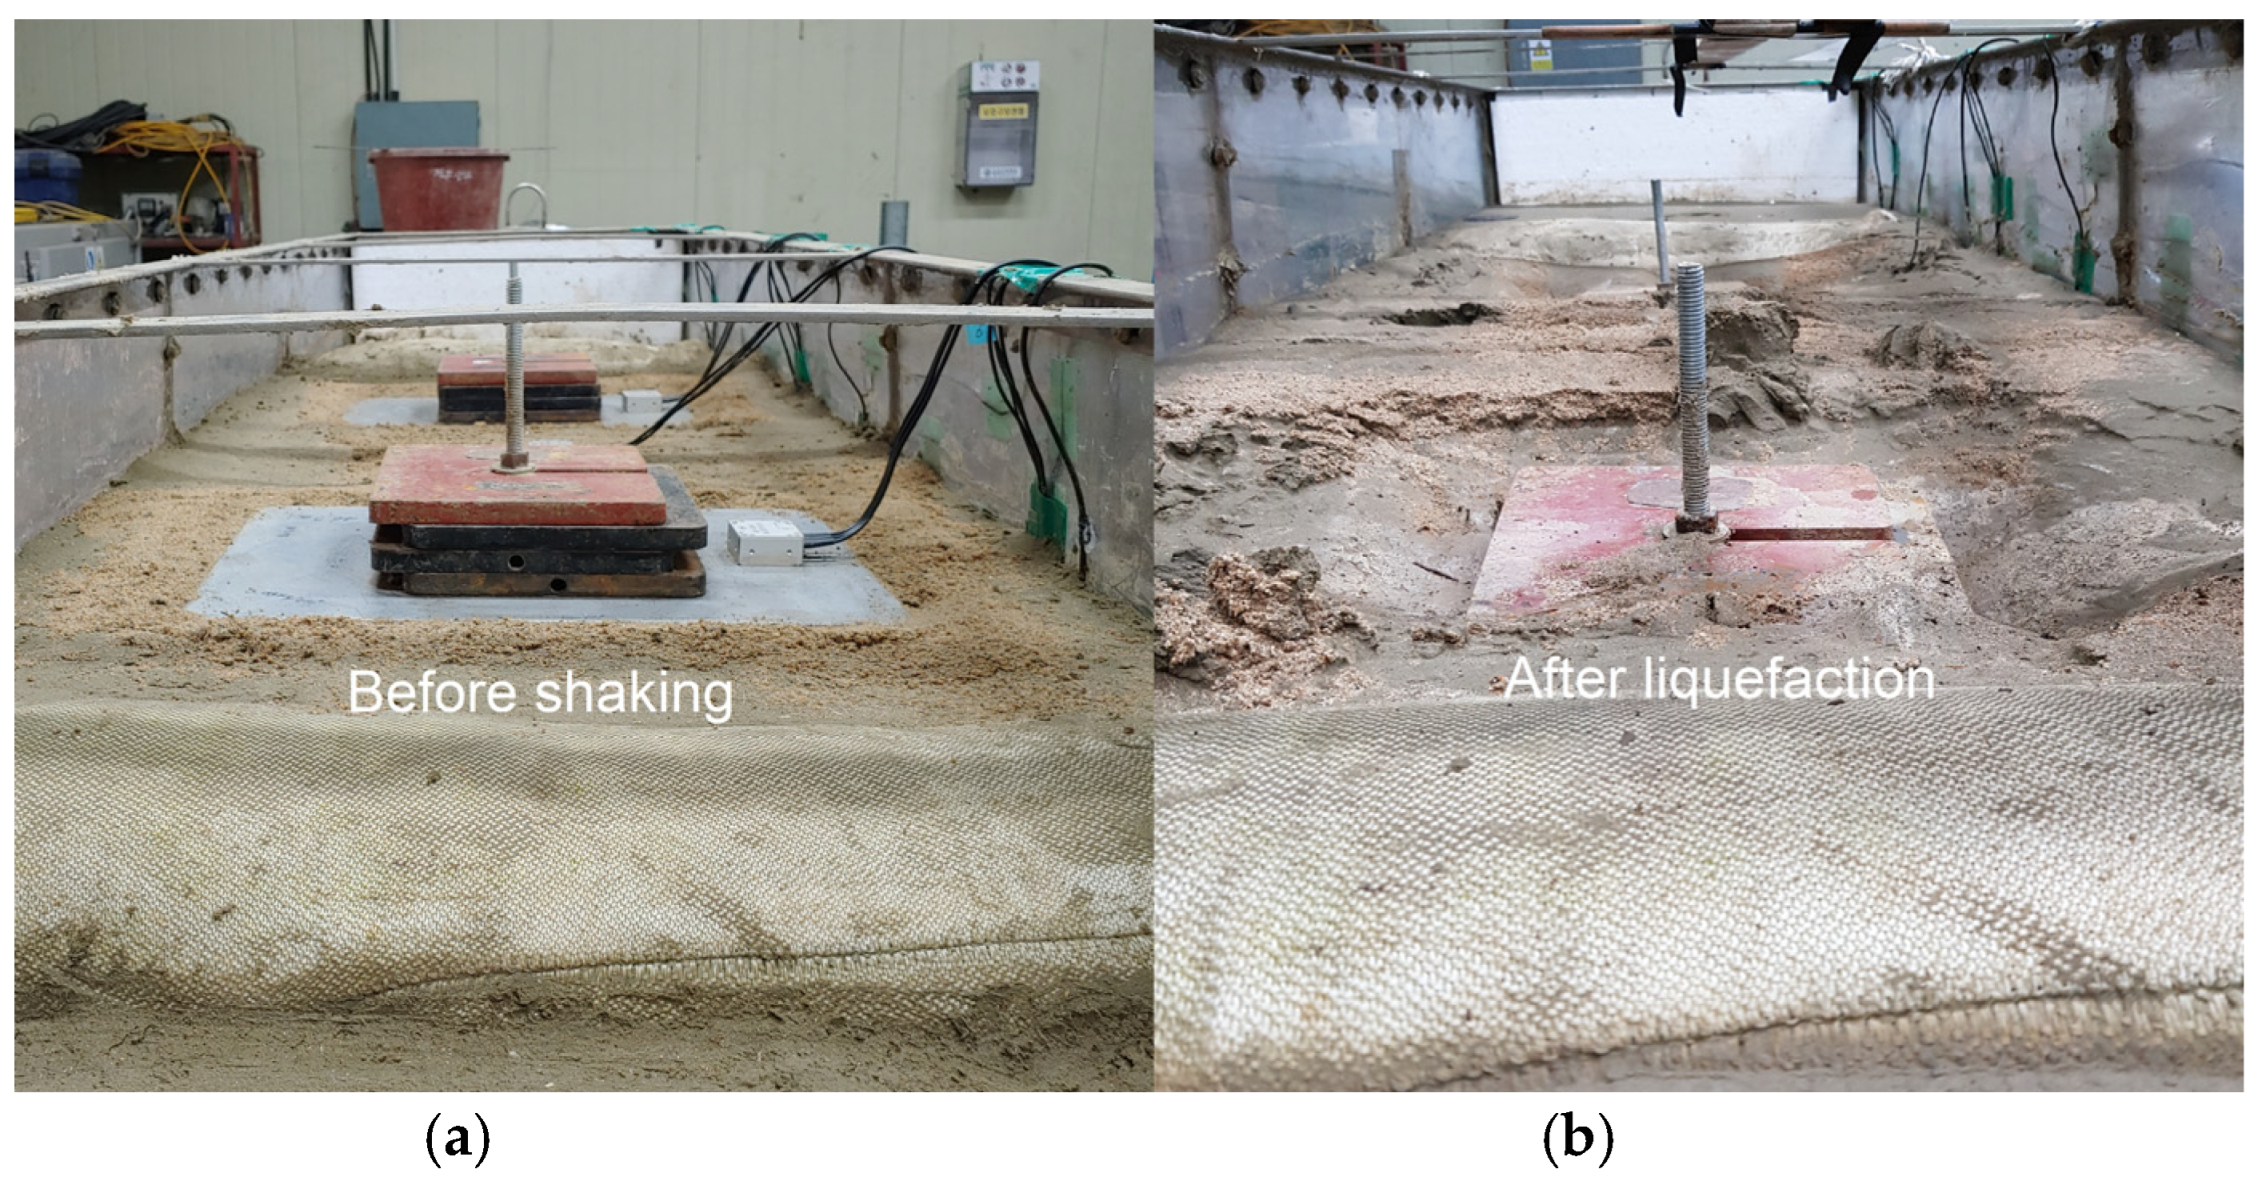
  • The liquefaction of the embankment was a reaction to the liquefaction of the outside soil as water seeped into it, showing the susceptibility of Saemangeum silty sand to seepage-induced liquefaction, even at a partially saturated state. It was observed that at t = 0 s to 200 s, pore pressure rise at PP-B and PP-D of the embankment was negligible. A sudden rise in pore rise was then observed at t = 200 s to 300 s.
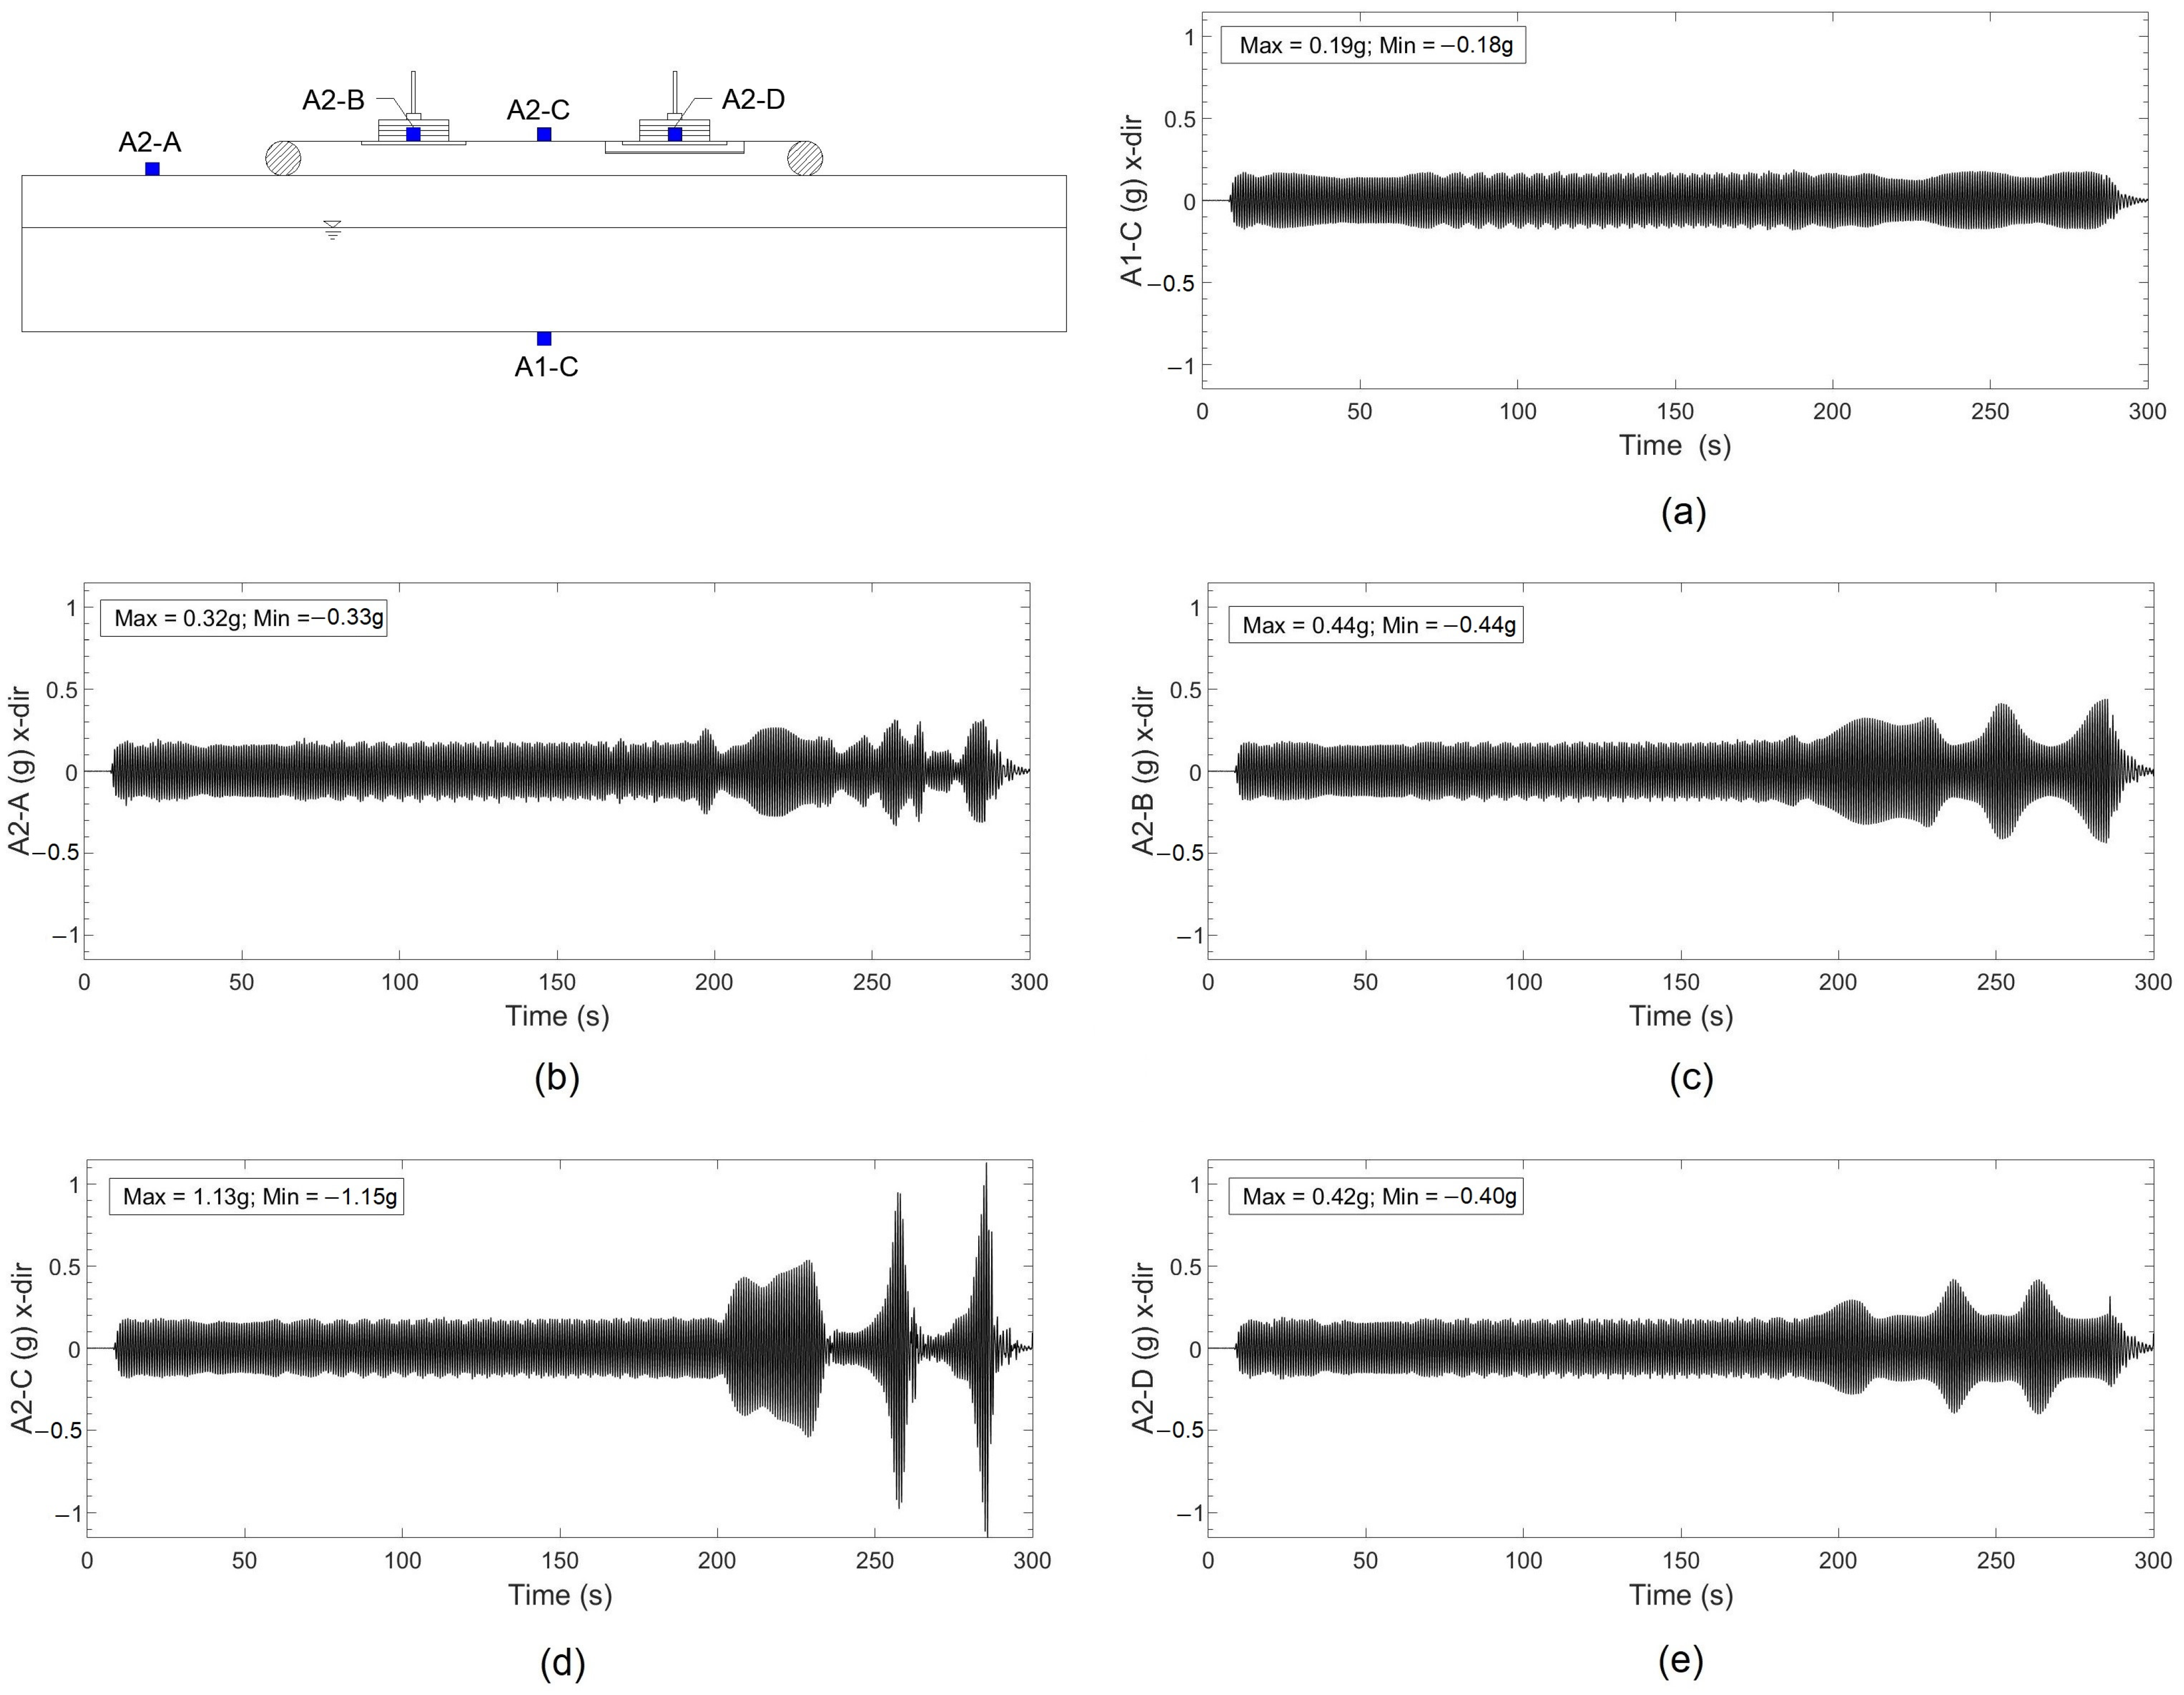
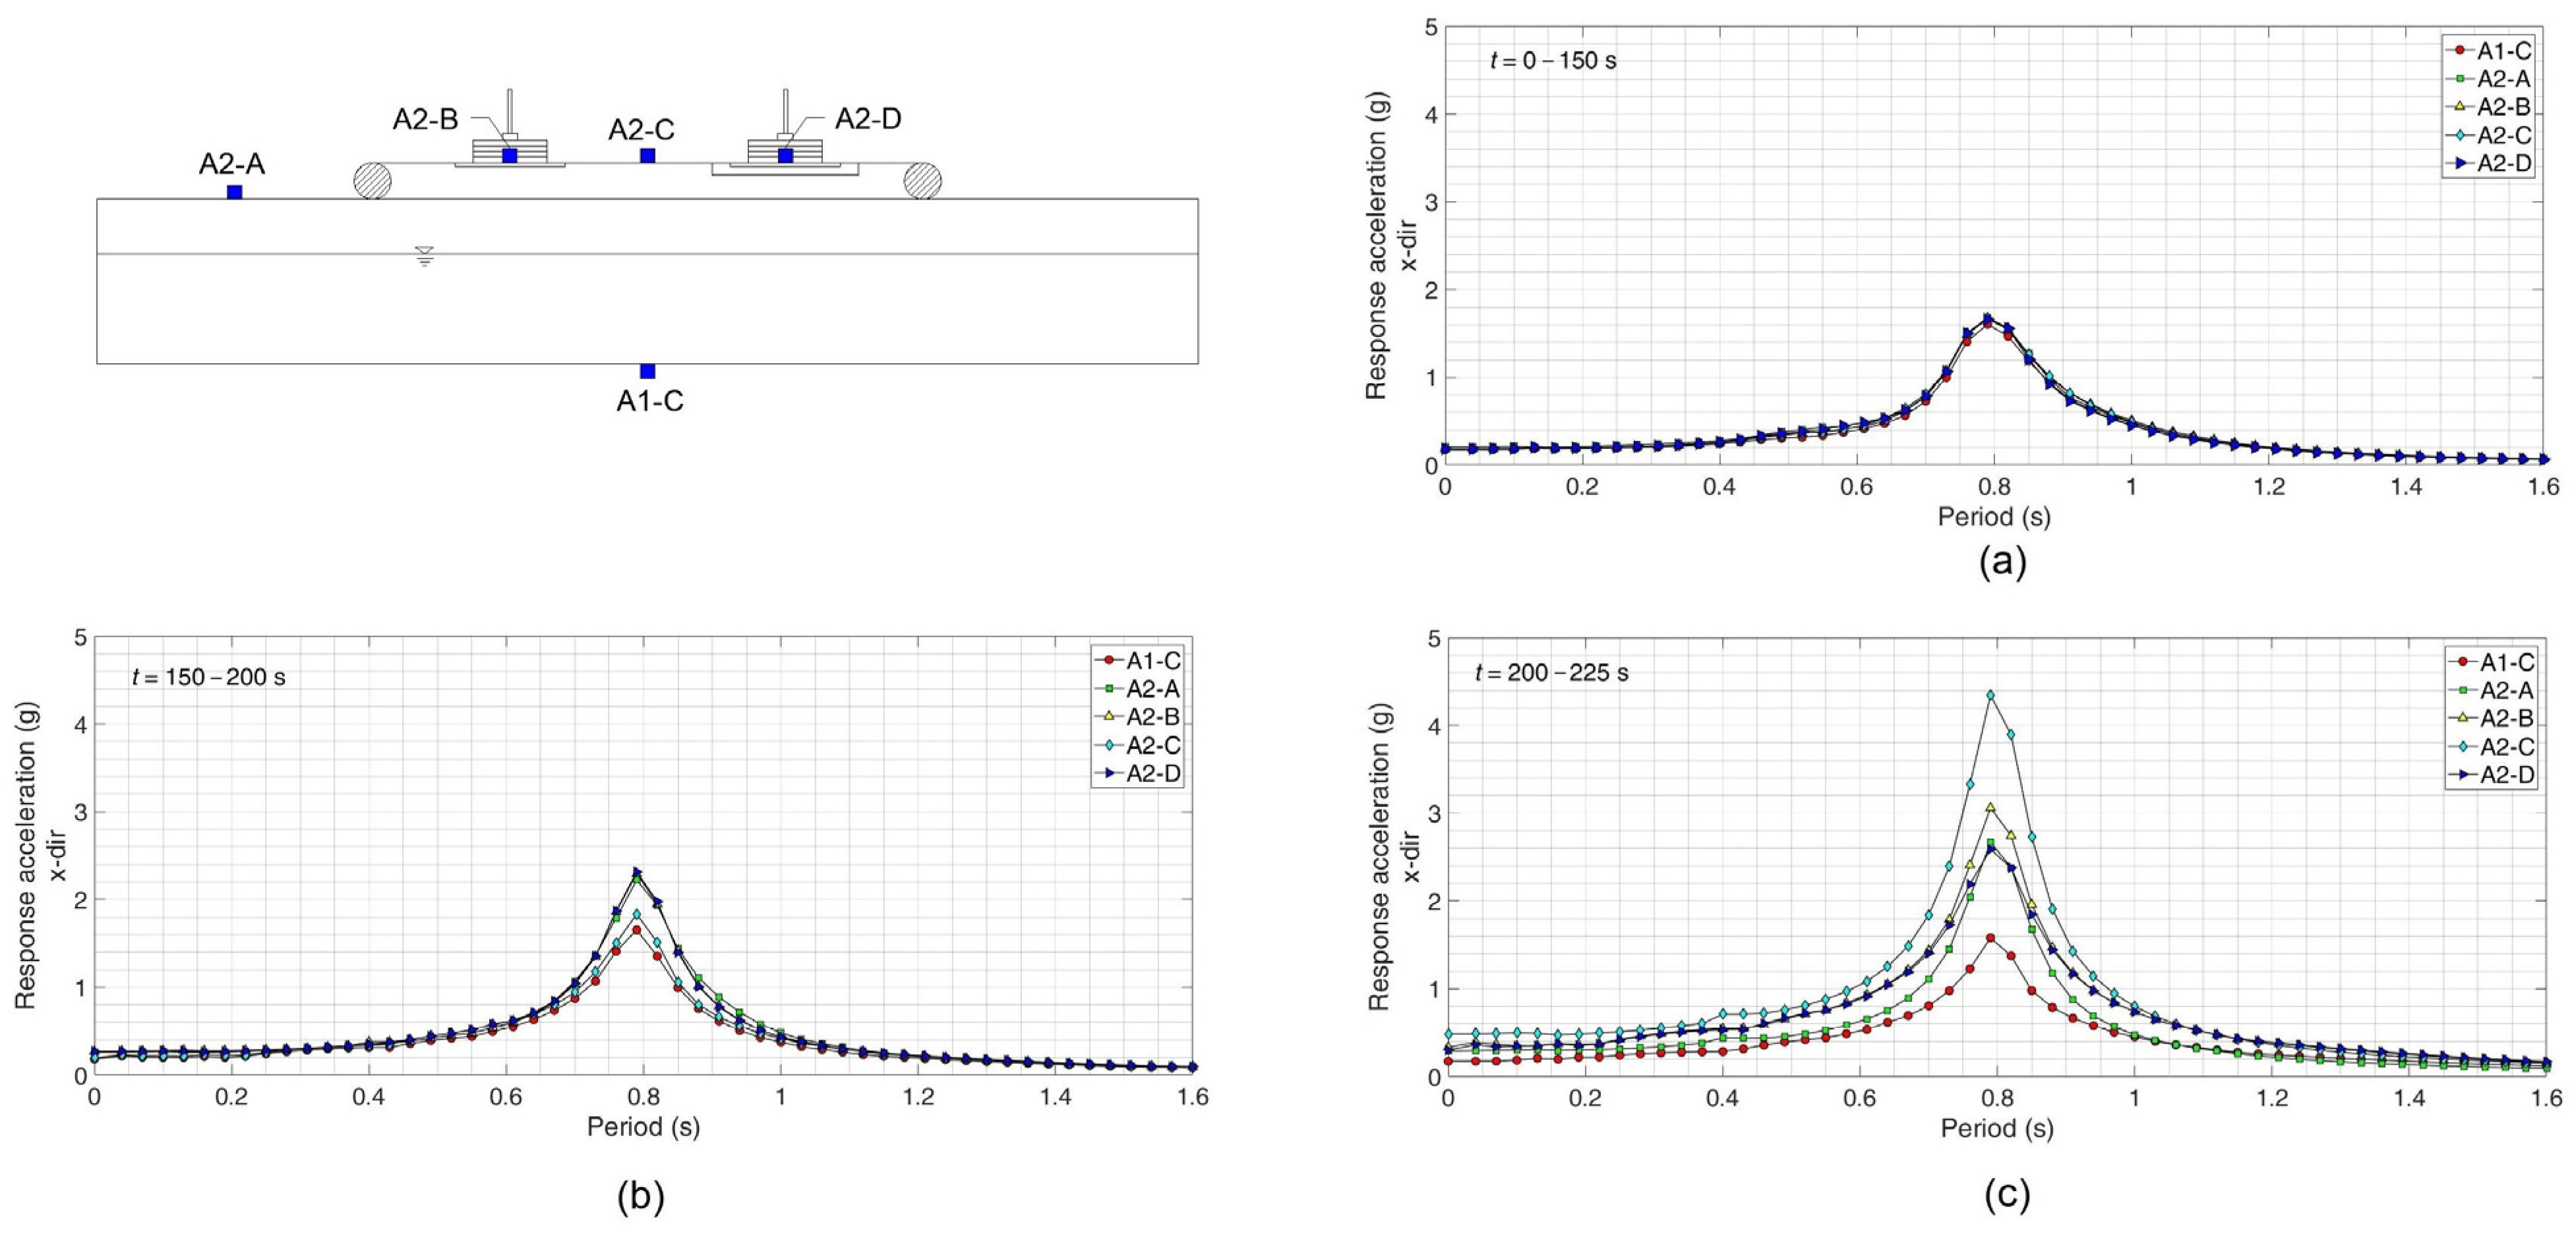
  • Larger surface accelerations were observed in the embankment soil in comparison to the outside soil, indicating the importance of analyzing the liquefaction potential of soils not only at the site area but also near embankments because this could cause severe damage to structures inside the embankment. The surface horizontal accelerations during shaking at A2-C were excessively large at about t = 250 s to 300 s, which reached a maximum surface acceleration of 1.15 g, about 6 times larger than the input acceleration.
  • Although higher excess pore water pressures were experienced earlier at location D, the shallow foundation at location D sustained slightly lesser damage, which could be mainly due to the effect of the geotextile and soil improvement. The settlement of the shallow foundation was reduced by 3 cm due to the addition of geotextile and soil improvement.
  • Since higher excess pore water pressures were experienced earlier at location D, it is recommended to use a more permeable geosynthetic reinforcement to lower the rise in pore pressure during shaking.
  • Further studies regarding the cost-effectiveness and advantages of geosynthetics are recommended.
  • An experiment conducted by the authors on a dry embankment resulted in cracks and severe inertia-induced damage to the shallow foundations. Hence, the state of the embankment will result in different damages.

Author Contributions

Conceptualization, H.-J.K.; supervision, H.-J.K.; methodology, H.-J.K., P.R.D., T.-W.P., and H.-S.K.; investigation, T.-W.P., H.-S.K., P.R.D., J.V.R., and H.-S.C.; formal analysis, P.R.D. and H.-S.C.; writing—original draft preparation, P.R.D.; writing—review and editing, J.V.R.; project administration, H.-S.K.; funding acquisition, H.-J.K. and T.-W.P. All authors have read and agreed to the published version of the manuscript.

Funding

This research was supported by the Basic Science Research Program through the National Research Foundation of Korea (NRF) funded by the Ministry of Education (NRF-2021R1A6A1A0304518511, NRF-2020R1I1A3A04036506). The APC was also funded by the National Research Foundation of Korea (NRF-2021R1A6A1A0304518511).

Institutional Review Board Statement

Not applicable.

Informed Consent Statement

Not applicable.

Data Availability Statement

Data generated or analyzed during this study are available from the corresponding author upon reasonable request.

Conflicts of Interest

The authors declare no conflict of interest.

References

  1. Farzampour, A.; Kamali-Asl, A. Seismic hazard assessment for two cities in Eastern Iran. Earthq. Struct. 2015, 8, 681–697. [Google Scholar] [CrossRef]
  2. Hu, J.; Liu, H. Identification of ground motion intensity measure and its application for predicting soil liquefaction potential based on the Bayesian network method. Eng. Geol. 2019, 248, 34–49. [Google Scholar] [CrossRef]
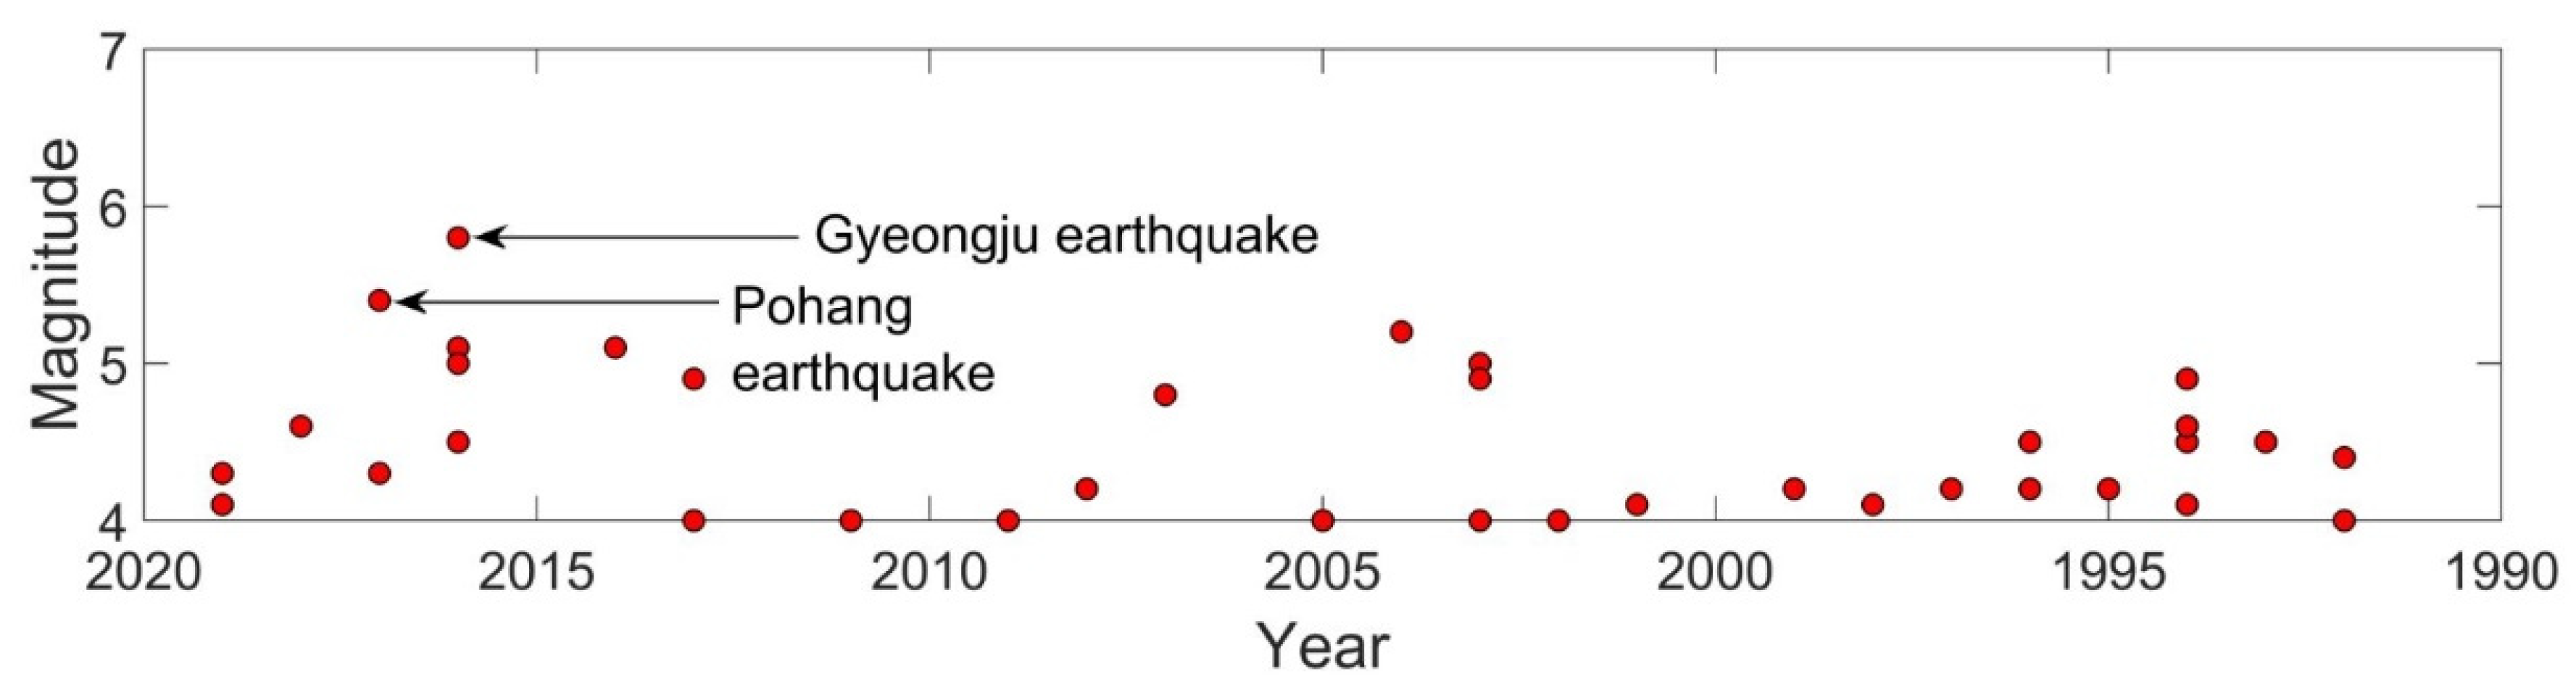
  3. Jee, H.W.; Han, S.W. Assessment of seismic risk of a typical RC building for the 2016 Gyeongju and potential earthquakes. Earthq. Struct. 2021, 20, 337–351. [Google Scholar]
  4. Buyuksarac, A.; Isik, E.; Harirchian, E. A case study for determination of seismic risk priorities in Van (Eastern Turkey). Earthq. Struct. 2021, 20, 445–455. [Google Scholar]
  5. Sonmezer, Y.B.; Akyuz, A.; Kayabali, K. Investigation of the effect of grain size on liquefaction potential of sands. Geomech. Eng. 2020, 20, 243–254. [Google Scholar]
  6. Yang, Y.; Xu, R.; Li, Y.; Li, Z. Study on seismic response characteristics of full light-weight concrete prefabricated utility tunnels. Earthq. Struct. 2021, 21, 51–62. [Google Scholar]
  7. Koga, Y.; Matsuo, O. Shaking table tests of embankments resting on liquefiable sandy ground. Soils Found. 1990, 30, 162–174. [Google Scholar] [CrossRef] [Green Version]
  8. Zhuang, H.; Wang, R.; Chen, G.; Miao, Y.; Zhao, K. Shear modulus reduction of saturated sand under large liquefaction-induced deformation in cyclic torsional shear tests. Eng. Geol. 2018, 240, 110–122. [Google Scholar] [CrossRef]
  9. Huang, Y.; Wen, Z.; Wang, L.; Zhu, C. Centrifuge testing of liquefaction mitigation effectiveness on sand foundations treated with nanoparticles. Eng. Geol. 2019, 249, 249–256. [Google Scholar] [CrossRef]
  10. Kim, H.J.; Dinoy, P.R. Two-dimensional consolidation analysis of geotextile tubes filled with fine-grained material. Geotext. Geomemb. 2021, 49, 1149–1164. [Google Scholar] [CrossRef]
  11. Beaty, M.H.; Byrne, P.M. UBCSAND Constitutive Model Version 904aR; Itasca: Minneapolis, MN, USA, February 2011; Available online: https://bouassidageotechnics.files.wordpress.com/2016/12/ubcsand_udm_documentation.pdf (accessed on 12 December 2022).
  12. Boulanger, R.W.; Ziotopoulou, K. PM4Sand (Version 3.1): A Sand Plasticity Model for Earthquake Engineering Applications; Rep. No. UCD/CGM-17/01; University of California: Berkeley, CA, USA, 2017. [Google Scholar]
  13. Nasiri, F.; Javdanian, H.; Heidari, A. Seismic response analysis of embankment dams under decomposed earthquakes. Geomech. Eng. 2020, 21, 35–51. [Google Scholar]
  14. Naik, S.P.; Gwon, O.; Park, K.; Kim, Y.S. Land damage mapping and liquefaction potential analysis of soils from the epicentral region of 2017 Pohang Mw 5.4 earthquake, South Korea. Sustainability 2020, 12, 1234. [Google Scholar] [CrossRef] [Green Version]
  15. Hong, T.K.; Lee, J.; Park, S.; Kim, W. Time-advanced occurrence of moderate-size earthquakes in a stable intraplate region after a megathrust earthquake and their seismic properties. Sci. Rep. 2018, 8, 13331. [Google Scholar] [CrossRef] [PubMed]
  16. Yasuda, S.; Ishihara, K.; Harada, K.; Shinkawa, N. Effect of soil improvement on ground subsidence due to liquefaction. Soils Found. 1996, 36, 99–107. [Google Scholar] [CrossRef] [Green Version]
  17. Kumar, S. Reducing liquefaction potential using dynamic compaction and construction of stone columns. Geotech. Geol. Eng. 2001, 19, 169–182. [Google Scholar] [CrossRef]
  18. Shen, M.; Juang, C.H.; Ku, C.S.; Khoshnevisan, S. Assessing effect of dynamic compaction on liquefaction potential using statistical methods—A case study. Georisk 2019, 13, 341–348. [Google Scholar] [CrossRef]
  19. Sasaki, Y.; Taniguchi, E. Shaking table tests on gravel drains to prevent liquefaction of sand deposits. Soils Found. 1982, 22, 1–4. [Google Scholar] [CrossRef] [PubMed] [Green Version]
  20. García-Torres, S.; Madabhushi, G.S. Performance of vertical drains in liquefaction mitigation under structures. Bull. Earthq. Eng. 2019, 17, 5849–5866. [Google Scholar] [CrossRef] [Green Version]
  21. Jung, C.; Ceglarek, R.; Clauvelin, T.; Ayeldeen, M.; Kim, D. Deep soil mixing in Sabkha soils for foundation support in United Arab Emirates. Int. J. Geosynt. Ground Eng. 2020, 6, 1–5. [Google Scholar] [CrossRef]
  22. Hasheminezhad, A.; Bahadori, H. On the deep soil mixing method in the mitigation of liquefaction-induced bearing capacity degradation of shallow foundations. Geomech. Geoeng. 2022, 17, 334–346. [Google Scholar] [CrossRef]
  23. Miller, E.A.; Roycroft, G.A. Compaction grouting test program for liquefaction control. J. Geotech. Geoenviron. Eng. 2004, 130, 355–361. [Google Scholar] [CrossRef]
  24. Gallagher, P.M.; Conlee, C.T.; Rollins, K.M. Full-scale field testing of colloidal silica grouting for mitigation of liquefaction risk. J. Geotech. Geoenviron. Eng. 2007, 133, 186–196. [Google Scholar] [CrossRef] [Green Version]
  25. Porcino, D.; Marcianò, V.; Granata, R. Undrained cyclic response of a silicate-grouted sand for liquefaction mitigation purposes. Geomech. Geoeng. 2011, 6, 155–170. [Google Scholar] [CrossRef]
  26. Salvatore, E.; Modoni, G.; Mascolo, M.C.; Grassi, D.; Spagnoli, G. Experimental evidence of the effectiveness and applicability of colloidal nanosilica grouting for liquefaction mitigation. J. Geotech. Geoenviron. Eng. 2020, 146, 04020108. [Google Scholar] [CrossRef]
  27. Seed, H.B.; Idriss, I.M. Simplified procedure for evaluating soil liquefaction potential. J. Soil Mech. Div. 1971, 97, 1249–1273. [Google Scholar] [CrossRef]
  28. Youd, T.L.; Idriss, I.M.; Andrus, R.D.; Arango, I.; Castro, G.; Christian, J.T.; Dobry, R.; Liam Finn, W.D.L.; Harder, L.F., Jr.; Hynes, M.E.; et al. Liquefaction resistance of soils: Summary report from the 1996 NCEER and 1998 NCEER/NSF workshops on evaluation of liquefaction resistance of soils. J. Geotech. Geoenviron. Eng. 2001, 127, 817–833. [Google Scholar] [CrossRef] [Green Version]
  29. Cetin, K.O.; Seed, R.B.; Der Kiureghian, A.; Tokimatsu, K.; Harder Jr, L.F.; Kayen, R.E.; Moss, R. 0.E. Standard penetration test-based probabilistic and deterministic assessment of seismic soil liquefaction potential. J. Geotech. Geoenviron. Eng. 2004, 130, 1314–1340. [Google Scholar] [CrossRef] [Green Version]
  30. Lombardi, D.; Bhattacharya, S. Liquefaction of soil in the Emilia-Romagna region after the 2012 Northern Italy earthquake sequence. Nat. Haz. 2014, 73, 1749–1770. [Google Scholar] [CrossRef]
  31. Ortiz-Hernández, E.; Chunga, K.; Toulkeridis, T.; Pastor, J.L. Soil liquefaction and other seismic-associated phenomena in the city of Chone during the 2016 Earthquake of Coastal Ecuador. Appl. Sci. 2022, 12, 7867. [Google Scholar] [CrossRef]
  32. SDIA (Saemangeum Development and Investment Agency). Available online: http://www.saemangeum.go.kr (accessed on 1 October 2021).
  33. Palmeira, E.M.; Melo, D.L.A.; Moraes-Filho, I.P. Geotextile filtration opening size under tension and confinement. Geotext. Geomemb. 2019, 47, 566–576. [Google Scholar] [CrossRef]
  34. Bridle, R.J.; Barr, B.I.G.; John, S. Hydraulically-filled geomembrane bags for land reclamation. Geosyn. Int. 2018, 5, 435–442. [Google Scholar] [CrossRef]
  35. Alvarez, I.E.; Rubio, R.; Ricalde, H. Beach restoration with geotextile tubes as submerged breakwaters in Yucatan, Mexico. Geotext. Geomemb. 2007, 42, 233–241. [Google Scholar] [CrossRef]
  36. Kim, H.J.; Won, M.S.; Jamin, J.C. Finite-element analysis on the stability of geotextile tube-reinforce embankments under scouring. Int. J. Geomech. 2015, 15, 06014019. [Google Scholar] [CrossRef]
  37. Maurer, B.W.; Gustafson, A.C.; Bhatia, S.K.; Palomino, A.M. Geotextile dewatering of flocculated, fiber reinforced fly-ash slurry. Fuel 2012, 97, 411–417. [Google Scholar] [CrossRef]
  38. Monkul, M.M.; Yamamuro, J.A. Influence of silt size and content on liquefaction behavior of sands. Can. Geotech. J. 2011, 48, 931–942. [Google Scholar] [CrossRef]
  39. Adampira, M.; Derakhshandi, M.; Ghalandarzadeh, A. Experimental study on seismic response characterstics of liquefiable soil layers. J. Earthq. Eng. 2019, 25, 1287–1315. [Google Scholar] [CrossRef]
  40. Kim, H.S. Development of simplified liquefaction program for the prediction of the seismic response of Saemangeum silty sand. Ph.D. Dissertation, Kunsan National University, Gunsan, Republic of Korea, 2020. [Google Scholar]
  41. Robertson, P.K. Soil behaviour type from the CPT: An update. In Proceedings of the 2nd International Symposium on Cone Penetration Testing, Hundtington Beach, CA, USA, 9–11 May 2010. [Google Scholar]
  42. Tsuchida, H. Prediction and countermeasure against the liquefaction in sand deposits. In Abstract of the Seminar in the Port and Harbor Research Institute; Ministry of Transport: Yokosuka, Japan, 1970; pp. 31–333. [Google Scholar]
  43. Miura, S.; Toki, S. A sample preparation method and its effect on static and cyclic deformation-strength properties of sand. Soils Found. 1982, 22, 61–77. [Google Scholar] [CrossRef] [Green Version]
  44. Wichtmann, T.; Steller, K.; Triantafyllidis, T. On the influence of the sample preparation method on strain accumulation in sand under high-cyclic loading. Soil Dyn. Earthq. Eng. 2020, 131, 106028. [Google Scholar] [CrossRef]
  45. Unni Kartha, G.; Beena, K.S.; Mohamed Thahir, C.P. Shake table studies on embankments on liquefiable soil. In Soil Dynamics and Earthquake Geotechnical Engineering; Springer: Singapore, 2019. [Google Scholar]
  46. Pramaditya, A.; Fathani, T.F. Geotechnical centrifuge test of reinforced road embankment against earthquake-induced liquefaction. Geomate J. 2021, 21, 115–122. [Google Scholar] [CrossRef]
Figure 1. Variation of earthquake magnitude in South Korea from year 1992–2019 (data obtained from weather.go.kr, accessed on 5 September 2019).
Applsci 13 00785 g001
Figure 2. Cracks at a port in Pohang after the 5.4 magnitude Pohang earthquake hit the city (photo by the Ministry of Oceans and Fisheries of Korea).
Applsci 13 00785 g002
Figure 3. Site investigation at Saemangeum, Republic of Korea.
Applsci 13 00785 g003
Figure 4. Soil behaviour classification with depth based on the cone penetration test.
Applsci 13 00785 g004
Figure 5. Soil distribution in Saemangeum, South Korea at shallow depths.
Applsci 13 00785 g005
Figure 6. Particle size distribution of Saemangeum dredged sand at various locations.
Applsci 13 00785 g006
Figure 7. Variation of SPT blow count with depth for BH-1 to BH-4.
Applsci 13 00785 g007
Figure 8. Scanning Electron Microscopy (SEM) of Saemangeum dredged sand.
Applsci 13 00785 g008
Figure 9. Composition of Saemangeum dredged sand based on X-ray Diffraction Analysis.
Applsci 13 00785 g009
Figure 10. Actual photo of shaking table test.
Applsci 13 00785 g010
Figure 11. Shaking table test: (a) scale model test setup, and (b) isometric view of shaking table.
Applsci 13 00785 g011
Figure 12. Preliminary shaking of silty sand showing wavelike deformation of the ground surface due to surface waves.
Applsci 13 00785 g012
Figure 13. Sensor locations and labels.
Applsci 13 00785 g013
Figure 14. Recorded horizontal accelerations: (a) A1-C, (b) A2-A, (c) A2-B, (d) A2-C, and (e) A2-D.
Applsci 13 00785 g014
Figure 15. Recorded vertical accelerations: (a) A1-C, (b) A2-B, and (c) A2-D.
Applsci 13 00785 g015
Figure 16. Photo of shallow foundations (a) before shaking and (b) after shaking.
Applsci 13 00785 g016
Figure 17. Variation of horizontal elastic response spectra: (a) t = 0–150 s, (b) t = 150–200 s, and (c) t = 200–225 s.
Applsci 13 00785 g017
Figure 18. Variation of vertical elastic response spectra: (a) t = 0–150 s, (b) t = 150–200 s, and (c) t = 200–225.
Applsci 13 00785 g018
Figure 19. Variation of excess pore water pressure at various locations: (a) location A, (b) location B, and (c) location D.
Applsci 13 00785 g019
Figure 20. Photo of the scale model before and after the occurrence of lateral spreading and geotextile tube settlement: (a) t = 0 and (b) t = 225 s.
Applsci 13 00785 g020
Figure 21. Damage sustained by the embankment if it is composed of dry silty sand.
Applsci 13 00785 g021
Figure 22. Shear stress-shear strain relationships: (a) point 1 at t = 0–175 s, (b) point 1 at t = 175–300 s, (c) point 2 at t = 0–175 s, (d) point 2 at t = 175–300 s, (e) point 3 at t = 0–175 s, and (f) point 3 at t = 175–300 s.
Applsci 13 00785 g022aApplsci 13 00785 g022b
Table 1. Properties of Saemangeum dredged soil used in the shaking table test.
PropertyUnitQuantity
Specific Gravity, GsNA2.71
Percent Passing #200 sieve%26.20
Soil Classification (USCS)NASM
Permeabilitycm/s2.09 × 10−3
Void Ratio in loosest state, emaxNA1.37
Void Ratio in densest state, eminNA0.68
Table 2. Properties of the woven polyester geotextile.
DescriptionTest MethodUnitQuantity
Tensile strength:WeftASTM D4595kN/m169
WarpASTM D4595kN/m176
Elongation:WeftASTM D4595%14
WarpASTM D4595%14
Apparent opening size (AOS)ASTM D4751μm315
PermeabilityASTM D4491cm/s8.5 × 10−3
Disclaimer/Publisher’s Note: The statements, opinions and data contained in all publications are solely those of the individual author(s) and contributor(s) and not of MDPI and/or the editor(s). MDPI and/or the editor(s) disclaim responsibility for any injury to people or property resulting from any ideas, methods, instructions or products referred to in the content.

