Article

Efficiency of Chemical Toilet Sewage (CTS) Co-Fermentation with Typical Energy Crops

by
Marcin Dębowski
1,
Joanna Kazimierowicz
2,* and
Marcin Zieliński
1
1
Department of Environmental Engineering, Faculty of Geoengineering, University of Warmia and Mazury in Olsztyn, 10-720 Olsztyn, Poland
2
Department of Water Supply and Sewage Systems, Faculty of Civil Engineering and Environmental Sciences, Bialystok University of Technology, 15-351 Bialystok, Poland
*
Author to whom correspondence should be addressed.
Appl. Sci. 2023, 13(2), 818; https://doi.org/10.3390/app13020818
Submission received: 16 December 2022 / Revised: 3 January 2023 / Accepted: 4 January 2023 / Published: 6 January 2023

Abstract

:
Chemical toilets are becoming more and more common. Large volumes of chemical toilet sewage (CTS) are generated in popular tourist destinations, where waste conveyance and treatment systems are not an option, which necessitates new methods for neutralizing such waste. Anaerobic digestion is, potentially, one such solution. The aim of the present study was to test the treatability of chemical toilet sewage (CTS) co-fermented with maize silage biomass using anaerobic digestion (AD). It was found that CTS does not impair AD, as long as the fluid used to dilute the feedstock does not contain more than 30% CTS. Biogas yield reached 400 cm3/gVS, and the biogas produced contained 57 ± 2.6% CH4 methane. Higher doses of CTS inhibited anaerobic digestion. This inhibition was directly linked to CTS toxicity, which reduced methanogen populations. This, in turn, slowed down VFA-to-biogas conversion, triggered VFA accumulation, and ultimately increased FOS/TAC and decreased pH.

1. Introduction

Certain regions of the world have seen enormous tourist traffic due to their attractiveness, natural beauty, and educational value [1,2]. One such site is the Great Mazurian Lakes mesoregion in north-eastern Poland [3]. The area spans 1732 km2, of which 486 km2 is composed of lakes and 1150 km2 of forests. This extremely attractive complex stands out among others of its kind in Europe, with a rich network of water bodies and forests, drawing six-digit numbers of hiking, biking and water sport enthusiasts each year [4]. Statistics show that tourist traffic in the region is consistently rising, having reached 1.5 million people per year [5]. Approximately 20,000 yachts manned by nearly 100,000 sailors take to the waters of the Great Mazurian Lakes throughout the tourist season [6]. About 80% of all boats are equipped with chemical toilets, which collect waste that must be emptied regularly and disposed of [7]. Many of the regional campsites serving nearly 200,000 visitors have no sewerage, meaning that they also rely on chemical toilets and the temporary storage of fecal matter in cesspools [8]. The tourist pressure on the region is not distributed evenly over the year. Nearly 90% of the region’s tourist traffic is relegated to the two months of July and August, due to the preferable weather and the school-free summer season [9].
This leads to the high generation of waste, has a significant impact on the environment, and presents an environmental hazard [10]. There are certain substances used in chemical toilets to neutralize odor, improve waste solubility, and dewater the feces. These include: active biocides, oxidizers, thickeners, chelating agents, odorants, surface-active substances, buffers and colorants [11]. Products designed for chemical toilets are made with formaldehyde, glutaraldehyde, quaternary ammonium compounds, inorganic salts, and most importantly, the powerful biocide bronopol, to imbue them with strong bactericidal properties [12,13].
Bronopol (2-Bromo-2-nitro-1,3-propanodiol) is not highly toxic to mammals, but acutely toxic to bacteria (particularly Gram-negative ones) and microalgae such as Scenedesmus sp., Nostock sp., and Chlorella sp. In fact, this toxic effect can be observed at concentrations as low as 6 to 50 ppm [14]. Applying the OECD 201 test to three microalgae species (Selenastrum capricornutum, Scenedesmus subspicatus, Chlorella vulgaris) showed that bronopol doses of 0.4–1.9 mg/L caused a decrease in biological activity for 50% of the population [15]. The abiotic degradation of bronopol is affected by multiple factors, including temperature, pH and light intensity [16]. Water-dissolved bronopol becomes more labile under alkaline conditions and at high temperatures [17]. The half-life of 300 ppm in distilled water is four months at 22 °C and pH 8, but over five years at pH 6 and pH 4 (temperature being the same) [18].
Due to its properties, toxicity and resistance to degradability, as well as the lack of sufficiently sophisticated wastewater treatment systems and developed sewerage systems, other ways of handling such waste need to be identified. Anaerobic digestion (AD) is, potentially, one such solution. It can be used in less-urbanized areas as a fully self-contained system, providing electricity and heat for domestic use and for tourist facilities [19]. The approach is fully in line with the principles of the circular economy and bio-economy, while also contributing to the push towards renewable energy [20,21]. Biodegradable organic waste collected in chemical toilets may potentially be used as an organic feedstock for AD [22]. However, due to its content of other hard-to-biodegrade and toxic chemicals, this type of waste needs to be reliably tested for co-fermentability with other common types of biomass. Identifying feedstock compositions that can be efficiently digested using AD should be a priority in this regard.
The aim of the present study was to test the treatability of chemical toilet sewage (CTS) co-fermented with maize silage biomass (MSB) using anaerobic digestion (AD). The laboratory study was conducted in continuous reactors. The study served to assess how the ratios of different organic feedstocks affect the process and its final performance in terms of total organic compounds removed, biogas yield/composition, and the fertilizing efficiency of the digestate.

2. Materials and Methods

2.1. Experimental Outline

The experiments were divided into seven variants (V) with different levels of chemical toilet sewage (CTS) used to increase water content of the maize silage to a target level. Before being fed into the anaerobic reactors, the silage was diluted with tap water and specific volumes of CTS, so that the final mixture had a water content of 90%. Depending on the experimental variant, the CTS fractions in the diluting mixture were: V1—0%, V2—10%, V3—20%, V4—30%, V5—40%, V6—50%, and V7—60%. The digester operational parameters were: organic load rate (OLR) 2.2 gVS/dm3·day (all variants), hydraulic retention time 20 days, and temperature 38 °C.

2.2. Materials

Maize (Zea mays) silage maintained and stored in a pile system was sourced from the crops of the Teaching & Research Station of the University of Warmia and Mazury in Olsztyn. The station itself is sited in the village of Bałdy (Poland). The anaerobic sludge used to inoculate the anaerobic reactors was sourced from a biogas plant used to process maize silage and cattle slurry. The key running parameters for the biogas plant were: T = 38 °C, OLR = 2.2 kgVS/m3·day, HRT = 20 days, and initial feedstock water content = 90%. Accordingly, the anaerobic sludge did not have to be adapted prior to the experiment proper. The basic parameters of the maize silage and anaerobic sludge are presented in Table 1.
The CTS used in the experiments was sourced from the sewage collection station of the “Korektywa” shipping port in the town of Piaski (near Ruciane-Nida). The CTS profile is given in Table 2.
The process was designed to match the running conditions at the agricultural biogas plant from which the anaerobic sludge was obtained (this obviated the need to adapt the anaerobic sludge inoculums). Before being fed into the anaerobic reactors, the mixture of maize silage and tap water + CTS (90% water content) was ground and homogenized in a T65 MultiDrive Control laboratory mill (IKA, Germany). The feedstock particles averaged 2.0 ± 1.0 mm in size. The process parameters and volumes of organic feedstocks used in the experiment are given in Table 3.

2.3. Anaerobic Reactors

AD was conducted using AMPTS II kits (Bioprocess Control, Lund, Sweden) equipped with an automated biogas measurement system. The continuous process was run in reactors with a total volume of 2.5 dm3 fitted with mechanical 3-blade vertical mixers rotating at 100 rpm in a 10 min ON/10 min OFF regime. At the outset of the experiment, the reactors were inoculated with 2.0 dm3 anaerobic sludge. In total, 100 cm3 digestate was removed once a day, and the reactor was replenished with an equivalent amount of feedstock. The digestion process was sustained for 60 days, equivalent to three times the hydraulic retention time in the bioreactor. To ensure anaerobic conditions at the start of the experiment, the inoculum + feedstock mixture was purged with pure nitrogen for 5 min. Bioreactors were fitted with a carbon dioxide absorption unit. The resultant biogas was fed into a 200 cm3 tank filled with a 3 M solution of NaOH.

2.4. Analytical Methods

COD (chemical oxygen demand), all phosphorus species, all nitrogen species, and chlorides and sulfates in the CTS were determined using a DR 5000 spectrophotometer with an HT200S mineralizer (Hach-Lange, Düsseldorf, Germany). Determination of biochemical oxygen demand (BOD5) was carried out according to PN-EN ISO 5815-1:2019-12 [23]. The pH was determined using a VWR 1000 L pH meter (Gdansk, Poland).
TS, VS and MS in the maize silage, in the anaerobic sludge inoculum, and in the digestate were determined gravimetrically. TS levels in the biomass were determined by drying to a constant weight at 105 °C, then burning it at 550 °C. The loss on ignition was the VS, as per PN-EN 15935: 23022-01. Biomass samples desiccated at 105 °C were assayed for TC, TOC, and Ntotal using a Flash 2000 elemental particle analyzer (Thermo Scientific, USA). Ptotal was determined colorimetrically in ammonium metavanadate (V) and ammonium molybdate after prior mineralization in a mixture of sulfuric (VI) and chloric (VII) acids at 390 nm using a DR 2800 spectrophotometer (HACH Lange, Weilheim, Germany). Total protein was calculated by multiplying the value of Ntotal by the protein conversion factor of 6.25. Reducing sugars were determined colorimetrically with an anthrone reagent at 600 nm using a DR 2800 spectrophotometer (HACH Lange, Weilheim, Germany). Lipids were quantified using the Soxhlet method with a Buchi extraction apparatus (Flawil, Switzerland). The pH in H2O was determined potentiometrically with an 867 pH module (Metrohm, Herisau, Switzerland). The FOS/TAC (the ratio of the buffer capacity of the sample to the VFA levels in the sample) was determined using a TitraLab AT1000 titrator (HACH Lange, Weilheim, Germany). Total alkalinity was determined through titration testing. Magnesium was determined by atomic absorption spectrometry. Calcium and potassium were determined by flame photometry. The experiment was conducted at an accredited test laboratory of the Chemical and Agricultural Research Station (Olsztyn branch, Poland).
Acute toxicity of the sludge (aqueous extracts) was measured using Vibrio fischeri bacteria in an M 500 Analyzer (Azur Environmental, Carlsbad, DE, USA), following Polish Standard PN-ISO 11348-2:2008. The aqueous extract was prepared by adding 4 volumes of distilled water on top of 1 volume of sludge and agitating mechanically for 24 h [24]. The molecular analysis aimed to determine the percentage of AD bacteria in the biomass using the fluorescent in situ hybridization (FISH) technique [25]. Four molecular probes were used for hybridization: the Bacteria-universal probe EUB338 [26], the Archaea-universal probe ARC915 [27], the Methanosarcinaceae-targeting probe MSMX860, and the Methanosaetatargeting probe MX825 [28]. Biogas composition was assayed in a gas chromatograph with a thermal conductivity detector (GC-TCD) (Agilent 7890 A-Agilent Technologies, Santa Clara, CA, USA).

2.5. Calculation Methods

COD—The digestion coefficient (portion digested), i.e., the ratio of the organic VS removed in the reactor to the VS fed into the reactor, was determined using the equation
η F = V S i n · ρ i n · Q i n V S o u t · ρ o u t · Q o u t V S i n · ρ i n · Q i n
where:
  • η F —portion digested, %;
  • V S i n —VS in the feedstock, g/dm3;
  • V S o u t —VS in the digestate, g/dm3;
  • ρ i n —feedstock density, g/cm3;
  • ρ o u t —digestate density, g/cm3;
  • Q i n —feedstock volume, cm3/day;
  • Q o u t —digestate volume, cm3/day.
Biogas/CH4 production per VS load was calculated as
Y b / C H 4 V S i n = V b / C H 4 ( V S i n · ρ i n · Q i n ) / 1000
where:
  • Y b / C H 4 V S i n —specific biogas production per VS in (by volume), cm3/gVS; V b / C H 4 —daily biogas/CH4 yield (by volume), cm3/day;
  • Q i n —daily volume of feedstock in cm3.

2.6. Statistical Methods

Statistical analysis of the results was carried out using the STATISTICA 13.1 PL software package. The tests were carried out in four repetitions. The Shapiro–Wilk test was used to verify the hypothesis regarding the degradation of the researched variables. ANOVA was used to establish the significance of differences between variables. Significant differences between variants were determined via Tukey’s honestly significant difference (HSD) test. Differences were considered significant at α = 0.05. The figures and tables show the mean values and standard deviations.

3. Results

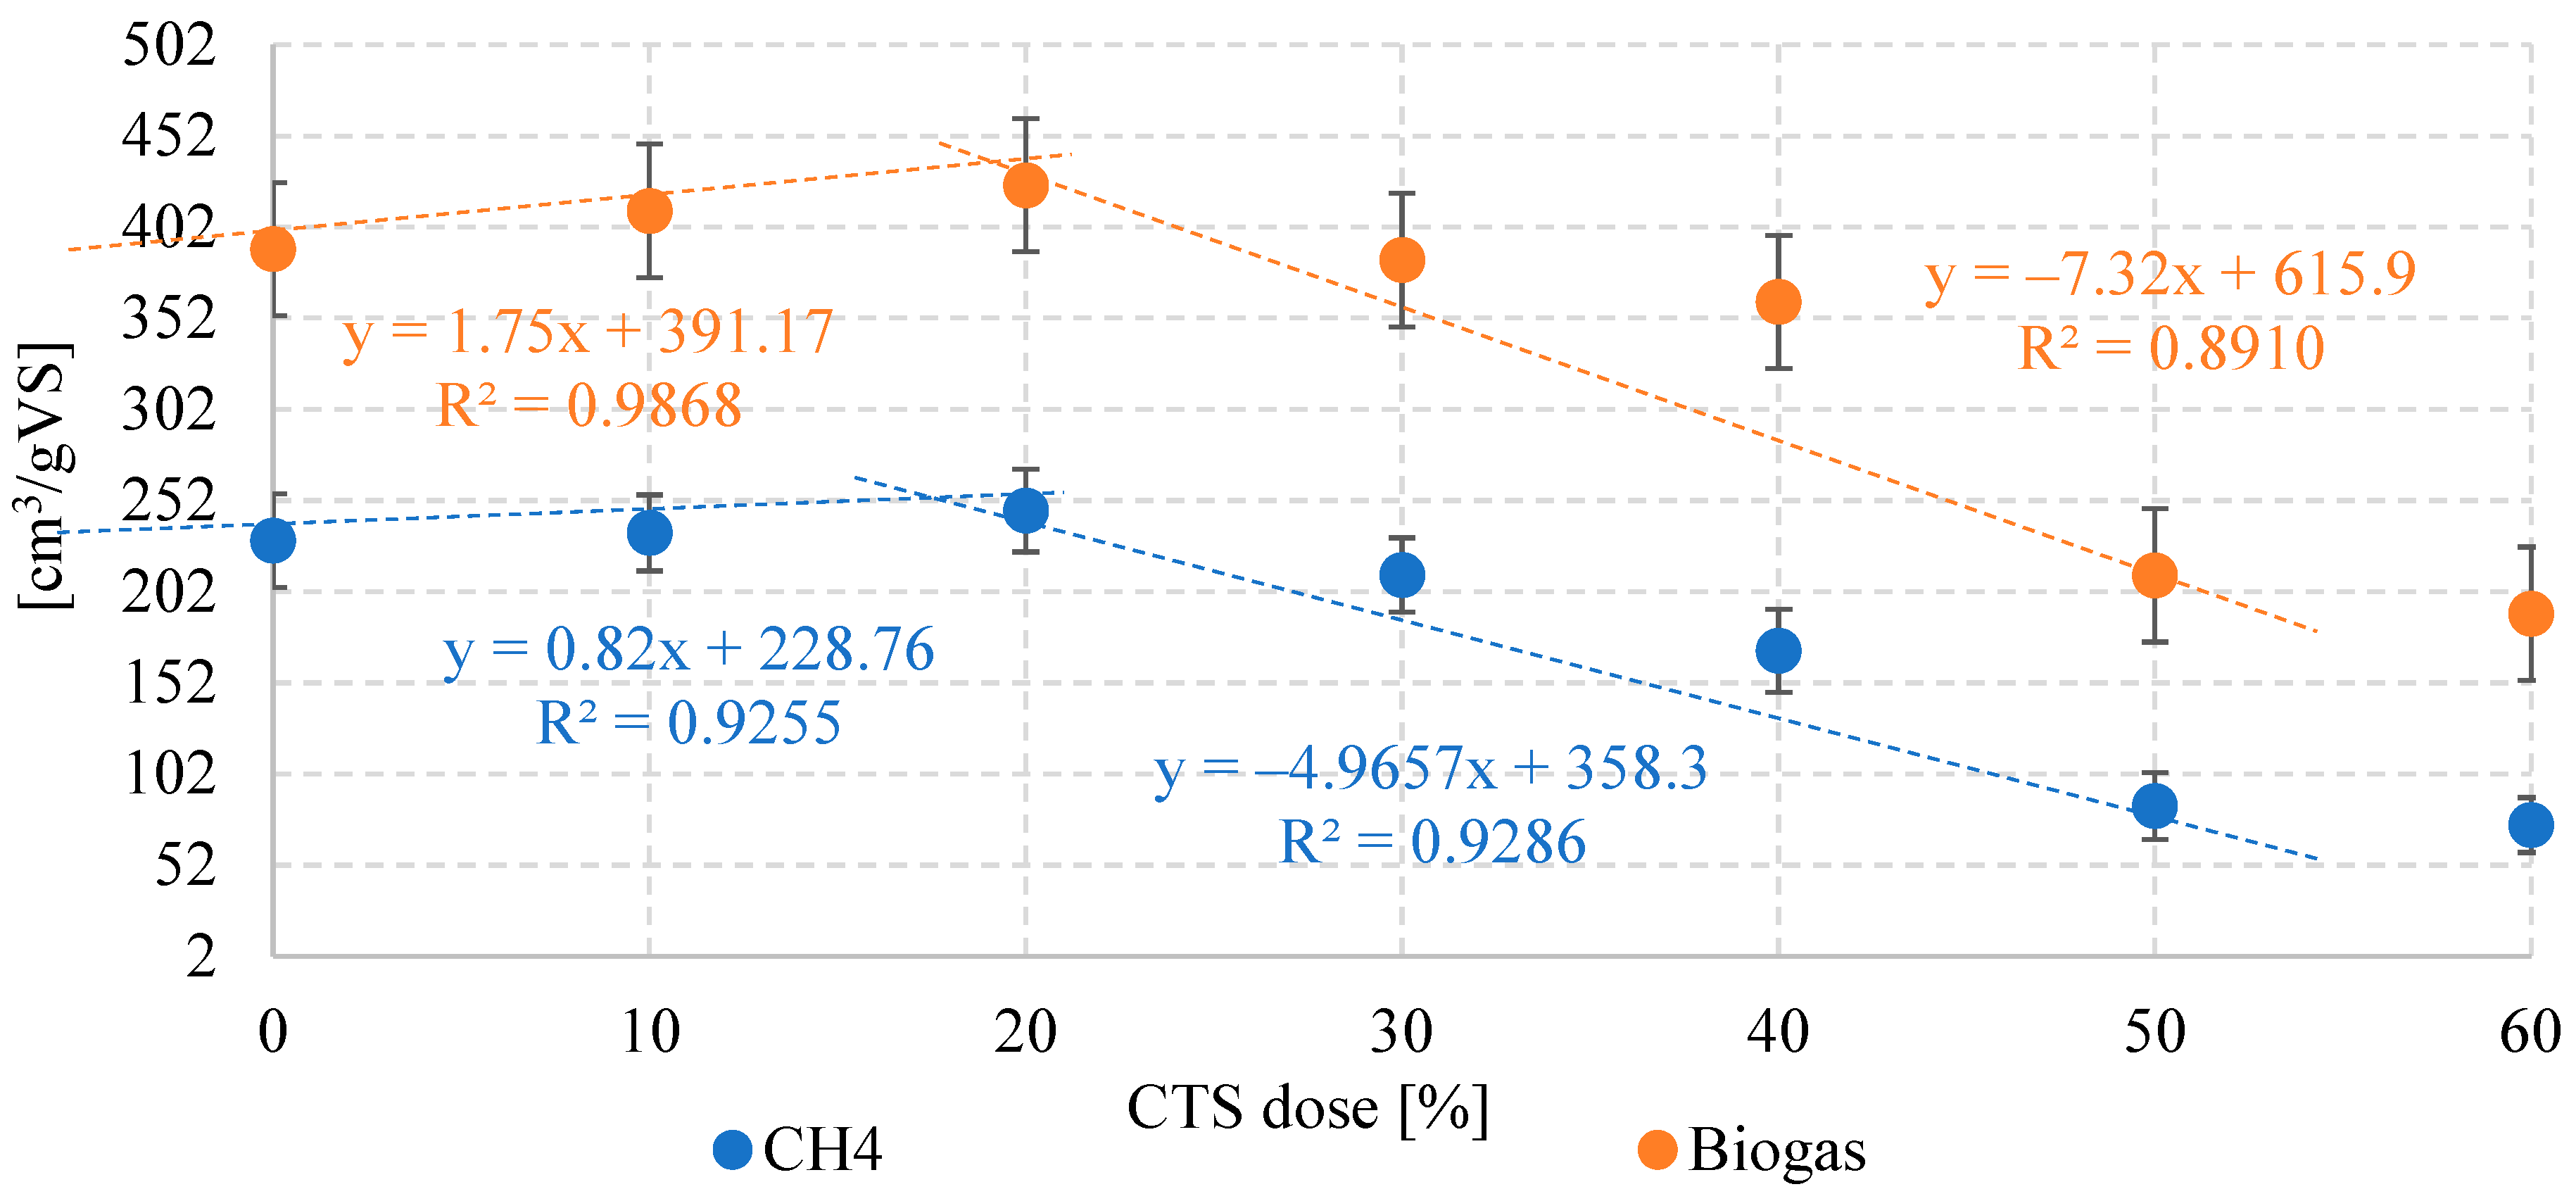
3.1. Biogas and CH4 Production

V1 (maize silage only) yielded 390 ± 44 cm3/gVS biogas containing 59 ± 3.1% CH4. Higher average biogas yields were noted for V2 and V3, where the dilution fluid contained 10% and 20% CTS, respectively, the former producing 411 ± 37 cm3/gVS (57 ± 2.6% CH4). Biogas production peaked in V3 at 425 ± 39 cm3/g vs. (58 ± 1.4% CH4). Differences across V1–V3 were not statistically significant (p = 0.05). V4 (30% CTS) and V5 (40% CTS) fared significantly worse in terms of gas output—384 ± 37 cm3/gVS (55 ± 2.7% CH4) and 361 ± 48 cm3/gVS (47 ± 3.9% CH4), respectively. The lower CH4 fractions translated to significantly reduced nominal methane yield in V5 (170 ± 23 cm3CH4/gVS) compared with V4 (211 ± 20 cm3CH4/gVS). Marked incremental decreases in AD performance were observed across V6 (50% CTS) and V7 (60% CTS) at 211 ± 46 cm3/gVS (40 ± 4.1% CH4) and 190 ± 39 cm3/gVS (39 ± 3.4% CH4), respectively. Methane production varied from 1085 ± 100 cm3CH4/day (V3) to just 326 ± 66 cm3CH4/day (V7) across the variants. Full biogas and methane production data are given in Table 4. The worldwide literature has seen few investigations into the impact of chemical toilet waste on AD. Litti et al. (2021) [29] tested whether biogas can be extracted from fecal sludge (FS) sourced from toilet complexes (ESTC) of passenger railcars. The FS was chemically treated (either through acidification or alkalization) and digested under thermophilic conditions. Acidification produced better results, with biogas yields of 3050 dm3/t containing 80% methane on average [29]. Other researchers have also found that CTS amendment improved anaerobic digestion. Wasilewski et al. (2017) [30] treated toilet sewage in a pilot-scale CSTR reactor. As the COD loads in the feedstock were raised from 0% to 35%, methane production similarly rose from 222 to 332 dm3CH4 kg/CODrem. The methane fraction in this biogas was approx. 60% [30]. Wendland (2008) [31] anaerobically digested toilet sewage with kitchen waste in a laboratory-scale CSTR at a ratio of 40 g kitchen refuse to 1 L of toilet wastewater. The methane fraction was similar across all variants at around 65 ± 2.0%, which translated to nominal yields of 172 to 255 dm3CH4/kg CODinput. Similarly, Reysset (2021) [32] posited that cistern-flush and pour-flush toilets, non-sewer toilets, and chemical toilets can be used for biogas production. The author believes that, although the quantity and/or seasonality of such waste preclude it from being used as the sole feedstock, it can feasibly be used in mixtures with other feedstocks [32].
The results indicate a strong correlation between biogas/CH4 production trends and the CTS dose in the feedstock. This linear correlation progresses in a down-curve pattern (Figure 1). The increase in CTS dose (0% to 20%) in variants V1–V2 was found to very strongly and positively correlate with biogas production (R2 = 0.9868), as well as CH4 production (R2 = 0.9255) (Figure 1). This trend was reversed in variants V3 (20% CTS) to V7 (60% CTS), where the increasing of CTS dose was found to very strongly and negatively correlate with biogas production (R2 = 0.8910) and specific CH4 production (R2 = 0.9286) (Figure 1).

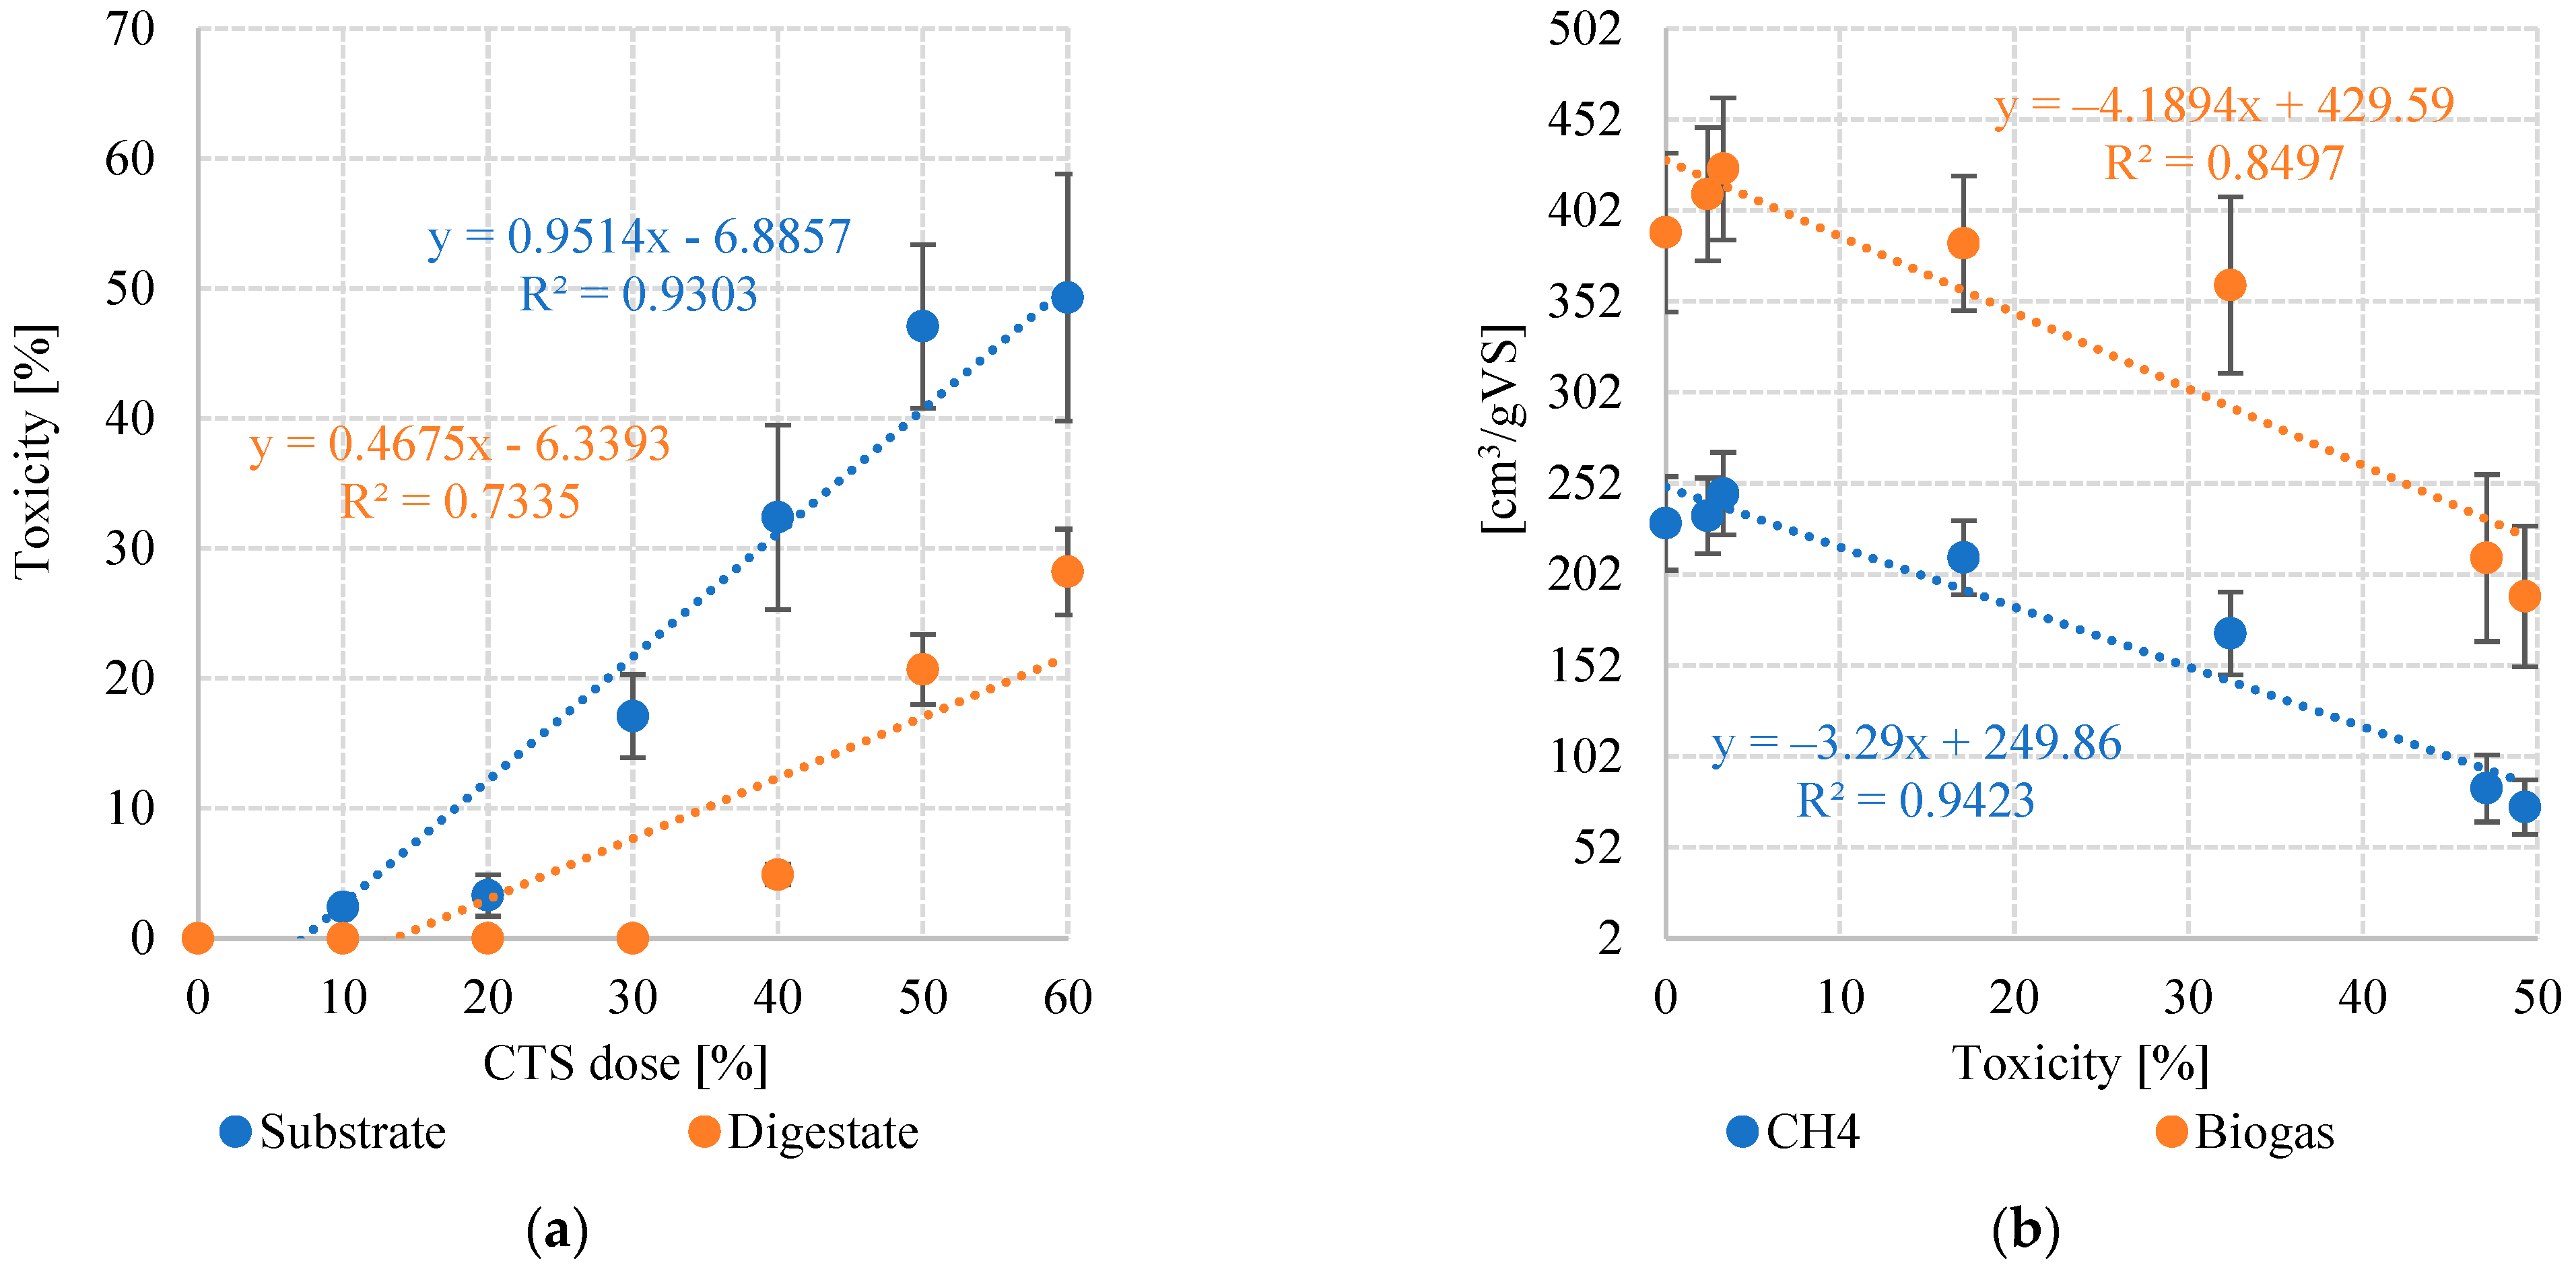
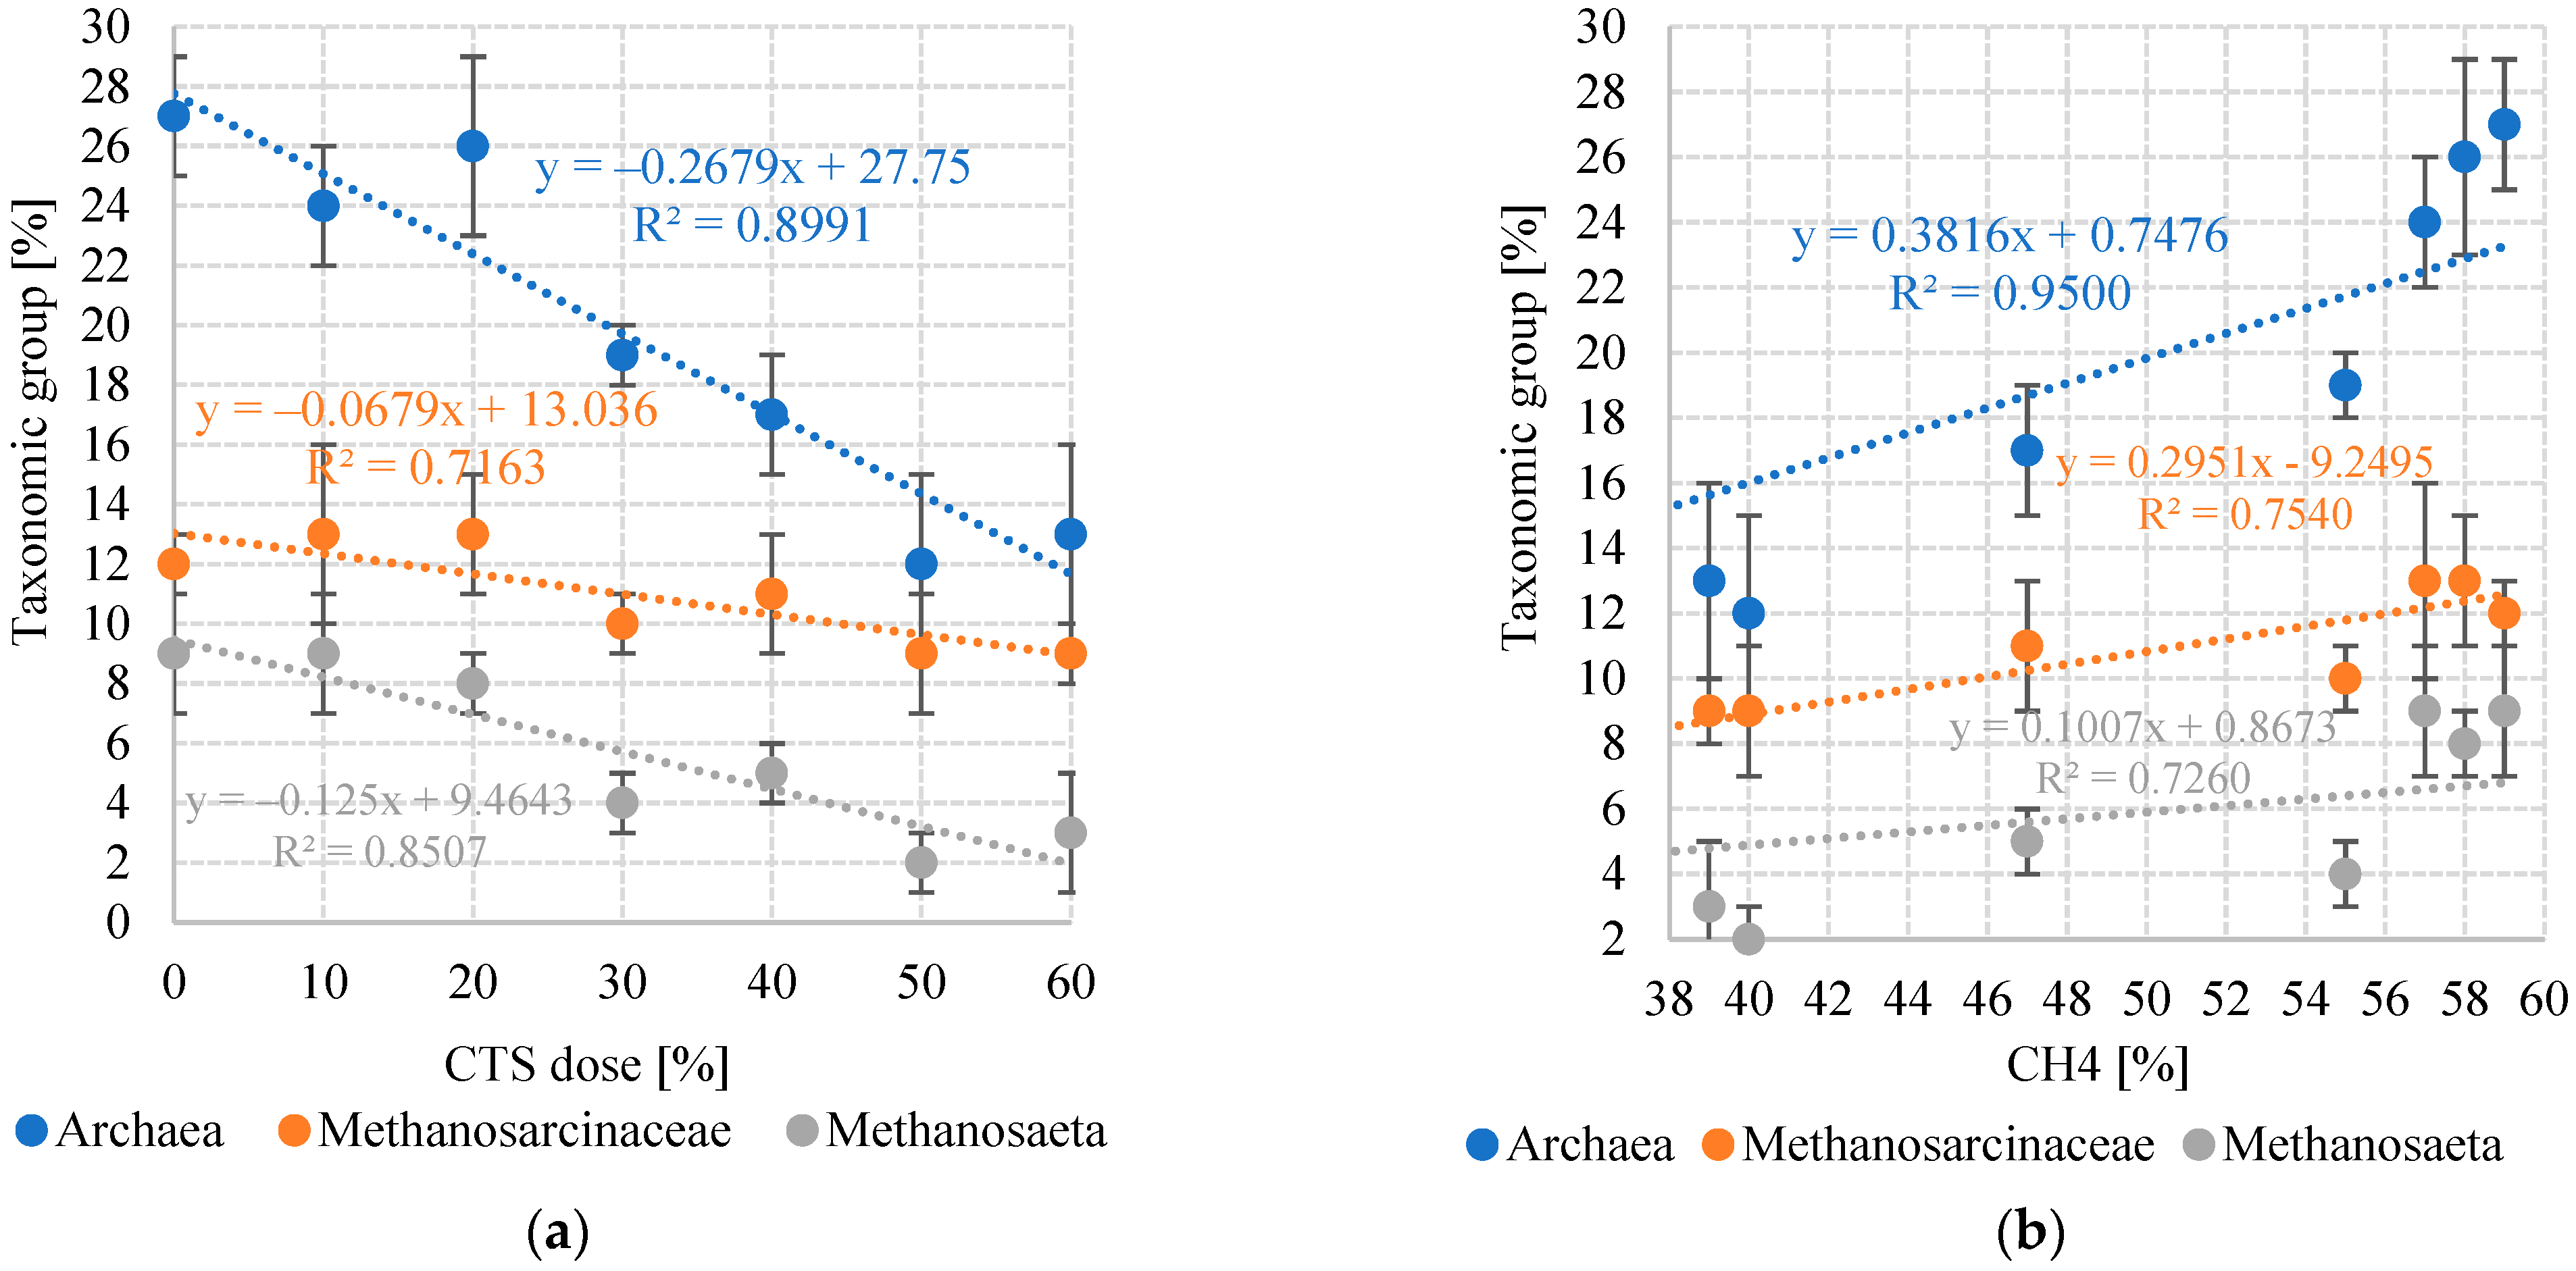
3.2. Toxicity and Bacterial Community
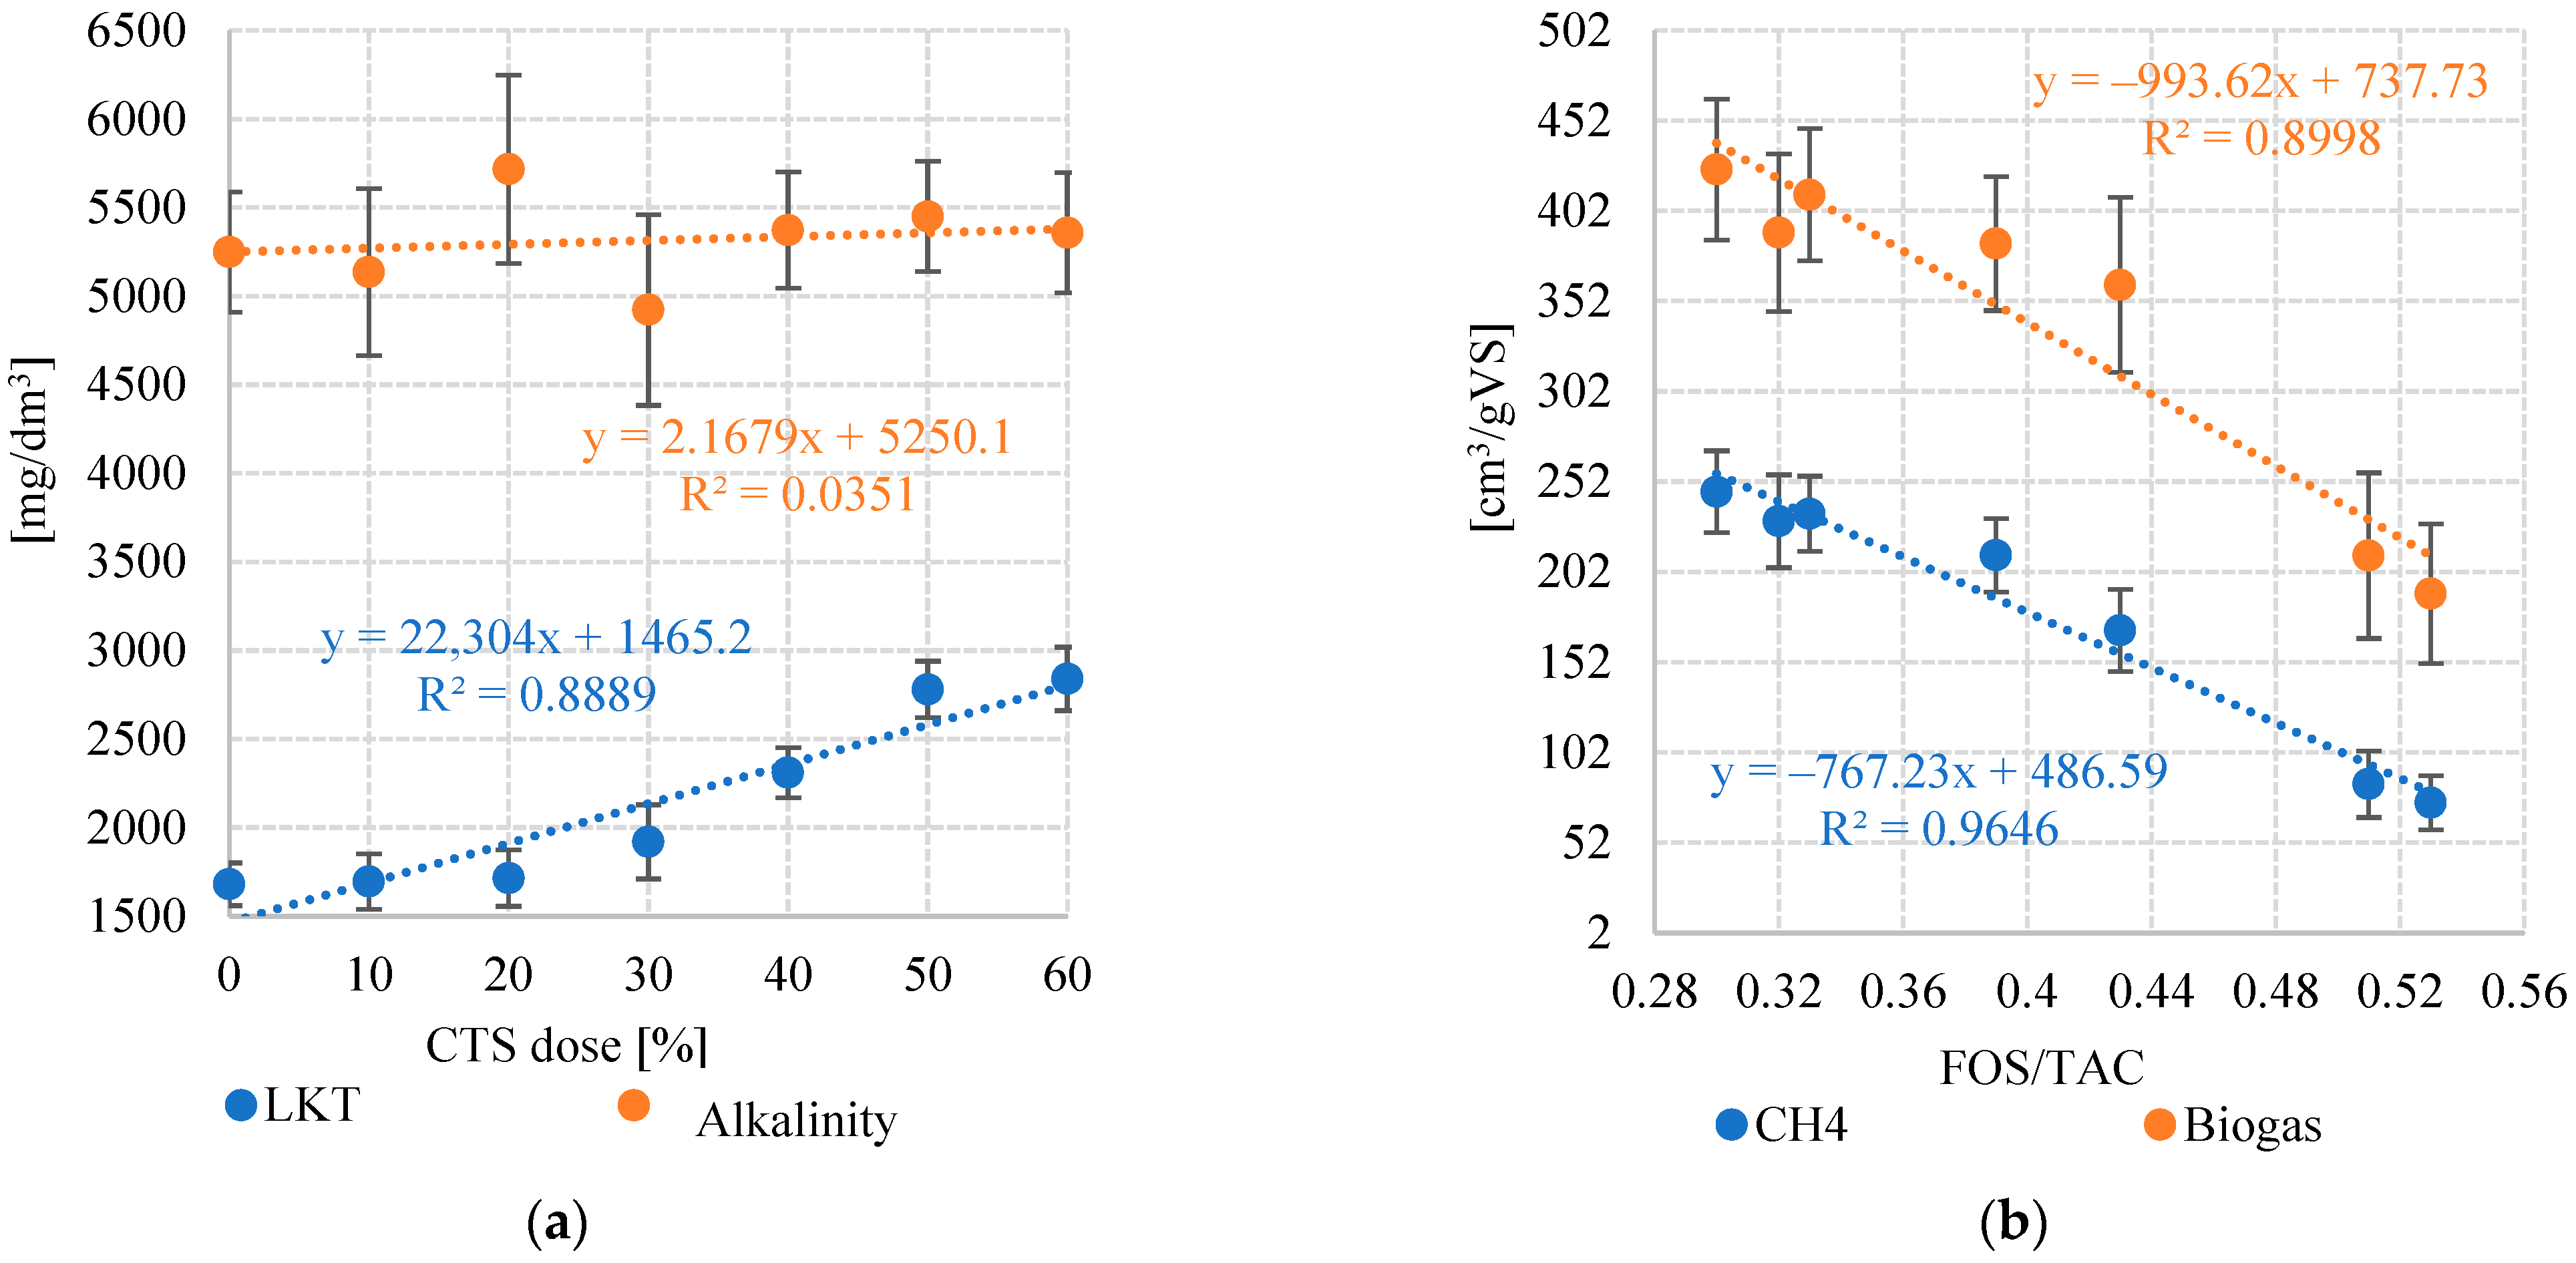
CTS contains biocides, toxic substances, bioinhibitory chemicals, and hard-to-degrade substances [33]. For these reason, it can negatively affect the structure and activity of anaerobic bacteria communities [34]. The toxicity of the tested feedstock composition rose proportionally to the CTS% in the dilution fluid. V1 (maize silage only) was found to be non-toxic. However, the CTS doses in V1 (10%) and V2 (20%) gave rise to some toxicity, which was statistically comparable at 2.4 ± 0.3% and 3.3 ± 1.6%, respectively. Significantly (p = 0.05) higher rates of 17.1 ± 3.2% were found for V4 (30% CTS), followed by another statistically significant increase for V5 (40% CTS) at 32.4 ± 7.1. V6 (50% CTS) and V7 (60% CTS) fared even worse, with toxicity rising to almost 50%. AD significantly reduced the toxicity rates, with complete detoxification in variants V1 to V4 (no toxicity in the digestate). In V5, it was markedly reduced to 4.9 ± 0.8%. V6 and V7 digestates remained relatively toxic, with rates of 20.7 ± 2.7% and 28.2 ± 3.3%, respectively. A very strong positive correlation was noted between the CTS dose and the toxicity of the feedstock (R2 = 0.9303), but not the digestate (R2 = 0.7335) (Figure 2a). There was also a clear direct linear relationship between the toxicity of the AD feedstock and the output of gas metabolites. A particularly pronounced negative correlation was found for CH4 (R2 = 0.9423), with a slightly weaker one for biogas (R2 = 0.8497) (Figure 2b). According to Loiko et al. (2022) [35], the toxic shock caused by the transfer of biocide-contaminated fecal sludge (FS) from chemical toilets to conventional wastewater treatment plants (WWTP) can pose a serious problem for activated sludge processing. The researchers argue that new environmental approaches need to be developed to mitigate biocide toxicity so as to prevent biocides from impairing WWTP performance [35]. Litti et al. (2021) [29,34] found that the deactivation of toxic biocidal agents (BA) in fecal sludge (FS) from chemical toilets resulted in a considerable improvement of AD performance, with several-fold increases in biogas yields [29,34].
The contribution of basic taxonomic groups in the anaerobic bacterial community is shown in Table 5. The microbial communities consisted primarily of bacteria (EUB338), with proportions thereof falling within the narrow range of 68 ± 5% in V5 (40% CTS) to 71 ± 3% in V3 (20% CTS) (Table 5). No relationship was found between the CTS dose in the feedstock mixture and the share of bacteria in the anaerobic microbe community.
A strong negative correlation (R2 = 0.8991) was found between the CTS dose and the share of Archaea (ARC915) in the anaerobic microbe community (Figure 3a). In variants V1 (0% CTS) to V3 (20% CTS), this share ranged from 24 ± 2% to 27 ± 2% (Table 5). Significantly lower rates were recorded for V3 and V4 at 19 ± 1% and 17 ± 2%, respectively. Archaea (ARC915) were statistically the least numerous in V6—12 ± 3% and V7—13 ± 3% (Table 5). Similar trends in bacterial community structure were found for Methanosarcinaceae (MSMX860) and Methanosaeta (MX825). As the CTS input increased, the contribution of methanogenic bacteria in the community consistently decreased. For Methanosarcinaceae (MSMX860), it was between 12 ± 1% and 13 ± 3% in V1–V3, falling to between 10 ± 1% and 11 ± 2% in V4–V5, and finally to 9 ± 2% in V6–V7 (Table 5). The coefficient of determination was R2 = 0.7163 (Figure 3a). Methanosaeta (MX825) were the most populous in V1 (9 ± 2%) and the least populous in V6 (2 ± 1%) (Table 5), again indicating a relationship with the CTS dose (R2 = 0.8507) (Figure 3a). The activity of anaerobic microorganisms treated with detoxifying agents was studied in experiments based on increasing biogas yields from the 30-day incubation of fecal sludge (FS) from passenger car toilet complexes. The CTS was preserved using biocidal agents to reduce toxicity. The biogas yield was five to seven times higher than in the control, proving that high activity of methanogens can be sustained in a CTS-based medium [29].
The data indicate that the presence of anaerobic microbes can be linked to CH4 levels in the biogas. A particularly strong positive correlation (R2 = 0.9500) was found for Archaea (ARC915), with slightly weaker ones noted for Methanosarcinaceae (MSMX860) (R2 = 0.7540) and Methanosaeta (MX825) (R2 = 0.7260) (Figure 3b). Archaea tend to be less populous than bacteria, but the AD feedstock used plays a role. Feedstocks rich in volatiles are linked to higher shares of Archaea [36]. Conversely, bacteria tend to dominate when mixed feedstocks are used, such as surplus sludges in wastewater treatment plants (approx. 55% bacteria) [37] or feedstocks containing organic urban residues (approx. 90% bacteria) [38]. Both Methanosaeta and Methanosarcinaceae can digest acetate feedstocks, whereas Methanosarcinaceae are more versatile and have the added ability to take up hydrogen and carbon dioxide. Methanosaeta have a higher feedstock affinity to acetate, but longer doubling times compared with Methanosarcinaceae. Bearing this in mind, the prevalence of Methanosarcinaceae may have resulted from the high acetate levels fueling their growth [39,40]. According to Mata-Alvarez et al. (2000) [41], digesters supplied with mixed feedstocks tend to produce more biogas than those with single-component feedstocks. Combined media can provide nutrients and minerals necessary for the microflora to grow [42].

3.3. FOS/TAC and pH

The study also measured FOS/TAC, which can often be used to verify whether the organic load rates (OLRs) in the digesters are within optimal levels. The FOS quotient is the sum of volatile fatty acids (VFAs) in the medium during anaerobic digestion, measured in mgCH3COOH/dm3, whereas TAC is used to determine alkaline buffer capacity, expressed in mgCaCO3/dm3. FOS/TAC also has other uses, apart from measuring OLR and HRT. It can be used to indirectly evaluate methanogenic bacteria activity, whose populations can be inhibited by factors that hamper their growth or metabolism, as well as by toxic substances in the medium. This can cause unmetabolized VFAs to accumulate during methanogenesis, which in turn leads to increased FOS/TAC.
In fact, this was the case in the present experiment. While the OLR was maintained at a constant and relatively low 2.2 kgVS/m3·day across all variants, a steady increase in FOS/TAC values was still observed, clearly indicating VFA accumulation in the anaerobic medium. The VFA levels were found to consistently increase with the CTS input. V1 (% CTS) had 1680 ± 121 mgCH3COOH/dm3, whereas V7 (60% CTS) contained 2840 ± 180 mgCH3COOH/dm3. In variants V1–V3 (CTS in the dilution fluid = 0–20%), the FOS/TAC ranged from 0.30 ± 0.01 to 0.33 ± 0.04. These values show that the AD process was running at optimal performance, as further evidenced by the biogas yield and quality. Increased CTS doses led directly to higher FOS/TAC, with the latter reaching 0.39 ± 0.02 in V4 and 0.43 ± 0.04 in V5, indicating impaired VFA removal. The highest FOS/TAC values (over 0.50) were noted in V6 and V7. Total alkalinity values were similar across variants, from 4923 ± 538 mgCaCO3/dm3 (V4) to 5717 ± 533 mgCaCO3/dm3 (V3). This translates to a range of 14%, compared to the much higher 42% for VFAs. The values of the primary anaerobic digestion indicators are presented in Table 6.
The present study also showed that the reduction in the total activity of methanogenic bacteria—and the resultant increase in VFAs in the system—was reflected in the observed pH values. The pH was at fairly stable, near-optimal levels across variants V1 to V4: between 7.34 ± 0.02 in V2 and 6.89 ± 0.11 in V4. Subsequent variants showed a sharp decrease in pH, as well as dramatic fluctuations thereof. V5 had a pH of 6.42 ± 0.19, which dropped to just 6.11 ± 0.14 in V7. For their study on CTS digestion, Litti et al. (2021) adjusted the pH to a target range of 9.4 to 7.0 [29]. These are the optimal levels for anaerobic processes [20,43]. Wasilewski et al. (2017) also found that stable pH improves performance [30]. Efficient mesophilic anaerobic digestion of the CTS was achieved at pH 7.3 [30]. Wendland (2008) [31] obtained good results when anaerobically digesting toilet sewage with kitchen waste in a CSTR. Again, stable AD was predicated on maintaining near-neutral pH [31]. In our study, rising CTS inputs were found to strongly and positively correlate with the VFA levels (R2 = 0.8889) (Figure 4a). On the other hand, no such correlation was found between the experimental variant and total alkalinity in the digesters (R2 = 0.0351) (Figure 4a). Even stronger relationships were noted between the FOS/TAC and the output of gas metabolites. A particularly pronounced negative correlation was detected between FOS/TAC and CH4 production (R2 = 0.9646), while a slightly weaker one was found between FOS/TAC and biogas yield (R2 = 0.8998) (Figure 4b).

3.4. Portion Digested (Digestion Coefficient) and Digestate Characteristics

The feedstock composition had a profound effect on the volatile solids in the digestate. Variants V1 to V3 had the lowest statistically comparable (p = 0.05) levels of organic matter (Table 7). The value fell within the narrow range of 68.2 ± 0.9% TS (V1) to 69.7 ± 1.4% TS (V2). Significantly lower organic compound removal rates were found for higher CTS doses. The volatile solids in dry matter peaked in V6 at 72.6 ± 1.4% TS. The portion digested ranged from 64.4 ± 1.8% (V3) to 70.7 ± 0.5% (V4). No relationship was found between the variant and the digestion coefficient (Table 7). Studies have revealed no relationship between the level of toxicity in the organic substrate and digestate and digestion coefficient. The coefficients of determination were R2 = 0.124 and R2 = 0.1434, respectively (Figure 5a). There was also no correlation between the digestion coefficient and the amount of biogas (R2 = 0.233) and methane (R2 = 0.1892) produced (Figure 5b).
Changes in the feedstock composition did not produce significant changes in other digestate parameters, and differences between the variants were not statistically significant (p = 0.05). TS ranged between 10.9 ± 1.2% FM (V6) and 13.9 ± 1.8% FM (V3). The choice of feedstock mix had little effect on the content of fertilizing substances. Variations in the phosphorus, nitrogen, calcium, magnesium, and potassium levels were negligible (Table 7). The digestate profile is given in Table 7. According to Abbas et al. (2022) [44], the co-digestion of feedstocks can potentially enhance biogas harvesting and nutrient (NPK) management in a biocircular economy, provided appropriate mixtures are used. Another study, conducted in four provinces of Rwanda on biodigesters connected with toilets, concluded that the resultant digestate is a rich and safe fertilizer with adequate NPK levels [45]. These findings are corroborated by other research, indicating that the bio-effluent from bio-digesters connected with toilets is not harmful to the population and can, indeed, serve as a nutrient-rich (NPK) organic fertilizer beneficial to plants [46,47]. Organic fertilizers increase biological, chemical and physical activity in the soil, rendering it more fertile and good for plant growth [48]. Radhakrishnan et al. (2021) [49] concluded that anaerobic digestion provided nutrient-rich digestate, but stressed the need for thorough hygienic and microbiological testing in each instance.
The effective neutralization of CTS in the process of methane fermentation offers many positive effects for both the natural environment and the development of various sectors of the economy in the region. Improving the trophic state of lakes by limiting the inflow of highly concentrated pollutants has a direct impact on increasing the natural attractiveness and tourist values of these reservoirs. It allows for the dynamic development of the hotel base and the expansion of recreational water use. It is conducive to the development of sport fishing, diving, kayaking and (increasingly popular) stand-up paddle boarding. Waters with high water quality also have increased economic potential for aquaculture and inland fisheries. The effective transformation of CTS to biogas and further to energy also favors the development of the renewable energy sector and accompanying industries, which is of fundamental importance in the current geopolitical situation. Due to its characteristics, the use of digestate can support agriculture, as demonstrated above.

4. Conclusions

The study has shown that chemical toilet waste can be included in feedstock mixtures for anaerobic digestion. However, this type of biomass should be used with utmost care due to its limited anaerobic digestibility and toxic nature. It would seem prudent that respirometric tests be conducted each time before reusing such waste, so as to identify potential risks to the process.
The present study results show that AD performance was impaired when maize silage was diluted with a CTS dose exceeding 30% of the required liquid volume. Higher CTS doses led to reduced biogas yields and methane fractions, whereas process failure occurred when CTS in the dilution fluid exceeded 50%.
It was found that the toxic nature of CTS inhibited AD by reducing methanogens in the bacterial community. This slowed down VFA-to-biogas conversion and triggered VFA accumulation, which in turn increased FOS/TAC and decreased pH—a chain reaction that ultimately resulted in diminished AD performance. This negative effect was significantly more pronounced in the high-CTS variants. The study identified multiple strong correlations between CTS dose, toxicity, taxonomic composition of the anaerobic microbial community, biogas/methane yields, FOS/TAC, and portion digested. Levels of organic compounds in the digestate varied significantly across variants. On the other hand, CTS did not affect the fertilizing value of the digestate, even at higher doses.

Author Contributions

Conceptualization, M.D., J.K. and M.Z.; methodology, M.D. and J.K.; validation, M.Z.; formal analysis, M.Z.; investigation, M.D., J.K. and M.Z.; resources, M.D., J.K. and M.Z.; data curation, M.Z.; writing—original draft preparation, M.D. and J.K.; writing—review and editing, M.D., J.K. and M.Z.; visualization, M.D. and J.K.; supervision, M.Z.; project administration, M.Z.; funding acquisition, J.K. All authors have read and agreed to the published version of the manuscript.

Funding

Project financially supported by Minister of Education and Science in the range of the program entitled “Regional Initiative of Excellence” for the years 2019–2023, project no. 010/RID/2018/19. Amount of funding: PLN 12,000,000. The work WZ/WB-IIŚ/3/2022 was funded by the Minister of Education and Science.

Institutional Review Board Statement

Not applicable.

Informed Consent Statement

Not applicable.

Data Availability Statement

Not applicable.

Conflicts of Interest

The authors declare no conflict of interest.

References

  1. Št’Astná, M.; Vaishar, A.; Brychta, J.; Tuzová, K.; Zloch, J.; Stodolová, V. Cultural Tourism as a Driver of Rural Development. Case Study: Southern Moravia. Sustainability 2020, 12, 9064. [Google Scholar] [CrossRef]
  2. Sultan, M.T.; Sharmin, F.; Badulescu, A.; Stiubea, E.; Xue, K. Travelers’ Responsible Environmental Behavior towards Sustainable Coastal Tourism: An Empirical Investigation on Social Media User-Generated Content. Sustainability 2020, 13, 56. [Google Scholar] [CrossRef]
  3. Siuda, W.; Grabowska, K.; Kaliński, T.; Kiersztyn, B.; Chróst, R.J. Trophic State, Eutrophication, and the Threats for Water Quality of the Great Mazurian Lake System. Pol. River Basins Lakes—Part I 2020, 86, 231–260. [Google Scholar] [CrossRef]
  4. Furgała-Selezniow, G.; Jankun-Woźnicka, M.; Woźnicki, P.; Cai, X.; Erdei, T.; Boromisza, Z. Trends in Lakeshore Zone Development: A Comparison of Polish and Hungarian Lakes over 30-Year Period. Int. J. Environ. Res. Public Health 2022, 19, 2141. [Google Scholar] [CrossRef] [PubMed]
  5. Swidy´nska, N.; Swidy´nska, S.; Witkowska, D.; Abrowska, M.; -Fernández, P. Indicators of the Tourist Attractiveness of Urban–Rural Communes and Sustainability of Peripheral Areas. Sustainability 2021, 13, 6968. [Google Scholar] [CrossRef]
  6. Kaźmierczak, R.; Szczepańska, A.; Grunwald, G.; Kowalczyk, C.; Tanajewski, D. Conceptual Framework of a Global Yacht Positioning System in Poland. Appl. Geomat. 2022, 14, 79–91. [Google Scholar] [CrossRef]
  7. Klasios, N.; Pozas, A.; Sha, J. The Great Bear Sea—a Toilet Bowl for Marine Vessels: Quantifying Waste and the Ecological, Social, Cultural and Economic Risks of Marine Dumping; The University of British Columbia: Vancouver, BC, Canada, 2020. [Google Scholar] [CrossRef]
  8. Alamanos, A.; Mcgrath, T.; Linnane, S. Treatment of Domestic WasteWater and Opportunities from Nature-Based Solutions for Small Communities: A Preliminary Assessment. Background Report January 2022. Available online: https://www.researchgate.net/publication/363728547_Treatment_of_Domestic_WasteWater_and_Opportunities_from_Nature-based_Solutions_for_small_communities_a_preliminary_assessment?channel=doi&linkId=632b55ac071ea12e364efdea&showFulltext=true (accessed on 3 January 2023).
  9. Bedynski, W.; Godz, J.; Łukowski, W. Urban Social Movements in a Small Town: The Case of “Aktywne Giżycko”. Przegląd Kryt. 2021, 3, 79–98. [Google Scholar] [CrossRef]
  10. Wang, S.; Ji, C.; He, H.; Zhang, Z.; Zhang, L. Tourists’ Waste Reduction Behavioral Intentions at Tourist Destinations: An Integrative Research Framework. Sustain. Prod. Consum. 2021, 25, 540–550. [Google Scholar] [CrossRef]
  11. Chatema, T.M. Effect of Ageing on the Physicochemical Properties of Fresh Faeces. Ph.D. Thesis, University of KwaZulu-Natal, Durban, South Africa, 2021. [Google Scholar]
  12. Byrnes, T.A.; Dunn, R.J.K. Boating- and Shipping-Related Environmental Impacts and Example Management Measures: A Review. J. Mar. Sci. Eng. 2020, 8, 908. [Google Scholar] [CrossRef]
  13. Vítěz, T.; Vítězová, M.; Nováčková, M.; Kushkevych, I. Activated Sludge Respiration Activity Inhibition Caused by Mobile Toilet Chemicals. Process 2020, 8, 598. [Google Scholar] [CrossRef]
  14. Tawfik, A. Valorization of Anaerobic Digestate from Microalgal Treatment. In Anaerobic Digestate Management; IWA Publishing: London, UK, 2022; p. 111. [Google Scholar] [CrossRef]
  15. OECD. Guideline for Testing of Chemicals 201. Alga, Growth Inhibition Test; OECD: Paris, France, 1984. [Google Scholar]
  16. Schinteie, R.; Tran-Dinh, N.; Vergara, T.J.; Midgley, D.J. An Estimation of Chemical Compound Concentrations Used in Onshore Gas Production, a Review of Their Degradation, and Associated Policy Frameworks in South Australia; CSIRO Energy: North Ryde, NSW, Australia, 2019. [Google Scholar]
  17. Omran, B.A.; Abdel-Salam, M.O. The Catastrophic Battle of Biofouling in Oil and Gas Facilities: Impacts, History, Involved Microorganisms, Biocides and Polymer Coatings to Combat Biofouling; Springer: Berlin/Heidelberg, Germany, 2020; pp. 47–99. [Google Scholar] [CrossRef]
  18. Anger, C.B.; Rupp, D.; Lo, P.; Takruri, H. Preservation of Dispersed Systems. In Pharmaceutical Dosage Forms 2020; CRC Press: Boca Raton, FL, USA, 2020; pp. 377–436. [Google Scholar] [CrossRef]
  19. Kircher, M.; Bayer, T. How to Realize an Urban Circular Bioeconomy. In Handbook Waste Biorefinery; Springer: Berlin/Heidelberg, Germany, 2022; pp. 895–913. [Google Scholar] [CrossRef]
  20. Kazimierowicz, J.; Dzienis, L.; Dębowski, M.; Zieliński, M. Optimisation of Methane Fermentation as a Valorisation Method for Food Waste Products. Biomass Bioenergy 2021, 144, 105913. [Google Scholar] [CrossRef]
  21. Markowski, M.; Białobrzewski, I.; Zieliński, M.; Dębowski, M.; Krzemieniewski, M. Optimizing Low-Temperature Biogas Production from Biomass by Anaerobic Digestion. Renew. Energy 2014, 69, 219–225. [Google Scholar] [CrossRef]
  22. Schumüller, K.; Weichgrebe, D.; Köster, S. Biogas Potential of Organic Waste Onboard Cruise Ships—a yet Untapped Energy Source. Biomass Convers. Biorefinery 2021, 12, 5647–5662. [Google Scholar] [CrossRef]
  23. PN-EN ISO 5815-1:2019-12; Water Quality—Determination of Biochemical Oxygen Demand after n Days (BODn). Polish Committee for Standardization: Warsaw, Poland, 2019. Available online: https://sklep.pkn.pl/pn-en-iso-5815-1-2019-12e.html (accessed on 10 December 2022).
  24. Wolska, L.; Mędrzycka, K. Assessing the Ecotoxicity of the Bottom Sediments from the Sea Ports of Gdansk and Gdynia. Environ. Pollut. Control 2009, 31, 49–52. [Google Scholar]
  25. Nielsen, P.H.; Lemmer, H.; Daims, H. Identification and Quantification of Microorganisms in Activated Sludge and Biofilms by FISH: Introduction. In FISH Handbook for Biological Wastewater Treatment; Balint, G., Antala, B., Carty, C., Mabieme, J.-M.A., Amar, I.B., Kaplanova, A., Eds.; IWA Publishing: London, UK, 2009; Volume 7, pp. 1–8. [Google Scholar] [CrossRef]
  26. Rajeshwari, K.V.; Balakrishnan, M.; Kansal, A.; Lata, K.; Kishore, V.V.N. State-of-the-Art of Anaerobic Digestion Technology for Industrial Wastewater Treatment. Renew. Sustain. Energy Rev. 2000, 4, 135–156. [Google Scholar] [CrossRef]
  27. Stahl, D.A.; Amann, R.I. Development and Application of Nucleic Acid Probes. In Nucleic Acid Techniques in Bacterial Systematic; Stackbrandt, E., Goodfellow, M., Eds.; John Wiley & Sons: New York, NY, USA, 1991; pp. 205–248. [Google Scholar]
  28. Raskin, L.; Stromley, J.M.; Rittmann, B.E.; Stahl, D.A. Group-Specific 16S RRNA Hybridization Probes to Describe Natural Communities of Methanogens. Appl. Environ. Microbiol. 1994, 60, 1232–1240. [Google Scholar] [CrossRef] [Green Version]
  29. Litti, Y.V.; Serdyukov, D.V.; Kanunnikov, O.V.; Akselrod, V.A.; Loiko, N.G. Antimicrobial Properties of a Biocide Based on Quaternary Ammonium Compounds plus Polyhexamethylene Guanidine and Possible Methods for Its Deactivation. Appl. Biochem. Microbiol. 2021, 57, 962–972. [Google Scholar] [CrossRef]
  30. Wasielewski, S.; Morandi, C.G.; Mouarkech, K.; Minke, R.; Steinmetz, H. Impacts of Blackwater Co-Digestion on Biogas Production in the Municipal Wastewater Treatment Sector Using Pilot-Scale UASB and CSTR Reactors. Desalin. Water Treat 2017, 91, 121–128. [Google Scholar] [CrossRef] [Green Version]
  31. Wendland, C. Anaerobic Digestion of Blackwater and Kitchen Refuse, Technischen Universität Hamburg-Harburg zur Erlangung des Akademischen Grades; Technische Universität Hamburg: Hamburg, Germany, 2009. [Google Scholar]
  32. Reysset, M. Comprehensive Overview of Biogas for Sanitation Options—Training of Trainers. Gates Open Res. 2021, 5, 1–64. [Google Scholar] [CrossRef]
  33. Litti, Y.V.; Serdyukov, D.V.; Kanunnikov, O.V.; Axelrod, V.A.; Loiko, N.G. Treatment of Preserved Fecal Sludge Using Anaerobic Digestion. Ecol. Ind. Russ. 2020, 24, 33–37. [Google Scholar] [CrossRef]
  34. Krause, A.; Häfner, F.; Augustin, F.; Udert, K.M. Qualitative Risk Analysis for Contents of Dry Toilets Used to Produce Novel Recycling Fertilizers. Circ. Econ. Sustain. 2021, 1, 1107–1146. [Google Scholar] [CrossRef] [PubMed]
  35. Loiko, N.; Kanunnikov, O.; Serdyukov, D.; Axelrod, V.; Tereshkin, E.; Vishnyakova, A.; Litti, Y. Didecyldimethylammonium Chloride- and Polyhexamethylene Guanidine-Resistant Bacteria Isolated from Fecal Sludge and Their Potential Use in Biological Products for the Detoxification of Biocide-Contaminated Wastewater Prior to Conventional Biological Treatment. Biology 2022, 11, 1332. [Google Scholar] [CrossRef] [PubMed]
  36. Wang, X.; Duan, X.; Chen, J.; Fang, K.; Feng, L.; Yan, Y.; Zhou, Q. Enhancing Anaerobic Digestion of Waste Activated Sludge by Pretreatment: Effect of Volatile to Total Solids. Environ. Technol. 2016, 37, 1520–1529. [Google Scholar] [CrossRef] [PubMed]
  37. Świątczak, P.; Cydzik-Kwiatkowska, A. Performance and Microbial Characteristics of Biomass in a Full-Scale Aerobic Granular Sludge Wastewater Treatment Plant. Environ. Sci. Pollut. Res. 2018, 25, 1655–1669. [Google Scholar] [CrossRef] [PubMed] [Green Version]
  38. Alcántara-Hernández, R.J.; Taş, N.; Carlos-Pinedo, S.; Durán-Moreno, A.; Falcón, L.I. Microbial Dynamics in Anaerobic Digestion Reactors for Treating Organic Urban Residues during the Start-up Process. Lett. Appl. Microbiol. 2017, 64, 438–445. [Google Scholar] [CrossRef]
  39. McHugh, S.; Carton, M.; Mahony, T.; O’Flaherty, V. Methanogenic Population Structure in a Variety of Anaerobic Bioreactors. FEMS Microbiol. Lett. 2003, 219, 297–304. [Google Scholar] [CrossRef] [Green Version]
  40. Zieliński, M.; Zielińska, M.; Cydzik-Kwiatkowska, A.; Rusanowska, P.; Dębowski, M. Effect of Static Magnetic Field on Microbial Community during Anaerobic Digestion. Bioresour. Technol. 2021, 323, 124600. [Google Scholar] [CrossRef]
  41. Mata-Alvarez, J.; Macé, S.; Llabrés, P. Anaerobic Digestion of Organic Solid Wastes. An Overview of Research Achievements and Perspectives. Bioresour. Technol. 2000, 74, 3–16. [Google Scholar] [CrossRef]
  42. Dębowski, M.; Kazimierowicz, J.; Zieliński, M.; Bartkowska, I. Co-Fermentation of Microalgae Biomass and Miscanthus × Giganteus Silage—Assessment of the Substrate, Biogas Production and Digestate Characteristics. Appl. Sci. 2022, 12, 7291. [Google Scholar] [CrossRef]
  43. Kazimierowicz, J. Organic Waste Used in Agricultural Biogas Plants. J. Ecol. Eng. 2014, 15, 88–92. [Google Scholar] [CrossRef]
  44. Abbas, Y.; Yun, S.; Mehmood, A.; Shah, F.A.; Wang, K.; Eldin, E.T.; Al-Qahtani, W.H.; Ali, S.; Bocchetta, P. Co-Digestion of Cow Manure and Food Waste for Biogas Enhancement and Nutrients Revival in Bio Circular Economy. Chemosphere 2022, 311, 137018. [Google Scholar] [CrossRef] [PubMed]
  45. Rwigema, A. Safety and Nutrient Values (NPK) of Bio-Effluent from Human Excreta Used to Feed Biogas Plants in Rwanda. Rwanda J. Eng. Sci. Technol. Environ. 2019, 2, 1–12. [Google Scholar] [CrossRef]
  46. Nakarmi, A.; Karki, A.B. Biogas as Renewable Source of Energy in Nepal: Theory and Development; Alternative Energy Promotion Centre: Kathmandu, Nepal; Biogas Sector Partnership–Nepal: Kathmandu, Nepal, 2005. [Google Scholar]
  47. Warnars, L. Bioslurry: A Supreme Fertiliser Positive Effects of Bioslurry on Crops. In Proceedings of the Practitioners’ Track, IFOAM Organic World Congress 2014, ‘Building Organic Bridges’, Istanbul, Turkey, 13–15 October 2014. [Google Scholar]
  48. Yerizam, M.; Norfhairna, N.; Margaretty, E.; Hajar, I.; Meilianti, M.; Supraptiah, E.; Silviyati, I.; Salsabila, J. Liquid Organic Fertilizer Production from Kersen Leaves (Muntingia calabura L.) and Eggshells with Addition of Spoiled Rice Local Microorganism (Mol) Bioactivator. In Proceedings of the 5th FIRST T1 T2 2021 International Conference (FIRST-T1-T2 2021), Paris, France, 26–28 October 2022; Volume 9, pp. 426–430. [Google Scholar] [CrossRef]
  49. Radhakrishnan, R.; Banerjee, S.; Banerjee, S.; Singh, V.; Das, D. Sustainable Approach for the Treatment of Poultry Manure and Starchy Wastewater by Integrating Dark Fermentation and Microalgal Cultivation. J. Mater. Cycles Waste Manag. 2021, 23, 790–803. [Google Scholar] [CrossRef]
Figure 1. Biogas and methane production vs. CTS% in the feedstock.
Applsci 13 00818 g001
Figure 2. Correlations between (a) CTS in the feedstock and feedstock/digestate toxicity, (b) feedstock toxicity and biogas/CH4 production.
Applsci 13 00818 g002
Figure 3. Correlations between (a) CTS in the feedstock and the contribution of basic taxonomic groups of methanogens, (b) the contribution of individual taxonomic groups of methanogens and CH4 in the biogas.
Applsci 13 00818 g003
Figure 4. Correlations between (a) CTS in the feedstock and VFA/total alkalinity, (b) FOS/TAC and specific biogas/CH4 production.
Applsci 13 00818 g004
Figure 5. Correlations between (a) toxicity and portion digested, (b) portion digested and specific biogas/CH4 production.
Applsci 13 00818 g005
Table 1. Profile of the maize silage and anaerobic sludge.
ParameterUnitValue
Maize SilageAnaerobic Sludge
Dry matter (TS)%30.2 ± 0.89.8 ± 0.2
Organic dry matter (VS)% TS89.0 ± 0.668.5 ± 2.5
Mineral dry matter (MS)% TS11.0 ± 1.331.5 ± 2.5
Total nitrogen (TN)mg/g TS11.1 ± 0.933.1 ± 3.3
Total phosphorus (TP)mg/g TS2.4 ± 0.31.7 ± 0.2
Total carbon (TC)mg/g TS460 ± 13309 ± 28
Total organic carbon (TOC)mg/g TS441 ± 15199 ± 34
C:N ratio-39.6 ± 1.69.3 ± 0.1
pH-7.73 ± 0.087.21 ± 0.31
Protein% TS9.2 ± 0.620.7 ± 2.8
Lipids% TS2.2 ± 0.53.1 ± 0.5
Sugars% TS60.4 ± 1.01.6 ± 0.4
Table 2. Profile of the chemical toilet sewage used in the experiment.
ParameterUnitValue
pHpH8.05 ± 0.74
BOD5mg O2/dm34645 ± 330
CODmg O2/dm313860 ± 920
TOCmg O2/dm310350 ± 270
TNmg Ntotal/dm32240 ± 230
Organic nitrogenmg N/dm32150 ± 240
Ammoniacal nitrogenmg N-NH4/dm390 ± 50
Nitric nitrogenmg N-NO3/dm32.20 ± 0.93
Nitrite nitrogen mg N-NO2/dm30.12 ± 0.02
TPmg Ptotal/dm3202 ± 61
Orthophosphatesmg P-PO4/dm3129 ± 33
Dry residuemg/dm312.5 ± 2.2
ChloridesmgCl/dm3574 ± 62
SulfatesmgSO4/dm30.39 ± 0.12
Lipidsmg/dm3184 ± 36
Table 3. Feedstock volumes and key process parameters.
VariantReactor Volume
(dm3)
OLR
(gVS/dm3·Day)
VS Load
(gVS/Day)
Maize Silage Weight
(g/Day)
Maize Silage Volume (at 70% Water Content)
(cm3)
Maize Silage Volume (at 90% Water Content) (cm3)Water Volume (cm3)CTS Volume (cm3)HRT
(doba)
Temperature
(°C)
122.24.416.53310067.00.02038
260.36.7
353.613.4
446.920.1
540.226.8
633.533.5
726.840.2
Table 4. Specific biogas and methane production indicators by variant.
ParameterIndicatorVariant
1234567
Biogascm3/gVS390 ± 44411 ± 37425 ± 39384 ± 37361 ± 48211 ± 46190 ± 39
cm3/gTS347 ± 39366 ± 33378 ± 35342 ± 33321 ± 43188 ± 41169 ± 34
cm3/gFM105 ± 12110 ± 10114 ± 11103 ± 1097 ± 1357 ± 1251 ± 10
cm3/day1716 ± 1921808 ± 1611870 ± 1721690 ± 1631588 ± 213928 ± 202836 ± 170
Methane%CH459 ± 3.157 ± 2.658 ± 1.455 ± 2.747 ± 3.940 ± 4.139 ± 3.4
cm3CH4/gVS230 ± 26234 ± 21247 ± 23211 ± 20170 ± 2384.4 ± 1874.1 ± 15
cm3CH4/gTS205 ± 23209 ± 19219 ± 20188 ± 18151 ± 2075.1 ± 1665.9 ± 13
cm3CH4/gFM61.8 ± 6.963.0 ± 5.666.3 ± 6.156.8 ± 5.545.6 ± 6.122.7 ± 4.919.9 ± 4.1
cm3CH4/day1012 ± 1131031 ± 921085 ± 100929 ± 90747 ± 100371 ± 81326 ± 66
Table 5. Percentage contribution of basic taxonomic groups in the anaerobic bacterial community (by experimental variant).
Taxonomic GroupVariant
1234567
Bacteria (EUB338)69 ± 470 ± 671 ± 369 ± 468 ± 569 ± 270 ± 4
Archaea (ARC915)27 ± 224 ± 226 ± 319 ± 117 ± 212 ± 313 ± 3
Methanosarcinaceae (MSMX860)12 ± 113 ± 313 ± 210 ± 111 ± 29 ± 29 ± 1
Methanosaeta (MX825)9 ± 29 ± 28 ± 14 ± 15 ± 12 ± 13 ± 2
Table 6. VFAs, total alkalinity, FOS/TAC and pH in the digesters (by variant).
IndicatorVFATotal AlkalinityFOS/TACpH
UnitmgCH3COOH/dm3mgCaCO3/dm3--
Variant11680 ± 1215250 ± 3400.32 ± 0.027.21 ± 0.07
21695 ± 1565136 ± 4700.33 ± 0.047.34 ± 0.02
31715 ± 1605717 ± 5330.30 ± 0.017.28 ± 0.04
41920 ± 2104923 ± 5380.39 ± 0.026.89 ± 0.11
52310 ± 1415372 ± 3280.43 ± 0.046.42 ± 0.19
62780 ± 1595450 ± 3120.51 ± 0.036.21 ± 0.13
72840 ± 1805358 ± 3400.53 ± 0.026.11 ± 0.14
Table 7. TS, VS and fertilizing substances in the digestate (by variant).
VariantPARAMETER
Phosphorus
(mgP/gTS)
Nitrogen
(mgN/gTS)
Calcium
(mgCa/gTS)
Magnesium
(mgMg/gTS)
Potassium
(mgK/gTS)
TS
(%)
VS
(% TS)
η F
(%)
12.46 ± 0.908.42 ± 1.7129.43 ± 3.121.66 ± 0.343.8 ± 0.912.4 ± 1.168.2 ± 0.968.5 ± 1.0
22.62 ± 1.129.76 ± 1.3231.47 ± 5.531.39 ± 0.424.1 ± 0.611.7 ± 0.969.7 ± 1.469.7 ± 1.1
32.37 ± 0.738.63 ± 2.6332.61 ± 5.921.47 ± 0.773.6 ± 1.313.9 ± 1.868.9 ± 1.764.4 ± 1.8
42.50 ± 0.468.11 ± 1.4733.65 ± 3.271.19 ± 0.313.5 ± 0.911.2 ± 0.670.3 ± 0.870.7 ± 0.5
52.19 ± 0.3810.73 ± 1.8132.79 ± 4.321.82 ± 0.724.4 ± 1.112.7 ± 1.171.1 ± 2.366.4 ± 1.7
62.13 ± 0.619.91 ± 2.2729.62 ± 3.851.50 ± 0.534.0 ± 1.010.9 ± 1.272.6 ± 1.470.6 ± 1.3
72.43 ± 0.2111.62 ± 0.6930.25 ± 5.231.71 ± 0.213.8 ± 0.511.4 ± 0.871.4 ± 2.569.7 ± 1.7
Disclaimer/Publisher’s Note: The statements, opinions and data contained in all publications are solely those of the individual author(s) and contributor(s) and not of MDPI and/or the editor(s). MDPI and/or the editor(s) disclaim responsibility for any injury to people or property resulting from any ideas, methods, instructions or products referred to in the content.

