
Behavior of Confined Headed Bar Connection for Precast Reinforced Concrete Member Assembly

Abstract
:1. Introduction
2. Experimental Program
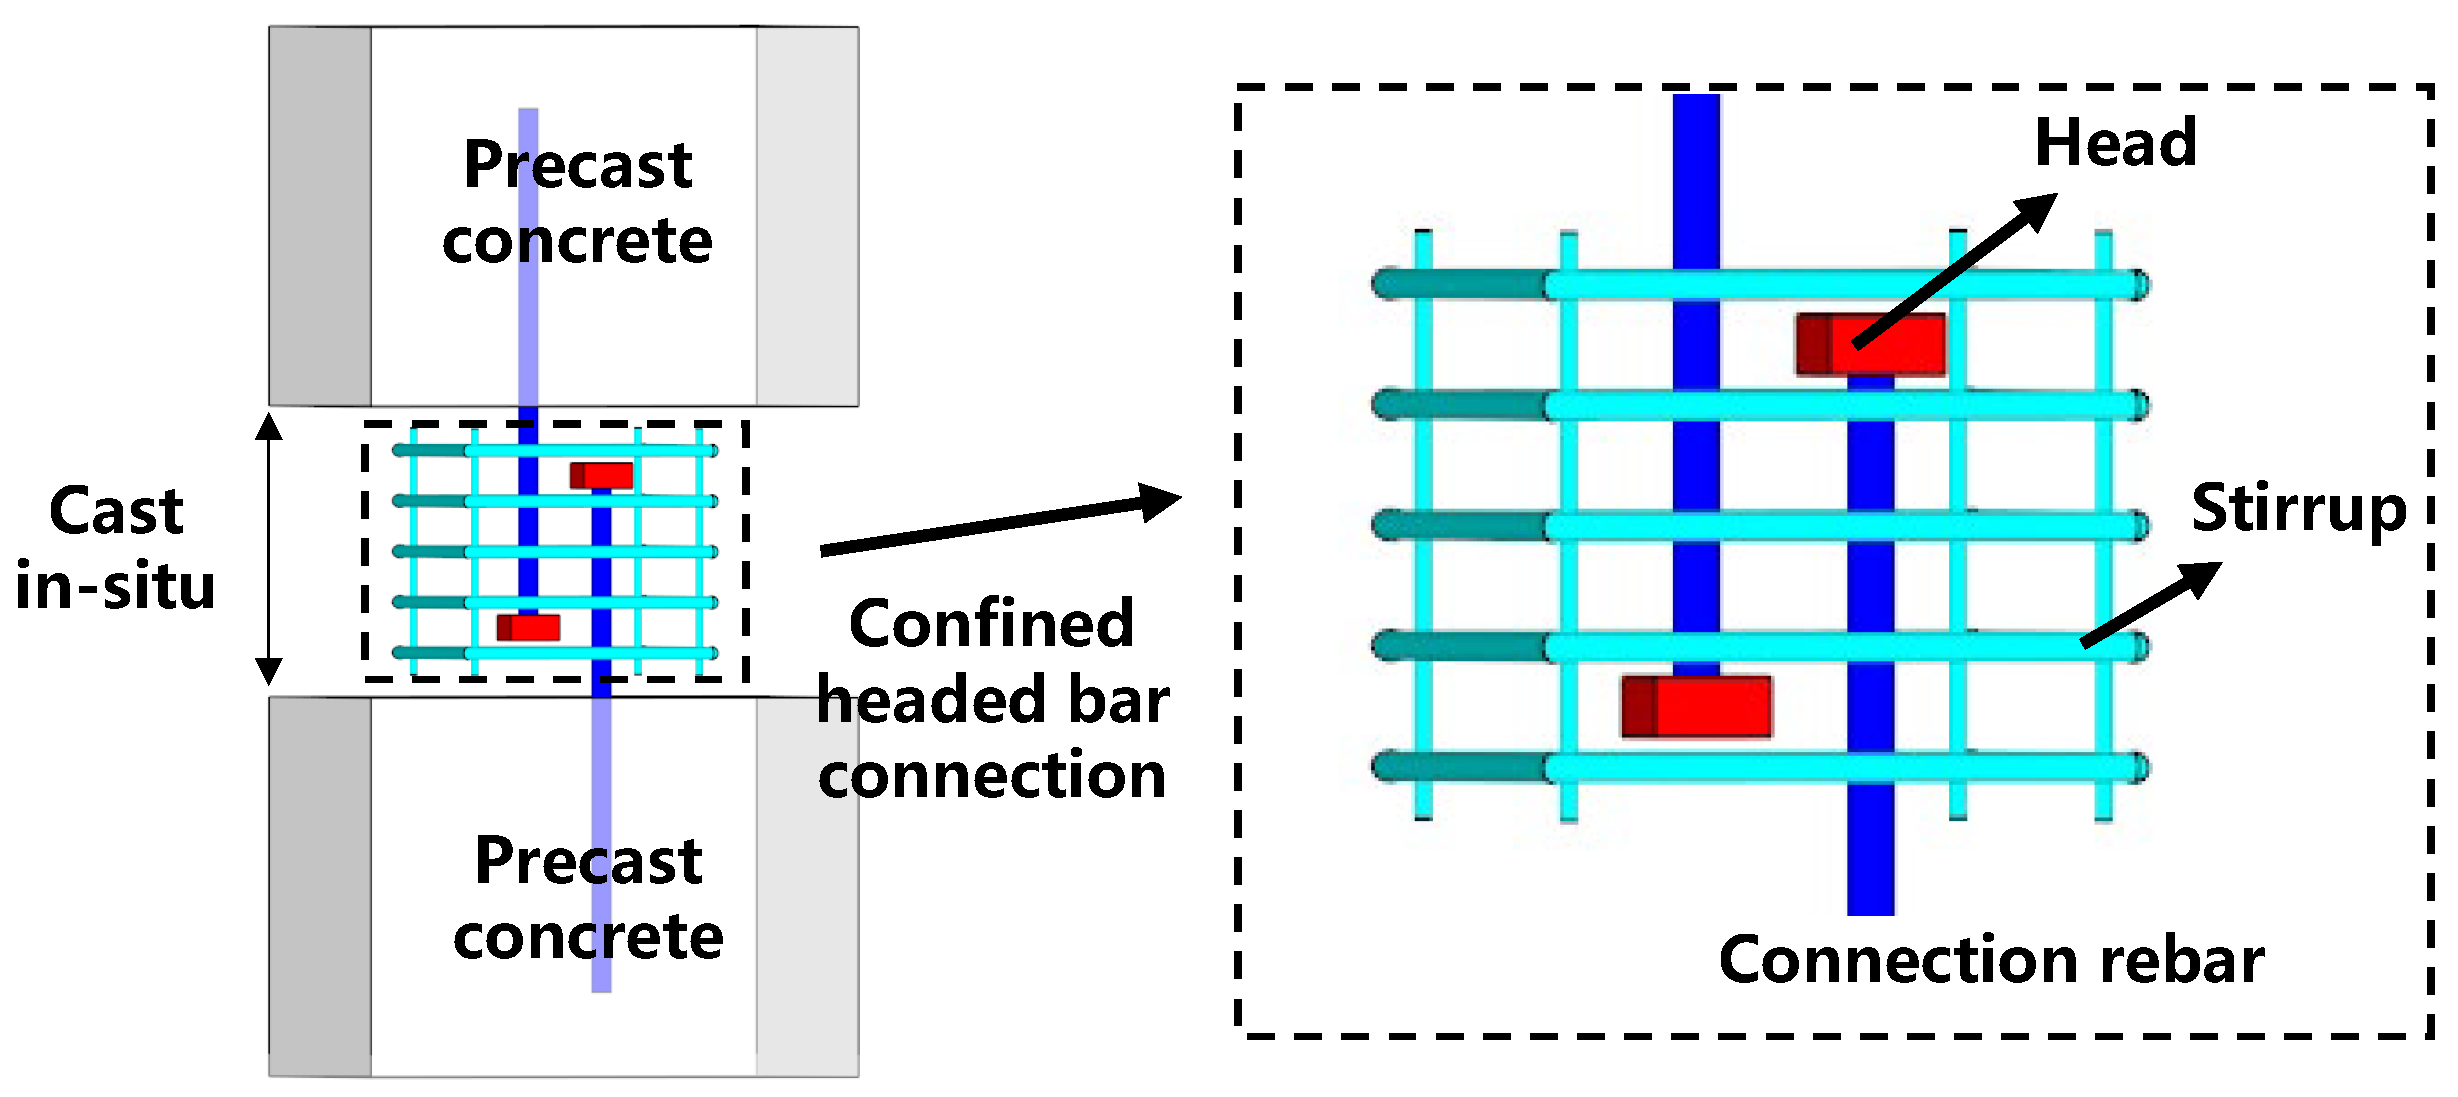
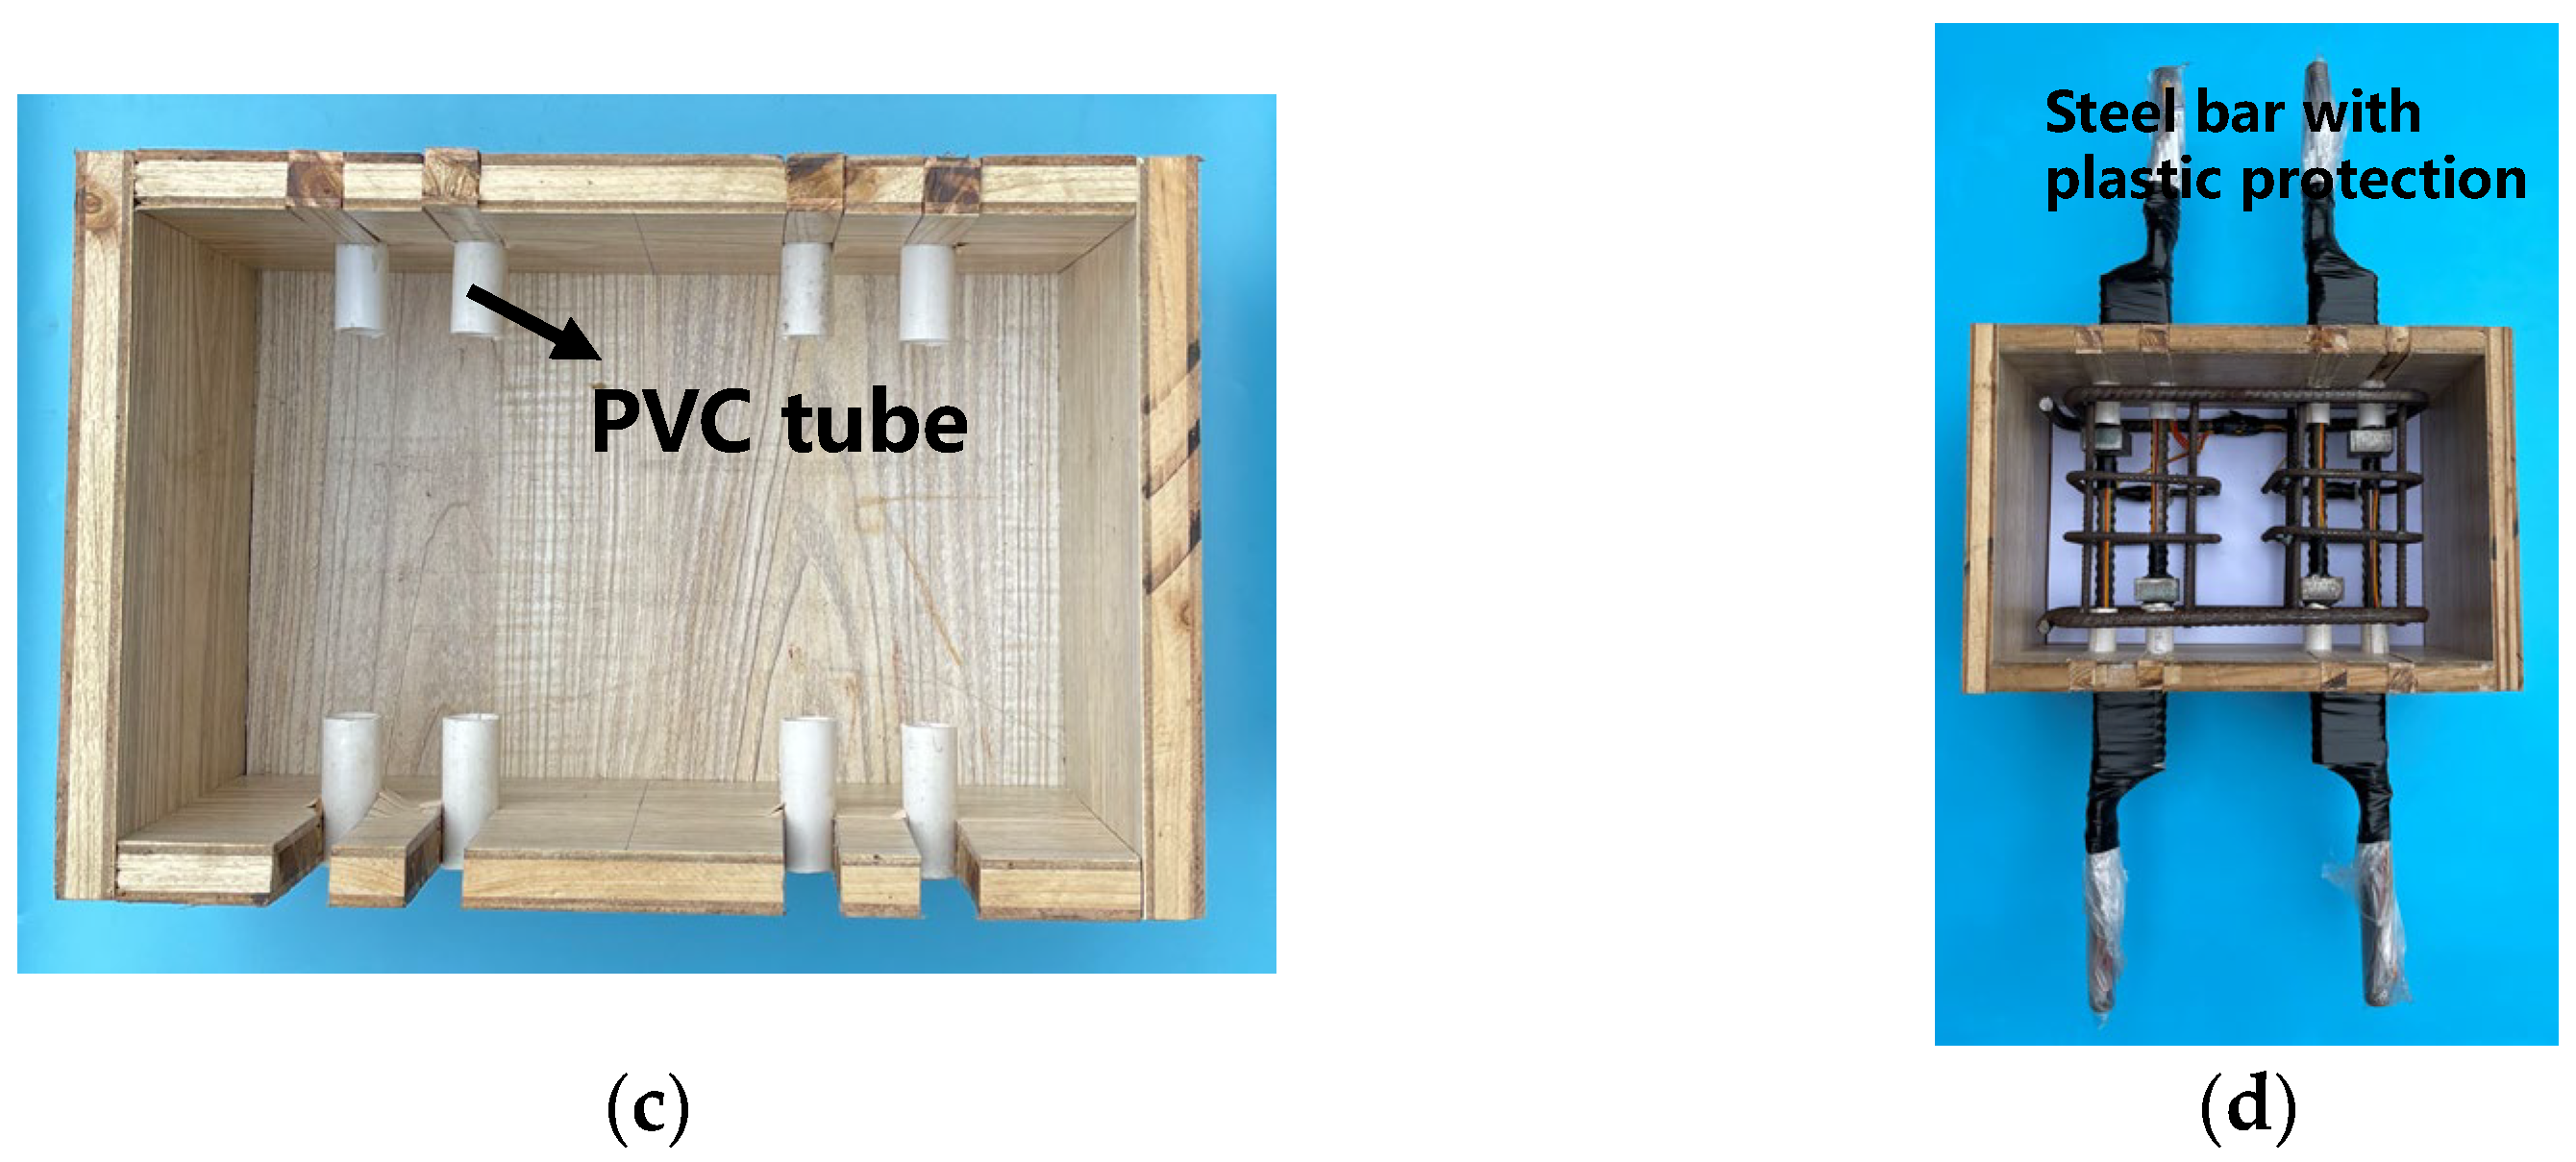
2.1. Specimen Design and Preparation
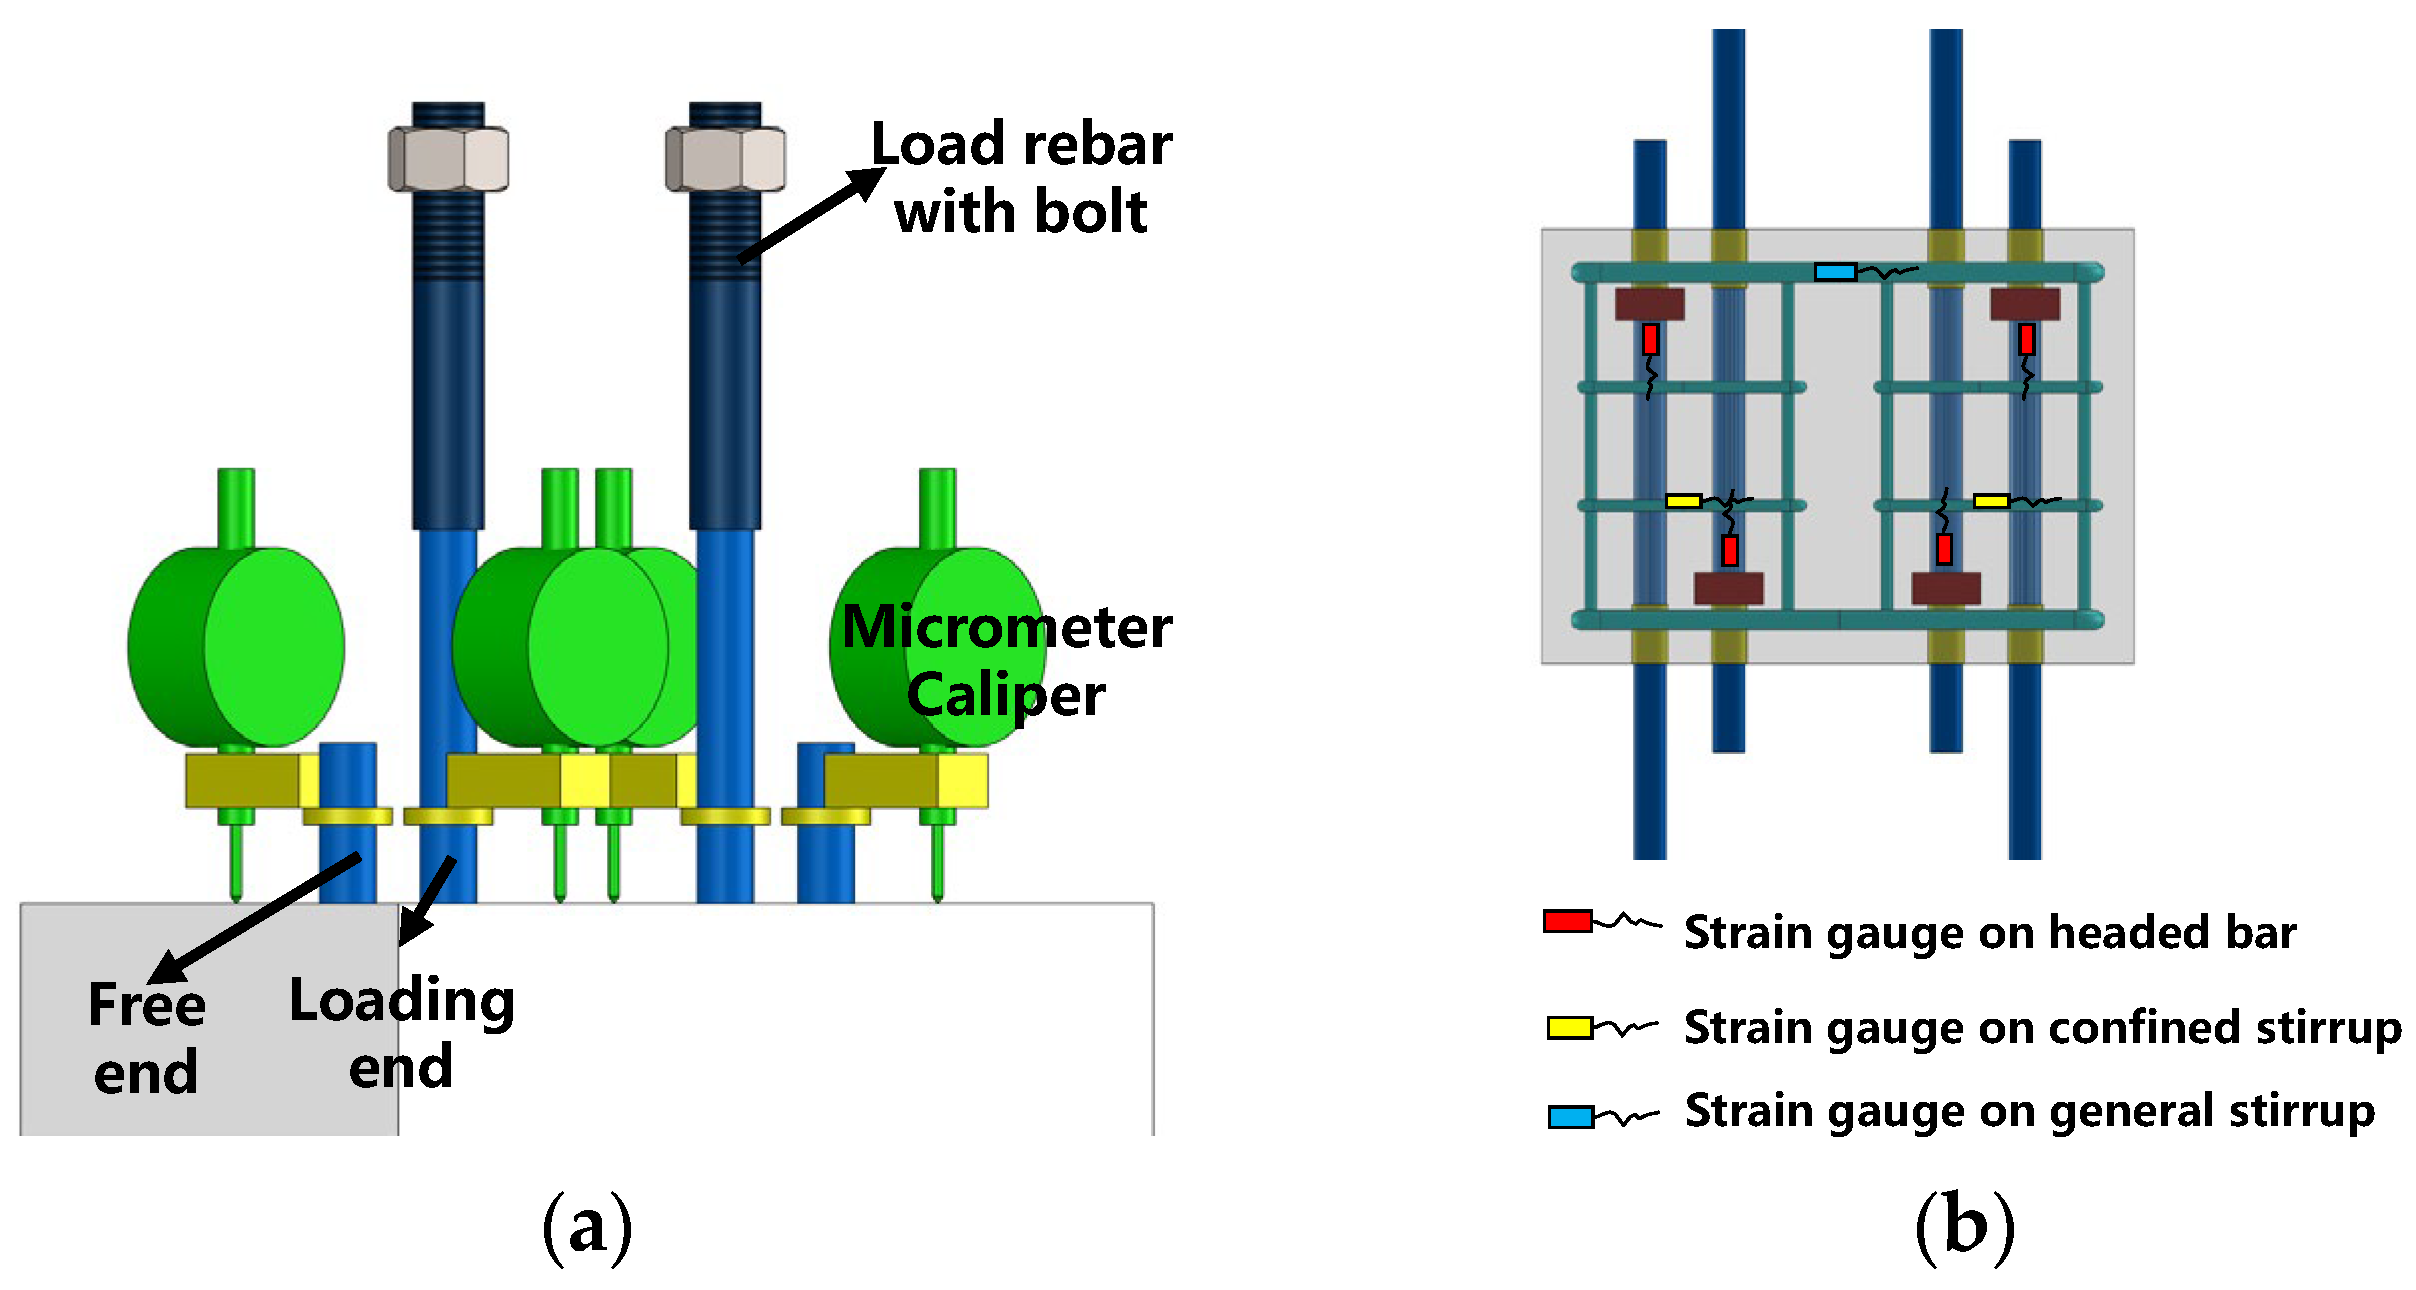
2.2. Test Setup and Loading Scheme
2.3. Materials
3. Experimental Results
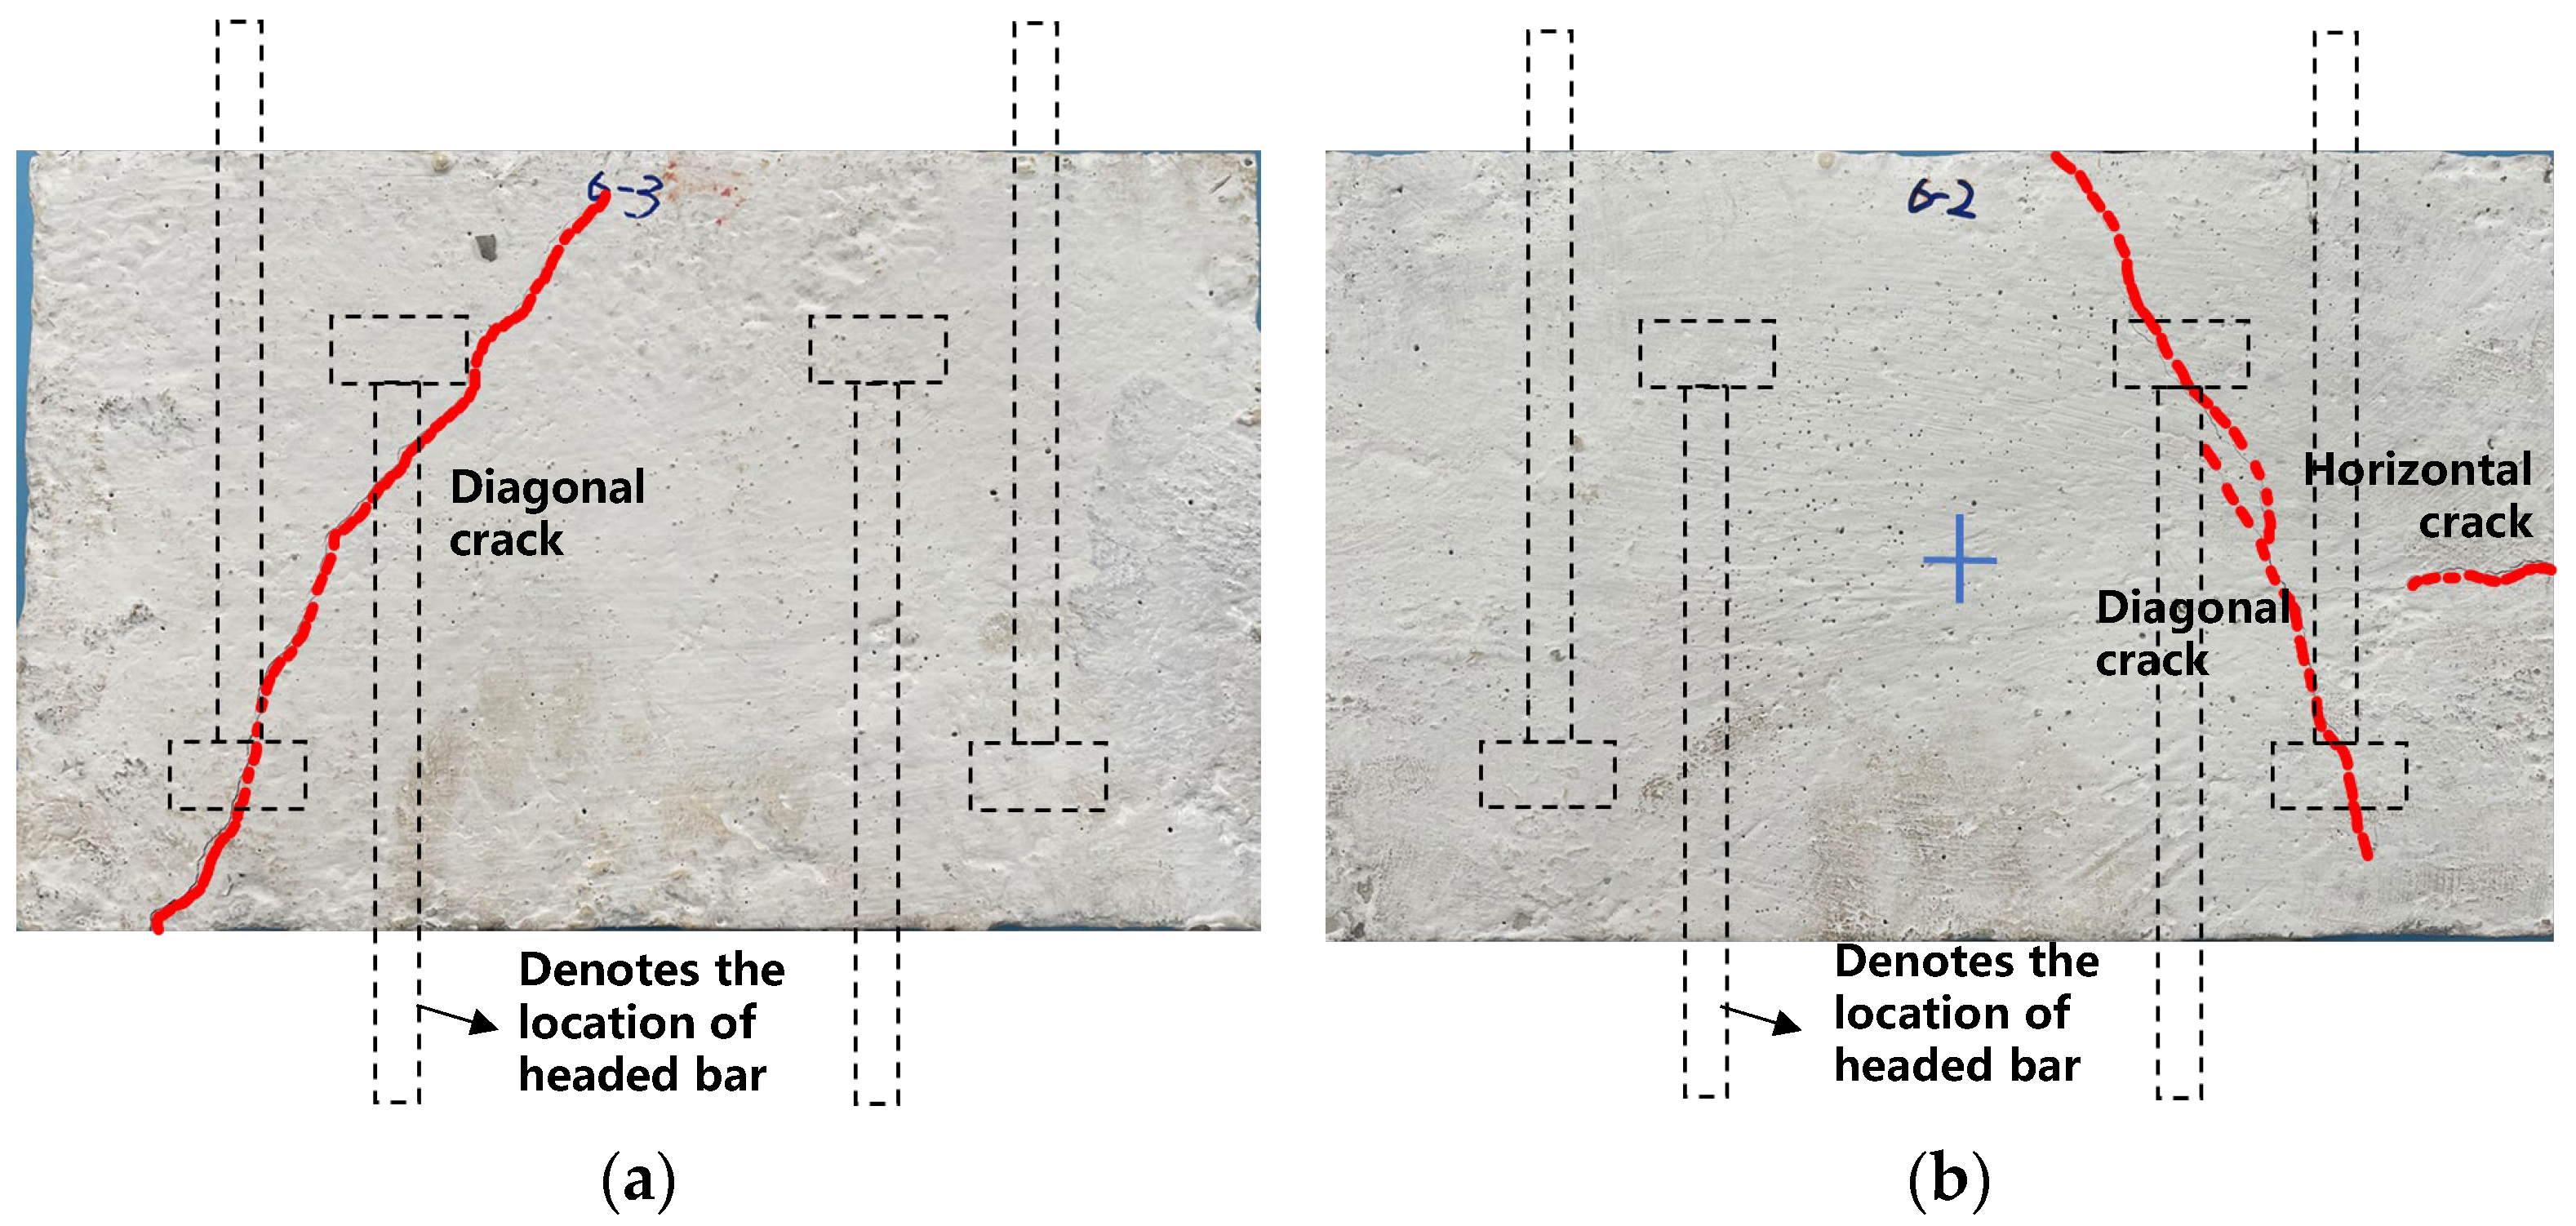
3.1. Overall Behavior and Failure Modes
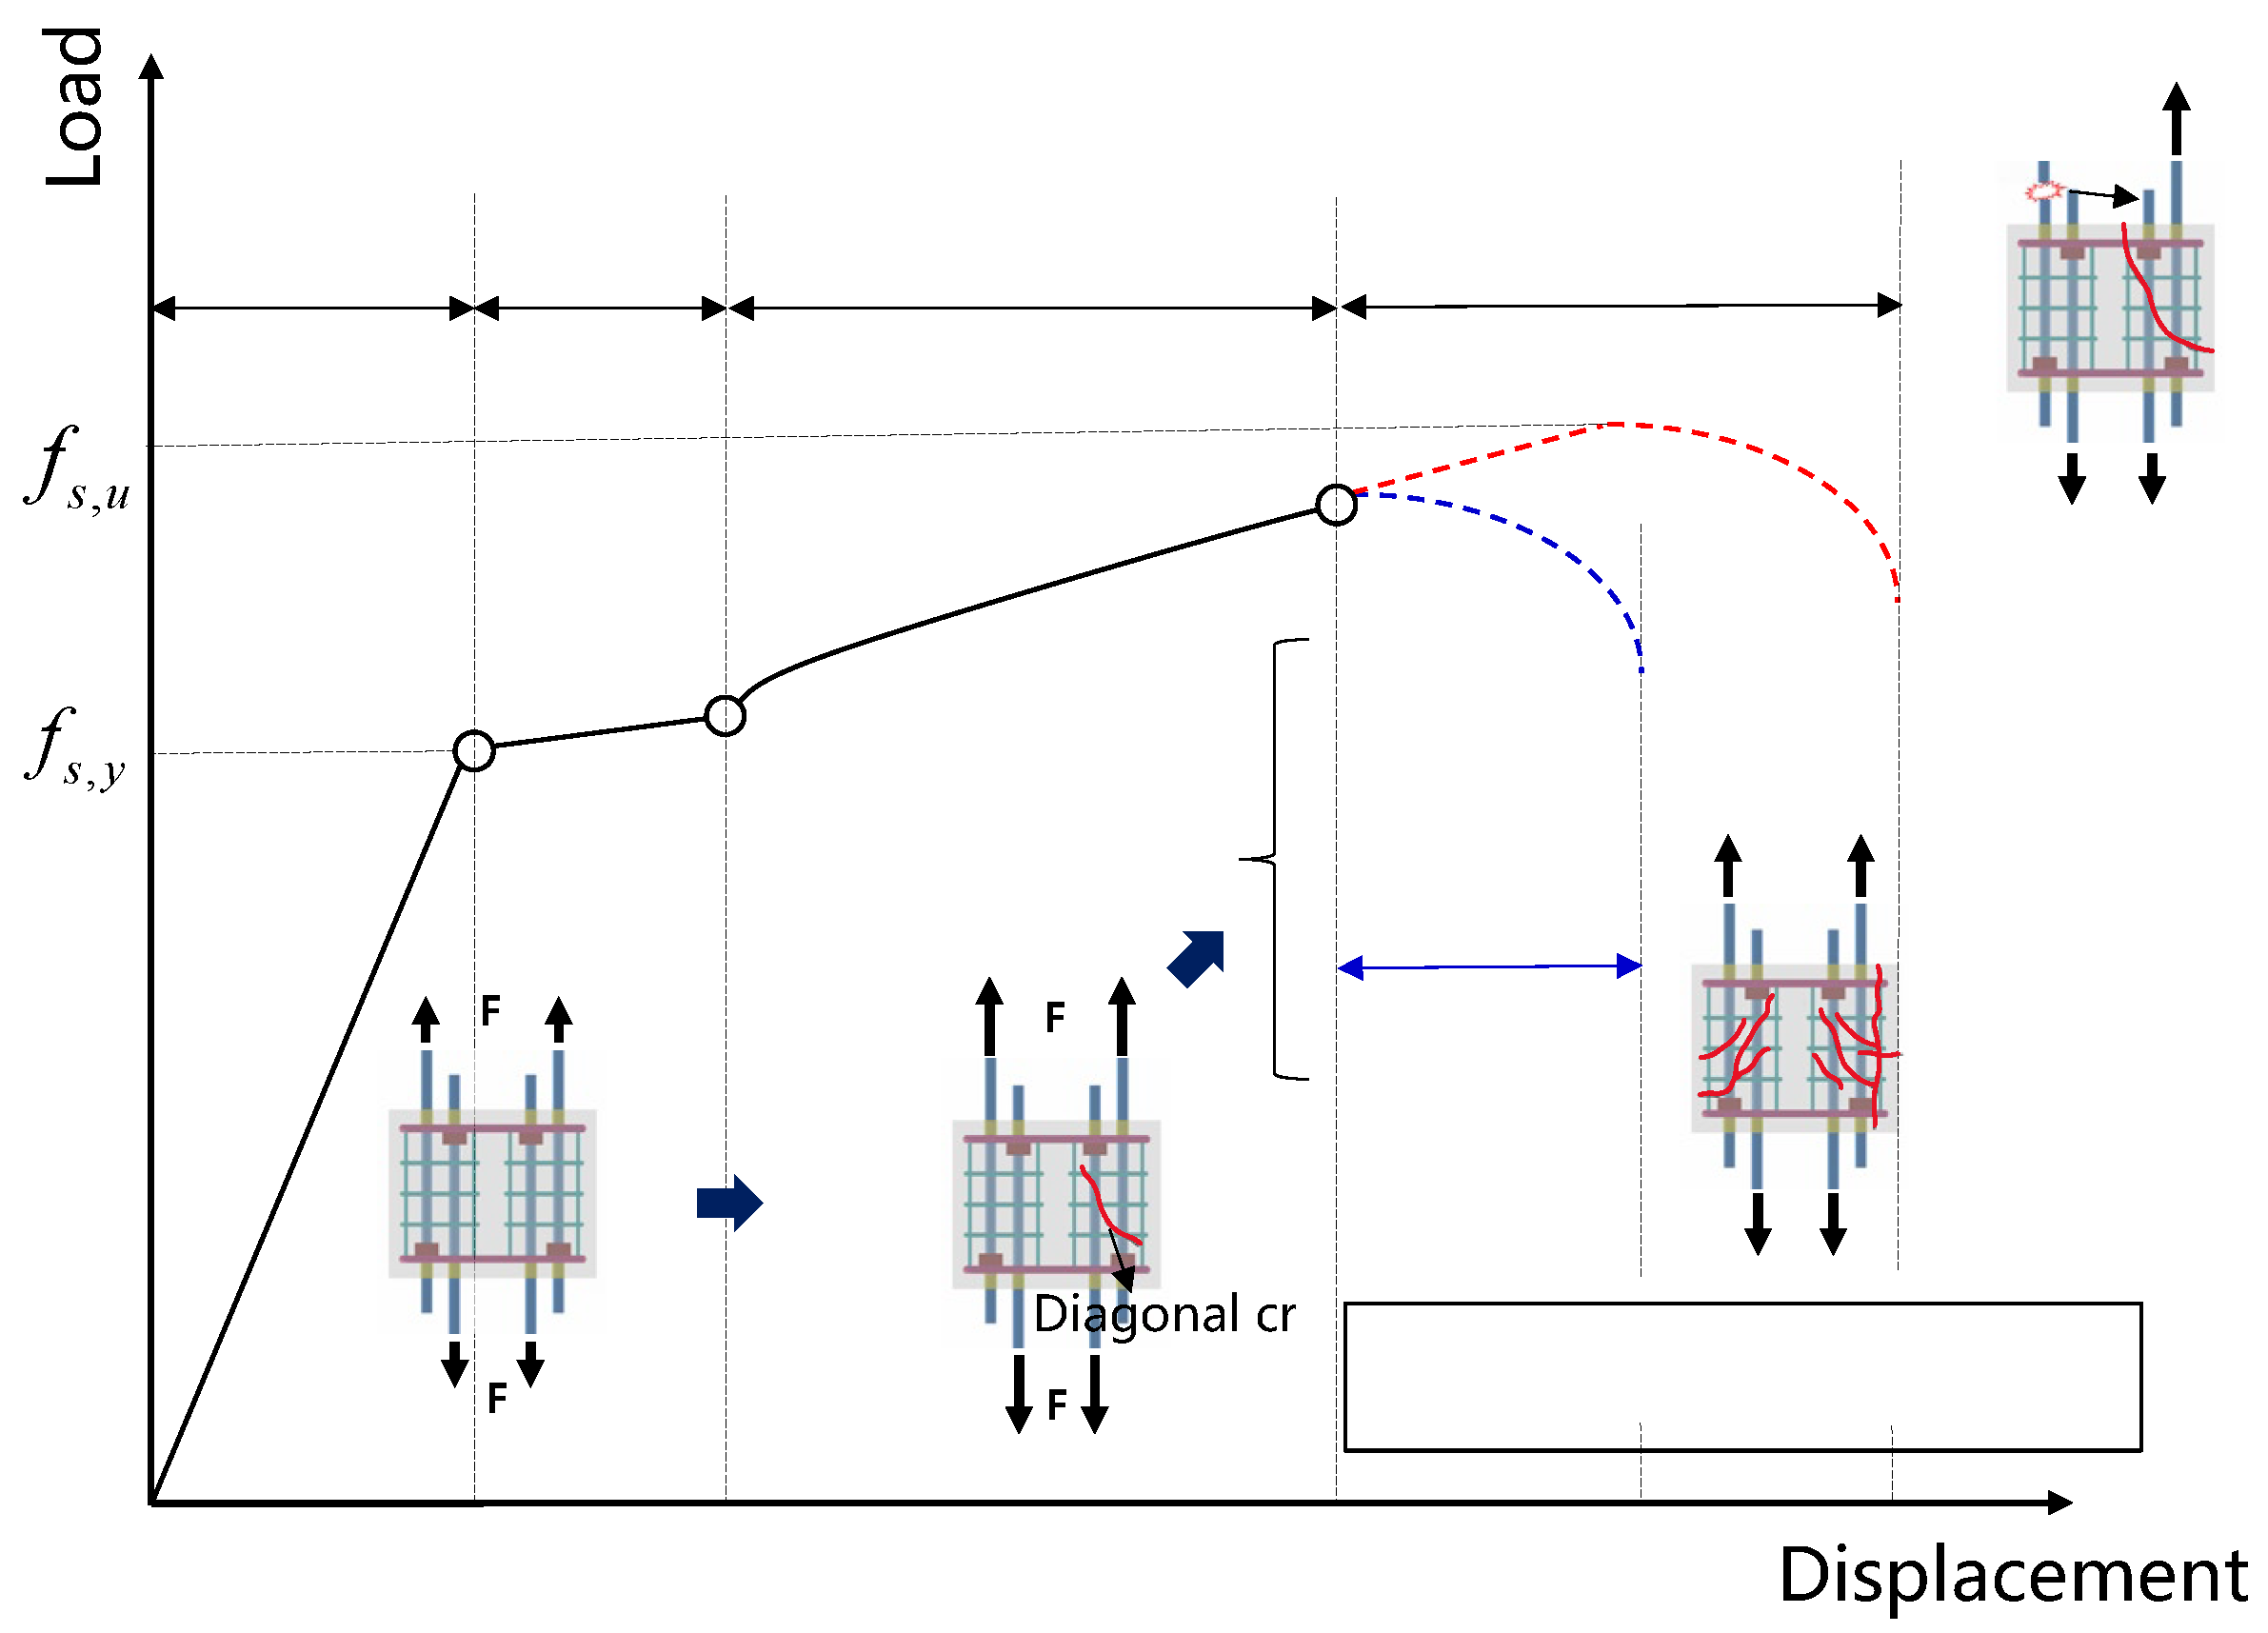
3.2. Load–Displacement Response
3.3. Effects of Main Variables on Bearing Capacity
3.3.1. Lap Length
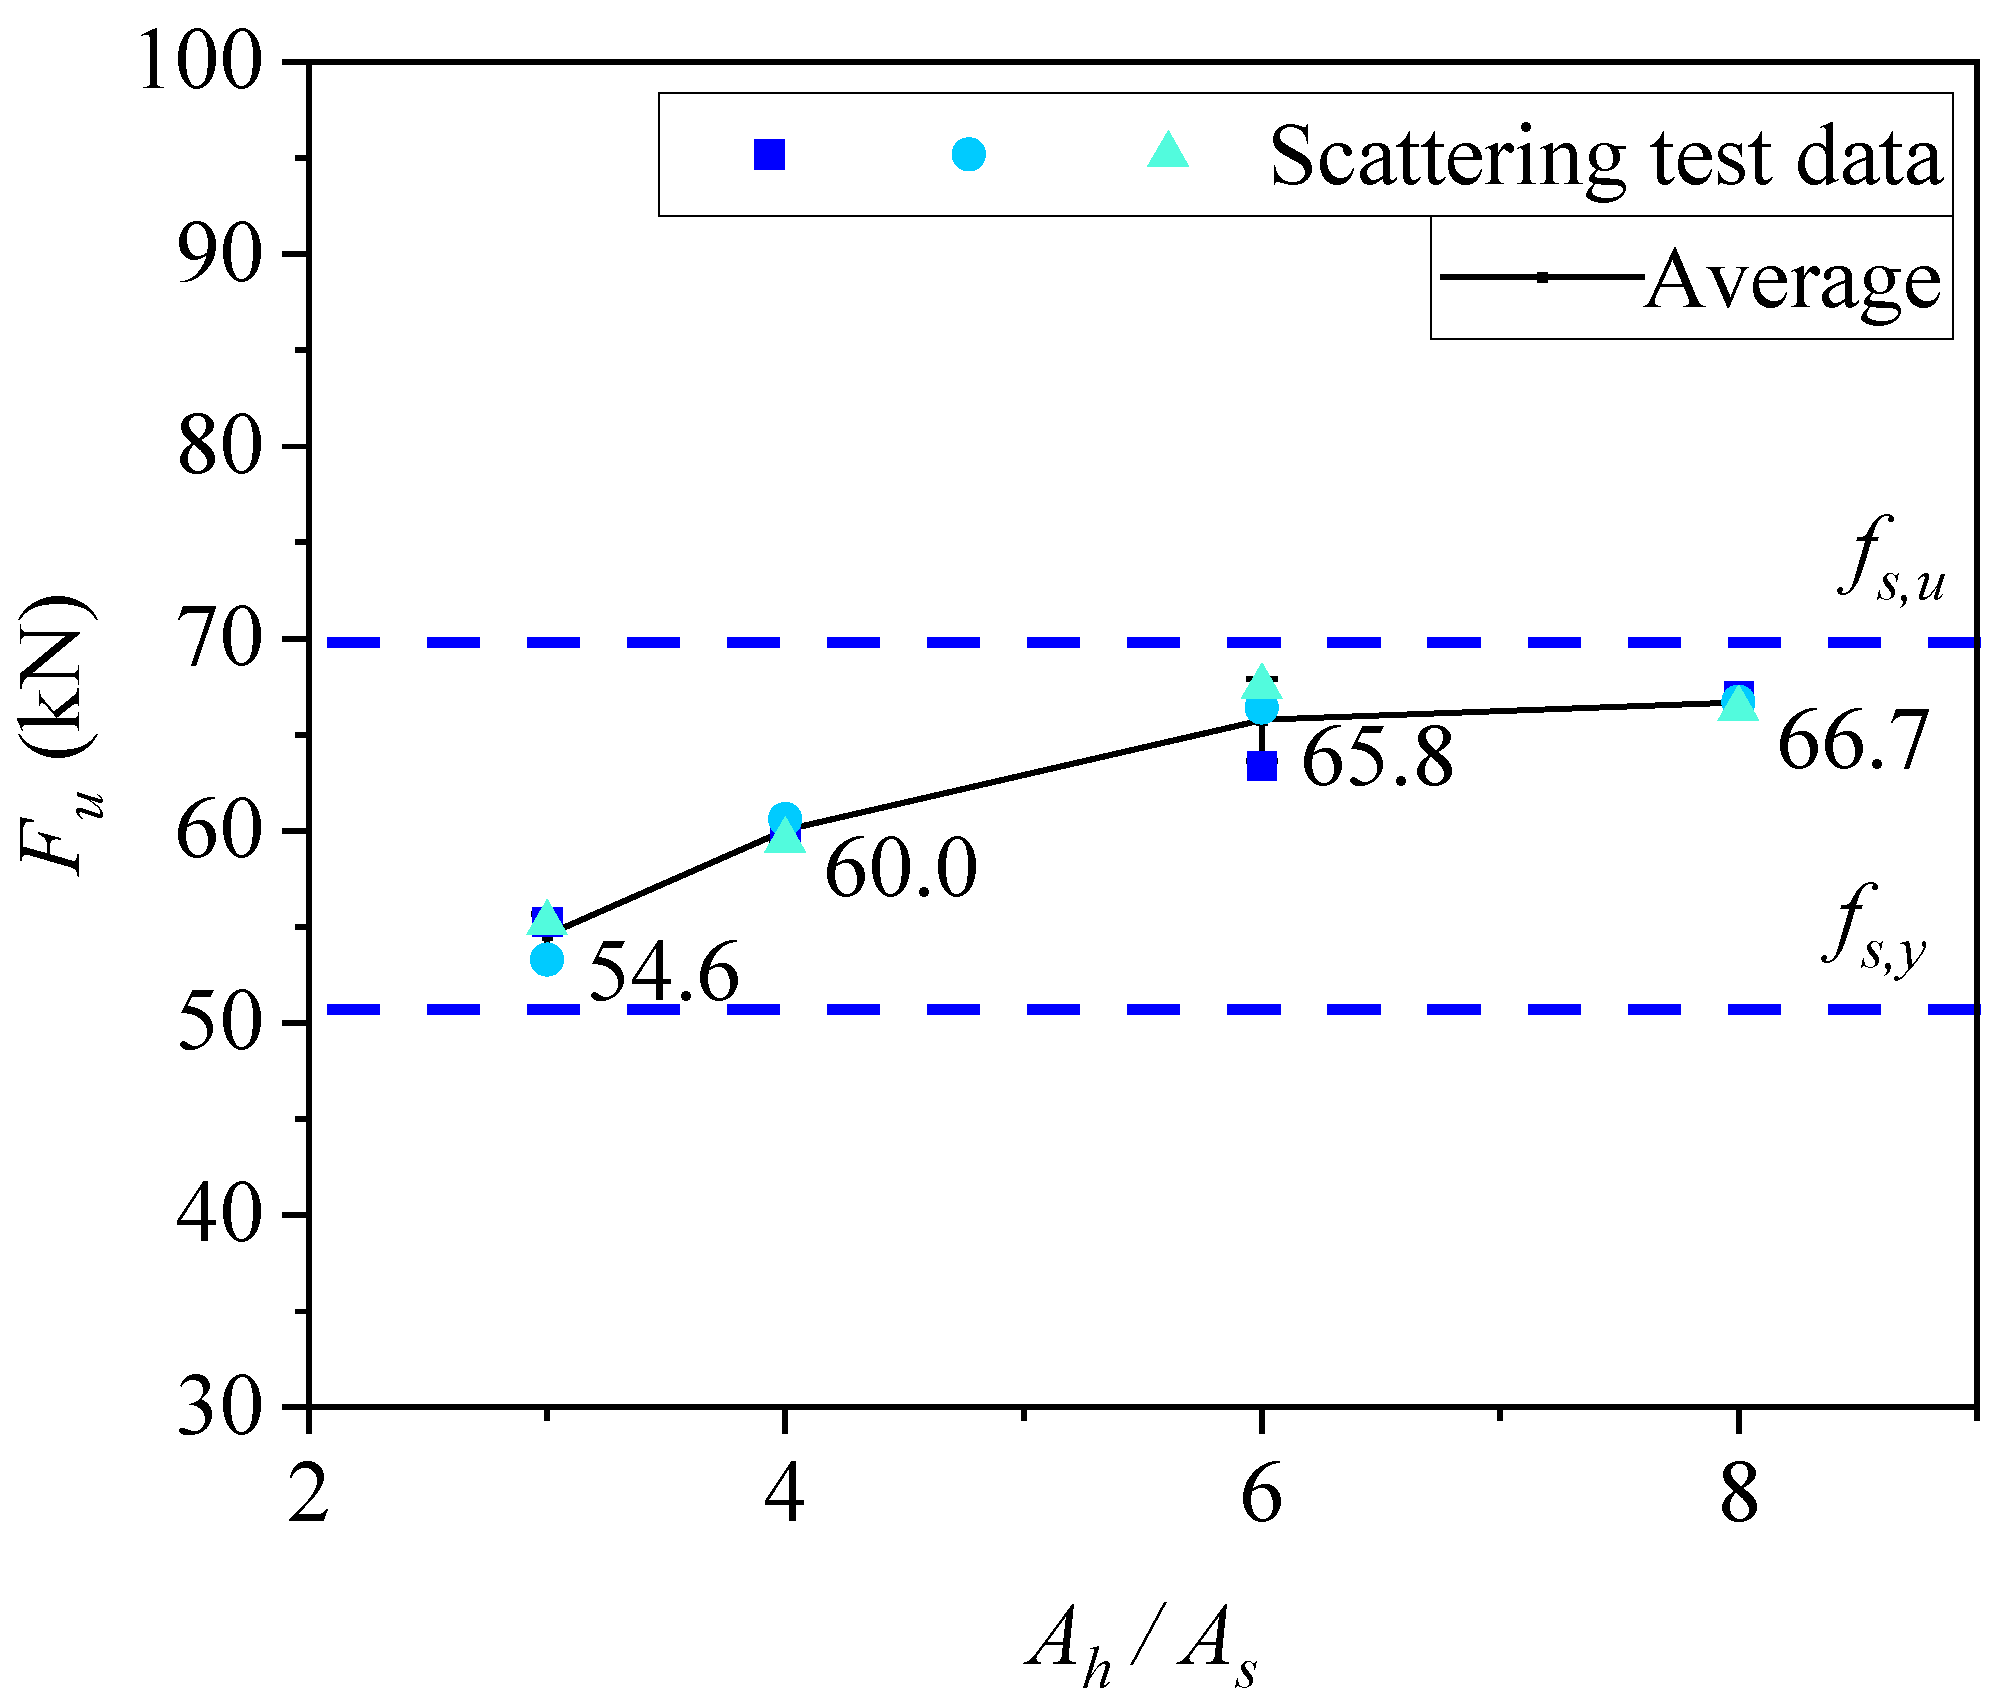
3.3.2. Head Size
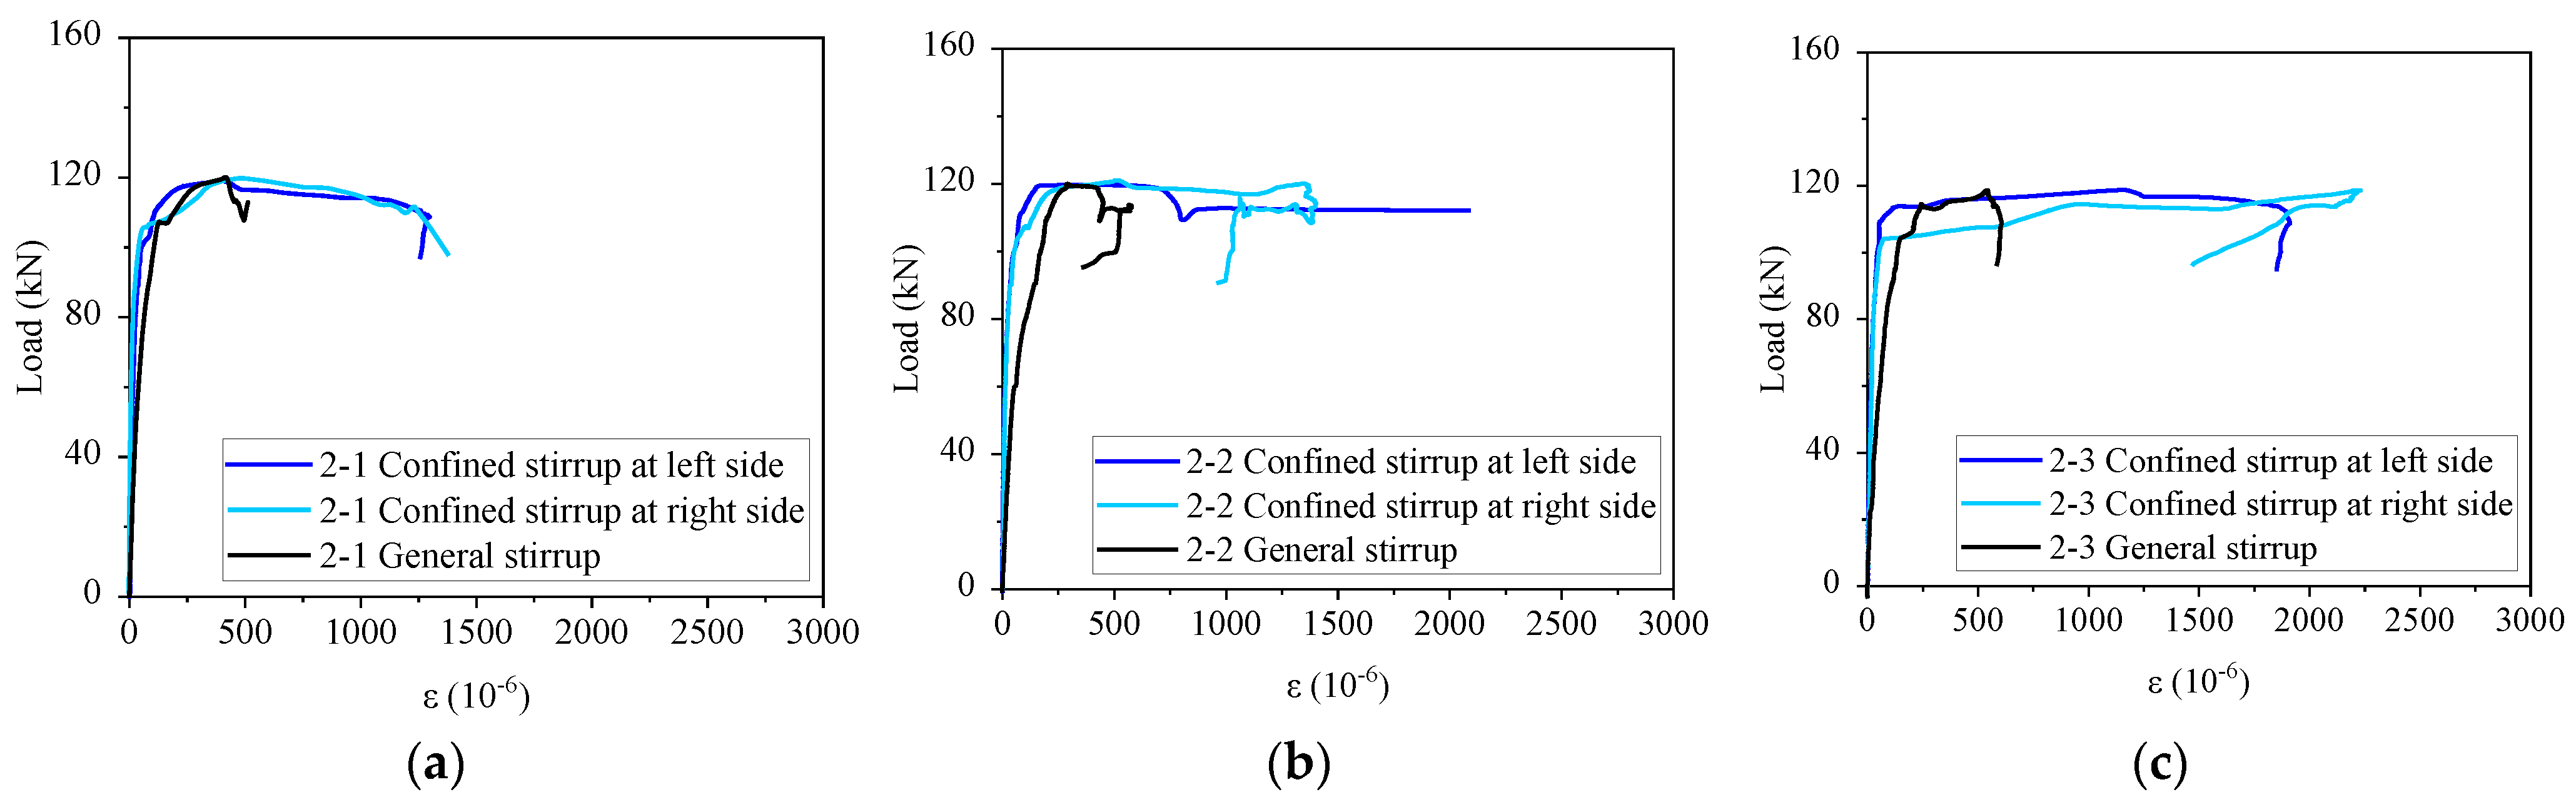
3.4. Strain Development of Stirrup
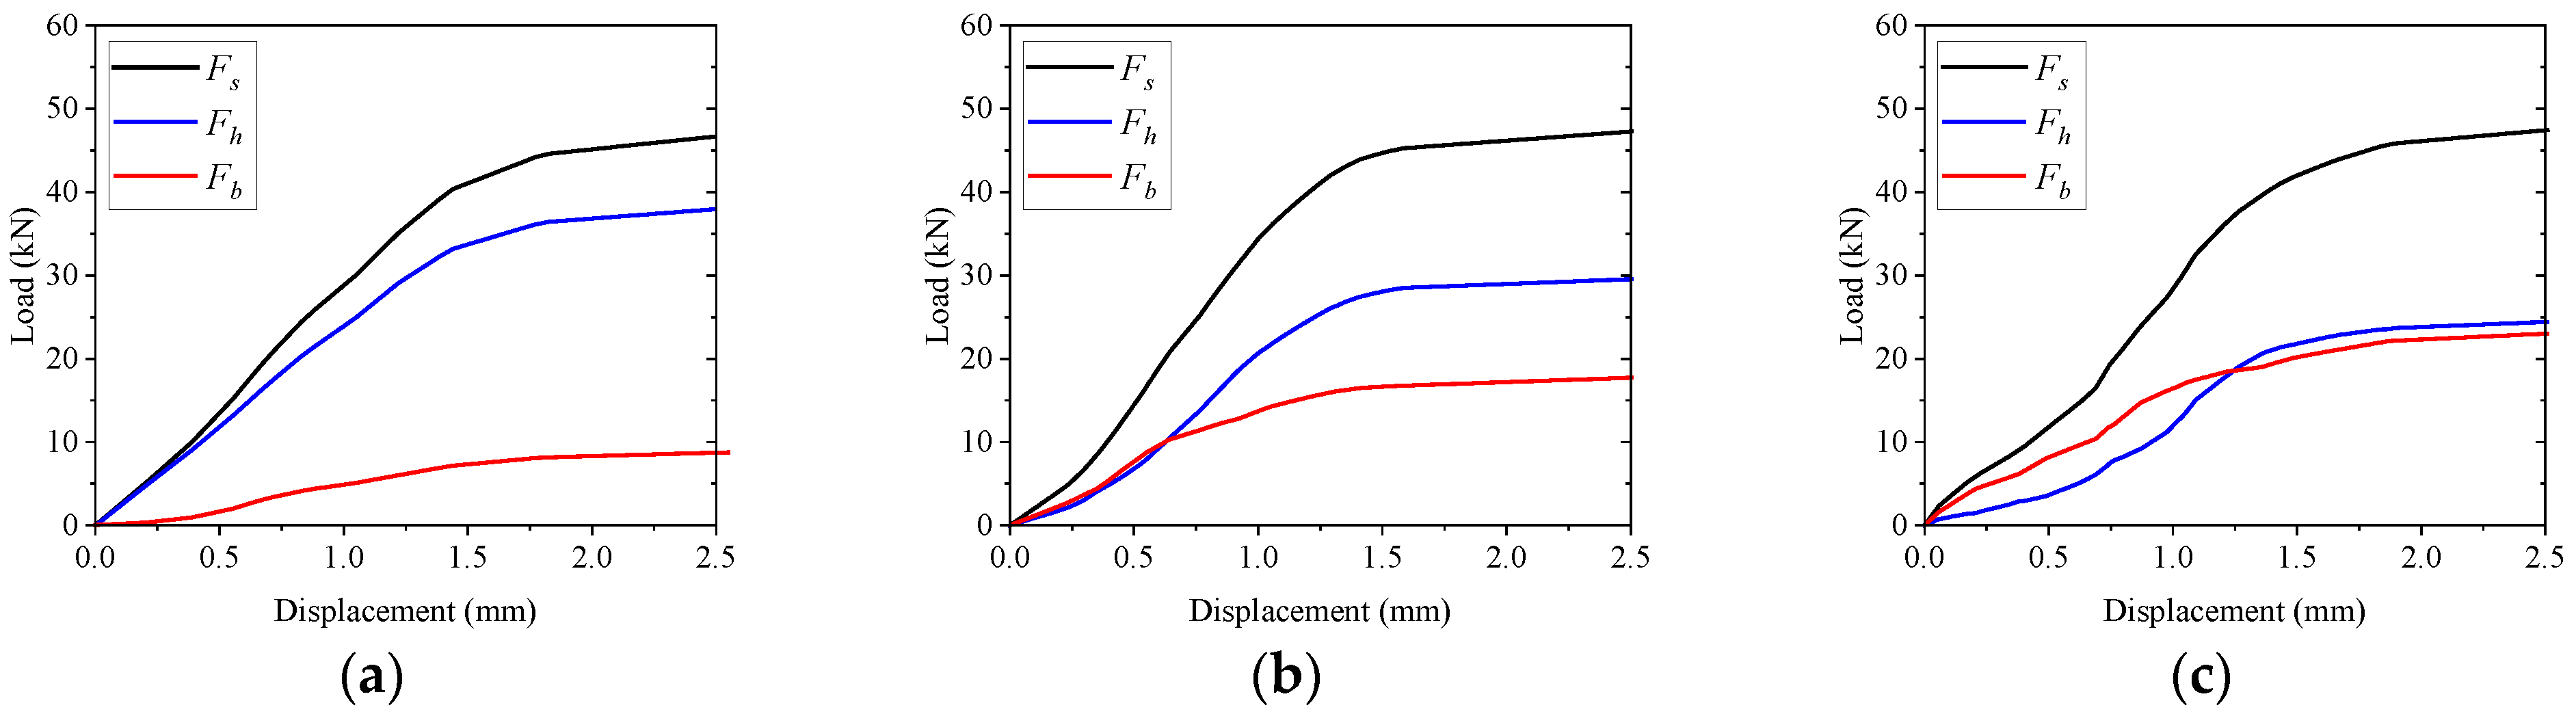
3.5. Distributive Relationship of Headed Bar Force
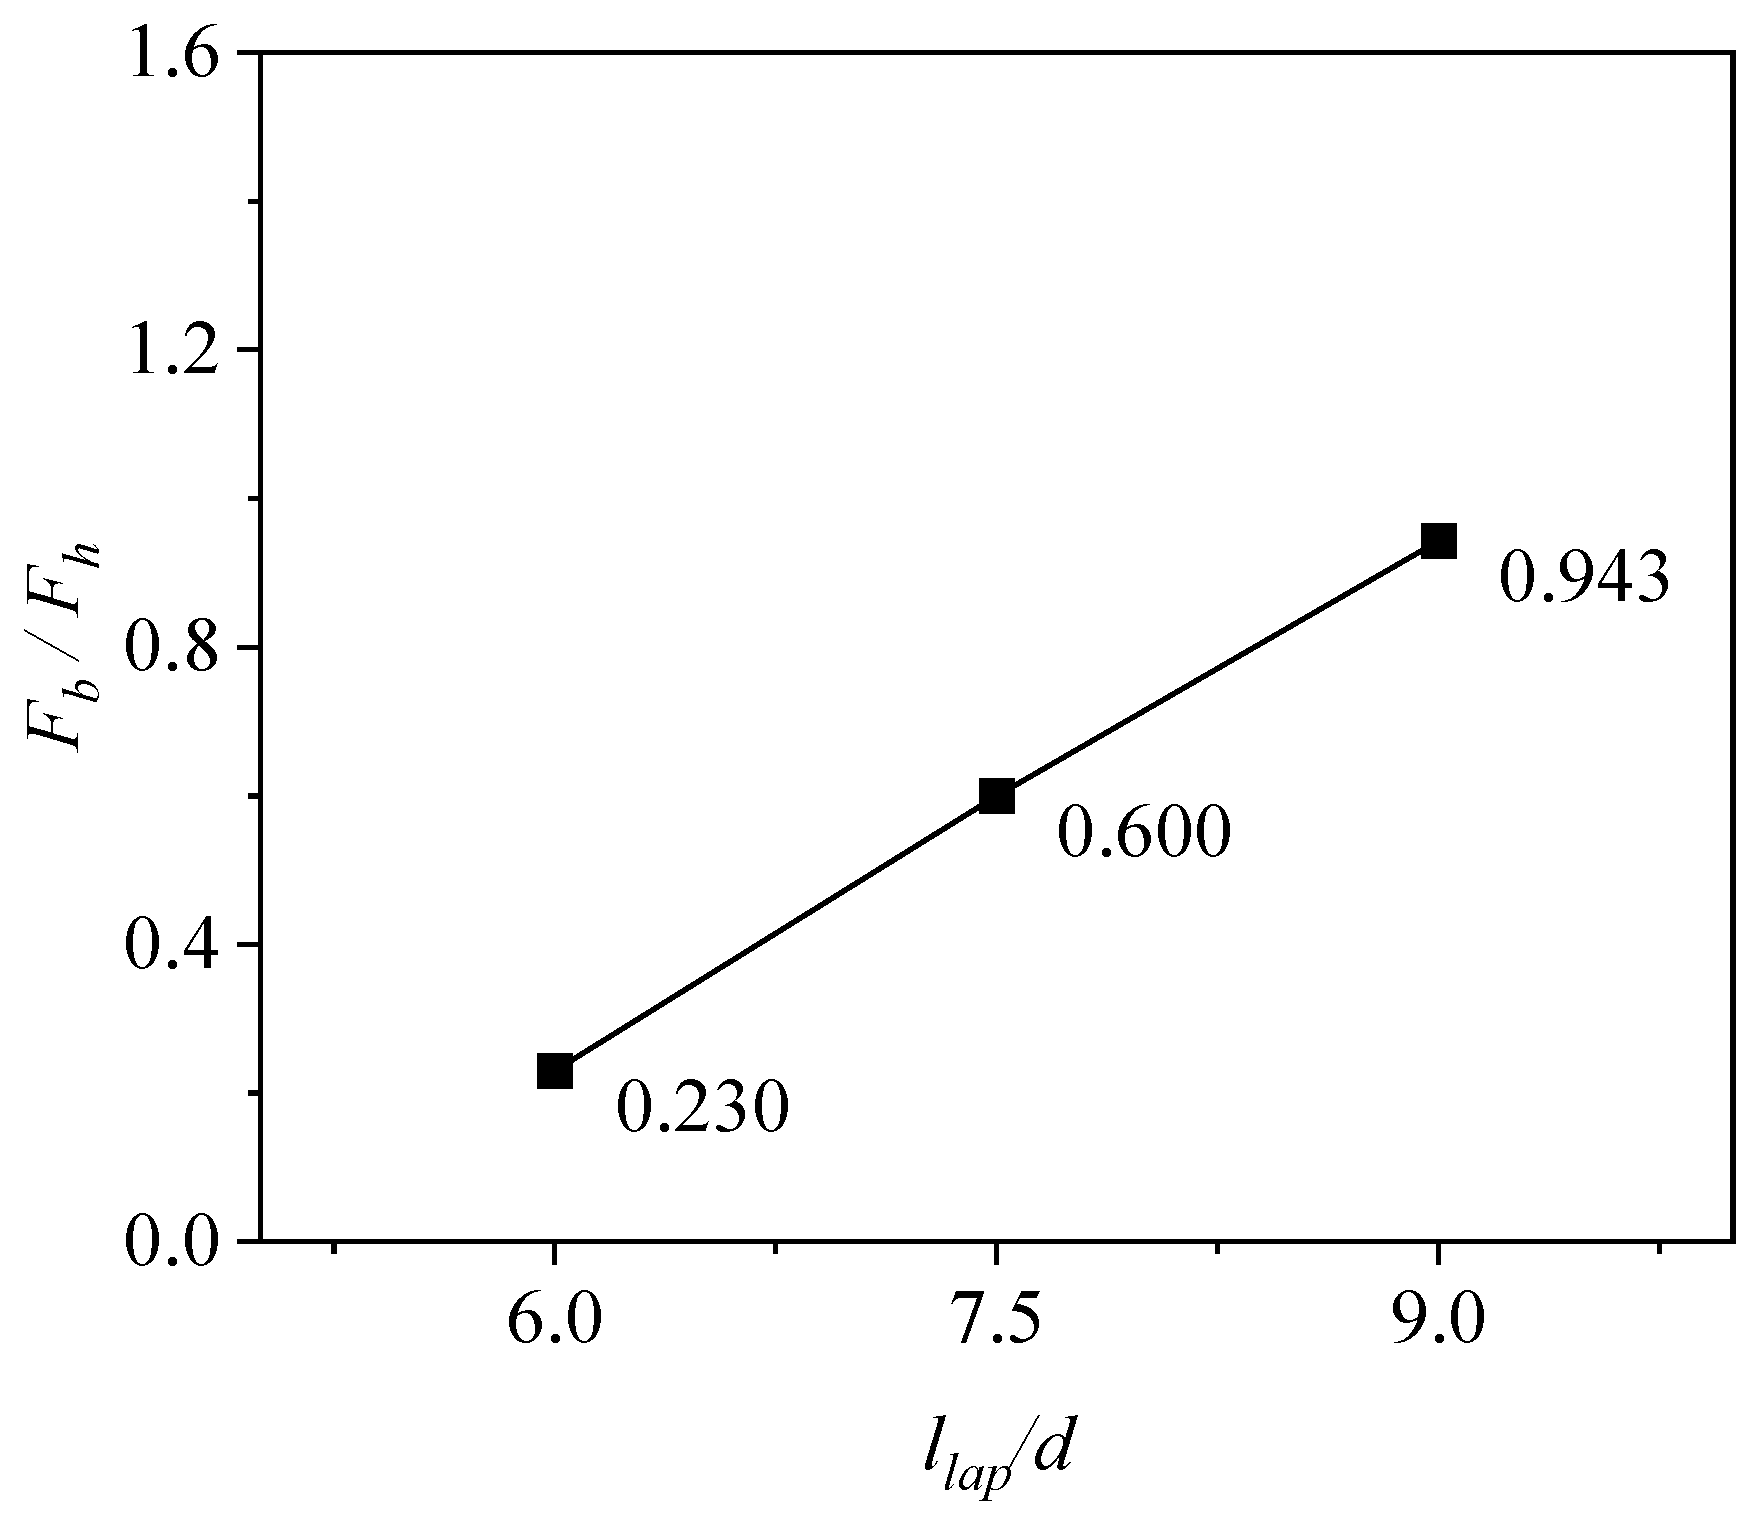
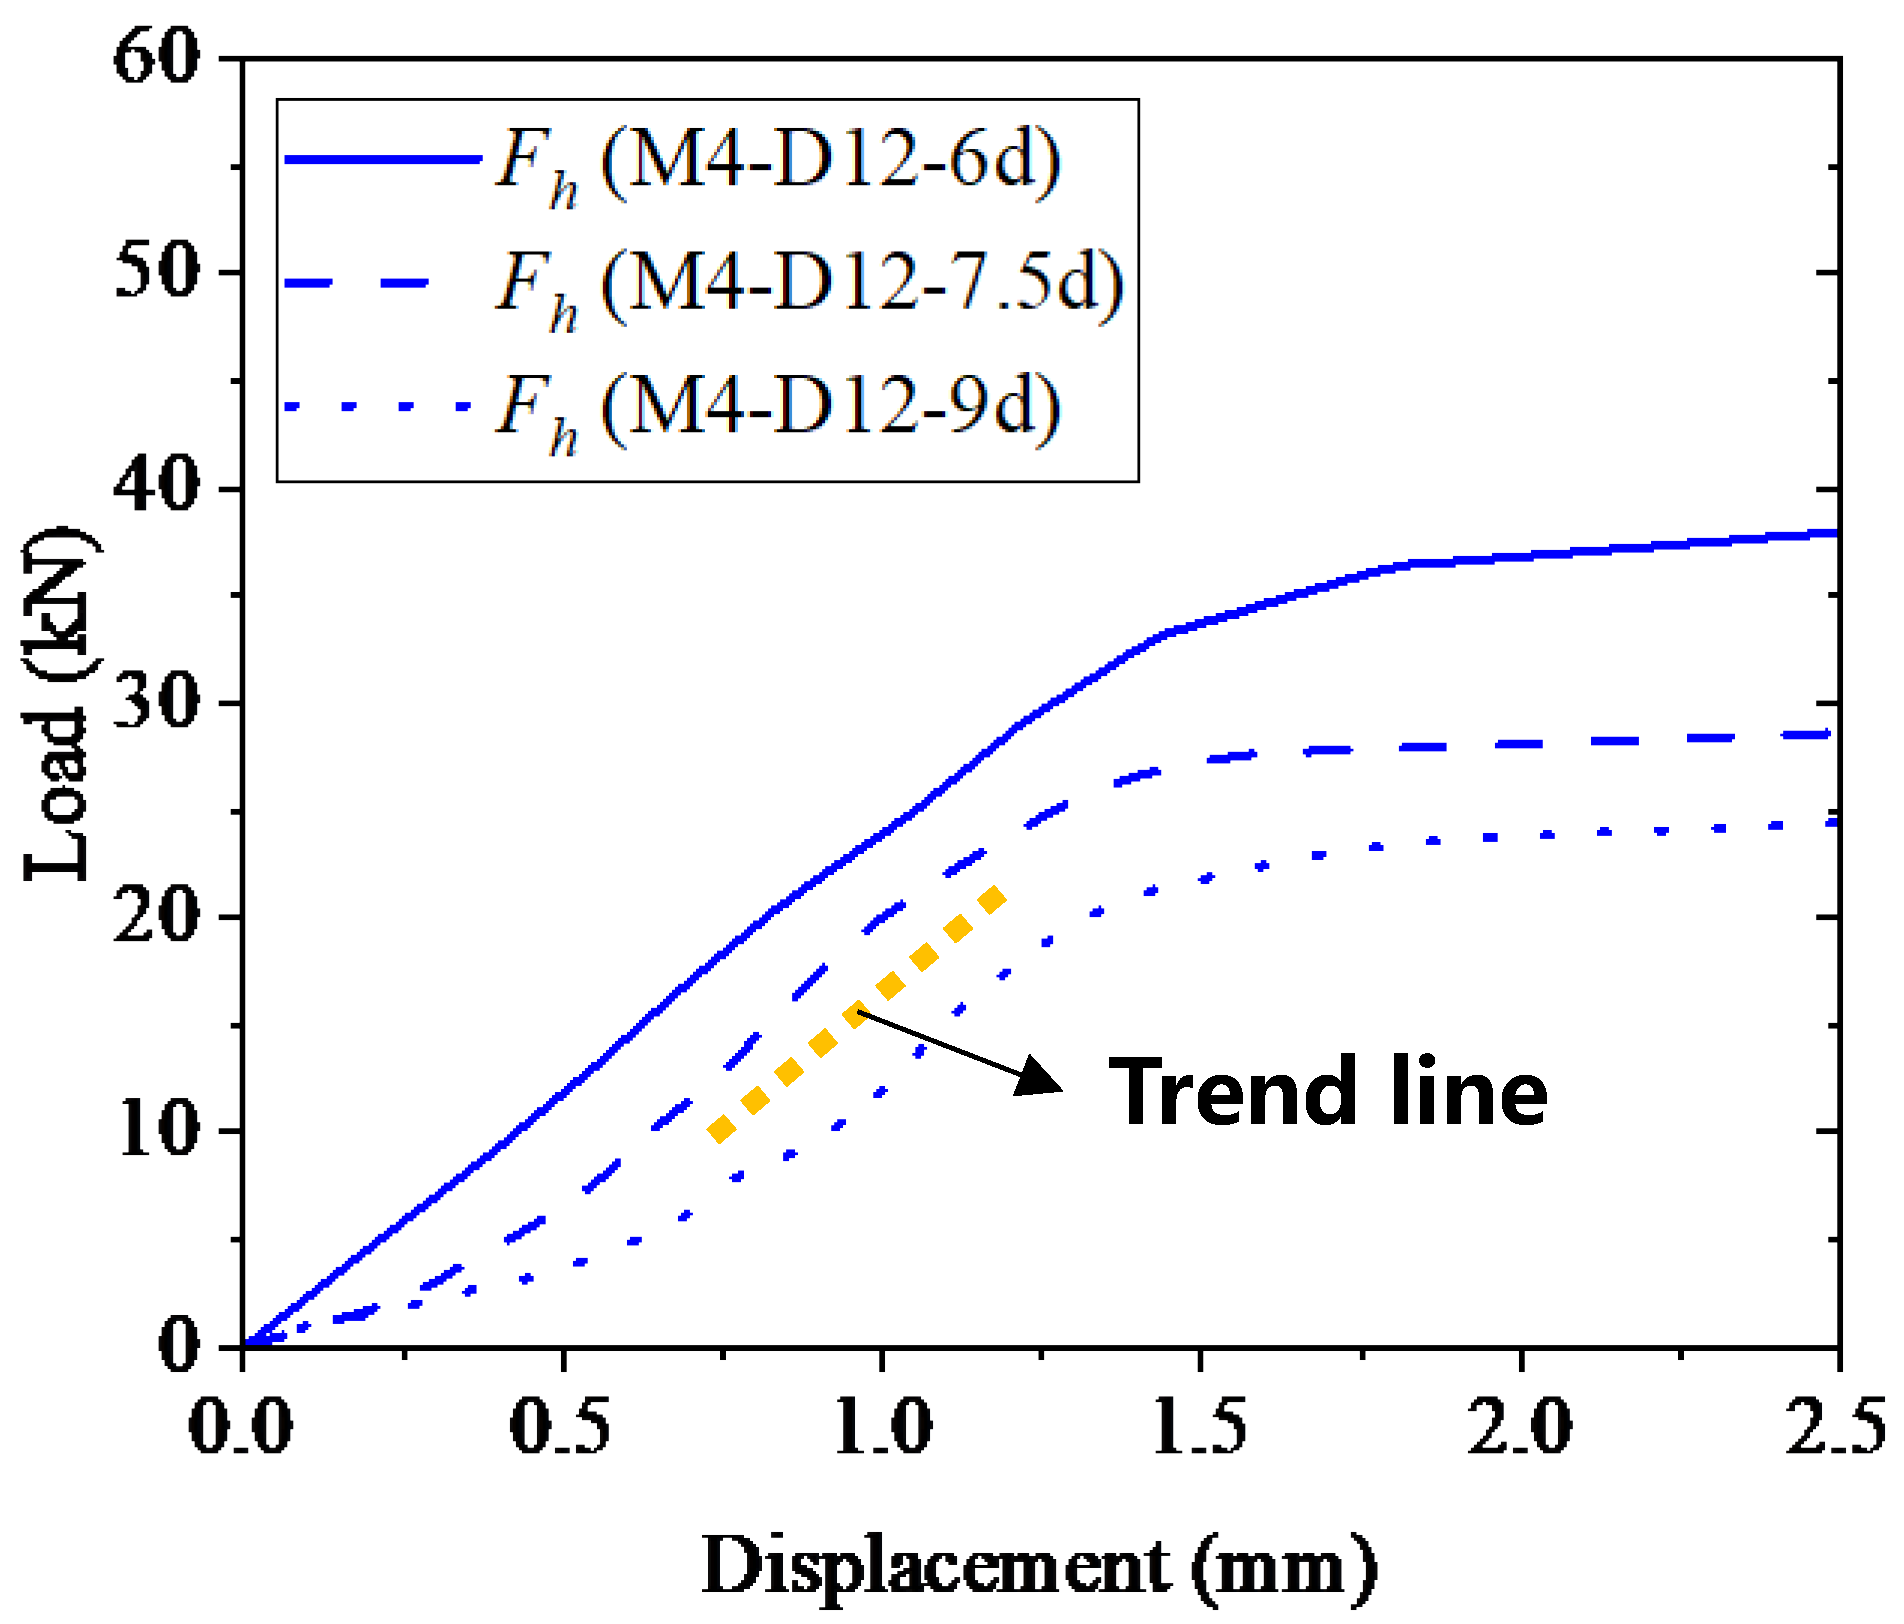
3.5.1. Effects of Lap Length
3.5.2. Effects of Head Size
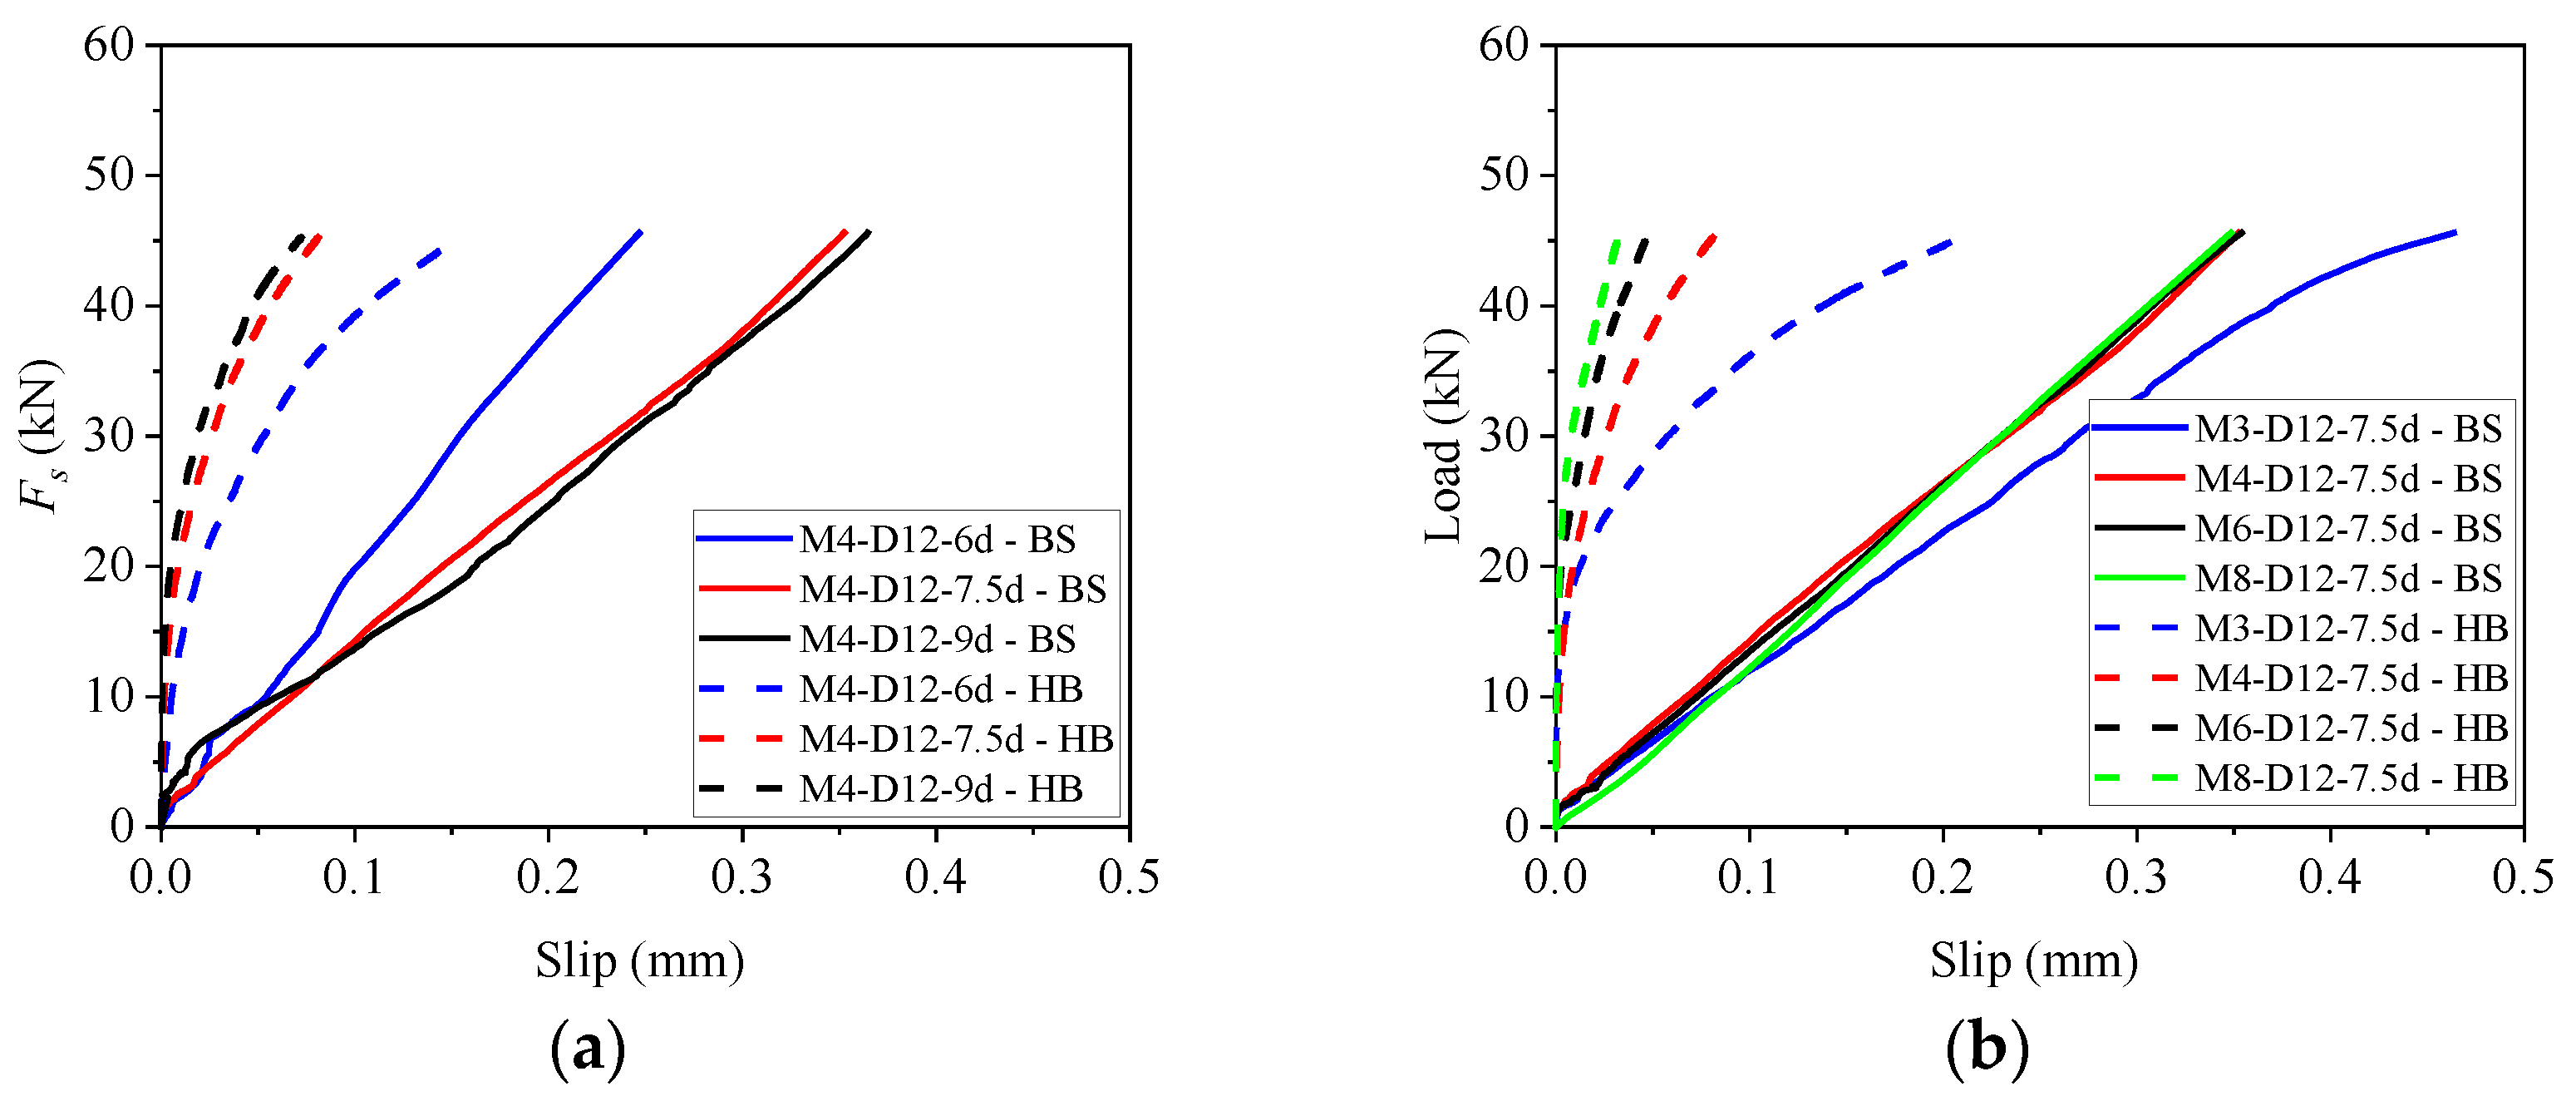
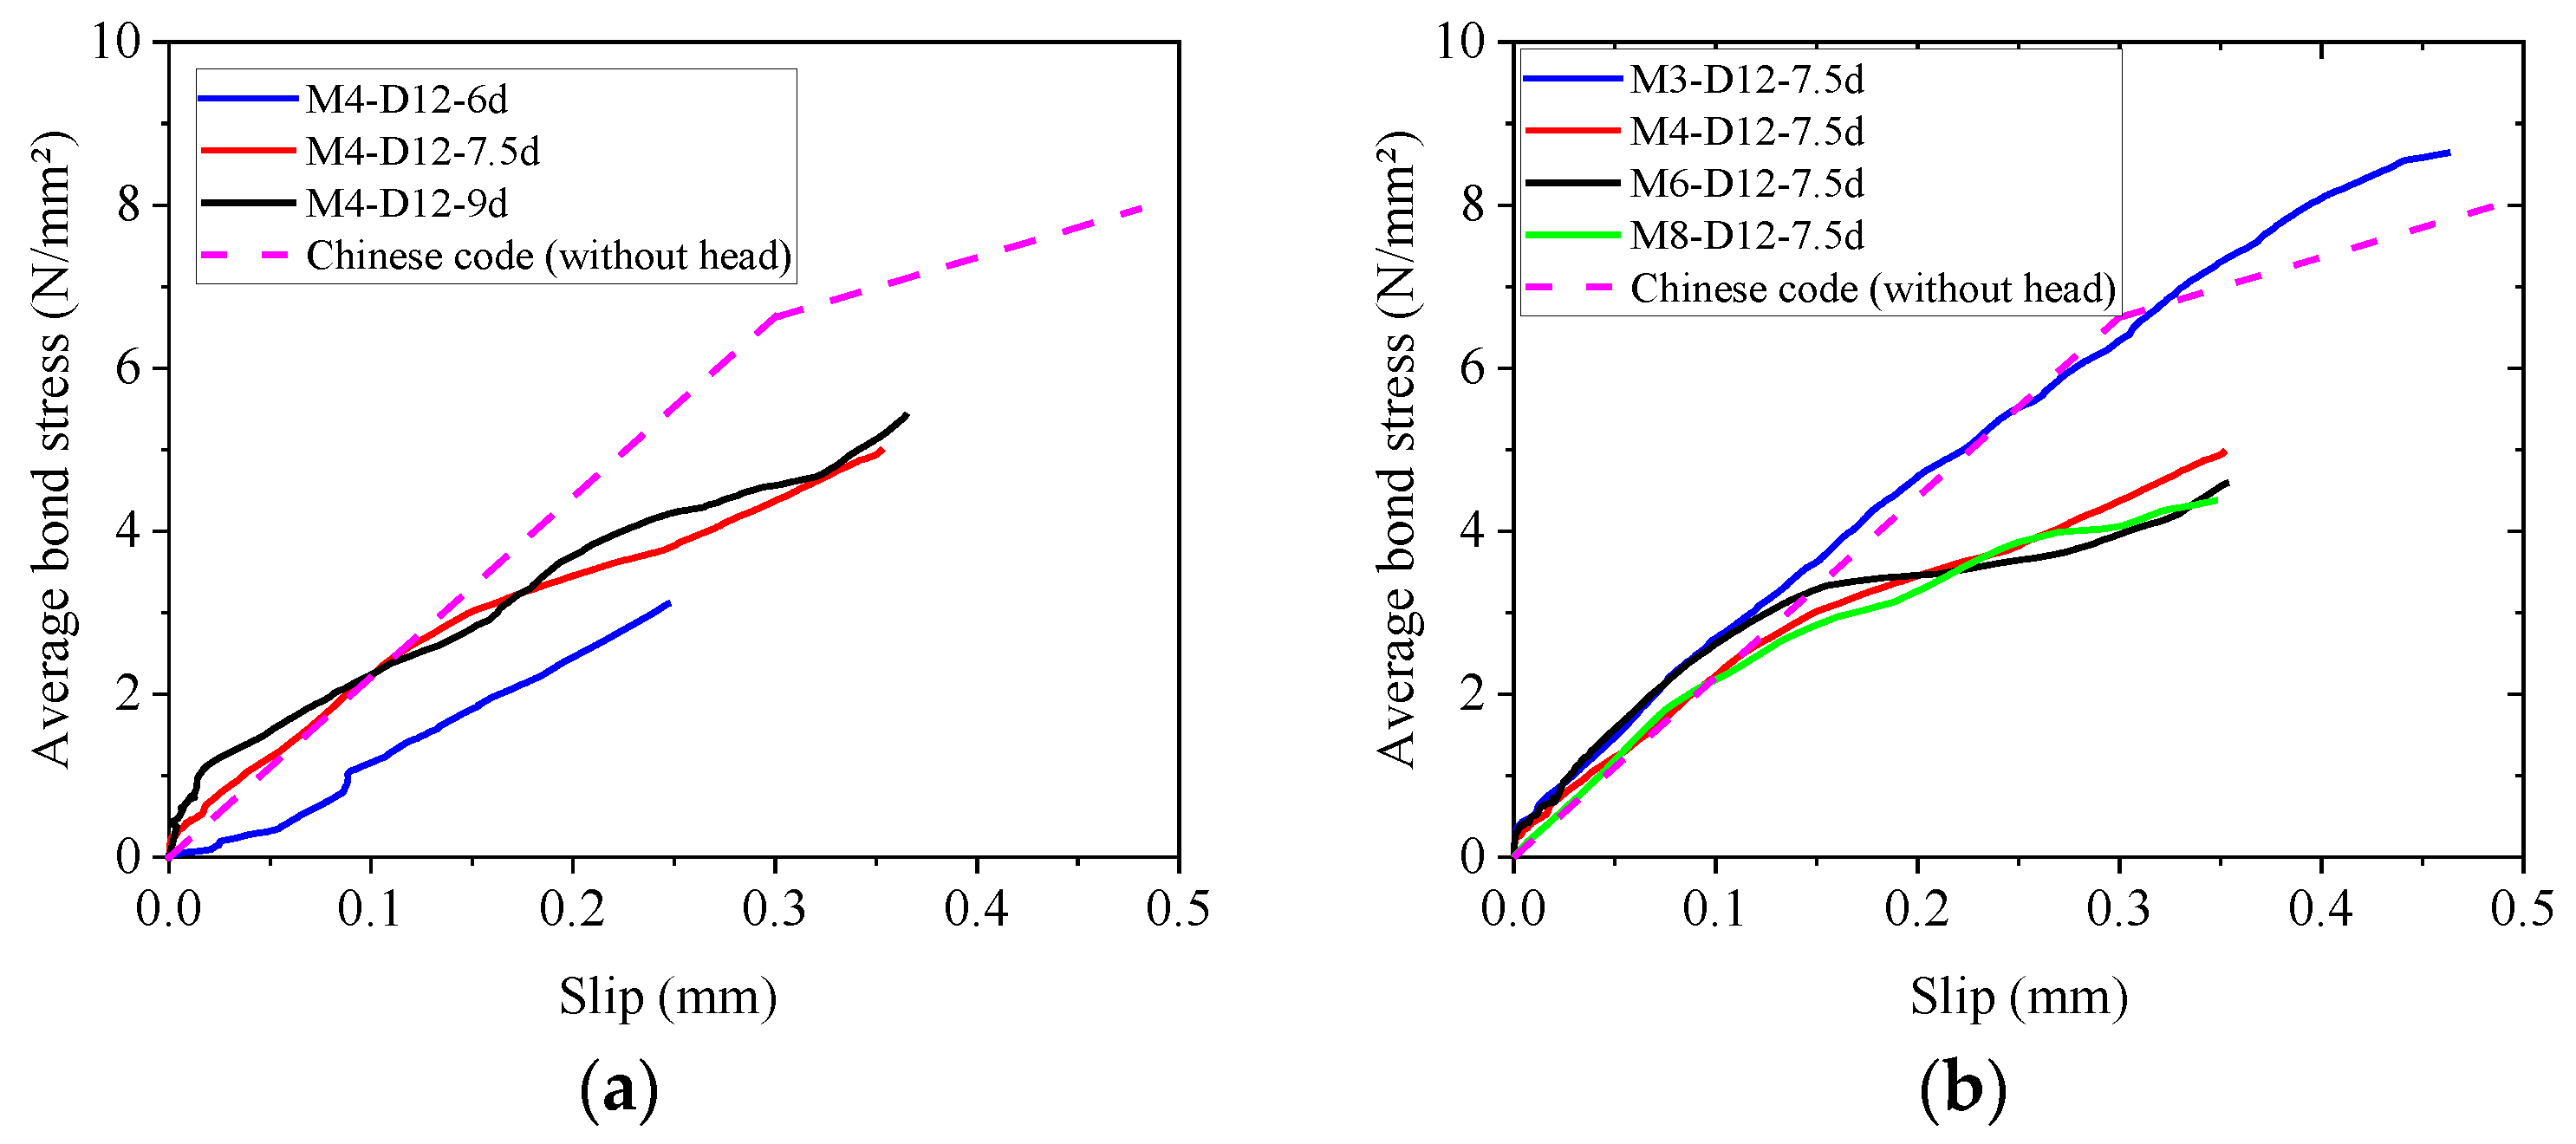
3.6. Slip Behavior
3.6.1. Load–Slip Response
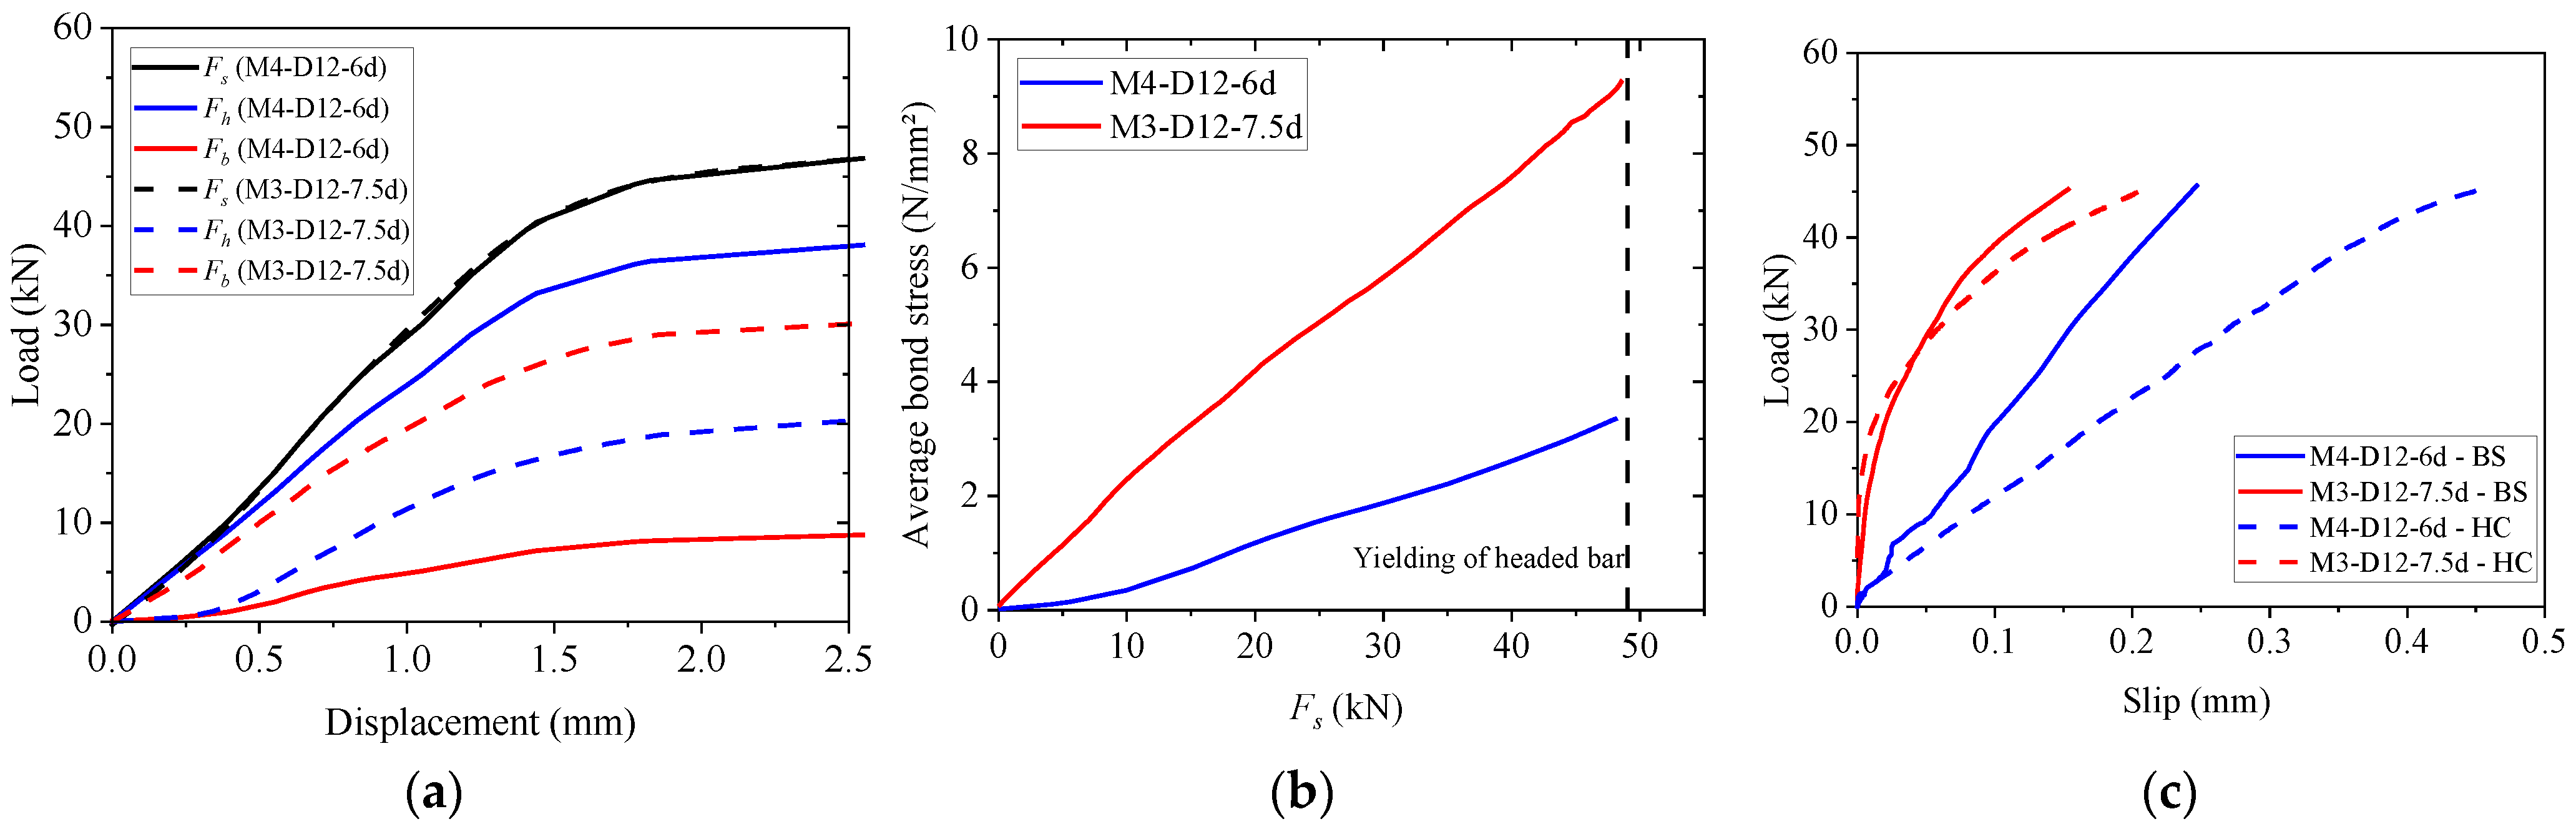
3.6.2. Interaction with the Force Distribution Relationship
3.6.3. Interrelationship of Lap Length and Head Size
4. Numerical Investigation
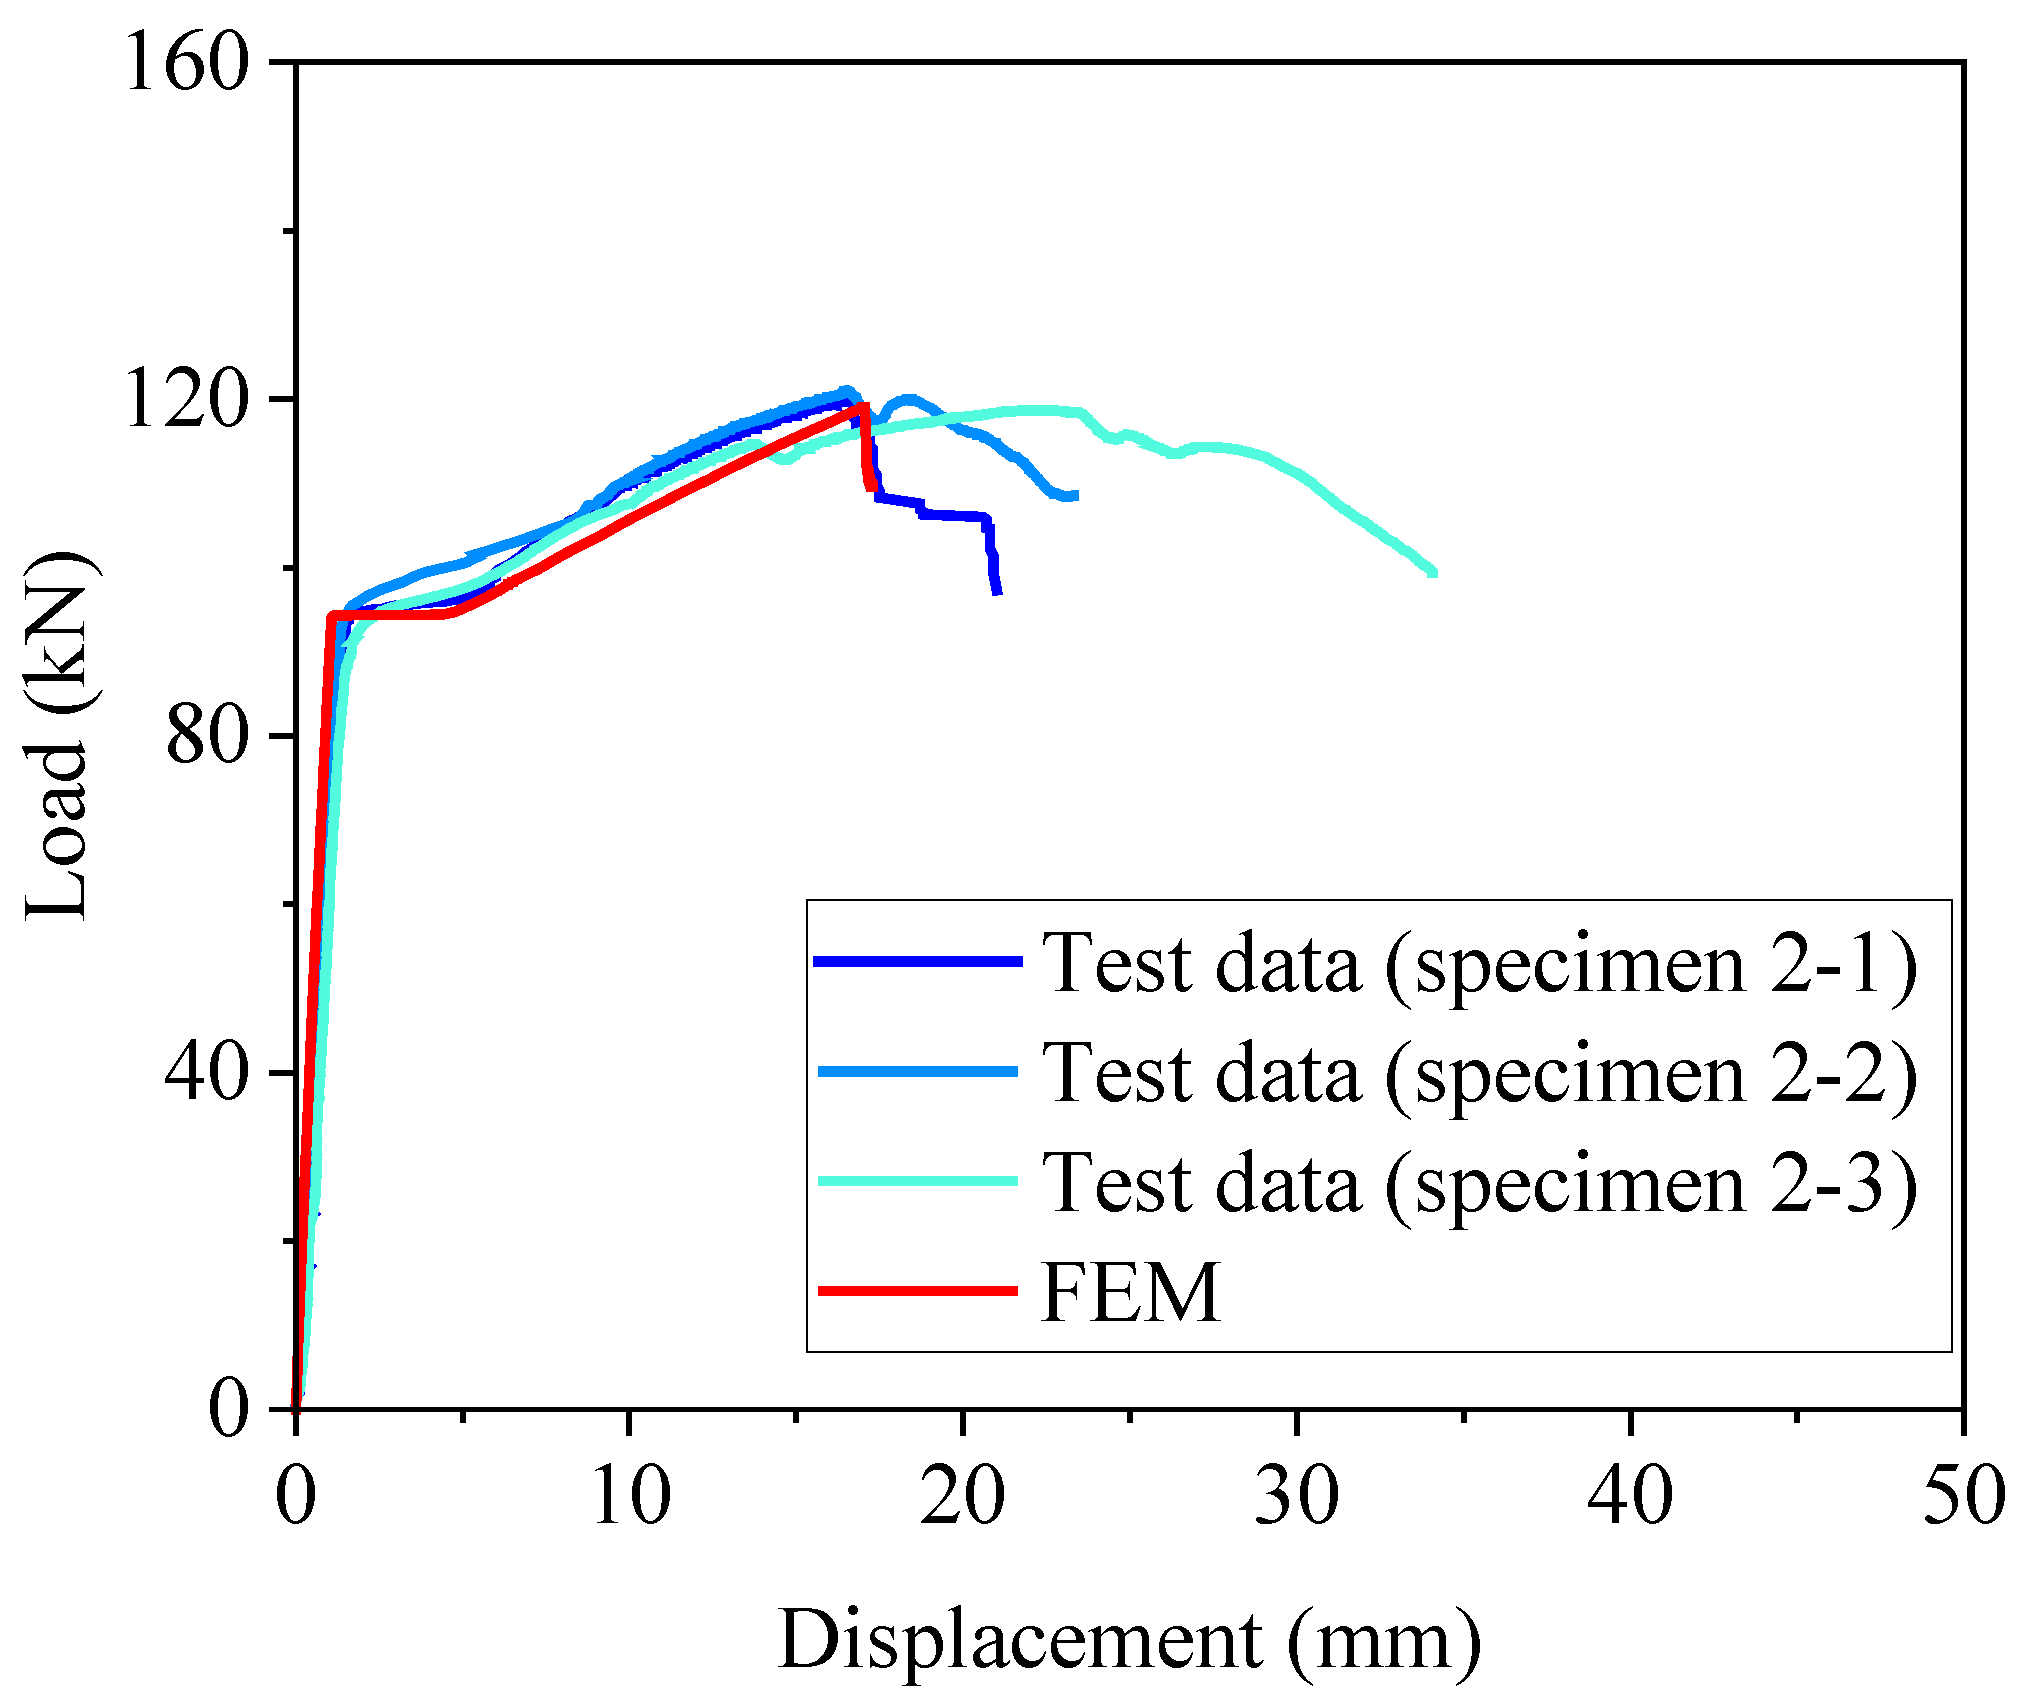
4.1. Finite Element Modeling
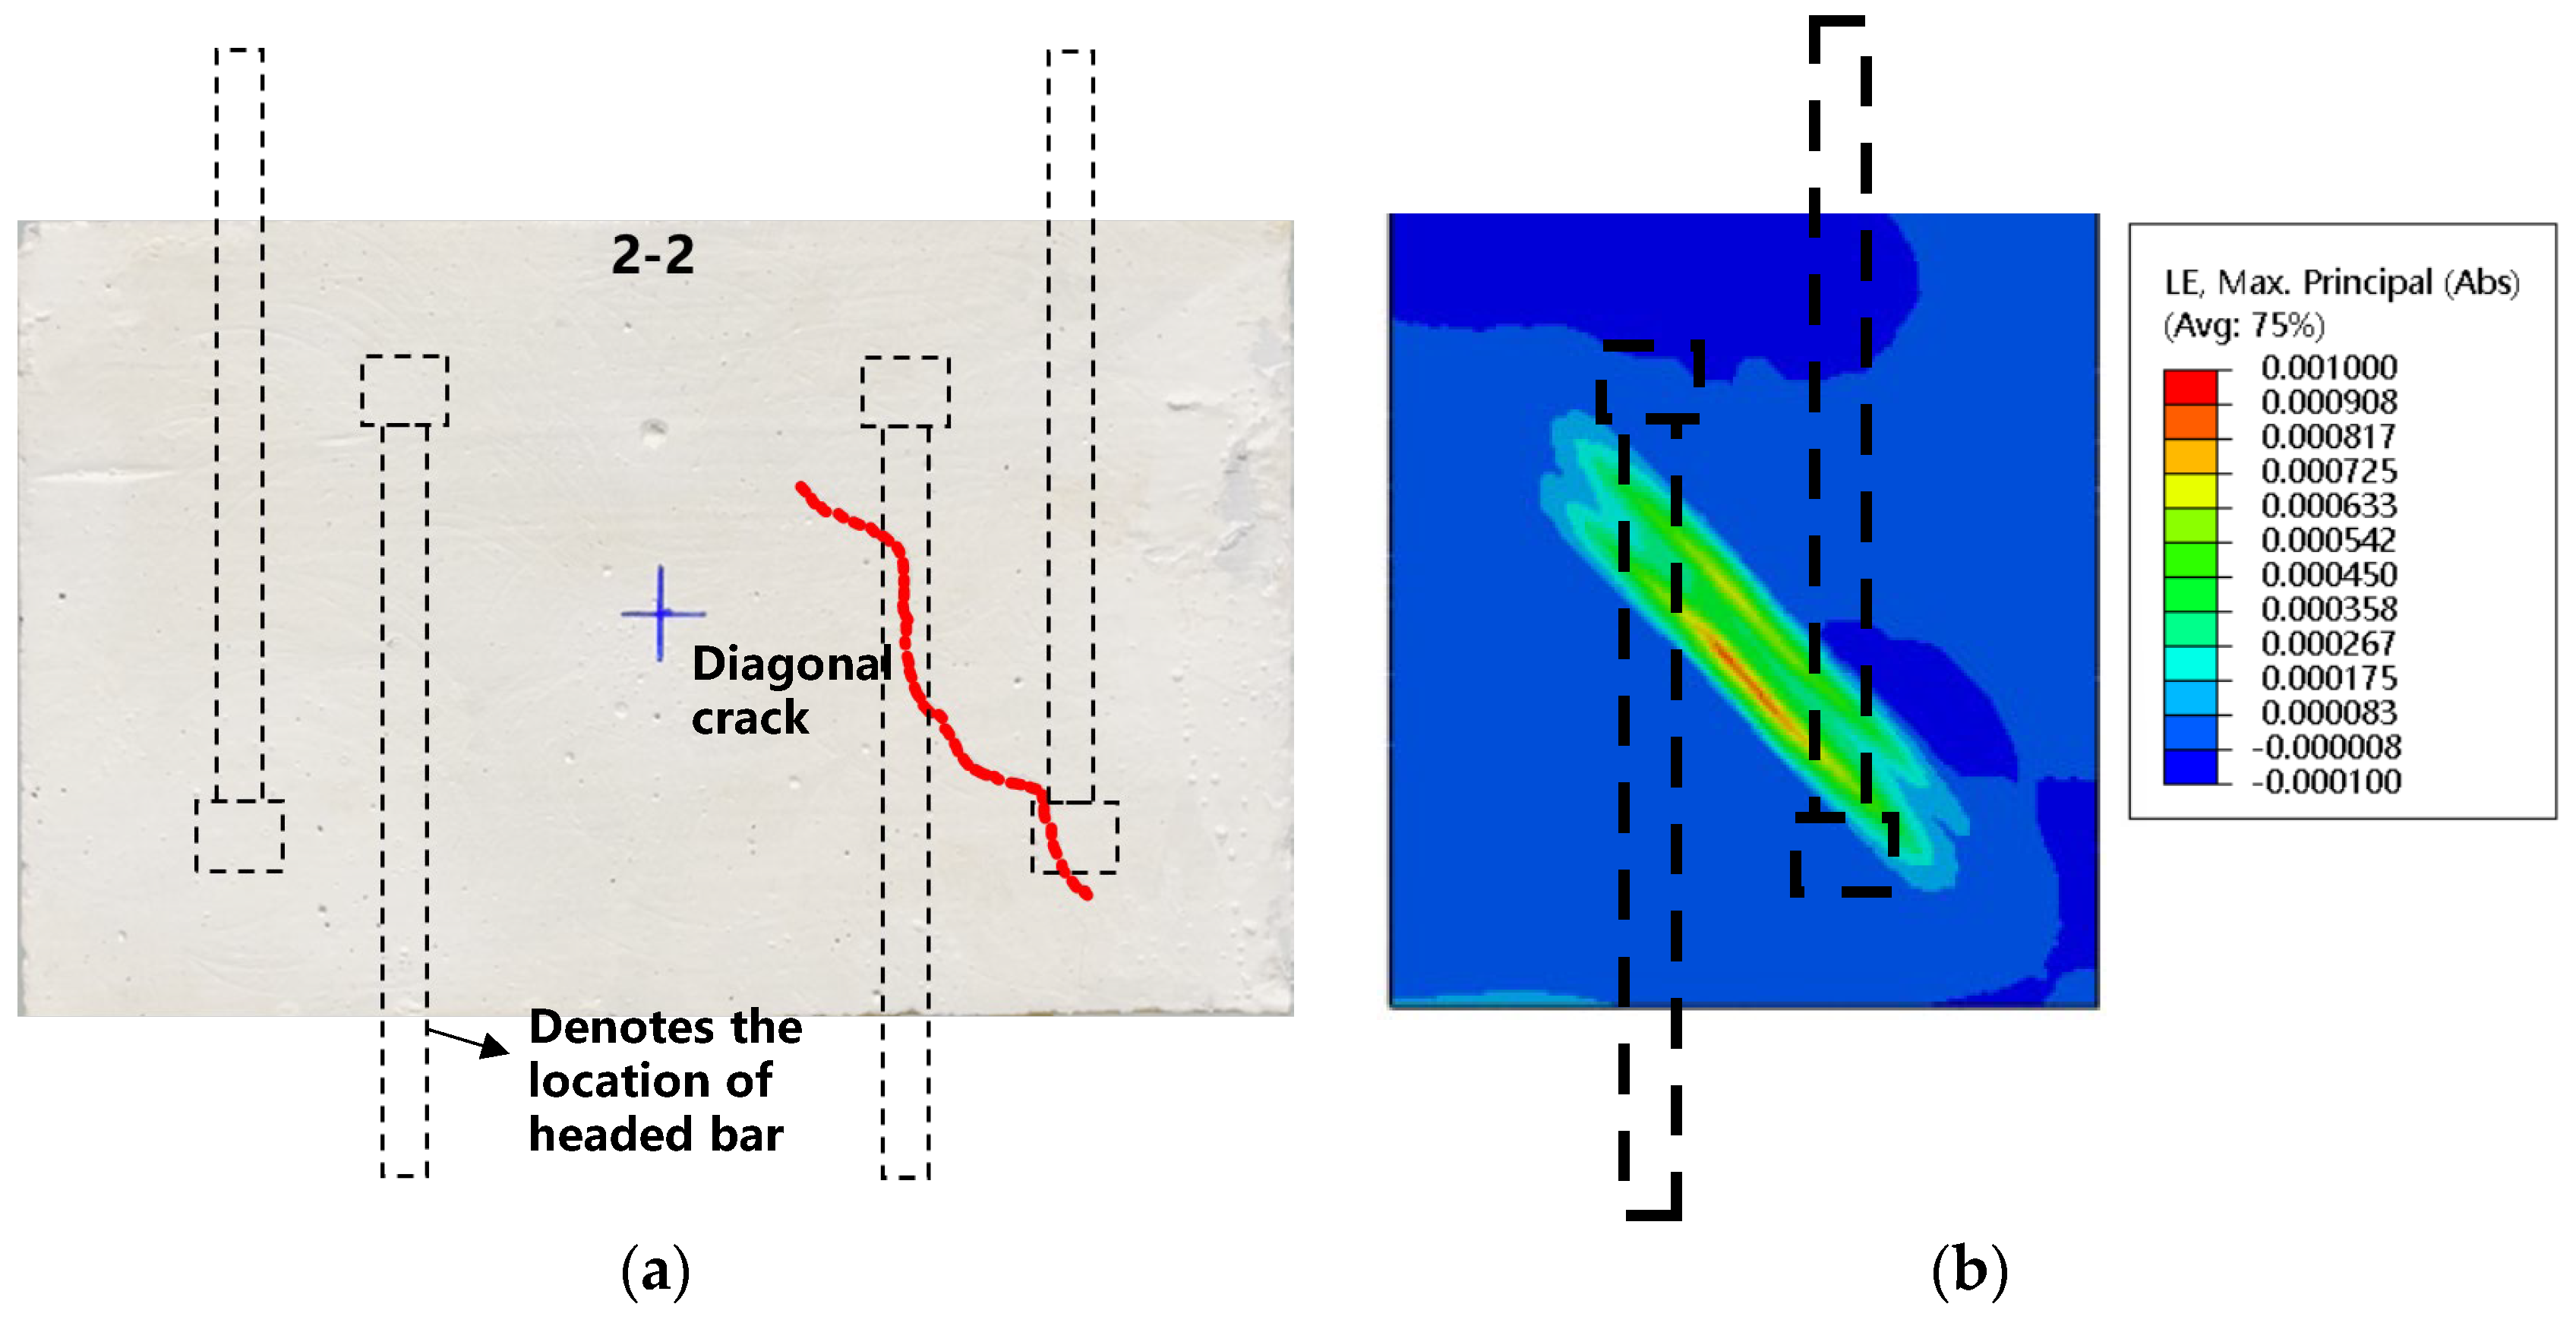
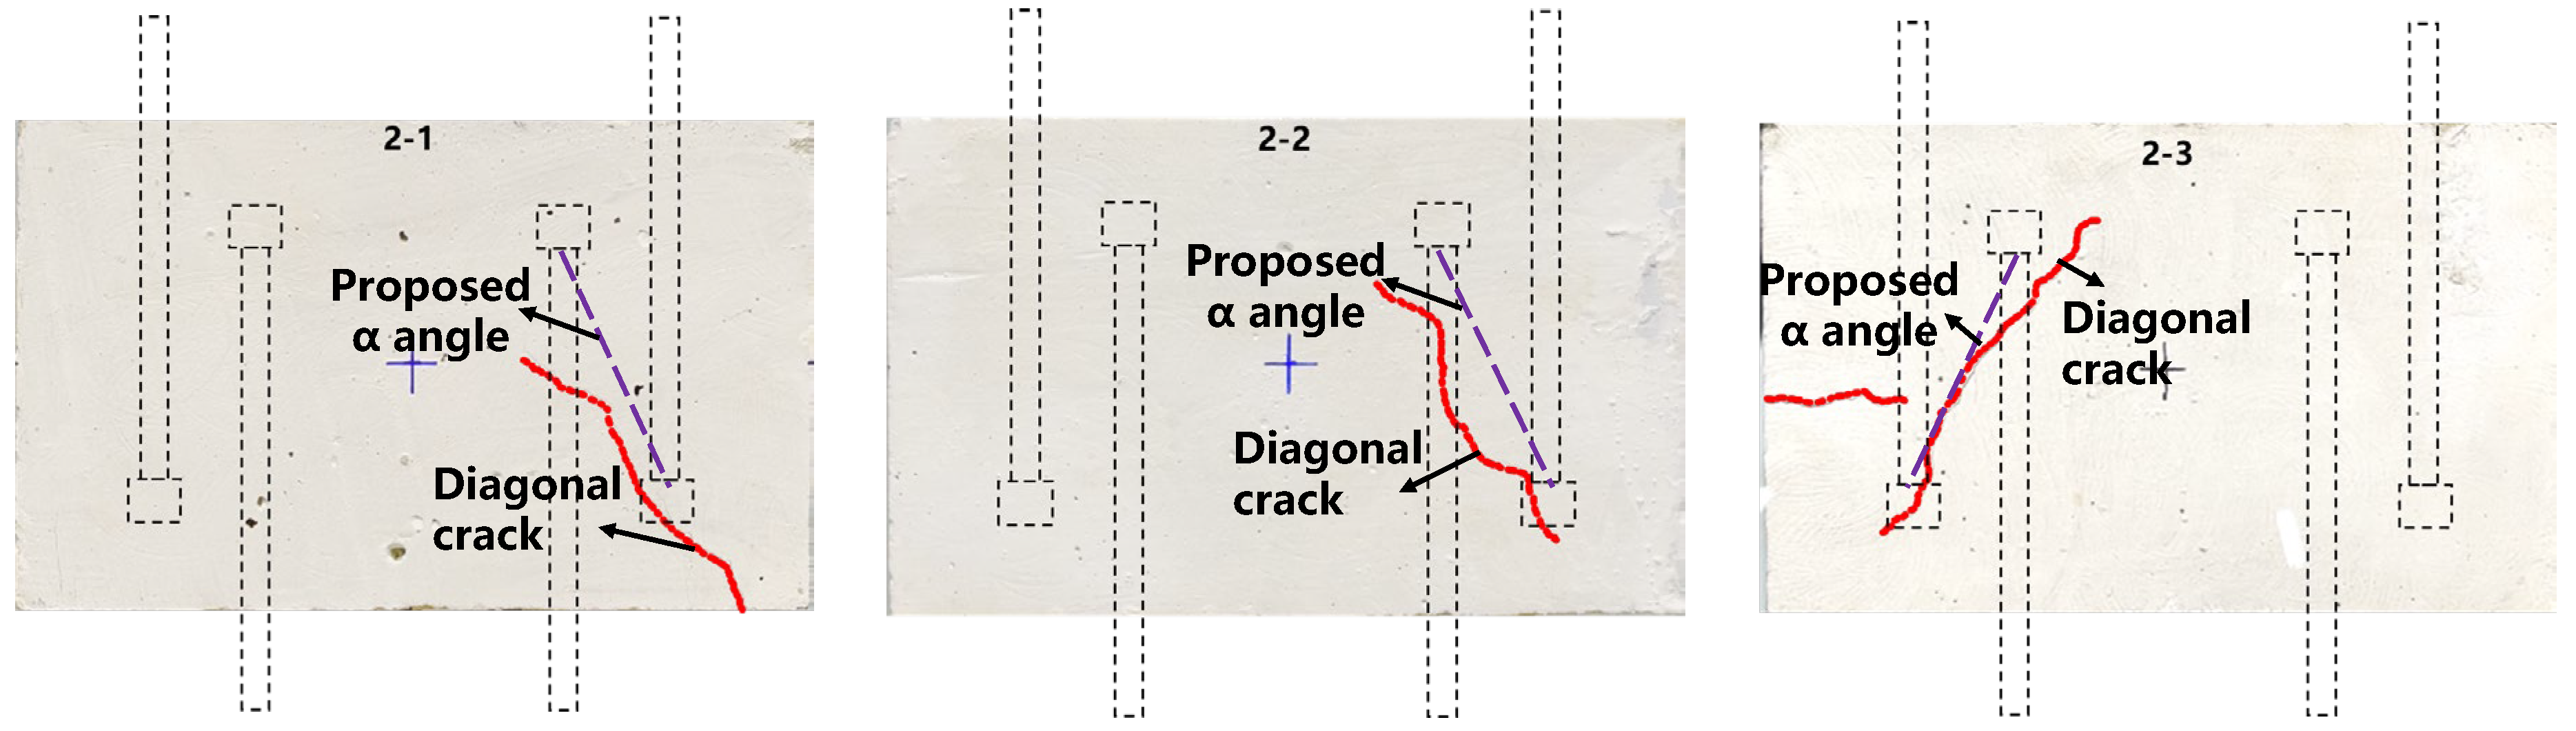
4.2. Crack Pattern
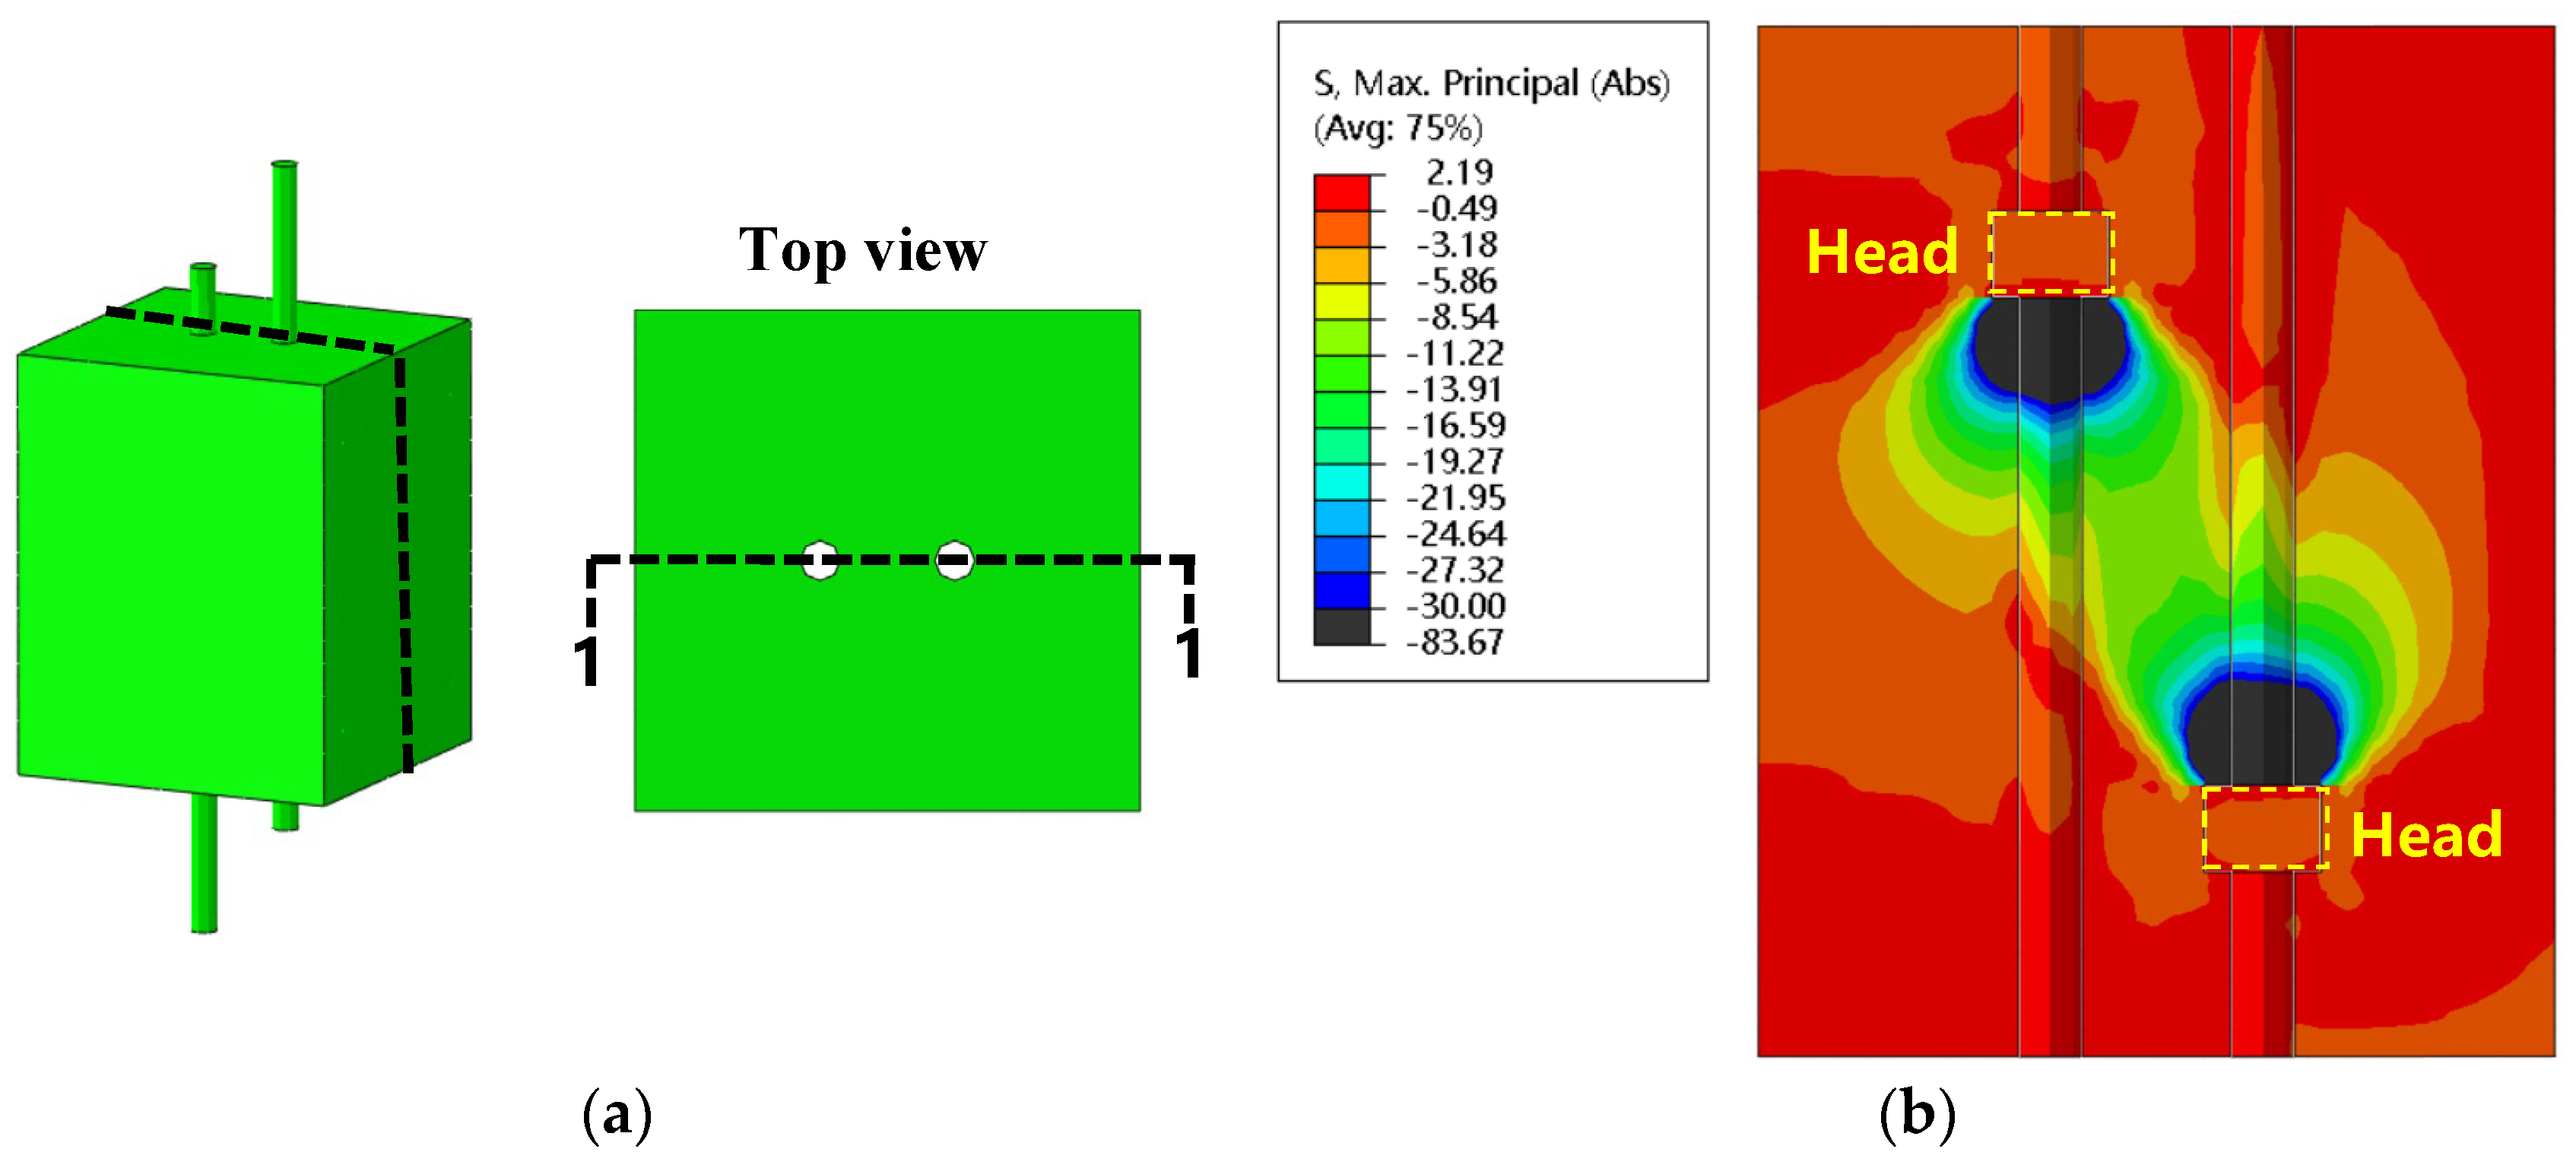
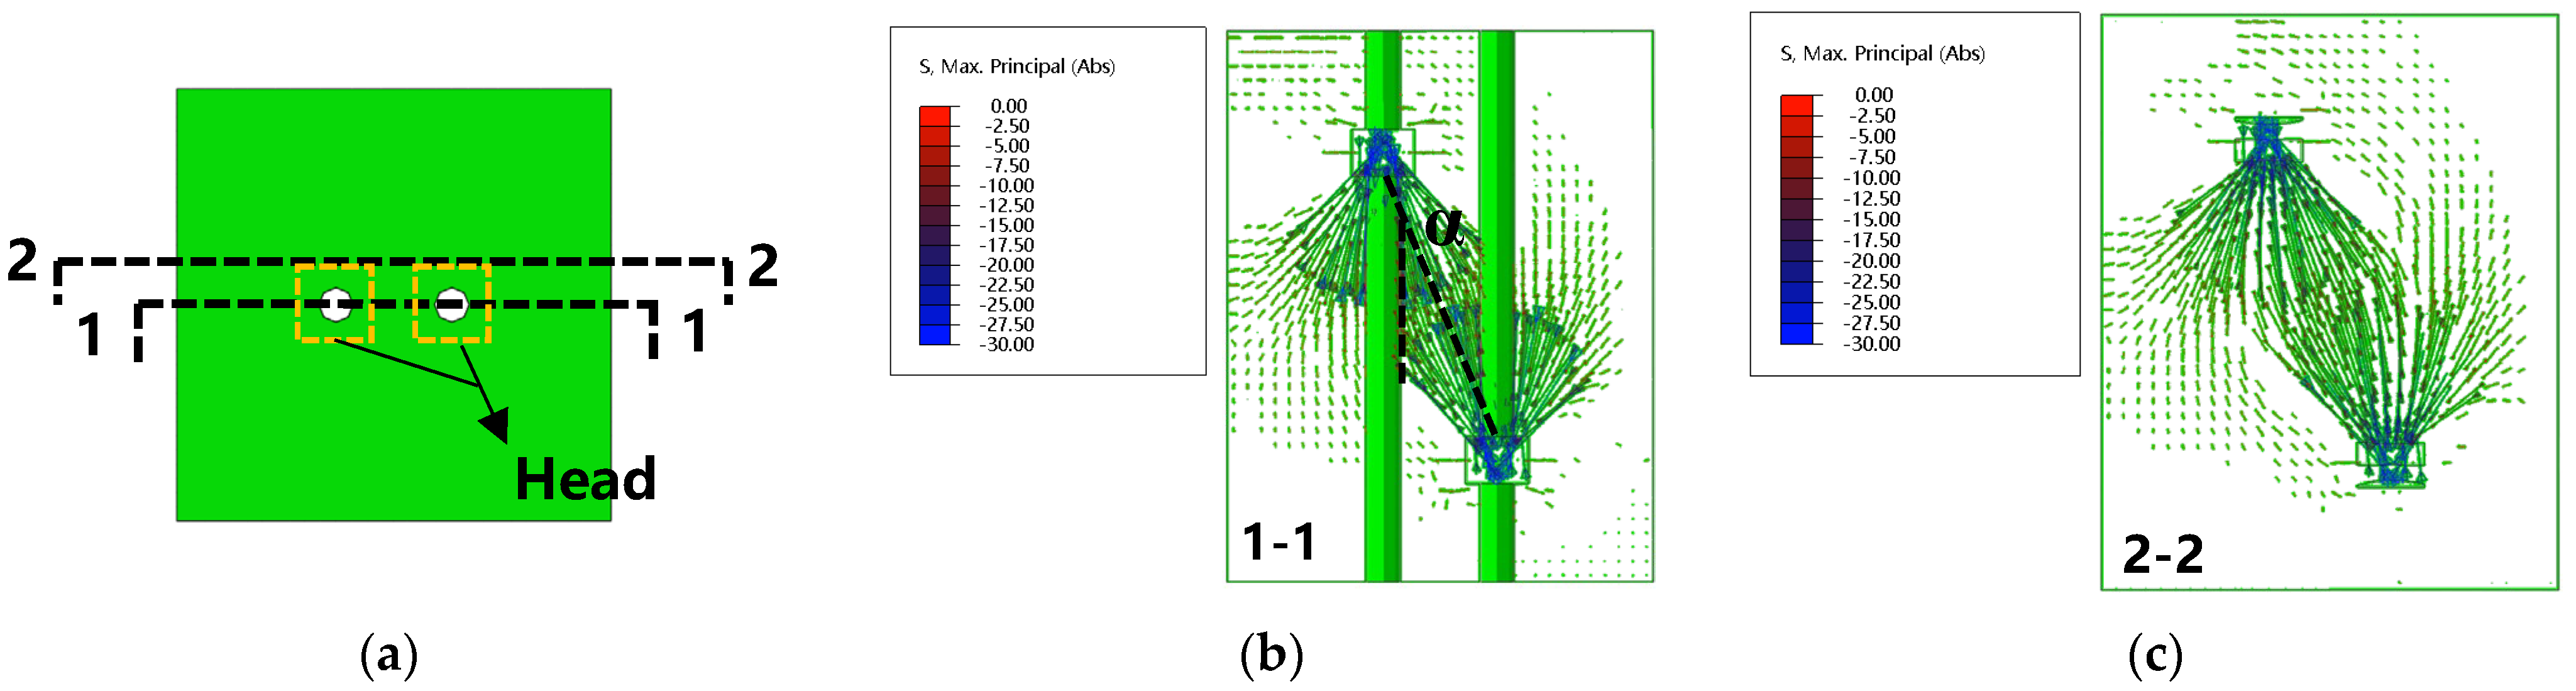
4.3. Concrete Compression at Head
5. Design Method
5.1. Bearing Capacity Contributed by Bond and Head
5.2. Validation of the Proposed Design Equation
5.3. Head Thickness
6. Conclusions
- (1)
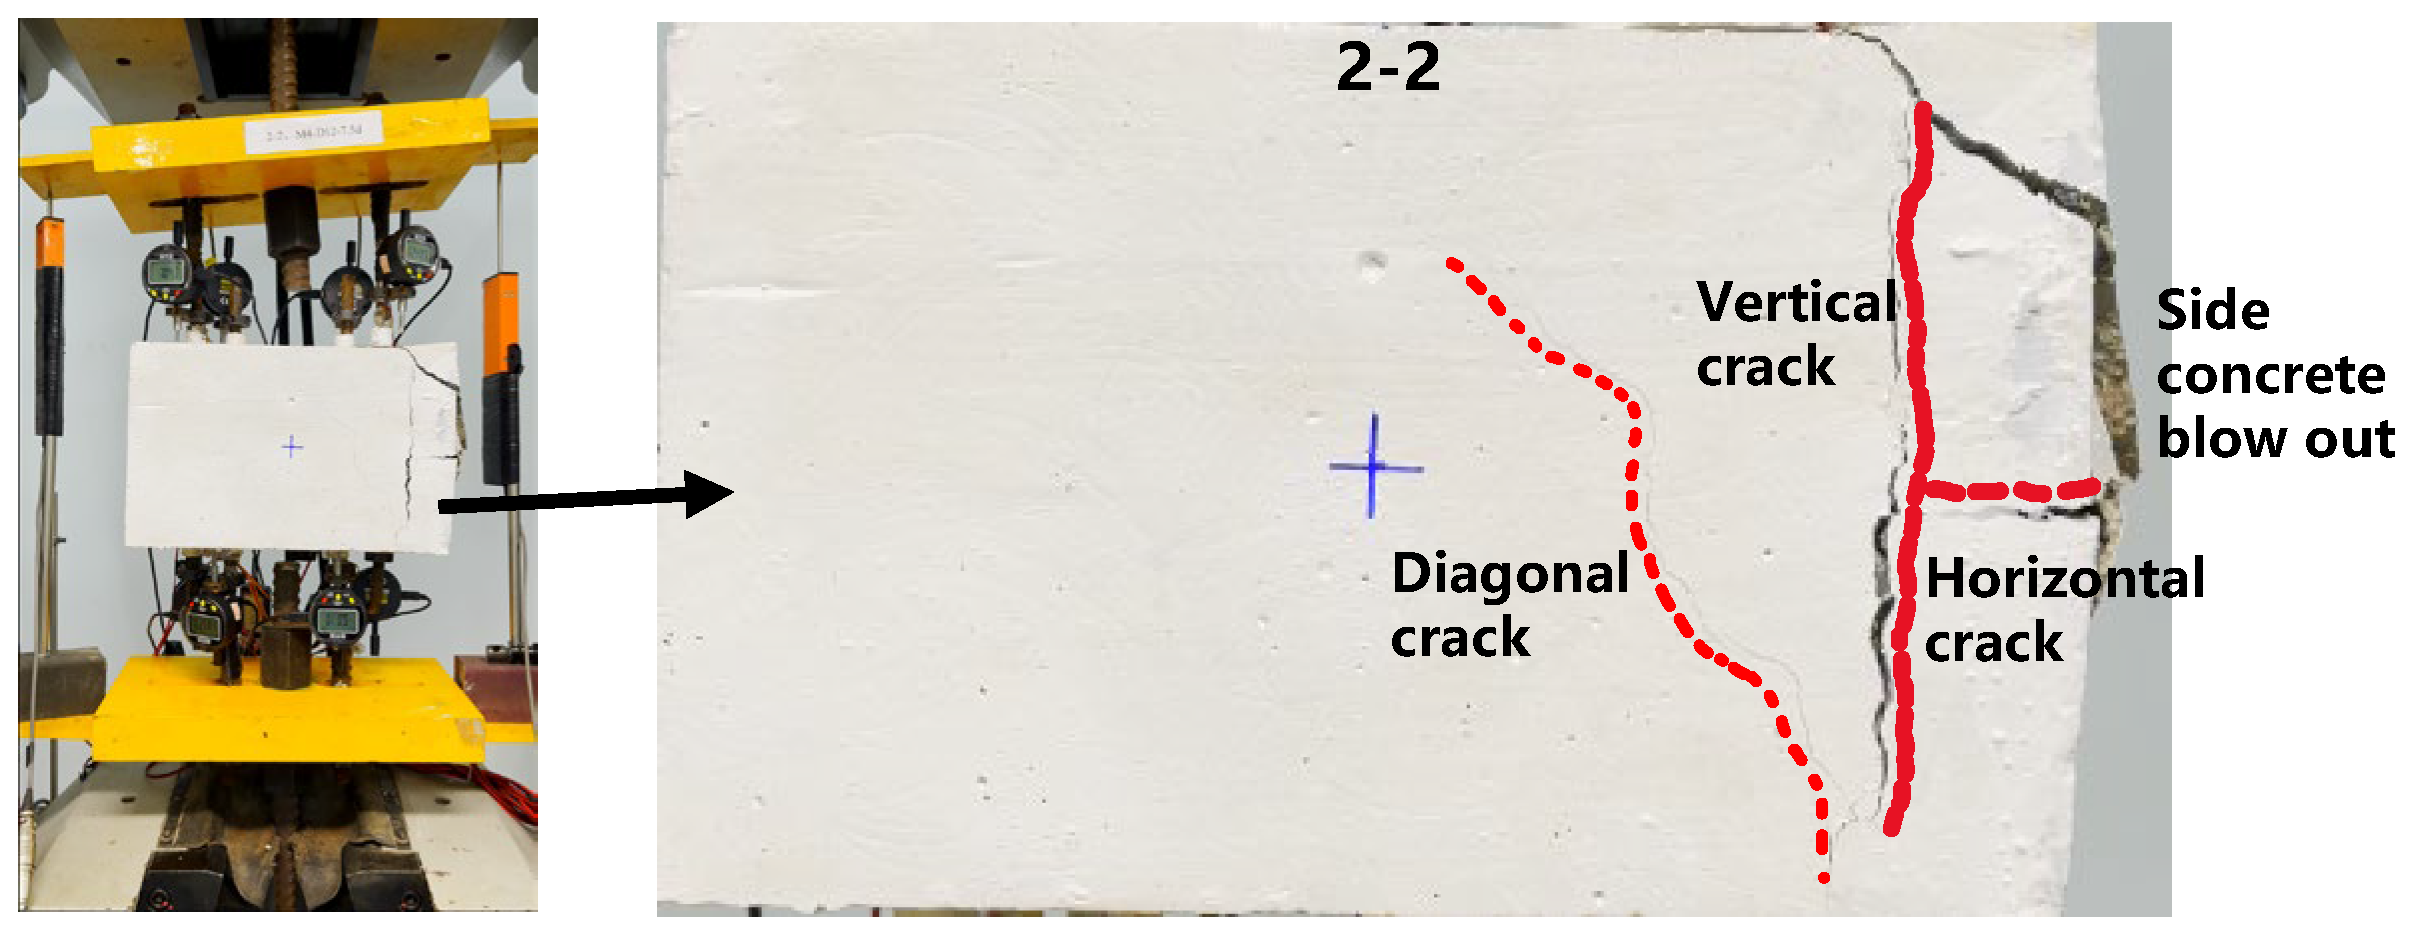
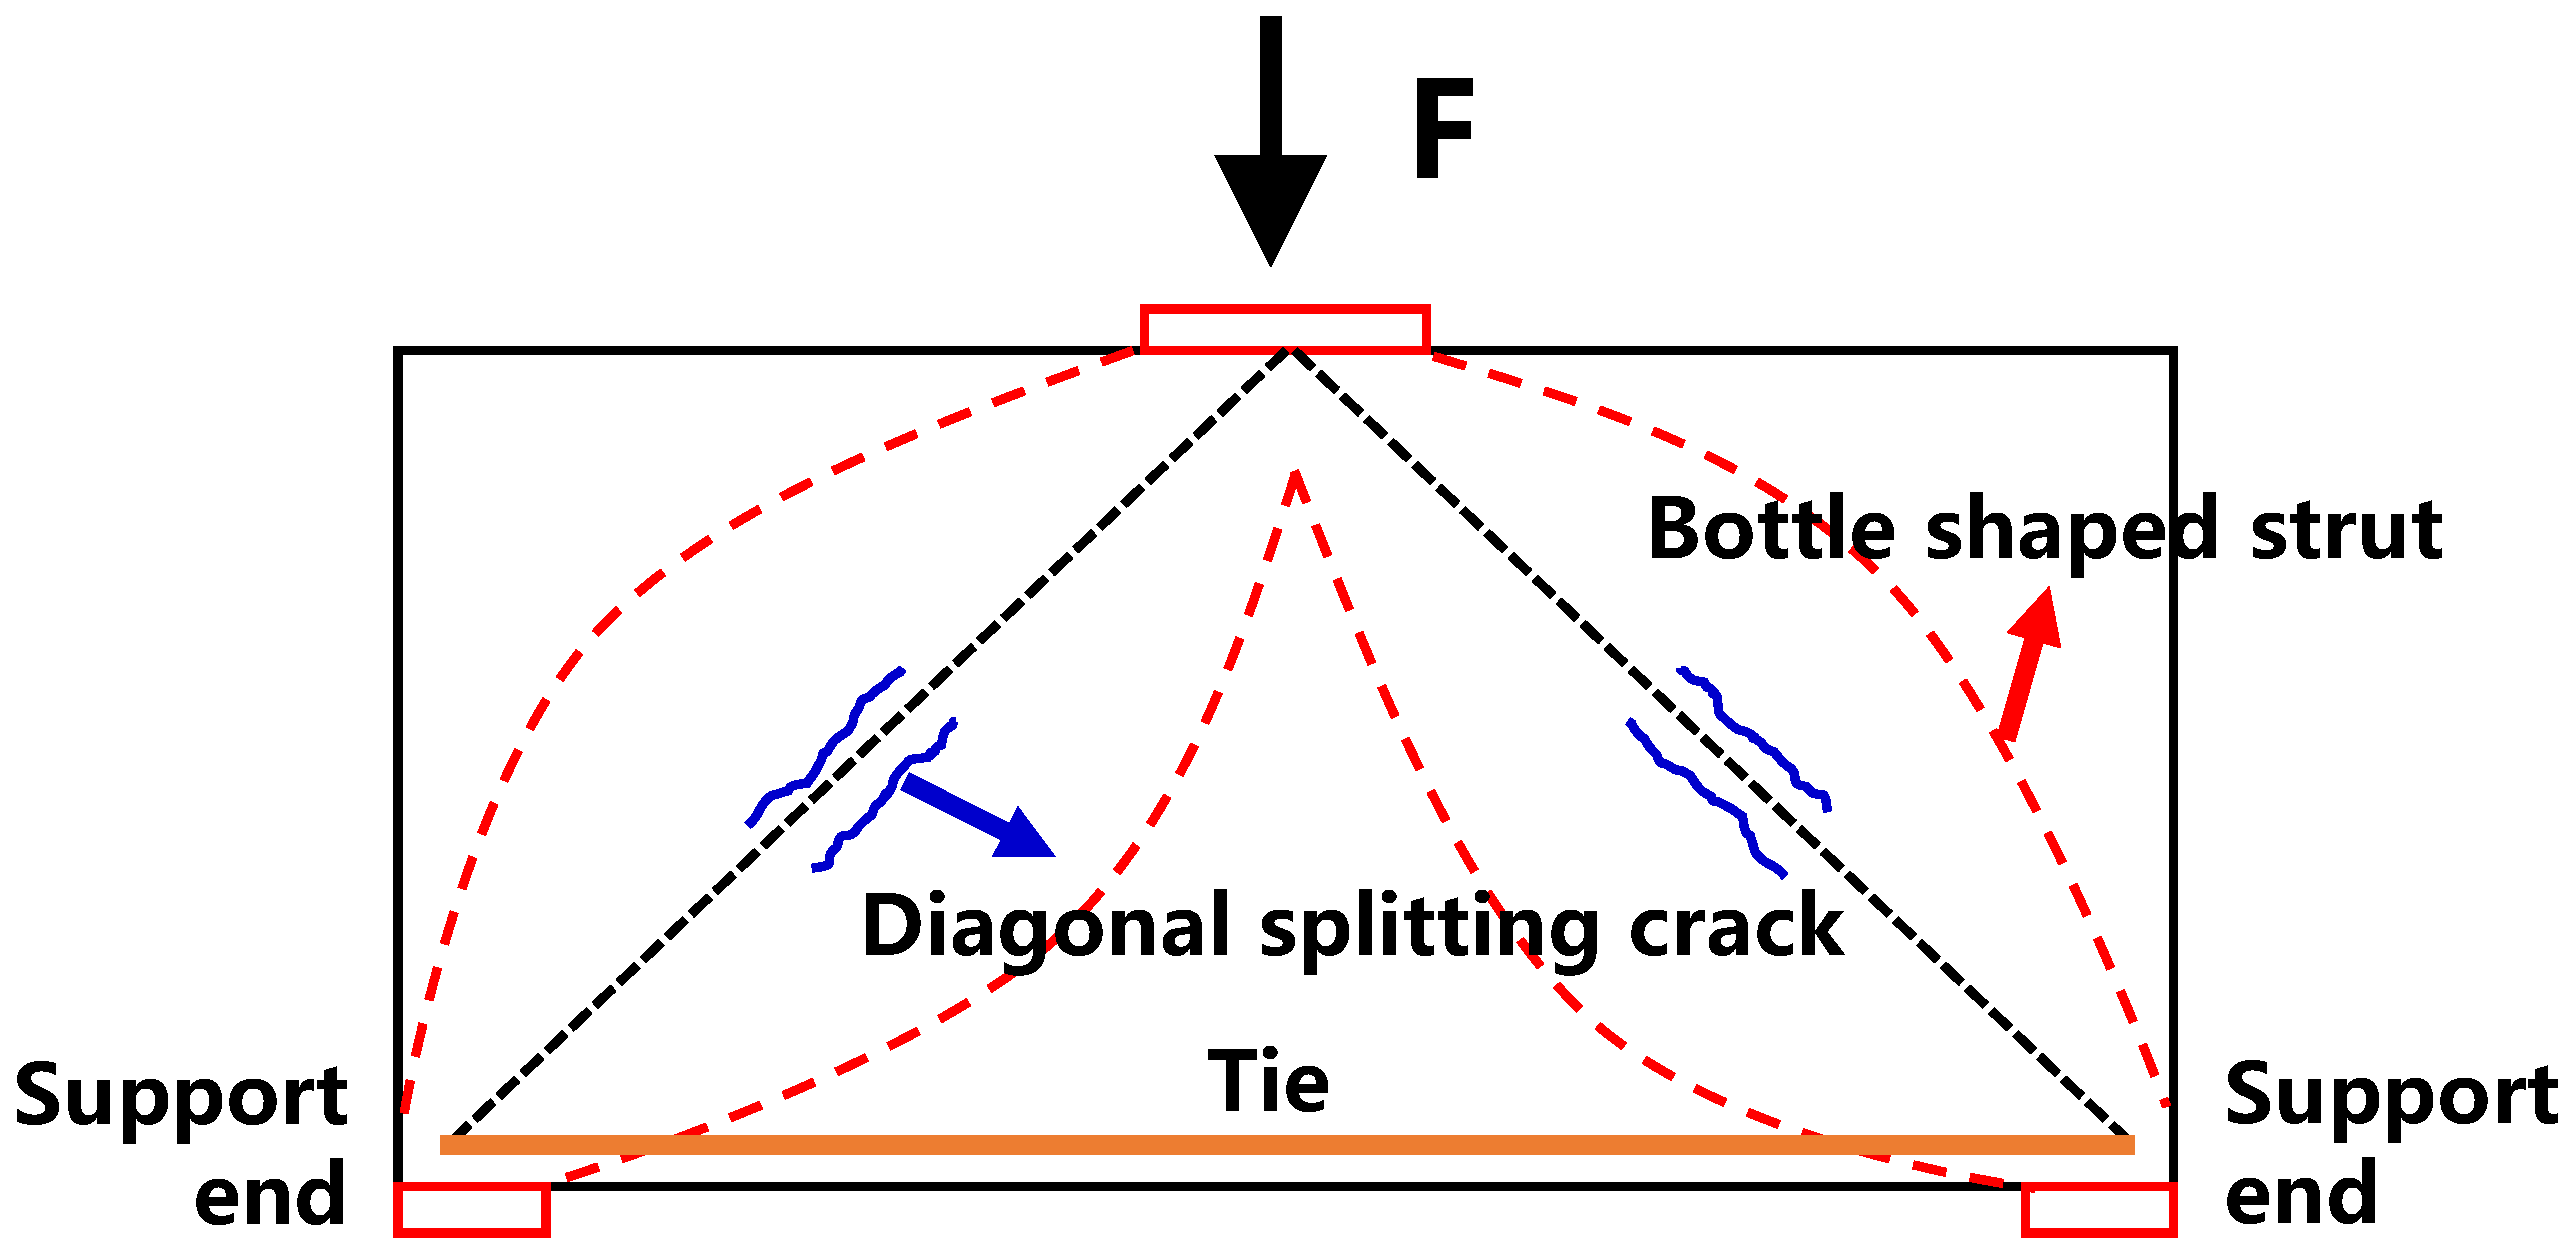
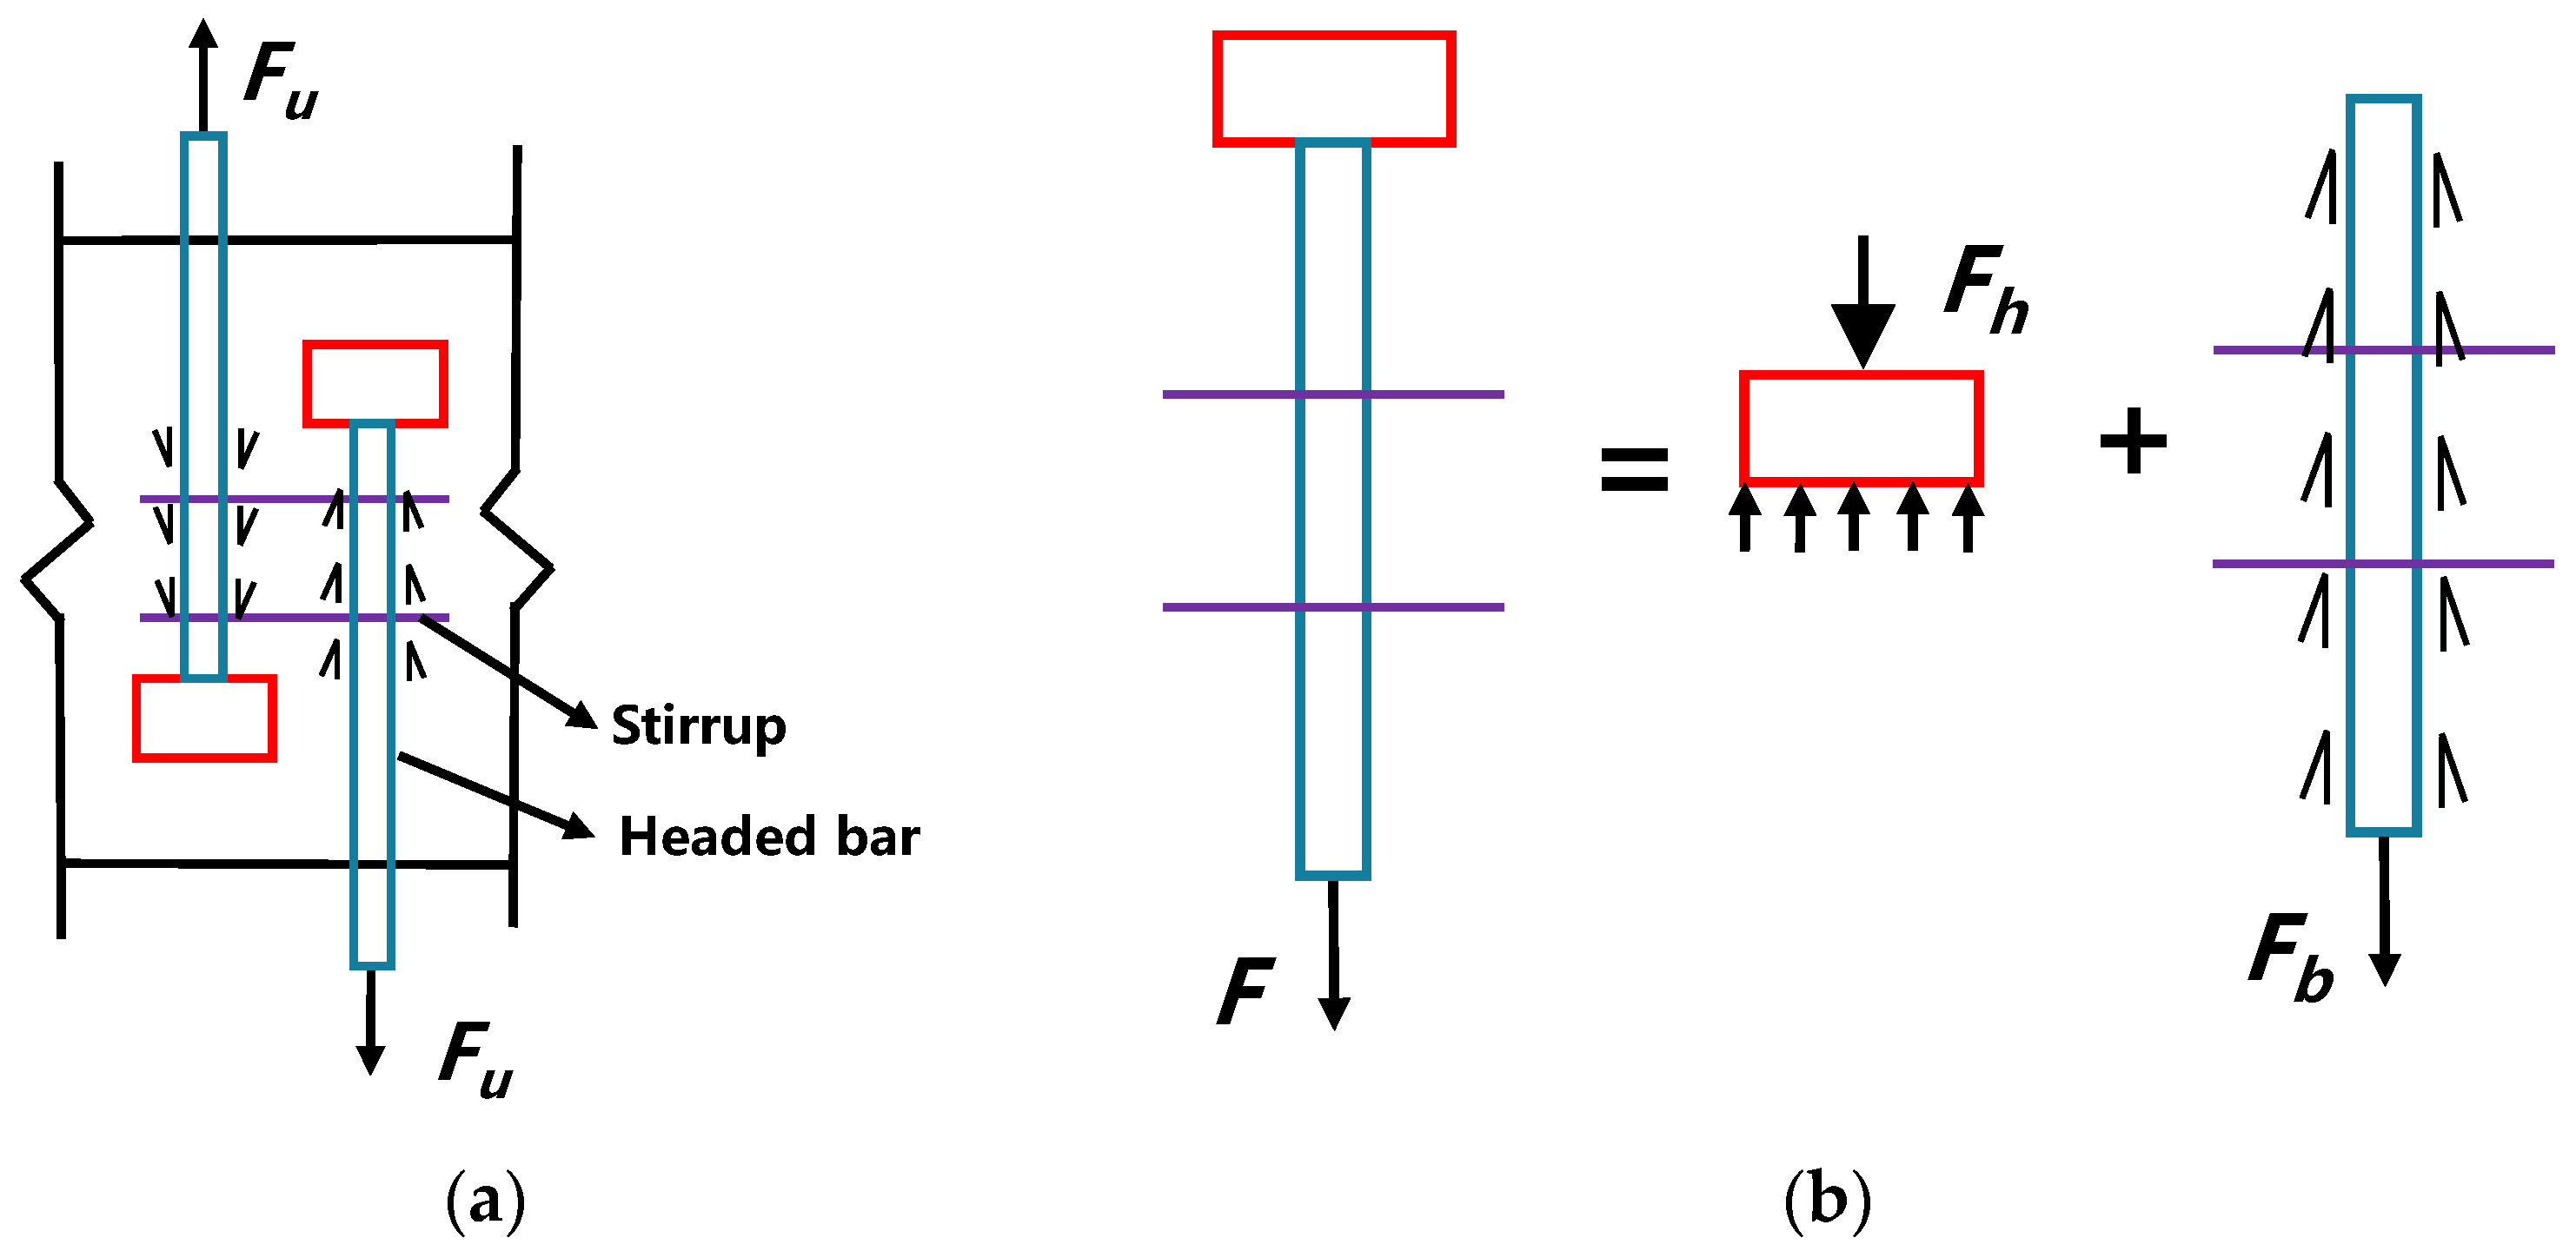
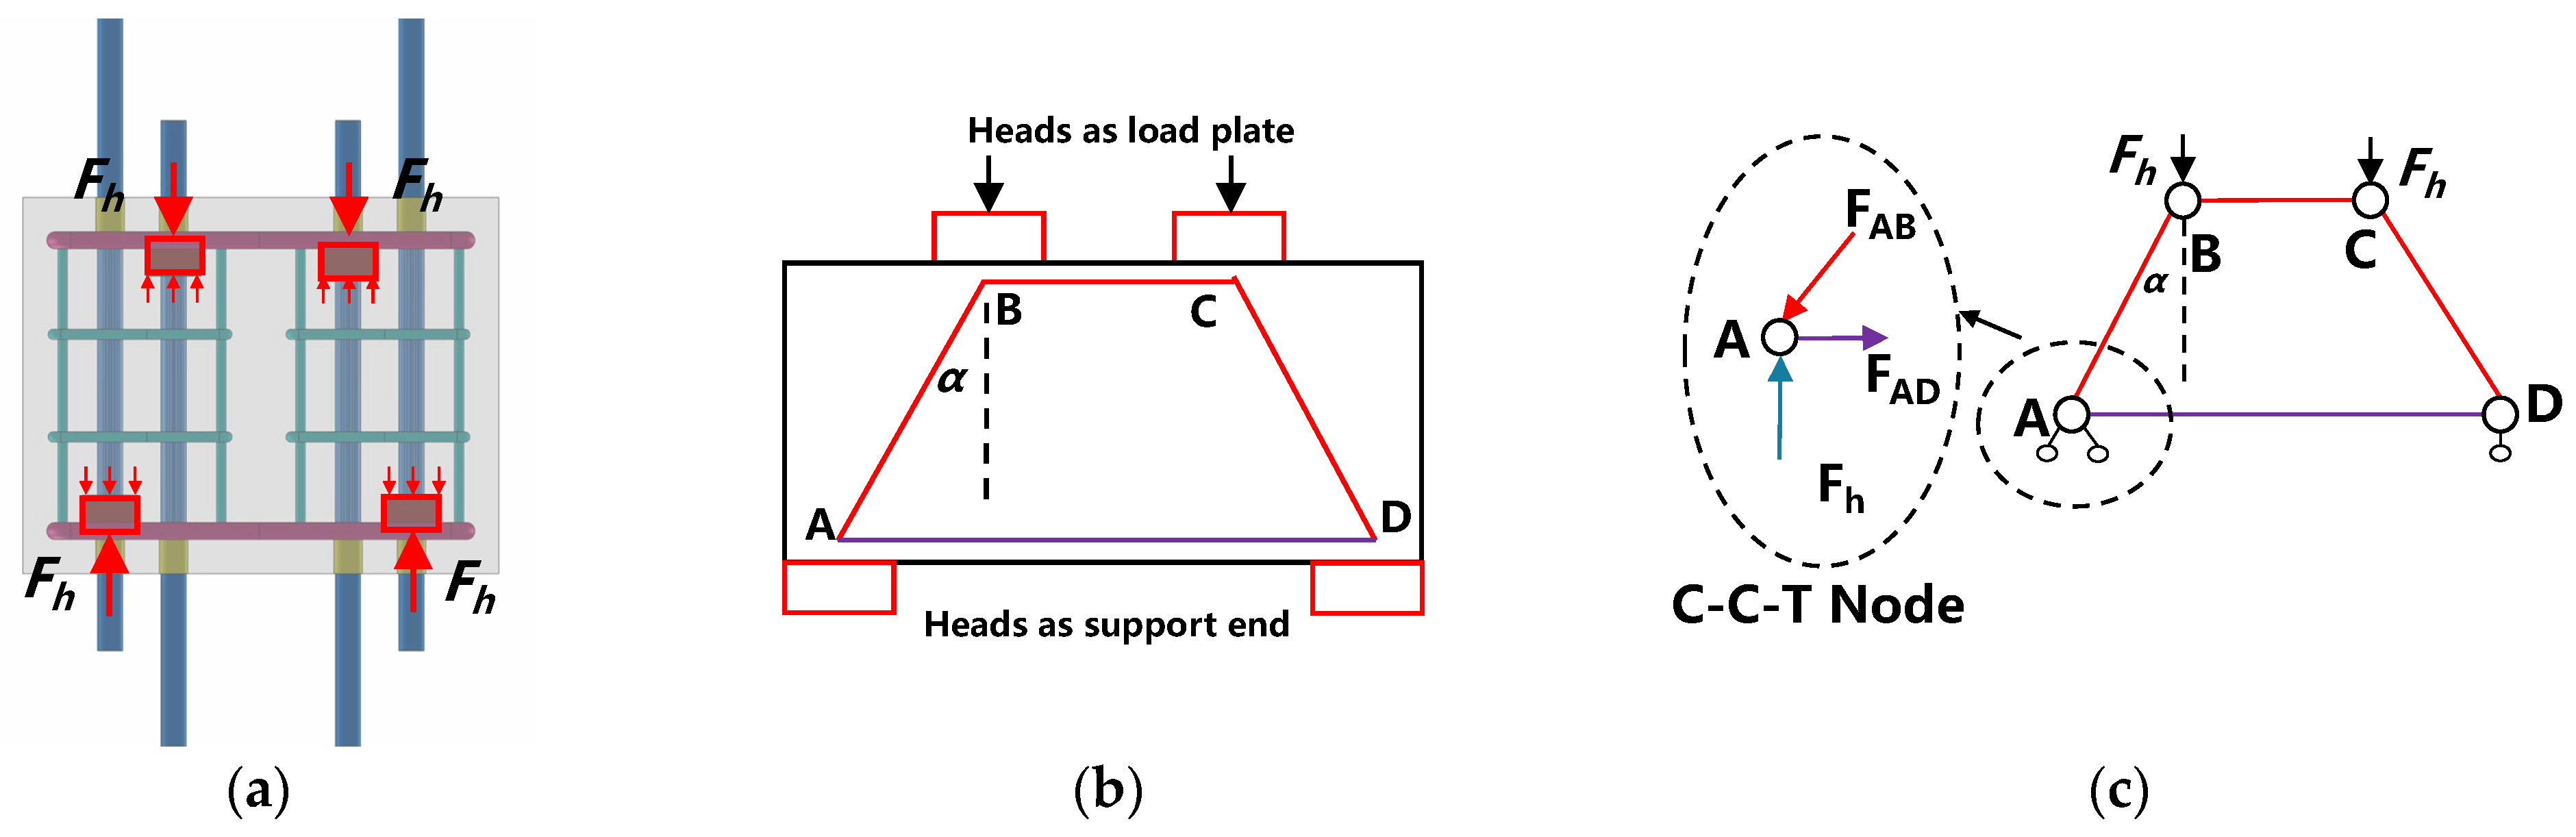
- All the specimens of CHBC develop diagonal cracks between the heads at peak load, which are caused by the concrete compression of the diagonal strut between the heads. The confined stirrups across the diagonal cracks mainly sustain tension force and function to provide with confinement to core concrete rather than bearing shear force which can contribute to the bearing capacity of CHBC directly;
- (2)
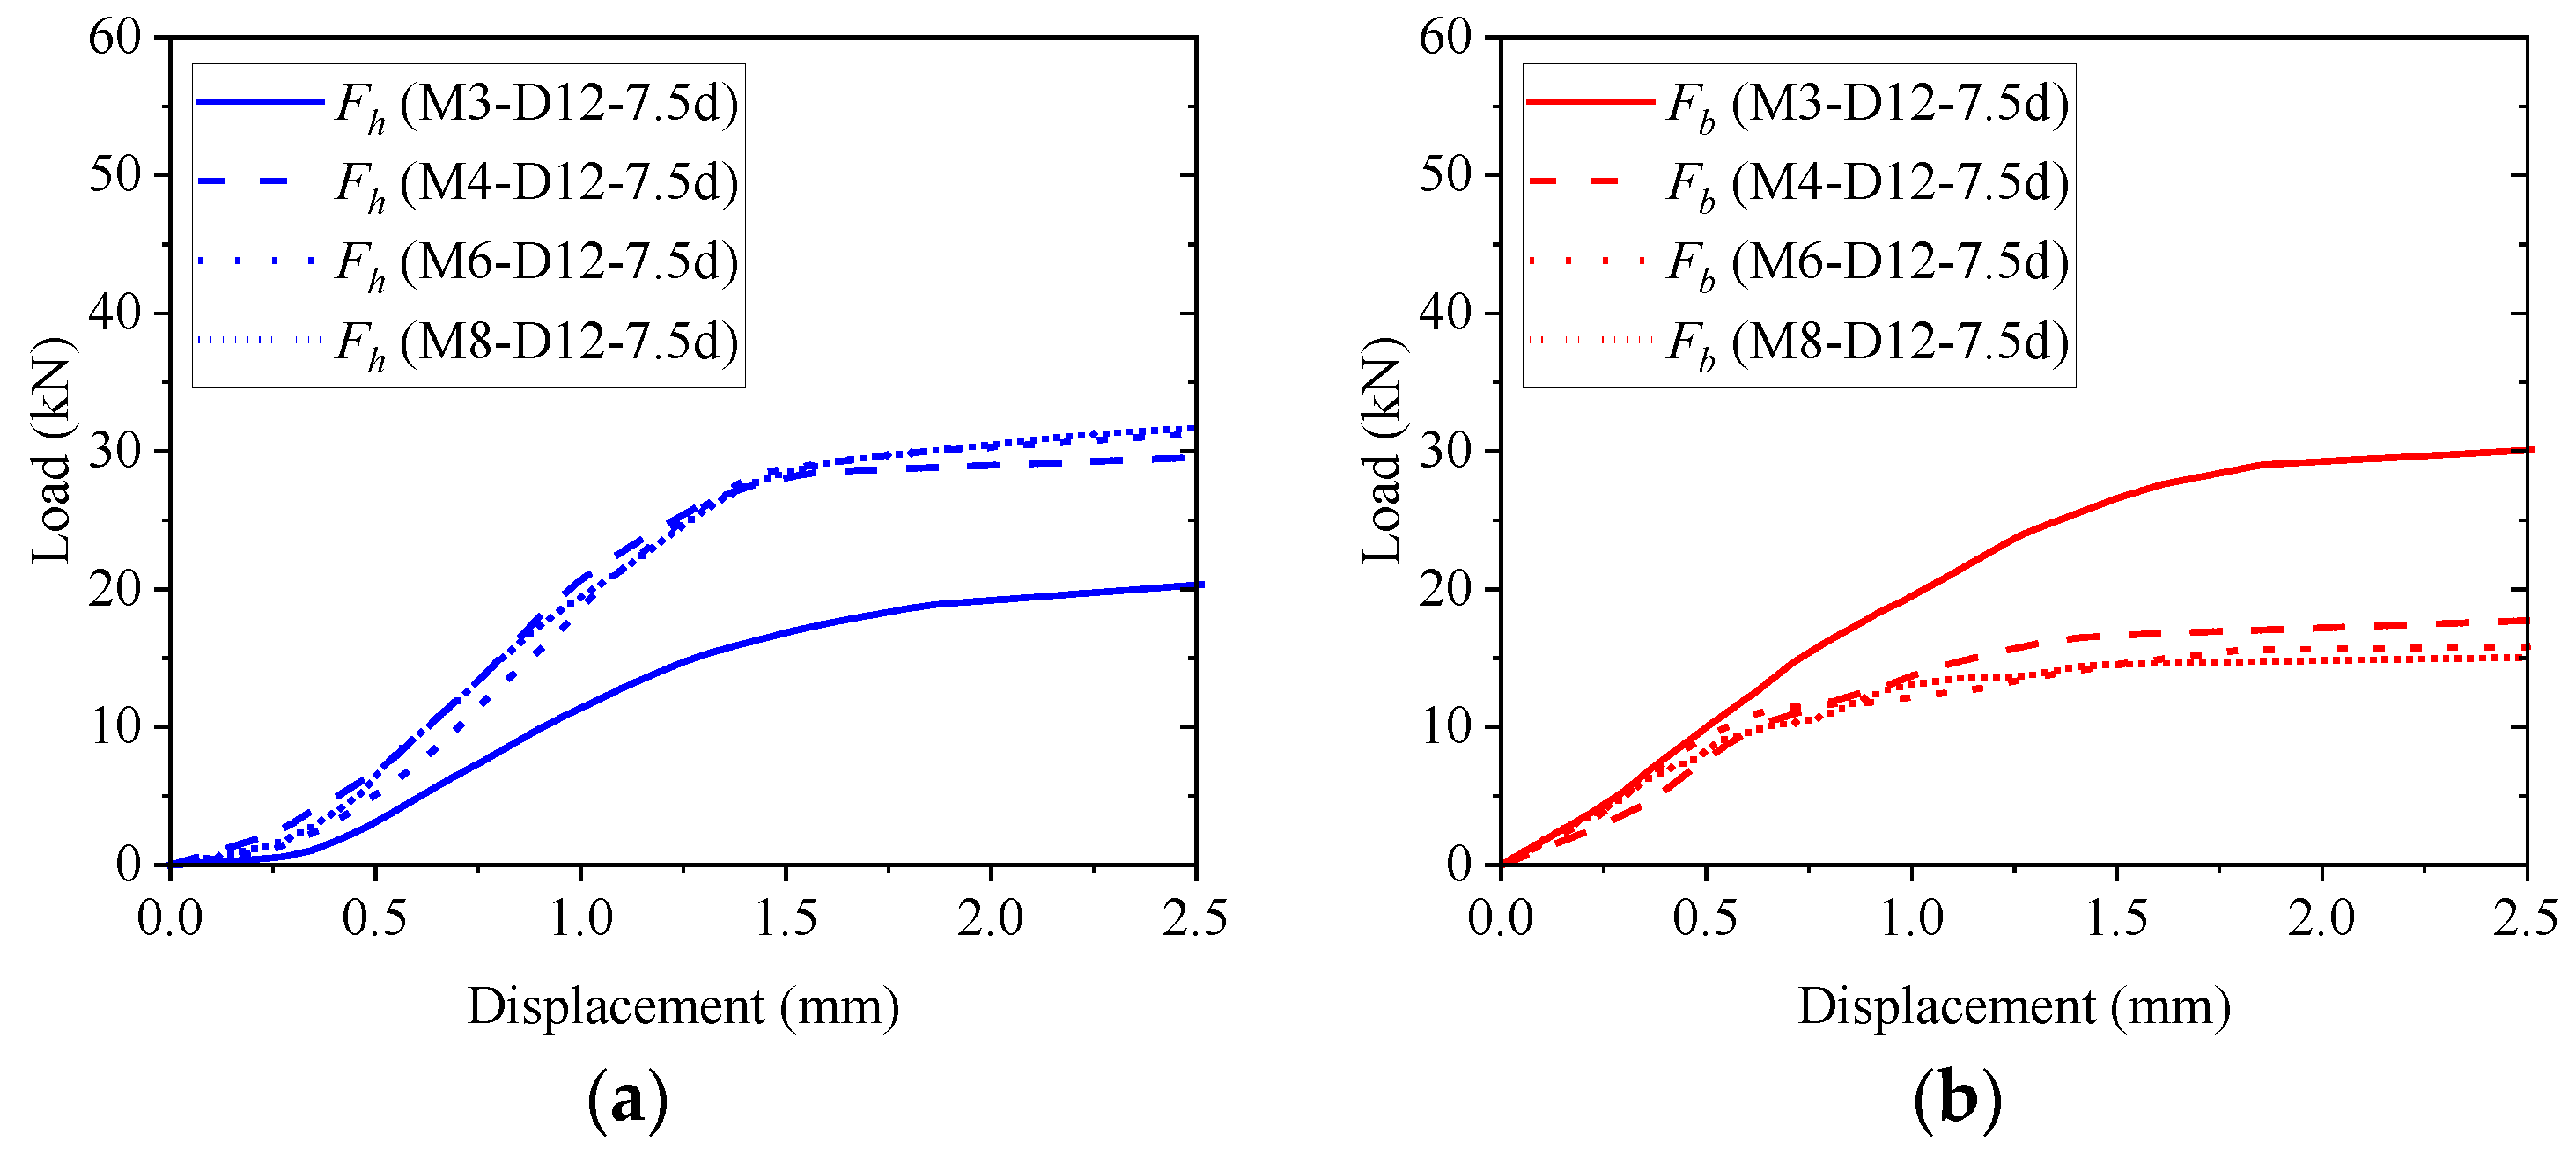
- For a head size equal to eight times the steel bar cross-sectional area, CHBC with only a 90 mm lap length, which is only 24% of the required lap length of straight bar splice and 36% of anchorage length of headed bar, can achieve the ultimate tensile strength of Φ12 steel bar. The CHBC can reduce the lap length of deformed bars significantly;
- (3)
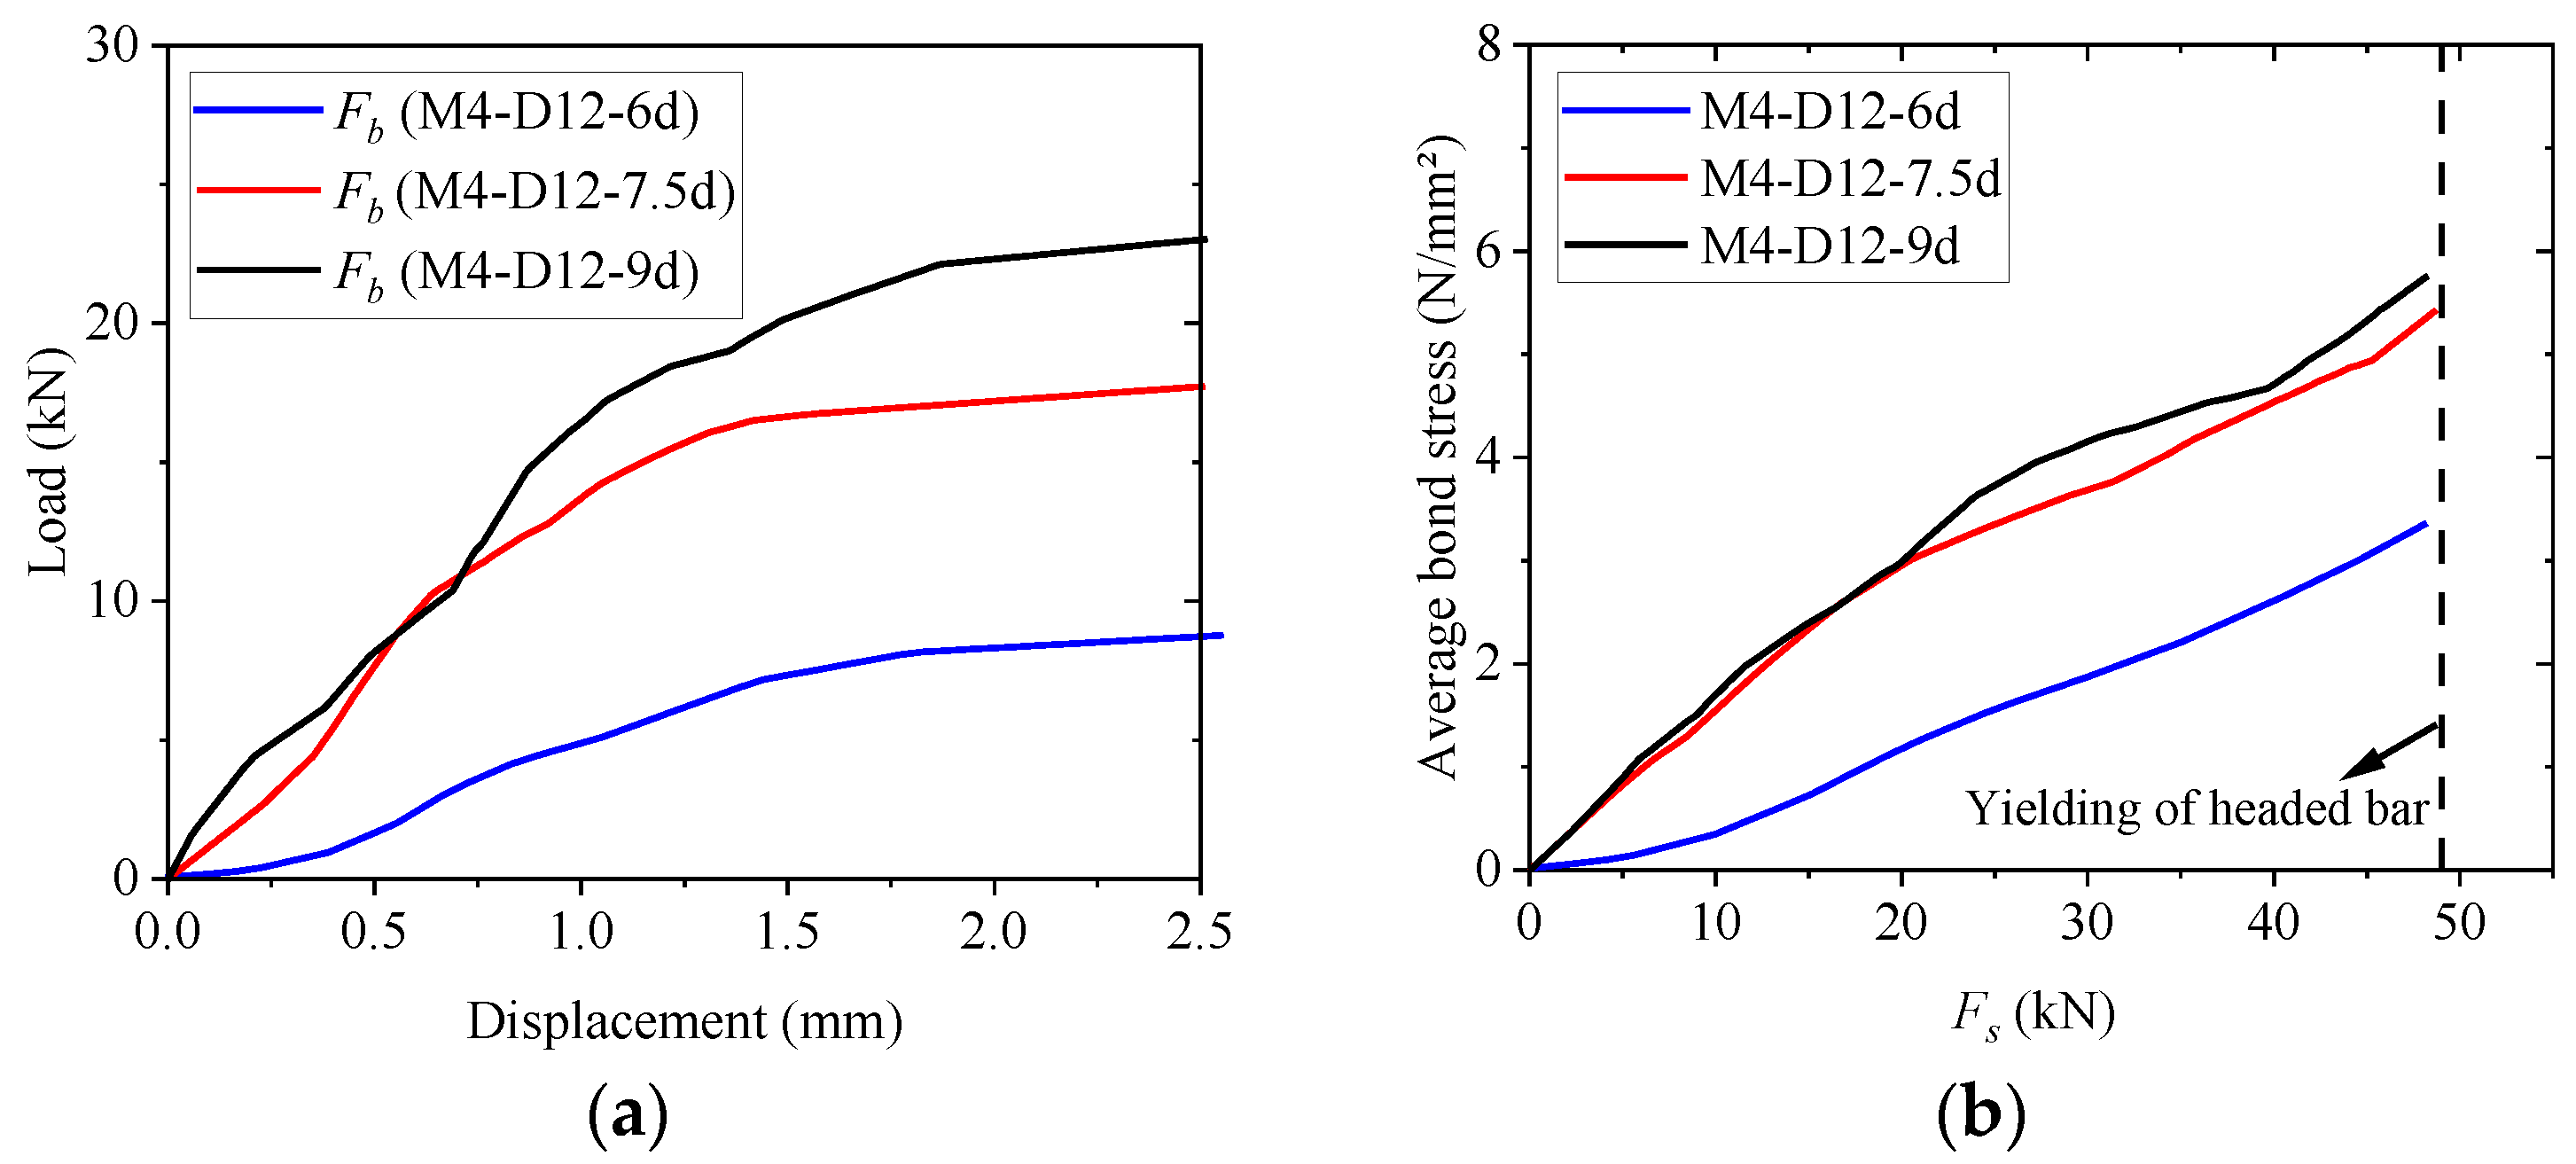
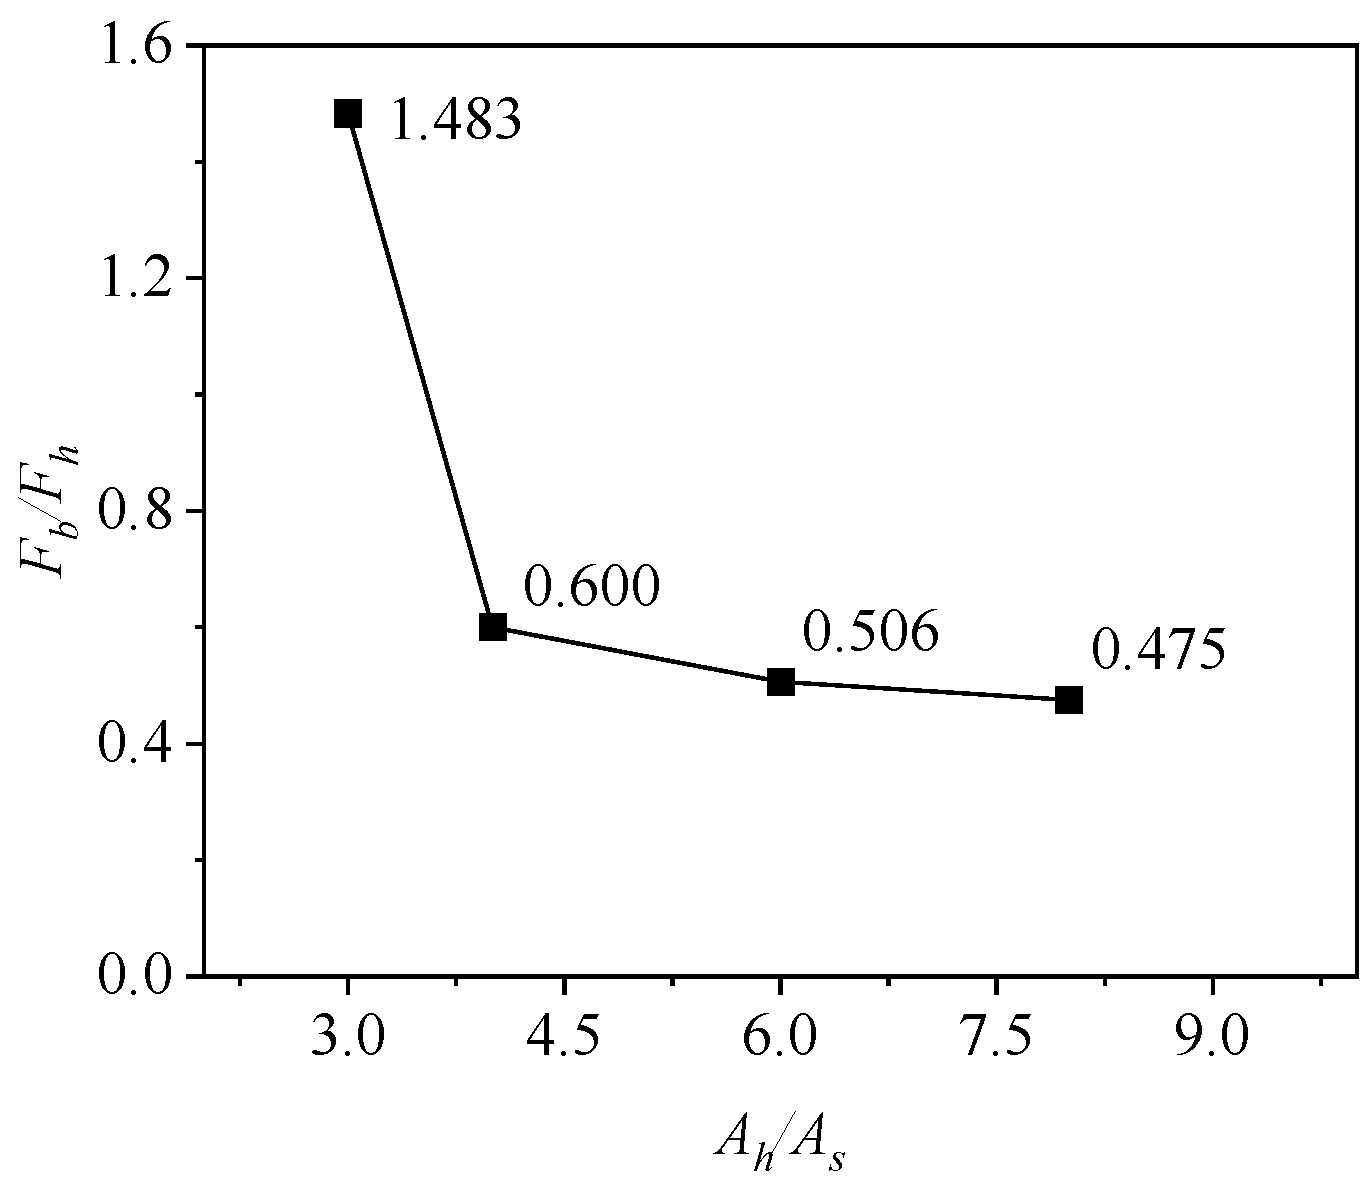
- The bearing capacity of CHBC consists of bond behavior force (Fb) and concrete compression force at the head (Fh). When the headed bar is yielding, the value of Fb/Fh increases linearly with the increase in lap length and decreases with the increase in head size. In addition, the increase in lap length by 50% (increasing from 72 mm to 108 mm) can increase the value of Fb/Fh by 310.0% and the increase in head size by 100% (increasing from 4 As to 8 As) can decrease the value of Fb/Fh by 20.8%. The change of Fb/Fh by head size is less obvious than that of lap length;
- (4)
- When the headed bar is yielded, under same head size, for the lap length increasing by 50% (increasing from 72 mm to 108 mm), the average bond stress is increased by 71.9% when the bond slip is increased by 48.4%. It is recommended to use small lap length in CHBC in order to reduce the slip values;
- (5)
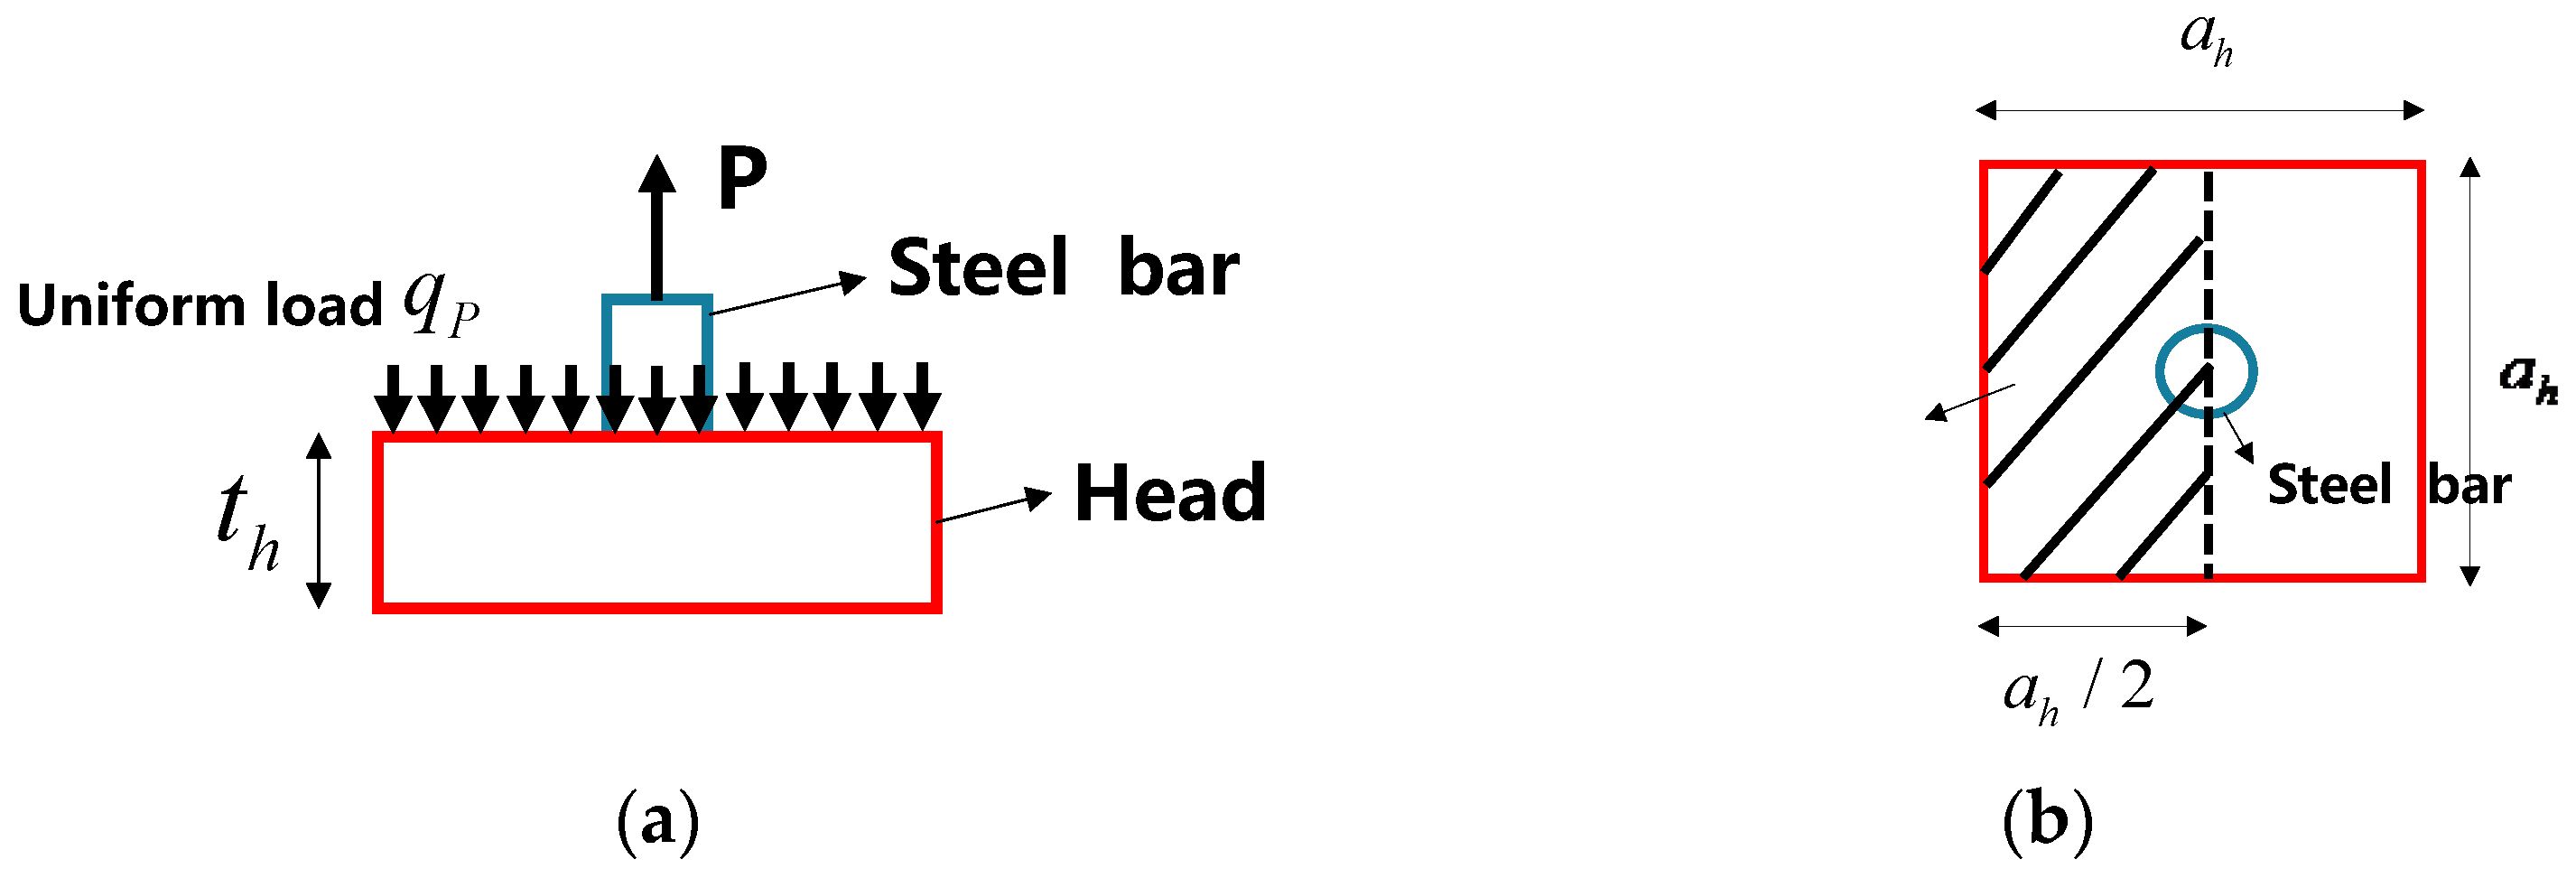
- Based on the superposition method and STM theory, a calculation method is proposed to determine the bearing capacity of CHBC. Compared with the test results, the deviation of predicted results is less than 10%. Moreover, the calculation of the required head thickness is suggested to prevent the head from yielding.
Author Contributions
Funding
Institutional Review Board Statement
Informed Consent Statement
Data Availability Statement
Conflicts of Interest
References
- Breccolotti, M.; Gentile, S.; Tommasini, M.; Materazzi, A.L.; Bonfigli, M.F.; Pasqualini, B.; Colone, V.; Gianesini, M. Beam-column joints in continuous RC frames: Comparison between cast-in-situ and precast solutions. Eng. Struct. 2016, 127, 129–144. [Google Scholar] [CrossRef]
- Yee, A.A. Social Benefits and of Environmental Precast For Concrete. PCI J. 2001, 46, 14–19. [Google Scholar] [CrossRef] [Green Version]
- Chang, Y.; Li, X.; Masanet, E.; Zhang, L.; Huang, Z.; Ries, R. Unlocking the green opportunity for prefabricated buildings and construction in China. Resour. Conserv. Recycl. 2018, 139, 259–261. [Google Scholar] [CrossRef]
- Yee, A.A. Splice Sleeve for Reinforing Bars. U.S. Patent 3,540,763, 17 November 1970. [Google Scholar]
- Lu, Z.; Huang, J.; Li, Y.; Dai, S.; Peng, Z.; Liu, X.; Zhang, M. Mechanical behaviour of grouted sleeve splice under uniaxial tensile loading. Eng. Struct. 2019, 186, 421–435. [Google Scholar] [CrossRef] [Green Version]
- Liu, C.; Pan, L.; Liu, H.; Tong, H.; Yang, Y.; Chen, W. Experimental and numerical investigation on mechanical properties of grouted-sleeve splices. Constr. Build. Mater. 2020, 260, 120441. [Google Scholar] [CrossRef]
- Yuan, H.; Zhenggeng, Z.; Naito, C.J.; Weijian, Y. Tensile behavior of half grouted sleeve connections: Experimental study and analytical modeling. Constr. Build. Mater. 2017, 152, 96–104. [Google Scholar] [CrossRef]
- Ling, J.H.; Rahman, A.B.; Ibrahim, I.S.; Abdul Hamid, Z. Tensile capacity of grouted splice sleeves. Eng. Struct. 2016, 111, 285–296. [Google Scholar] [CrossRef]
- Yu, Q.; Sun, J.; Xu, Z.; Li, L.; Zhang, Z.; Yu, S. Mechanical Analysis of Grouted Sleeve Lapping Connector. Appl. Sci. 2019, 9, 4867. [Google Scholar] [CrossRef] [Green Version]
- Zheng, G.; Kuang, Z.; Xiao, J.; Pan, Z. Mechanical performance for defective and repaired grouted sleeve connections under uniaxial and cyclic loadings. Constr. Build. Mater. 2020, 233, 117233. [Google Scholar] [CrossRef]
- Zhang, X.; Zhao, Y.; Guo, Y.; Li, Z. Equivalent stress-strain model of half grouted sleeve connection under monotonic and repeated loads: Experiment and preliminary application. Eng. Struct. 2022, 260, 114247. [Google Scholar] [CrossRef]
- Liu, Q.; Lin, Y.; Li, J.; Yang, C.; Chen, J.; Zhang, M.; Liu, B. Bond strength prediction model of defective grout materials in half-grouted sleeve connections under uniaxial and cyclic loadings. Constr. Build. Mater. 2022, 352, 128981. [Google Scholar] [CrossRef]
- Lu, Z.; Wang, Y.; Li, J.; Fan, Q. Experimental study on seismic performance of L-shaped partly precast reinforced concrete shear wall with cast-in-situ boundary elements. Struct. Des. Tall Spec. Build. 2019, 28, e1602. [Google Scholar] [CrossRef]
- Li, J.; Fan, Q.; Lu, Z.; Wang, Y. Experimental study on seismic performance of T-shaped partly precast reinforced concrete shear wall with grouting sleeves. Struct. Des. Tall Spec. Build. 2019, 28, e1632. [Google Scholar] [CrossRef]
- Li, J.; Wang, L.; Lu, Z.; Wang, Y. Experimental study of L-shaped precast RC shear walls with middle cast-in-situ joint. Struct. Des. Tall Spec. Build. 2018, 27, e1457. [Google Scholar] [CrossRef]
- Xu, L.; Pan, J.; Cai, J. Seismic performance of precast RC and RC/ECC composite columns with grouted sleeve connections. Eng. Struct. 2019, 188, 104–110. [Google Scholar] [CrossRef]
- Xu, L.; Pan, J.; Guo, L. Mechanical performance of precast RC columns with grouted sleeve connections. Eng. Struct. 2022, 252, 113654. [Google Scholar] [CrossRef]
- Liu, H.; Chen, J.; Xu, C.; Du, X. Seismic performance of precast column connected with grouted sleeve connectors. J. Build. Eng. 2020, 31, 101410. [Google Scholar] [CrossRef]
- Yu, J.; Zhang, E.; Xu, Z.; Guo, Z. Seismic Performance of Precast Concrete Frame Beam-Column Connections with High-Strength Bars. Materials 2022, 15, 7127. [Google Scholar] [CrossRef]
- Hb, J.; Hs, Z.; Wq, L.; Hy, Y. Experimental study on plug-in filling hole for steel bar anchorage of the PC structure. J. Harbin Inst. Technol. 2011, 43, 28–36. [Google Scholar]
- Chen, Z.; Wang, H.; Wang, H.; Jiang, H.; Zhu, X.; Wang, K. Application of the Hybrid Simulation Method for the Full-Scale Precast Reinforced Concrete Shear Wall Structure. Appl. Sci. 2018, 8, 252. [Google Scholar] [CrossRef] [Green Version]
- Gu, Q.; Dong, G.; Wang, X.; Jiang, H.; Peng, S. Research on pseudo-static cyclic tests of precast concrete shear walls with vertical rebar lapping in grout-filled constrained hole. Eng. Struct. 2019, 189, 396–410. [Google Scholar] [CrossRef]
- Ma, C.; Jiang, H.; Wang, Z. Experimental investigation of precast RC interior beam-column-slab joints with grouted spiral-confined lap connection. Eng. Struct. 2019, 196, 109317. [Google Scholar] [CrossRef]
- Xu, F.; Wang, K.; Wang, S.; Li, W.; Liu, W.; Du, D. Experimental bond behavior of deformed rebars in half-grouted sleeve connections with insufficient grouting defect. Constr. Build. Mater. 2018, 185, 264–274. [Google Scholar] [CrossRef]
- Guo, T.; Yang, J.; Wang, W.; Li, C. Experimental investigation on connection performance of fully-grouted sleeve connectors with various grouting defects. Constr. Build. Mater. 2022, 327, 126981. [Google Scholar] [CrossRef]
- Xiao, S.; Wang, Z.; Li, X.; Harries, K.A.; Xu, Q.; Gao, R. Study of effects of sleeve grouting defects on the seismic performance of precast concrete shear walls. Eng. Struct. 2021, 236, 111833. [Google Scholar] [CrossRef]
- Xie, L.; Wang, X.; Zhong, B.; Yang, C.; Chen, X.; Miao, Q.; Liu, Q. Full-scale experimental investigation on the seismic performance of PC columns before and after repair of grouting defects. J. Build. Eng. 2022, 58, 104996. [Google Scholar] [CrossRef]
- Li, F.; Abruzzese, D.; Milani, G.; Li, S. Influence of internal defects of semi grouted sleeve connections on the seismic performance of precast monolithic concrete columns. J. Build. Eng. 2022, 49, 104009. [Google Scholar] [CrossRef]
- Devries, R.A. Anchorage of Headed Reinforcement in Concrete; The University of Texas at Austin: Austin, TX, USA, 1996. [Google Scholar]
- Bashandy, T.R. Application of Headed Bar in Concrete Member; The University of Texas at Austin: Austin, TX, USA, 1996. [Google Scholar]
- Islam, S.; Afefy, H.M.; Sennah, K.; Azimi, H. Bond characteristics of straight- and headed-end, ribbed-surface, GFRP bars embedded in high-strength concrete. Constr. Build. Mater. 2015, 83, 283–298. [Google Scholar] [CrossRef]
- Maranan, G.B.; Manalo, A.C.; Karunasena, W.; Benmokrane, B. Pullout behaviour of GFRP bars with anchor head in geopolymer concrete. Compos. Struct. 2015, 132, 1113–1121. [Google Scholar] [CrossRef]
- Miao, T.; Zheng, W. Local bearing capacity of concrete under the combined action of pressure force and bond stress. Constr. Build. Mater. 2019, 226, 152–161. [Google Scholar] [CrossRef]
- Miao, T.; Zheng, W. Distributive relationship of anchorage force relative to reinforcement and headed bars. Eng. Struct. 2020, 209, 109961. [Google Scholar] [CrossRef]
- Yuan, L.; Yang, Y.; Sun, B.; Zhao, W. Anchorage behavior of large shear reinforcements with anchor heads and 180-degree hooks. Structures 2022, 44, 647–664. [Google Scholar] [CrossRef]
- Singhal, S.; Chourasia, A.; Kajale, Y. Cyclic behaviour of precast reinforced concrete beam-columns connected with headed bars. J. Build. Eng. 2021, 42, 103078. [Google Scholar] [CrossRef]
- GB 50010-2020; Code for Design of Concrete Structure. China Architecture and Building Press: Beijing, China, 2020.
- ACI318-19; Building Code Requirements for Structural Concrete and Commentary. American Concrete Institute: Farmington Hills, MI, USA, 2019.
- Thompson, M.; Ledesma, A.; Breen, J. Lap splices anchored by headed bars. ACI Struct. J. 2006, 2, 271–279. [Google Scholar]
- Tarabia, A.M.; Mahmoud, Z.I.; Shoukry, M.S.; Abudina, A.A. Performance of R.C. slabs with lap splices using headed bars. Alex. Eng. J. 2016, 55, 2729–2740. [Google Scholar] [CrossRef] [Green Version]
- Li, L.; Jiang, Z. Flexural Behavior and Strut-and-tie Model of Joints with headed bar details Connecting Precast Members. Perspect. Sci. 2016, 7, 253–260. [Google Scholar] [CrossRef] [Green Version]
- Vella, J.P.; Vollum, R.L.; Jackson, A. Flexural behaviour of headed bar connections between precast concrete panels. Constr. Build. Mater. 2017, 154, 236–250. [Google Scholar] [CrossRef]
- Vella, J.P.; Vollum, R.L.; Jackson, A. Investigation of headed bar joints between precast concrete panels. Eng. Struct. 2017, 138, 351–366. [Google Scholar] [CrossRef]
- Vella, J.P.; Vollum, R.; Jackson, A. Headed Bar Connections between Precast Concrete Panels Loaded in Bending; Springer International Publishing: Cham, Switzerland, 2017; pp. 989–997. [Google Scholar]
- Vieito, I.; Herrador, M.F.; Martínez-Abella, F.; Varela-Puga, F. Proposal and assessment of an efficient test configuration for studying lap splices in reinforced concrete. Eng. Struct. 2018, 165, 1–10. [Google Scholar] [CrossRef]
- GB/T 50081-2019; Standard for Test Method of Mechanical Properties on Ordinary Concrete. China Architecture and Building Press: Beijing, China, 2019.
- GB/T 28900-2012; Test Methods of Steel for Reinforcement of Concrete. China Architecture and Building Press: Beijing, China, 2012.
- GB/T 228.1-2021; Metallic Materials-Tensile Testing-Part 1: Method of Test at Toom Temperature. General Adminstration of Quality Supervision, Inspection and Quarantine of China: Beijing, China, 2021.
- JGJ 355-2015; Technical Specification for Grout Sleeve Splicing of Rebars. China Architecture and Building: Beijing, China, 2015.
- Jun, T.; Zuo-Hua, L.; An, L.; Liang, C. A Plastic-Damage Uniaxial Compression Constitutive Model for Stirrup Confined Concrete. Eng. Mech. 2014, 31, 189–194. [Google Scholar]
- Collins, M.P.; Mitchell, D. Prestressed Concrete Structures; Prentice-Hall: Englewood Cliffs, NJ, USA, 1991. [Google Scholar]
- Mander, J.B.; Priestley, M.J.N.; Park, R. Theoretical stress strain model for confined concrete. J. Struct. Eng. 1988, 114, 1804–1826. [Google Scholar] [CrossRef]
- Youlin, X.; Wendu, S.; Hong, W. An experiment study of bond-anchorage properties of bar in concrete. J. Build. Struct. 1994, 15, 26–37. [Google Scholar]


| No. | Specimen ID | ah (mm) | d (mm) | Ah/As | llap (mm) | llap/d | Stirrup | c (mm) | Number of Specimens |
|---|---|---|---|---|---|---|---|---|---|
| 1 | M4-D12-6d | 22 | 12 | 4.0 | 72 | 6 | Φ6@40 | 49 | 3 |
| 2 | M4-D12-7.5d | 22 | 4.0 | 90 | 7.5 | 3 | |||
| 3 | M4-D12-9d | 22 | 4.0 | 108 | 9 | 3 | |||
| 4 | M3-D12-7.5d | 18 | 3.0 | 90 | 7.5 | 3 | |||
| 5 | M6-D12-7.5d | 26 | 6.0 | 90 | 7.5 | 3 | |||
| 6 | M8-D12-7.5d | 30 | 8.0 | 90 | 7.5 | 3 |
| Material | fcu (MPa) | fc (MPa) | fy (MPa) | fu (MPa) | Ec or Es (GPa) | v |
|---|---|---|---|---|---|---|
| C30 concrete | 31.9 | 19.7 | / | / | 28.9 | 0.212 |
| Φ6 stirrup | / | / | 463.4 | 613.7 | 209.2 | / |
| Φ10 stirrup | / | / | 472.5 | 637.0 | 195.4 | / |
| Φ12 headed bar | / | / | 448.6 | 617.2 | 199.0 | / |
| Head steel plate | / | / | 250.7 | 407.3 | 209.3 | 0.282 |
| Grade | Water to Binder Ratio | Water (kg/m³) | Cement (kg/m³) | Fine Aggregate (kg/m³) | Coarse Aggregate (kg/m³) | Superplasticizer (kg/m³) | Fly Ash (kg/m³) |
|---|---|---|---|---|---|---|---|
| C30 | 0.40 | 153 | 300 | 710 | 1110 | 7.6 | 80 |
| No. | Specimen ID | Fu (kN) | Average of Fu (kN) | Fy,s (kN) | Fu,s (kN) | Failure Mode |
|---|---|---|---|---|---|---|
| 1 | M4-D12-6d | 53.6 | 54.6 | 50.7 | 69.8 | Steel bar connector failure |
| 2 | 53.9 | |||||
| 3 | 56.2 | |||||
| 4 | M4-D12-7.5d | 59.5 | 60.0 | 50.7 | 69.8 | Steel bar connector failure |
| 5 | 60.0 | |||||
| 6 | 60.6 | |||||
| 7 | M4-D12-9d | 61.1 | 62.0 | 50.7 | 69.8 | Steel bar connector failure |
| 8 | 61.9 | |||||
| 9 | 63.1 | |||||
| 10 | M3-D12-7.5d | 53.3 | 54.6 | 50.7 | 69.8 | Steel bar connector failure |
| 11 | 55.2 | |||||
| 12 | 55.3 | |||||
| 13 | M6-D12-7.5d | 63.4 | 65.8 | 50.7 | 69.8 | Steel bar connector failure |
| 14 | 66.4 | Steel bar connector failure | ||||
| 15 | 67.5 | Steel bar rupture failure | ||||
| 16 | M8-D12-7.5d | 66.4 | 66.7 | 50.7 | 69.8 | Steel bar rupture failure |
| 17 | 66.7 | |||||
| 18 | 67.0 |
| No. | Specimen ID | Fu,exp (kN) | Fu,pre (kN) | Fu,pre/Fu,exp |
|---|---|---|---|---|
| 1 | M4-D12-6d | 53.6 | 52.1 | 0.972 |
| 2 | 53.9 | 52.1 | 0.967 | |
| 3 | 56.2 | 52.1 | 0.927 | |
| 4 | M4-D12-7.5d | 59.5 | 60.1 | 1.010 |
| 5 | 60.0 | 60.1 | 1.002 | |
| 6 | 60.6 | 60.1 | 0.992 | |
| 7 | M4-D12-9d | 61.1 | 67.0 | 1.097 |
| 8 | 61.9 | 67.0 | 1.082 | |
| 9 | 63.1 | 67.0 | 1.062 | |
| 10 | M3-D12-7.5d | 53.3 | 53.8 | 1.009 |
| 11 | 55.2 | 53.8 | 0.975 | |
| 12 | 55.3 | 53.8 | 0.973 | |
| 13 | M6-D12-7.5d | 63.4 | 66.5 | 1.049 |
| 14 | 66.4 | 66.5 | 1.002 | |
| 15 | 67.5 | 66.5 | 0.985 | |
| 16 | M8-D12-7.5d | 66.4 | 69.8 | 1.051 |
| 17 | 66.7 | 69.8 | 1.046 | |
| 18 | 67.0 | 69.8 | 1.042 | |
| Mean value | 1.013 | |||
| Coefficient of variation (COV) | 0.045 | |||
Disclaimer/Publisher’s Note: The statements, opinions and data contained in all publications are solely those of the individual author(s) and contributor(s) and not of MDPI and/or the editor(s). MDPI and/or the editor(s) disclaim responsibility for any injury to people or property resulting from any ideas, methods, instructions or products referred to in the content. |
© 2023 by the authors. Licensee MDPI, Basel, Switzerland. This article is an open access article distributed under the terms and conditions of the Creative Commons Attribution (CC BY) license (https://creativecommons.org/licenses/by/4.0/).
Share and Cite
Liang, Z.; Gong, C.; Liang, W.; Zhang, S.; Li, X. Behavior of Confined Headed Bar Connection for Precast Reinforced Concrete Member Assembly. Appl. Sci. 2023, 13, 827. https://doi.org/10.3390/app13020827
Liang Z, Gong C, Liang W, Zhang S, Li X. Behavior of Confined Headed Bar Connection for Precast Reinforced Concrete Member Assembly. Applied Sciences. 2023; 13(2):827. https://doi.org/10.3390/app13020827
Chicago/Turabian StyleLiang, Zihao, Chao Gong, Weiqiao Liang, Sumei Zhang, and Xiaozhong Li. 2023. "Behavior of Confined Headed Bar Connection for Precast Reinforced Concrete Member Assembly" Applied Sciences 13, no. 2: 827. https://doi.org/10.3390/app13020827