Article

An Improved Passing Network for Evaluating Football Team Performance

International Football College, Tongji University, Shanghai 200092, China
*
Author to whom correspondence should be addressed.
Appl. Sci. 2023, 13(2), 845; https://doi.org/10.3390/app13020845
Submission received: 6 December 2022 / Revised: 2 January 2023 / Accepted: 3 January 2023 / Published: 7 January 2023

Abstract

:
With the continuous development of sensor technology, the realization of football techniques and tactics comes with richer technical support. Among them, network analysis has been widely used to analyze passing behavior, and some results have been achieved. However, most of these studies directly determine the weight of passing sidelines between players by measuring the number of passes, without carefully considering the potential contribution value of a single pass. In view of this problem, we carried out the following work: (1) map the football field to the coordinate system, calculate the endpoint coordinates of each pass, and take the coordinates as coefficients to obtain the weighted value of a single channel, and then calculate all channels together to achieve a directional channel network. (2) On this network, for the team evaluation that is difficult to quantify, we suggest that the ratio of the average clustering coefficient to the average intermediate centrality be taken as the overall network index to measure the coordination of the football team’s performance. (3) We tested the proposed index with two scores. The index passed the correlation and sensitivity tests, which proves that it is helpful for explaining the coordination level of the team and has certain reference value for the evaluation of the competitiveness of the football team.

1. Introduction

Graph theory is widely used in life, especially in recent years; it has gradually become the core module of artificial intelligence and machine learning. In this paper, we focus on the integration of graph theory and sports performance analysis based on the passing network with our own teaching practice, and explore the new teaching mode of sports colleges and universities in the context of new engineering, and also deepen the concept of integration of sports and education into teaching.
Graph theory is the study of graphs, which are graphs consisting of a number of given points and a line connecting two points, and are usually used to describe a particular relationship between certain features. Graph theory is an important knowledge structure in applied mathematics, and the famous Königsberg Seven Bridges Problem, the Chinese Postman Problem, and the Cargo Stretcher Problem are all classical problems in graph theory [1,2]. Regarding the teaching of graph theory, teachers in different professional fields integrating students’ professional backgrounds have created rich research, investigations, and reforms, such as the allocation of forces in air defense soldiers’ combat readiness and operations [3,4], the return of gourds to jars and jars to baskets, the wolf and sheep crossing the river, and other intellectual problems or stories from childhood [5,6]. However, there are relatively few cases of teaching graph theory integrating expertise in the field of sports, but such cases are of extraordinary significance for engineering students in sports colleges in the context of the new engineering [7,8]. In this paper, we mainly introduce the application of graph theory in the field of sports with the example of a passing network, which breaks the boring, pure-learning points of graph theory knowledge on the one hand and develops students’ vision and further understanding of new sports technology on the other hand. More importantly, it gives students a clearer understanding of their majors, enhances their interest in learning cross-disciplinary knowledge, and engages them in research and development of new sports technology by understanding graph theory in the field of sports. By understanding the application of graph theory in the field of sports, students are motivated to engage in sports science and technology.

2. Related Work

Graph or network analysis plays a role in a wide range of problems, from sociology to sports science [9,10,11]. Mathematicians have developed rich theories around network science, aiming to study the connections among the components of a network in a more efficient and reliable way. The passing movement is an ideal data source to measure team performance because of its repeated times and high behavior discrimination in football matches [12,13]. The passing map of a football match has high similarity to the data structure of a computer network graph, and the application of network science to map the passing line has high analyzability, which can intuitively reveal the information in the passing data flow [14]. Football is characterized by a large range of ball flow and high frequency of convection. Traditional statistics such as goals, assists, and ball possession rate are not enough to measure individual and overall performance of a football team [15,16]. By using network science to analyze the phenomenon of football, which has better theoretical support, the complex movement behavior set can be abstracted into a more intuitive network topology structure. A professional football team with a distinctive style can display high levels of tactical discipline and coordination during matches, but images presented by television cameras alone are difficult to quantify and cannot support computer analysis. Therefore, in this study, we use network science to focus on the overall coordination index of team performance. In order to transform the passing routes into a network structure, we collected the total data from 38 rounds of Everton’s Premier League matches in 2017–2018 from a public free data platform, and mapped the passing image distribution for every Everton’s match into a weighted oriented network, with each node corresponding to the players in the match. Directional lines between nodes represent passes between players, and there are usually two opposite edges between nodes corresponding to two players. Before this study, some scholars had built a similar network [17], but their network simply takes the times of players passing each other as the weight of the edges between nodes. Obviously, this weight calculation method has a higher contribution proportion for the players who frequently pass each other in the middle or back court, but not so friendly to the frontcourt players who do not pass the ball as often and have a high turnover rate. Therefore, we optimize the weight calculation method and build an improved passing network.
At present, centrality analysis is commonly used for measurement of the passing network [18]. By using degree centrality [19], closeness centrality [20], eigenvector centrality [21], and their variants, researchers can analyze player interactions in transfer sequences and further classify teams’ tactical styles [22,23,24]. However, it is difficult for a single centrality measure to contribute high quality indicators to the analysis of complex passing networks [25]. We take the ratio of network global clustering coefficient to average betweenness centrality as the network consistency index. Furthermore, the correlation test and sensitivity analysis are carried out between the index and Everton’s score of attack and defense efficiency and the score of control power in each match, and relatively ideal results are obtained, which prove the validity and reliability of the proposed index. This index evaluates the coordination of the overall performance of football teams from a quantitative perspective, and can improve the difficult problem of football team evaluation. We try to promote this index to help coaches have a clearer and intuitive understanding of their team’s performance.

3. Methodology

3.1. Research Object

In this study, all the passing information from Everton in 38 matches of the Premier League in the 2017–2018 season is taken as the sample to establish and optimize the passing network and construct the evaluation index of the team.
In a high-level league, a team with the most possession in a game can pass an incredible number of passes. Premier League champions Manchester City played Manchester United (744 and 528 passes per game, respectively) with a high passing rate that had a positive impact on the result. Although high-level football teams have more passes and can contribute a larger data set of passes, the accumulation effect of the stars in the team can guide the progress of the game and cover the tactical configuration effect of the stars in the team, and especially cause a dominant effect to team offensive efficiency [26]. As a result, individual star performances can disrupt the internal balance of the team, and the interpretation of team performance by match results can be diluted [27]. Based on this, in order to better reflect the overall performance of the team, we choose Everton, which has been in the middle of the Premier League for a long time, as the research object. In 2017–2018, Everton finished eighth in the league, winning 13, drawing 10, and losing 15 in 38 games, scoring 44 goals, and conceding 58. As a veritable mid-table team, Everton is ideal for passing network analysis, with a small number of elite players (Rooney, Pickford) who satisfy the diversity of their players’ make-up, and a wealth of passing statistics (14,782 passes accumulated, 238 key passes accumulated, 389 passes per game).

3.2. Model Specification

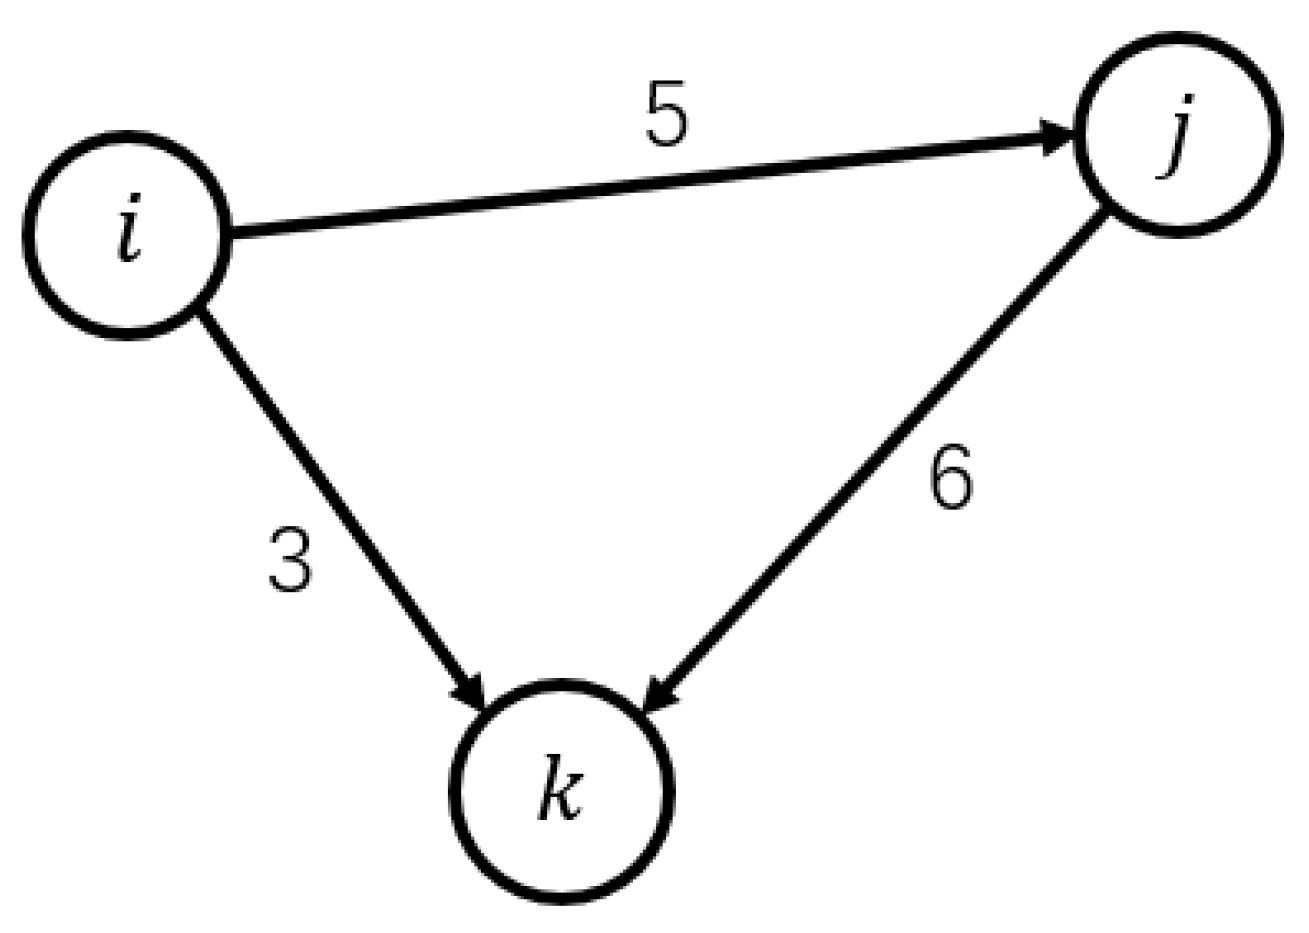
3.2.1. Basic Network Model

Since passing is a one-way relationship, the original matrix is a directed multivalued matrix. In order to reflect the two-way passing relationship between players, it is necessary to transform the original matrix into a symmetric matrix based on the sum of out-degree and in-degree. In the construction of the passing route model, the specific position of each player on the field is not very important. On the contrary, the abstract position and the topological relationship of players in the passing process are the core of the research. In other words, topology is more critical than measurement in this model, which coincides with the basic characteristics of network models. Referring to the network model, the passing network can be described as G = (V, E), where V represents the set of nodes in the figure, namely the set of players. E represents a directed edge, namely the path of the pass. The specific construction method is as follows: for Everton’s 38 rounds of Premier League matches, a passing network is built in each round. The passing network of each match is defined as the network connecting arrows between players as nodes. All players who have completed passing actions (including starters and substitutes, excluding the players who entered the roster but did not play and the players who did not complete the pass after playing), the corresponding nodes constitute the network node set. If player i successfully completes a pass to player i, then nodes i and j have one and only one edge from i to j, see Figure 1.

3.2.2. Weight Models of Directed Edges and Nodes

After establishing the basic network graph model, we optimize the measurement method of the importance of the directed edge.
In the past passing network graph model, the number of passes between players is often used to directly determine the weight of directed edges, ignoring some important factors that affect the value of passes [28]. Such weights only partly reflect how closely the players are connected. In general, the average physical distance between two players on the court is significantly negatively correlated with the frequency of passes to each other; for a player, the bigger the target, the stronger the target tendency. As a result, the constructed passing network is prone to clustering effect, that is, the passing group composed of a few players (usually middle and back court players) will be separated from the team, destroying the consistency of the network and presenting the characteristics of short node distance and thick edges on the network. The distribution in local network invariants calculated from similar networks is chaotic and the standard deviation of global network invariants is large, which is not conducive to network analysis. In order to solve these problems, we propose a quantization equation for evaluating the value of a single pass based on pass coordinates, and iterate the weight of the directed edge with the improved weighting method. Finally, the contribution weight of different passes is expressed by continuous variable smoothing. The adjacency matrix of the team is constructed according to the weight of directed edges between players, which is convenient to display the value of the pass, and can be visualized in the form of directed edge width in the network diagram.
On this basis, according to the adjacency matrix built by directed edges, we establish the value evaluation model of nodes.
Considering that football is a high-intensity, intermittent, and long-term sport, the position of players on the field changes irregularly and continuously, while for the passing network, the position of nodes is fixed. Therefore, in this study, the average coordinates of each player passing and receiving the ball are used to fix the node position. In the calculation of node value, the degree of input and output are important factors to measure, which respectively represent the number of times that the node is used as the end point and the start point of the edge. In the weighted digraph, this degree is replaced by the sum of the weights of the directed edges. We refer to Google PageRank algorithm [29] and comprehensively determine the value of nodes in the network according to the feature vectors of input and output of each node in the directed pass graph, which is an indicator to measure the importance of players in the match. Reflected in the passing network diagram, this value reflects the size of the node: the larger the node, the higher the value of the player.
PageRank, the competitive sorting algorithm that Google relies on, calculates the ranking of nodes in a graph based on the structure of incoming links. The structure of the passing network is similar to the low-quantity Internet, and the player nodes are similar to web pages. The importance of the passing network is determined by the integration of inbound and outgoing degrees, so it is suitable for PageRank analysis. At the same time, passing network has particularity and may have strong connectivity. The network nodes are fixed, and it is easy to form a closed loop between nodes, that is, a loop occurs between a node and its own or a few other nodes, resulting in excessive algorithm iteration. In this process, the PageRank value of a few nodes increases monotonically. In order to solve the problem, jump-out probability is added to prevent overfitting by adding a penalty term. For the passing network, the PageRank value of player i is calculated by the formula
P R ( i ) = α j M i P R ( j ) W ( j ) + ( 1 α ) N
In Formula (1), Mi is the set of all players whose out degree is i, W(j) is the sum of the out-degree weights of player j, N is the total number of players, and α is the probability constant of jumping out.
After the completion of network construction, the passing network diagram presents four elements: edge, edge weight, node, and node value.

3.2.3. Establishment of Coordination Index

For players’ performance on the field, researchers have built mature individual multidimensional ratings through various means [30]. Football data companies such as Whoscored and Opta provide fans worldwide with intuitive single-game ratings of players. Computer scientists can do more ground-breaking research based on player ratings [30,31]. Compared with the relatively perfect research on individual players, the research on the whole team is obviously more challenging. A football team is a multidimensional set of players on the field, and the contribution of nodes to the network fluctuates with increasing time. Meanwhile, the weight of each node in the network is expanded or shrunk by the triangle pair formed by the combination of a few nodes. Therefore, the network mapped by the set of players is more difficult to scientifically and accurately reflect the fit between theoretical science and practical science. Compared with individual analysis, team network analysis has more practical value. Professional coaching teams can better master the individual technical and tactical abilities of team members, but lack of clear evaluation standards for the overall play of the team, most of which are judged by experience. Intuitive metrics to measure team performance can help coaching teams develop better tactical policies. Based on this, we propose a quantitative index of team coordination based on improved passing network, which is intended to provide a numerical evaluation standard for the overall team consistency.
In complex network theory, there are many local network invariants or global network invariants to measure the whole network index, which can be reflected in the passing network. For example, the network average shortest path calculated by the improved Dijkstra algorithm [32] represents the average total value of passes of players in a single game, which is an effective method to measure passing performance. The closeness centrality [33] of each node in the network is measured as the average distance between the node and all other nodes, which can measure the difficulty of reaching a player by passing the ball. A higher measurement means better player integration. When the mean value of closeness centrality of all nodes is high, it means that the passing network has high acceptance for all players, and the team plays more evenly as a whole. High-quality team passing patterns require both stable ball control and high quality passing by surprise, which correspond to the stability and randomness of network attributes, respectively. The small world [34] of the network is defined as the difference between the ratio of the average clustering coefficient and the average shortest path to each random network attribute. This value determines the proportion of stability and randomness in the network, which can be used to measure the team’s ball control and creativity. These network global invariants can describe the reduction degree of the passing network to the actual game in a limited way and give theoretical results. However, they have their own defects and are still difficult to use for meeting the research requirements. In order to measure the quality of the passing network, it is necessary to consider both the individual performance of the player and the overall balance of the team. In this study, the ratio of network average clustering coefficient to average betweenness centrality value is used as the coordination measure of the passing network. The betweenness centrality [35,36] of the network is used to measure the degree to which nodes in the network are on paths between other nodes, and is usually defined as the percentage of shortest paths through a node. Higher betweenness centrality value means a player is dominant on his team, while lower value, which is more evenly distributed, means more balanced team performance. The average clustering coefficient [37] can be obtained by calculating the arithmetic mean of the local clustering coefficient of each node [38], which can measure the overall robustness of the network. A higher average clustering coefficient indicates that the team has a higher passing stability.

4. Results

A graph can be defined in terms of a set, but it is mostly represented as a graph, and it can also be represented as a matrix. The matrix representation of graphs facilitates the study of graph properties by algebraic methods, and also provides convenience for computers to store and process information of graphs. Therefore, the matrix representation of the graph is of great importance. In order to represent a graph by a matrix, the order of the vertices or edges must be specified, i.e., the graph must be calibrated. This subsection discusses how to integrate the association matrix, adjacency matrix, and reachability matrix of directed graphs with soccer networks.

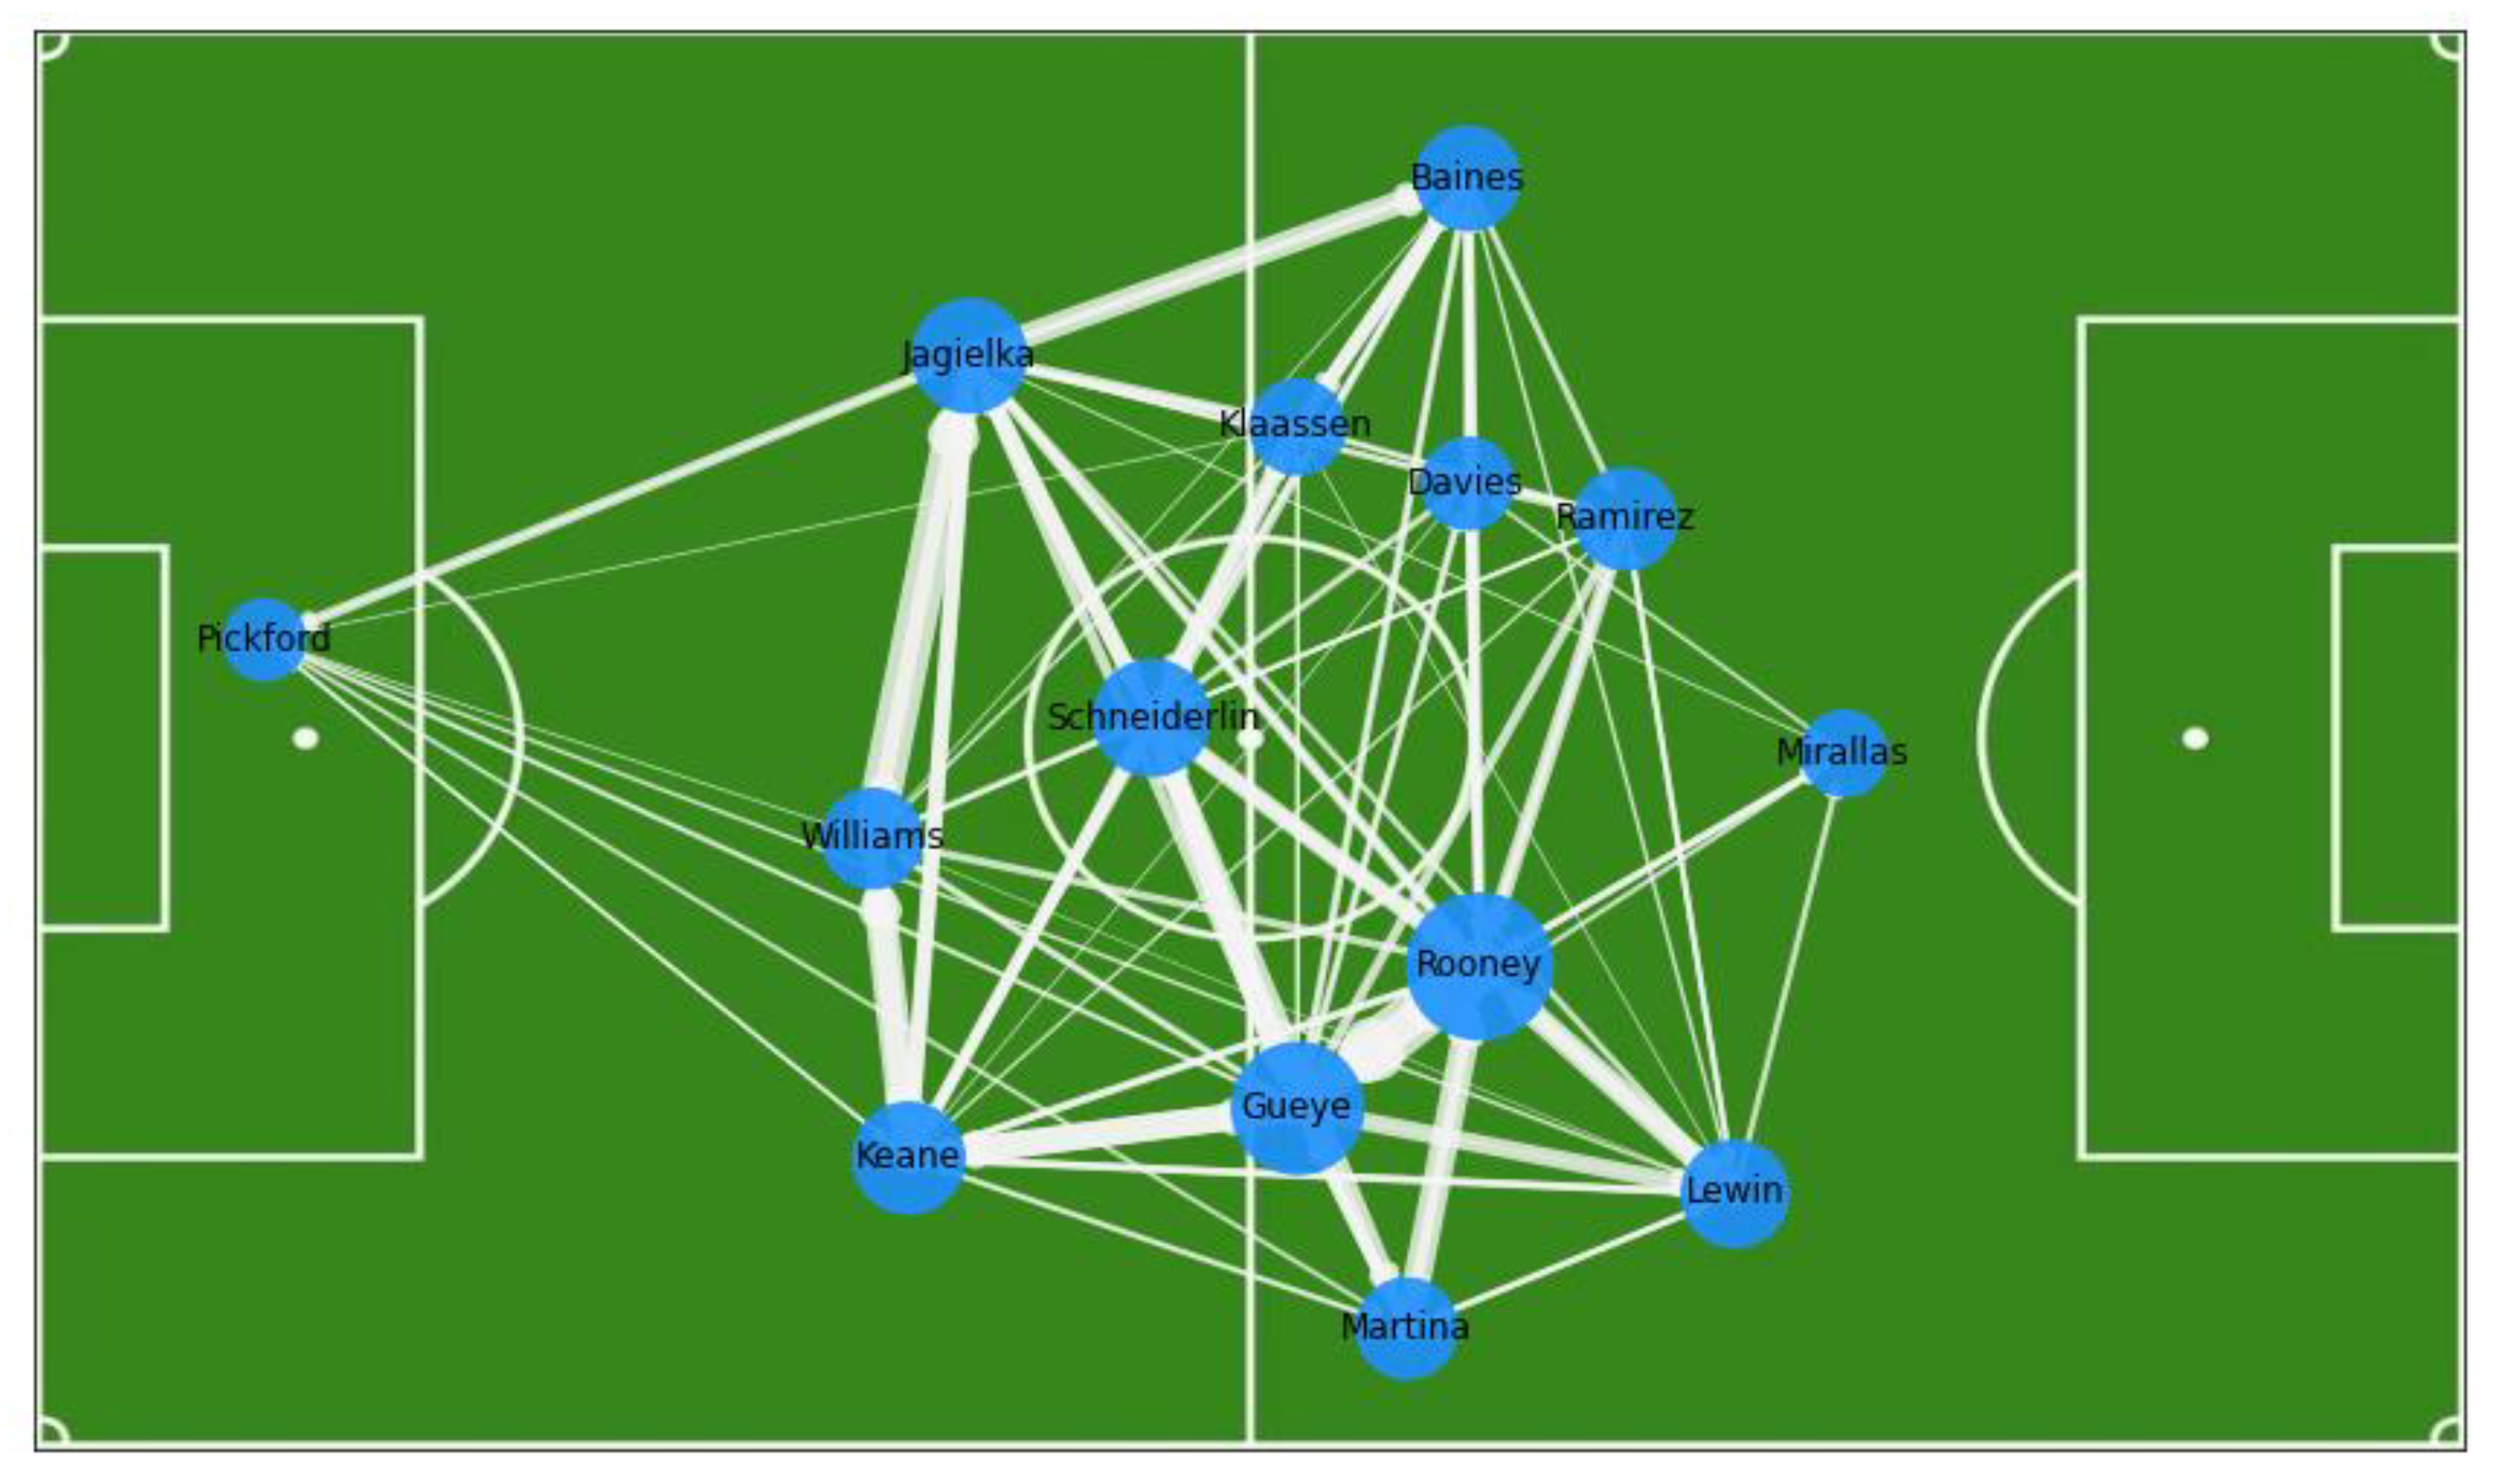
4.1. Visualization and Comparison of Passing Networks

All network structures depend on the adjacency matrix composed of edge weight set and node set. Based on adjacency matrix, local network invariants and global network invariants can be calculated. The local network invariants reveal the characteristics of a single player, such as touch range and pass width. The global network invariants are usually obtained from the arithmetic average value of local network invariants, which can reveal team characteristics, such as team movement trend and flexibility. Since the data set of passing is the only data source of the passing network, the weight calculation and weighting formula of a single pass directly determine the robustness of the network, and further determine the actual match fitting degree.
A pass always moves the ball from one point on the field to another. There are coordinates of the start and end of the pass. In order to quantify the coordinates, the flag area at the lower left corner of the field is taken as the origin of the coordinates. The long axis of the football field is the x-axis with the x value variation range [0, 100], and the short axis is the y-axis with the y value variation range [0, 100]. The z-axis variation caused by the long pass is not considered. In the coordinate system of the football field, the center point of the goal coordinate of the one side is (0, 50), and that of the other side is (100, 50). The coordinate system of football field reflects the abstract relationship between two-dimensional numerical value and football competition. The difficulty and contribution of the pass increase with the increase in x value, and change with the positive correlation between y value in [0, 50] and negative correlation between y value in [50, 100]. The potential value of coordinates is represented by color saturation, and the darker the color, the higher the potential value, as shown in Figure 2.
In Figure 2, the degree of color gradient shows that when the y value is fixed, the potential value of the pass increases nonlinearly along the x-axis with the increase in x value. We calculate the ratio of successful passes for each position as the ratio of changes in the potential value of passes. The potential value of the pass in the backfield area of the own side is the minimum value 1. When the parallel line of the y-axis where the x value gradually approaches the line of the opponent’s penalty area, the potential value of the pass increases significantly. If and only if the coordinates are in the opponent’s penalty area, the potential value of the pass reaches a maximum value of 5 and does not change as the coordinates continue to approach the opponent’s goal. In order to quantify the relationship between the potential value of passes and coordinate changes, we defined 22 important coordinates by taking into account the boundary of the field, the intersection of the field line, and the arithmetic midpoints of the coordinate system. The value of each close coordinate is defined by the ratio of the average number of passes of third-line players. Taking the x and y coordinates of the important coordinate set as independent variables and the value set as dependent variables, the multivariate nonlinear regression equation is established and the regression image is shown in Figure 3. In order to avoid the value crossing the boundary, the value interval obtained from the multivariate nonlinear regression equation is [1, 5]. For a few values whose fitting values are located at (0, 1), and those located at (5, +∞), the coordinate-based regression equation for the potential value of a single pass is obtained by taking 1 and 5, respectively.
P i = { 1 ( P i < 1 ) 0.0005 x i 2 0.0003 y i 2 0.01 x i + 0.0348 y i + 0.5547 5 ( P i > 5 )
In Formula (2), xi and yi are, respectively, the abscissa and the ordinate of the end point of the i pass.
We iterate through all the data of Everton’s successful passes in a single match, add the nonexistent edges, and update the weight of the existing edges. The updated value is the sum of the original weight and the value of this pass. The player who initiates the pass is recorded as the data index, and the weighted directional edge weight is used as the value to build the single-game adjacency matrix. Taking Everton’s 1-0 victory over Stoke City in the first round of the Premier League as an example, the adjacency matrix is shown in Table 1.
In Table 1, the row index is the player who initiates the pass, and the column index is the player who targets the pass. The calculated weight value is reserved with two decimal places. A weight of zero means there are no certain direction passes between players (or players themselves). The adjacency matrix obtained from the improved passing weight calculation formula successfully quantifies the relationship between players on the field and reflects the distribution in team passes well. We constructed adjacency matrix for each round of the competition, and all complex network construction and analysis depended on the deconstruction and reorganization of adjacency matrix.
The width of each edge in the network diagram represents the weight of directional pass between players, and the intercept of each edge is the Euclidean distance between the average coordinates of nodes. For node position information, all the starting coordinates of a player as a pass server and all the receiving coordinates as a pass target are recorded, and their arithmetic mean value is calculated as the corresponding node coordinates. The PageRank algorithm is used to calculate the importance information of nodes. Node radius is used to represent the importance of players, and a single game passing network diagram is built. Take Everton’s adjacency matrix in the first round as an example, as shown in Figure 4.
Through the visualization of the passing network, individual differences in players can be compared more directly, and tactical arrangement and changes in teams can be analyzed. As can be seen from Figure 4, Everton maintained a 3-5-2 formation throughout the match. Schneiderlin occupies the center of the net, acting as a front screen for the three center-backs and the first point of release. Gueye is the most important passing agent among the five midfielders, with a wide edge between his out and in. Rooney and Ramirez, the striker duo, have a clear division of duties, with Ramirez being the closest player to the opposition’s goal, a position that is reinforced when Mirallas comes on as a substitute and withdraws him in the 77th minute. In contrast, Rooney, the other nominal striker, drops back in depth, not even as far from the goal as Lewin, the right-winger, who is Rooney’s first choice when passing the ball forward. Rooney and Gueye serve as the team’s offensive and passing hubs, respectively, with a combined value of 59.16 passes between the two players, making them the closest pair in the network. In addition, the total value of passes between right-back Keane and Gueye is 36.73, the highest between center-back junction pairs. Schneiderlin, Gueye, and Rooney’s passing team made an excellent job of setting-up the right half from back to front, and all three players achieve the top three of the team in post-match ratings (7.6, 7.7, and 7.9, respectively). This analysis of the passing network cannot be obtained through official statistical data, which reflects the superiority of the passing network.
Comparing Everton team’s different performances in different matches through the passing network is an effective way to analyze the team’s tactical layout and can demonstrate the team’s passing fluctuations from a dynamic perspective. We chose the 30th round Everton 2-0 home win against Brighton and the 23rd round 4-0 away loss to Tottenham Hotspur as typical matches to demonstrate the analyzed passing network, see Figure 5. In the winning passing network shown in Figure 5a, Everton chose a hard attacking 4-3-3 formation. In the midfield, the iron triangle of Rooney, Davies, and Sigurdsson provided ample support for the deeper players, directly reflected in the wider directional edges of the passing network. In the negative passing network shown in Figure 5b, Allardyce used a 4-2-3-1 formation with five midfielders playing solid defense against a strong Tottenham Hotspur team. Owing to the huge gap in strength, the Everton players were trapped in their own zone with the overall center of the network moving significantly backward. Compared to Figure 5a, the average touch coordinates of the four defenders were closer to Pickford. In the passing network, the width of the two defenders in and out of the midfield was much wider than the edge between the midfielders’ nodes, proving that the two midfielders, Gueye and McCarthy, were unable to connect with their teammates when pressed and had to pass the ball back to Martina or Kenny. The width of the passing network was squeezed and spread to the edges, reflecting a complete loss of control in Everton’s midfield.

4.2. Establish Team Coordination Index

The average betweenness centrality and the average clustering coefficient of the network used nodes and edges as the basic variables, respectively, and tested the variance inflation factor of the two variables, obtaining the VIF value of 2.831, which passed the collinearity diagnosis. The ratio of the two global network invariants is named as the team coordination index, which can evaluate the consistency of the team’s overall play from the compound perspective of individual play and passing value. The formula follows:
d i j = 1 W i j c c ( i ) = 1 u i ( u i 1 ) j , k W i j W k j W k i 3 m a x ( W ) c b ( i ) = j , k V σ ( j , k | i ) σ ( j , k ) c = 1 N i c c ( i ) c b ( i )
In Formula (3), dij is the topological distance from node i to j, which is defined as the reciprocal of the total value Wij of passes from player i to j. Cc(i) is the local clustering coefficient of player i, and ui is the set of out nodes of player i. Cb(i) is the betweenness centrality value of player i, σ(j,k) is the set of shortest distances between nodes, and σ(j,k|i) is the set of shortest distances passing through node i. By calculating the average value of the ratio of local clustering coefficient and betweenness centrality value for all nodes in the network, and N is the set of players, the team coordination index c can be obtained. The calculated score of coordination index in 38 games of the season is shown in Table 2.

5. Inspection

5.1. Pezzali Score Test

In football competition, team scoring efficiency per unit time is significantly lower than that of other ball sports, which makes it one-sided to evaluate the team’s offensive and defensive ability by the number of goals scored, conceded, or goal difference, and the accumulated accidental factors make the team’s scores and losses fluctuate greatly. Taking this into account, Cintia proposed the Pezzali score [38] to measure the team’s attack and defense efficiency, which accounts for the four-dimensional data of goals of the home team, shots of the home team, goals of the away team, and shots of the away team, and established a formula. We make some adjustments to the formula and use it as a test variable in the team coordination index. The formula is
P = g ( t ) + C a ( t ) + C · a ( o ) + C g ( o ) + C
In Equation (4), g(t) is the number of goals scored by the home team, a(t) is the number of shots on goal by the home team, a(o) is the number of shots on goal by the away team, g(o) is the number of goals scored by the away team, and C is a constant term that avoids 0, where C is 1. Pezzali’s score calculations for Everton’s season are shown in Table 3.
The correlation coefficient between the team coordination index and Pezzali score is 0.494, and the correlation is significant in the 0.01 interval, indicating that the team coordination index has a significant positive correlation with Pezzali score. The validity of the index proves that the index can effectively measure the overall team offense and defense coordination.

5.2. Control Score Test

The Pezzali score measures the team’s attack and defense efficiency from the perspective of shot conversion rate. Compared with the number of goals, the number of shots has greatly expanded the amount of data in a single game, but it still has the defects of high fluctuation range and strong contingency. Comparing shots, attacks, and dangerous attacks further expands the data and describes the average team positioning. The number of attacks is the statistic of how much the team pushes the ball upfield, and the number of dangerous attacks is the statistic of how much the team pushes the ball into the dangerous area of the opponent, usually defined as the 30 m zone of the opponent’s backfield. Both of these stats are significantly influenced by possession, which means more opportunities to develop the ball up front, but also by the fact that the home team can be behind the opposition in attack frequency. Good control is a high rate of possession and a far greater number of attacks and dangerous attacks. This study uses Pezzali’s score for reference, and sets up the control scoring formula based on the ball possession rate of the side, the attack times of the side, the dangerous attack times of the side, the attack times of the other side, and the dangerous attack times of the other side. We used the Pezzali scoring evaluation method for reference, and set up the control score with the ball possession rate of the home team, the number of attacks of the home team, the number of dangerous attacks of the home team, the number of attacks of the away team, and the number of dangerous attacks of the away team.
C = p ( t ) · D A 2 ( t ) A ( o ) · D A ( o )
In Equation (5), p(t) is the possession rate of the home team, DA(t) is the number of dangerous attacks of the home team, A(o) is the number of dangerous attacks of the visiting team, and DA(o) is the number of dangerous attacks of the visiting team. The formula consists of the possession rate, the ratio of the number of attacks of both teams, the ratio of the number of dangerous attacks of both teams, and the ratio of dangerous attacks and attacks of the home team. The number of attacks of the home team was divided as a common factor and the score of team control was calculated, as shown in Table 4.
The correlation test of team coordination index score and control score shows that the correlation coefficient is 0.485, significant in the 0.01 interval, indicating a significant positive correlation between the two, proving that the index can effectively measure the coordination of team control ability.

6. Conclusions

In this study, computer network graph theory was applied on the basis of traditional passing networks; a weighting function was obtained by fitting the trend of the passing value; the coordinate set of the target player receiving the pass was used as the independent variable to calculate the function value; the number of passes was used as the weighting coefficient of the pass to construct the adjacency matrix; the PageRank value was then applied as the node weight to calculate the importance of the player and used successfully to construct an improved weighted directed passing network; by means of visualization, typical passing networks in seasonal passing networks were shown and compared. We further tested the passing network with various network invariants, combined the individual with the whole, evaluated the competitive quality of the team by the ratio of the average clustering coefficient of the network to the average betweenness centrality, and proposed a quantitative index to measure the overall coordinated performance of the team, and tested the correlation between the index and the Pezzali score and control score of the team, respectively, to prove the validity of the index. The index theoretically measures the level of consistency in team performance, helps to explain complex team performance, improves the high dependence of team evaluation on the coaching experience of the coaching team, and provides reference value in training and real-world practice.
The study of the passing network in this research is not perfect, and there are some shortcomings and much room for improvement. First, owing to the lack of z-axis coordinates in the passing data, we could not distinguish between aerial passes and ground passes, both of which have their own tactical value in soccer games. If we can obtain 3D pass coordinate data including z-axis in future research, we can build a richer pass weighting calculation system. Second, owing to the size of the data source, we only took the perspective of a single team and were unable to build a network model for each of the 20 teams participating in the 2017–2018 season. Obviously, a team’s competitive performance is dynamic and fluctuates with factors such as home and away games and opponent strength. It is sufficient in the time dimension to evaluate a team’s performance during the whole season cycle, but it is insufficient in the control of variables. The currently proposed quantitative index of coordination is highly scalable and can be easily transferred to other teams’ evaluation systems. In future studies, if we can obtain a set of pass-through data that is several times larger than the current data, we will attempt to construct a larger, kinked coordination evaluation matrix for teams.

Author Contributions

Conceptualization, W.Z.; Methodology, W.Z.; Validation, Z.W.; Data curation, S.Y.; Writing—review & editing, G.Y. All authors have read and agreed to the published version of the manuscript.

Funding

This research was funded by 2022 Key planning subject for the 14th five-years plan of national education sciences grant [ALA220029].

Institutional Review Board Statement

Not applicable.

Informed Consent Statement

Not applicable.

Data Availability Statement

The experimental data used to support the findings of this study are available from the corresponding author upon request.

Conflicts of Interest

The authors declare no conflict of interest.

References

  1. Reep, C.; Benjamin, B. Skill and Chance in Association Football. J. R. Stat. Soc. Ser. A (Gen.) 1968, 131, 581–585. [Google Scholar] [CrossRef]
  2. Rao, Y.; Chen, L. A survey of video enhancement techniques. J. Inf. Hiding Multimed. Signal Process. 2012, 3, 71–99. [Google Scholar]
  3. Hild, F.; Roux, S. Digital Image Correlation: From Displacement Measurement to Identification of Elastic Properties–A Review. Strain 2010, 42, 69–80. [Google Scholar] [CrossRef] [Green Version]
  4. Dubitzky, W.; Lopes, P.; Davis, J.; Berrar, D. The Open International Soccer Database for machine learning. Mach. Learn. 2018, 108, 1–20. [Google Scholar] [CrossRef] [Green Version]
  5. Wang, L. Statistics and analysis of goals conceded in the final stage of the 2006 World Cup soccer tournament. Acad. Discuss. 2006, 2010, 267–268. [Google Scholar]
  6. Xiang, Y.; Hu, W. Research on goals from set pieces in the 18th World Cup. Three Gorges Univ. J. Humanit. Soc. Sci. 2010, 199–200. [Google Scholar]
  7. Pappalardo, L.; Cintia, P.; Ferragina, P.; Massucco, E.; Pedreschi, D.; Giannotti, F. PlayeRank: Data-driven Performance Evaluation and Player Ranking in Soccer via a Machine Learning Approach. ACM Trans. Intell. Syst. Technol. 2019, 10, 1–27. [Google Scholar] [CrossRef] [Green Version]
  8. Pappalardo, L.; Cintia, P.; Rossi, A.; Massucco, E.; Ferragina, P.; Pedreschi, D.; Giannotti, F. A public data set of spatio-temporal match events in soccer competitions–Python code to replicate plots in the paper. Sci. Data 2019, 6, 1–15. [Google Scholar] [CrossRef] [Green Version]
  9. Liu, Z.; Yan, J. Research on the optimal allocation of defense and control forces based on graph theory. Univ. Math. 2013, 29, 52–55. [Google Scholar]
  10. Boyd, D.M.; Ellison, N.B. Social Network Sites: Definition, History, and Scholarship. J. Comput. Mediat. Commun. 2013, 13, 210–230. [Google Scholar] [CrossRef] [Green Version]
  11. Aral, S.; Nicolaides, C. Exercise contagion in a global social network. Nat. Commun. 2017, 8, 14753. [Google Scholar] [CrossRef] [Green Version]
  12. Buldú, J.M.; Busquets, J.; Martínez, J.H.; Herrera-Diestra, J.L.; Echegoyen, I.; Galeano, J.; Luque, J. Using Network Science to Analyse Football Passing Networks: Dynamics, Space, Time, and the Multilayer Nature of the Game. Front. Psychol. 2018, 9, 1900. [Google Scholar] [CrossRef] [Green Version]
  13. Li, W.; Zhang, D.; Cui, H. Analysis of critical foul flash voltage prediction of silicone rubber composite insulators based on BP neural network. Autom. Technol. Appl. 2020, 39, 90–93. [Google Scholar]
  14. Passos, P.; Davids, K.; Araújo, D.; Paz, N.; Minguéns, J.; Mendes, J. Networks as a novel tool for studying team ball sports as complex social systems. J. Sci. Med. Sport 2011, 14, 170–176. [Google Scholar] [CrossRef]
  15. Kong, X. Prediction of total hospitalization cost and analysis of influencing factors for patients with bronchopneumonia based on BP neural network and support vector machine. West China Med. 2021, 36, 55–60. [Google Scholar]
  16. Karlis, D.; Ntzoufras, I. Bayesian modelling of football outcomes: Using the Skellam’s distribution for the goal difference. Ima J. Manag. Math. 2009, 20, 133–145. [Google Scholar] [CrossRef]
  17. Ling, X.; Xu, L.; Yu, J. Prediction of corrosion rate in oil pipelines based on improved BP neural network. Sens. Microsyst. 2021, 40, 124–127. [Google Scholar]
  18. Gudmundsson, J.; Horton, M. Spatio-Temporal Analysis of Team Sports. ACM Comput. Surv. 2017, 50, 1–34. [Google Scholar] [CrossRef] [Green Version]
  19. Golbeck, J. Chapter 21–Analyzing networks. In Introduction to Social Media Investigation; Golbeck, J., Ed.; Syngress: Boston, MA, USA, 2015; pp. 221–235. [Google Scholar]
  20. Golbeck, J. Chapter 3–Network Structure and Measures. In Analyzing the Social Web; Golbeck, J., Ed.; Morgan Kaufmann: Boston, MA, USA, 2013; pp. 25–44. [Google Scholar]
  21. Bonacich, P. Power and Centrality: A Family of Measures. Am. J. Sociol. 1987, 92, 1170–1182. [Google Scholar] [CrossRef]
  22. Clemente, F.M.; Martins, F.M.L.; Mendes, R.S. Analysis of scored and conceded goals by a football team throughout a season: A network analysis. Kinesiology 2016, 48, 103–114. [Google Scholar] [CrossRef]
  23. Clemente, F.M.; Silva, F.; Martins, F.M.L.; Kalamaras, D.; Mendes, R.S. Performance Analysis Tool for network analysis on team sports: A case study of FIFA Soccer World Cup 2014. Proc. Inst. Mech. Eng. Part P J. Sport. Eng. Technol. 2016, 230, 158–170. [Google Scholar] [CrossRef]
  24. Grund, T.U. Network structure and team performance: The case of English Premier League soccer teams. Soc. Netw. 2012, 34, 682–690. [Google Scholar] [CrossRef]
  25. Li, C.; Ji, X.; Zhi, L. Analysis of the degree of interdisciplinarity of disciplines based on E–I index—Taking five disciplines such as intelligence science as an example. Libr. Inf. Work 2011, 55, 33–36. [Google Scholar]
  26. Yu, Q.; Chen, L. Analysis of CSL teams’ passing performance based on social network analysis and its value to team performance. Hubei Sport. Sci. Technol. 2020, 39, 1004–1012. [Google Scholar]
  27. Nia, M.E.; Besharat, M.A. Comparison of athletes’ personality characteristics in individual and team sports. Procedia–Soc. Behav. Sci. 2010, 5, 808–812. [Google Scholar] [CrossRef] [Green Version]
  28. Lei, L. Research on the passing network before soccer goals based on the perspective of social network analysis method—Taking the 2018 World Cup as an example. Commun. Power Res. 2020, 4, 144–149. [Google Scholar]
  29. Haveliwala, T.H. Topic-sensitive PageRank: A context-sensitive ranking algorithm for Web search. IEEE Trans. Knowl. Data Eng. 2003, 15, 784–796. [Google Scholar] [CrossRef] [Green Version]
  30. Stefani, R.; Pollard, R. Football Rating Systems for Top-Level Competition: A Critical Survey. J. Quant. Anal. Sport. 2007, 3. [Google Scholar] [CrossRef]
  31. Li, B.; Wang, L. Feasibility analysis of social network analysis method to study the passing performance of soccer games. J. Beijing Sport. Univ. 2017, 40, 112–119. [Google Scholar]
  32. Ao, X.; Gong, Y.; Li, J. Soccer tournament result prediction based on handicap data. J. Chongqing Univ. Technol. Bus. Nat. Sci. Ed. 2016, 33, 85–89. [Google Scholar]
  33. Liang, H.; Li, X.; Li, J. The value of applying social network analysis in the sociological study of sports and its limitations. J. Chengdu Sport. Inst. 2015, 51–56. [Google Scholar]
  34. Telesford, Q.K.; Joyce, K.E.; Hayasaka, S.; Burdette, J.H.; Laurienti, P.J. The ubiquity of small-world networks. Brain Connect. 2011, 1, 367–375. [Google Scholar] [CrossRef] [Green Version]
  35. Brandes, U. On variants of shortest-path betweenness centrality and their generic computation. Soc. Netw. 2008, 30, 136–145. [Google Scholar]
  36. Brandes, U. A faster algorithm for betweeness centrality. J. Math. Sociol. 2001, 25, 163–177. [Google Scholar] [CrossRef]
  37. Schank, T.; Wagner, D. Approximating clustering coefficient and transitivity. J. Graph Algorithms Appl. 2005, 9, 2005. [Google Scholar] [CrossRef]
  38. Zhao, G.; Chen, C. Research on the research method and evaluation index system of soccer game performance. Sport. Sci. 2015, 72–81. [Google Scholar]
Figure 1. Passing network diagram.
Applsci 13 00845 g001
Figure 2. Field zoning plan.
Applsci 13 00845 g002
Figure 3. Graph of the coordinate regression equation.
Applsci 13 00845 g003
Figure 4. Everton’s passing network in the first round of Premier League.
Applsci 13 00845 g004
Figure 5. Comparison of Everton’s passing network in typical matches.
Applsci 13 00845 g005
Table 1. Premier League round 1 Everton pass weight adjacency matrix.
MartinaSchneiderlinRooneyGueye
Martina0.001.8919.209.16
Schneiderlin13.800.0013.4216.18
Rooney7.919.180.0037.02
Gueye7.7214.1922.140.00
Table 2. Team coordination index score.
Match_ID123……363738
Co_Index0.049860.076760.05274……0.04790.051610.05309
Table 3. Team Pezzali score.
Match_ID123……363738
Pezzali Score22.50.7917……3.751.10.5333
Table 4. Team control score.
Match_ID123……363738
Control Score0.24070.09060.0774……0.11940.44860.1351
Disclaimer/Publisher’s Note: The statements, opinions and data contained in all publications are solely those of the individual author(s) and contributor(s) and not of MDPI and/or the editor(s). MDPI and/or the editor(s) disclaim responsibility for any injury to people or property resulting from any ideas, methods, instructions or products referred to in the content.

