Article

Heat Transfer Characteristics of Modular Heat Storage Wall Solar Greenhouse Based on Active Heat Storage System

1
College of Engineering, Anhui Agricultural University, Hefei 230036, China
2
Institute of Agricultural Facilities and Equipment, Jiangsu Academy of Agricultural Sciences, Key Laboratory of Facility Agricultural Engineering in the Middle and Lower Reaches of the Yangtze River, Ministry of Agriculture and Rural Affairs, Nanjing 210014, China
3
College of Horticulture, Northwest A&F University, Key Laboratory of Northwest Facility Horticulture Engineering, Ministry of Agriculture and Rural Affairs, Xianyang 712100, China
*
Author to whom correspondence should be addressed.
Appl. Sci. 2023, 13(2), 846; https://doi.org/10.3390/app13020846
Submission received: 14 December 2022 / Revised: 30 December 2022 / Accepted: 5 January 2023 / Published: 7 January 2023
(This article belongs to the Section Agricultural Science and Technology)

Abstract

:
The modular heat storage wall is a new type of solar greenhouse wall structure, which has the advantages of fast construction and good heat storage ability. This study provides data reference and practical value for producing modular heat storage wall in the construction of a solar greenhouse. In this paper, we used different heat storage materials to construct the modular wall. In the winter thermal environment test, soil module solar greenhouse (SG) and stone module solar greenhouse (PG) were controlled against each other in two greenhouses. The test results for 28 consecutive days (31 January 2021 9:00 to 28 February 2021 9:00) showed that both greenhouses could effectively increase the temperature in greenhouse by 10–12 °C. The average temperature of SG was 0.86 °C lower than that of PG during the daytime (09:00–17:00) and 0.44 °C higher than that of PG during the nighttime (17:00–09:00). Under typical sunny conditions, the average temperature differences between the inlet and outlet of SG in the heat storage and exothermic stage was less than that of PG, and the relative humidity difference was greater than that of PG. This indicated that SG had a better performance of heat preservation than PG and could raise the nighttime temperature rapidly. Under the condition of a typical cloudy day, the average temperature difference between the inlet and outlet was SG < PG and the relative humidity difference was SG > PG in the exothermic stage, which was consistent with the conclusion of sunny days. In the storage and exothermic stages of typical sunny days and cloudy days, the total heat exchange of SG was 464.87, 110.44 and 54.82 MJ and the total heat exchange of PG was 264.16, 61.60 and 46.89 MJ, respectively. Moreover, the heat storage and release of SG were more than that of PG in all stages. In summary, the thermal performance of the modular heat storage wall heliogreenhouse could meet the growth of tomato crop, in which the heat transfer performance of SG was optimum.

1. Introduction

The solar greenhouse industry has a profound impact on the production of northern facilities [1]. As of the end of 2018, the construction area of solar greenhouses in China was 5.775 million hm2, accounting for about one-third of the total construction area of horticultural facilities [2]. The solar greenhouse provides a new way for the sustainable supply of vegetables in the off-season in north China. Traditional thick earth wall and brick wall solar greenhouse have the disadvantages of high construction cost, complex construction process and poor heat preservation performance. Meanwhile, the modular heat storage wall plays an important role in the development of modern solar greenhouse, and has a character of simple installation. Therefore, a large number of researchers explored on modular back wall material [3,4,5], back wall structure [6,7], heat storage mode [8,9], and heat preservation performance [10,11]. Zou Zhirong [12] analyzed the performance of the modular assembled solar greenhouse which has a good thermal insulation performance, a 30% lower construction cost and 14–20% higher output. Compared with the traditional solar greenhouse in Shandong area, the construction cost of soil module greenhouse can be reduced by more than 40%. Zhang Jie et al. [13] made a comparative analysis of gravel and traditional brick as the back wall material used in solar greenhouse, and revealed that the gravel wall solar greenhouse was 3.2–5.0 °C higher than the traditional brick wall solar greenhouse in three types of weather: sunny, cloudy and snowy. In addition, the internal temperature of the gravel wall solar greenhouse was also higher than that of the traditional brick wall. This indicated that the thermal performance of the gravel wall was better than that of the traditional brick wall.
It has been found that passive heat storage of solar greenhouse walls could not effectively maintain the indoor temperature of nighttime. Therefore, many papers designed greenhouses with active heat storage [14,15,16,17]. Zhang Chao and others compared and analyzed the temperature changes in the growing season of three solar greenhouses under different weather conditions. The results show that the active heat storage solar greenhouse is superior to the sunken solar greenhouse and the local traditional solar greenhouse as a whole. It has good heat preservation and temperature storage performance under extreme low temperature and typical overcast weather conditions, and can meet the growth requirements of indoor crops at low temperatures [18]. The heat storage performance analysis of flat micro-heat pipe array heat storage wall showed that the greenhouse temperature was increased by 1.2–1.5 °C on average [19]. Besides, the analysis results of a rear wall heat storage system with ventilated heat storage ducts and conducted performance revealed that the active heat storage rear wall solar greenhouse increased the temperature by 2.2 °C on average compared with the traditional solar greenhouse [20]. Wu et al. [21] tested the thermal performance of the back wall of active heat storage solar greenhouse (SW). Compared with passive heat storage solar greenhouse (CK), the average temperature of SW was lower during daytime and higher at night in sunny weather. In cloudy weather, SW was 1.8 and 2.7 °C higher than CK, and the effective heat storage layer of SW was more than that of CK in sunny and cloudy weather. They concluded that active heat storage solar greenhouse had a better heat storage effect.
The above studies provided data references for the production of active thermal storage heliogreenhouse. However, the thermal performance analysis of different modular thermal storage back walls combined with soil thermal storage has not been published yet. Firstly, the thermal performance of thermal storage back wall heliostat is excellent, but the long construction period and high cost limit the large area production of this type of heliostat. Meanwhile, the modular wall has the advantages of a short construction time, low difficulty and input cost. Soil thermal storage is also an important method to improve the thermal performance of greenhouse. It has certain research significance to combine the two thermal storage methods and form a new system. In this paper, we optimized the active thermal storage system based on the previous research [22], and used PVC (Polyvinyl chlorid) pipes to connect the back wall thermal storage and soil thermal storage together to construct a new active thermal storage circulation system. Beyond that, different wall thermal storage materials were combined to build different modular thermal storage walls in order to optimize the thermal environment in the heliostat. By analyzing the heat transfer performance of two different modular heat storage wall solariums under winter conditions, we could provide data references and production value for the practical use of modular heat storage wall solariums.

2. Materials and Methods

2.1. Test Materials

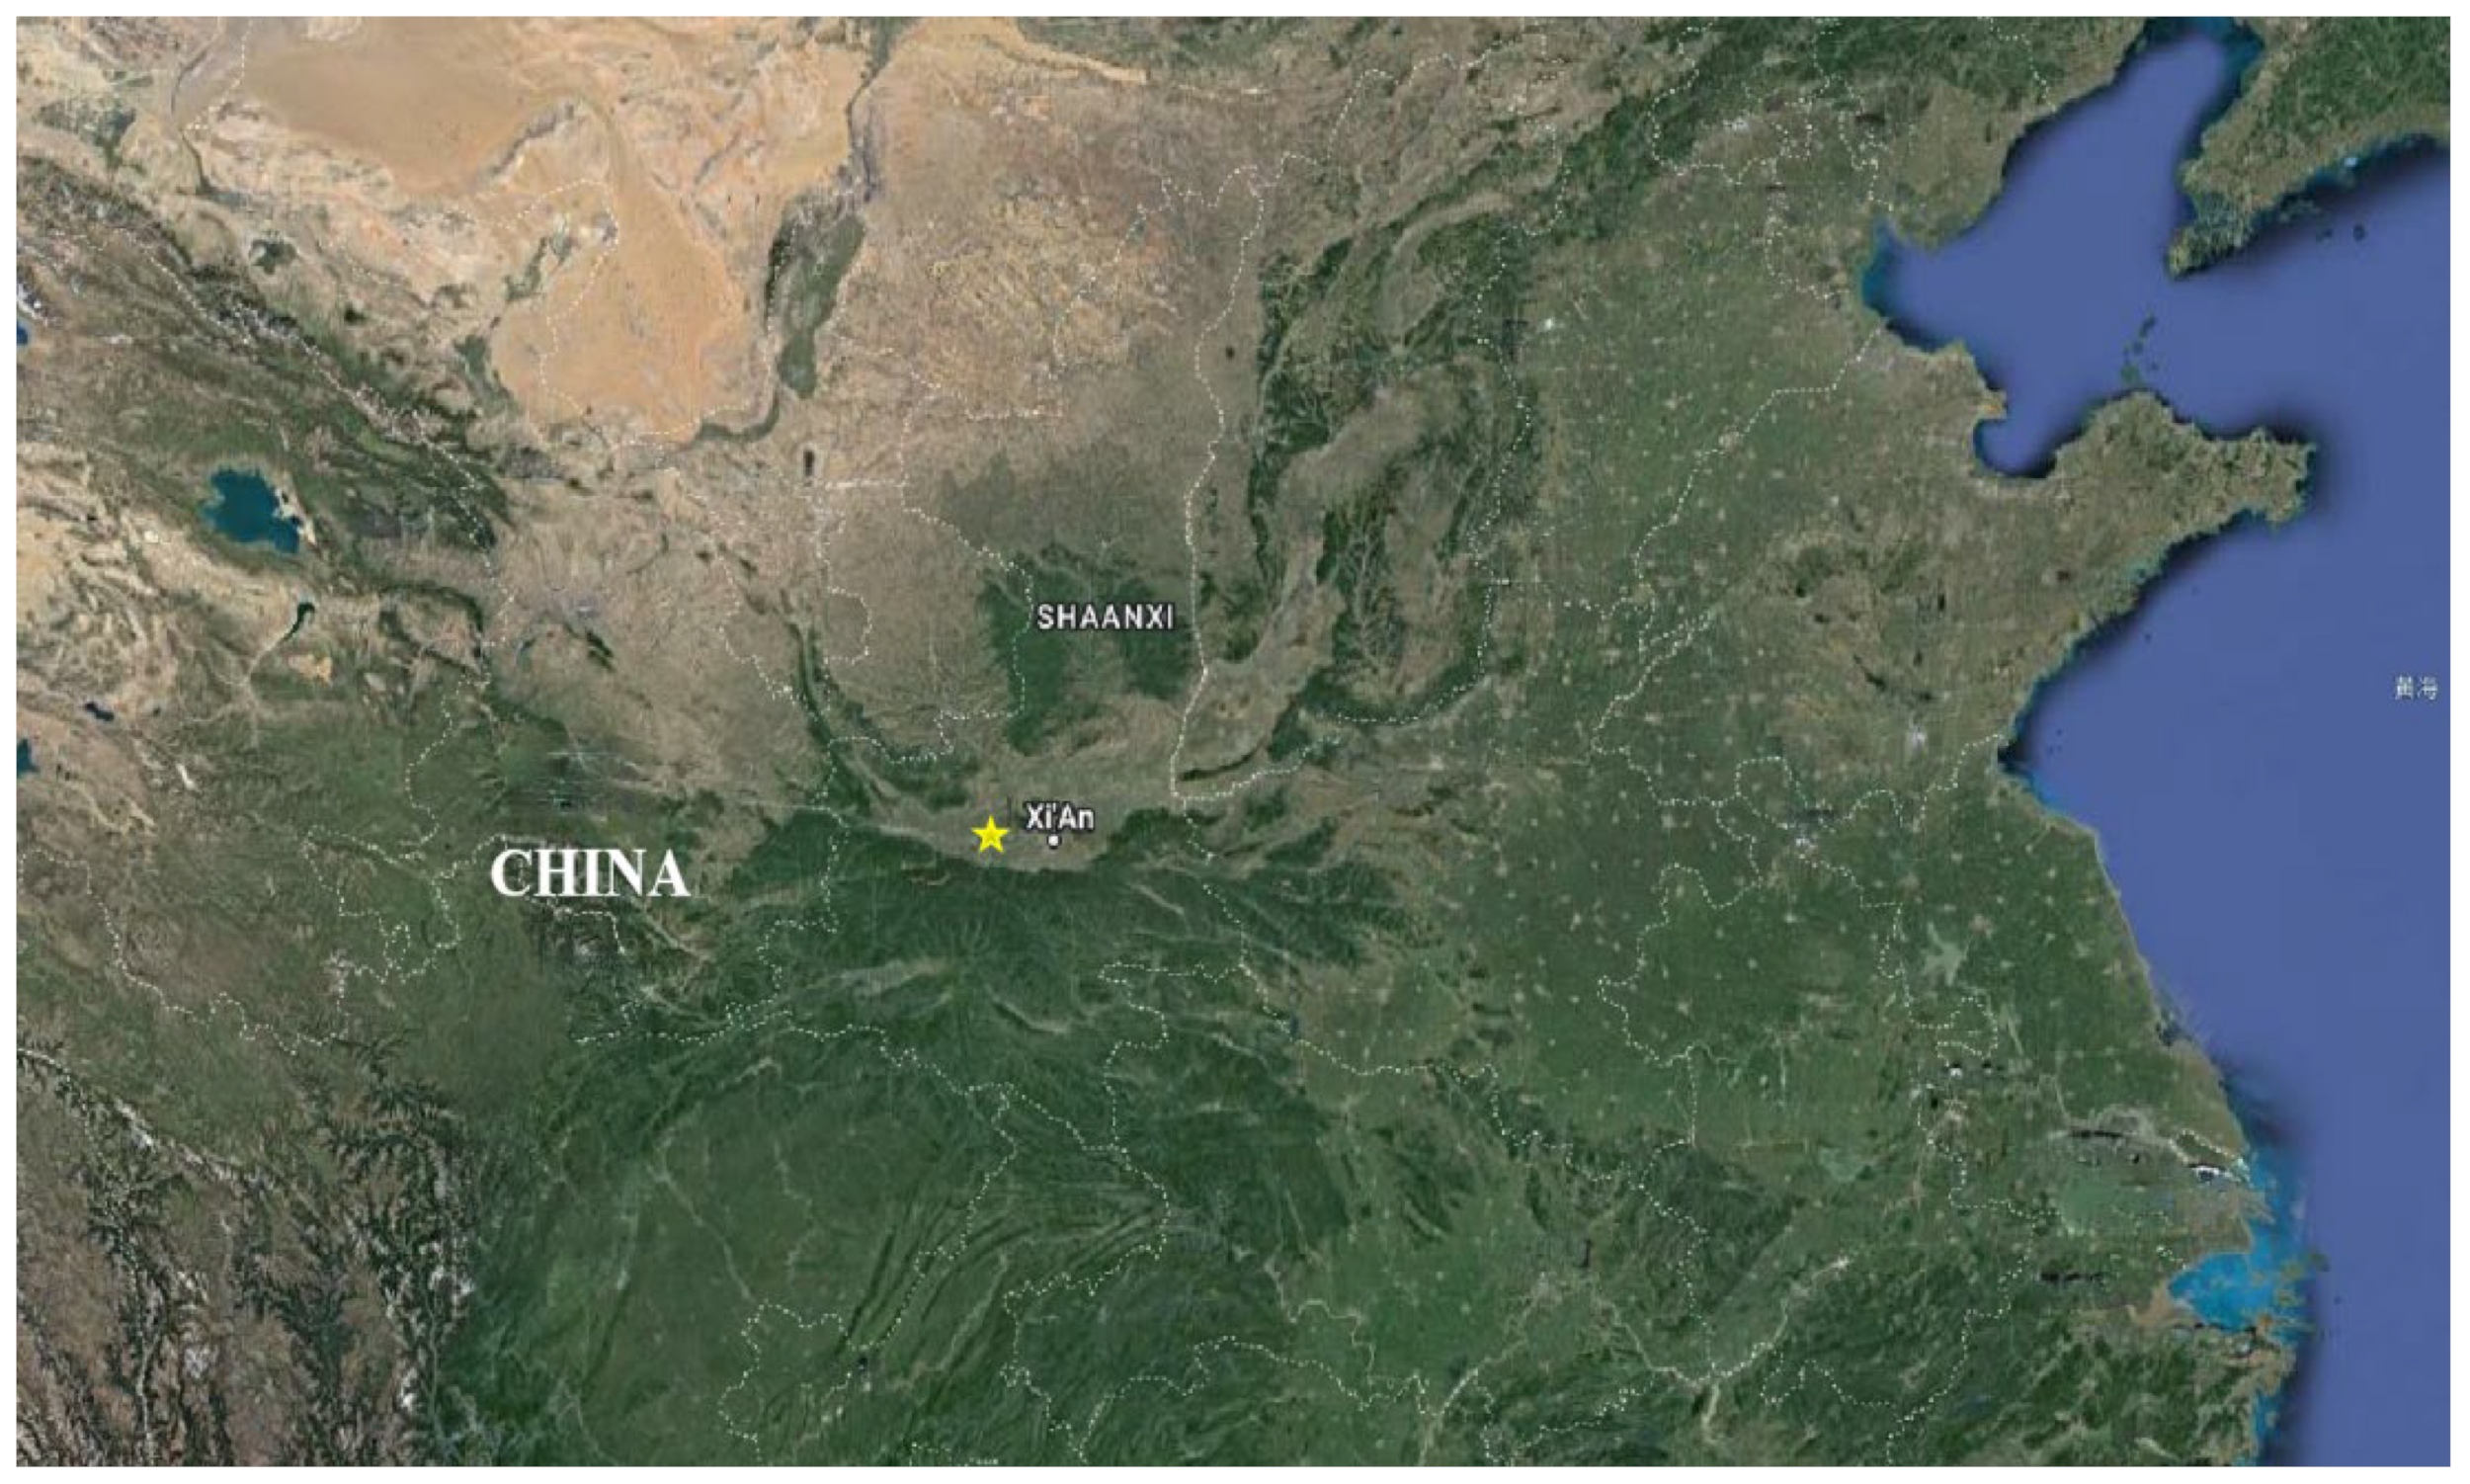
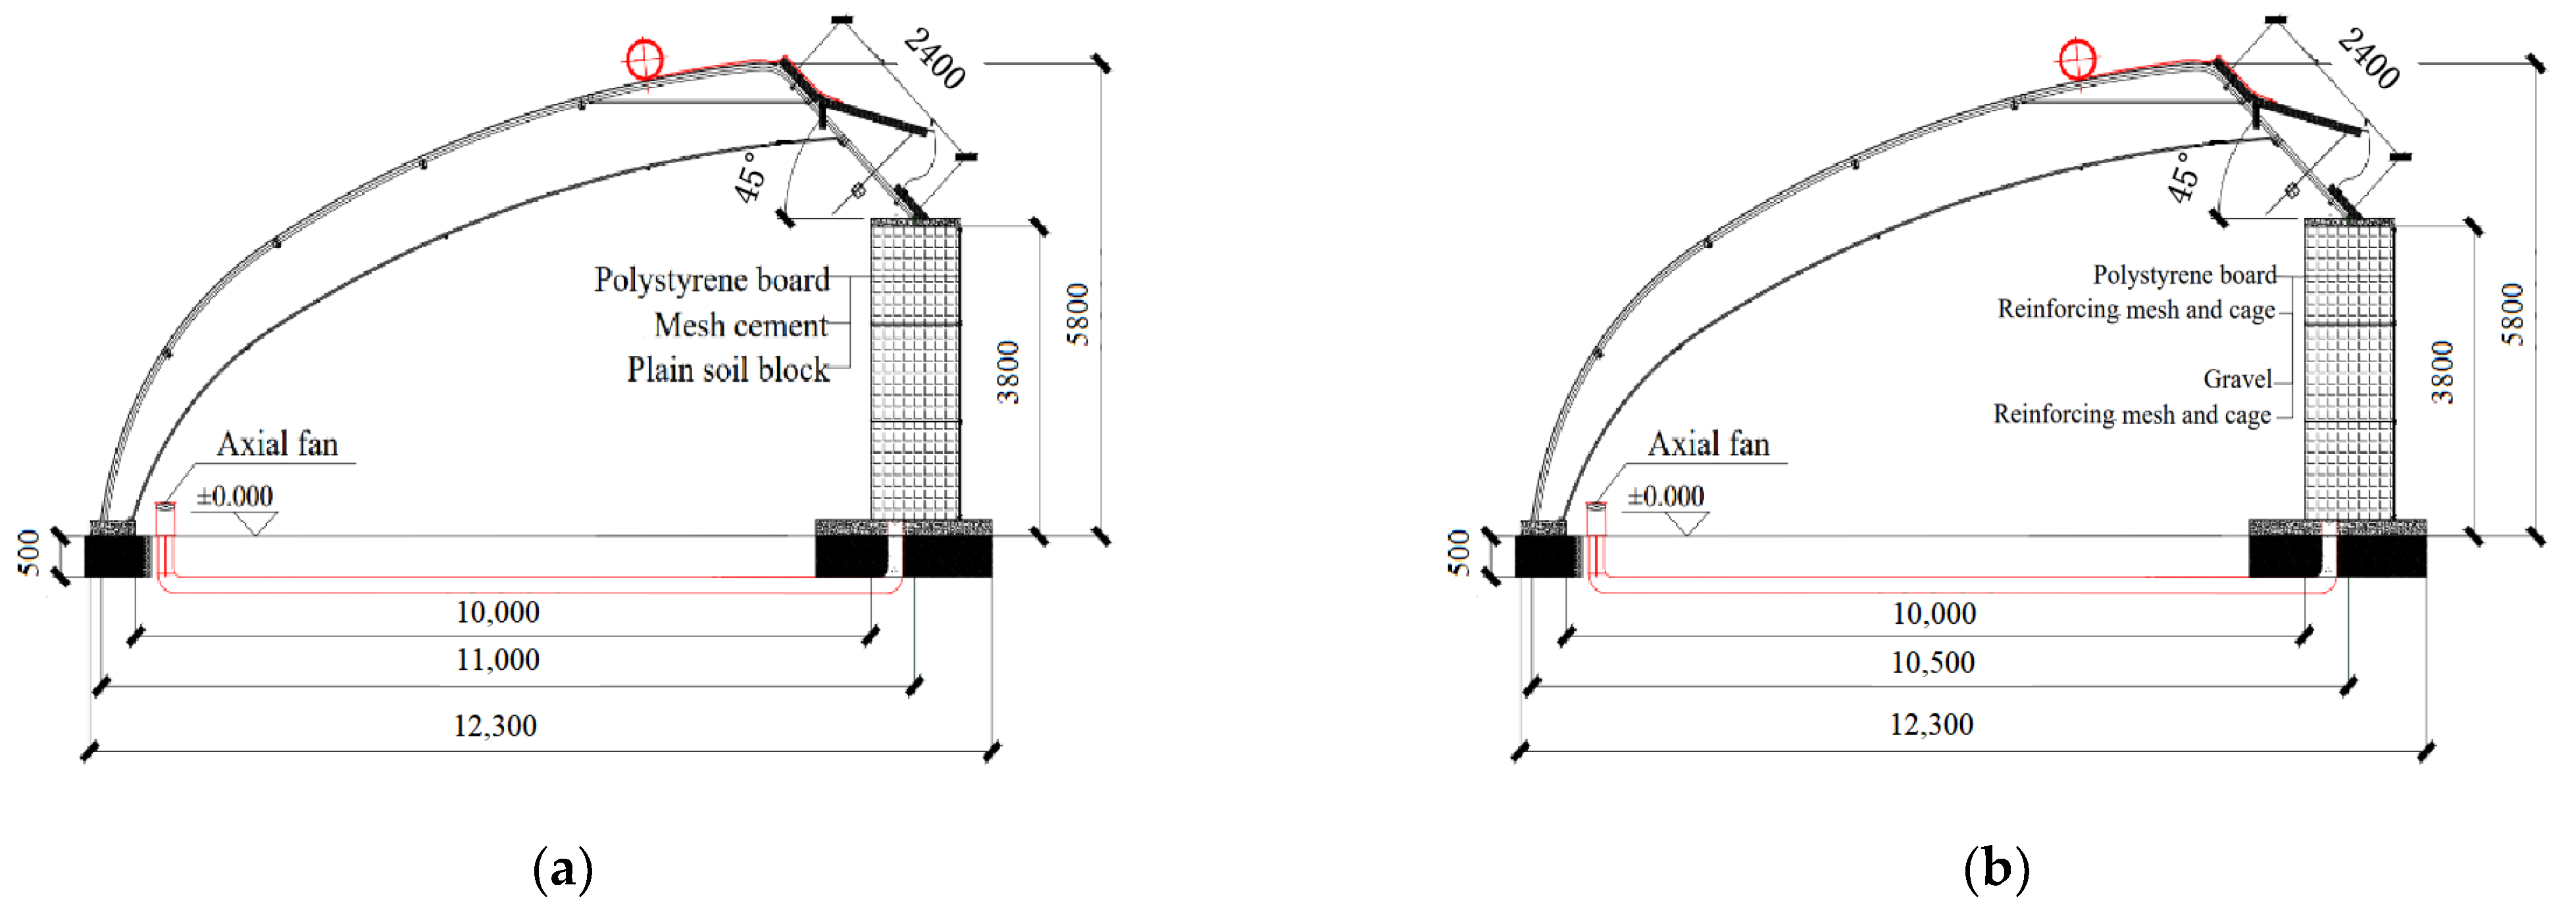
2.1.1. Test Greenhouses

The test greenhouses were constructed in Horticultural Experimental Farm of Northwest University of Agriculture and Forestry Science and Technology, Yangling Demonstration Zone, Shanxi Province (34°16′ N, 108°06′ E), as shown in Figure 1, where the yellow stars indicate the test site. The orientation of the solar greenhouses was 5°S W. Except for the material of the rear wall, performances of two modular greenhouses were identical. The internal structure of the greenhouses was shown in Figure 2. The soil modular greenhouse was denoted as SG and the stone modular greenhouse was denoted as PG. Both kinds of modular greenhouses were 16.0 m long. The height of back wall, ridge and skeleton spacing was 3.8 m, 5.8 m and 1.0 m, respectively. The interior of both the east and west hillside walls were made up of brick walls and the exterior consisted of polystyrene panels. Double-layer PO film (10 silk, 0.1 mm) was used as the southern cladding. The structure of SG back wall [23,24,25] consisted of earth block (1.2 m × 1.2 m × 0.9 m), net plastered cement (lap joint) and polystyrene board (100 mm thick). The total thickness of the back wall was 1200 mm. The structure of PG back wall [26,27] was constructed by reinforcement mesh (4 mm thick and hole mesh was 60 mm × 60 mm), gravel (30 mm thick, stacked thickness was 600 mm) and polystyrene board (100 mm thick). The total thickness of back wall is 740 mm, the heat transfer air pipes of the two greenhouses are all PVC pipes with a diameter of 110 mm and the wall thickness is 7.5 mm. Tomato (Solanum lycopersicum, ‘Provence’) plants were cultivated in a substrate bag with drip irrigation in all kinds of greenhouses on 17 January 2021. In this paper, 9:00–17:00 was set as solar radiation during the day, and 17:00–9:00 the next day was set as insulation at night, according to the thermos cup cover roll-up time to determine the day and night. The back wall ventilation windows were opened at noon (12:00) and closed at 14:00 on sunny days to facilitate the hot air circulation and maintain the heat storage.

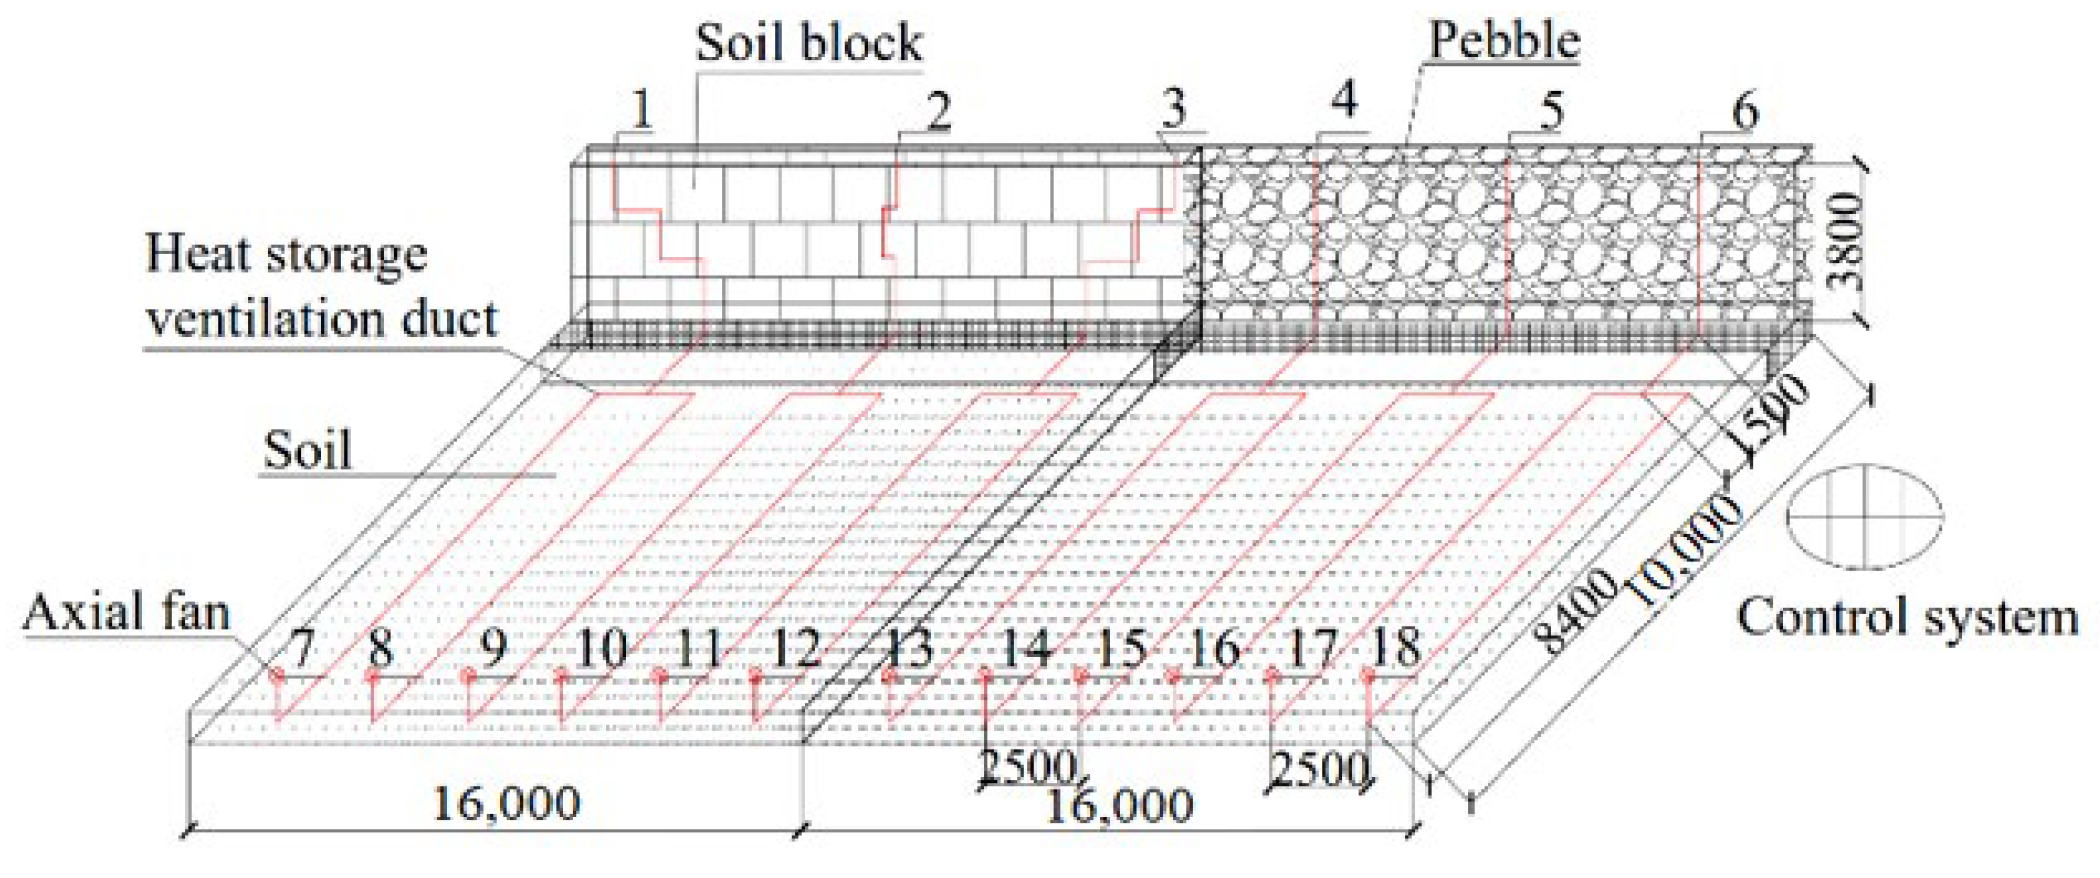
2.1.2. Active Thermal Storage Circulation System

The active heat storage circulation system consisted of heat transfer ducts (indoor), an axial flow fan, a control system and so forth. As shown in Figure 3, 1–6 consist of PVC pipe inlets located at the top of the rear wall, while 7–18 represent the PVC pipe outlets located 200 mm from the front roof in the soil and 450 mm above the soil. Thereinto, the inner and outer diameter of the PVC pipes was 95 and 110 mm, respectively. Meanwhile, the pipe diameter of PG rear wall was 200 mm. Other pipe diameters were 110 mm. Due to the different internal structure of the back wall, the total length of the pipes differed slightly, including 17.75 and 15.75 m for SG and 14.75 m for PG. The control system was installed on the east side of the greenhouse with an automatic fan control mode. When the room temperature during the period of 17:00 to 9:00 the next day was lower than 20 °C, the fan could automatically turn on for heat dissipation. Then, if the room temperature were lower than 8 °C, the fan could automatically stop for heat preservation. On the basis of the previous studies [28] and the bottom-up flow law of indoor hot air [29], in order to ensure that more heat can be stored during the day and can appropriately reduce the humidity in the greenhouse to provide better growth conditions for crops, axial flow fan installed in the lower outlet position by the principle of negative pressure ventilation. When the fan was activated, the negative pressure was formed in the duct. Then, the hot air flowed from the wall to the soil and finally arrived in the room. The rated ventilation capacity and power of axial flow fan was 269 m3/h and 25 W, respectively. That is, the back wall is connected with the soil through PVC pipes, so that hot air can flow from the back wall to the soil along the PVC pipes, and then be guided to the air through the axial flow fan. As the hot air flows from bottom to top, it will enter the top air inlet again, and from then on, the hot air will form a circulating flow in the greenhouse. The heat release mode of the circulation system was carried out at night in order to achieve the effect of heat preservation in winter.

2.1.3. Testing Instruments

In the test, HOBO temperature and humidity recorder UX100-011 (accuracy: temperature ±0.20 °C, relative humidity ±2.50%) produced by Onset, USA was used to measure the environmental temperature and humidity of the greenhouse. The light intensity was measured by HOBO light intensity recorder UA002-64 (accuracy: ±10 lx). The wind speed of indoor import and export was detected by Testo 425 (accuracy: wind speed ±0.03 m/s + 5% of the measured value) produced by Testo, Germany. Heat flow density was measured by the portable heat flow meter JTDL-4 type (accuracy: heat flow ±4%, resolution 0.1 W/m2) produced by Beijing Century Jintong company.

2.2. Wall Construction Process

The differences between the walls of the two greenhouses were mainly due to the differences in their back wall materials. The SG wall was mainly constructed by mechanically pressing plain soil modules and then staggered by forklifts. The PG wall was composed of abundant small stones such as gravel and pebbles, which were fixed with fine and coarse reinforcing steel mesh. After leaving a gap the heat transfer ducts of the SG were constructed during the pressing process of the plain soil modules. In order to prevent the surface layer of the ducts from falling off, the PVC ducts were also buried and docked with the soil ducts during installation. The heat transfer duct of PG was a top-down and vertical duct, which was made manually and then docked with the soil duct.

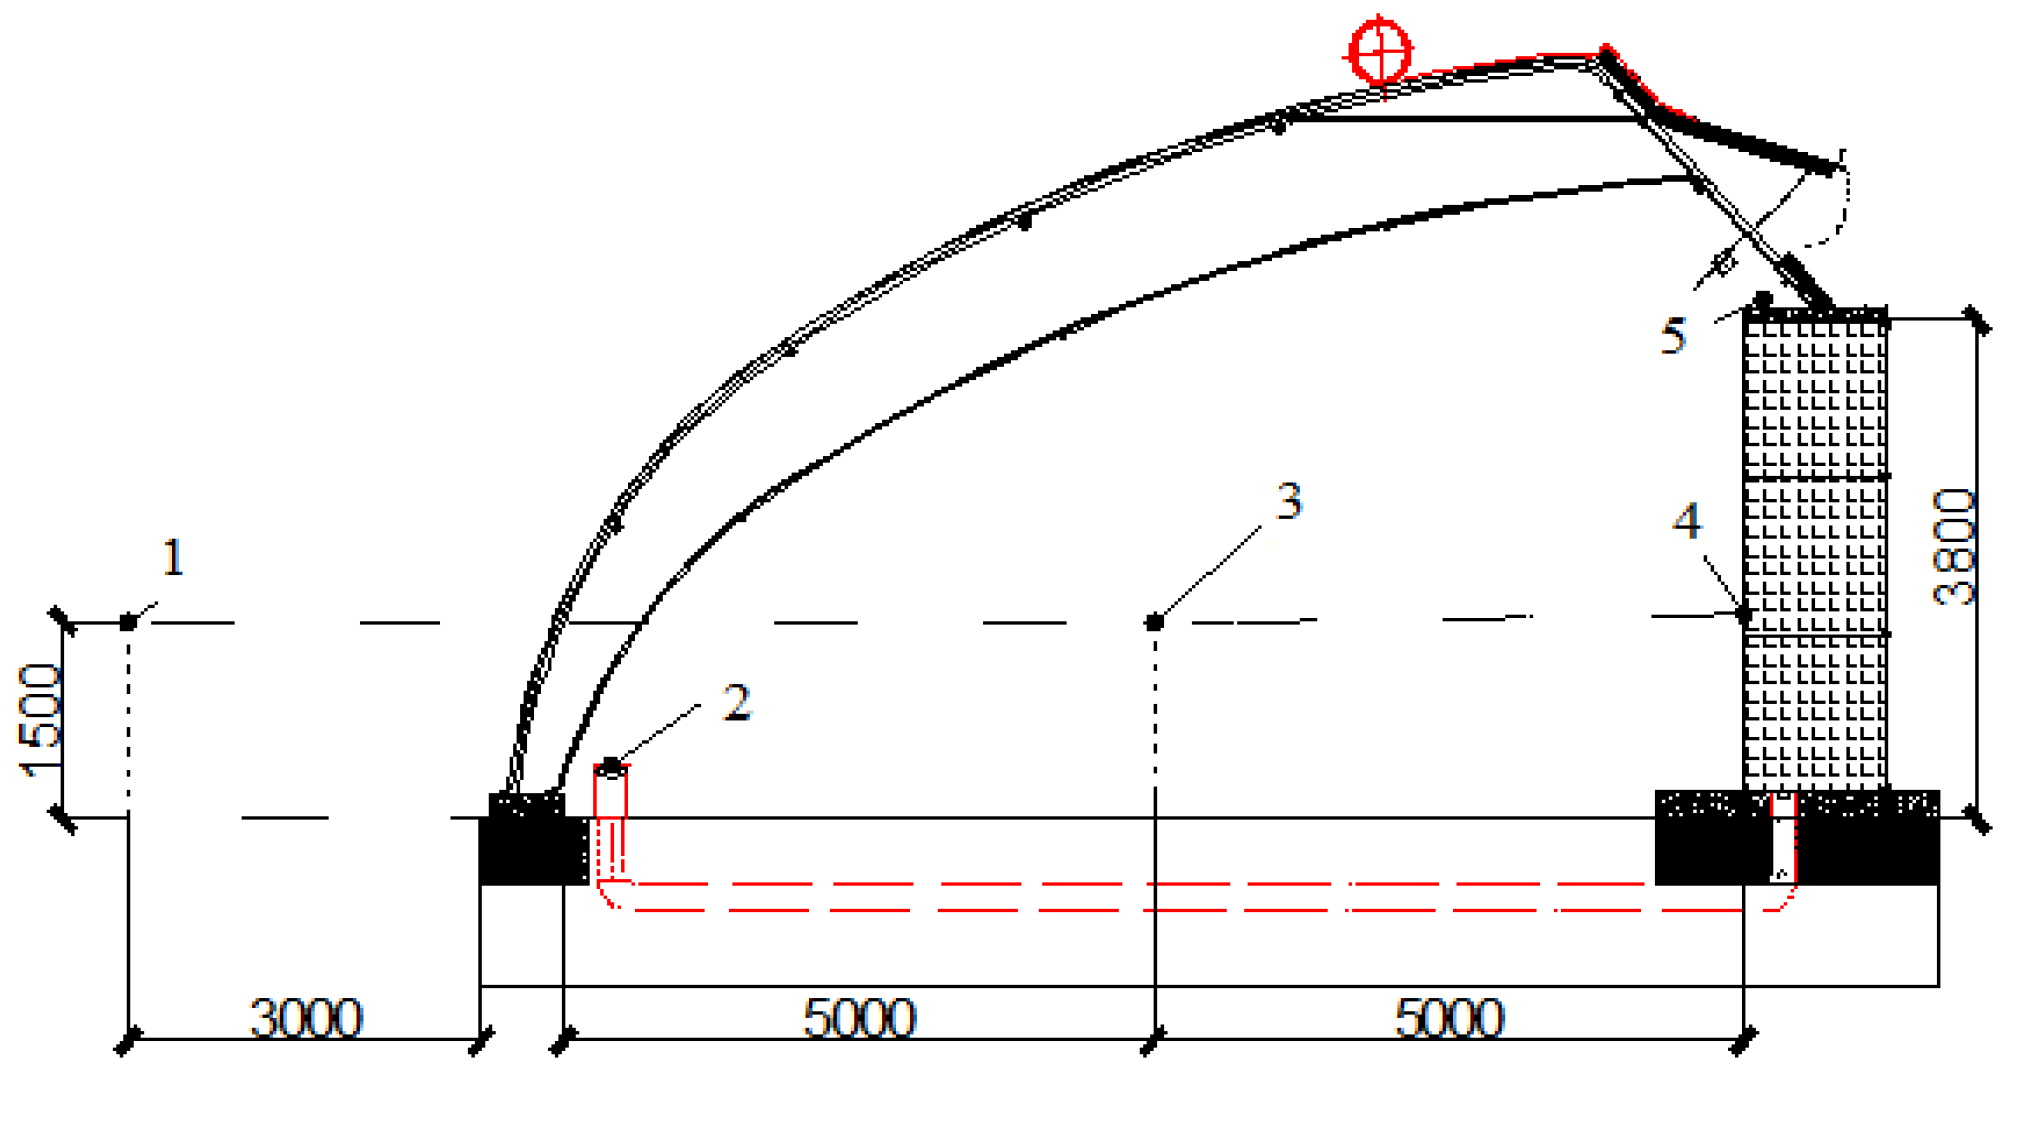
2.3. Measurement Point Arrangement

The details of the measurement point arrangement of the two kinds of greenhouses were shown in Figure 4, the measurement points of outdoor temperature, humidity and light intensity were located at 3 m away from the greenhouse with a height of 1.5 m (see the points 1). Meanwhile, the measurement points of indoor temperature, humidity and light intensity were located in the middle of the greenhouse with a height of 1.5 m (see the points 3). The measurement points of temperature and humidity at the air inlet and outlet were set at the upper air inlet and the lower air outlet (see the points 5 and 2). The measurement points of heat flow density at the back wall were set on the surface of the back wall with a height of 1.5 m (see the point 4). The measurement points of wind speed were located at the inlet and outlet ducts and measured horizontally. The test data collection time was from 30 January 2021 to 28 February 2021, and the data recording interval was set to 10 min each time. Thereinto, the heat flow density collection time was taken as 20 min each time, as shown in Figure 3.

2.4. Data Processing

The data from this experiment were analyzed and plotted in two-dimensional graphs using Excel 2019 and Origin 2019b, and significance tests were performed using SPSS 26.0.
The heat transfer in this paper was divided into active and passive, where the active and passive heat storage can be calculated according to the following Equations (1) and (2) [9].
Q a c t = v τ A 1 V o u t H o u t t τ v τ A 1 V i n H i n t τ / 1000  
Q p a s = q τ S Δ t τ / 10 6
where Qact and Qpas, respectively, indicated the heat exchange of active and passive heat storage (positive value indicated heat storage, negative value indicated heat release), MJ; vt is the air flow velocity in the duct at the time τ (measured, the air velocity of SG inlet and outlet is 1.47 and 2.80 m/s, respectively, and of PG 1.51 and 2.82 m/s, respectively); A is the equivalent cross-sectional area of the duct (m2), and the equivalent cross-sectional area of SG and PG is calculated as 0.009 and 0.02 m2, respectively; Vin and Vout are the specific volume (density inverse) of the air inlet and outlet at the time τ, (m3/kg); Hin and Hout are the enthalpy of air inlet and outlet, respectively, at time τ, (kJ/kg); t is the time interval of data recording during the test as 1200 s; qτ is the heat flow at the back wall at time τ, (W/m2); S is the area of the back wall (the product of the length and width of the back wall), m2.
In Equation (1), H (enthalpy of air) is calculated from [30], where d signifies the moisture content of air and c represents the specific heat capacity. The specific equation is as follows:
c = R a T p 1 + 1.608 d  
d = 0.622 p w p p w
H = 1.01 T + d ( 2501 + 1.85 T )
where d is the air moisture content, kg/kgdry air; p is the pressure of wet air, i.e., atmospheric pressure, (Pa); pw is the partial pressure of water vapor, (Pa); Ra is the gas constant of dry air, valued as 287, J/(kg·K); T is the thermodynamic temperature of air (K); T′ is the dry bulb temperature (°C). Then, the calculated values were substituted into (1, 2), and the results are shown in Table 1.

3. Analyses of Environmental Parameters of Different Modular Wall Greenhouses

3.1. Comparative Analyses of Temperatures inside and outside the Greenhouse

Due to the heat storage effect of the back wall of the solar greenhouse, it was suitable for overwintering tomato production. Moreover, the winter period was mainly between December and February and the main period of tomato production was from January to March. However, due to the COVID-19 pandemic, the test time was delayed to arrange. The local weather was the main factor affecting the safe production of solar greenhouse. Thus, it was necessary to analyze the thermal performance of the solar greenhouse under different weathers. Among them, Guo et al. [30] selected the typical weather in spring, summer, autumn and winter to match the weather types and conditions, which appeared more frequently in the local meteorological data in recent years. Li et al. [31] determined the typical weather with the analysis of thermal performance in water-mediated solar greenhouse based on the instantaneous outdoor light intensity which was more than 500 W/m2 in the typical sunny days and less than 200 W/m2 in the typical cloudy days. Combined with the statistics of the weather condition of Yangling Meteorological Bureau in Shaanxi Province (Table 2) and previous studies [31,32], the typical weather in the thermal performance analysis of water-mediated solar greenhouse was determined based on the instantaneous outdoor light intensity. When the instantaneous outdoor light was more than 500 W/m2, it was categorized as a typical sunny day. Meanwhile, when the instantaneous outdoor light was less than 200 W/m2, it was categorized as a typical cloudy day. In this research, when the instantaneous outdoor light intensity reached 850 W/m2 and the temperature was over 20 °C, it was categorized as a typical sunny day. When the instantaneous outdoor light intensity was less than 250 W/m2 and the temperature was less than 10 °C, it was categorized as a typical cloudy day. The outdoor light intensity details are shown in Figure 3; according to the local weather conditions, we selected the 28-day average temperature from 31 January 2021 9:00 to 28 February 2021 9:00, in which the typical sunny day condition was present from 19 February 2021 9:00 to 22 February 2021 9:00 and the typical cloudy day condition from 24 February 2021 9:00 to 27 February 2021 9:00. The outdoor temperature reached about 20 °C on typical sunny days, and 0–9 °C on typical cloudy days, as shown in Table 2 (data from Xianyang Meteorological Bureau, China).
As shown in Figure 5, the same temperature changing trend was performed in both kinds of greenhouses for 28 consecutive days. Thereinto, the maximum temperature was 42.56, 42.56 and 27.19 °C, the minimum temperature was 9.11, 9.11 and −3.75 °C and the average temperature was 18.47, 18.23 and 6.82 °C in SG, PG and outdoor, respectively. In the nighttime, the average temperature was 15.51, 15.07 and 4.41 °C, respectively. The results revealed that the temperature in both greenhouses was increased by 10–12 °C compared to the outdoor condition, which could promote the overwintering growth of tomato plants at night.

3.2. Temperature Analysis inside the Greenhouses during the Test Period

The detailed information of the inside and outside temperature environments of the two heliogreenhouses over 28 days is not clearly shown in the above figure. Therefore, we determined the detailed parameters of temperature environment by analyzing the changes of indoor temperature for the growth of tomato plants in the daytime and nighttime conditions, which is shown in Table 3. Concrete analysis was as follows:
The optimum temperature range for tomato growth was 18–25 °C during the day and 8–13 °C at night [33]. Thus, 8, 13, 18 and 25 °C were selected to compare the differences between the two greenhouses. It revealed that the average temperature at night (17:00–09:00) was 0.44 °C higher in SG than that in PG. Moreover, there was no temperature below 8 °C in both kinds of greenhouses, which suggested that both greenhouses were suited for the overwintering production of tomato. According to the perspective of nighttime insulation and average temperature in daytime, the indoor environment of SG was better for the growth of tomato than PG.

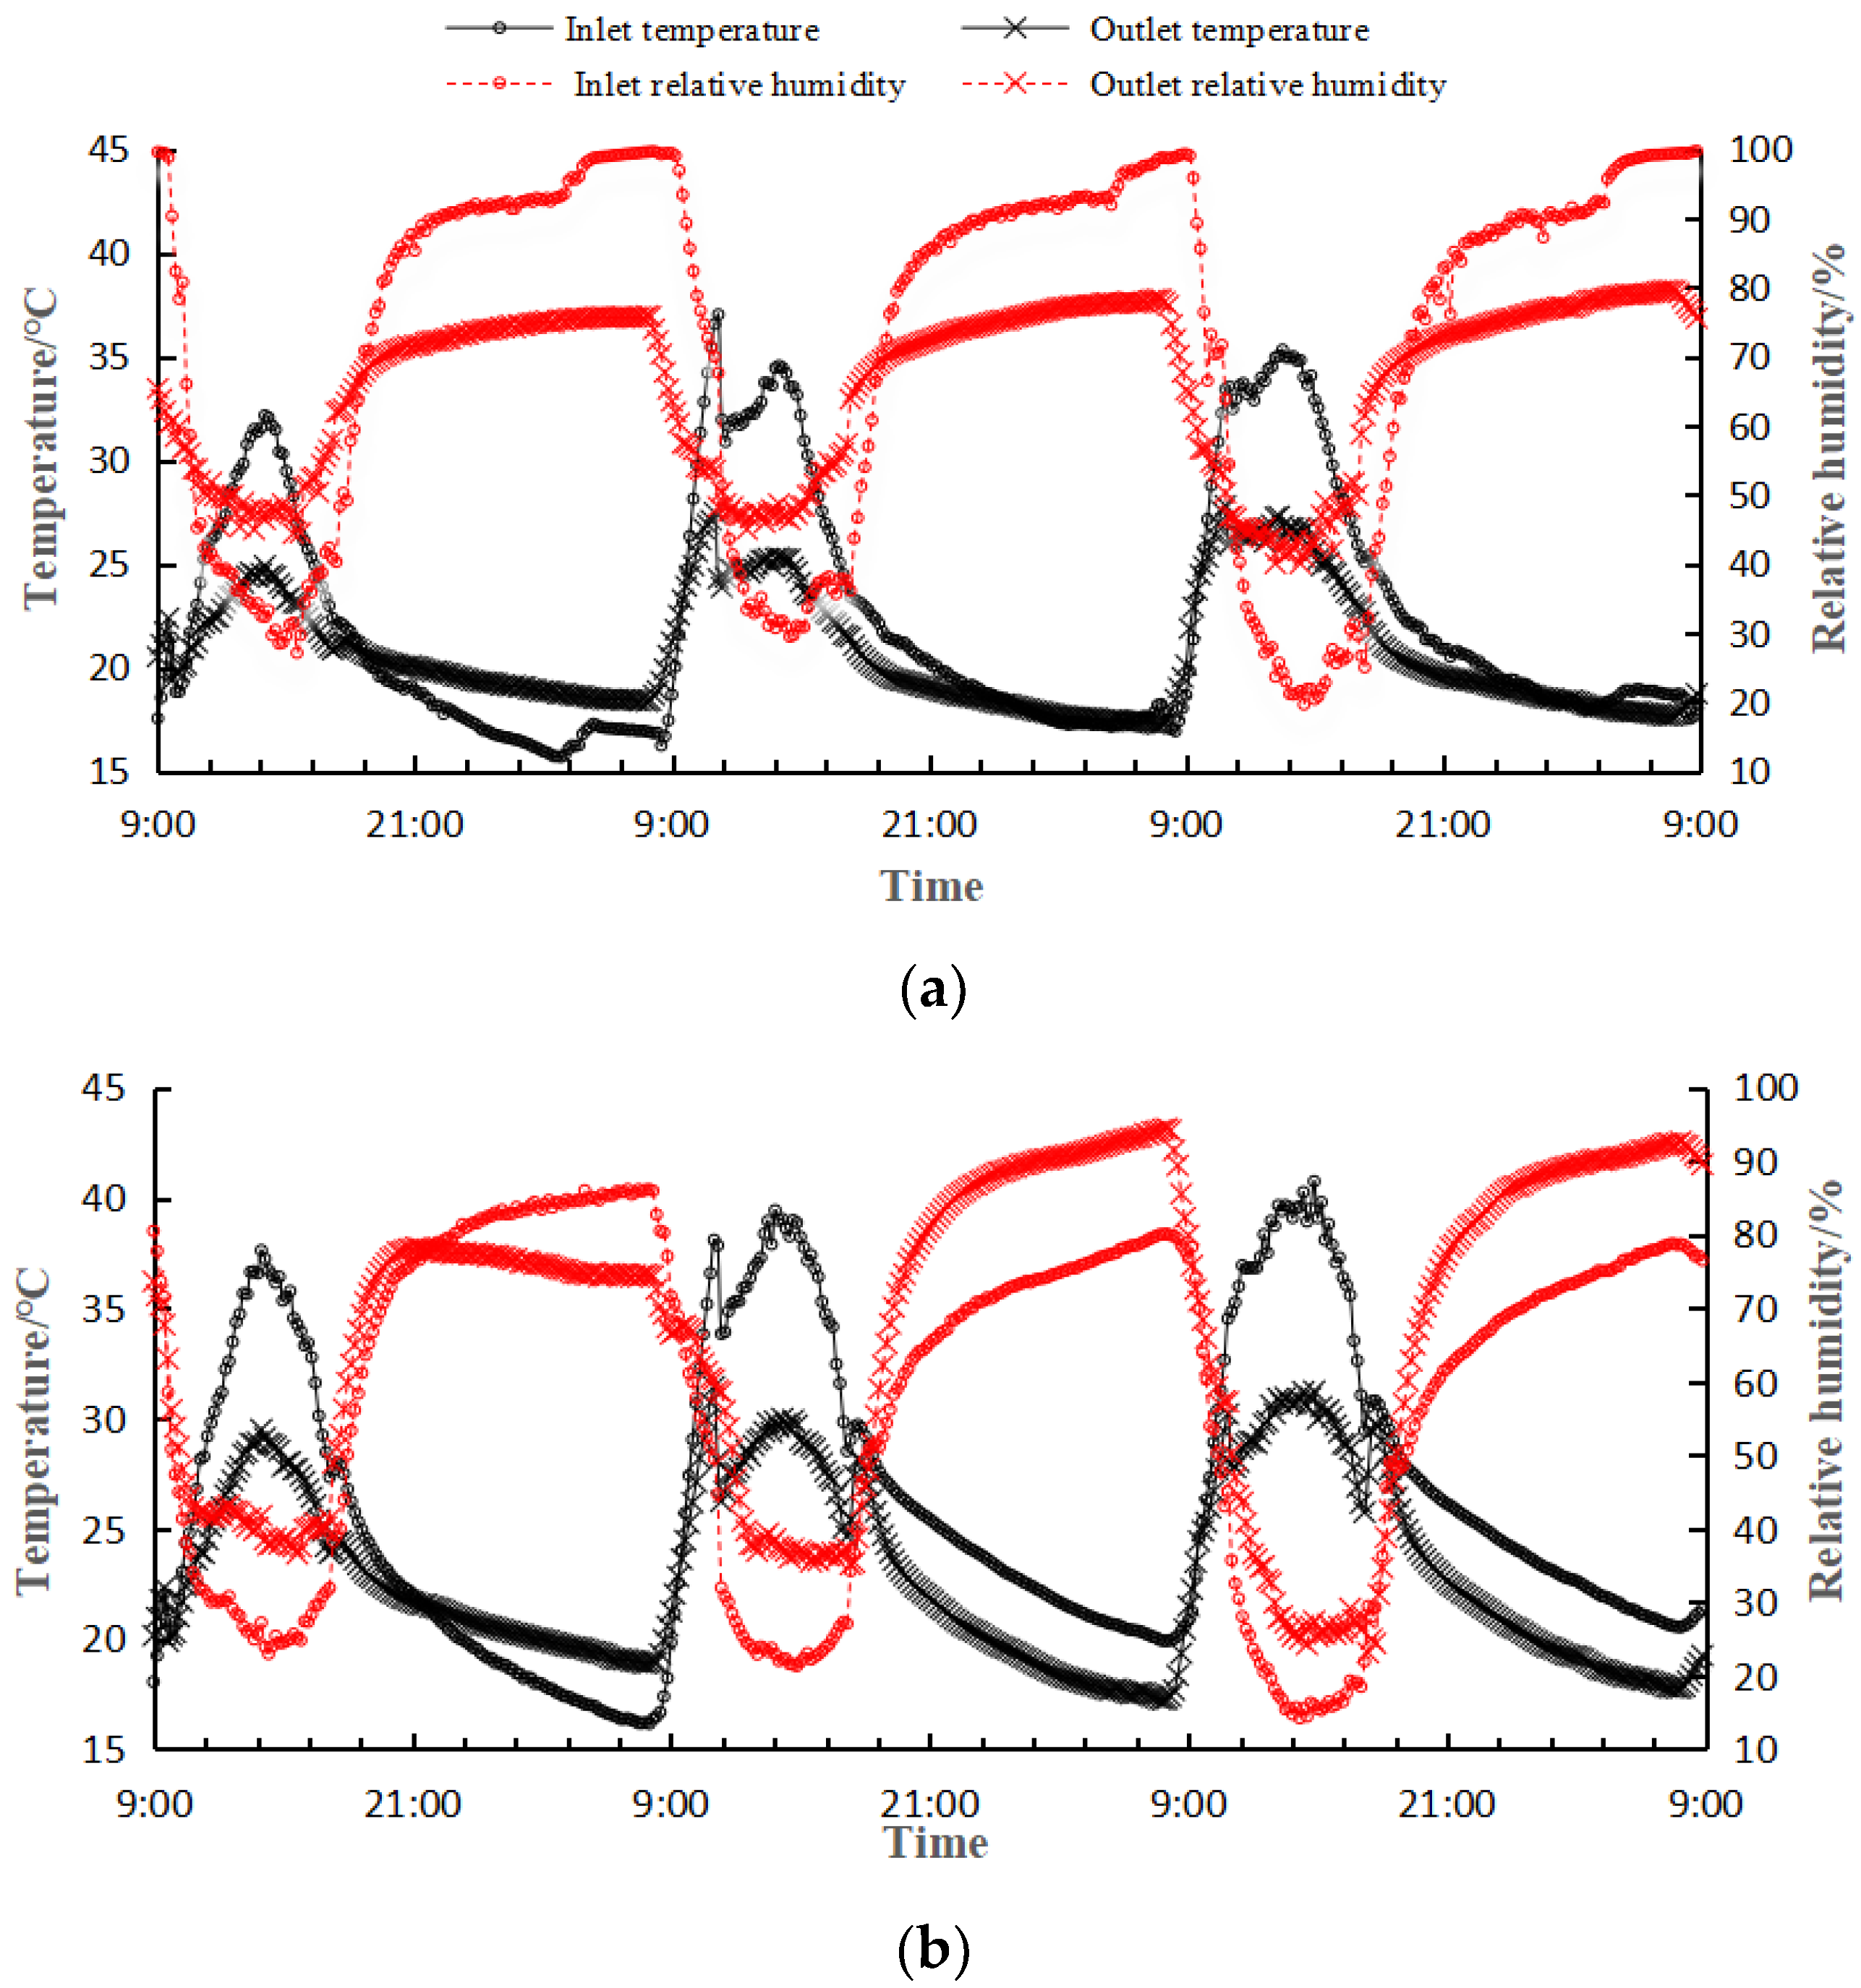
3.3. Comparative Analyses of the Inlet and Outlet Air Temperature and Humidity in the Greenhouse on Typical Sunny Days

For typical sunny days (19 February 2021 9:00 to 22 February 2021 9:00), the changes of the temperature and humidity in the inlet and outlet air vents of SG and PG are shown in Figure 6. The maximum and minimum temperature in the inlet of SG was 37.02 and 15.68 °C, respectively. In the outlet of SG, the maximum and minimum temperature was 27.81 and 17.25 °C, respectively. When it comes to the inlet of PG, 40.76 and 16.16 °C were the maximum and minimum temperature, respectively. Meanwhile, 31.44 and 17.25 °C were the maximum and minimum outlet temperature of PG, respectively. The average temperature difference between the inlet and outlet of SG and PG during the heat storage process was 5.03 and 5.98 °C, and the average relative humidity differences between the inlet and outlet of SG and PG was 17.15% and 11.40%, respectively. The average daily heat storage duration of SG and PG was 6.8 and 6.6 h, respectively. This suggested that during the heat storage process in daytime, SG warmed up faster and the average relative humidity difference changed more than it in PG. However, PG warmed up slowly. The exothermic process carried out at night to ensure that the temperature in the greenhouse would not drop too fast and be lower than 14 °C. The average temperature difference between the inlet and outlet of SG and PG during the exothermic process was 1.04 and 2.37 °C. In addition, the average relative humidity difference between the inlet and outlet of SG and PG was 15.99% and 11.50%. The average daily exothermic duration of SG and PG was 10 and 10.5 h, respectively. This indicated that both SG and PG could provide a large amount of heat during the nighttime exothermic process, and the exothermic duration of PG was slightly longer than that of SG. That is, the greenhouse temperature performance in PG was slightly worse than that in SG, so it needed a longer duration of exothermic heat to maintain the greenhouse temperature. In conclusion, the temperature performance of SG was better than that of PG.

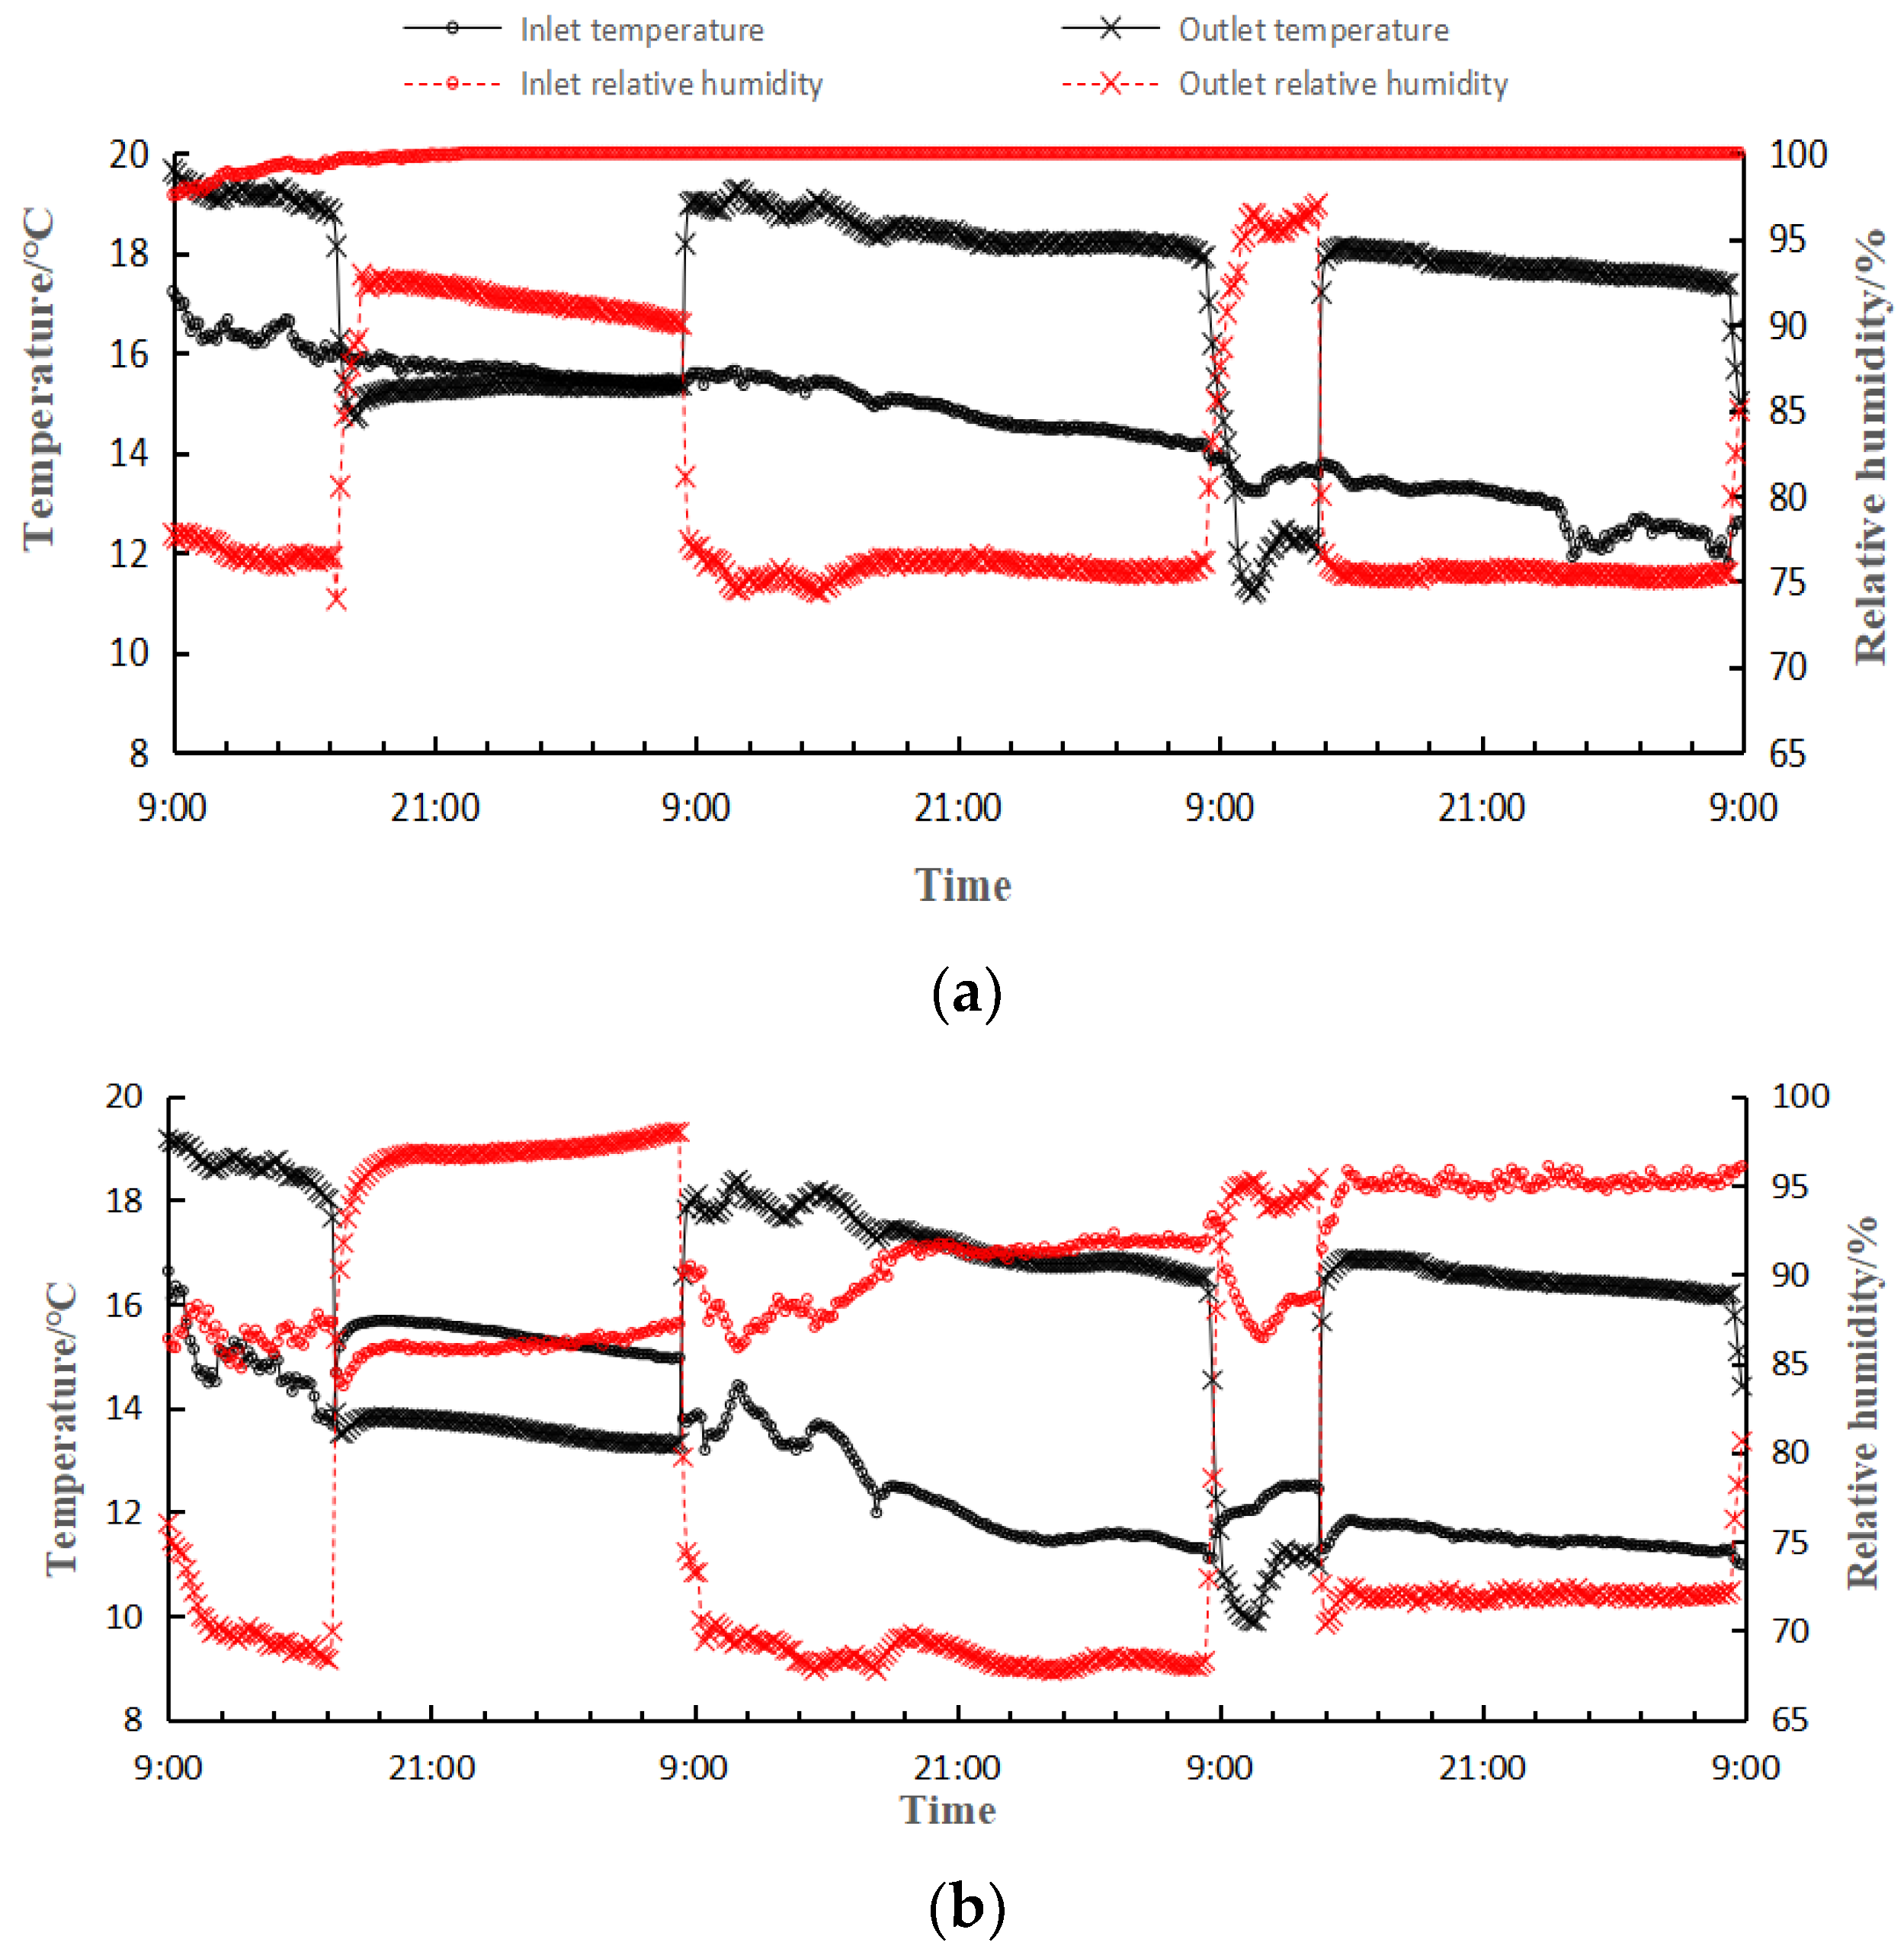
3.4. Comparative Analyses of the Temperature and Humidity of the Air Inlet and Outlet in the Greenhouse on Typical Cloudy Days

For typical cloudy weather (24 February 2021 9:00 to 27 February 2021 9:00), the temperature and humidity changes of SG and PG air inlet and outlet are shown in Figure 7. The maximum temperatures of both SG and PG were not over 20 °C. Meanwhile, the fan was set to start when the indoor temperature exceeded 22 °C during the daytime period (9:00–17:00). Thus, the fans in SG and PG were shut down in cloudy weather. The maximum and minimum temperature of SG greenhouse air inlet was 17.23 and 11.79 °C, while the maximum and minimum temperature in the air outlet was 19.65 and 11.20 °C, respectively. The maximum and minimum temperature of PG greenhouse air inlet was 16.63 and 10.98 °C, while the maximum and minimum temperature in the air outlet was 19.18 and 9.88 °C, respectively. The average temperature difference between the inlet and outlet was 2.89 and 3.90 °C. At night, the average relative humidity difference between the inlet and outlet of SG and PG was 19.92% and 15.87% with the fan manual working, respectively. According to the average temperature difference between the inlet and outlet at night, PG could cool quickly. The average relative humidity difference SG was large, which indicated that it had a more obvious enhancement in the indoor air temperature of SG. On the basis of the above results, the average indoor air temperature of SG and PG was 12.03 and 11.92 °C during the daytime and 11.39 and 11.38 °C at night, respectively. Meanwhile, the average outdoor air temperature during the daytime was 3.42 °C and the average outdoor air temperature at night was 2.27 °C. In summary, thermal insulation and heat storage effect of SG were slightly better than that of PG, and both greenhouses could effectively improve the thermal environment inside the greenhouse under the condition of a cloudy day.

3.5. The Significance Analyses of Environmental Parameters of Two Greenhouse on Typical Sunny and Cloudy Days

Significance tests using SPSS software were conducted for SG and PG. The independent sample t-test was used for both subjects, where ventilation was continuous for 4 h (active thermal storage circulation system was turned on) on typical sunny days. For typical cloudy days, the inlet and outlet temperatures and humidity of both greenhouses are shown in Table 4 and Table 5. As shown in Table 4 and Table 5, there was a significant difference between the inlet and outlet temperatures on a typical sunny day. However, there was no difference in the relative humidity. Besides, there was a significant difference in the inlet and outlet temperatures and humidity on a typical cloudy day.

3.6. Analysis of an Active Heat Storage System Heat Transfer and Passive Heat Storage of Walls

3.6.1. Active Passive Heat Storage and Heat Release

The back wall was mainly responsible for the passive heat storage and release. The changes of the heat flow density of the passive back wall of the two greenhouses under typical weather are shown in Figure 8. On a typical sunny day (19 February 2021 9:00–9:00 the next day), the average heat storage heat flow density of SG and PG was 256.95 and 136.44 W·m−2, and the heat storage time was 7.67 h. The average heat release heat flow density of SG and PG was 29.99 and 14.86 W·m−2, and the heat release time was 15.34 h. Figure 7b showed the heat flow density curves of the back wall surface on a typical cloudy day (24 February 2021 9:00–9:00 the next day), the average heat storage heat flow density of SG and PG was 15.78 and 9.62 W·m−2 and the heat storage duration was 2.33 and 2.00 h, respectively. The average exothermic heat flow density of SG and PG was 7.87 and 6.26 W·m−2, respectively. The average heat flow density of SG and PG was 7.87 and 6.26 W·m−2, respectively, and the duration of heat release was 16 h. This showed that the heat flow density of the back wall of the two greenhouses varied with the time of insulation uncovering, and the average heat storage density of SG was higher than that of PG on sunny days.
The calculated results of heat transfer and active heat transfer ratio (the ratio of heat transfer of active heat storage system to total heat transfer) of the two greenhouses under different weathers by active and passive heat storage and heat release Equations (1) and (2) are shown in Table 1. This revealed the total heat transfer of SG and PG. In detail, heat storage was 464.87 and 264.16 MJ on sunny days, and 110.44 and 61.60 MJ was the heat release on sunny days. Meanwhile, 54.82 and 46.89 MJ was the heat release on cloudy days, respectively. In terms of active heat transfer, SG was higher than PG on sunny days and SG was lower than PG on cloudy days. The active heat transfer ratio of the two greenhouses was higher on cloudy days. Because the external weather in the two greenhouses caused the back wall of the greenhouse to absorb little sunlight. That is, the back wall of the greenhouse rarely absorbed solar radiation and then stored heat. It needed to exert heat for a long time to maintain the temperature inside the greenhouse. In summary, heat storage of both greenhouses was higher than the heat release for the whole day, which reflected the good thermal performance of the two heliogreenhouse. Moreover, the heat storage performance of SG was slightly better than that of PG.

3.6.2. Energy Efficiency Ratio

In this paper, the energy efficiency ratio K of the active heat storage cycle system was defined as the ratio of the total heat transfer in the storage and discharge phases to the power consumption of the axial fan operation in 1 d (9:00–9:00 the next day). The larger the energy efficiency ratio was, the better the energy saving effect was [7]. The energy efficiency ratio of the two kind greenhouses was specifically calculated according to the following equation [34]:
K = Q a c t P t / 1000
where Qact is the heat transfer in the storage and discharge phases of the active heat storage cycle system in the greenhouse (same as Qact in Equation (2)), (MJ); P is the rated power of the axial fan, (kW), which is 0.025 kW for the two greenhouses with the same fan specification; t is the operation time of the storage and discharge phases of the active heat storage cycle system, (s).
The energy efficiency ratios of the two greenhouses for SG and PG were calculated as 92.12 and 79.55, respectively, in the heat storage phase on a typical sunny day and 16.78 and 15.21, respectively, in the heat release phase on a sunny day. In addition, 30.11 and 28.15 were the heat release phases on a typical cloudy day for SG and PG, respectively. This suggested that both SG and PG had a good energy saving effect in the three stages, among which the energy efficiency ratio in the typical sunny heat storage stage was higher than the other two stages. All the results indicated that the energy saving effect was better in this stage, which was due to the short duration and high heat transfer in the heat storage stage, so as to provide the heat release in the greenhouse at night. The lowest heat release stage was caused by the low heat release on sunny days and the long heat release duration. which increased the running time of the fan. The energy saving effect was lower than the other two stages, and then the energy efficiency ratio of SG was greater than PG in all three stages. This suggested that the energy saving effect of SG was slightly better than that of PG.

4. Discussion

(1)
On typical cloudy days, the relative humidity at the air inlet of SG was generally high, reaching 96% on average, which was consistent with the results of the previous study [35]. The relative humidity at the air inlet of both SG and PG was close to 100%, which may arise from the shutting down of the active thermal storage circulation system on cloudy days. Meanwhile, the hot air was hovering over the top of internal environment, which resulted in the accumulation of moisture at the air inlet. In terms of the back wall material, the water absorption and permeability of soil was higher than that of stone. Combined with the less density of soil than that of pebbles, the relative humidity of both SG and PG air inlets were high. Then, the relative humidity of SG tended to reach 100%.
(2)
As shown in Table 1, the active heat transfer accounted for a smaller percentage in the sunny heat storage and exothermic stages, which was different from the active heat transfer percentage of G1 and G2 of 30.02% and 34.32% studied by related research [7] This may be on account of no difference in the calculated values of ντ, Hin and Hout involved in the computational formula of heat transfer in Equations (1) and (2) of this paper. Meanwhile, V: 0.16, 0.27 m3 and A: 0.009, 0.02 m2 in this paper were different from the total volume of ducts (5.60, 8.98 m3) and cross-sectional area (0.152, 0.235 m2) in a previous study [7]. Structural optimization of the active heat storage circulation system will be carried out subsequently to improve its active heat storage capacity.
(3)
The back wall material structure and heat storage method were crucial to improve the thermal insulation and heat storage of the solar greenhouse [36,37]. In this paper, the back wall materials and the horizontal positions of the air inlet and outlet of the two greenhouses were different. Thus, no single analysis of the thermal insulation and heat storage performance of a single greenhouse can be performed. The difference of duct arrangement structure caused by the back wall material made it difficult to analyze the heat transfer characteristics. However, the heat storage mode and the horizontal height of air inlet and outlet of the two greenhouses were identical. Thus, a comparative analysis was conducted between the two greenhouses [38], in order to determine the greenhouse with better heat insulation and heat storage. The next step will be to consider the analysis of the heat transfer performance of a single greenhouse under the condition of natural temperature difference.

5. Conclusions

(1)
The data test analysis of 28 consecutive days showed that the average indoor air temperature at night was 15.51 and 15.07 °C for SG and PG, respectively. Meanwhile, the average outdoor air temperature at night was 4.41 °C. Therefore, both modular greenhouses can effectively increase the nighttime temperature by 10–12 °C. That is, the nighttime insulation performance of both greenhouses was good. However, SG was slightly better than PG.
(2)
In terms of the active heat transfer characteristics, the difference of average air temperature between the inlet and outlet of SG and PG during the heat storage period was 5.03 and 5.98 °C, respectively. The average relative humidity difference was 17.15% and 11.40% and the average heat storage duration was 6.8 and 6.6 h, respectively. In addition, the difference of average relative humidity between the inlet and outlet of SG and PG was 1.04 and 2.37 °C. The average relative humidity difference between the inlet and outlet of SG and PG was 15.99% and 11.50%, respectively. The average heat release duration was 10 and 10.5 h. The difference of the average temperature and the relative humidity between the inlet and outlet of SG and PG indicated that the insulation effect of SG was better and the speed of increasing temperature was faster at night than that of PG. On typical cloudy days, the average temperature difference between the inlet and outlet of SG and PG was 2.89 and 3.90 °C, respectively. The difference of average relative humidity was 19.92% and 15.87%, respectively. Besides, the average duration of heat release was 11 h. The difference of average temperature between the inlet and outlet of SG was smaller than that of PG in the heat release. The difference of average relative humidity was SG > PG. Therefore, the heat preservation and storage performance of SG was slightly better than PG. The thermal performance of heliogreenhouse with a modular heat storage wall can effectively improve the growth of crop tomatoes.
(3)
During the heat storage and release period on sunny heat storage stage, sunny day exothermic phase, and cloudy exothermic phase, the total heat transfer of SG was 464.87, 110.44 and 54.82 MJ, respectively, while the total heat transfer of PG was 264.16, 61.60 and 46.89 MJ, respectively. The heat storage capacity of the two greenhouses was much larger than the heat release, which indicated that the heat storage performance of the two greenhouses was good. Thereinto, the heat storage and heat release of SG were higher than that of PG. In addition, the maximum energy efficiency ratio of SG and PG was 92.12 and 79.55, respectively, in the heat storage phase on typical sunny days. The maximum energy efficiency ratio of SG and PG was 16.78 and 15.21 in the heat release phase on typical sunny days, respectively. Additionally, the maximum energy efficiency ratio of SG and PG was 30.11 and 28.15 in the heat release phase on typical cloudy days, respectively. This revealed that the energy saving effect of the active system in the greenhouse under different weather is very good, where the heat storage phase on typical sunny days was the optimum.
(4)
The construction cost of the modular heat storage wall heliogreenhouse was reduced by 70–160 yuan/m2 compared with the traditional heat storage solar greenhouse and backfilled assembly heat storage wall solar greenhouse. Moreover, the construction time of the modular heat storage wall solar greenhouse was short.
In summary, both modular heat storage wall heliogreenhouses have good thermal insulation and heat storage performance, and the thermal insulation and heat storage performance of SG were slightly better than that of PG. The conclusions of this paper could provide data reference and practical value for the production and application of a modular heat storage wall heliogreenhouse.

Author Contributions

Conceptualization, D.W., B.C. and Y.Z.; methodology, D.W., B.C. and Y.Z.; software, D.W., B.C. and Y.Z.; validation, D.W., Y.Z. and X.W.; formal analysis, D.W., X.W. and E.B.; investigation, D.W., B.C. and Z.Z.; writing—original draft preparation, D.W., B.C. and Y.Z.; writing—review and editing, D.W., B.C. and X.W.; supervision, D.W., Z.Z. and E.B. All authors have read and agreed to the published version of the manuscript.

Funding

National Natural Science Foundation of China: Research on the structure optimization and energy transfer mechanism of active thermal storage cycle system in solar greenhouse (31901420). Structure Research and application demonstration of a new type of assembled active thermal storage solar greenhouse in Qinghai agricultural region (2022-NK-121).

Institutional Review Board Statement

Not applicable.

Informed Consent Statement

Not applicable.

Data Availability Statement

Not applicable.

Conflicts of Interest

The authors declare no conflict of interest.

References

  1. Bao, E.C.; Zou, Z.R.; Zhang, Y. CFD simulation of heat transfer on back wall of active heat storage solar greenhouse with different airflow directions. J. Agric. Eng. 2018, 34, 169–177. [Google Scholar]
  2. Greenhouse Data System. Department of Rural Mechanization Management, Ministry of Agriculture and Rural Affairs. 30 June 2021. Available online: http://data.sheshiyuanyi.com/AreaData/ (accessed on 10 September 2021).
  3. Wu, Y.W.; Zhang, Y.; Bao, E.C.; Cao, K.; Zou, Z.R. Research progress of modular heat storage wall solar greenhouse. Agric. Eng. Technol. 2022, 42, 54–58. [Google Scholar]
  4. Chen, C.; Li, Z.; Guan, Y.; Han, Y.Q.; Ling, H.S. Influence of manufacturing methods on thermal performance of phase change heat storage materials in solar greenhouse. Trans. Chin. Soc. Agric. Eng. 2012, 28, 186–191. [Google Scholar]
  5. Xu, F.; Shang, C.; Li, H.; Xue, X.; Sun, W.; Chen, H.; Li, Y.; Zhang, Z.; Li, X.; Guo, W. Comparison of thermal and light performance in two typical Chinese solar greenhouses in Beijing. Int. J. Agric. Biol. Eng. 2019, 12, 24–32. [Google Scholar] [CrossRef]
  6. Zhang, J.; Wang, J.; Guo, S.; Wei, B.; He, X.; Sun, J.; Shu, S. Study on heat transfer characteristics of straw block wall in solar greenhouse. Energy Build. 2017, 139, 91–100. [Google Scholar] [CrossRef]
  7. Bao, E.C.; Cao, Y.F.; Zou, Z.R.; Zhang, Y. Heat transfer characteristics of solar greenhouse with active heat storage walls with different structures. Trans. Chin. Soc. Agric. Eng. 2019, 35, 189–197. [Google Scholar]
  8. Han, F.; Chen, C.; Hu, Q.; He, Y.; Wei, S.; Li, C. Modeling method of an active–passive ventilation wall with latent heat storage for evaluating its thermal properties in the solar greenhouse. Energy Build. 2021, 238, 110840. [Google Scholar] [CrossRef]
  9. Shi, P.P.; Lu, J.; Yang, H.X.; Li, X.L.; Zhou, H.; Wang, B. Influence of construction method of heat storage layer on heat storage performance of solar greenhouse composite phase change wall. Acta Energ. Sin. 2018, 39, 1511–1518. [Google Scholar]
  10. Li, X.F.; Chen, Q.Y. The effect of wall materials and their combinations on the thermal insulation performance of solar greenhouse walls. Chin. J. Eco-Agric. 2006, 14, 185–189. [Google Scholar]
  11. Zhou, S.; Zhang, Y.; Cheng, R.F.; Yang, Q.Z.; Fang, H.; Zhou, B.; Lu, W.; Zahng, F. Evaluation on heat preservation effects in micro-environment of large-scale greenhouse with active heat storage system. Trans. Chin. Soc. Agric. Eng. 2016, 32, 218–225. [Google Scholar]
  12. Zou, Z. Performance and advantage analysis of modular solar greenhouse. Agric. Eng. Technol. 2020, 40, 10–12. [Google Scholar]
  13. Zhang, J.; Zou, Z.R.; Zhang, Y.; Sun, Y.C. Preliminary study on the performance of a new type of gravel heat storage wall solar greenhouse. North. Hortic. 2016, 46–50. [Google Scholar] [CrossRef]
  14. Pi, J.; Liu, J.; Xia, L.R.; Meng, L.L. Research and design of environmental control system based on active heat storage solar greenhouse. Chin. J. Agric. Mach. Chem. 2019, 40, 132–136. [Google Scholar]
  15. Zhang, B.; Fan, X.; Liu, M.; Hao, W. Experimental study of the burning-cave hot water soil heating system in solar greenhouse. Renew. Energy 2016, 87, 1113–1120. [Google Scholar] [CrossRef]
  16. Guan, Y.; Chen, C.; Li, Z.; Han, Y.Q.; Ling, H.S. Improving the thermal environment of solar greenhouse by phase change thermal storage wall. Trans. Chin. Soc. Agric. Eng. 2012, 28, 194–201. [Google Scholar]
  17. Guan, Y.; Chen, C.; Ling, H.S.; Han, Y.Q.; Yan, Q.Y. Analysis of heat transfer characteristics of triple-structure phase change heat storage wall in solar greenhouse. Trans. Chin. Soc. Agric. Eng. 2013, 29, 166–173. [Google Scholar]
  18. Zhang, C.; Sun, J.; Yin, S.; Zhu, G.; Xi, Y. Temperature contrast test of various types of solar greenhouses in Beijing suburbs. Agric. Eng. 2021, 11, 21–26. [Google Scholar]
  19. Guan, Y.; Wang, T.M.; Wei, M.T.; Liu, T.M.; Hu, W.L.; Duan, S.J. Thermal performance test of flat-plate microheat tube array heat storage wall in solar greenhouse. Trans. Chin. Soc. Agric. Eng. 2021, 37, 205–212. [Google Scholar]
  20. Zhang, Y.; Gao, W.B.; Zou, Z.R. CFD simulation and performance test of heat transfer on the back wall of solar greenhouse with active heat storage. Trans. Chin. Soc. Agric. Eng. 2015, 31, 203–211. [Google Scholar]
  21. Wu, Z.X.; Wang, Q.; Zhang, Y.; Zou, Z.R.; Yan, L.L. Performance test of energy-saving active heat storage rear wall of solar greenhouse in Qinghai area. China Agric. Meteorol. 2020, 41, 86–93. [Google Scholar]
  22. Bao, E.C.; Shen, T.T.; Zhang, Y.; Cao, K.; Cao, Y.F.; Chen, D.Y.; He, B.; Zou, Z.R. Thermal performance analysis of solar greenhouse with fabricated active heat storage wall. Trans. Chin. Soc. Agric. Eng. 2018, 34, 178–186. [Google Scholar]
  23. Zou, Z.R.; Liu, X.F.; Li, Y.J. A Modular Splicing Solar Greenhouse Back Wall. CN207597641U, 10 July 2018. [Google Scholar]
  24. Zhang, Y.; Zou, Z.R. A Solar Greenhouse with Heat Storage Back Wall. CN102630526A, 15 August 2012. [Google Scholar]
  25. Zhang, Y.; Zou, Z.R. A Back Wall Solar Greenhouse with Active Daylighting and Self Heat Storage of Solidified Soil. CN103416261A, 4 December 2013. [Google Scholar]
  26. Zhang, Y. A Rammed Earth Wall Forming Method and Device Based on Phase Change Solidified Soil. CN106639005A, 10 May 2017. [Google Scholar]
  27. Zhang, Y. A Rammed Earth Wall Forming Device Based on Beam String. CN206888272U, 16 January 2018. [Google Scholar]
  28. Sun, Y.C. Research on Structure Optimization and Heat Transfer Characteristics of Three-Dimensional Circulation Active Heat Storage System in Solar Greenhouse. Ph.D. Thesis, Northwest A&F University, Xianyang, China, 2020. [Google Scholar]
  29. Zhao, R.Y.; Fan, C.Y.; Xue, D.H.; Qian, Y.M. Air Conditioning (Fourth Edition); China Construction Industry Press: Beijing, China, 2009. [Google Scholar]
  30. Ma, C.W.; Miao, X.W. Agricultural Bio-Environmental Engineering; China Agricultural Press: Beijing, China, 2005. [Google Scholar]
  31. Guo, E.G.; Wang, C.; Qi, G.F.; Cai, Y. Effects of typical weather in northern regions on atmospheric particulate matter in urban forests. China Environ. Sci. 2013, 33, 1185–1198. [Google Scholar]
  32. Li, Y.M.; Li, Y.X.; Yue, X.; Liu, X.A.; Li, T.L. Experiment on heat storage and release performance of water-based energy-saving solar greenhouse. J. Shenyang Agric. Univ. 2021, 52, 306–313. [Google Scholar]
  33. Li, S.J. Facility Horticulture; China Agricultural University Press: Beijing, China, 2002. [Google Scholar]
  34. Bao, E.C. Research on the Heat Transfer Characteristics of the Active Heat Storage Cycle System of the Fabricated Solar Greenhouse. Ph.D. Thesis, Northwest A&F University, Xianyang, China, 2018. [Google Scholar]
  35. Zhou, B.; Zhang, Y.; Fang, H.; Yang, Q.C.; Ao, H.D. Design and performance test of light and simple prefabricated solar greenhouse with heating and dehumidification system. Chin. J. Agric. Eng. 2016, 32, 226–232. [Google Scholar]
  36. Zhang, Y.; Xu, Y.J.; Chen, Y.; Zhang, K.X.; Ni, X.Y. Test of heat storage and release performance of new phase change material and its application in greenhouse. Trans. Chin. Soc. Agric. Eng. 2021, 37, 218–226. [Google Scholar]
  37. Wu, G.F.; Huang, H.Y.; Sun, E.H.; Xu, Y.D.; Chen, F.H.; Chang, Z.Z. Insulation performance of solar greenhouse with different wall materials. J. Jiangsu Agric. Sci. 2015, 31, 441–448. [Google Scholar]
  38. Meng, L.L.; Bao, E.C.; Xia, L.R.; Zou, Z.R.; Qi, C.L. Performance test analysis of different new solar greenhouse structures in northern Jiangsu Province. Jiangsu Agric. Sci. 2020, 48, 238–244. [Google Scholar]
Figure 1. Test location map.
Applsci 13 00846 g001
Figure 2. Solar greenhouse structure site map. (a) Soil module solar greenhouse (SG). (b) Pebble module solar greenhouse (PG).
Applsci 13 00846 g002
Figure 3. Active heat storage cycle system composition diagram.
Applsci 13 00846 g003
Figure 4. Layout of measuring points.
Applsci 13 00846 g004
Figure 5. The inside and outside temperature of an active heat storage type solar greenhouse (31 January 2021 9:00–28 February 2021 9:00).
Applsci 13 00846 g005
Figure 6. Temperature and humidity changes on a typical sunny day (19 February 2021 9:00–22 February 2021 9:00). (a) SG; (b) PG.
Applsci 13 00846 g006
Figure 7. Temperature and humidity changes on typical cloudy days (24 February 2021 9:00–27 February 2021 9:00). (a) SG; (b) PG.
Applsci 13 00846 g007
Figure 8. Change of the heat flux density of the greenhouse back wall. (a) Typical sunny day. (b) Typical cloudy day.
Applsci 13 00846 g008
Table 1. Heat transfer characteristics of active heat storage in greenhouse and passive heat storage of the back wall.
Performance ParameterSunny Heat Storage
Stage
Sunny Day Exothermic
Phase
Cloudy Exothermic
Phase
SGPGSGPGSGPG
Active heat transfer/MJ56.3847.25−15.10−14.37−29.81−27.87
Passive heat transfer/MJ408.49216.91−95.34−47.23−25.01−19.92
General biography Heat/MJ464.87264.16−110.44−61.60−54.82−46.89
Proportion of active heat transfer0.120.140.230.230.540.59
Table 2. Statistics of weather conditions during the test collection period in Xianyang, China.
DateWeatherTemperature/°C
30 January 2021Cloudy−4~12
31 January 2021Cloudy−3~10
1 February 2021Sunny day−4~13
2 February 2021Sunny day−5~8
3 February 2021Cloudy−2~14
4 February 2021Cloudy day/Cloudy−2~7
5 February 2021Sunny day/Cloudy−3~16
6 February 2021Sunny day/Cloudy−2~17
7 February 2021Cloudy/Sunny day−1~12
8 February 2021Sunny day−2~12
9 February 2021Cloudy/Sunny day−2~13
10 February 2021Sunny day/Cloudy−1~15
11 February 2021Cloudy/Sunny day−1~14
12 February 2021Sunny day/Cloudy−1~17
13 February 2021Rainy day/Sunny day−3~11
14 February 2021Sunny day/Cloudy0~16
15 February 2021Cloudy day/Cloudy−2~11
16 February 2021Sunny day−3~16
17 February 2021Cloudy day−2~14
18 February 2021Cloudy1~16
19 February 2021Sunny day1~20
20 February 2021Sunny day2~21
21 February 2021Sunny day/Cloudy3~23
22 February 2021Sunny day/Cloudy5~19
23 February 2021Sunny day/Cloudy5~19
24 February 2021Rain and snow/Cloudy day0~7
25 February 2021Cloudy day0~6
26 February 2021Cloudy day0~9
27 February 2021Cloudy day1~11
28 February 2021Rainy day1~5
Table 3. Analysis of indoor monthly temperature in two greenhouses (31 January 2021 9:00–28 February 2021 9:00).
ParametersSGPG
Average minimum air temperature/°C12.1212.52
Average maximum air temperature/°C32.3832.32
Average daily air temperature/°C18.4718.47
Average daytime temperature (09:00–17:00)/°C24.4025.26
Average night air temperature (17:00–next 09:00)/°C15.5115.07
Number of days with minimum temperature ≤ 8 °C/d2118
Number of days with minimum temperature ≤ 5 °C/d00
Number of days with maximum temperature ≥ 25 °C/d2122
Number of days with average daytime temperature
(09:00–17:00) ≥ 18 °C/d
2222
Table 4. SPSS significance test of the average air temperature and humidity of the air inlet and outlet on a typical sunny day.
Module TypeInlet AirOutlet Air
Temperature/°CRelative Humidity/%Temperature/°CRelative Humidity/%
SG33.18 ± 0.8038.17 ± 10.4424.94 ± 0.2047.63 ± 1.24
PG37.14 ± 1.57 *26.61 ± 6.3629.07 ± 0.81 **43.22 ± 8.95
Note: Different * in the same column mean a significant difference between treatments (p < 0.05, where 0.001 < p < 0.01 is **, 0.01< p < 0.05 is *).
Table 5. SPSS significance test of the average air temperature and humidity of the air inlet and outlet on a typical cloudy day.
Module TypeInlet Air Outlet Air
Temperature/°CRelative Humidity/%Temperature/°CRelative Humidity/%
SG15.42 ± 0.07 ***100.00 ± 0.00 ***18.93 ± 0.12 ***74.97 ± 0.27 ***
PG13.65 ± 0.3687.51 ± 0.6917.96 ± 0.1768.90 ± 0.66
Note: Different * in the same column mean a significant difference between treatments (p < 0.05, where p < 0.001 is ***).
Disclaimer/Publisher’s Note: The statements, opinions and data contained in all publications are solely those of the individual author(s) and contributor(s) and not of MDPI and/or the editor(s). MDPI and/or the editor(s) disclaim responsibility for any injury to people or property resulting from any ideas, methods, instructions or products referred to in the content.

