Article

Field Characterization of Dynamic Response of Geocell-Reinforced Aeolian Sand Subgrade under Live Traffic

1
College of Water Conservancy & Architectural Engineering, Shihezi University, Shihezi 832003, China
2
Science and Technology R&D Center, Xinjiang Transport Planning Survey and Design Institute Co., Ltd., Urumqi 830006, China
3
Xinjiang Academy of Architectural Science (Limited Liability Company), Urumqi 830046, China
*
Authors to whom correspondence should be addressed.
These authors contributed equally to this work.
Appl. Sci. 2023, 13(2), 864; https://doi.org/10.3390/app13020864
Submission received: 5 December 2022 / Revised: 22 December 2022 / Accepted: 27 December 2022 / Published: 8 January 2023
(This article belongs to the Section Civil Engineering)

Abstract

:
In desert regions, aeolian sand is abundant, but it is not suitable to be used directly as the upper roadbed filler for highways. Generally, gravelly soil is mined around the desert as upper roadbed fill, resulting in high engineering expenses for road construction in the desert hinterland. Geocells have a significant reinforcing effect on aeolian sand. However, in the completed desert highway, the dynamic performance of geocell-reinforced aeolian sand as an upper layer of roadbed fill has not been studied. Using a field test method, the dynamic performance of geocell-reinforced aeolian sand as an upper roadbed fill is examined. The results show that the majority of the frequency distribution of road vibration is within 30 Hz. In the horizontal direction, the actual vibration amplitude decay on the side of geocell-reinforced aeolian sand is slower but smoother than on the side of gravelly soils. In vibration velocity, the work area depth of the geocell-reinforced aeolian sand side of the roadbed is less than that of the gravelly soil side. The maximum difference can reach 0.55 m. As far as vibration velocity is concerned, the 30 cm gravelly soils can be substituted with 15 cm geocell-reinforced aeolian sands as the upper roadbed. In summary, the dynamic attenuation characteristics of geocell-reinforced aeolian sand are superior to gravelly soils. The research results provide a reference for the design of the desert highway subgrade.

1. Introduction

Deserts account for 20% of the Earth’s total land area [1,2,3]. Desert highways can greatly reduce detours, save energy, and reduce carbon emissions. In desert regions, there is an inexhaustible supply of aeolian sand that is too fine and non-cohesive to be employed as highway filler in the upper roadbed of highways [4]. The traditional upper roadbed is filled with gravelly soil. However, the gravelly soil is tiny and unevenly distributed in desert areas. The long transportation distance leads to high engineering costs. Therefore, using aeolian sand to pave the upper roadbed is one of the most important research topics for reducing the cost of desert highways [5].
DHT soil coagulant and cement were utilized to cure wind and sand [6]. When the amount of aeolian sand incorporated is about 68%, the mix’s compressive strength meets the specifications required for highway strength. Enzyme-induced carbonate precipitation and polyvinyl alcohol enhanced the cementation of aeolian sand particles. The unconfined compressive strength, wind erosion resistance, water erosion resistance, and surface strength of aeolian sand were improved [7]. However, the cementing solution releases ammonia to pollute the environment. Reinforcing the aeolian sand with glass fiber and cement strengthened the bond between the sand particles [8]. However, the particles were prone to slip between them. Previous studies have explored different materials for curing aeolian sand, thus meeting the design requirements for highway roadbeds. However, the proposed method of aeolian sand has little admixture, pollutes the environment, and is immature, and there are few efficient methods to lower the cost of desert highway construction projects.
Geosynthetic materials are widely used in geotechnical engineering [9]. The enclosed geocell has a lateral restraint effect on the soil it reinforces, stress homogenization as the membrane effect, as well as a friction effect due to the pressure between the cell material and the soil. There is a substantial difference between the elastic modulus of the geocell and that of the material contained within it. Under traffic load, the contact surface of the geocell and the filler have the propensity to slip comparatively, thus generating friction. The friction depends on the energy transmitted down from above, as demonstrated through model tests [10]. Geocell compartments can improve soft soils, according to a survey study [11]. Figure 1 shows the reinforcement mechanism of geocell.
Using numerical simulations and laboratory measurements, the pressure-spreading impact of geocells was established [12]. Through model studies, geocells raised the ultimate bearing capacity of aeolian sand layers by a factor of four. Moreover, the experimental studies through three-dimensional modeling demonstrate that geocells spread the load over a larger region beneath the structural layer [13,14]. A significant triaxial test indicated that geocell reinforcement of dense sandy soil is significantly more successful than that of loose sandy soil [15]. Geocells could stabilize circulation resistance to resistance to sudden destruction in excess of static capacity [16]. Geocells can lower displacement amplitude by 61% when used to reinforce aeolian sand [17]. Through static triaxial testing, dynamic triaxial tests, model tests, and numerical simulations, previous research has analyzed the performance of geocell-reinforced wind-deposited sand. Data such as stress–strain, hysteresis, damage characteristics, and pressure settlement response were analyzed and predicted. The study has significant scientific relevance; however, it does not account for actual traffic volumes. Essential metrics for evaluating the reinforcing effect are the dynamic characteristics of the roadbed under actual dynamic wheel load [18,19].
The purpose of this paper is to study the vibration characteristics of geocell-reinforced aeolian sand roadbeds under the actual moving wheel load. Meanwhile, it can demonstrate the feasibility of geocell-reinforced aeolian sand as the upper part of the infill subgrade. Two test sections of gravelly soil and geocell-reinforced sand were constructed in the field. Vibration velocity sensors were placed at different locations. A comparison was made between the dynamic response of geocell-reinforced aeolian sand, gravelly soil, and aeolian sand. The efficiency of geocells in reinforcing aeolian sand is evaluated in terms of energy attenuation and working area depth. The research findings suggest that geocell-reinforced aeolian sand replaces gravelly soil as the upper roadbed in terms of reducing vibration. In addition, the decrease in desert road expenditures is accomplished.

2. Experimental Design

2.1. Experimental Overview

The Gurbantunggut Desert is China’s most extensive fixed and semi-fixed desert [20]. The test section was selected from K233 + 600 to K233 + 750 of the S21 line in the Gurbantunggut Desert hinterland. In this study, two schemes were developed to compare the dynamic characteristics of geocell-reinforced aeolian sand and gravelly soil as the upper roadbed. Scheme 1 uses gravelly soil to fill the upper roadbed. Scheme 2, the geocell-reinforced gravelly soil, was used to fill the upper roadbed. The design scheme is depicted in Figure 2. The thickness of the asphalt layer is 12 cm. The cement-stabilized gravel base is 36 cm. In addition, the thickness of the natural gravel subgrade is 18 cm for both schemes 1 and 2. Scheme 1 is characterized by the use of woven fabric and gravelly soil to fill the upper roadbed, and scheme 2 uses woven fabric + geocell—aeolian sand to fill the upper roadbed. The characteristics of the fill are shown in Figure 3 and Table 1, respectively. In addition, the strip breaking tension and shear resistance of connection point of geocell is 180 kN/m, the yield elongation of strip of geocell is 15%, and the strip thickness of geocell is 0.55 ± 1 mm. The connection mode of the cell mesh belt is made of U-shaped steel nail insertion and weaving. The diameter of U-shaped nails is greater than or equal to 2.5 mm. The U-shaped steel nails must be galvanized and anti-corrosion. When the cell is stretched in place, each U-shaped steel nail is a rigid support point. The compactness of aeolian sand roadbed reinforced by geocells meets the compactness standard of 97%.

2.2. Monitoring Program

Vibration velocity is a crucial measure for measuring the influence of vehicle loading on the depth of the road structure. Vibration velocity is highly related to traffic speed and the parameters of the roadbed material [21]. The vibration velocity can represent the vibration times of the object in unit time, which can better show the changes in the components and magnitudes of the subgrade vibration frequency caused by the moving load. During road construction, the vibration velocity meter is installed at specified sites to measure the vibration velocity of various roadbed constructions. The dynamic module collector is selected to acquire the value of the subgrade vibration velocity instrument. The objective of the test was to have medium-sized buses traverse the test sections at six different speeds: 20, 40, 60, 80, 100, and 120 km/h, respectively. To assure the validity of the test, the mass of the test vehicle was accurately measured prior to the test. The specific instrument burial site and test working conditions are detailed in Table 2 and Table 3.
The total mass of test vehicles is 2.8 t. There is sufficient space between the test vehicle and the test section for the vehicle to accelerate in advance. Guarantee it can traverse the test section before and after the 20 m range at the same speed. The center track of the rear wheel is directly above the vertical position. For each operating state, three sets of experiments were performed, from which identical excitation data were selected. Figure 4 shows the test on site.

3. Results

Internal vibration velocities of roadbeds are impacted by a number of variables, including roadbed structure, driving speed, and road unevenness spectrum [22,23]. In this paper, the time–frequency characteristics of vibration velocities of geocell-reinforced aeolian sand on roadbeds and conventional gravelly soil on roadbeds were examined using medium-sized passenger vehicles as an example. In two test sections, the monitoring findings of six medium-sized buses traveling at varying speeds were examined. The effects of depth, horizontal distance, and material on the time range and vibration velocity spectrum were analyzed. In both instances, the pavement structure and test vehicles are the same. Therefore, it is possible to disregard the effects of levelness and inherent vibration characteristics.
The average transport distance of gravel soil is 170 km, which makes construction difficult. The geocell can be folded, so the transportation cost is low [24]. Considering the cost of materials and transportation, the cost is 30% of the gravel soil. The study by Zhang is the experimental results in the case of unpaved road surfaces, while this paper is the experimental results after paved road surfaces [25]. After paving the road surface, the test results are closer to the real conditions.

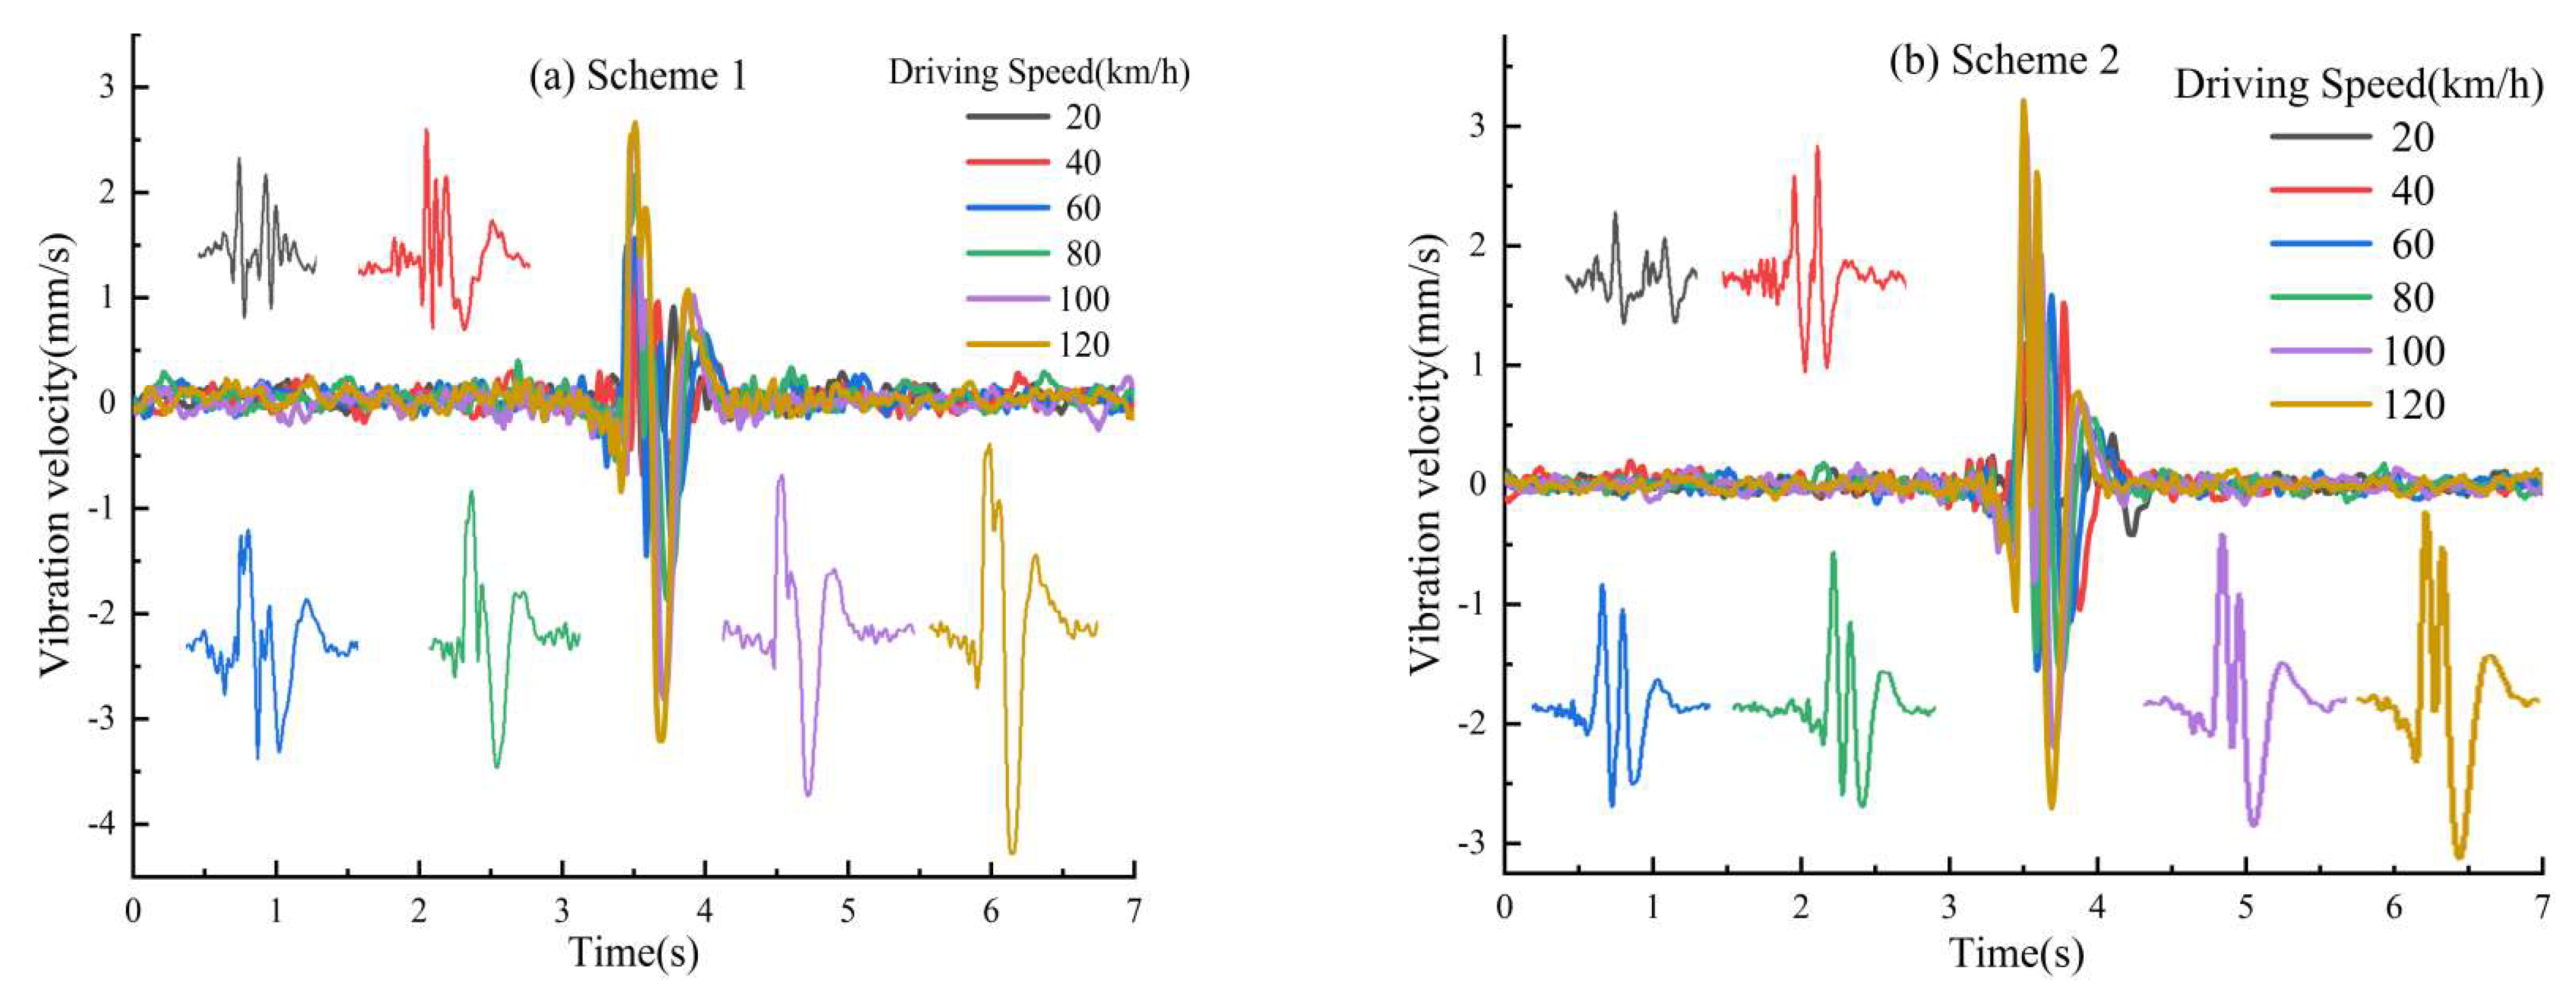
3.1. Time–Domain Results of Vibration Velocity Response

Figure 5 depicts the diagram of the variation of the vibration velocity of the road surface with time at various driving speeds of medium-sized buses. Scenario one and scenario 2 show similar shapes in the time–domain curve of vibration velocity. The vibration velocity drops a little as the axle approaches. Then it climbs to its maximum, drops to its minimum, and returns close to zero. It generates an N-shaped curve [26,27,28]. The timing of the wave peak’s appearance coincides with the arrival of the axle. When the medium-sized bus passes through the section at a speed of 20 km/h, the curve is double N-shaped. With the acceleration of driving speed, the double N-shaped gradually transformed into a single N-shaped. It is because the front and rear axles of the driving vehicle have two excitation effects on the road that cause this phenomenon. At a slower driving speed, the excitation interval is longer and can act independently on the test section, producing two N-shaped. At a faster driving speed, the two excitation moments are comparably close. Hence, a superposition effect of the two excitation effects of the traveling load on the test section. The vibration velocity is expressed as an N-shaped in the time–domain curve [29,30].
In addition, the period of the pavement vibration velocity generated by the random excitation of the travel load is less affected by the vehicle’s travel speed. For schemes 1 and 2, the response period of traveling wave load vibration velocity is around 1.5 s. Nevertheless, scheme 2 has a little longer response time than scheme 1. In the experiment, polypropylene resin material is utilized to create a geocell. A geocell has a high modulus of elasticity, which results in a high circumferential stress for aeolian sand provided by the geocells. The geocell-reinforced aeolian sand layer is a structurally interconnected layer. Allowing the upper roadbed and superstructure layer to be excited for a longer duration [31,32]. In contrast, in gravelly soils, the connection between soil particles and gravel is rather loose. When subject to loads from above, relative displacement will occur. The upper roadbed becomes less sensitive to excitation, hence scheme 2 has a longer response period than scheme 1.

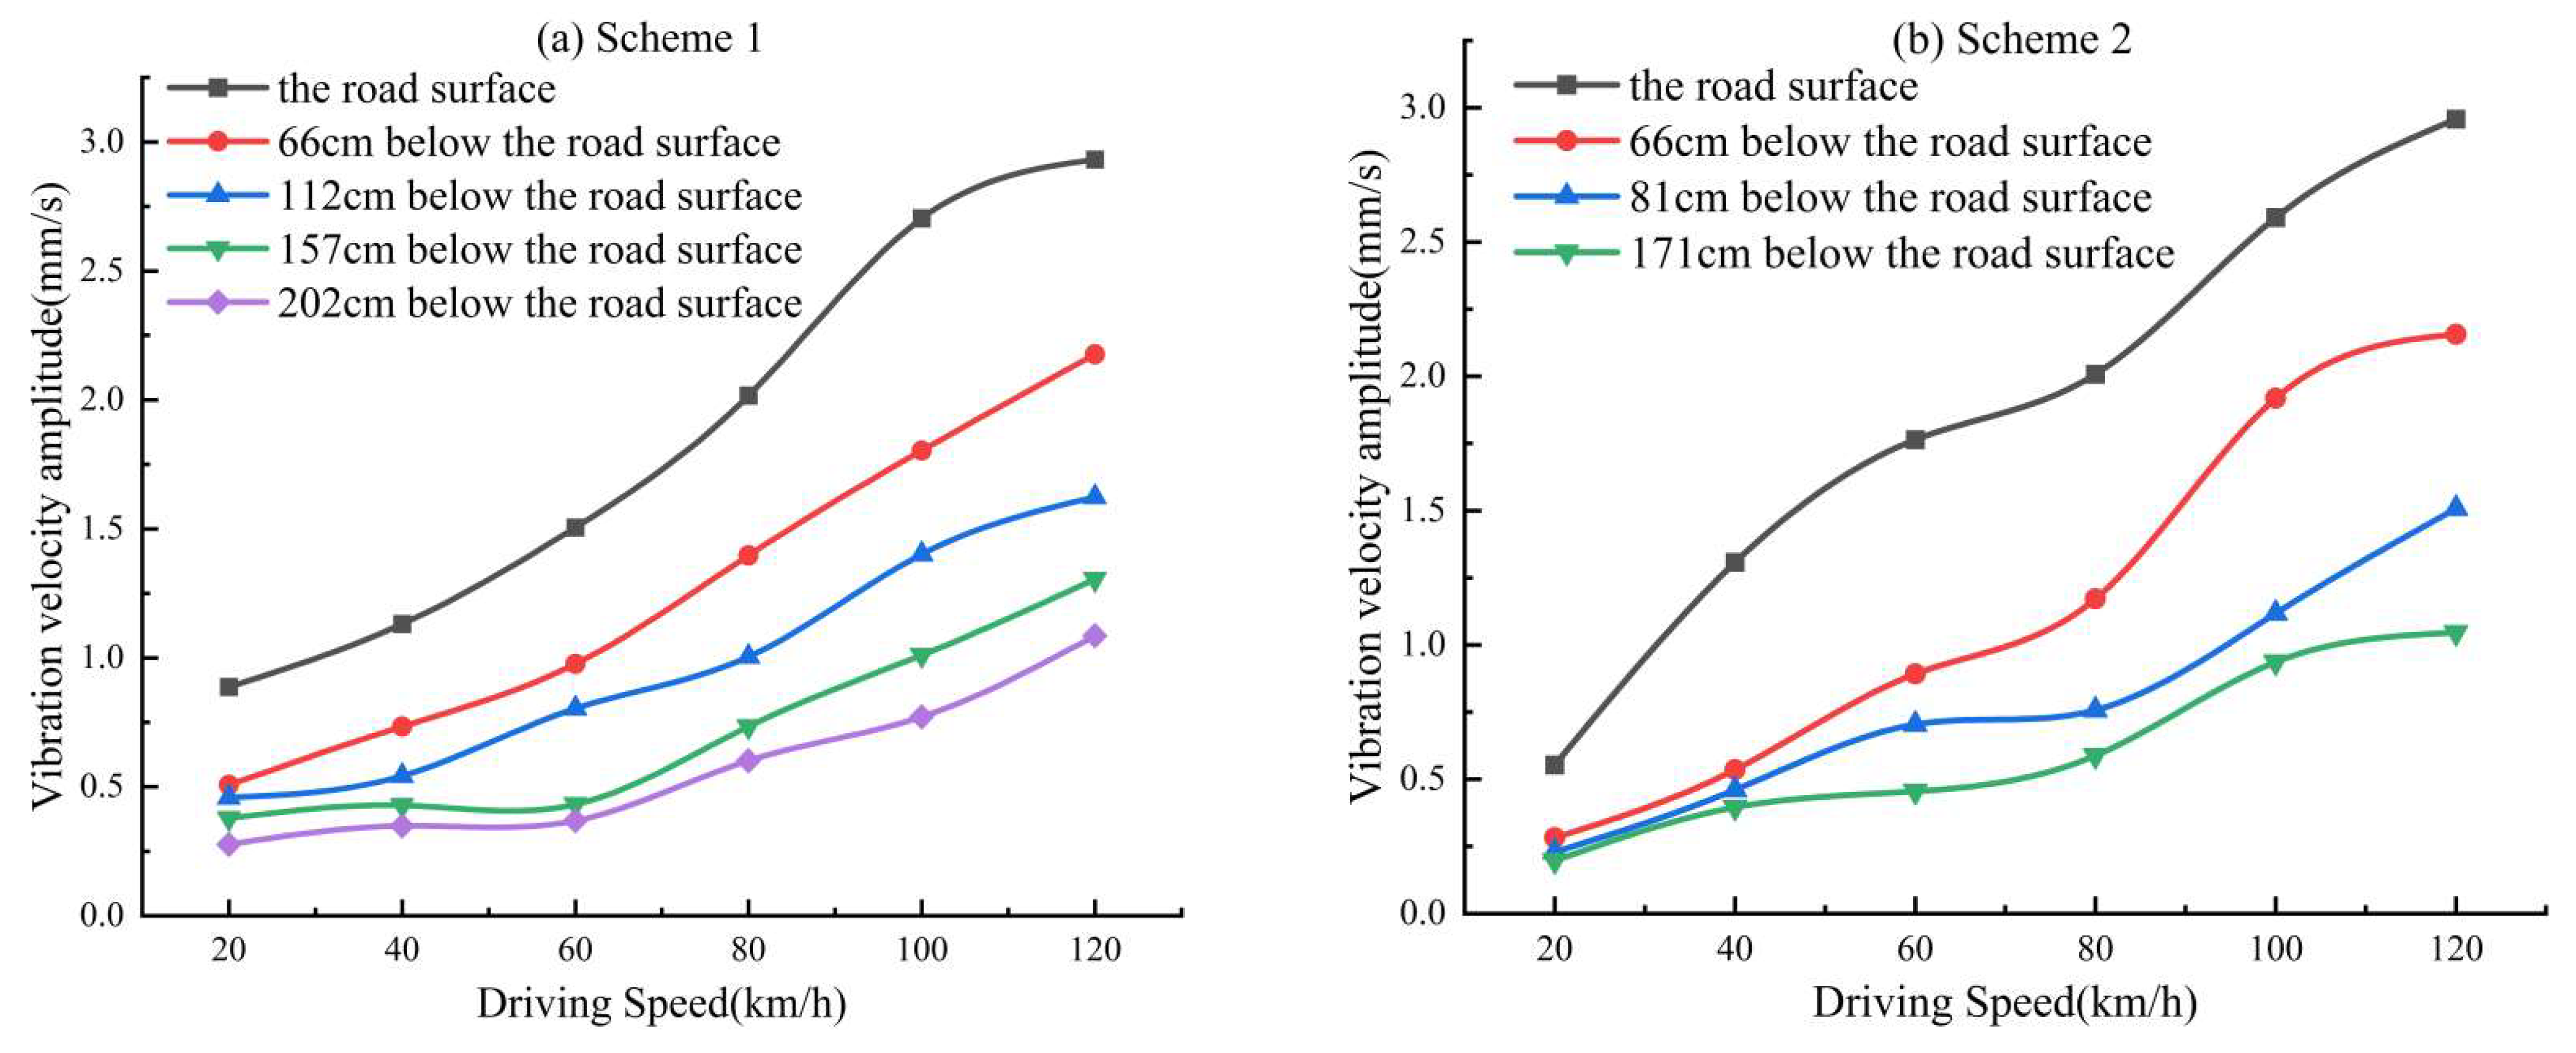
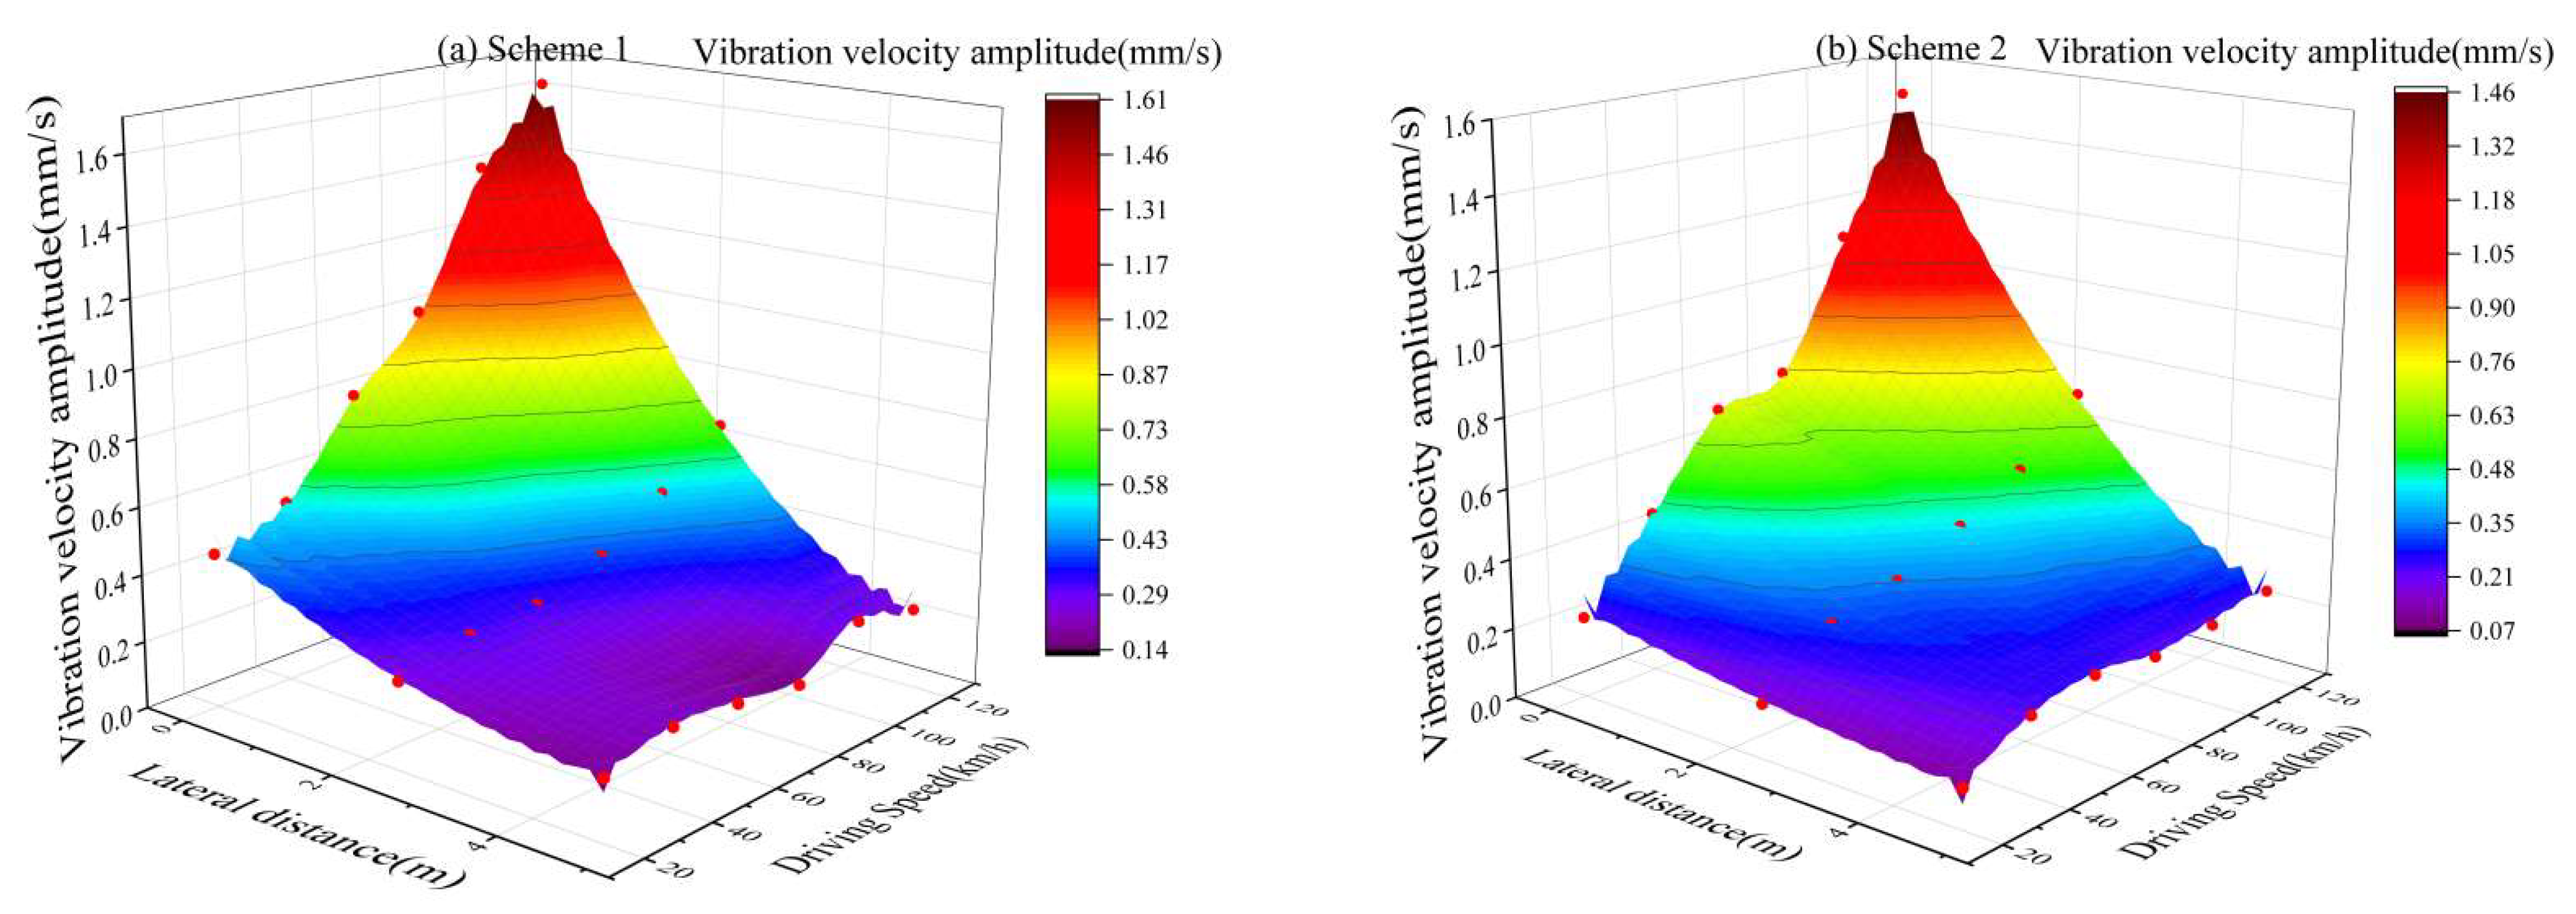
3.2. Analysis of Actual Vibration Amplitude

The actual vibration va amplitude is half the difference between the time–domain curve’s maximum and minimum vibration velocity in one cycle [33,34]. The relationship between the actual vibration amplitude at different depths and the driving speed is depicted in Figure 6. Figure 7 depicts the lateral attenuation of actual vibration amplitude at various driving speeds.
v a = v max v min 2
The driving speed and the actual vibration amplitude are about linear, as shown in Figure 6. Actual vibration amplitude tends to grow gradually as driving speed increases. Possible explanation: the geocell-reinforced aeolian sand produces a dense structural layer. The dense structural layer’s sensitivity to the moving velocity of the vibration source differs. In addition, as the depth increases, the real vibration amplitude reduces, with 120 km/h being the most noticeable. The amplitude decay is nonlinearly proportional to depth [35,36].
According to Figure 7, the actual vibration amplitude decreases continually as the lateral distance increases. When the driving speed is between 20–120 km/h, the actual vibration amplitude decays more quickly in the 0–2.9 m range for both schemes than in the 2.9–4.8 m range. In addition, the actual vibration amplitude decay in the horizontal direction is faster in scheme 1 than in scheme 2. The geocell increases the horizontal bending moment and shear force to resist deformation in the lower portion, hence promoting lateral vibration diffusion. The vibration decay rate in the lowest portion of the gravelly soil is greater than that of the geocell-reinforced aeolian sand.

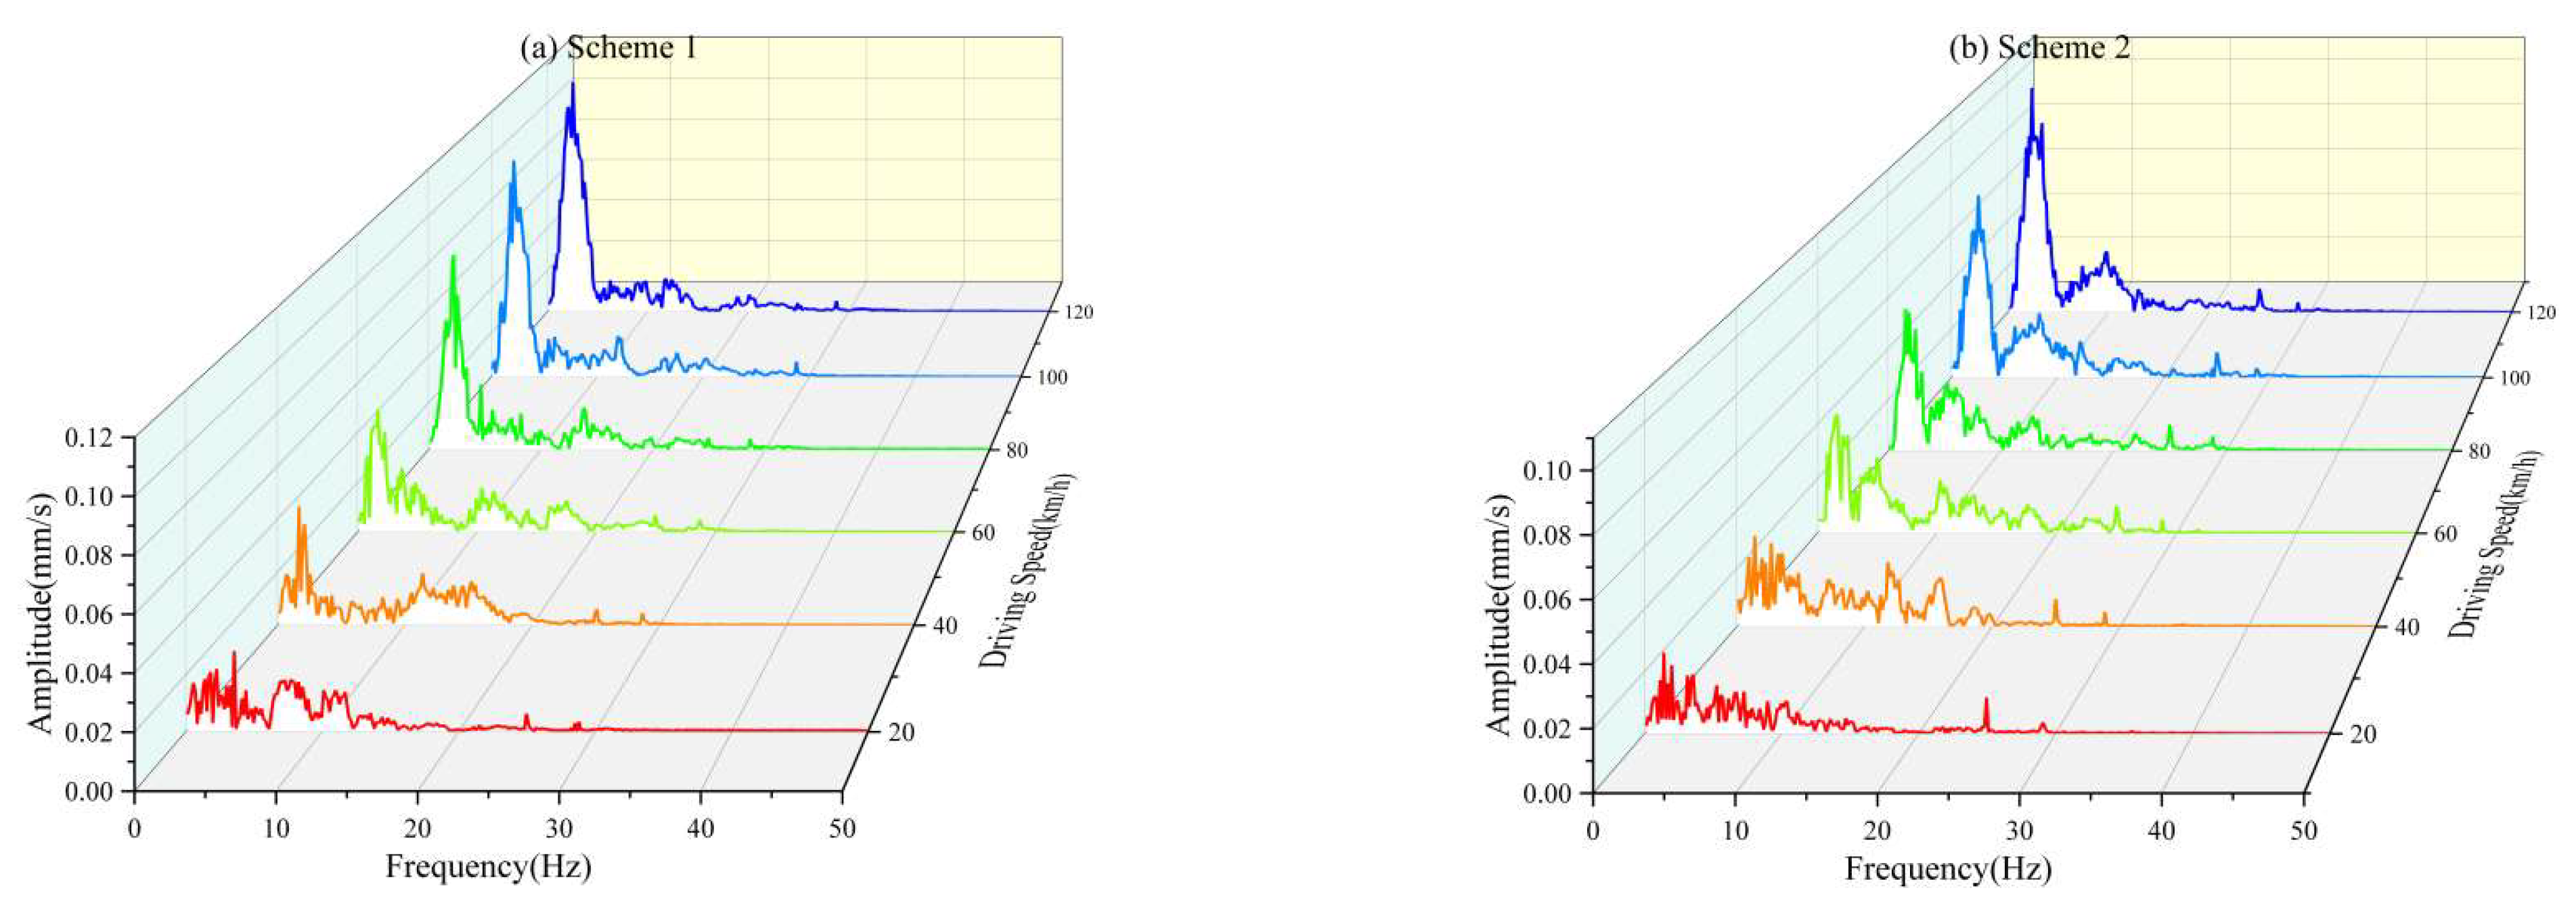
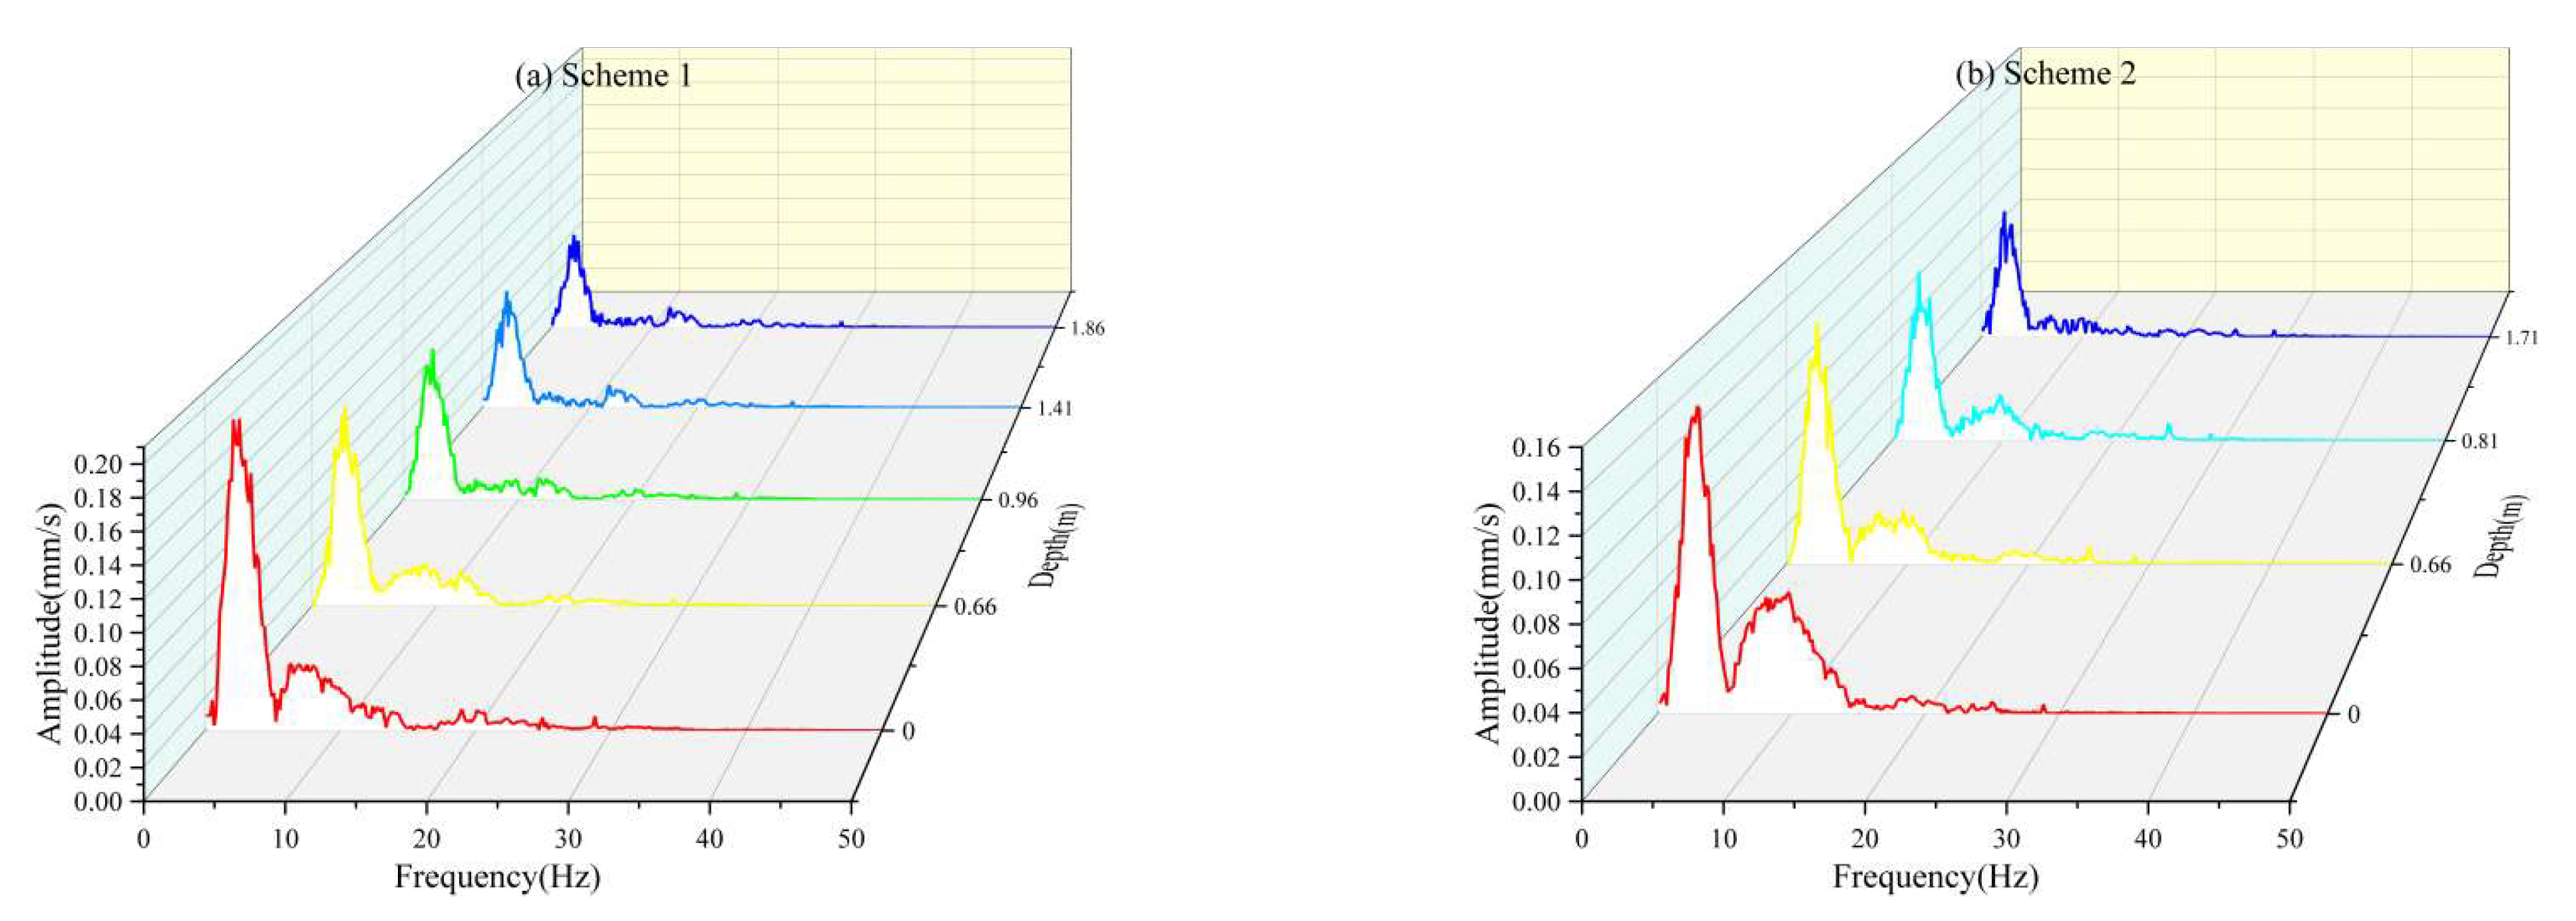
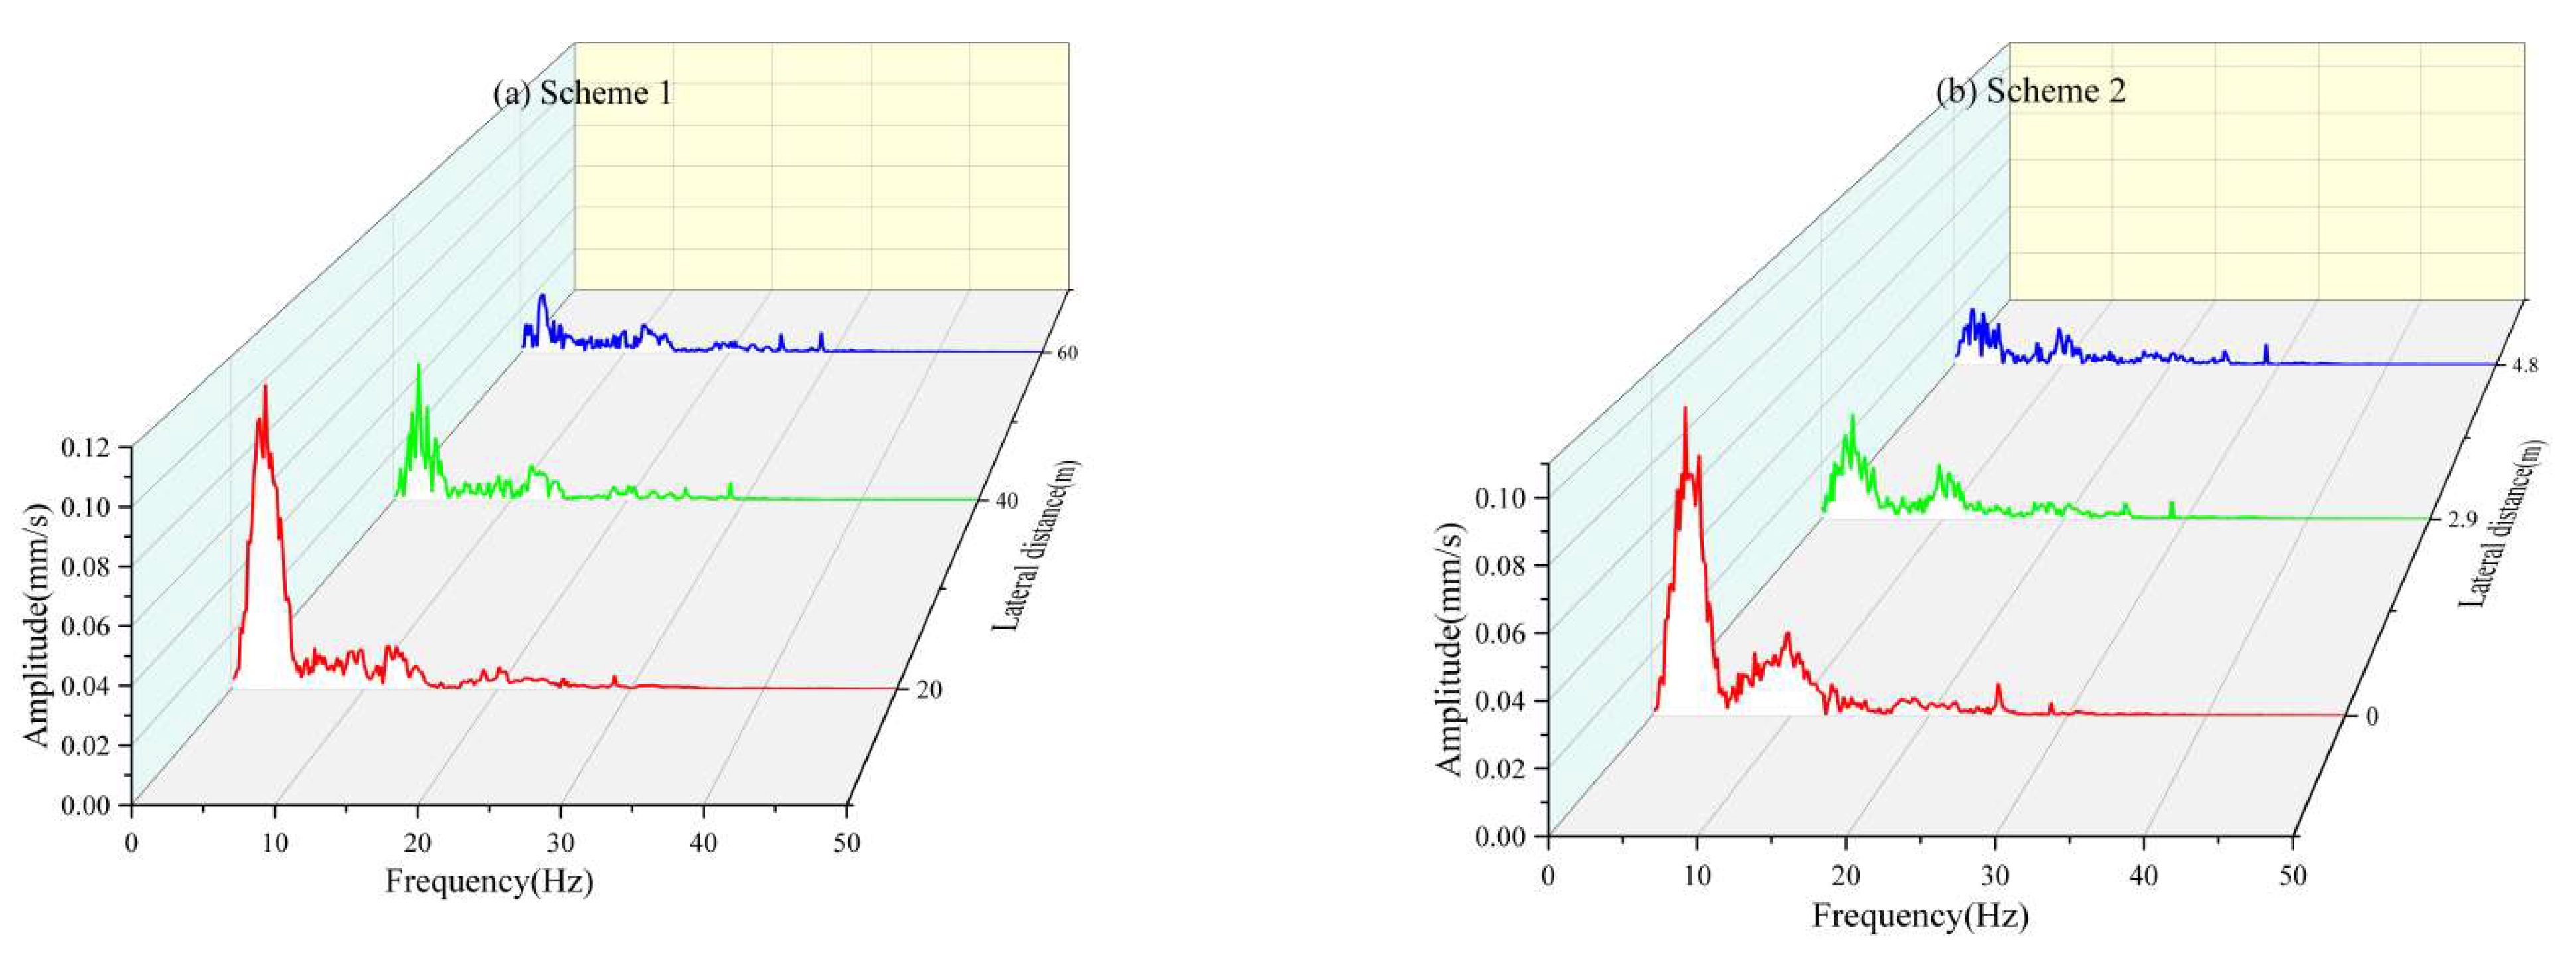
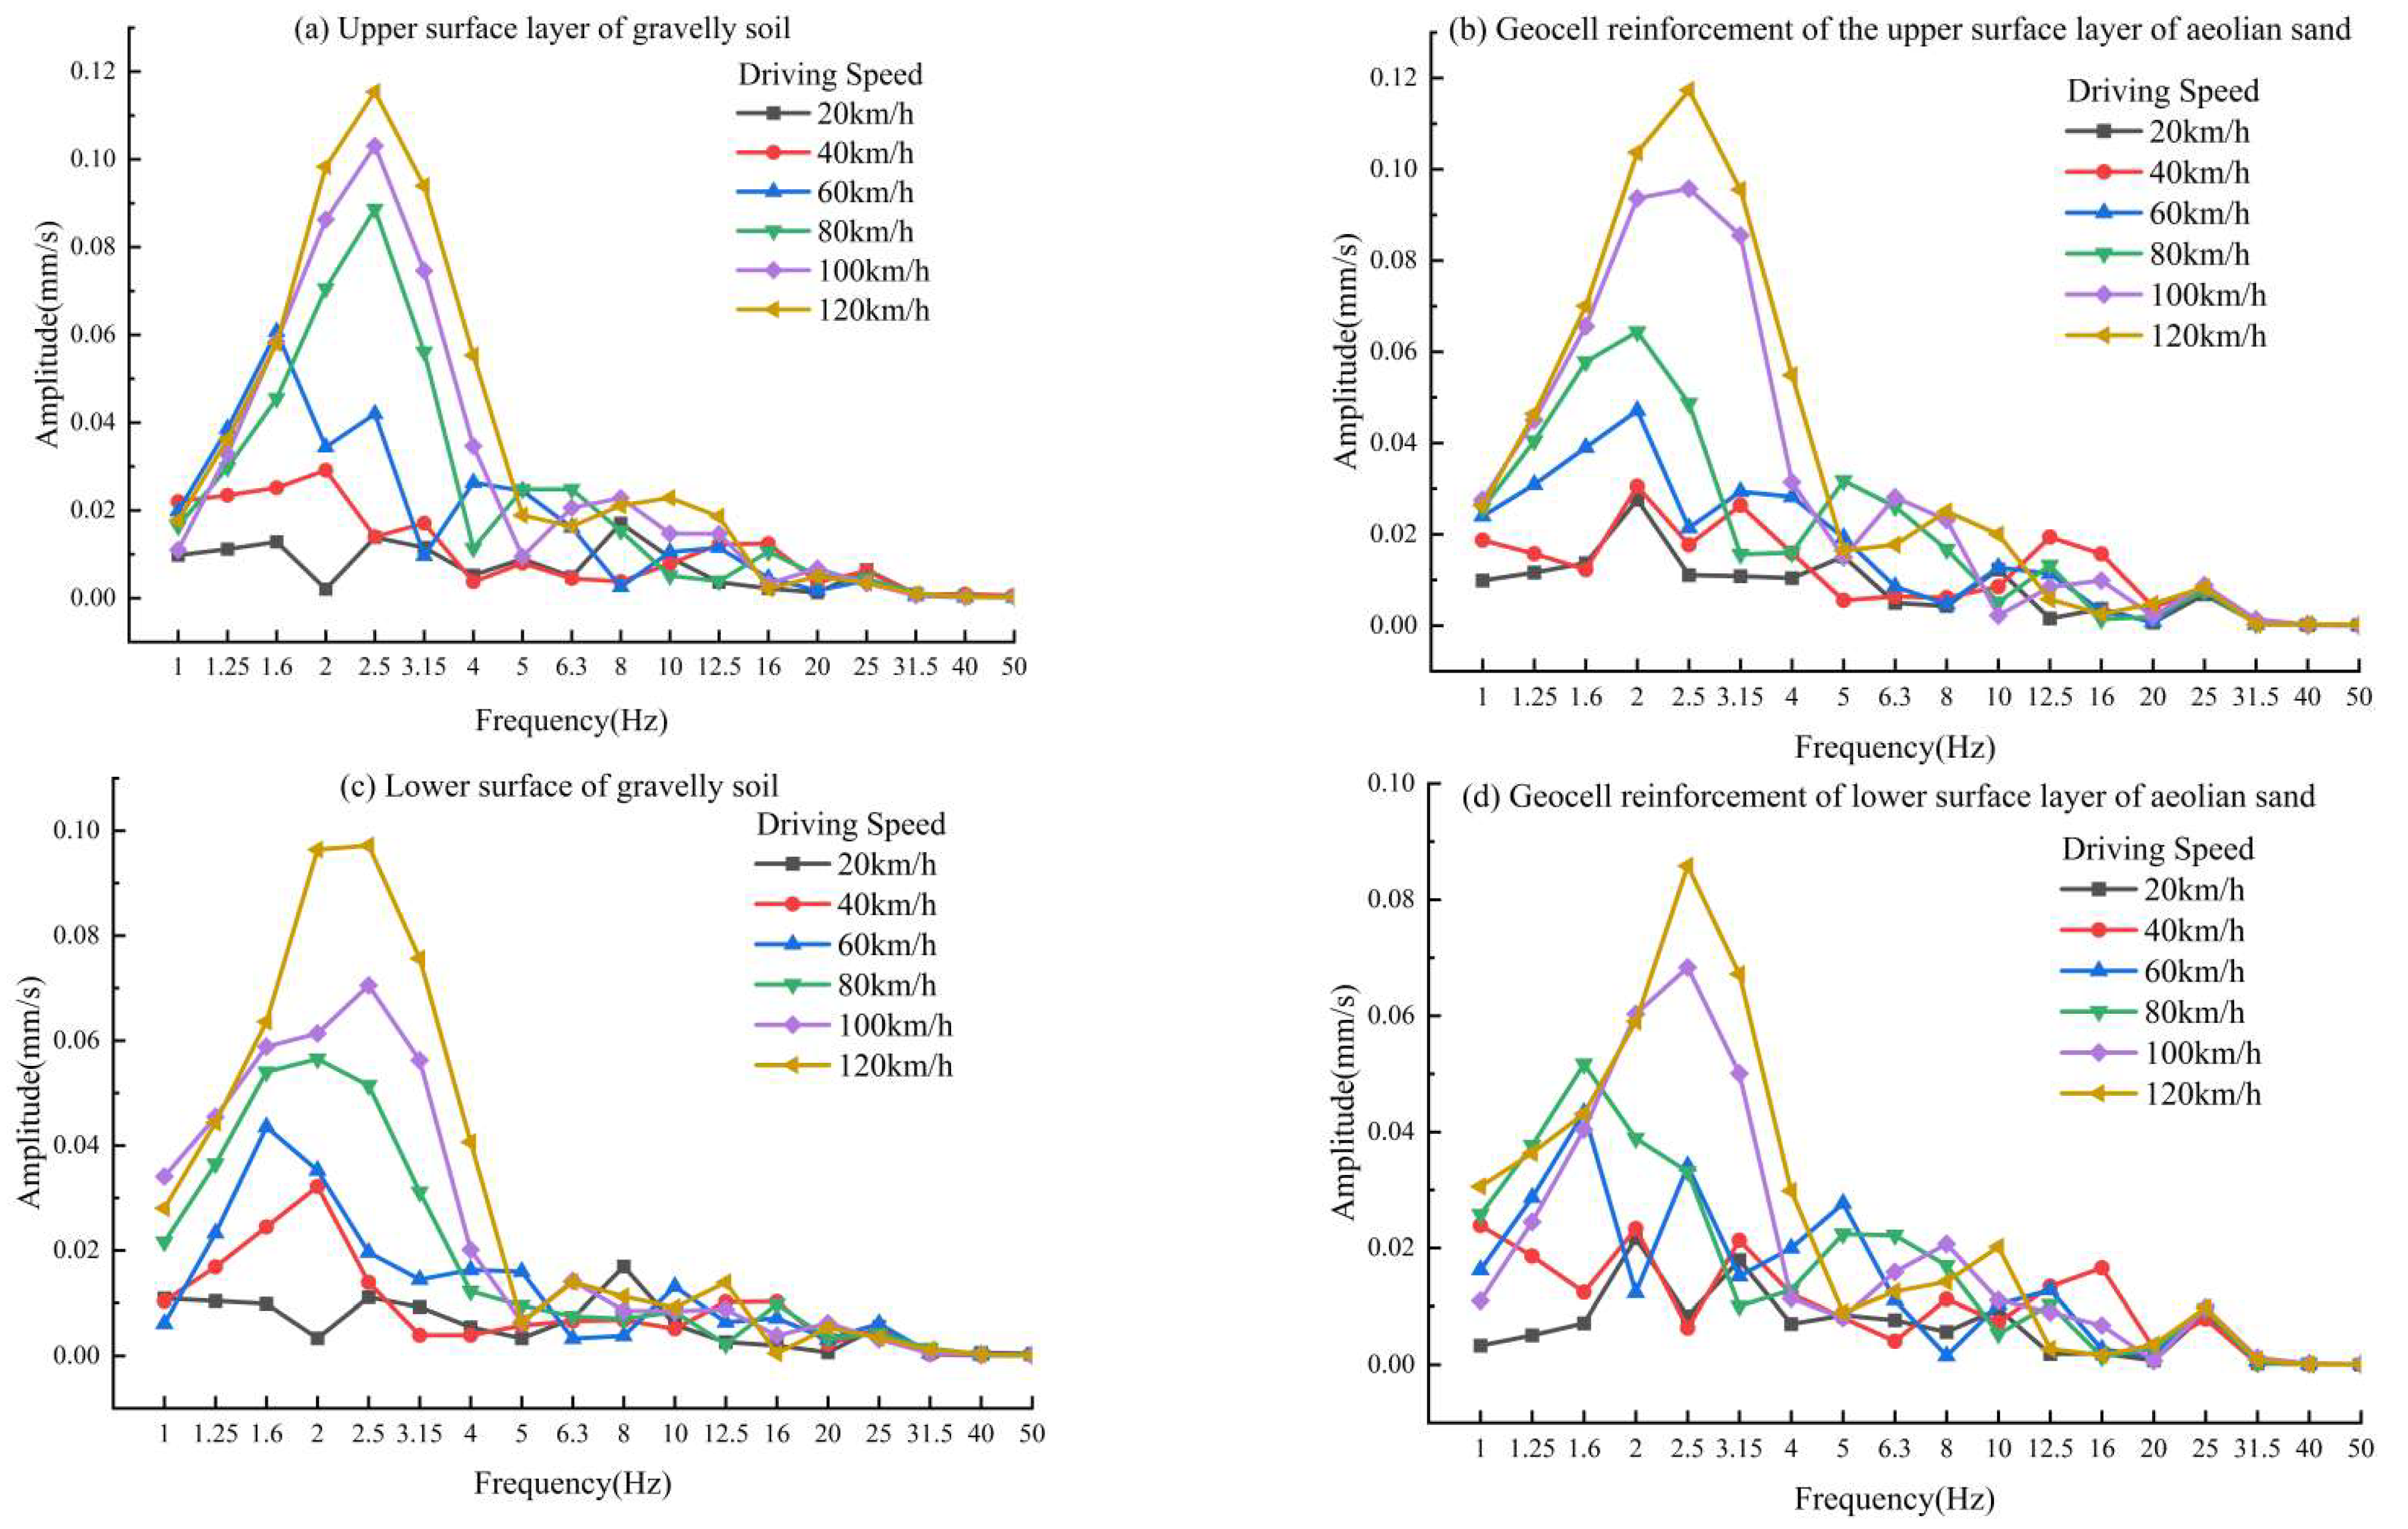
3.3. Frequency–Domain Analysis of Vibration Velocity Response

In order to study the frequency composition of traffic load excitation decay on the road, the time–domain data are converted into frequency–domain data by FFT (fast Fourier transform). Figure 8, Figure 9 and Figure 10 depict the frequency spectrum of each measurement point under varied working conditions.
Figure 8 depicts the spectrum of several measurement sites within the scheme 1 and scheme 2 test sections. The frequency range of the test vehicle causes a little amount of road vibration. The overall frequency is low, mainly within 30 Hz. As the driving speed of the test vehicle decreases, the influence frequency is gradually reduced to 0–15 Hz. The maximum peak value within the range of influence is only within 0–5 Hz. The frequency distribution of the vibrational energy is relatively concentrated, with a prominent peak value [37,38].
Figure 9 shows the spectrum of the measurement points at various depths while the test vehicle goes through the two test sections at 120 km/h. As shown in Figure 9, the longitudinal decay of vibration velocity is due to the decay of the corresponding frequency. Furthermore, the frequency composition varies a little between 0–15 Hz. The roadbed and the superstructure layer have little effect on the composition of vibration frequencies. As depth increases, the corresponding frequency amplitude drops [39].
Figure 10 depicts the spectrum of measurement points at various horizontal distances as the test vehicle goes through the two test sections at 120 km/h. Similar to the longitudinal direction results, the transverse attenuation of vibration velocity is caused by the attenuation of the corresponding frequency. The frequency range remains rather constant, between 0–15 Hz. Combined with Figure 9, it is possible to deduce that the spatial position of vibration velocity diffusion has no effect on the frequency range. As the distance from the excitation point increases, the frequency of the corresponding point decreases [40].
It can be seen that Figure 8, Figure 9 and Figure 10 show the apparent frequency band division in the excitation spectrum generated by the test vehicle. The distribution of vibration frequencies in scheme 2 is smooth, and the frequency attenuation is systematic. On one side of Option 1, the gravelly soil is relatively scattered and disordered. Different damping at different positions and directions means the vibration cannot be uniformly diffused [41,42].

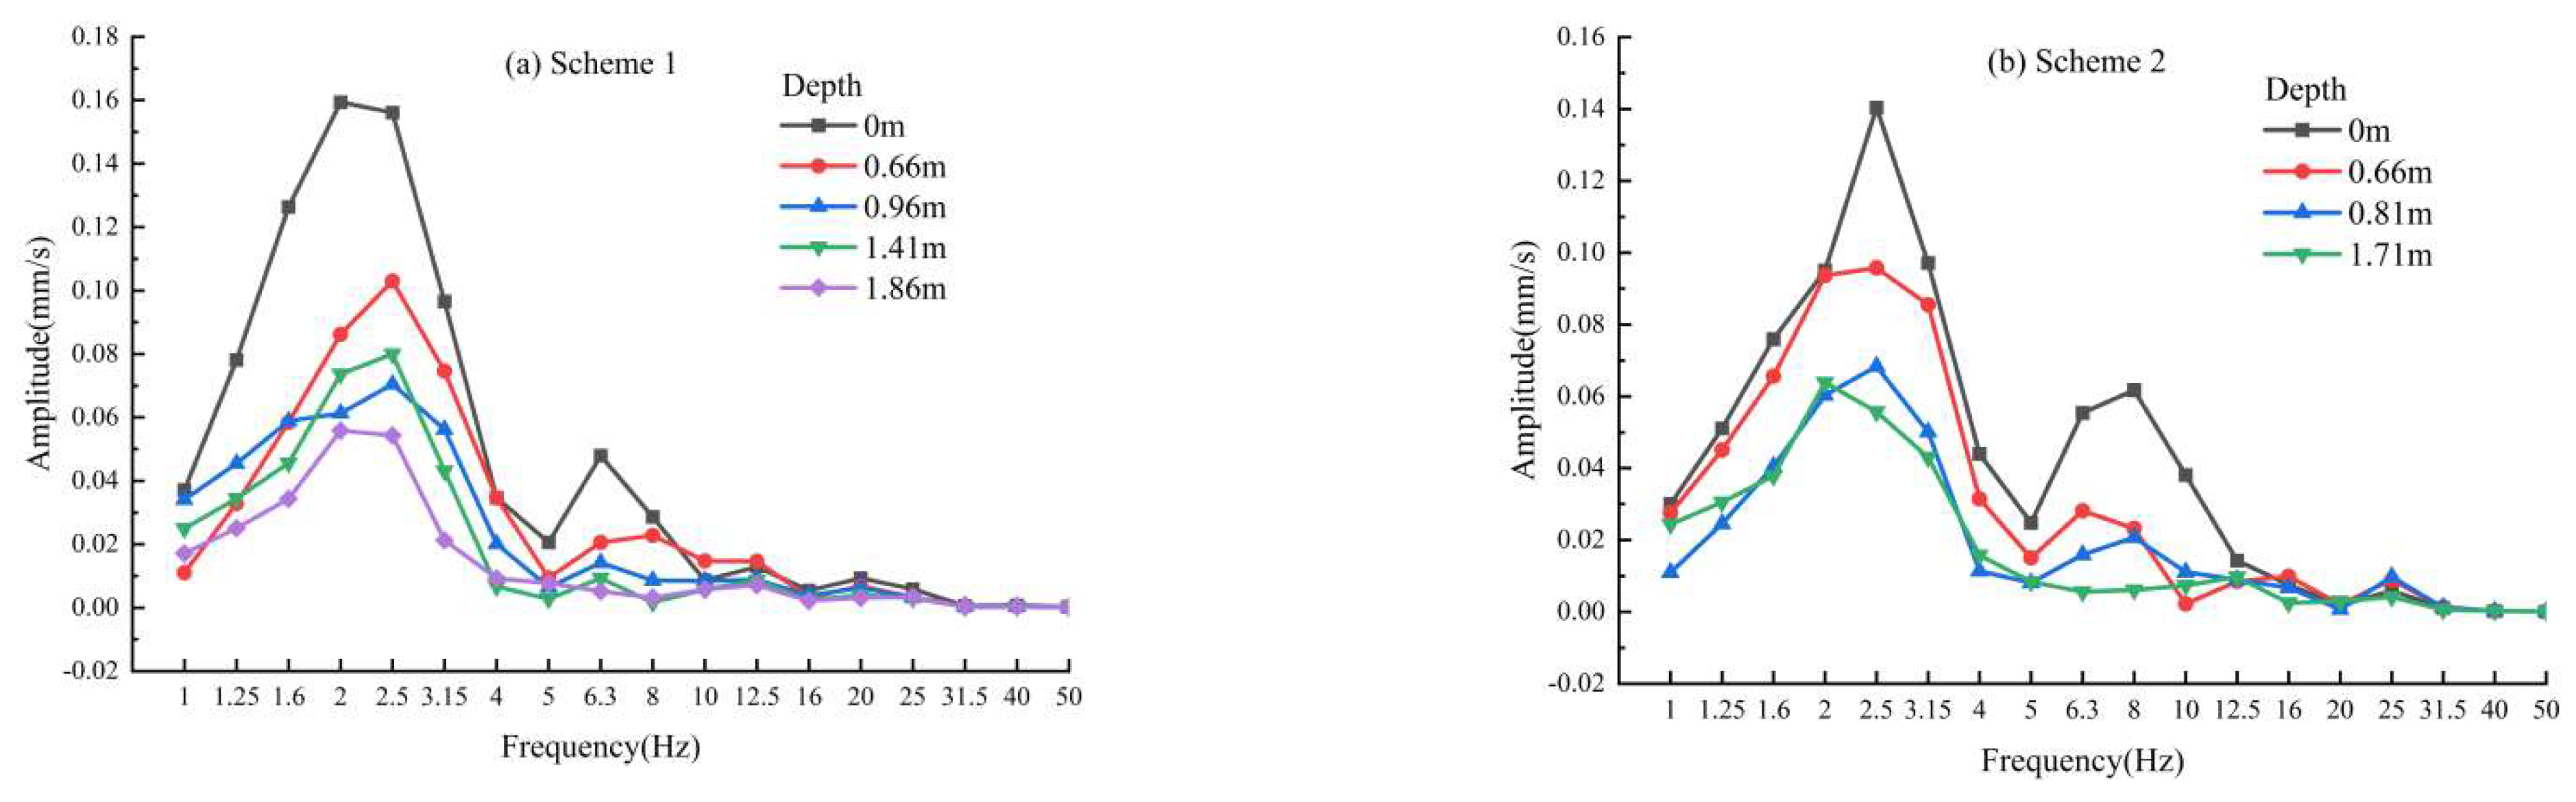
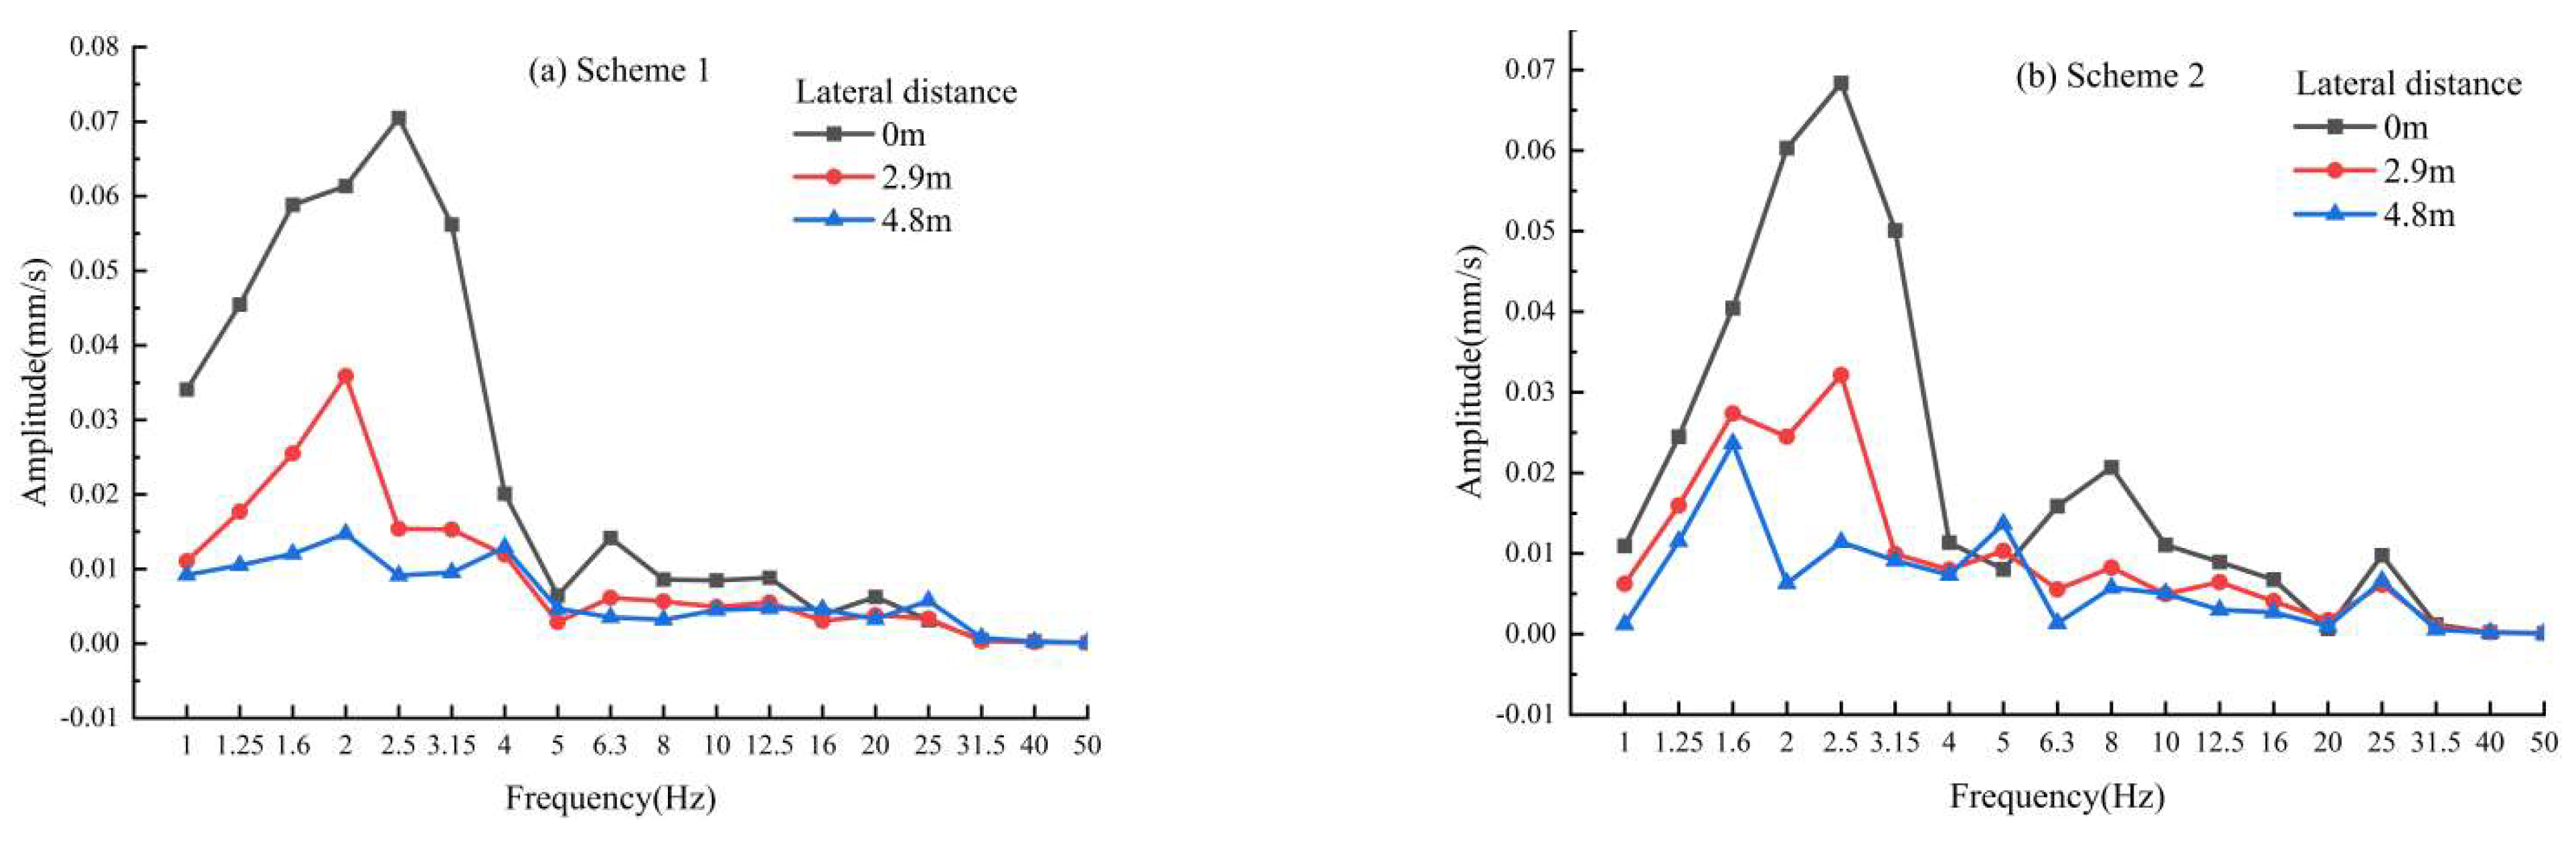
3.4. One-Third Frequency Range Analysis

One-third frequency range analysis was used to explore the decay law of distinct frequency bands of vibration velocity with varying excitation and position changes. The energy distribution in various frequency ranges was also investigated [43]. The boundary frequencies of the 1/3 frequency range are calculated by the nominal value method, and the 1/3 frequency range diagram as shown in Figure 11, Figure 12 and Figure 13 is obtained.
Figure 11 demonstrates that each vibration frequency band decays with depth for a 100 km/h traveling test vehicle. The center frequency is divided into three bands with 5 Hz and 31.5 Hz as the boundary of the fundamental vibration frequency. The first band, 1–5 Hz, is mountainous with a noticeable peak, and as the depth increases, the peak shows a trend of decay. The frequency band is the test vehicle’s principal influence band. In this band, attenuation of vibration in gravelly soil is more negligible than that of geocell-reinforced aeolian sand. At 2 Hz, the amplitude of vibration from the upper surface to the lower surface of gravelly soil increases. It results from the phase change caused by the heterogeneity of gravelly soil [44,45]. The second band, 5–31.5 Hz, has apparent fluctuations on the pavement surface. In addition, the vertical attenuation is faster than in the first segment. This frequency band’s vibration velocity accounted for a pretty considerable amount of the pavement’s attenuation. Scheme 2′s attenuation is more pronounced than scheme 1′s. The geocell-reinforced aeolian sand layer on the pavement structure of the vibration diffusion effect is greater than the gravelly soil. The third section is greater than 31.5 Hz. This vibration section hardly varies with depth, indicating that the road excitation of a medium-sized bus is within 31.5 Hz. As frequency increases, longitudinal attenuation tends to accelerate. The faster the frequency of vibration, the greater the number of vibrations of the corresponding masses and the increased energy dissipated inside the soil [46,47].
Figure 12 shows the one-third frequency curve for the 100 km/h test vehicle. The vibration of each frequency band of ground vibration decreases as horizontal distance increases. Additionally, the central frequency undergoes modifications. Under scenario 1, the primary frequency is 2.5 Hz, while the central frequencies at 2.9 m and 4.8 m are 2 Hz and 1.6 Hz, respectively, indicating that the central frequency of vibration tends to decrease with lateral diffusion. Scheme 2 attenuates the central frequency more than scheme 1 at greater horizontal distances. Under dynamic loading, the modulus of elasticity of gravelly soils falls. However, the polypropylene resin geocell maintains the stability of the structural layer with lower plastic deformation. Therefore, transferring the dynamic load to a larger horizontal range with smaller values [48,49].
Figure 13a,c depicts a c as the one-third frequency line of the vibration velocity on the upper and lower sides of the gravel soil in scheme 1. Similarly, Figure 13b,d represents the one-third frequency line of the variation of the vibration velocity of the upper and lower sides of the geocell-reinforced aeolian sand for scheme 2. The central frequency of the test section of scheme 1 is 2.5 Hz, 2 Hz, 1.6 Hz, 2.5 Hz, 2.5 Hz, 2.5 Hz, 2.5 Hz, and 2.5 Hz when the test vehicle passes at 20 km/h, 40 km/h, 60 km/h, 80 km/h, 100 km/h, 120 km/h. The main frequencies change from 2.5 Hz, 2 Hz, 1.6 Hz, 2 Hz, 2.5 Hz, 2.5 Hz, and 2.5 Hz on the upper side of gravelly soil to 2.5 Hz, 2 Hz, 2.6 Hz, 2 Hz, 2.5 Hz, 2.5 Hz on the lower side. The central frequencies of both Scheme 1 and Scheme 2 are a process of decreasing and then increasing with the increase in the driving speed of the test vehicle. The central frequencies mainly decrease at 40 km/h and 60 km/h when transmitted downward. The reason for the change in the center frequency is that the phase is close to half of the original when the test vehicle is running at 40 km/h and 60 km/h. Some amplitudes in the central frequency are offset. Consequently, the central frequency has changed [50,51].
Except for the primary frequency amplitude attenuation of 30 cm gravelly soil at a driving speed of 40 km/h, which is greater than that of 15 cm geocell-reinforced gravelly soil. The central frequency amplitude attenuation of scheme 2 is greater than scheme 1 at all other vehicle speeds, especially at a driving speed of 100 km/h. The geocell-reinforced aeolian sand layer attenuates vibrations twice as high as the gravelly soil layer. Through horizontal diffusion, the lateral ring hoop effect of the geocell conveys a portion of the mobile load’s energy. Consequently, a decrease in energy spread vertically downward. The longitudinal vibration reduction of the geocell-reinforced aeolian sand-on-sand bed is superior to that of the gravelly soil-on-sand bed [52,53].

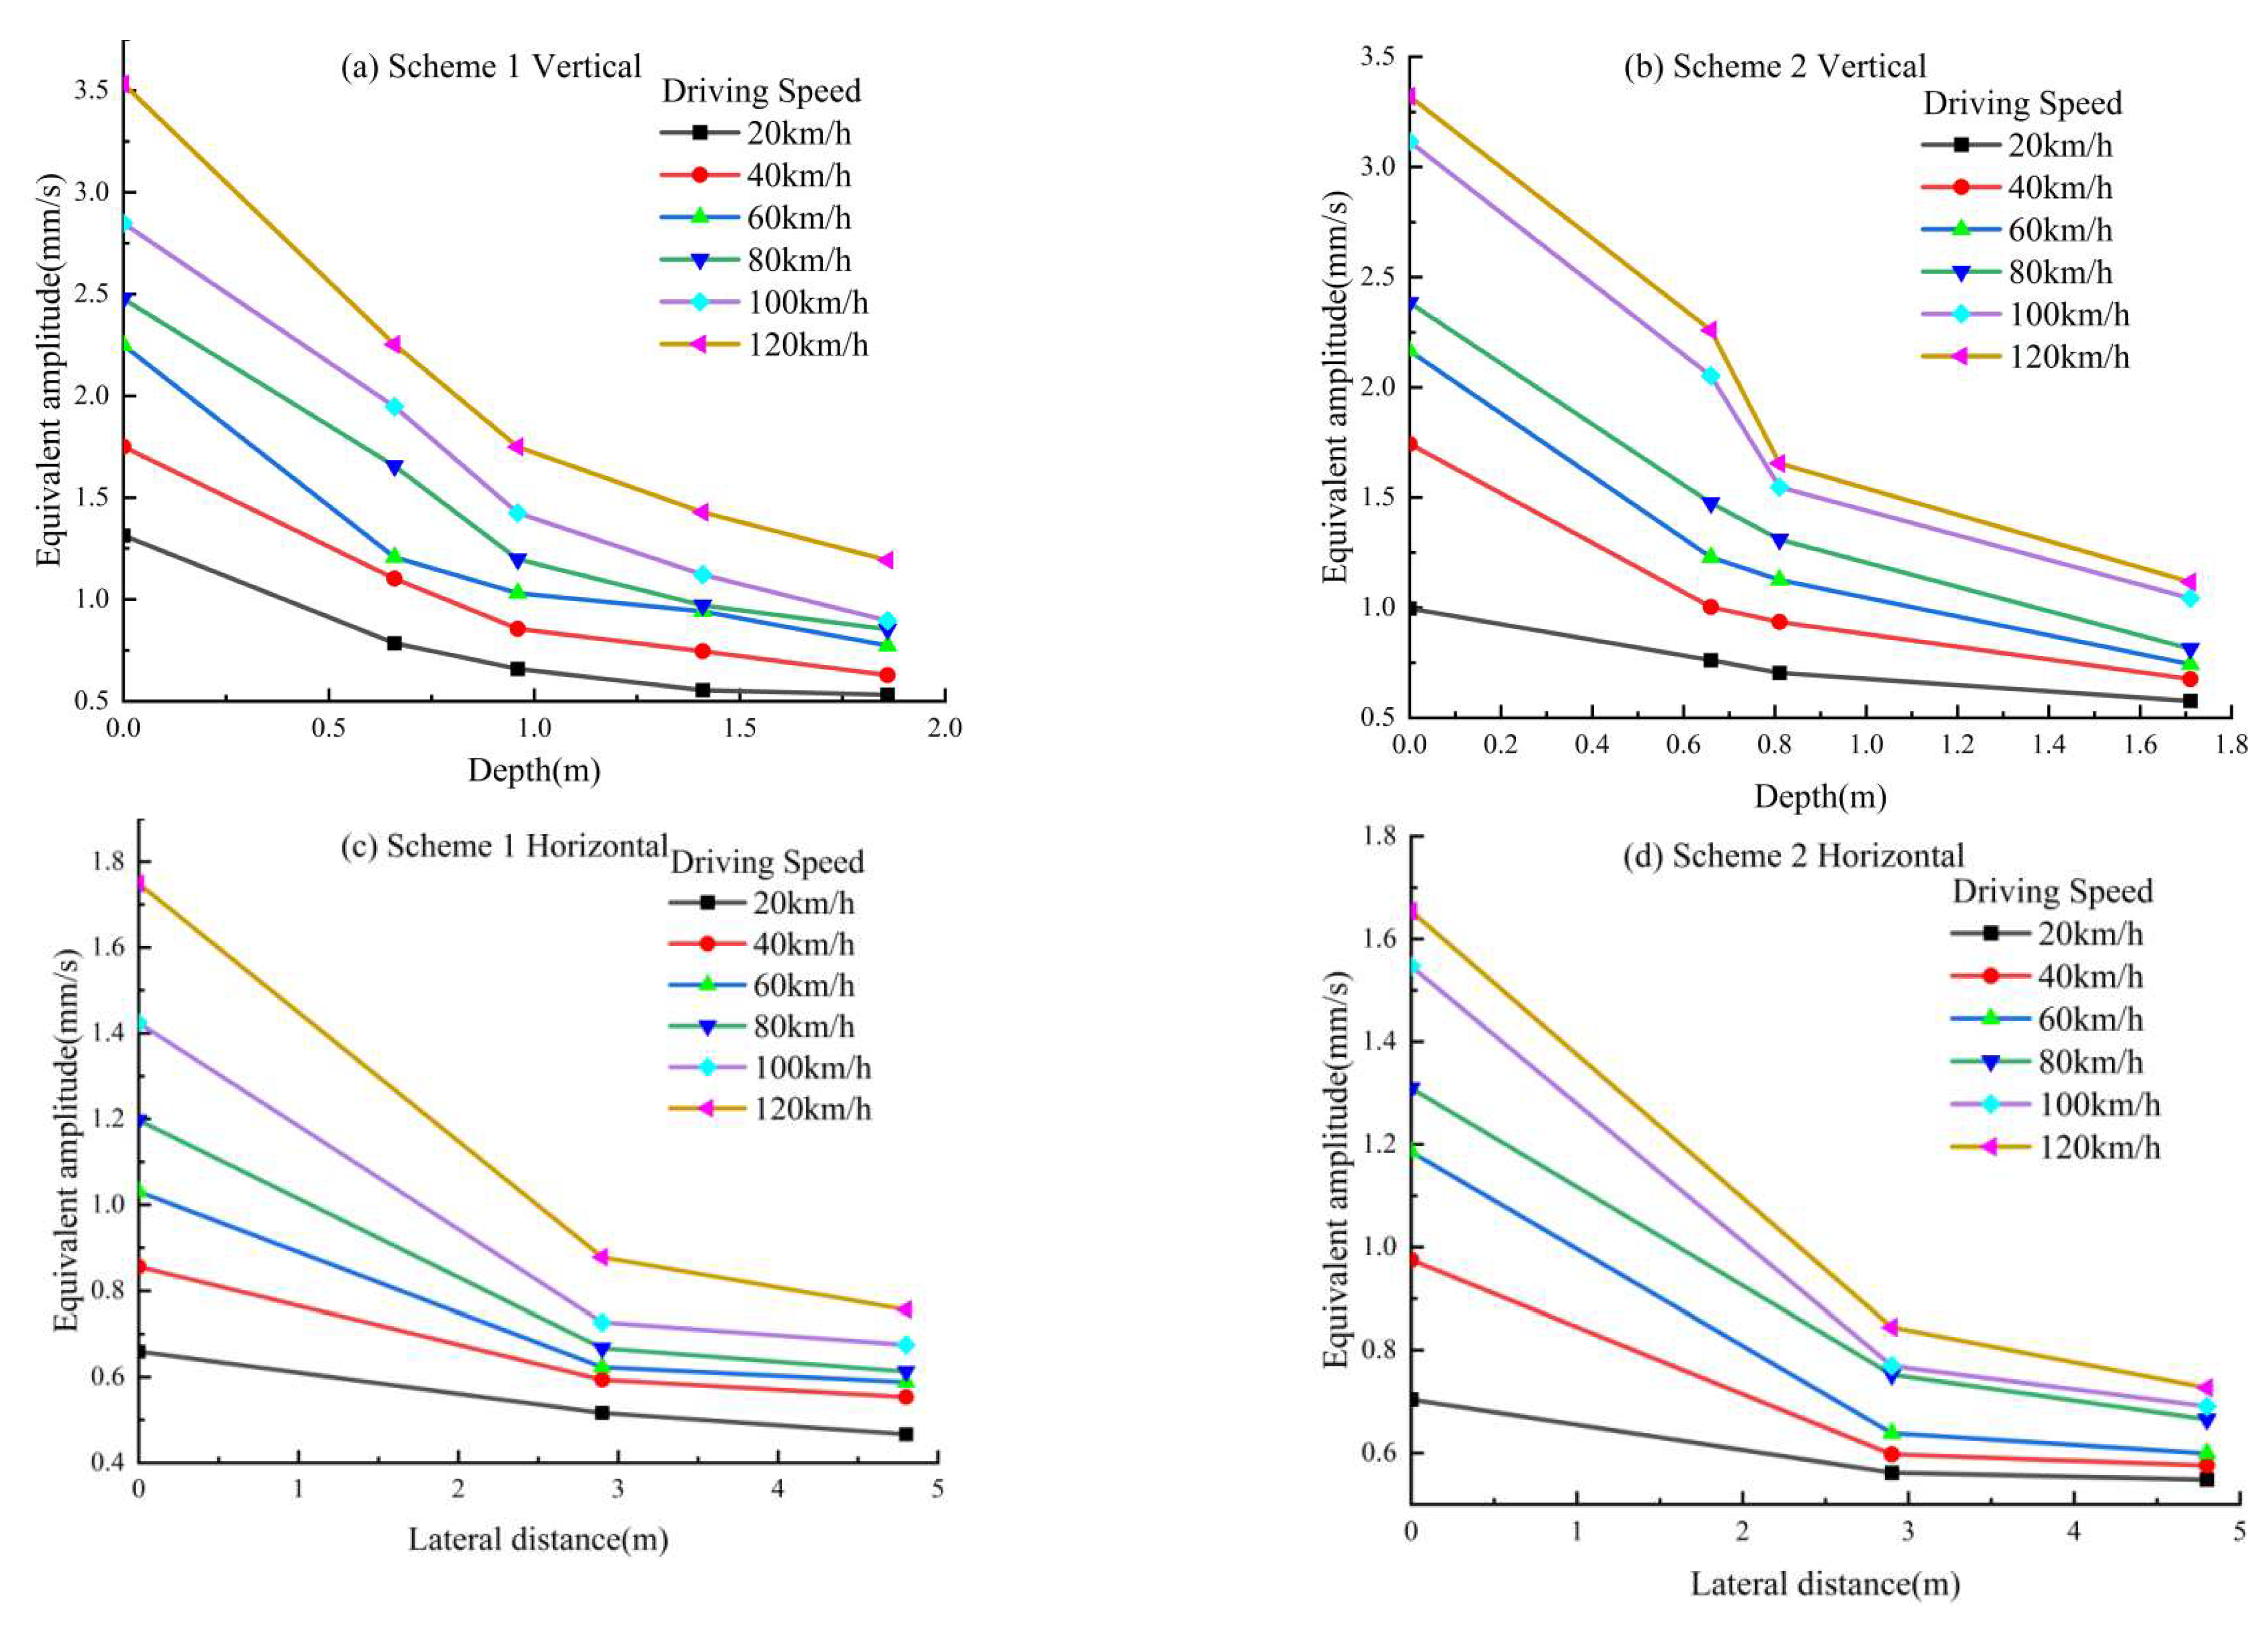
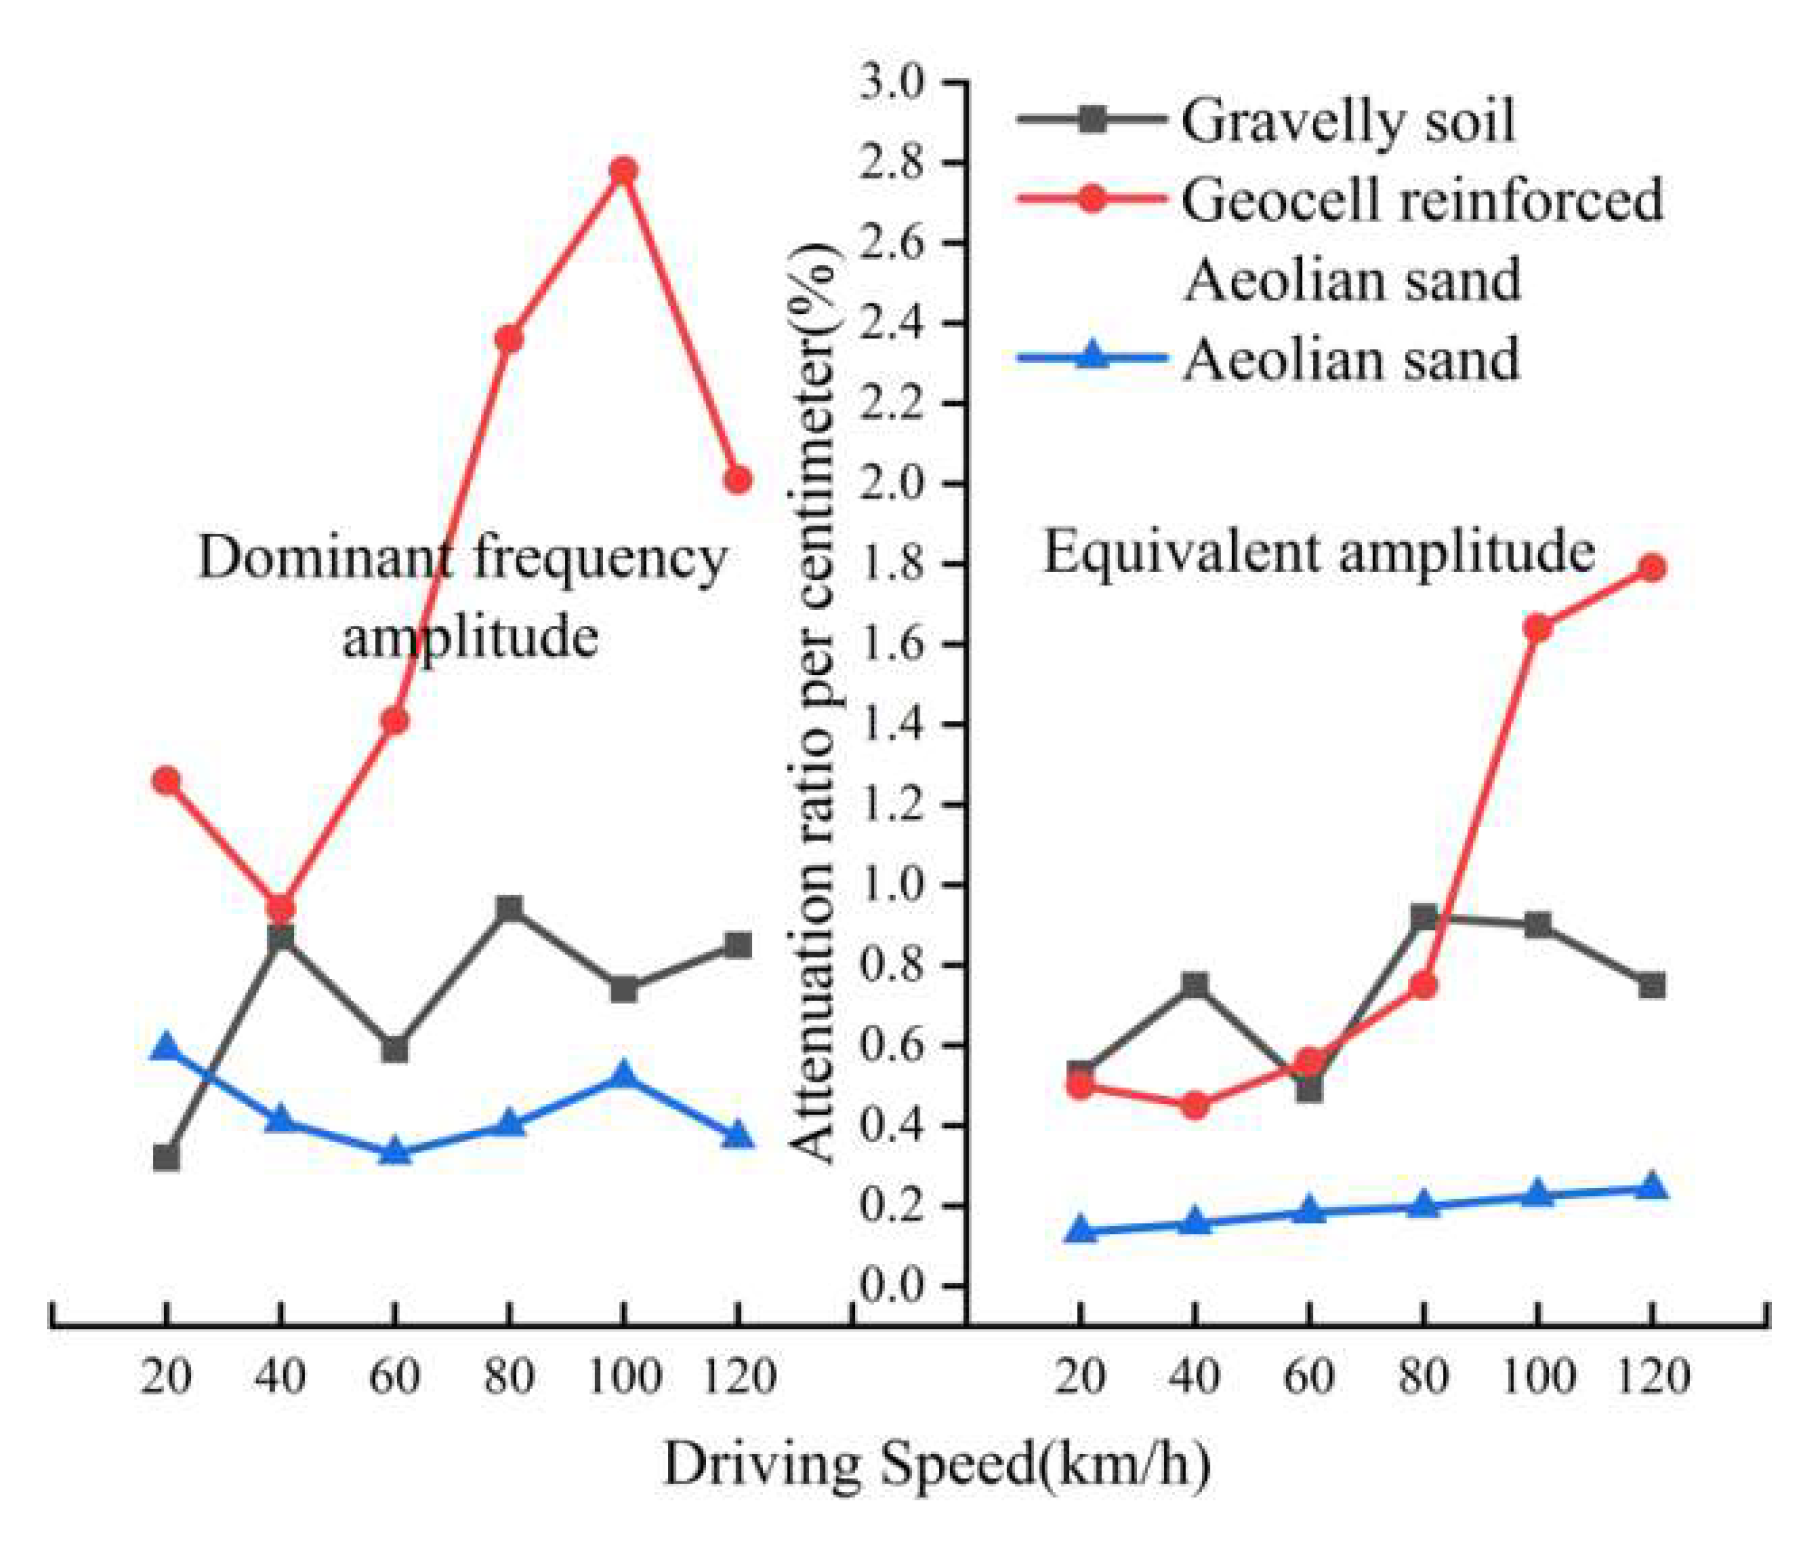
3.5. Analysis of the Depth of Influence

3.5.1. Analysis Basis

Evaluation of geocell-reinforced aeolian sands on the roadbed is dependent on the effect of vehicle vibrations on the roadbed [54]. The vertical vibration velocity attenuation research is a prerequisite for the influence depth study. Analysis of the attenuation of vibrations from the perspective of the principal frequency amplitude alone is relatively discrete. Variation of moving load road vibrations cannot be quantified in this manner. Compare exhaustively the attenuation in different structural layers of energy generated by vehicle load. Therefore, the equivalent amplitude Ad is defined to represent the amplitude in the entire frequency domain and is calculated as follows:
A d = Σ ( A i × f i )
where Ai is the individual amplitude in the one-third octave analysis, fi is the frequency corresponding to Ai. The frequency fd of Ad satisfies:
Σ ( A i × f i ) = Σ ( A i + d × ( f i + d ) ) , i = 1 , 2 d .
In terms of energy decay, the entire frequency domain can be represented by a simple harmonic function f(t) with amplitude Ad and frequency fd. f(t) at this point is a function of vibration velocity against time. Its integration against time can be obtained as a function of vibration displacement about time g(t) that is:
f ( t ) d t = g ( t )
Since there is no initial vibration displacement at 0, the integration constant is also 0. At the same time, g(t) is also a simple harmonic function, and its amplitude is Ad. Therefore, the energy generated by the vibration is:
E = 1 2 k A d 2
where k is the modulus of elasticity of the material.
The equivalent amplitude can be used to measure the vibrational energy. The rate of vibration energy dissipation can be determined by comparing the decay rate of equivalent amplitude. In addition, the amplitude decay ratio can quantify the attenuation performance of the structural layer to the vibration velocity along the depth direction, which is calculated as:
φ = A s A x A s h × 100 %
where As is the vibration amplitude of the upper boundary of the structure in mm/s, Ax is the vibration amplitude of the lower boundary of the structure in mm/s, and h is the thickness of the structural layer in cm.

3.5.2. Analysis Process

Figure 14 depicts the variation in equivalent amplitude between scheme 1 and scheme 2. The equivalent amplitudes at the top of the roadbed are more similar between the two schemes than the main frequency amplitudes. At the same driving speed, the excitement experienced by both sides is the same. The upper structure of gravelly soil is identical to that of geocell-reinforced aeolian sand. Thus, the equivalent amplitude is more comprehensive than the maximum amplitude and is a more comprehensive measure of vibration velocity.
The vertical attenuation of scheme 1 has an obvious turning point at 0.96 m. It indicates that the surface material of gravelly soil has similar effects on vibration from the perspective of energy attenuation. In contrast, scheme 2 has two distinct inflection points at 0.66 m and 0.81 m, and the slope increases with speed in this range. When the vibration of vehicles traveling at speeds above 100 km/h, the vertical attenuation effect of geocell-reinforced aeolian sand is the most obvious.
Figure 15 depicts the amplitude attenuation of primary frequency amplitude and equivalent amplitude at various structural layers. After aeolian sand is reinforced with geocells, the proportion of primary frequency amplitude attenuation increases dramatically, ranging from 0.52% to 2.26%. Geocells reinforce a large rise in the equivalent amplitude attenuation of aeolian sand. Expanding 11.66, 2.57, 2.83, 5.58, 7.32, and 9.73, respectively, between 20 to 120 km/h. It demonstrates that the reinforcement of the geocell on the aeolian sand accelerates the vibration energy dissipation by the aeolian sand. The reinforcement impact grows with the speed of the driving vehicle when the driving vehicle’s speed exceeds 40 km/h [55].
At all vehicle speeds, geocell-reinforced aeolian sand attenuates more main frequency amplitude than gravelly soils, with a maximum difference of 2.4%. At driving speeds of 20 km/h, 40 km/h, 60 km/h, 80 km/h, 100 km/h, and 120 km/h, the main frequency amplitude attenuation ratio is 3.89, 1.08, 2.38, 2.51, 3.75, and 2.37 times that of gravel type soil. The proportion of equivalent amplitude attenuation of geocell-reinforced aeolian sand from 20 km/h to 120 km/h is 0.94, 0.61, 1.15, 0.81, 1.83, and 2.39 times that of gravelly soils. Polypropylene resin geocells increase the aeolian sand’s dynamic elastic modulus and damping. The aeolian sand’s compression properties and deformation characteristics under traffic loads are changed by geocell. Moreover, geocells restrict lateral soil deformation and prevent the development of shear zones in the soil, increasing the soil’s load-bearing capability and enhancing its vibration suppression performance [56,57]. Thus, the vibration resistance of the geocell-reinforced aeolian sand layer exceeds that of the gravelly soil layer in most cases.
In addition, as driving speed increases, the proportion of equivalent amplitude attenuation of geocell-reinforced wind-cumulus increases. Specifically, there is a substantial increase from 0.75% to 1.64% between 80 km/h and 100 km/h. The vibration response of the system increases sharply after approaching a critical driving speed was also concluded [58,59].

3.5.3. Analysis Results

On the basis of the depth of the roadbed working area stress, the vibration speed of the roadbed working area is proposed. When the equivalent amplitude decays to one-tenth of the road surface, the depth is equal to the depth of the working area of the roadbed H. The depth of the roadbed working area of the vibration speed was computed as follows:
( 1 φ 1 h 1 ) ( 1 φ 2 h 2 ) ( 1 φ 3 ( H h 2 ) ) = 1 10
where φ1 is the amplitude attenuation ratio of the pavement structure layer, h1 is the thickness of the pavement structure layer, φ2 is the amplitude attenuation ratio of the upper roadbed, h2 is the thickness of the upper roadbed, φ3 is the amplitude attenuation ratio of the roadbed, solved for:
H = h 2 + 1 φ 3 ( 1 1 10 ( 1 φ 1 h 1 ) ( 1 φ 2 h 2 ) )
Under the influence of a moving load, Figure 16 depicts the depth of vibration velocity roadbed working area for two distinct upper roadbeds. The depth of vibration velocity roadbed working area diminishes as travel speed increases. The vibration caused by the traveling load on the geocell reinforced with aeolian sand is less than that on the side of gravelly soil. The difference between the two can reach 0.55 m. The reason is that the three-dimensional cellular vertical tendons in the lateral limit structure operate as lateral restraints on the soil and have a substantial foundation impact. Geocell greatly increases the apparent cohesion of the soil and the integrity of the structure, hence minimizing the depth of influence of vibration velocity on the roadbed [60].

4. Discussion

In this study, the test findings for the vibration velocity of gravelly soils and geocell-reinforced aeolian sand beds under traffic loads are presented. At six different velocities, the vibration response of two distinct upper beds and roadbeds is investigated. In addition, the vibration attenuation performance of geocell-reinforced aeolian sand and gravelly soils are compared. The lack of field tests on reinforced wind-covered roads is made up [61,62,63]. The main conclusions are that the geocell-reinforced sand can replace the gravel as the upper roadbed regarding vibration velocity and energy attenuation.
The lack of field measurement data in previous studies was filled. Unfortunately, this experiment contains some limitations. The instrument is damaged 45 cm from the lower edge of the geocell on the geocell reinforced aeolian sand side. Therefore, the effect of the geocell on the aeolian sand underneath cannot be investigated in depth. It is recommended that more than one instrument can be arranged at the same point of the field test, which can avoid the lack of test data. At the same time, the accuracy of data is improved [64,65,66]. The height of the geocell is an important factor affecting the dynamic response of aeolian sand in geocell reinforcement. However, due to the limitation of the length of the field test section, it is impossible to ensure that the geocells of different heights are laid without affecting each other.
In the follow-up study, the material, height, and size of the geocell can be used as variables to study the dynamic characteristics of the stiffened and unstiffened samples of wind–sand under cyclic load through the dynamic triaxial test. The test section is set up to simulate the real traffic condition. The spatial distribution and dynamic response range of subgrade dynamic load are analyzed. The interaction mechanism between geocell and aeolian sand in subgrade is discussed. The influence law of moving load on aeolian sand reinforced by geocells was clarified. Determine the practical life of the geocell for reinforcing wind-bound sand. By combining various data, the road performance of aeolian sand reinforced with geocells is comprehensively analyzed [67]. Finally, corresponding design criteria are proposed [68,69,70].

5. Conclusions

The time–domain curves of the vibration velocity of the geocell-reinforced aeolian sand side and the gravelly soil side are both N-shaped curves. The wave peak’s appearance time corresponds to the vehicle axle’s arrival time. The response period of traveling load vibration velocity is around 1.5 s. In addition, the geocell-reinforced aeolian sand side has a somewhat longer response duration than the gravelly soil side.
The majority of the frequency distribution of road vibrations induced by the test vehicle is mainly within the 30 Hz range. As the test vehicle’s speed diminishes, the impact frequency steadily lowers to between 0–15 Hz. The single peak value within the region of influence is between 0–5 Hz. In terms of vibration amplitude decay in the horizontal direction, geocell-reinforced aeolian sand is slower, but smoother, than gravelly soil.
After geocell reinforcement of aeolian sand, the vibration velocity primary frequency amplitude per attenuation ratio increased substantially. Additionally, the value increase was between 0.52% and 2.26%. At speeds ranging from 20 to 120 km/h, the equivalent amplitude attenuation ratio increased by 11.66, 2.57, 2.83, 5.58, 7.32, and 9.73 times, respectively.
At different driving speeds, the depth of vibration effect of the geocell-reinforced sand side is smaller than that of the gravel side, with a maximum difference of 0.55 m. Therefore, the 15 cm geocell-reinforced sand can replace the 30 cm gravel as the upper roadbed regarding vibration velocity and energy attenuation.

Author Contributions

B.G. and X.L. contributed to analysis and manuscript preparation. B.G., J.L. and L.S. performed the data analyses and wrote the manuscript. Y.S. and Y.Y. helped perform the analysis through constructive discussions. All authors have read and agreed to the published version of the manuscript.

Funding

This study received funding from Xinjiang Transport Planning Survey and Design Institute Co. Ltd. (Grant Nos KY2020112301; KY2021100901) and CSXEC Xinjiang Construction & Engineering (Group) Co. Ltd. (Grant Nos 65000022859700210197).

Informed Consent Statement

Informed consent was obtained from all subjects involved in the study.

Data Availability Statement

The raw data supporting the conclusions of this manuscript will be made available by the authors, without undue reservation, to any qualified researcher.

Acknowledgments

The authors would like to thank Shiyu Zhu of Chang’an University for helpful discussions on topics related to this work.

Conflicts of Interest

Author Xuejun Liu is employed by Xinjiang Academy of Architectural Science (Limited Liability Company) which is a subsidiary of CSXEC Xinjiang Construction & Engineering (Group) Co. Ltd. The funder was not involved in the study design, collection, analysis, interpretation of data, the writing of this article, or the decision to submit it for publication. All authors declare no other competing interest.

References

  1. Wang, C.; Li, S.; Li, Z.; Lei, J.; Chen, J. Effects of windblown sand damage on desert highway guardrails. Nat. Hazards 2020, 103, 283–298. [Google Scholar] [CrossRef]
  2. Yuan, J.; Ye, C.; Luo, L.; Pei, X.; Yang, Q.; Chen, J.; Liao, B. Sand fixation property and erosion control through new cellulose-based curing agent on sandy slopes under rainfall. Bull. Eng. Geol. Environ. 2020, 79, 4051–4061. [Google Scholar] [CrossRef]
  3. Tang, X.; Xiao, J.; Ma, M.; Yang, H.; Li, X.; Ding, Z.; Yu, P.; Zhang, Y.; Wu, C.; Huang, J.; et al. Satellite evidence for China’s leading role in restoring vegetation productivity over global karst ecosystems. For. Ecol. Manag. 2022, 507, 120000. [Google Scholar] [CrossRef]
  4. No. JTG 3610—2019; Technical Specifications for Construction of Highway Subgrads. People’s Traffic Publishing House Co.: Beijing, China, 2019.
  5. Abu Seif, E.-S.S.; Sonbul, A.R.; Hakami, B.A.H.; El-Sawy, E.K. Experimental study on the utilization of dune sands as a construction material in the area between Jeddah and Mecca, Western Saudi Arabia. Bull. Eng. Geol. Environ. 2016, 75, 1007–1022. [Google Scholar] [CrossRef]
  6. Sun, J.; Gu, S.; Li, J.; An, Y.; Liu, H. Research on Road Performance of Aeolian Sand Subbase Stabilized by DHT Soil Condensate. Highway 2021, 11, 57–62. [Google Scholar]
  7. Miao, L.; Wu, L.; Sun, X. Enzyme-catalysed mineralisation experiment study to solidify desert sands. Sci. Rep. 2020, 10, 10611. [Google Scholar] [CrossRef]
  8. Zhang, X.; Pang, S.; Li, J.; Zhang, X.; Cai, G.; Tian, L. Interface Mechanism and Splitting Characteristics of Fiber-Reinforced Cement-Solidified Aeolian Sand. Materials 2022, 15, 2860. [Google Scholar] [CrossRef]
  9. Lu, Y.; Abuel-Naga, H.; Leong, E.-C.; Jiao, W.-G.; Wang, X. Characterisation of geomembrane and geotextile interface short-term creep behaviour in a dry condition. Geotext. Geomembranes 2021, 50, 312–322. [Google Scholar] [CrossRef]
  10. Han, X.; Zhang, M.; Li, J.; Jiang, S. Model Test of Sand Foundation Reinforced with High-strength Geocel. J. Yangtze River Sci. Res. Inst. 2014, 3, 27–33. [Google Scholar]
  11. Sheikh, I.R.; Shah, M.Y. State-of-the-Art Review on the Role of Geocells in Soil Reinforcement. Geotech. Geol. Eng. 2020, 39, 1727–1741. [Google Scholar] [CrossRef]
  12. Saride, S.; Gowrisetti, S.; Sitharam, T.G.; Puppala, A.J. Numerical simulation of geocell-reinforced sand and clay. Proc. Inst. Civ. Eng. Ground Improv. 2009, 162, 185–198. [Google Scholar] [CrossRef]
  13. Hegde, A.; Sitharam, T.G. Experimental and numerical studies on footings supported on geocell reinforced sand and clay beds. Int. J. Geotech. Eng. 2013, 7, 346–354. [Google Scholar] [CrossRef]
  14. Hegde, A.; Sitharam, T. 3-Dimensional numerical modelling of geocell reinforced sand beds. Geotext. Geomembranes 2015, 43, 171–181. [Google Scholar] [CrossRef]
  15. Song, F.; Liu, H.; Yang, B.; Zhao, J. Large-scale triaxial compression tests of geocell-reinforced sand. Geosynth. Int. 2019, 26, 388–395. [Google Scholar] [CrossRef]
  16. Tafreshi, S.M.; Rahimi, M.; Dawson, A.; Leshchinsky, B. Cyclic and post-cycling anchor response in geocell-reinforced sand. Can. Geotech. J. 2019, 56, 1700–1718. [Google Scholar] [CrossRef]
  17. Venkateswarlu, H.; Hegde, A. Effect of infill materials on vibration isolation efficacy of geocell-reinforced soil beds. Can. Geotech. J. 2019, 57, 1304–1319. [Google Scholar] [CrossRef]
  18. Wan, X.; Ding, J.; Hong, Z.; Huang, C.; Shang, S.; Ding, C. Dynamic Response of a Low Embankment Subjected to Traffic Loads on the Yangtze River Floodplain, China. Int. J. Géoméch. 2022, 22, 04022065. [Google Scholar] [CrossRef]
  19. Abbaspour, M.; Narani, S.S.; Aflaki, E.; Nejad, F.M. Dynamic characteristics of a sandy subgrade reinforced by waste tire textile fibres. Int. J. Pavement Eng. 2022, 23, 2293–2308. [Google Scholar] [CrossRef]
  20. Yang, X.; He, Q.; Liu, X.; Yang, F.; Huo, W.; Shen, S.; Mamtimin, A. Saltation activity and its threshold velocity in the Gurbantunggut Desert, China. Nat. Hazards 2018, 90, 349–364. [Google Scholar] [CrossRef]
  21. Hou, Y.; Wang, B.; Huang, L.; He, W.; Zhu, J.; Wang, J. Mechanical properties of re-packed reinforced Earth embankment during service stage. J. Asian Arch. Build. Eng. 2022, 21, 1520–1531. [Google Scholar] [CrossRef]
  22. Múčka, P. Sensitivity of road unevenness indicators to short wavelength distresses in Portland cement concrete surfaces. Int. J. Pavement Eng. 2018, 19, 901–916. [Google Scholar] [CrossRef]
  23. Wan, J.; Li, B.; Gao, Y.; Tan, C.; Feng, C.; Zhang, P. Dynamic response of the inhomogeneous pavement structure containing a buried fault zone under the moving aircraft loads. Bull. Eng. Geol. Environ. 2022, 81, 301. [Google Scholar] [CrossRef]
  24. Salehi, K.; Eisa, H.M.; Badv, K. Reinforcement effect of geotextiles on shear strength of peat soil: A case study on Urmia peat. Bull. Eng. Geol. Environ. 2021, 80, 6799–6812. [Google Scholar] [CrossRef]
  25. Zhang, B.-B.; Liu, J.; Gao, B.; Wang, B.; Ai, Y.-H. The Study on Dynamic Response of Aeolian Sand Embankment Strengthened by Geocell through Field Test. J. Highw. Transp. Res. Dev. 2021, 15, 24–35. [Google Scholar] [CrossRef]
  26. Haghnejad, A.; Ahangari, K.; Moarefvand, P.; Goshtasbi, K. Numerical investigation of the impact of rock mass properties on propagation of ground vibration. Nat. Hazards 2019, 96, 587–606. [Google Scholar] [CrossRef]
  27. Saha, P.; Mandal, K.K. A study of earthquake-induced vibration on laminated composite plates using finite element method. Nat. Hazards 2021, 106, 2251–2277. [Google Scholar] [CrossRef]
  28. Li, X.; Wang, Y.; Hu, Y.; Zhou, C.; Zhang, H. Numerical Investigation on Stratum and Surface Deformation in Underground Phosphorite Mining Under Different Mining Methods. Front. Earth Sci. 2022, 10. [Google Scholar] [CrossRef]
  29. Huang, F.; Cao, Z.; Guo, J.; Jiang, S.-H.; Li, S.; Guo, Z. Comparisons of heuristic, general statistical and machine learning models for landslide susceptibility prediction and mapping. Catena 2020, 191, 104580. [Google Scholar] [CrossRef]
  30. Liu, Z.; Gu, X.; Ren, H.; Zhou, Z.; Wang, X.; Tang, S. Analysis of the dynamic responses of asphalt pavement based on full-scale accelerated testing and finite element simulation. Constr. Build. Mater. 2022, 325, 126429. [Google Scholar] [CrossRef]
  31. Chang, Z.; Du, Z.; Zhang, F.; Huang, F.; Chen, J.; Li, W.; Guo, Z. Landslide Susceptibility Prediction Based on Remote Sensing Images and GIS: Comparisons of Supervised and Unsupervised Machine Learning Models. Remote Sens. 2020, 12, 502. [Google Scholar] [CrossRef] [Green Version]
  32. Li, W.; Han, S.; Han, X.; Yao, Y. Experimental and numerical analysis of mechanical properties of geocell reinforced reclaimed construction waste composite base layer. Constr. Build. Mater. 2021, 304, 124587. [Google Scholar] [CrossRef]
  33. Huang, F.; Zhang, J.; Zhou, C.; Wang, Y.; Huang, J.; Zhu, L. A deep learning algorithm using a fully connected sparse autoencoder neural network for landslide susceptibility prediction. Landslides 2020, 17, 217–229. [Google Scholar] [CrossRef]
  34. Tertyshnaya, Y.V.; Karpova, S.G.; Podzorova, M.V.; Khvatov, A.V.; Moskovskiy, M.N. Thermal Properties and Dynamic Characteristics of Electrospun Polylactide/Natural Rubber Fibers during Disintegration in Soil. Polymers 2022, 14, 1058. [Google Scholar] [CrossRef] [PubMed]
  35. Toyota, H.; Takada, S. Settlement assessment of sand subjected to cyclic stress related to a load moving over a surface using hollow cylindrical torsional shear apparatus. Transp. Geotech. 2021, 29, 100580. [Google Scholar] [CrossRef]
  36. Huang, F.; Cao, Z.; Jiang, S.-H.; Zhou, C.; Huang, J.; Guo, Z. Landslide susceptibility prediction based on a semi-supervised multiple-layer perceptron model. Landslides 2020, 17, 2919–2930. [Google Scholar] [CrossRef]
  37. Galvín, P.; Romero, A.; Domínguez, J. Vibrations induced by HST passage on ballast and non-ballast tracks. Soil Dyn. Earthq. Eng. 2010, 30, 862–873. [Google Scholar] [CrossRef] [Green Version]
  38. Jiang, S.-H.; Huang, J.; Huang, F.; Yang, J.; Yao, C.; Zhou, C.-B. Modelling of spatial variability of soil undrained shear strength by conditional random fields for slope reliability analysis. Appl. Math. Model. 2018, 63, 374–389. [Google Scholar] [CrossRef]
  39. Zhou, S.; Luo, X.; Jiang, N.; Zhang, S.; Lei, Y. Ground vibration characteristics of carbon dioxide phase transition fracturing: An in situ test. Bull. Eng. Geol. Environ. 2021, 80, 9029–9047. [Google Scholar] [CrossRef]
  40. Zhang, X.; Pei, X.; Zhang, Z.; Song, L. Study on pore pressure and fluidization evaluation method of unsaturated loess in vibration process. Bull. Eng. Geol. Environ. 2021, 80, 5575–5587. [Google Scholar] [CrossRef]
  41. Venkateswarlu, H.; Hegde, A.; Kazemi, K.; RezaArvin, M.; Hataf, N.; Khademhosseini, A.; Dehkordi, P.F.; Ghazavi, M.; Ganjian, N.; Karim, U.F.A.; et al. Behavior of geocell reinforced bed under vibration loading: 3D numerical studies. Geosynth. Int. 2022, 1–20. [Google Scholar] [CrossRef]
  42. Chang, Z.; Catani, F.; Huang, F.; Liu, G.; Meena, S.R.; Huang, J.; Zhou, C. Landslide susceptibility prediction using slope unit-based machine learning models considering the heterogeneity of conditioning factors. J. Rock Mech. Geotech. Eng. 2022. [Google Scholar] [CrossRef]
  43. Liénard, J.-S. Quantifying vocal effort from the shape of the one-third octave long-term-average spectrum of speech. J. Acoust. Soc. Am. 2019, 146, EL369–EL375. [Google Scholar] [CrossRef] [PubMed]
  44. Chatterjee, K.; Arumuru, V.; Patil, D.; Jha, R. Multipoint monitoring of amplitude, frequency, and phase of vibrations using concatenated modal interferometers. Sci. Rep. 2022, 12, 3798. [Google Scholar] [CrossRef] [PubMed]
  45. Huang, F.; Chen, J.; Liu, W.; Huang, J.; Hong, H.; Chen, W. Regional rainfall-induced landslide hazard warning based on landslide susceptibility mapping and a critical rainfall threshold. Geomorphology 2022, 408, 108236. [Google Scholar] [CrossRef]
  46. Umehara, M.; Okumura, K. Rising Obstacle in a Two-dimensional Granular Bed Induced by Continuous and Discontinuous Vibrations: Dynamics Governed by Vibration Velocity. J. Phys. Soc. Jpn. 2020, 89, 035001. [Google Scholar] [CrossRef]
  47. Li, L.; Zhang, H.; Pan, Y.; Ju, X.; Tang, L.; Li, M. Influence of stress wave-induced disturbance on ultra-low friction in broken blocks. Int. J. Coal Sci. Technol. 2022, 9, 22. [Google Scholar] [CrossRef]
  48. Pini, T.; Briatico-Vangosa, F.; Frassine, R.; Rink, M. Fracture toughness of acrylic resins: Viscoelastic effects and deformation mechanisms. Polym. Eng. Sci. 2018, 58, 369–376. [Google Scholar] [CrossRef] [Green Version]
  49. Singh, M.; Trivedi, A.; Shukla, S.K. Evaluation of geosynthetic reinforcement in unpaved road using moving wheel load test. Geotext. Geomembranes 2022, 50, 581–589. [Google Scholar] [CrossRef]
  50. Zhao, Y.; Ling, X.; Wang, Z.; Gong, W.; Li, G. Acceleration Frequency Characteristics of the Freight-Train-Induced Vibration of the Beijing-Harbin Railway Subgrade. Shock. Vib. 2020, 2020, 6651713. [Google Scholar] [CrossRef]
  51. Feng, F.; Chen, S.; Zhao, X.; Li, D.; Wang, X.; Cui, J. Effects of external dynamic disturbances and structural plane on rock fracturing around deep underground cavern. Int. J. Coal Sci. Technol. 2022, 9, 15. [Google Scholar] [CrossRef]
  52. Ju, S. Study of ground vibration induced by high-speed trains moving on multi-span bridges. Struct. Eng. Mech. 2016, 59, 277–290. [Google Scholar] [CrossRef]
  53. Wang, Q.; Xu, S.; He, M.; Jiang, B.; Wei, H.; Wang, Y. Dynamic mechanical characteristics and application of constant resistance energy-absorbing supporting material. Int. J. Min. Sci. Technol. 2022, 32, 447–458. [Google Scholar] [CrossRef]
  54. Venkateswarlu, H.; Hegde, A. Effect of Influencing Parameters on the Vibration Isolation Efficacy of Geocell Reinforced Soil Beds. Int. J. Geosynth. Ground Eng. 2020, 6, 16. [Google Scholar] [CrossRef]
  55. Liu, F.; Shao, Z.; Qiao, R.; Zhang, S.; Cheng, W.-C. The influence of compaction energy on frost-heave characteristics of coarse-grained soil. Nat. Hazards 2020, 100, 897–908. [Google Scholar] [CrossRef]
  56. Liu, F.; Wu, M.; Chen, J.; Yufeng, Z. Experimental study on influence of geo-cell reinforcement on dynamic properties of rubber-sand mixtures. Chin. J. Geotech. Eng. 2017, 9, 1616–1625. [Google Scholar]
  57. Jiang, P.; Chen, Y.; Song, X.; Li, N.; Wang, W.; Wu, E. Study on Compressive Properties and Dynamic Characteristics of Polypropylene-Fiber-and-Cement-Modified Iron-Ore Tailing under Traffic Load. Polymers 2022, 14, 1995. [Google Scholar] [CrossRef]
  58. Dong, L.; Chen, Y.; Sun, D.; Zhang, Y. Implications for rock instability precursors and principal stress direction from rock acoustic experiments. Int. J. Min. Sci. Technol. 2021, 31, 789–798. [Google Scholar] [CrossRef]
  59. Hou, R.-Y.; Zheng, J.-J.; Fang, H.; You, L. An analytical model for dynamic response of geosynthetic reinforced embankment system under traffic load. Comput. Geotech. 2022, 142, 104555. [Google Scholar] [CrossRef]
  60. Khorsandiardebili, N.; Ghazavi, M. Internal stability analysis of geocell-reinforced slopes subjected to seismic loading based on pseudo-static approach. Geotext. Geomembranes 2021, 50, 393–407. [Google Scholar] [CrossRef]
  61. Hong, K.-C.; Eum, K.-Y.; Kim, J.-Y.; Kim, D.-K. Real-scale Accelerated Testing to Evaluate Roadbed Reinforcement Effect by Using Rectangular-Parallelepiped Fiber Reinforcement Sack. J. Korean Soc. Railw. 2019, 22, 888–895. [Google Scholar] [CrossRef]
  62. Sivapriya, S.V.; Ganesh-Kumar, S. Functional and cost- benefits of geosynthetics as subgrade reinforcement in the design of flexible pavement. Rev. Fac. De Ing. 2019, 28, 39–49. [Google Scholar] [CrossRef] [Green Version]
  63. Ibrahim, O.R.; Al Maqbali, L.A.; Al Shaqsi, M.S. Comparison between Sediment Material and Natural Subgrade Material for Road Construction. Key Eng. Mater. 2022, 913, 215–226. [Google Scholar] [CrossRef]
  64. Du, M.; Su, J.; Wang, X.; Lu, Z. Field Test and Numerical Analysis of Dynamic Stress of High-Speed Railway Tunnel Invert in Mudstone. Geotech. Geol. Eng. 2020, 39, 829–837. [Google Scholar] [CrossRef]
  65. Yang, C.; Zhang, L.; Han, Y.; Cai, D.; Wei, S. Study on the Transmission and Evolution Characteristics of Vibration Wave from Vibratory Roller to Filling Materials Based on the Field Test. Appl. Sci. 2020, 10, 2008. [Google Scholar] [CrossRef] [Green Version]
  66. Lu, Z.; Tang, C.; Duan, Y.; Fang, R.; Yao, H.; Guo, S. Field test and semi-analytical simulation of unsaturated road subgrade in various water content subjected to a heavy duty truck. Soil Dyn. Earthq. Eng. 2021, 144, 106667. [Google Scholar] [CrossRef]
  67. Yin, C.; Wang, Z.; Zhao, X. Spatial prediction of highway slope disasters based on convolution neural networks. Nat. Hazards 2022, 113, 813–831. [Google Scholar] [CrossRef]
  68. Li, S.-Z.; Ling, X.-Z.; Tian, S.; Ye, Y.-S.; Tang, L.; Cai, D.-G.; Wang, K. In-situ test and analysis of subgrade vibration with ballasted track in deep seasonally frozen regions. Transp. Geotech. 2021, 31, 100658. [Google Scholar] [CrossRef]
  69. Mousavi, F.; Hemmat, M.A.; Abdi, E.; Norouzi, A. The effect of polymer materials on the stabilization of forest road subgrade. Int. J. For. Eng. 2021, 32, 235–245. [Google Scholar] [CrossRef]
  70. Wang, X.; Wang, X.; Yang, G.; Pu, C.; Jin, J. Field Test on Deformation Characteristics of Pile-Supported Reinforced Embankment in Soft Soil Foundation. Sustainability 2022, 14, 7805. [Google Scholar] [CrossRef]
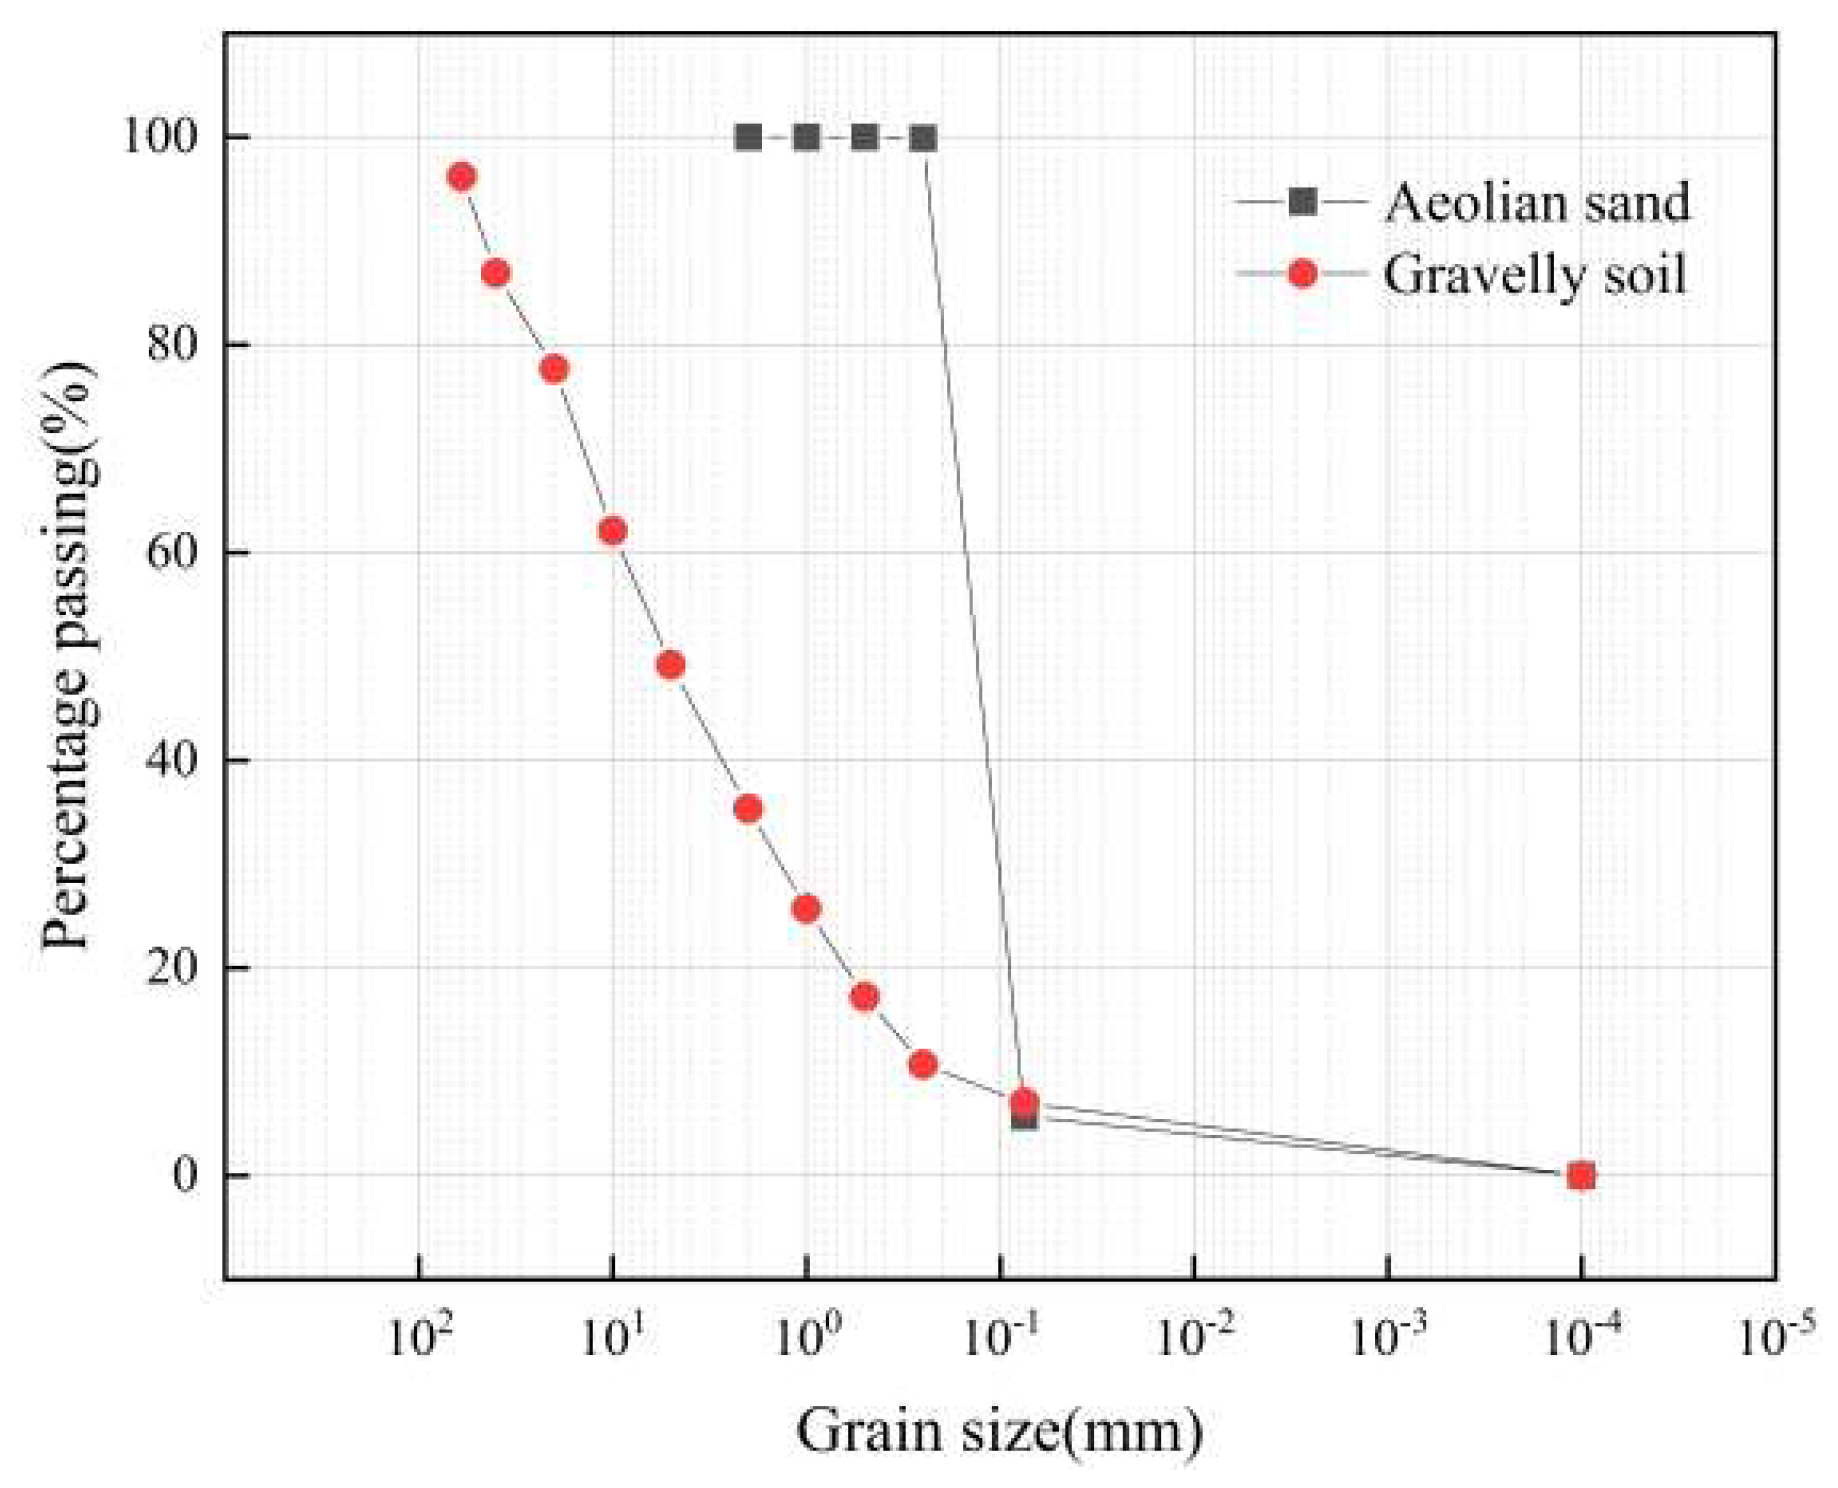
Figure 1. Geocell reinforcement mechanism diagram.
Applsci 13 00864 g001
Figure 2. Schematic diagram of road structure.
Applsci 13 00864 g002
Figure 3. Grading curves of aeolian sand and gravelly soils.
Applsci 13 00864 g003
Figure 4. Test on site.
Applsci 13 00864 g004
Figure 5. Time-domain curve of vibration velocity.
Applsci 13 00864 g005
Figure 6. Actual vibration amplitude longitudinal decay curve.
Applsci 13 00864 g006
Figure 7. Actual vibration amplitude transverse decay curve.
Applsci 13 00864 g007
Figure 8. Frequency–domain curve of vibration velocity with driving speed.
Applsci 13 00864 g008
Figure 9. Frequency–domain curve of longitudinal decay of vibration velocity.
Applsci 13 00864 g009
Figure 10. Vibration velocity level decay frequency–domain curve.
Applsci 13 00864 g010
Figure 11. One-third frequency range analysis of the longitudinal decay curve.
Applsci 13 00864 g011
Figure 12. One-third frequency range analysis lateral decay curve.
Applsci 13 00864 g012
Figure 13. One-third frequency range analysis curve.
Applsci 13 00864 g013
Figure 14. Equivalent amplitude decay curve.
Applsci 13 00864 g014
Figure 15. Vibration velocity attenuation performance curve.
Applsci 13 00864 g015
Figure 16. Depth of roadbed working area for vibration velocity.
Applsci 13 00864 g016
Table 1. Physical property index of the upper roadbed filler.
Upper Roadbed FillerNatural
Density/(g·cm−3)
Water Content/%Coefficient of Uniformity
Cu
Curve Coefficient
Cc
Aeolian sand (SP)1.651.311.850.87
Gravelly soil (GW)2.384.7646.851.06
Table 2. Scheme 1 test location and working condition table.
Travel
Speed
Vertical LayoutHorizontal Layout
The Road Surface66 cm Below the Road Surface112 cm Below the Road Surface157 cm Below Road Surface202 cm Below Road SurfaceRoad Center290 cm from Road Center480 cm from Road Center
20 km/h
40 km/h
60 km/h
80 km/h
100 km/h
120 km/h
Table 3. Scheme 2 test location and working condition table.
Travel
Speed
Vertical LayoutHorizontal Layout
The Road Surface66 cm Below the Road Surface81 cm Below the Road Surface126 cm Below the Road Surface171 cm Below the Road SurfaceRoad Center290 cm from Road Center480 cm from Road Center
20 km/hX
40 km/hX
60 km/hX
80 km/hX
100 km/hX
120 km/hX
Disclaimer/Publisher’s Note: The statements, opinions and data contained in all publications are solely those of the individual author(s) and contributor(s) and not of MDPI and/or the editor(s). MDPI and/or the editor(s) disclaim responsibility for any injury to people or property resulting from any ideas, methods, instructions or products referred to in the content.

