Article

Lid Driven Triangular and Trapezoidal Cavity Flow: Vortical Structures for Steady Solutions and Hopf Bifurcations

1
School of Aeronautics, Northwestern Polytechnical University, Xi’an 710072, China
2
National Key Laboratory of Science and Technology on Aerodynamic Design and Research, Xi’an 710072, China
3
Key Laboratory of Icing and Anti/De-Icing, China Aerodynamics Research and Development Center, Mianyang 621000, China
4
Fluid Mechanics Department, Universitat Politècnica de Catalunya, 08034 Barcelona, Spain
*
Author to whom correspondence should be addressed.
Appl. Sci. 2023, 13(2), 888; https://doi.org/10.3390/app13020888
Submission received: 2 December 2022 / Revised: 26 December 2022 / Accepted: 5 January 2023 / Published: 9 January 2023

Abstract

:
A numerical study of two dimensional lid-driven triangular and trapezoidal cavity flow is performed via using the lattice Boltzmann method (LBM) for steady solutions. The equilateral and right-angled isosceles triangular cavity flow at Reynolds numbers, respectively, 500 and 100 is employed as the benchmark case for code validation. The isosceles right-angled triangular cavity flow is studied for Reynolds numbers sweeping from 100 to 8100. Flow topologies are captured and analyzed. The critical Reynolds number of Hopf bifurcation is predicted by calculating the perturbation decay rate. Two different geometries of right-angled isosceles trapezoidal cavities, bowl-shaped and pyramid-shaped trapezoids, are studied at Reynolds numbers 1000 and 7000. For each type of the trapezoidal cavity, a geometric parameter λ (top-line/base-line ratio) is presented to distinguish different geometries of trapezoidal cavities. The flow patterns regarding the streamlines, vortical structures, and velocity profiles are discussed. The impact of parameter λ on the fluid characteristics are investigated.

1. Introduction

Two dimensional lid-driven square cavity flow is one of the basic issues of fluid mechanics. Using Navier–Stokes equations, Giha et al. [1] studied two-dimensional lid driven square cavity flow, and fluid was considered as incompressible. Several Reynolds numbers and grid resolutions were considered. A multigrid method for mesh refinement was proposed and tested in their work. Schreiber and Keller [2] investigated as well the incompressible flow inside a square cavity at different Reynolds numbers and grid resolutions. In their research, they employed reliable numerical techniques of high-order accuracy. These two studies [1,2] are frequently used as benchmark cases for steady states. The critical Reynolds number characterizing the boundary between steady and unsteady periodic flow in square cavities was reported at 7500 [3,4], 8000 [5,6,7], and 8000–8300 [8]. Bruneau and Jouron [3] numerically investigated the critical Reynolds number, which was observed at 7500. In another work performed by Bruneau and Saad [7], they employed the Lyapunov exponent at different Reynolds numbers to obtain the critical Reynolds number. They reported a critical Reynolds number of 8000. Via analyzing the phase-space trajectories of velocity v vs. velocity u and the Fourier spectra of velocity u, Peng et al. [4] reported a critical Reynolds number of 7500. Fortin et al. [5] solved the eigenvalues of the Jacobian matrix and obtained a critical Reynolds number of 8000. The same value of the critical Reynolds number was reported by Auteri et al. [6] using a second-order spectral projection method. Using a novel implicit finite volume method combined with the Arnoldi’s one, Sahin and Owens [8] employed linear stability analysis to determine the stability properties. They reported a critical Reynolds number between 8000–8300.
Some of the studies performed on triangular lid driven cavities are [9,10,11,12,13,14,15,16,17,18]. The flow in an equilateral triangular cavity was initially investigated by Ribbens et al. [9]. A set of Reynolds numbers ranging from 1 to 500 were studied. They observed that a finer mesh was needed for simulations with high Reynolds numbers, and reported that using an upwind difference scheme would be desirable for solving higher Reynolds numbers cases. Using a multigrid solution procedure for the Navier–Stokes equations, Jyotsna and Vanka [10] studied the flow inside lid driven isosceles triangular cavities. For code validation they employed a deep triangular cavity with long hypotenuses. Due to the geometry they used, they observed four vortices hierarchically located along the cavity vertical main axis. The vortex located on the top, moved to the right with the Reynolds number increase, and the smaller lower ones remained in the same location. The flow inside a triangular cavity via using finite differences was studied by Li and Tang [11]. Different shapes of triangular cavities, including equilateral and scalene geometries were evaluated. Using finite elements, steady viscous flow in triangular cavities was as well studied by Gaskell et al. [12]. They reported that the secondary recirculations diminished rapidly in size as the stagnant corner angle was increased beyond 40 degrees. Using a very fine mesh, the flow inside lid-driven triangular cavities was investigated by Erturk and Gokcol [13]. The different shapes were tested at Reynolds numbers ranging from 0 to 7500. Mostly due to the small stagnant corner angle, they reported that for an equilateral triangular cavity flow, Batchelor’s mean-square law was not as successful as it was in square or rectangle cavity flows. Steady flow inside a lid-driven isosceles triangular cavity at Reynolds numbers varying from 100 to 780 was studied by González et al. [14]. The top lid moved toward the rectangular corner and in the opposite direction. Experimental and numerical results were performed and compared. Using the popular lattice Boltzmann LBGK-D2Q9 model, Sidik and Munir [15] studied the flow inside lid driven square and triangular cavities. Three different motion conditions and Reynolds numbers between 100 and 10,000 were considered. Code validation was accomplished via comparing their simulations with previous researchers ones. 2D numerical studies of flow inside right-angled isosceles triangular cavities with five cross-sectional aspect ratios Γ , was reported by Ahmed and Kuhlmann [16]. When studding shallow cavities with 0.1 Γ 0.43 the instabilities were elliptic in nature. Three different types of instabilities were observed, two of them were oscillatory. The two instabilities for Γ > 0.43 were identified as centrifugal instabilities. Via employing a spectral collocation method, Jagannathan et al. [17] studied the viscous incompressible flow characteristics inside a lid-driven right-angled isosceles triangular cavity. Three Reynolds numbers, 100, 500, and 1000, were considered. They employed the Chebyshev–Gauss–Lobatto grid and observed that a third-order Adams Bashforth/backward differentiation method was providing good numerical stability, allowing to employ larger time steps. A multigrid algorithm for solving the finite element Navier–Stokes equations at low Reynolds numbers was employed by Gaspar et al. [18] to study the flow in triangular cavities. The efficiency of the multigrid algorithm was proved, yet, due to grid anisotropy a slight deterioration of the convergence factor was observed. Some of the initial studies focused on flow performance inside trapezoidal lid driven cavities are [19,20,21]. Darr and Vanka [19] dicretized the Navier–Stokes equations using the finite-difference method and studied for the first time the flow structure in a trapezoidal cavity. Two cases with different driven conditions were reported, in the first case, the top-line was driven and on the second case, the top and base lines were driven in the same direction. Steady viscous flow in a trapezoidal cavity was studied by McQuain et al. [20]. The vortical structures generated were observed to be highly dependent on the geometry employed. Lid-driven flow in trapezoidal cavities at Reynolds numbers ranging from 100 to 15,000 and using the original 9-bit lattice Boltzmann method, were investigated by Zhang et al. [21]. The top angles were varied from 50 to 90 degrees. For a given Reynolds number and as the top angles increased to a value of around 60 degrees, they reported that the vortex near the bottom wall broke up into two smaller vortices. Regarding the latest investigations on trapezoidal cavity flow [22,23,24,25,26,27,28,29,30,31,32,33,34,35,36], which is the main focus of the present research, it is noticed that nearly all of the recent work is related to the mixed convection [22,23,24,25,26,27,28,29,30,31,32,33,34,35]. Air was employed as working fluid in [22,29,34,35], nanofluids applications are introduced in [23,24,25,27,28,30,31,32], ferrofluids were considered in [26], and non-Newtonian power-law fluids were considered in [33]. Hybrid nanofluid flow with an obstacle inside the domain was as well investigated in [36]. It is observed that, regarding the trapezoidal geometry, there is no research on the vortical structures, topology evolution, transitions, and Hopf bifurcation reported as similar as what has been performed in the present study. The authors believe that this is for the first time to reveal the vortical structures and transitional characteristics of the trapezoidal enclosures.
It should be noticed as well that in authors’ previous investigations [37,38,39,40], the transitional characteristics of the flow inside a right-angled isosceles triangular lid-driven cavity [37] and two-sided wall-driven square cavity [38] were presented. The critical Reynolds numbers for Hopf and Neimark-Sacker bifurcations were presented for each driving condition, as well as the corresponding Reynold numbers for the appearance of chaos. Transitions were analyzed in detail, through flow topologies, phase trajectories, Poincaré map and perturbation decay rate. The chaotic mechanism inside the classic lid-driven and two-sided wall-driven cavity [39] were discussed along with the development of vortical structures. Regarding the flow over square and circular cylinders [39,40], Hopf bifurcation was observed and analyzed. With a splitter plate positioned in front of a square cylinder, both Karman vortex street and Kelvin–Helmholtz instability were captured. The impact of the plate on the flow transitions was discussed for different values of plate thickness, plate position, plate length, and velocity ratios.
In the present paper, steady solutions of right-angled isosceles triangular cavity flow are initially studied, and the critical Reynolds number between steady and unsteady solutions is obtained and discussed. The flow topology evolution as a function of the Reynolds number is visualized through stream functions. The behavior of the dominant primary and secondary vortices are discussed in detail. For the right-angled isosceles trapezoidal enclosures, a geometrical parameter λ (the ratio of the top-line over base-line) is introduced in order to distinguish the different geometries. We investigate the influence of λ on steady solutions at Reynolds numbers 1000 and 7000 for both bowl-shaped and pyramid-shaped trapezoidal cavities. For these cavities and for the different λ studied, the Hopf bifurcation is obtained and presented for the first time. We found that the geometrical parameter λ plays an important role on flow stability. Regardless of the shape of the trapezoidal cavity tested, the flow inside the domain behaves more stable than that in a triangular enclosure. Moreover, the influence mechanism of parameter λ on transitions is concluded for both bowl-shaped and pyramid-shaped trapezoids. The rest of the paper is designed as follows, in Section 2, the framework of the numerical approach is introduced. In Section 3, the code validation is presented. The new results and flow analysis are to be found in Section 4. The conclusions are presented in Section 5.

2. Numerical Approach and Boundary Treatment

The development of LBM has been ongoing for several decades, and numerical studies are covering a wide range of fields. Without any doubts, it has already become a trustworthy approach used in computational fluid mechanics. The discrete lattice Boltzmann–Bhatnagar–Gross–Krook (LBGK) equation is given by
f i ( s + e i Δ t , t + Δ t ) f i ( s , t ) = Ω f i = 1 τ [ f i e q ( s , ξ ) f i ( s , ξ , t ) ]
where i represents the direction of the discrete velocities, f i ( s + e i Δ t , t + Δ t ) and f i ( s , t ) characterize the discrete post- and precollision distribution functions vectors, respectively. Ω f i is the discrete collision operator on i th direction and τ is the relaxation time defined as τ = 3 ν Δ t + 0.5 , where ν = U L R e is the kinematic viscosity and Δ t denotes the time step.
Since the Navier–Stokes equations can be recovered from the discrete lattice Boltzmann equation [41,42], flow density ρ and velocity u can be calculated through distribution functions and defined as
ρ = i f i ρ u = i e i f i
Speaking of LBM, the LBGK D2Q9 model [41] is popular and it is also employed in the present paper. Figure 1 shows the discrete velocities of the LBGK D2Q9 model.
The equilibrium distribution functions, for the 9 discrete velocities, are determined by
f i e q = ω i ρ [ 1 + e i · u C s 2 + ( e i · u ) 2 2 C s 4 u 2 2 C s 2 ] ; i = 0 , 1 , , 8
where ω i represents the weight coefficients, i denotes the direction of discrete velocities, and C s = R T = C 3 is defined as the lattice sound speed.
In order to deal with the straight wall boundary conditions involved in the present numerical simulations, a popular scheme, the nonequilibrium extrapolation scheme [43] is employed, in which the distribution function of each direction f i is classified as the nonequilibrium term f i n e q and the equilibrium term f i e q ; ( f i = f i e q + f i n e q ). Both of these terms are calculated through the formulations presented in [43]. Flow velocity and density are calculated and defined as
u x = U l i d ; u y = 0 ; ρ y = 0 | L i d ; u = 0 ; ρ n = 0 | S t r a i g h t w a l l s ; u = 0 ; ρ = 0.5 ( ρ H + ρ V ) | T i l t e d w a l l s ;
where n is the normal vector perpendicular to the walls. ρ H and ρ V are the first layer fluid points adjacent to the wall boundary nodes, respectively on horizontal and vertical directions.

3. Code Validation

Lid Driven Flow on an Equilateral Triangular Cavity

The lid-driven equilateral and right-angled triangular cavity flows at steady Reynolds numbers 500 and 100, respectively, are chosen as the benchmark cases for code validation. The grid spacing Δ x = 0.001667 is employed in the present work, and notice that in our previous work [37,38], the grid independency test for this grid spacing was performed. It was proved that this grid spacing is sufficient for obtaining trustable steady states.
Figure 2 sketches the streamlines inside an equilateral triangular cavity and a right-angled isosceles triangular cavity, respectively, at steady Reynolds numbers 500 and 100. When comparing Figure 2a with Figure 7d in reference [20], Figure 3 in reference [11] and Figure 2d in reference [13], it can be stated that there is a good agreement between the present prediction and the other three studies [11,13,20]. It is also found that the main vortex gradually moves to the right corner as the Reynolds number increases, which is also confirmed by [13]. Figure 2b describes streamlines predicted in the present study, which has good agreement with Figure 10 in reference [12] and Figure 4a in reference [15]. It is observed that, apart from the main vortex which dominates the entire domain, a small vortex appears at the bottom corner. In fact, according to the work developed by Moffatt [44], and providing the grid spacing was small enough, an infinite series of vortices could be spotted in the bottom stagnant corner.
Table 1 shows the position of the main vortex of each data source. From this table, it is observed that the present study has a good performance regarding the lid-driven equilateral and right-angled isosceles triangular flow.

4. Computational New Results and Analysis

4.1. Right-Angled Isosceles Triangular Cavity

In this section, several new results will be introduced. For each result, a numerical analysis will be followed and discussed on the behalf of fluid characteristics. Figure 3 presents the vortex structure inside a right-angled isosceles triangular cavity as steady Reynolds number increases from 100 to 7000. It is observed that as Reynolds number increases, the main vortex tends to move along the driving direction, which is from left to right. Meanwhile, as Reynolds number increases, the secondary bottom vortex keeps growing and moving toward the left corner, pushing the main vortex toward the right side of the domain. At about Reynolds number 3000, the main vortex has an elongated form, the secondary vortex has become the biggest in size and it is located on the left side of the triangular cavity. Moreover, a third vortex appears at the bottom corner and as Reynolds number keeps increasing from 3000 to 7000, this third vortex grows in size and moves toward the right side of the domain, tending to separate the two previously generated vortices.
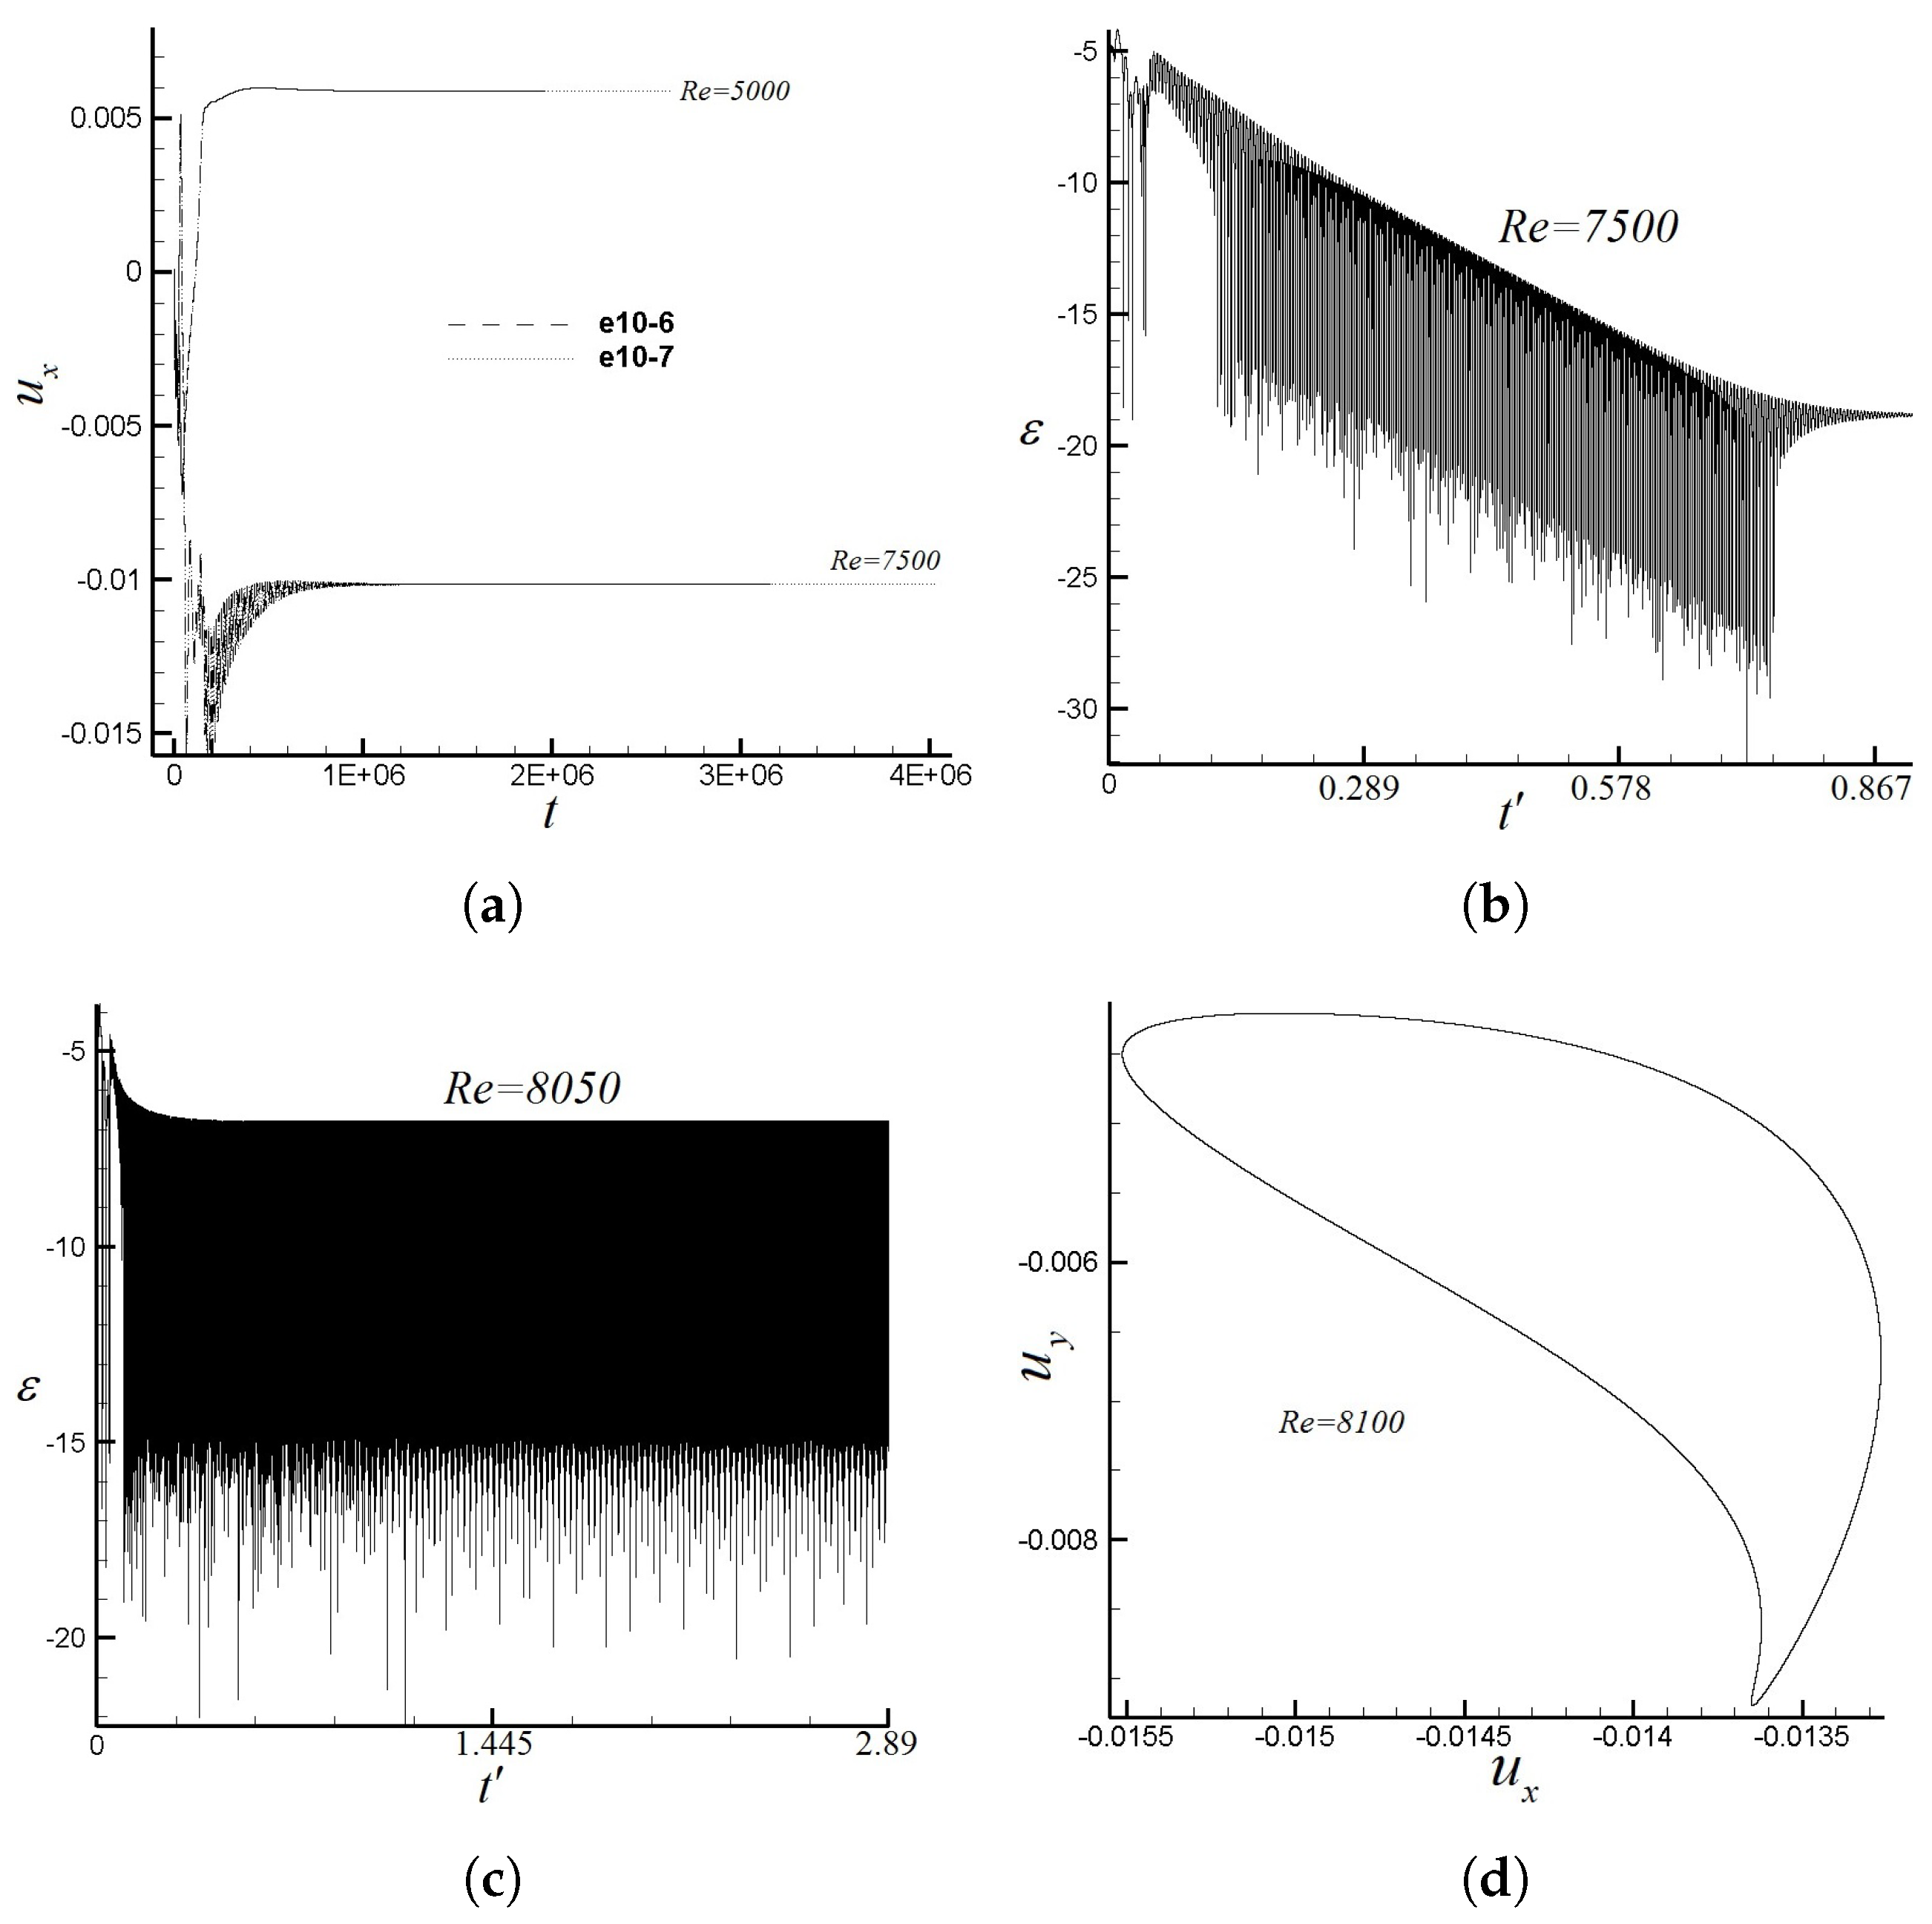
Accompanied by the consistent rising of Reynolds numbers, the flow is changing from steady to unsteady periodic. According to similar studies on a square cavity flow [1,2,3,4,5,6,7,8], the critical Reynolds number of the transitional flow, steady to unsteady periodic, was found around 8000. The same phenomenon is obtained for the present right-angled isosceles triangular cavity. In order to determine the critical Reynolds number between steady and unsteady periodic, it is necessary to address the perturbation decay rate γ , which is the slope of the logarithmic value of perturbation, defined as ϵ = l o g ( | u x U ¯ | ) for each Reynolds number, where U ¯ is the converged value of a steady solution. Figure 4a shows the horizontal velocity history for Reynolds numbers 5000 and 7500 and measured from a probe located at geometric center. As can be seen from Figure 4a, the numerical predictions obtained via using different convergence criteria, 10 6 and 10 7 , are exactly the same. Figure 4b,c describe the perturbation histories at Reynolds numbers 7500 and 8050, respectively. Therefore, it is concluded that the Hopf bifurcation appears at Reynolds numbers between 7500 and 8050. Figure 4d presents the phase map of u x versus u y obtained from the probe planted at the cavity center, which is the cross point of the horizontal and vertical central lines, at a Reynolds number 8100. It is observed that the phase trajectory at Reynolds number 8100 is a closed loop, indicating the flow to this stage in our discussion is already unsteady periodic.
Table 2 shows the perturbation decay rate of each Reynolds number varying from 100 to 8050. t is the physical time for each Reynolds number to obtain a converged solution. S D γ is defined as the standard deviation of perturbation decay rate. As the Reynolds number grows and approaches the value of 8000, γ becomes close to zero, which means the flow inside the enclosure is about to be unsteady. At Reynolds number 8050, γ = 0.0 , further indicating that for the present two-dimensional flow, the critical Reynolds number of Hopf bifurcation ( R e H ) is obtained between the Reynolds number range (7950, 8050).

4.2. Right-Angled Isosceles Trapezoidal Cavity (Bowl Shape)

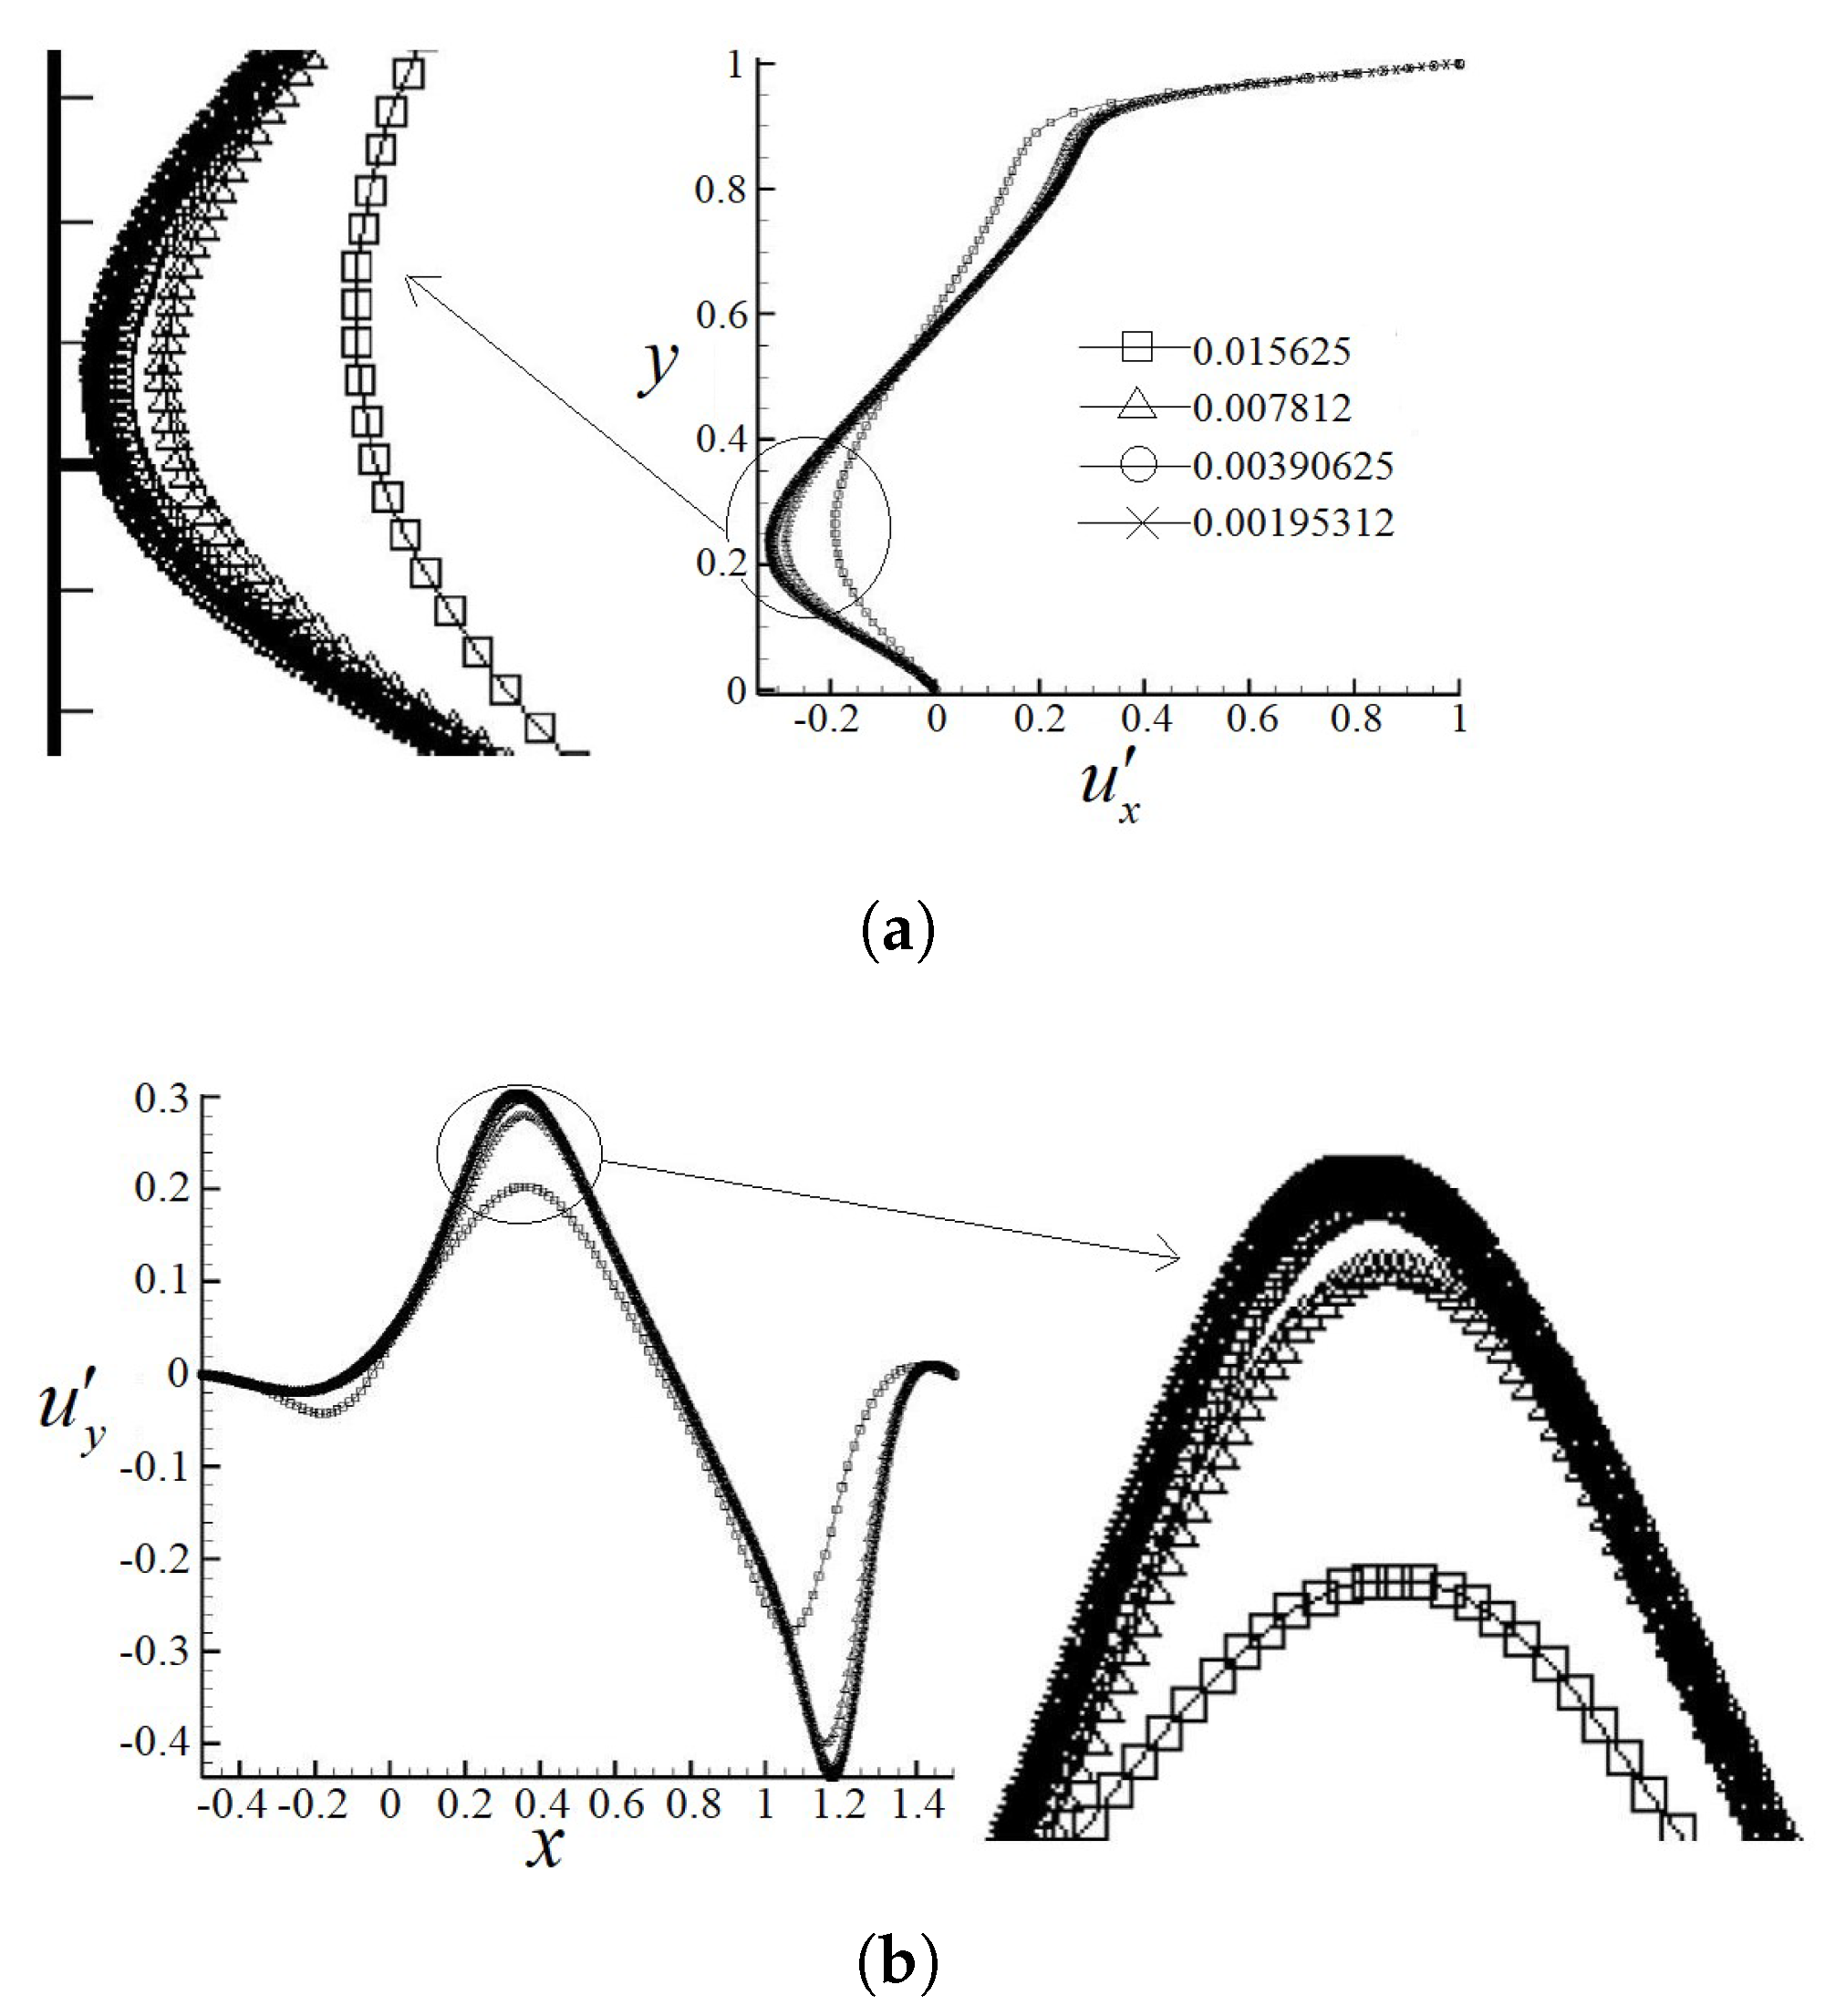
In this subsection, a series of right-angled isosceles trapezoidal enclosures (bowl shape) with different top-line/base-line ratios defined as λ = L t o p / L b a s e are shown in Figure 5. Figure 6 shows the velocity profiles along the vertical and horizontal central lines obtained from different grid resolutions at a steady Reynolds number 1000. The normalized velocity profiles u x = u x / U l i d and u y = u y / U l i d along the vertical and horizontal central lines, respectively, are introduced. It is found that whenever the grid spacing is smaller than 0.00390625, the normalized velocity profiles remain constant, suggesting that a grid spacing of Δ x = 0.001667 is appropriate for steady solutions.
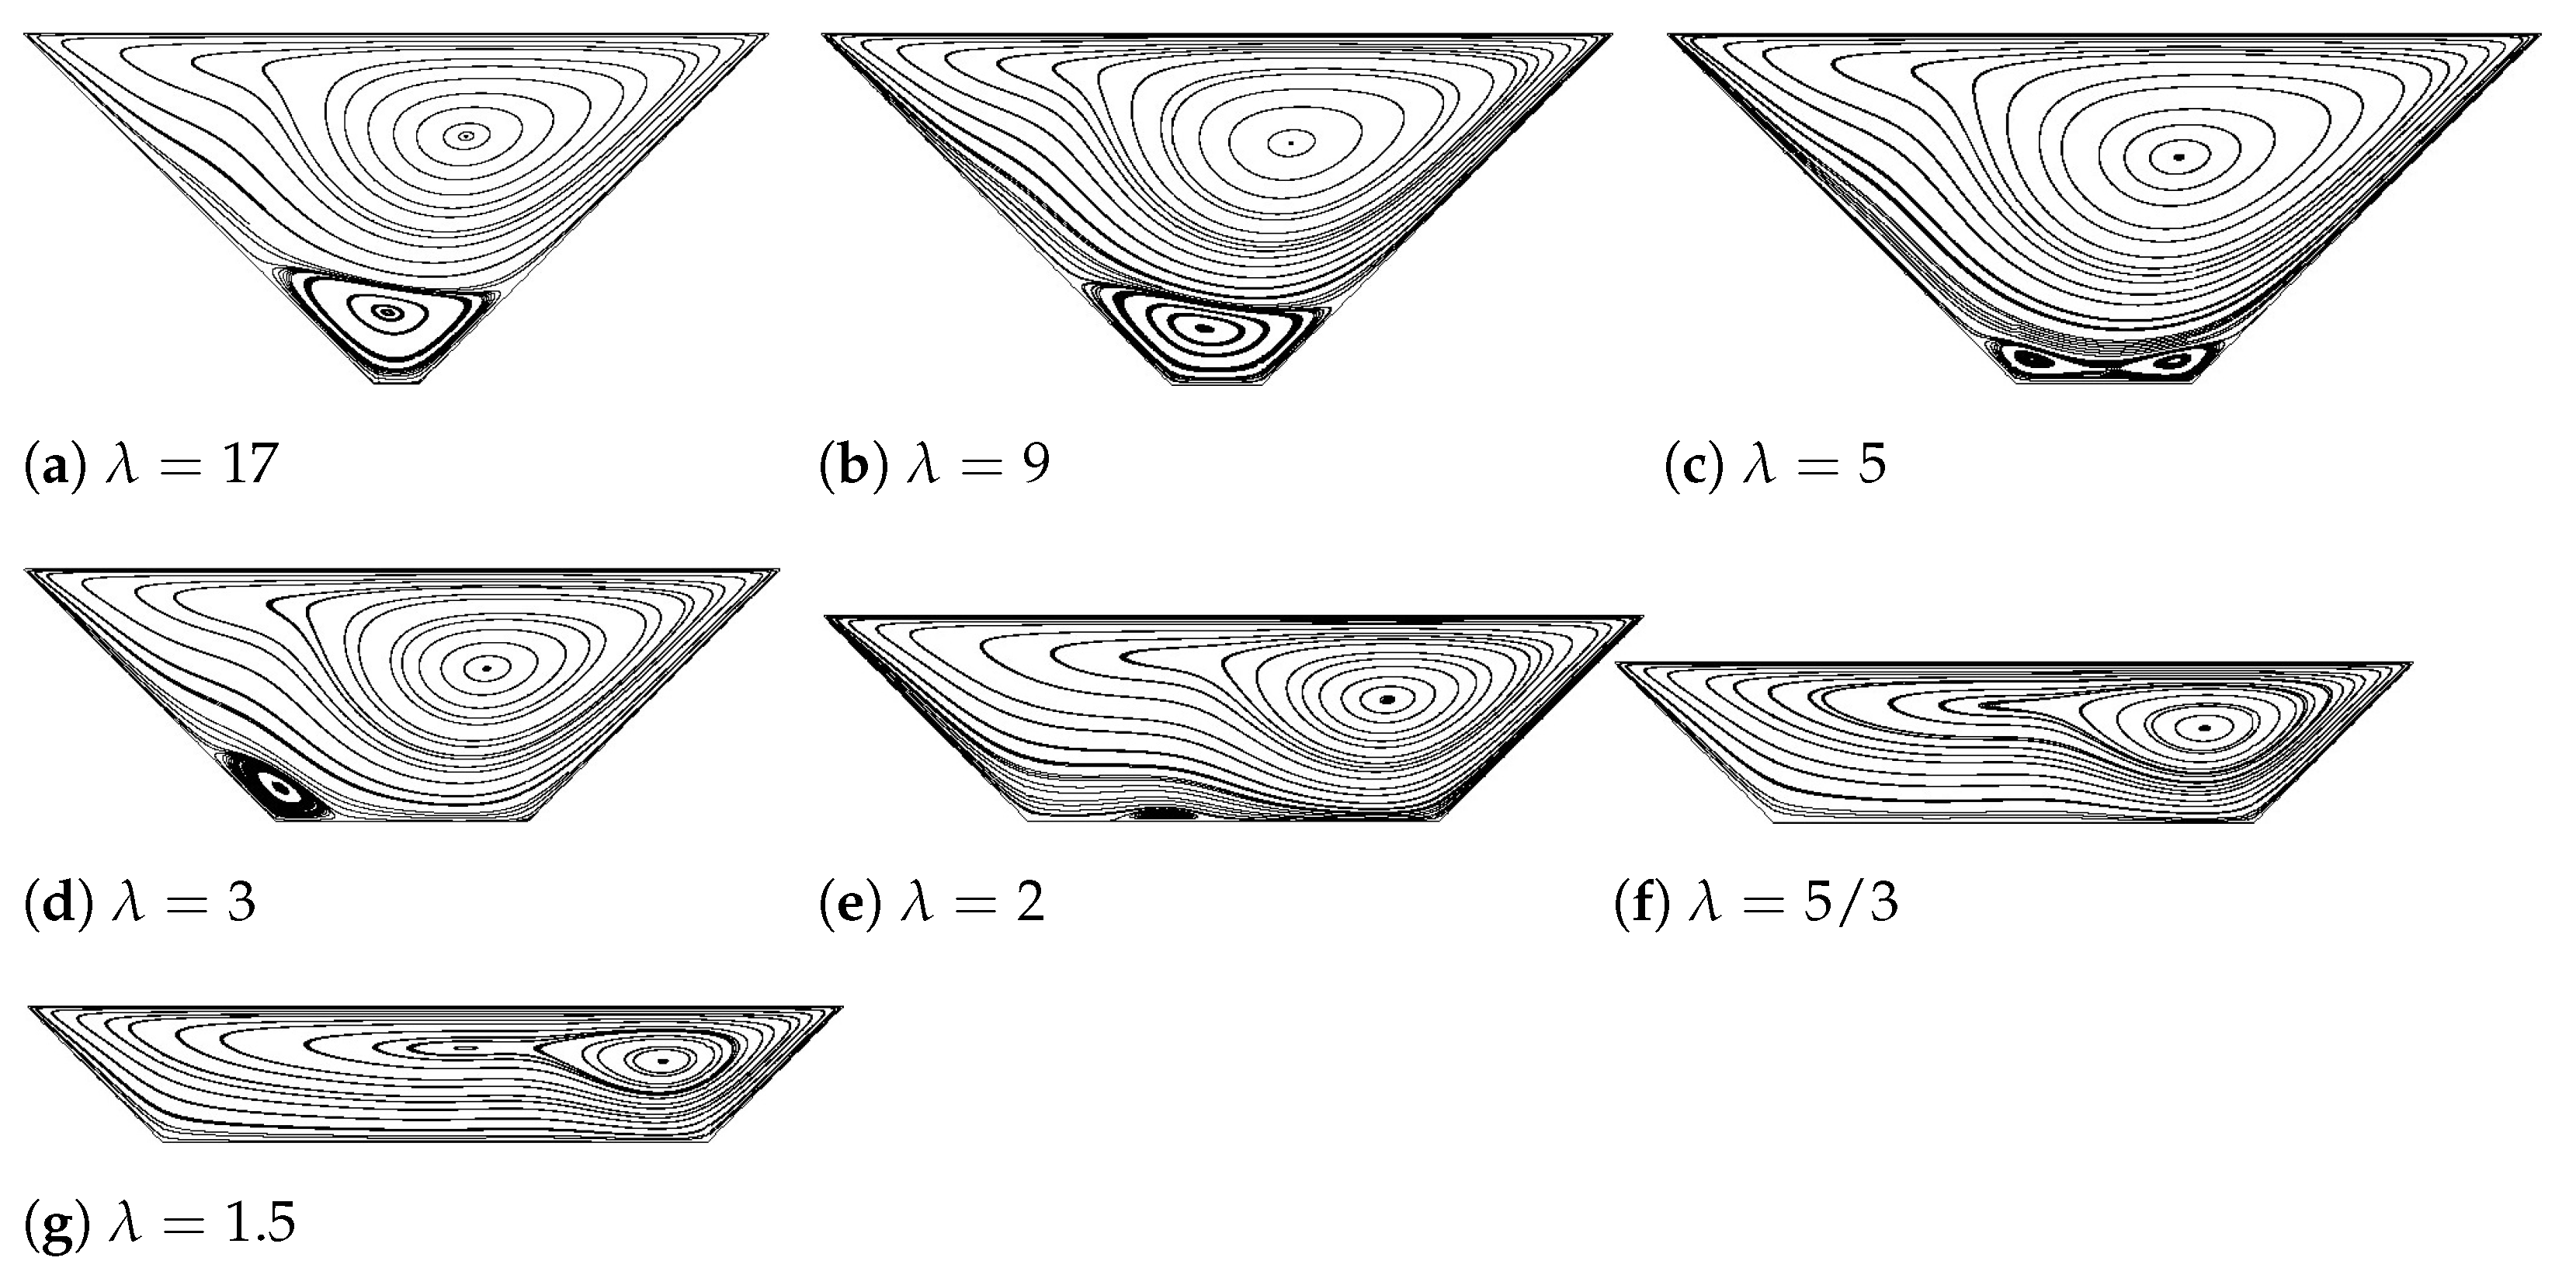
Figure 7 illustrates the streamlines and vortical structures for different geometries of the right-angled isosceles trapezoidal cavities at Reynolds number 1000. It is interesting to realize that the following trend appears in all cavities presented in Figure 7. As λ decreases, the main primary vortex keeps moving toward the positive x axis. Meanwhile, it is noticed that the bottom secondary vortex is compressed gradually whenever the length of the base line is outstretched. When the base line extends to a certain value with λ = 5 , the secondary bottom vortex breaks up, generating two subvortices, located near the right and left corner, respectively. With the further extension of the base line λ = 5 / 3 , these two subvortices keep separating and finally disappear.
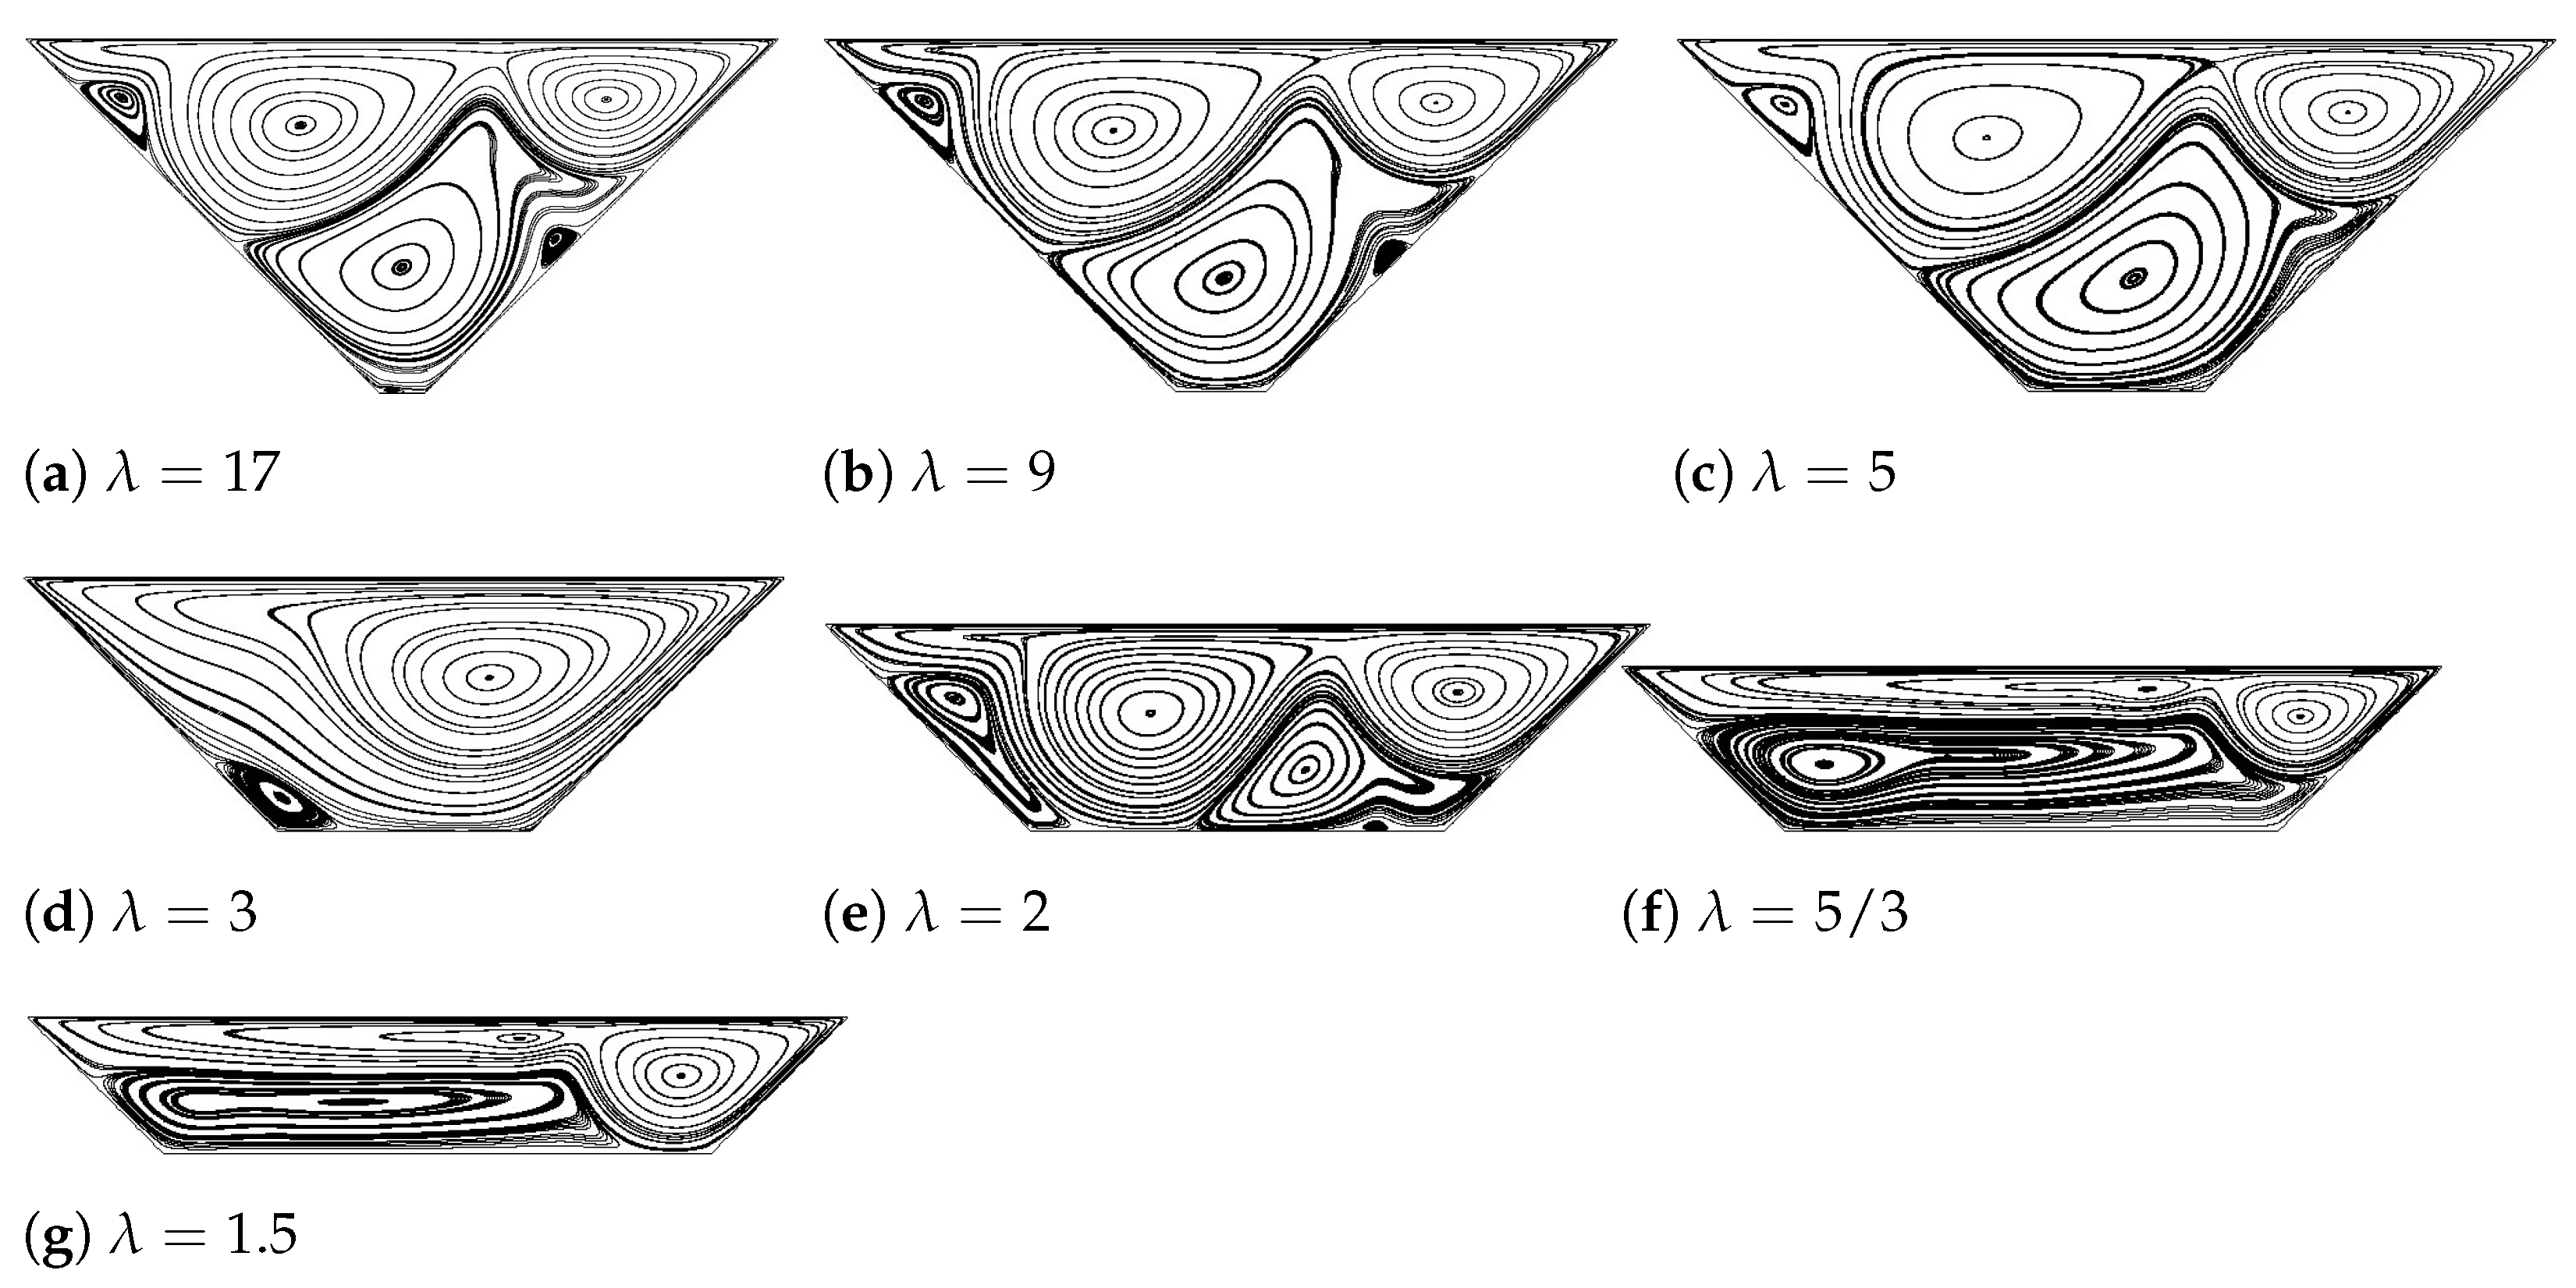
From Figure 8, it is observed that for each value of λ , at R e = 7000 , three main vortices, two negative and one positive, are almost covering the entire flow domain, in all these cases, a fourth much smaller positive vortex appears on the upper left hand side corner. As soon as λ reaches a value of 5/3, the previous existing four vortices collapse and generate two elongated main vortices, a positive and a negative one, which respectively separate the fluid into an upper and lower domain. It is important to realize when comparing Figure 8 with Figure 7 that an increment of Reynolds number promotes the flow complexity inside the domain; this is due to the higher kinetic energy embedded in the fluid. The approximate value of R e H for the bowl-shaped trapezoid is roughly predicted for each value of λ through a similar systematic study of perturbation decay rate presented in Table 2. It is found that when λ 5 , as λ decreases, R e H decreases. Specifically, R e H is around 8300, 8200, and 8000 when λ = 17 , 9 and 5, respectively. However, when λ decreases from 3 to 1.5, R e H keeps increasing from roughly from 18,000 to 24,000. Notice that this phenomenon is similar to authors’ previous research on the transitions inside a lid-driven shallow square cavity, where when the aspect ratio (H/L) was 0.1, R e H was found to be around 19,000, indicating the cavity flow tends to be stable as the enclosure is horizontally elongated.
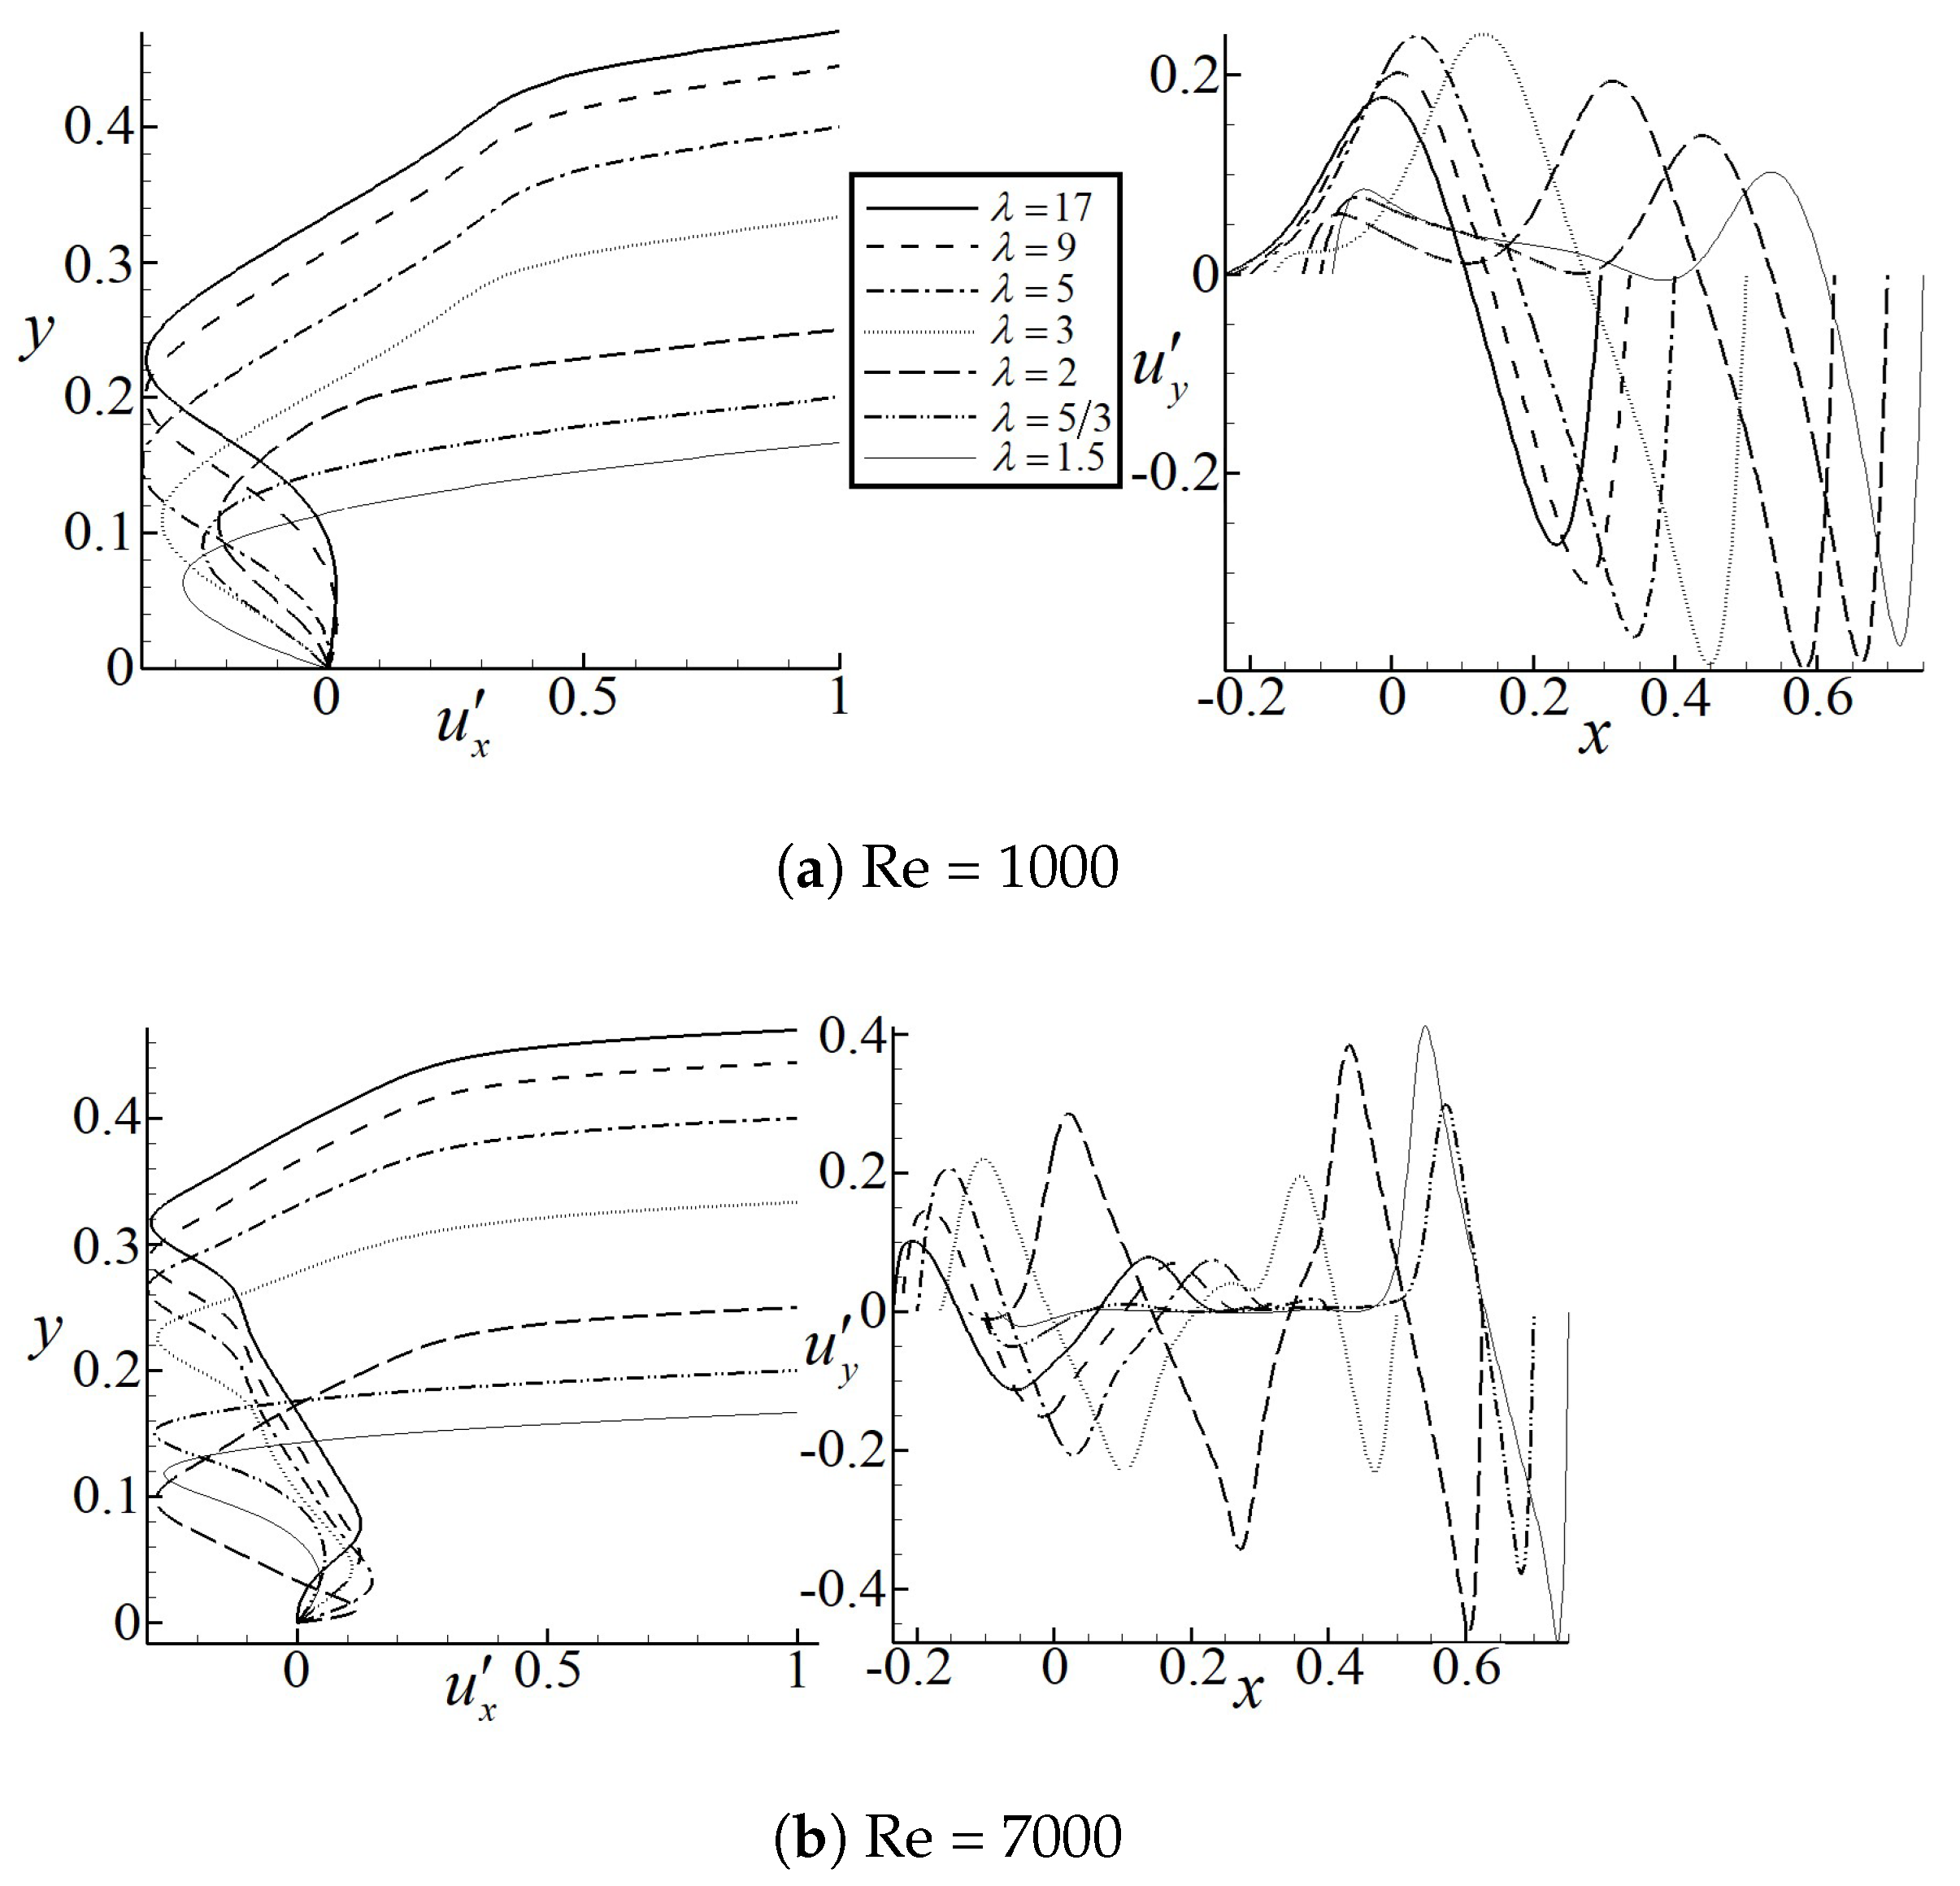
Figure 9 shows the normalized velocity profiles at Reynolds numbers 1000 and 7000 along the vertical and horizontal central lines for all the geometries studied in this case. In Figure 9a, it is introduced the horizontal velocity distribution along the vertical central line. It is observed that as λ decreases, the area percentage in which the negative velocity exist decreases, the negative velocity distribution is more homogenous in these final cases. The maximum negative velocity increases with λ increase. Regarding the vertical velocity along the horizontal central line, it can be seen that as λ decreases the negative vertical velocity tends to increase, showing a clear tendency of vortex turning speed increase. Nevertheless, as the horizontal and vertical lines do not pass through the main vortex center, it seems relevant to evaluate u x and u y velocities at the vortex central axes. When comparing Figure 9a,b, it is found that, regardless of the Reynolds number simulated, the amplitude of horizontal velocity profile almost remains the same for all values of λ . The velocity profiles are much smooth at low Reynolds number 1000 and have more variations for a higher Reynolds number 7000. Considering the vertical velocity profiles, when Reynolds number increases from 1000 to 7000, more oscillations are observed which are caused by the secondary vortical structures. Meanwhile, the amplitude decreases for λ > 2 but increases for λ 2 .
In Table 3 and at steady Reynolds numbers 1000 and 7000, notice that it is characterizing the primary vortex position, and stream function and vorticity at the vortex centre are presented for different values of λ . Whenever λ 2 , the primary vortex position keeps moving toward the x positive axis as λ decreases, vorticity increases and the stream function decreases. It is realized that a vorticity increase involves a primary vortex turning speed increase, and since vorticity and the stream function are linked through the Poisson’s equation, the stream function always presents an opposite effect to vorticity. At Reynolds number 7000, the corresponding results are presented for the upper right hand side vortex. This particular vortex was chosen since fluid movement of the entire domain depends on it. Regarding this particular vortex x position, it is realized that remains almost constant until λ reaches the value of 2. When λ = 5 / 3 , the vortex x position moves toward the right hand side and when λ = 1.5 , which has associated a bigger negative vortex, its central position is slightly being displaced toward the left side. The dominant vortex observed when λ = 1.5 , appears to keep increasing in size until covering the entire domain, this is expected to happen as λ reduces.

4.3. Right-Angled Isosceles Trapezoidal Cavity (Pyramid Shape)

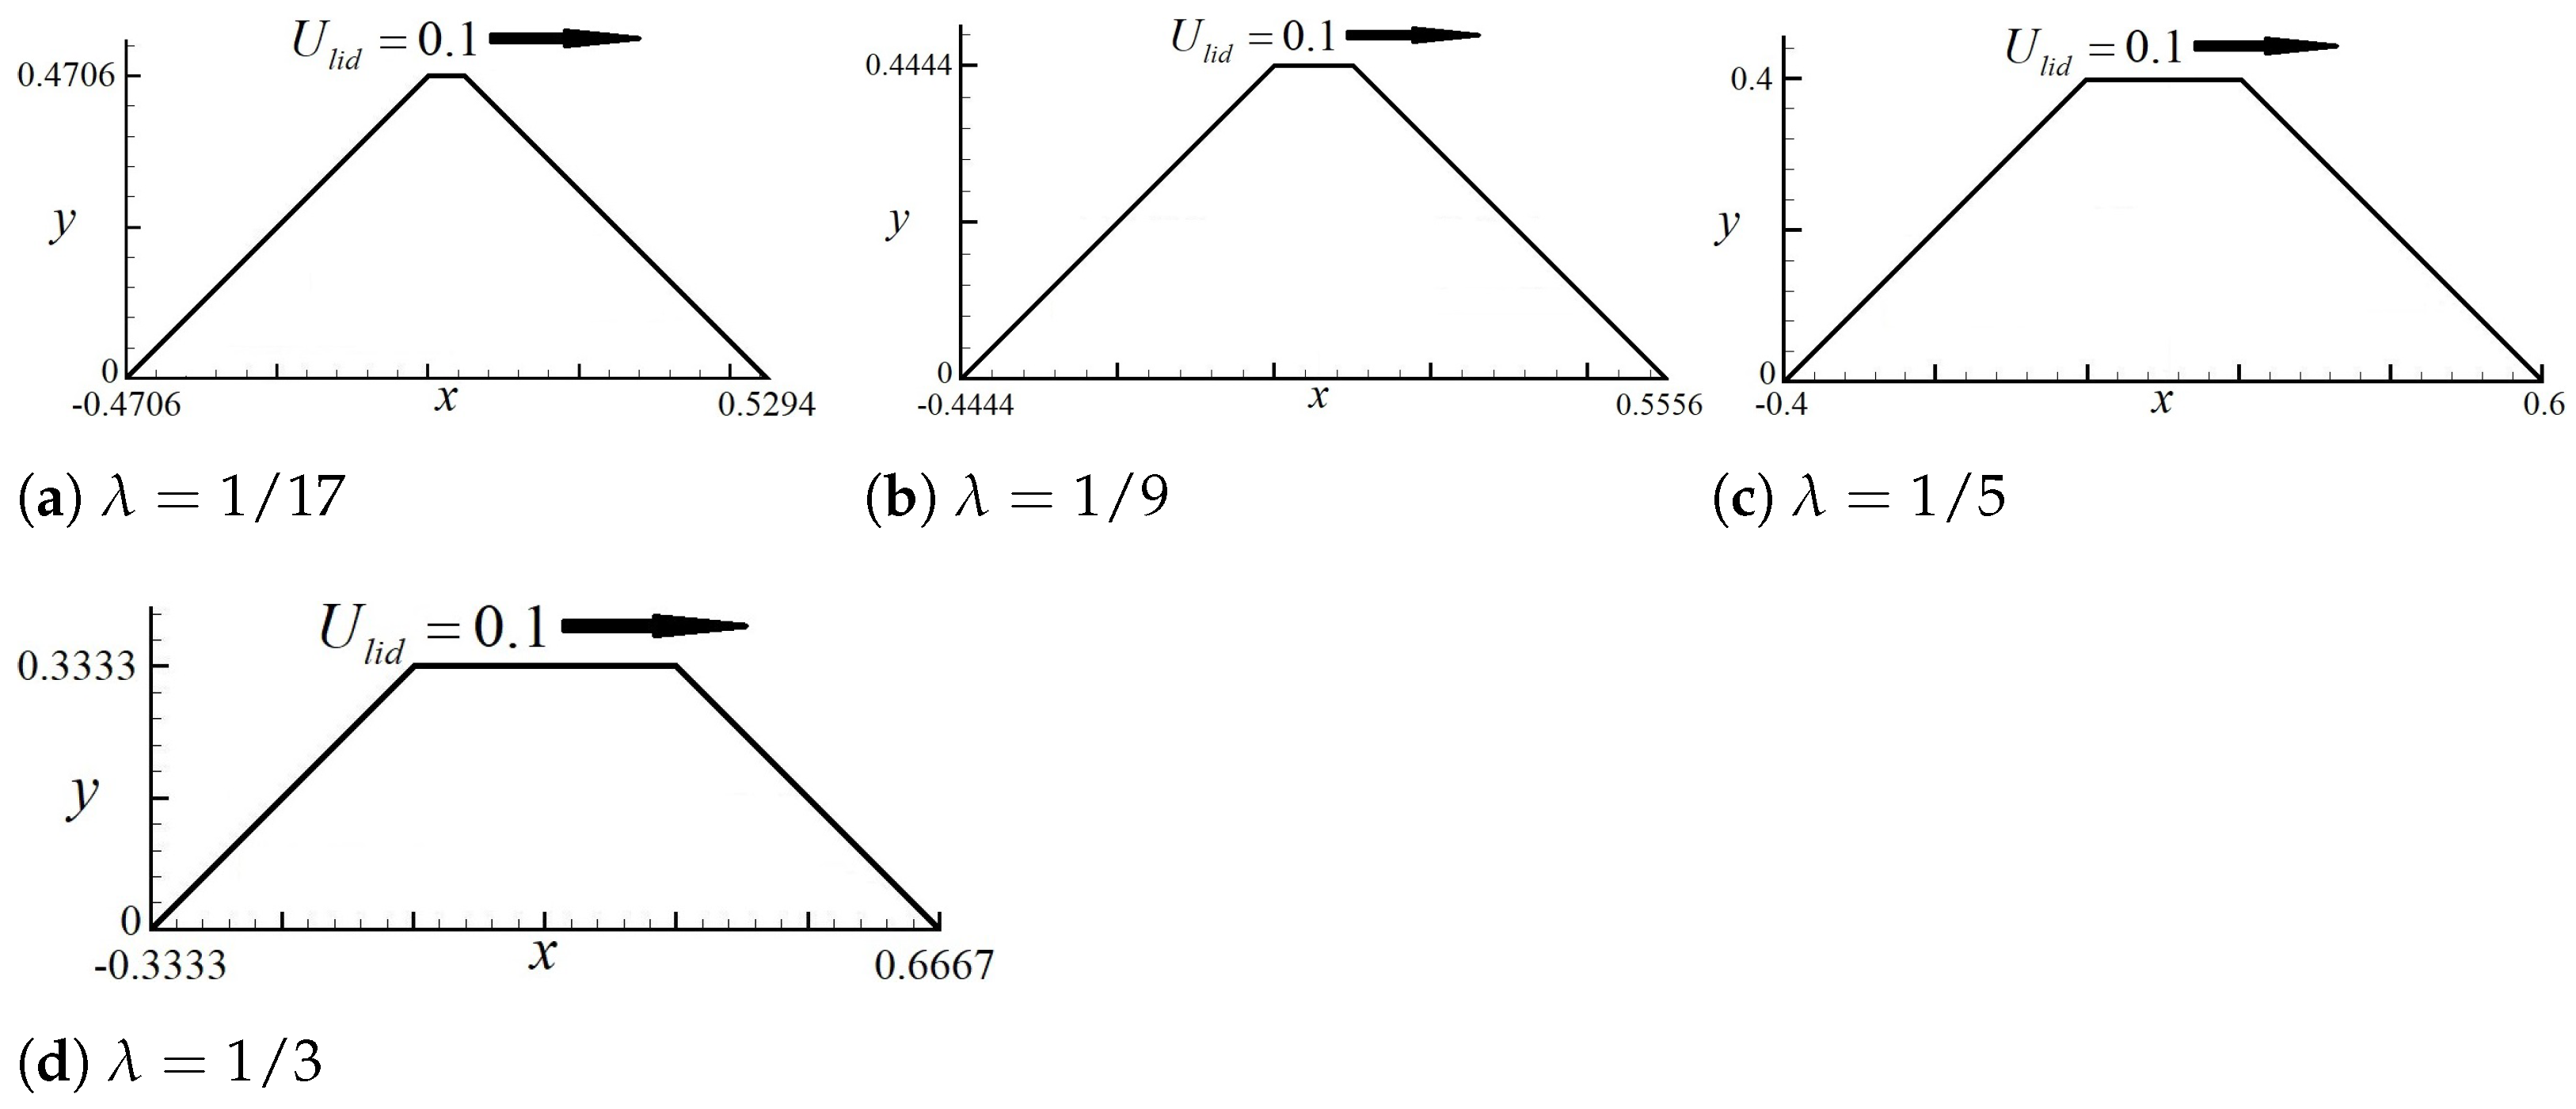
The different studied geometries of the pyramid-shaped right-angled isosceles trapezoidal cavities are presented in Figure 10, where the value of λ sweeps from 1/17 to 1/3.
Figure 11 introduces the streamlines inside each geometry at Reynolds number at 1000. It is found that the changes of configuration has barely an impact on the secondary vortex located near the acute angles. Yet, the primary main vortex changes substantially as λ increases. It is observed that there is an infinite sequence of eddies, four distinct recirculations, adjacent to the sharp stagnant corners, as that proved in Moffatt’s [44] investigation.
For the present pyramid-shaped trapezoidal cavity, the stream lines obtained at Reynolds 7000 are presented in Figure 12. When comparing Figure 12 with Figure 11, it is observed that, as Reynolds number increases, the main vortex located at the geometry center, remains almost circular regardless of the value of λ . Notice that in Figure 12, the main vortex is tending to have a rounded form as λ increases, the number of secondary vortices appearing also suffer an increase. In fact, the original number of vortices, increases to 7 whenever λ is 1/3, indicating that the number of vortices is likely to keep increasing with the increment of Reynolds number. In any case, the infinite series of eddies appearing at the sharp stagnant corners, will remain for all values of λ and Reynolds numbers studied, although observed at a high Reynolds numbers. In the same way, the value of R e H for the pyramid-shaped trapezoid is predicted for each value of λ . It is found that as λ increases, R e H decreases from 23,000 to 17,000, having a huge drop to about 7400 when λ = 1 / 3 . This observation suggests that the flow inside the pyramid-shaped trapezoid with a pointy head (smaller distance of top line) is way more stable than that with a flat (larger distance of top line) head. When λ increases to a certain value ( λ = 1 / 3 ), this strong stability disappears and flow recovers to a normal level of stability. A bit unstable though when compared with the classic lid-driven square cavity flow, at which R e H is around 8000.
Figure 13 introduces the velocity profiles along the vertical and horizontal central lines for different λ configurations. Figure 13a shows that the main vortex turning speed increases with λ increase. The velocity magnitude appears to be rather constant for the two Reynolds numbers studied; this may be due to the fact that in the simulations, the different Reynolds numbers were obtained via maintaining the lid velocity and the geometry, and the fluid viscosity was the changing parameter. Compared with Figure 13a, when Reynolds number increases from 1000 to 7000, for λ < 1 / 3 , the velocity profiles presented in Figure 13b barely changes, which is in good agreement with the observation from flow topologies presented in Figure 12a–c. However, for λ = 1 / 3 , large oscillations of velocity profiles along the axes are observed, which is caused by the secondary vortices shown in Figure 12d. Based on Figure 13a,b, it is further proved that the flow inside a pyramid-shaped trapezoid with a pointy head is quite stable, because as can be seen from the figures, the normalized velocity profiles of u x and u y when λ < 1 / 3 nearly remain the same for both Reynolds numbers 1000 and 7000.
In Table 4, which is focusing on the primary vortex location, stream function and vorticity at the vortex center are presented for different values of λ at steady Reynolds numbers 1000 and 7000. Regarding the main vortex central position, it keeps moving toward the right hand side and towards the bottom of the pyramid as λ increases. In this table, it is also presented the vorticity and stream function at main vortex center, although there is no linear trend the general tendency in vorticity is that it decreases as the distance between the main vortex center and the top lid increases. As previously presented, the relation between the stream function and vorticity is given by the Poisson equation. For Reynolds number 7000, as λ increases, the main vortex center position streams toward the right hand side and toward the bottom. Its vorticity associated keeps increasing with the λ increase. Nevertheless, it has to be highlighted that when λ = 1 / 17 , the main vortex turns anticlockwise while for the rest of the cases, it turns clockwise. This effect is to be explained when understanding the function of the small upper vortex attached to the top lid. Notice that in fact, this vortex has to be regarded as the primary one, then the entire flow domain depends on it.

5. Conclusions

In the present paper, we performed a systematic study on the lid-driven right-angled isosceles triangular and trapezoidal cavity flow for steady solutions. We focused on the vortical structure and vortex evolution inside different geometries. Regarding the triangular chamber, steady solutions at Reynolds numbers from 100 to 8100 are presented and discussed. We found that, at low Reynolds number R e 1000 , the domain is dominated by a large primary vortex with a tiny eddy observed at bottom corner. As Reynolds number increases, this primary vortex is squeezed by the tiny eddy located at the bottom corner and gradually elongates as the bottom eddy grows until it breaks into two secondary vortices. Meanwhile, a series of tiny eddies start to show up adjacent to the corners. Since the previous primary vortex is broken, the domain is now covered by several secondary vortices. By investigating the perturbation decay rate, R e H is obtained at a Reynolds number between 7950 and 8050, at which unsteadiness shows up. Considering the trapezoidal cavity, we designed a geometric parameter λ to distinguish different shapes of the cavity. Simulations are performed at steady Reynolds number 1000 and 7000. For the bowl-shaped trapezoid with λ 2 , as Reynolds number increases from 1000 to 7000, we found a similar trend of flow patterns observed in the triangular cavity, in which the primary vortex is squeezed and finally breaks into secondary vortices. As λ decreases further, it is observed that, regardless of the Reynolds number tested the enclosure is always dominated by primary vortices with large size, no tiny eddies are observed, indicating the trapezoid with smaller value of λ is more stable than that of larger value of λ . The unsteadiness shows up accompanied with the appearance of tiny vortical structures. It is found that as λ decreases from 17 to 5, R e H decreases roughly from 8300 to 8000. However, when λ decreases from 3 to 1.5, R e H keeps increasing from roughly from 18,000 to 24,000, indicating the cavity flow tends to be incredibly stable as the enclosure is horizontally elongated. As to the pyramid-shaped trapezoid, regardless of the Reynolds number tested, the Moffatt’s phenomenon is obviously observed around corners and the domain is always dominated by the primary central vortex. We found that when λ 1 / 5 , the vortical structures remains barely the same when Reynolds number increases from 1000 to 7000, indicating the flow is quite stable. This is further observed by studying the perturbation decay rate, we discovered that the critical Reynolds number of Hopf bifurcation for λ 1 / 5 , is around 20,000, much bigger than that of the triangular or square cavity flow. When λ increases to 1 / 3 , as Reynolds number increases from 1000 to 7000, we can observe a series of secondary vortices and small scale eddies. It is found that as λ increases, R e H decreases from 23,000 to 17,000, having a huge drop to about 7400 when λ = 1 / 3 . This observation suggests that the flow inside the pyramid-shaped trapezoid with a pointy head (smaller distance of top line) is way more stable than that with a flat (larger distance of top line) head. When λ increases to a certain value ( λ = 1 / 3 ) , this strong stability disappears and flow recovers to a normal level of stability.

Author Contributions

Conceptualization, all; methodology, all; software, B.A.; validation, B.A. and S.G.; formal analysis, B.A. and S.G.; investigation, all; data curation, B.A. and S.G.; writing—original draft preparation, B.A. and J.M.B.; writing—review and editing, J.M.B. and B.A.; visualization, B.A. and S.G.; supervision, J.M.B. and B.A.; project administration, J.M.B. and B.A. All authors have read and agreed to the published version of the manuscript.

Funding

This work was sponsored by the foundation of National Key Laboratory of Science and Technology on Aerodynamic Design and Research (No. 614220121030101) and Key Laboratory of Icing and Anti/De-icing of CARDC (Grant No. IADL20210302).

Institutional Review Board Statement

Not applicable.

Informed Consent Statement

Not applicable.

Data Availability Statement

Not applicable.

Conflicts of Interest

The authors declare no conflict of interest.

Nomenclature

C s Lattice sound speed
CLattice velocity
e i Unit velocities vector along discrete directions
f i ( s , t ) Precollision distribution functions
f i ( s + e i Δ t , t + Δ t ) Postcollision distribution functions
f i e q The discrete equilibrium distribution functions
f i n e q The discrete nonequilibrium distribution functions
LCharacteristic length
n Normal vector perpendicular to the walls
R e Reynolds number
S D γ Standard deviation of perturbation decay rate
sSpatial position vector
tIteration steps
t Physical computational time
λ Aspect ratio of the top line over the base line
u Velocity
U l i d Lid-driven velocity
U ¯ Converged solution
u x Horizontal component of velocity
u y Vertical component of velocity
u x Unitized horizontal component of velocity
u y Unitized vertical component of velocity
iDiscrete directions
Δ x                               Grid spacing
Δ t Time step
γ Perturbation decay rate
ϵ Perturbation
ρ Density
φ Stream function
ζ Vorticity
ξ Velocity vector
τ Single relaxation time term
ω i Weight coefficient
Ω f i Discrete collision operator

References

  1. Ghia, U.; Ghia, K.N.; Shin, C. High-Re solutions for incompressible flow using the Navier-Stokes equations and a multigrid method. J. Comput. Phys. 1982, 48, 387–411. [Google Scholar] [CrossRef]
  2. Schreiber, R.; Keller, H.B. Driven cavity flows by efficient numerical techniques. J. Comput. Phys. 1983, 49, 310–333. [Google Scholar] [CrossRef]
  3. Bruneau, C.H.; Jouron, C. An efficient scheme for solving steady incompressible Navier-Stokes equations. J. Comput. Phys. 1990, 89, 389–413. [Google Scholar] [CrossRef]
  4. Peng, Y.F.; Shiau, Y.H.; Hwang, R.R. Transition in a 2-D lid-driven cavity flow. Comput. Fluids 2003, 32, 337–352. [Google Scholar] [CrossRef]
  5. Fortin, A.; Jardak, M.; Gervais, J.; Pierre, R. Localization of Hopf bifurcations in fluid flow problems. Int. J. Numer. Methods Fluids 1997, 24, 1185–1210. [Google Scholar] [CrossRef]
  6. Auteri, F.; Parolini, N.; Quartapelle, L. Numerical investigation on the stability of singular driven cavity flow. J. Comput. Phys. 2002, 183, 1–25. [Google Scholar] [CrossRef]
  7. Bruneau, C.H.; Saad, M. The 2D lid-driven cavity problem revisited. Comput. Fluids 2006, 35, 326–348. [Google Scholar] [CrossRef]
  8. Sahin, M.; Owens, R.G. A novel fully implicit finite volume method applied to the lid-driven cavity problem—Part I: High Reynolds number flow calculations. Int. J. Numer. Methods Fluids 2003, 42, 57–77. [Google Scholar] [CrossRef]
  9. Ribbens, C.J.; Watson, L.T.; Wang, C.Y. Steady viscous flow in a triangular cavity. J. Comput. Phys. 1994, 112, 173–181. [Google Scholar] [CrossRef] [Green Version]
  10. Jyotsna, R.; Vanka, S. Multigrid calculation of steady, viscous flow in a triangular cavity. J. Comput. Phys. 1995, 122, 107–117. [Google Scholar] [CrossRef]
  11. Li, M.; Tang, T. Steady viscous flow in a triangular cavity by efficient numerical techniques. Comput. Math. Appl. 1996, 31, 55–65. [Google Scholar] [CrossRef] [Green Version]
  12. Gaskell, P.; Thompson, H.; Savage, M. A finite element analysis of steady viscous flow in triangular cavities. Proc. Inst. Mech. Eng. Part C J. Mech. Eng. Sci. 1999, 213, 263–276. [Google Scholar] [CrossRef]
  13. Erturk, E.; Gokcol, O. Fine grid numerical solutions of triangular cavity flow. Eur. Phys. J.-Appl. Phys. 2007, 38, 97–105. [Google Scholar] [CrossRef] [Green Version]
  14. Gonzalez, L.; Ahmed, M.; Kühnen, J.; Kuhlmann, H.C.; Theofilis, V. Three-dimensional flow instability in a lid-driven isosceles triangular cavity. J. Fluid Mech. 2011, 675, 369–396. [Google Scholar] [CrossRef] [Green Version]
  15. Sidik, N.A.C.; Munir, F.A. Mesoscale numerical prediction of fluid flow in a shear driven cavity. Arab. J. Sci. Eng. 2012, 37, 1723–1735. [Google Scholar] [CrossRef]
  16. Ahmed, M.; Kuhlmann, H.C. Flow instability in triangular lid-driven cavities with wall motion away from a rectangular corner. Fluid Dyn. Res. 2012, 44, 025501. [Google Scholar] [CrossRef]
  17. Jagannathan, A.; Mohan, R.; Dhanak, M. A spectral method for the triangular cavity flow. Comput. Fluids 2014, 95, 40–48. [Google Scholar] [CrossRef]
  18. Gaspar, F.; Rodrigo, C.; Heidenreich, E. Geometric multigrid methods on structured triangular grids for incompressible navier-stokes equations at low reynolds numbers. Int. J. Numer. Anal. Model. 2014, 11, 400–411. [Google Scholar]
  19. Darr, J.H.; Vanka, S. Separated flow in a driven trapezoidal cavity. Phys. Fluids A Fluid Dyn. 1991, 3, 385–392. [Google Scholar] [CrossRef]
  20. McQuain, W.D.; Ribbens, C.J.; Wang, C.Y.; Watson, L.T. Steady viscous flow in a trapezoidal cavity. Comput. Fluids 1994, 23, 613–626. [Google Scholar] [CrossRef] [Green Version]
  21. Zhang, T.; Shi, B.; Chai, Z. Lattice Boltzmann simulation of lid-driven flow in trapezoidal cavities. Comput. Fluids 2010, 39, 1977–1989. [Google Scholar] [CrossRef]
  22. Ismael, M.A.; Chamkha, A.J. Mixed convection in lid-driven trapezoidal cavities with an aiding or opposing side wall. Numer. Heat Transf. Part A Appl. 2015, 68, 312–335. [Google Scholar] [CrossRef]
  23. Kareem, A.K.; Mohammed, H.; Hussein, A.K.; Gao, S. Numerical investigation of mixed convection heat transfer of nanofluids in a lid-driven trapezoidal cavity. Int. Commun. Heat Mass Transf. 2016, 77, 195–205. [Google Scholar] [CrossRef] [Green Version]
  24. Rashad, A.; Sivasankaran, S.; Mansour, M.; Bhuvaneswari, M. Magneto-convection of nanofluids in a lid-driven trapezoidal cavity with internal heat generation and discrete heating. Numer. Heat Transf. Part A Appl. 2017, 71, 1223–1234. [Google Scholar] [CrossRef]
  25. Selimefendigil, F.; Öztop, H.F. Modeling and optimization of MHD mixed convection in a lid-driven trapezoidal cavity filled with alumina–water nanofluid: Effects of electrical conductivity models. Int. J. Mech. Sci. 2018, 136, 264–278. [Google Scholar] [CrossRef]
  26. Mehmood, Z. Numerical simulations and linear stability analysis of mixed thermomagnetic convection through two lid-driven entrapped trapezoidal cavities enclosing ferrofluid saturated porous medium. Int. Commun. Heat Mass Transf. 2019, 109, 104345. [Google Scholar] [CrossRef]
  27. Chamkha, A.J.; Selimefendigil, F.; Oztop, H.F. Pulsating flow of CNT–water nanofluid mixed convection in a vented trapezoidal cavity with an inner conductive T-shaped object and magnetic field effects. Energies 2020, 13, 848. [Google Scholar] [CrossRef] [Green Version]
  28. Toghraie, D. Numerical simulation on MHD mixed convection of Cu-water nanofluid in a trapezoidal lid-driven cavity. Int. J. Appl. Electromagn. Mech. 2020, 62, 683–710. [Google Scholar] [CrossRef]
  29. Mondal, P.; Mahapatra, T.R. Minimization of entropy generation due to MHD double diffusive mixed convection in a lid driven trapezoidal cavity with various aspect ratios. Nonlinear Anal. Model. Control 2020, 25, 545–563. [Google Scholar] [CrossRef]
  30. Ali, F.H.; Hamzah, H.K.; Hussein, A.K.; Jabbar, M.Y.; Talebizadehsardari, P. MHD mixed convection due to a rotating circular cylinder in a trapezoidal enclosure filled with a nanofluid saturated with a porous media. Int. J. Mech. Sci. 2020, 181, 105688. [Google Scholar] [CrossRef]
  31. Alshuraiaan, B.; Pop, I. Numerical simulation of mixed convection in a lid-driven trapezoidal cavity with flexible bottom wall and filled with a hybrid nanofluid. Eur. Phys. J. Plus 2021, 136, 580. [Google Scholar] [CrossRef]
  32. Ishak, M.S.; Alsabery, A.I.; Hashim, I.; Chamkha, A.J. Entropy production and mixed convection within trapezoidal cavity having nanofluids and localised solid cylinder. Sci. Rep. 2021, 11, 14700. [Google Scholar] [CrossRef] [PubMed]
  33. Prince, H.A.; Redwan, D.A.; Rozin, E.H.; Saha, S.; Mamun, M.A.H. Augmentation of Pure Mixed Convection Heat Transfer in a Non-Newtonian Power-Law Fluid Filled Lid-Driven Trapezoidal Cavity With Double Rotating Cylinders. J. Heat Transf. 2021, 143, 082601. [Google Scholar] [CrossRef]
  34. Shah, S.S.; Haq, R.U.; Al-Kouz, W. Mixed convection analysis in a split lid-driven trapezoidal cavity having elliptic shaped obstacle. Int. Commun. Heat Mass Transf. 2021, 126, 105448. [Google Scholar] [CrossRef]
  35. Mebarek-Oudina, F.; Laouira, H.; Hussein, A.K.; Omri, M.; Abderrahmane, A.; Kolsi, L.; Biswal, U. Mixed Convection inside a Duct with an Open Trapezoidal Cavity Equipped with Two Discrete Heat Sources and Moving Walls. Mathematics 2022, 10, 929. [Google Scholar] [CrossRef]
  36. Khan, Z.; Khan, W.; Qasim, M.; Alharbi, S.; Hamid, M.; Du, M. Hybrid nanofluid flow around a triangular-shaped obstacle inside a split lid-driven trapezoidal cavity. Eur. Phys. J. Spec. Top. 2022, 231, 2749–2759. [Google Scholar] [CrossRef]
  37. An, B.; Bergada, J.; Mellibovsky, F. The lid-driven right-angled isosceles triangular cavity flow. J. Fluid Mech. 2019, 875, 476–519. [Google Scholar] [CrossRef]
  38. Bo, A.; Mellibovsky, F.; Bergadà, J.; Sang, W. Towards a better understanding of wall-driven square cavity flows using the lattice Boltzmann method. Appl. Math. Model. 2020, 82, 469–486. [Google Scholar]
  39. An, B.; Bergadà, J.M.; Mellibovsky, F.; Sang, W. New applications of numerical simulation based on lattice Boltzmann method at high Reynolds numbers. Comput. Math. Appl. 2020, 79, 1718–1741. [Google Scholar] [CrossRef]
  40. An, B.; Bergadà, J.; Mellibovsky, F.; Sang, W.; Xi, C. Numerical investigation on the flow around a square cylinder with an upstream splitter plate at low Reynolds numbers. Meccanica 2020, 55, 1037–1059. [Google Scholar] [CrossRef]
  41. Qian, Y.H.; d’Humières, D.; Lallemand, P. Lattice BGK models for Navier-Stokes equation. Europhys. Lett. 1992, 17, 479. [Google Scholar] [CrossRef]
  42. Guo, Z.; Shi, B.; Wang, N. Lattice BGK model for incompressible Navier–Stokes equation. J. Comput. Phys. 2000, 165, 288–306. [Google Scholar] [CrossRef]
  43. Guo, Z.; Zheng, C.; Shi, B. Non-equilibrium extrapolation method for velocity and pressure boundary conditions in the lattice Boltzmann method. Chin. Phys. 2002, 11, 366. [Google Scholar]
  44. Moffatt, H.K. Viscous and resistive eddies near a sharp corner. J. Fluid Mech. 1964, 18, 1–18. [Google Scholar] [CrossRef]
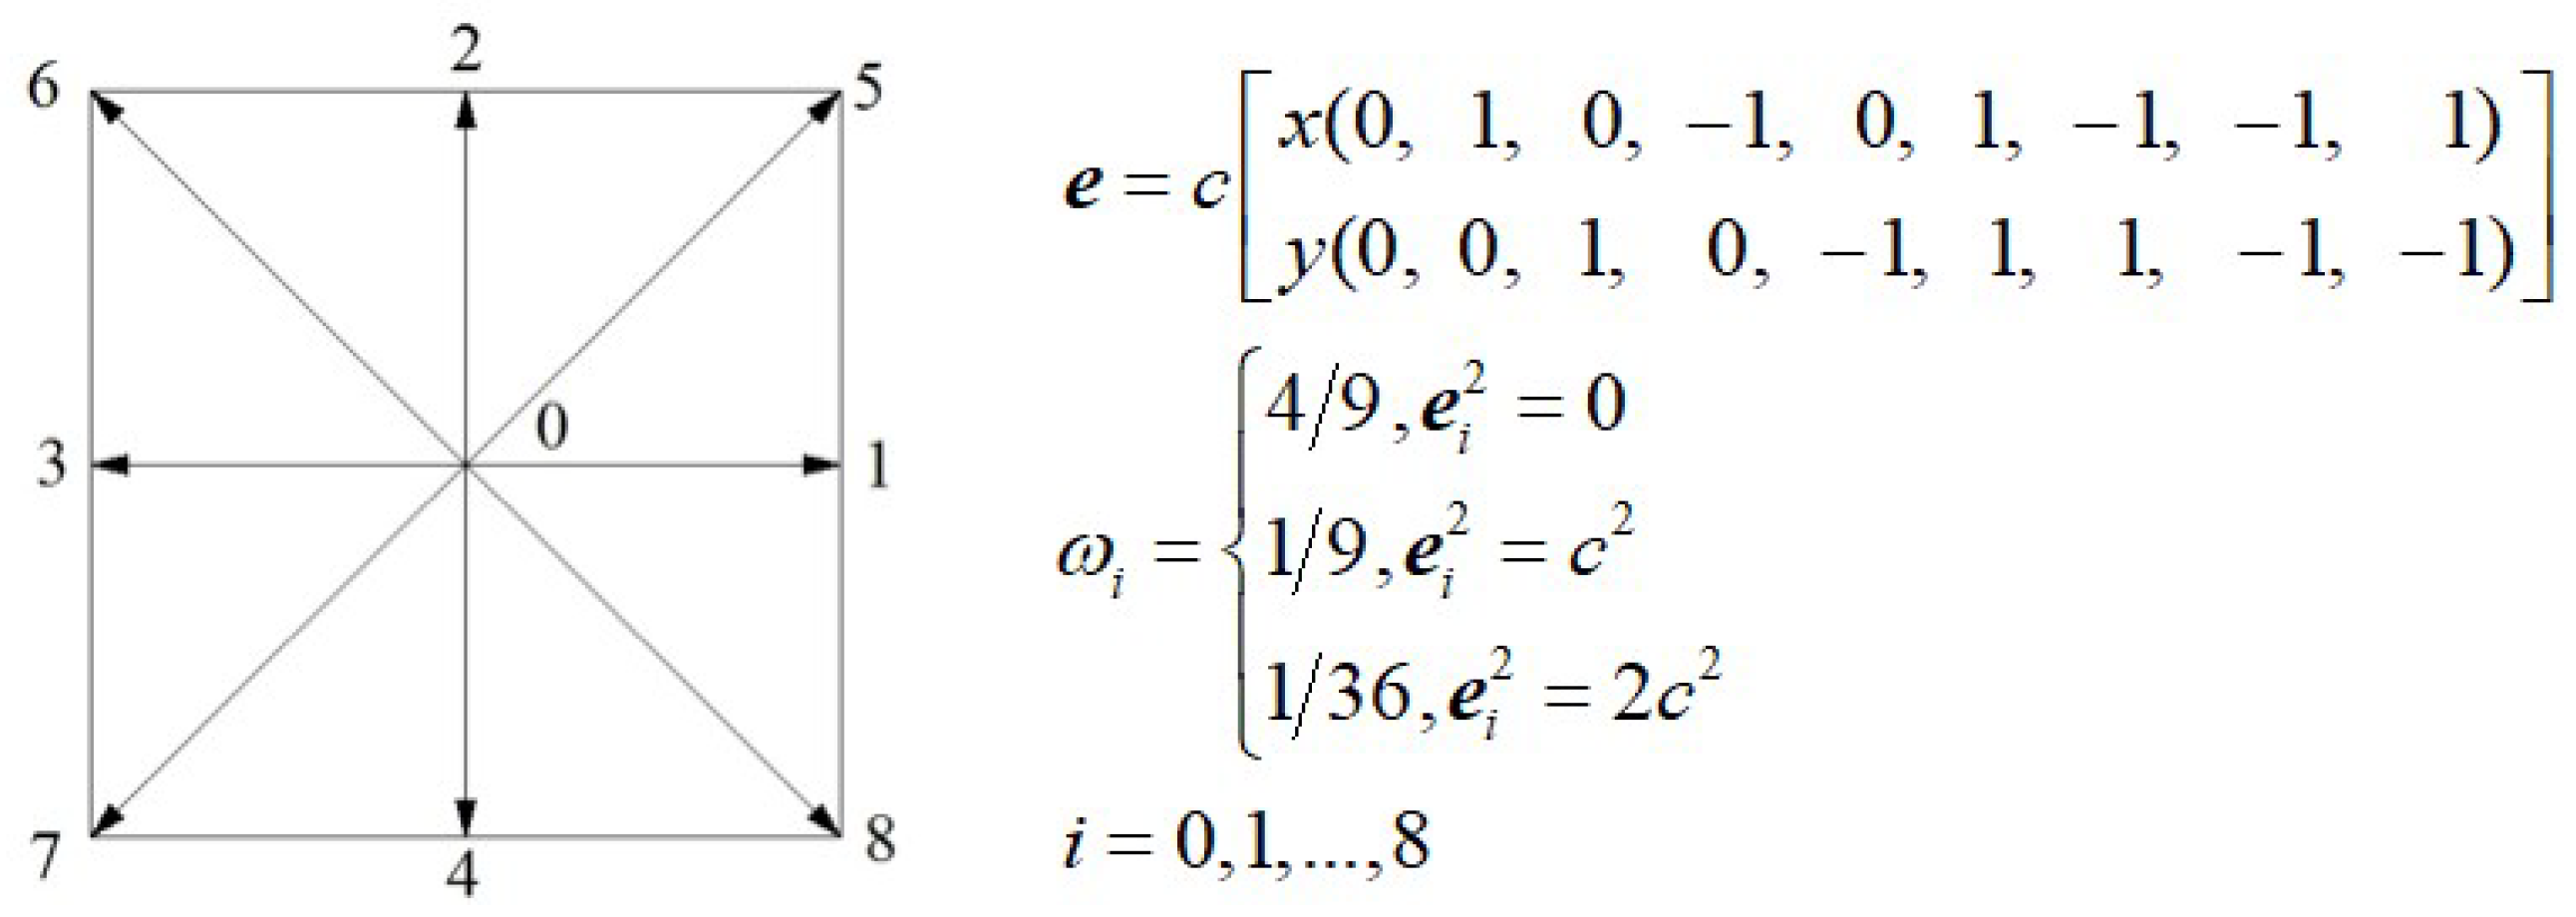
Figure 1. Discrete velocities of lattice Boltzmann D2Q9 model, where c = Δ x Δ t = 1 is the lattice velocity, and Δ x , Δ t are lattice grid spacing and time step, respectively.
Applsci 13 00888 g001
Figure 2. (a) Streamlines in the equilateral triangular cavity at R e = 500 . (b) Streamlines in the right-angled isosceles triangular cavity at R e = 100 .
Applsci 13 00888 g002
Figure 3. Steady solutions, streamlines describe vortical structures inside the right-angled isosceles triangular cavity at different Reynolds numbers, ranging from 100 to 7000.
Applsci 13 00888 g003
Figure 4. Velocity component u x versus iteration steps t. (a) Steady solutions at R e = 5000 and R e = 7500 . (b) Logarithmic value of perturbation at R e = 7500 . (c) Logarithmic value of perturbation at R e = 8050 . (d) Phase map of u x versus u y at a periodic Reynolds number 8100.
Applsci 13 00888 g004
Figure 5. Different geometries of right-angled isosceles trapezoidal cavity with the long topline driven.
Applsci 13 00888 g005
Figure 6. Velocity profiles along the vertical (a) and horizontal (b) central lines with different resolutions.
Applsci 13 00888 g006
Figure 7. Streamlines inside the bowl-shaped trapezoid with various values of λ at R e = 1000 .
Applsci 13 00888 g007
Figure 8. Streamlines inside the bowl-shaped trapezoid with various values of λ at R e = 7000 .
Applsci 13 00888 g008
Figure 9. Normalized velocity profiles along the vertical and horizontal central lines for different values of λ .
Applsci 13 00888 g009
Figure 10. Different geometries of pyramid-shaped right-angled isosceles trapezoidal cavities.
Applsci 13 00888 g010
Figure 11. Streamlines inside the pyramid-shaped trapezoid with various values of λ at Re = 1000.
Applsci 13 00888 g011
Figure 12. Streamlines inside the pyramid-shaped trapezoid with various values of λ at Re = 7000.
Applsci 13 00888 g012
Figure 13. Normalized velocity profiles along the vertical and horizontal central lines for different values of λ .
Applsci 13 00888 g013
Table 1. The position of primary vortices of the lid-driven equilateral and right-angled isosceles triangular cavity at R e = 500 and R e = 100 , respectively.
Equilateral triangular cavityData sourceThis paperRef. [13]Ref. [11]Ref. [15]
Primary vortexX = 0.5442X = 0.5401X = 0.5499X = 0.5266
Y = 0.6455Y = 0.6527Y = 0.6539Y = 0.6501
Isosceles triangular cavityData sourceThis paperRef. [14]Ref. [18]
Primary vortexX = 0.0465X = 0.0448X = 0.045
Y = 0.3829Y = 0.3816Y = 0.38
Table 2. Evolution of growth rate decay with Reynolds number.
Re7000710072007300750076007700
t0.473990.490840.5512960.641461.06961.1791.5745
γ −4.57412−3.8701−3.40548−2.96897−1.9354−1.4096−1.03147
S D γ 0.6013060.404080.4542940.4030310.249980.1039150.0947897
Re78007850790079508050
t2.301652.953154.0816.4732.8928
γ −0.69855−0.5528−0.39235−0.25251−0.0000
S D γ 0.0955910.08010.04470.0312720
Table 3. Vortex properties of the primary vortex of different geometries at steady Reynolds numbers 1000 and 7000.
Re = 1000 λ 1795325/31.5
PositionX = 0.5946X = 0.5949X = 0.5862X = 0.6122X = 0.6868X = 0.7385X = 0.7790
Y = 0.3319Y = 0.3054Y = 0.2600Y = 0.2020Y = 0.1476Y = 0.1176Y = 0.0989
φ −0.0527−0.0528−0.0537−0.0510−0.0426−0.0360−0.02994
ζ −6.393−6.397−6.274−6.859−9.066−11.46−13.804
Re = 7000PositionX = 0.7714X = 0.7733X = 0.7626X = 0.7512X = 0.7665X = 0.8271X = 0.7966
Y = 0.3898Y = 0.3638Y = 0.3165Y = 0.2458Y = 0.1680Y = 0.1395Y = 0.0945
φ −0.0349−0.03475−0.0361−0.0359−0.0035−0.02461−0.0290
ζ −13.020−13.070−12.563−11.233−12.39−16.096−13.635
Table 4. Vortex properties of the primary vortex of different geometries at steady Reynolds numbers 1000 and 7000.
Re = 1000 λ 1/171/91/51/3
PositionX = 0.5118X = 0.5301X = 0.5382X = 0.5822
Y = 0.4425Y = 0.2764Y = 0.2195Y = 0.1830
φ −0.0078−0.0176−0.0334−0.0426
ζ −23.27−3.566−4.269−5.794
Re = 7000PositionX = 0.4828X = 0.5349X = 0.5311X = 0.5927
Y = 0.2188Y = 0.2047Y = 0.2031Y = 0.1744
φ 0.0128−0.0126−0.0309−0.0406
ζ 1.443−1.637−3.304−5.916
Disclaimer/Publisher’s Note: The statements, opinions and data contained in all publications are solely those of the individual author(s) and contributor(s) and not of MDPI and/or the editor(s). MDPI and/or the editor(s) disclaim responsibility for any injury to people or property resulting from any ideas, methods, instructions or products referred to in the content.