Abstract
With shorter wavelengths than microwaves and greater penetration depth than infrared light, waves in the terahertz spectrum offer unique material testing opportunities. Terahertz technology offers non-invasive and non-destructive testing in the form of spectroscopy and imaging. The most used systems for terahertz imaging are time-domain spectroscopy systems. However, frequency domain spectroscopy systems could offer excellent frequency resolution and be more suitable for biomedical applications. Terahertz imaging based on frequency domain spectroscopy systems is slow, and suffers from frequency tuning errors. A novel one-dimensional imaging principle is presented in this paper. In addition, frequency range optimization based on convolutional neural networks and occlusion sensitivity is utilized for frequency range optimization. Frequency range optimization is used to determine the optimal frequency range for data acquisition. The optimal frequency range or bandwidth should be wide enough for effective phase detection, and should be at the intersection of several spectral footprints in the observed medium. The intersection of spectral footprints is estimated using the proposed frequency range optimization algorithm based on a convolutional neural network and occlusion sensitivity algorithm. The proposed algorithm selects the most sensitive frequency band of THz spectrum automatically, and enables very fast acquisitions for object inspection and classification.
1. Introduction
Terahertz (THz) technology has become one of the most promising in non-invasive and non-destructive object detection and recognition. The THz band is located between the microwave spectrum and infrared spectrum, with frequencies ranging from THz to 10 GHz [1]. The most significant advantage of THz waves is that they are non-ionizing and non-destructive at a reasonably short wavelength. That provides the opportunity for material testing in chemistry [2], biology [3], agriculture [4], and other fields.
Methods for generating and detecting THz waves are divided into optical, opto-electrical, and electrical methods [1]. While optical methods provide the widest bandwidth, they are too expensive and complex for industrial applications. On the other hand, electrical methods are the cheapest of the three, but with limited bandwidth below 1 THz. The most promising are opto-electric methods, divided into wideband and continuous wave (CW) methods. Both methods can utilize photoconductive antennas (PCAs) for generating and detecting THz waves. Wideband systems use a femtosecond laser to generate optical signals, while CW systems use the beating of two optical signals with different wavelengths. Both systems can be utilized for THz spectroscopy. Time-domain spectroscopy (TDS) based on broadband THz systems is much more favorable in material testing, as shown in [5], since it is less complex and has a higher acquisition speed. Frequency domain spectroscopy (FDS) uses CW THz systems. The frequency resolution in THz-FDS systems is higher than in THz-TDS systems, but the acquisition speed is much lower. Some of the main advantages of THz-FDS systems are their cost, flexibility, and lower impact from the surroundings, since THz-FDS systems can be implemented using fiber optics.
In recent years, THz imaging techniques have been used for material inspection and testing. The most works were done using TDS THz systems, and different techniques were used for image acquisition, such as raster imaging [6], Synthetic Aperture Radar (SAR) [7], compressive imaging [8], tomography [9], and others. The most used imaging techniques in THz imaging are based on well-known principles, while implemented in the reflection mode. Shorter wavelengths compared to microwaves and longer penetration depth compared to the infrared spectrum offers unique possibilities for applications using THz waves. Imaging applications were deployed in the fields of medicine [6], security [10], and others. Researchers proposed different approaches to image processing and enhancement from other imaging fields, such as compressive imaging [11] and deconvolution [12].
THz-TDS systems are the main opto-electronic methods in current THz imaging applications. However, despite the THz-FDS shortcomings, some applications were developed using THz-FDS systems, as shown in [13]. There could be some advantages in using THz-FDS systems, as shown in [14]. Authors in [13] divided imaging based on THz-FDS systems into single-point scanning, full-field imaging, and three-dimensional imaging. Single-point scanning or raster imaging has a focusing lens and scans the observed object pixel-by-pixel. The system for single point scanning utilizes optics for focusing the THz beam to an as small as possible pixel, and can be implemented in reflection mode or transmission mode. Full-field imaging utilizes an array of receivers. A wider THz beam is generated, and then sampled using the full-field receiver. The resolution can be enhanced using compressive imaging or other techniques. Three-dimensional imaging uses more advanced and expensive devices. Examples of three-dimensional imaging are holographic imaging [15] and tomography [16].
A new approach to THz imaging was proposed in the preliminary work [17]. The proposed method used a deconvolution technique with a combination of single-point imaging and full-field imaging. A wide and collimated THz beam was generated and detected with the single-point receiver. The transmitter and receiver in transmission mode are then moved as in single-point scanning, and a spectrogram image is generated. Each trace in the spectrogram was generated in the frequency range between 710 GHz to 810 GHz. The acquired spectrogram image was processed using the proposed Gauss Spotlight Filter (GSF), and then compressed into a one-dimensional (1D) image. The GSF method assumes that the intensity profile or spotlight of the PCA antenna has a Gauss intensity function [18]. One-dimensional image compression was developed for amplitude images and phase images.
The low acquisition time was the first problem mitigated with the proposed THz imaging techniques applied to material classification. Each material in the sample was observed in a wide frequency range. Based on an expert opinion, the frequency range was set from 710 GHz to 810 GHz. A narrower bandwidth and bidirectional scanning helped reduce the acquisition time significantly. The second problem mitigated by the proposed THz imaging technique was frequency tuning. Frequency tuning in THz-FDS systems is performed by shifting the wavelengths. Wavelength shift can be achieved by heating or cooling the laser diode. Since the actual frequency is too high to be measured, it is estimated based on the temperature difference. The actual frequency differs from the target frequency, and the resulting data will have additional phase shifts. With a broader frequency range, the phase shifts occur because of the tuning error.
The proposed THz imaging proved to mitigate some of the THz-FDS’s problems. However, the acquisition time still needed to be lowered for practical applications. An approach to frequency range optimization is proposed in this paper. In the preliminary work, the expert chose the frequency range and, in this paper, a convolutional neural network (CNN) and occlusion sensitivity were used for frequency range optimization. A windowing spectrum dilation (WSD) [19] algorithm was proposed for the transformation of data series to two-dimensional (2D) images. The 2D images created using WSD were then used to train the CNN and for sample classification. The WSD algorithm leans onto the measured data’s properties so that, at lower frequencies, the intensity of the detected THz waves is much higher; therefore, spectral footprints at lower frequencies will have a higher impact on the classification. The proposed WSD algorithm mitigated frequency tuning errors while retaining full spectrum information.
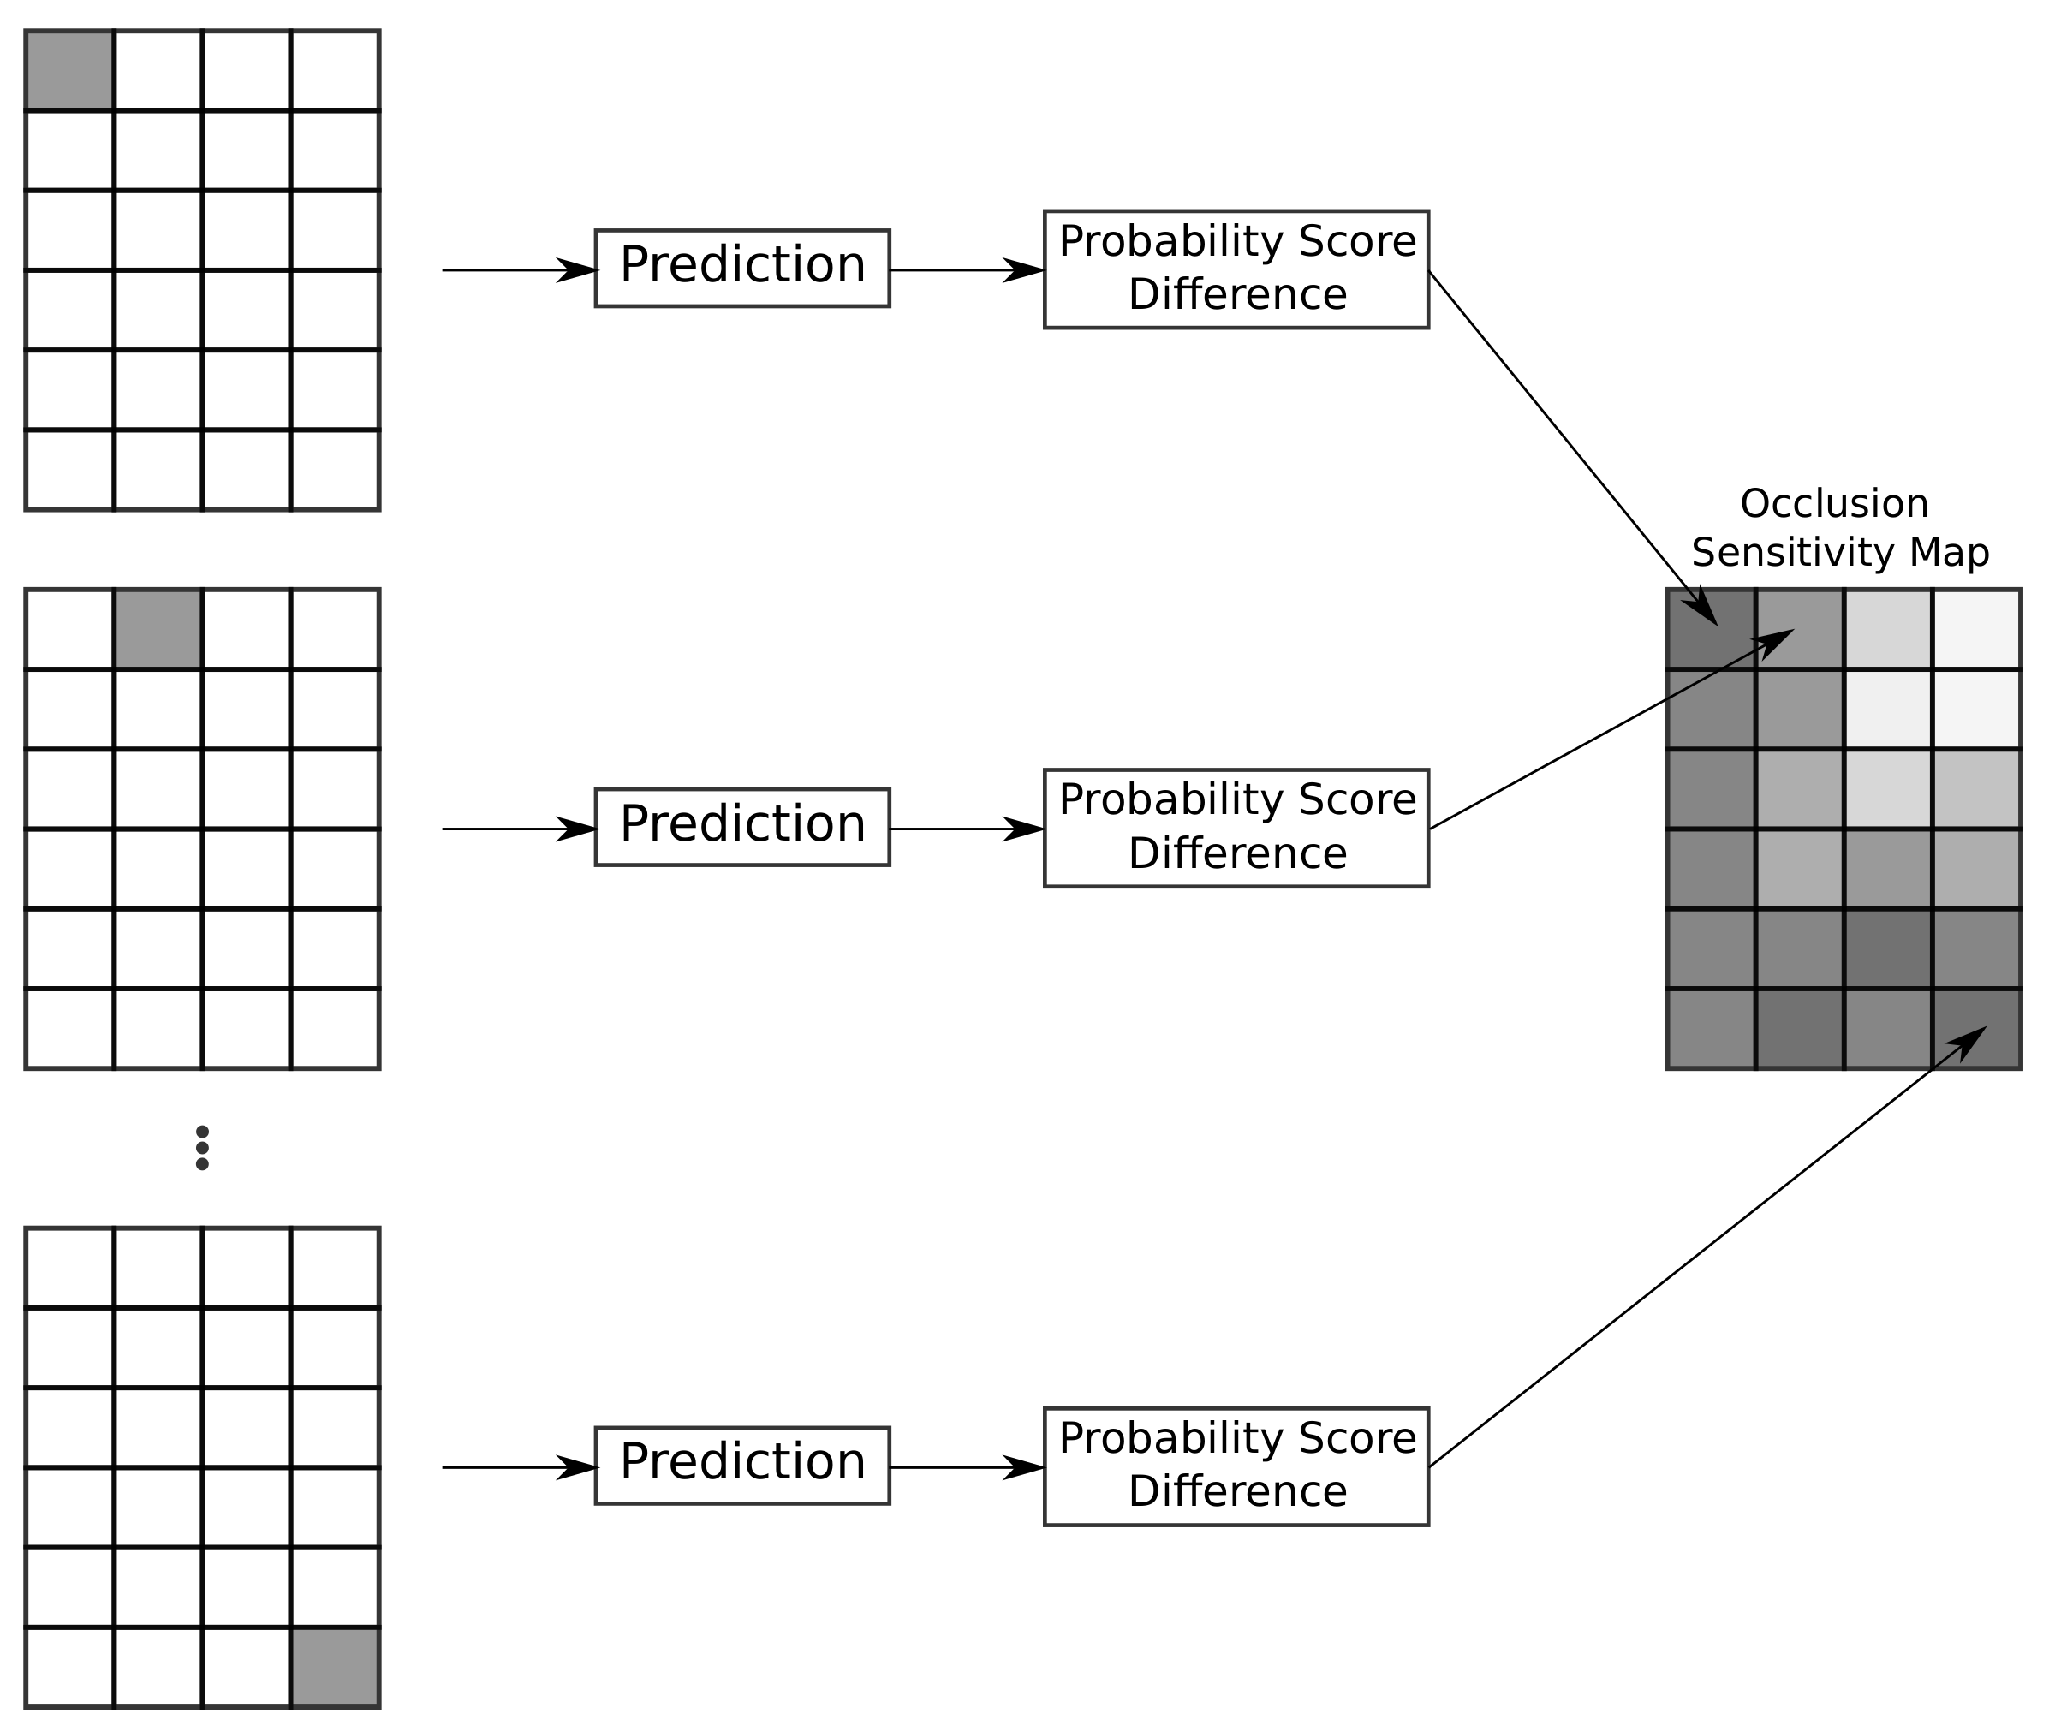
In this paper, the WSD algorithm and classification using CNN were used to distinguish between different materials in the observed sample. The goal was to use CNN visualization features, and determine which features are the most suitable for material classification and, based on a CNN visualization output, select the optimized frequency range. The CNN was analyzed and visualized using occlusion sensitivity. Occlusion sensitivity is one of many CNN analytics tools, as shown in [20], and its result is the occlusion map of the same size as the input image to the CNN. In the first step of the occlusion sensitivity, the algorithm selects the first pixel or area in the image. The image with the occluded pixel is used for prediction, and a change is estimated in the probability score. The change in the probability score is stored in the occlusion map, and the next pixel or area of the image is processed. The algorithm repeats until every pixel or area in the image has been processed. Any pixel or area with a high probability score change has a high impact on the classification. The occlusion sensitivity function (OSF) can be estimated, since we can estimate the frequency from the measured spectrum in the 2D image created using inverse WSD transformation. The optimized frequency range can be selected from the OSF. Occlusion sensitivity was used successfully in different applications, such as COVID-19 detection [21].
The experimental validation of the proposed method is presented in this paper. The sample was built from three different materials. The materials were all polyethene plastic plates of varying density, with different additives and with the same geometry. Fifty frequency scans were acquired in the range between 50 GHz and 1210 GHz for each material. The WSD algorithm was applied for every frequency scan, and the CNN was trained to classify the materials. The optimized frequency range was determined using occlusion sensitivity and predetermined criteria. The results were evaluated for three frequency ranges, and they were compared to the results in the preliminary work [17]. The results show a decrease in acquisition time, while frequency resolution and contrast stayed reasonable. Frequency tuning error, bias towards lower frequencies and phase shift because of frequency tuning were all mitigated in the proposed frequency range optimization algorithm.
2. THz-FDS System for Generating and Detecting THz Waves
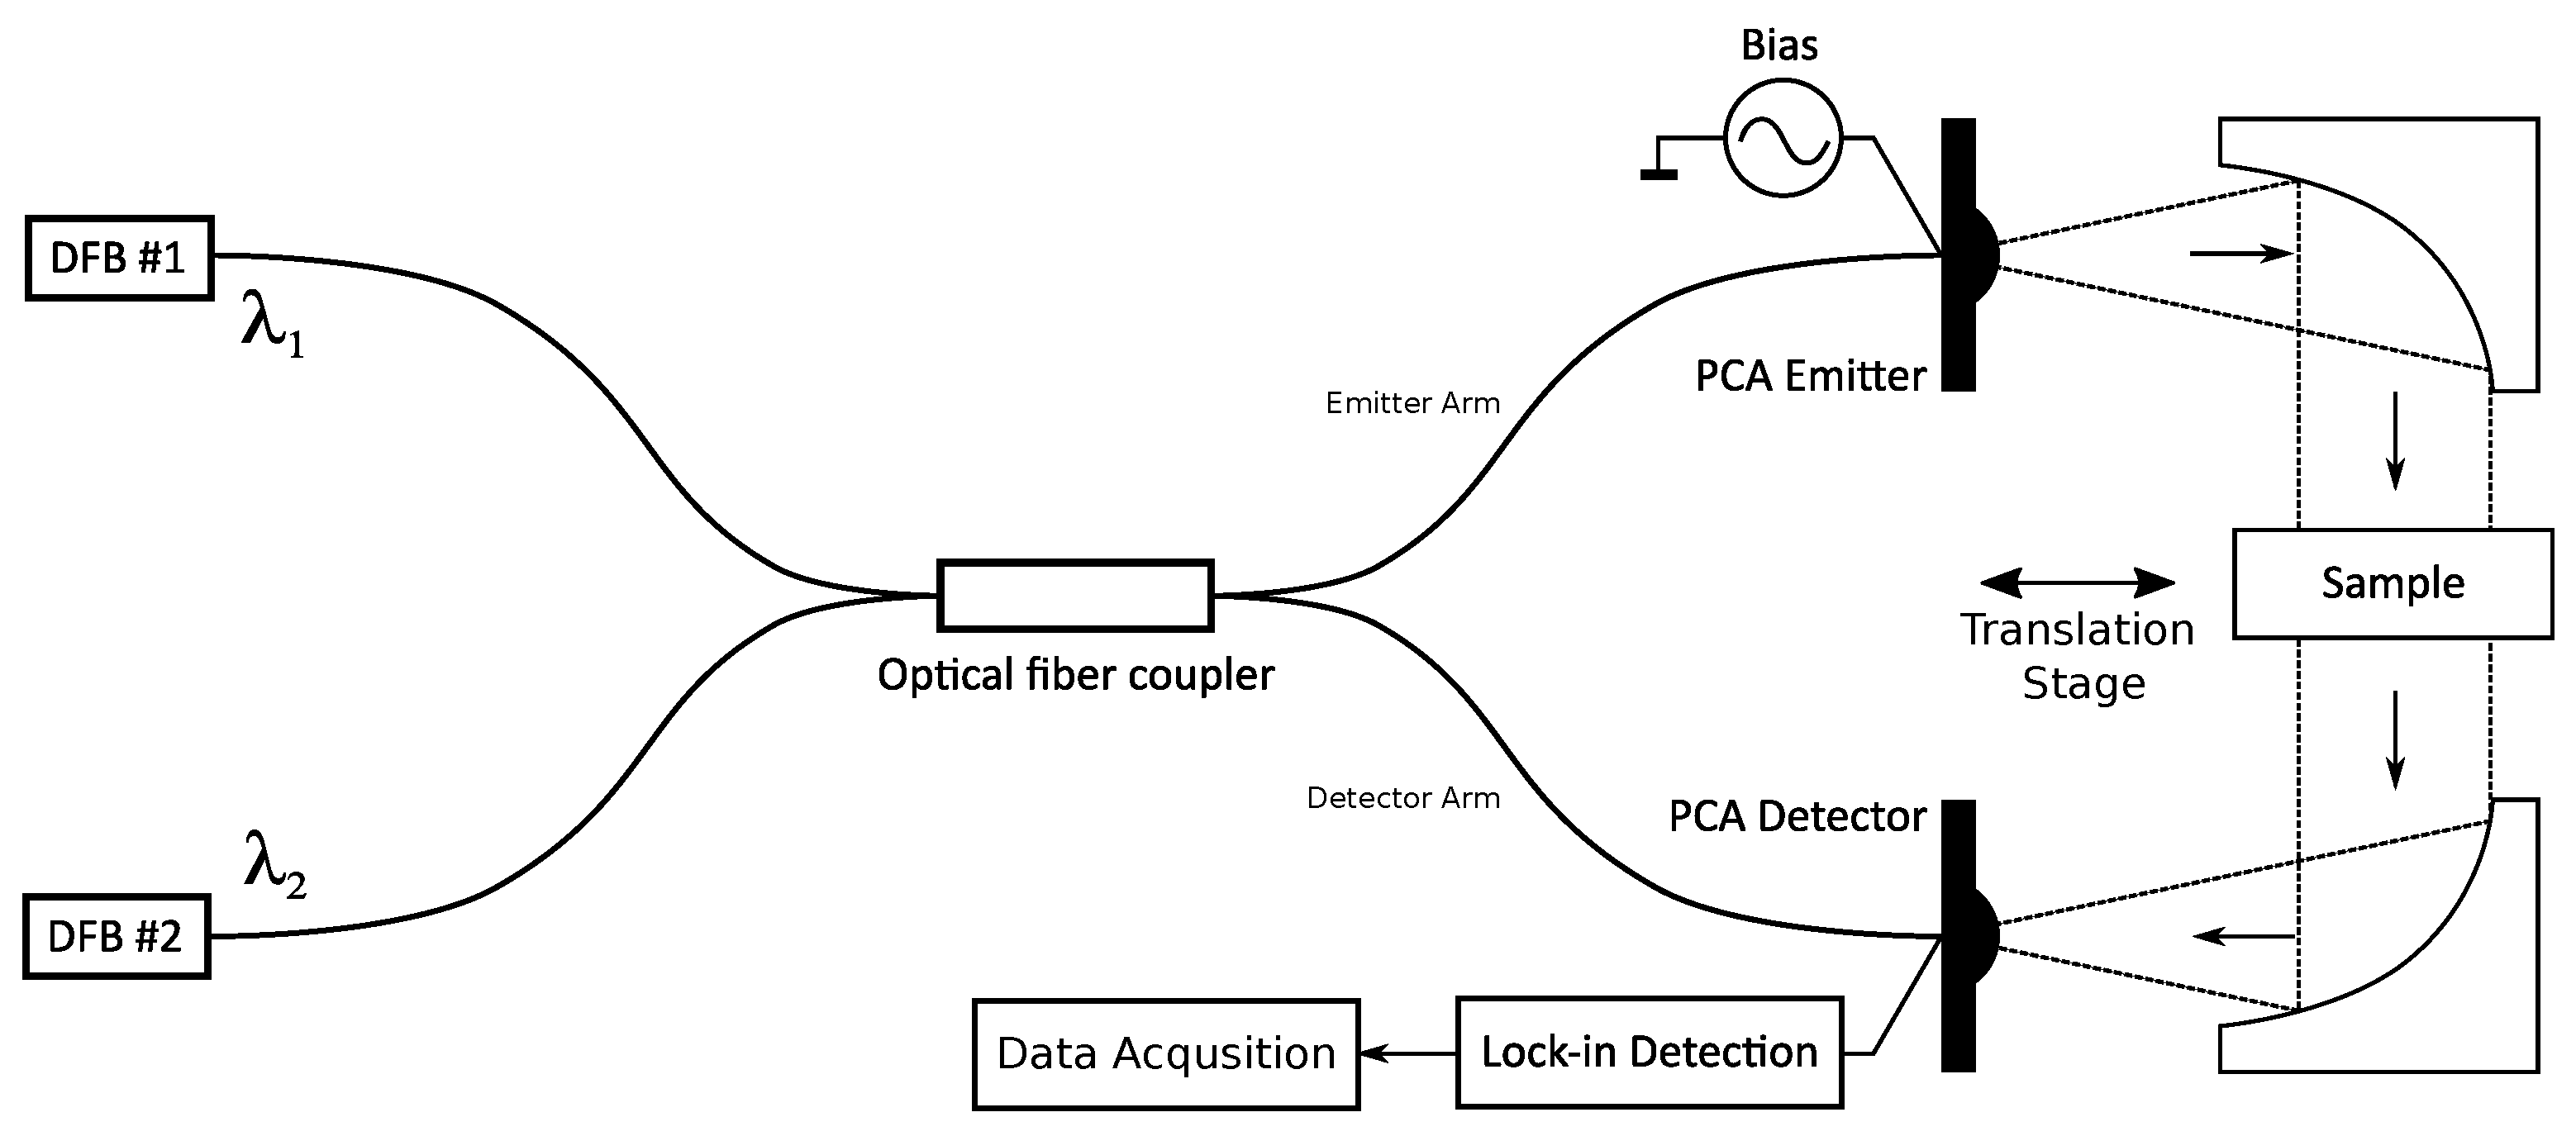
Common THz-FDS is based on beating two optical signals with different wavelengths [22]. Tunable laser sources are used as optical signal sources, as shown in Figure 1. The frequency modulation happens in an optical fiber coupler, where two optical signals are mixed. The resulting optical signal contains THz carrier frequency , estimated as:
where c = 299,792,458 is the speed of light in vacuum, n is the refractive index of the light propagation medium ( for optical fiber), and . Tunable laser sources are usually distributed feedback (DFB) laser diodes. DFB laser diodes can be tuned with temperature—if the DFB laser diode is heated or cooled, the wavelength of the emitted optical signal will shift while the spectral line will not change. In the standard telecom DFB laser diode, wavelength shift is estimated to be around nm/°C [23].
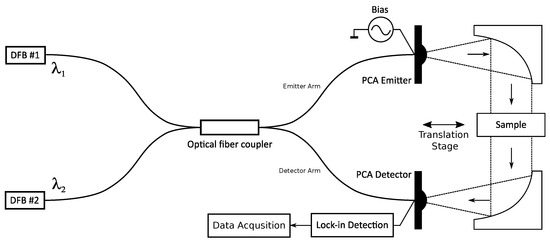
Figure 1.
THz-FDS System.
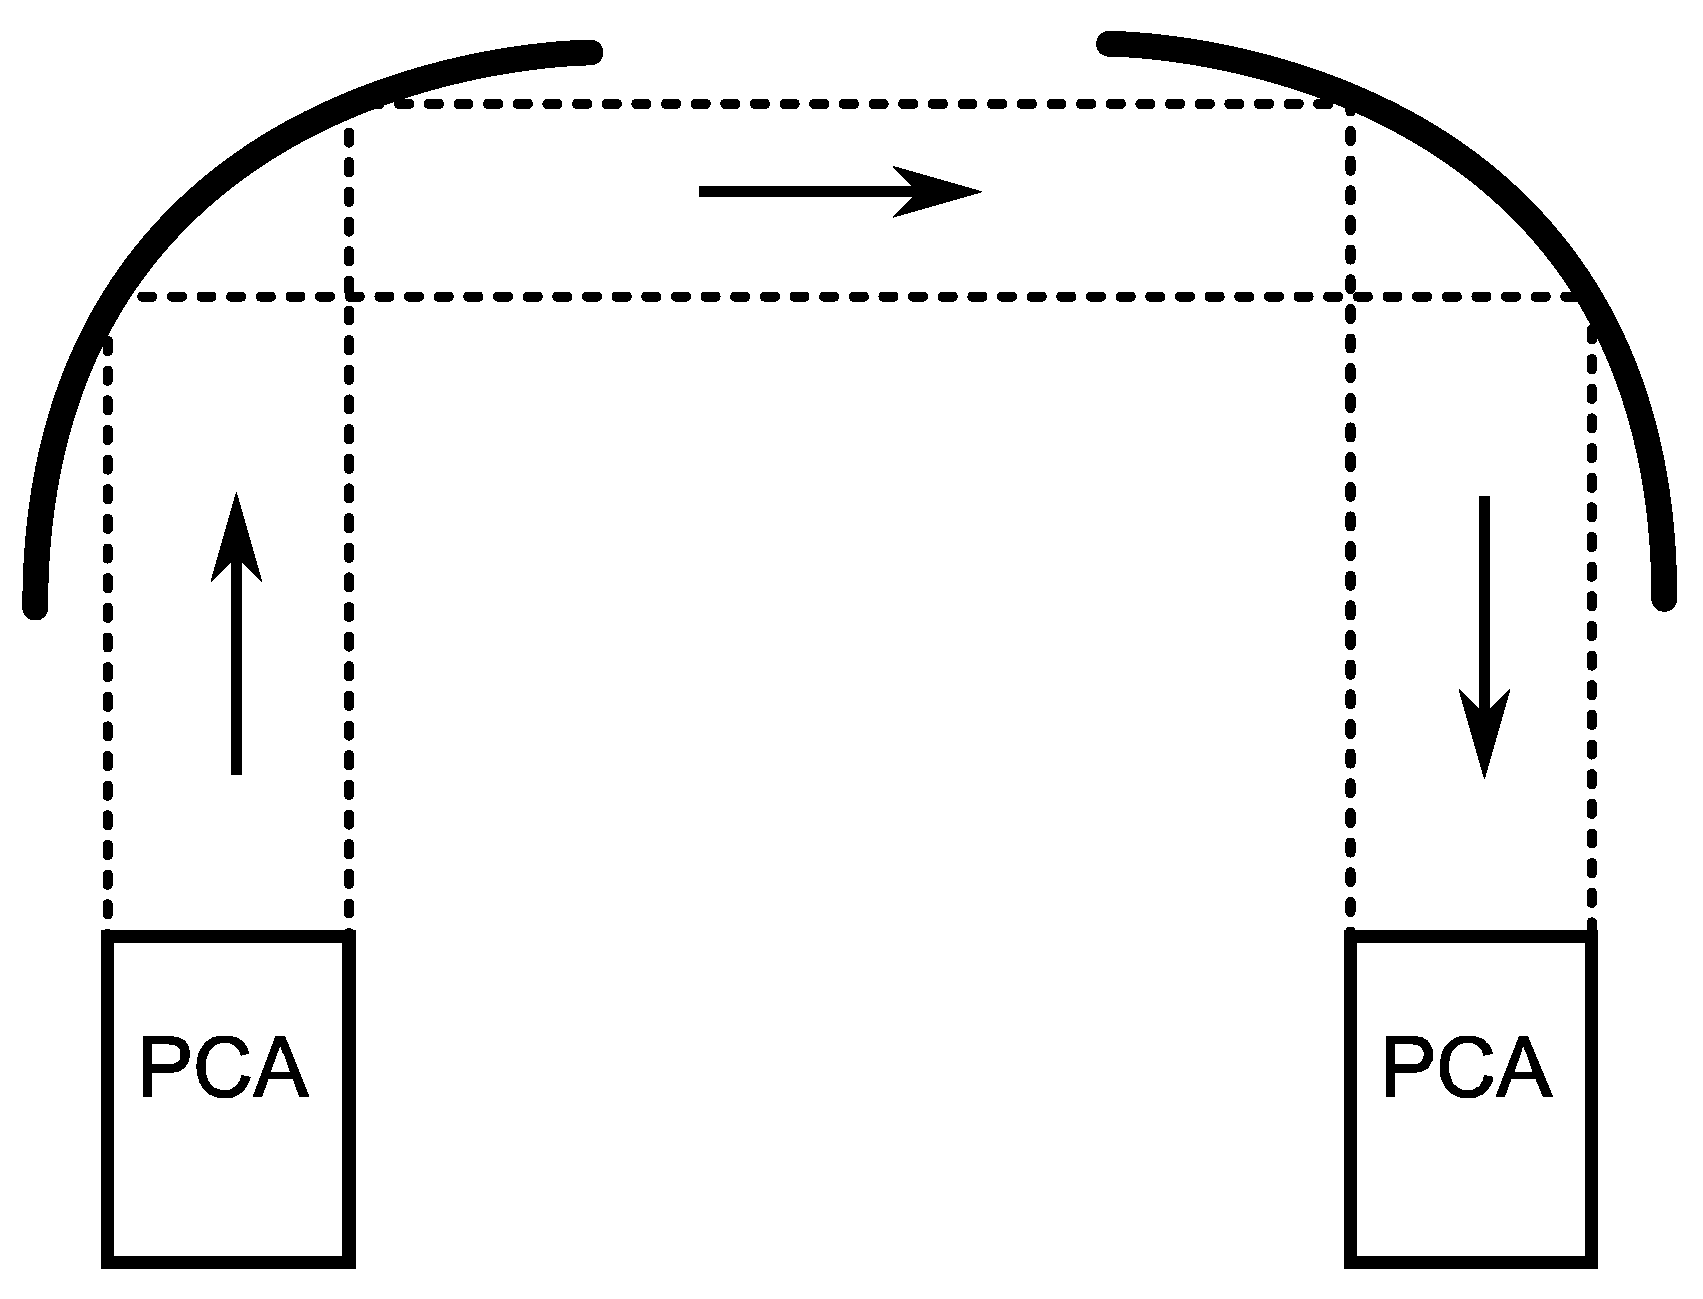
A THz-FDS system can work in two modes: transmission mode, shown in Figure 2, and reflection mode. This paper is focused on transmission mode. In transmission mode, the emitted THz beam from the emitter PCA travels through the sample and is detected using a PCA detector on the other side. There are several ways of focusing the THz beam. One of the most common methods in THz-FDS is the beam’s collimation, as shown in Figure 2. A collimation mirror collates the THz beam emitted from the THz emitter. At the detector side, another collimation mirror is used for focusing the THz beam on the PCA’s structure. The measured characteristic of the sample in transmission mode is transmittance, or how much of the original field has passed the sample. Transmittance T can be estimated as:
where is the remaining field after propagation through the medium, and is the initial field. The initial field’s value is hard to measure, which is why the reference measurement is performed. The reference field is detected in the same environment as the remaining field after propagation through the sample. Equation (2) can now be expressed as:
where is the measured intensity with the sample obstructing the THz beam’s path, and is the reference intensity with the unobstructed THz beam’s path. In the presented THz-FDS system, the emitted THz wave is modulated with a bias signal on the PCA. Because of that, coherent detection can be used using a lock-in amplifier (LIA). The inbound electric field will induce a photocurrent in the PCA receiver, which will be modulated with the bias signal’s frequency. The induced photocurrent is then detected using the LIA and can be measured. If the length of both the emitter and receiver arms are the same, the detected intensity can be estimated as:
where is the inbound THz field at the receiver PCA, and L is the distance between the antennas, and F is the phase fringe frequency. From Equation (4), the phase fringe frequency F can be estimated as:
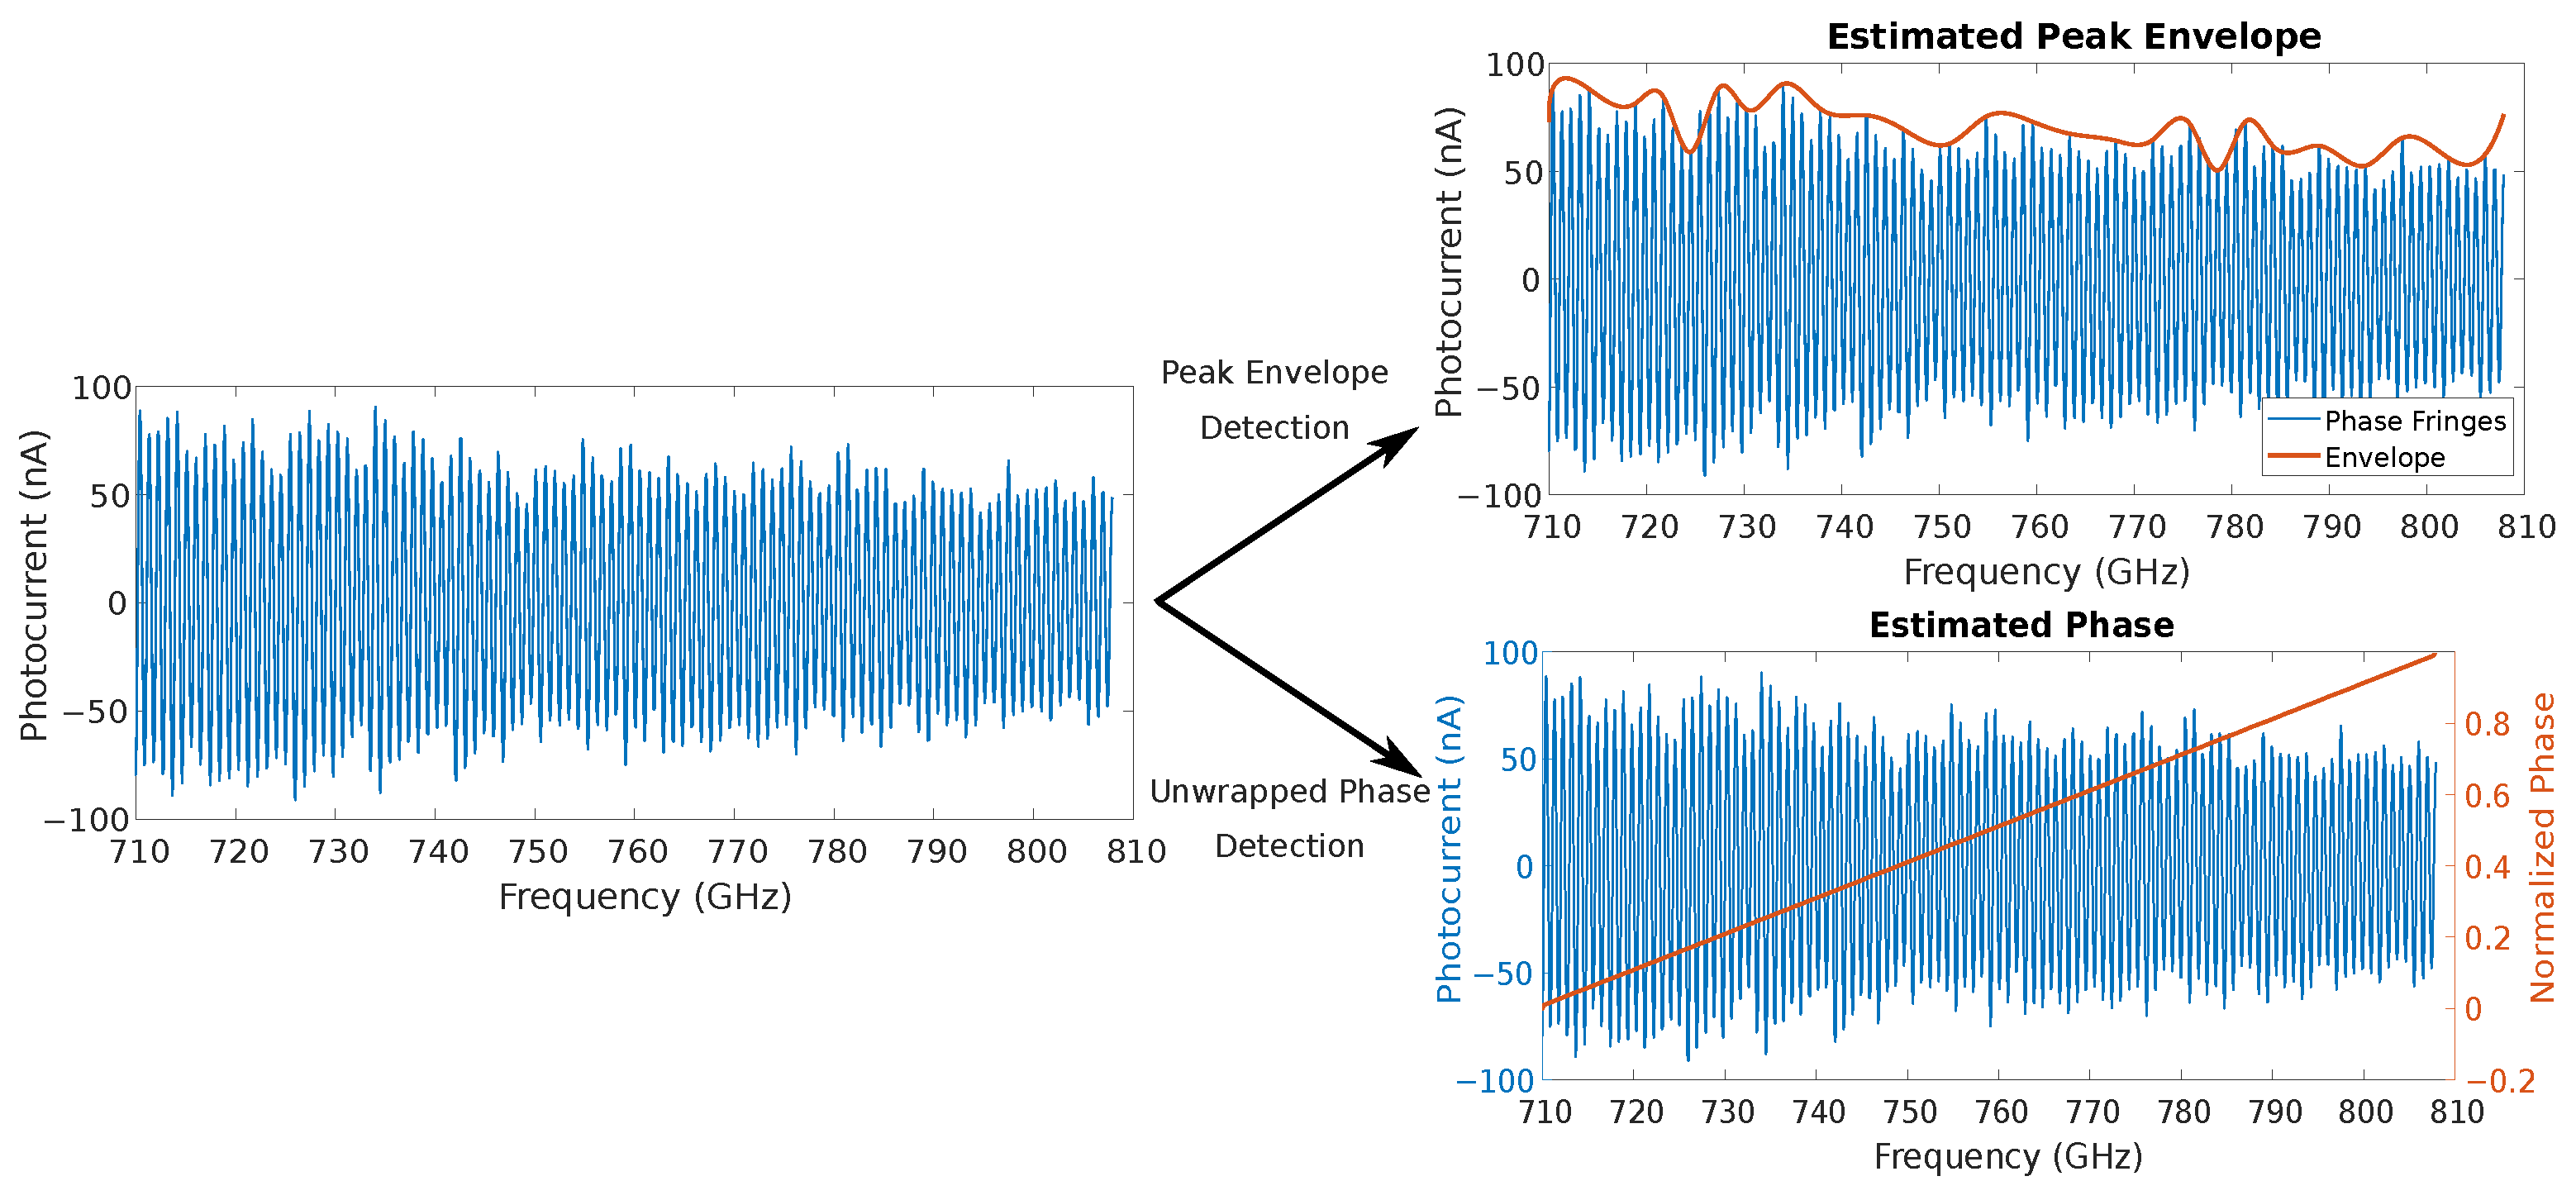
Combining Equations (4) and (5), the detected photocurrent depends on the THz carrier frequency and distance from the PCA emitter and PCA detector L. Sweeping either or L will result in phase fringe detection, as shown in Figure 3.
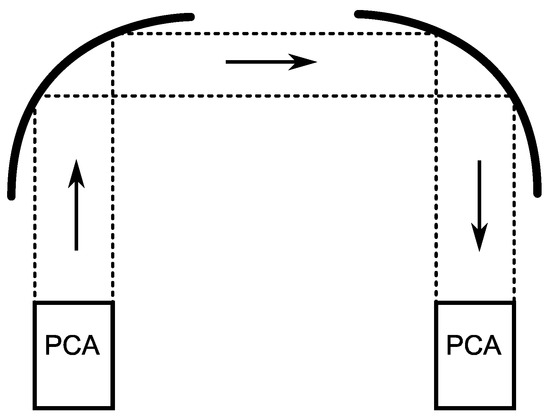
Figure 2.
Collimation of the THz beam in transmission mode.
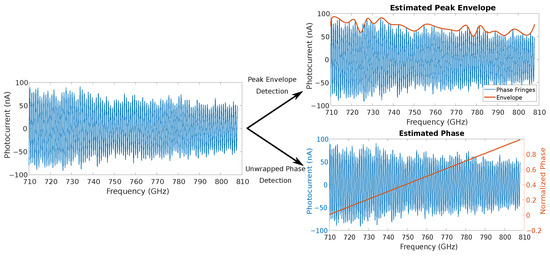
Figure 3.
Peak envelope and unwrapped phase estimated from the detected phase fringes. The peak envelope represents the amplitude spectrum, and the unwrapped phase represents the phase spectrum.
The sample’s spectral characteristics will impact the detected intensity and shift the phase. The absorption coefficient is introduced, since the classical electromagnetic theory using Maxwell equations can describe the propagation of THz waves on the macro level [1]. If frequency depended absorption is introduced to Equation (4), the detected intensity could be estimated as:
where d is the thickness of the observed medium, and is the initial THz beam intensity. From classical electromagnetic theory, dispersion in the medium is introduced. The dispersion or change in the propagation speed will result in phase difference , estimated as:
where . By combining Equations (6) and (7), the intensity can be estimated as:
A photocurrent is induced in detector PCA when the THz field hits the antenna structure. Induced current in detector PCA can then be detected using an LIA and, based on Equation (8), it will have a sinusoidal shape. The amplitude and phase spectrum can be estimated from the detected photocurrent. The amplitude spectrum can be estimated by identifying the peak envelope, which is carried out by detecting signal maxima and using spline interpolation. The phase spectrum can be estimated by determining zero crossings and linear interpolation.
There are two main problems with the presented system: The relation between the emitted wavelength and temperature can only be determined empirically [24], and wavelength-tuning using temperature is a slow process and unsuitable for fast wavelength shifts [23]. The empirically determined relation between the emitted wavelength and the DFB laser diode’s temperature can never be completely accurate. There are also no cheap and readily available methods for measuring optical frequency in the THz band. Because of those two shortcomings, the set THz frequency and actual THz carrier frequency will always be different, which can impact the measurements’ repeatability. The second major drawback, slow wavelength sweeps, results in time-consuming measurements and makes the technology unsuitable for fast quality control applications in industry.
The third major drawback is the environment itself. Changes in temperature and a change in absolute humidity will impact the measurements drastically. In ideal conditions, measurements should be performed in a vacuum or near vacuum, or air should be supplemented with other gases. However, this reduces the robustness of the processing methods and increases the complexity of the system.
3. Proposed Method for One-Dimensional Image Reconstruction
The proposed method for image reconstruction is based on our previous research [17] and presents a combination of full-field imaging and single-point scanning. A linear actuator with small steps is used to move PCAs over the sample, similar to single-point scanning. Because of the relatively large spotlight compared to the translation step, the acquired single trace will overlap with its neighboring traces. If the linear step is much smaller than the spotlight’s radius, and if the spotlight’s intensity profile is known or can be modeled, the neighboring values can be used to determine the pixel value. This is similar to full-field imaging, where techniques such as compressed sensing are used to determine single pixel value. In the proposed image reconstruction method, a linear step determines the image resolution. The setup for image acquisition is presented in Figure 1. THz wave generation and detection was performed using commercially available system TeraScan 1550 from Toptica Photonics, and the LTS300/M linear rail from Thorlabs was used as translation stage. The linear rail’s speed was set to 1 mm/s and the linear rail’s acceleration to 1 mm/s. Step distance of LTS300/M was set to 0.5 mm.
In our preliminary work, [17], the proposed method was proven to mitigate some of the shortcomings of the THz-FDS system. The peak envelope and phase shift are extracted from the detected photocurrent in the first processing stage. The peak envelope is extracted using maxima detection and spline interpolation, and the phase shift is extracted using zero crossing detection and linear interpolation. Figure 3 shows the estimated amplitude and phase spectrums. At starting, the frequency phase was set to zero, since we were more interested in the phase change because of the dispersion, as shown in Equation (7).
GSF was applied in the second processing stage of the proposed image reconstruction algorithm. The authors in [18] determined that the PCA’s intensity profile can be estimated using the Gauss function. While using the THz-TDS system, THz beam profile modeling was used in [12] to enhance the resolution and contrast of the acquired image. In the acquisition setup shown in Figure 1, the THz beam is directed through a silicon lens and collimated through collimation mirrors. The intensity profile will stay the same after collimation. Therefore, the THz beam will propagate through the sample with a Gauss intensity profile. The empirically determined spotlight’s diameter was 8 mm, while the linear step was set to mm. The intensity profile was modeled using a 1D Gauss function using 8 mm/ mm = 16 samples. As shown in Figure 4, GSF was applied to the samples at the same vertical position in the acquired spectrogram.

Figure 4.
Principle of proposed Gauss Spotlight Filter (GSF). The filter moves through the spectrogram on every vertical position or every target frequency.
In the last processing stage of the proposed image reconstruction algorithm, the amplitude and phase spectrum were compressed into a single pixel. The boxcar filter averages the set of measurements into a single pixel. Using the boxcar average, we focussed on the sum of intensity in the broadband signal shape. The broadband signal is limited in its bandwidth, representing frequency limitations in the amplitude spectrum. By adding the detected amplitude spectrum between the initial and end frequencies in the frequency scan, we can extract the information about absorption in a limited bandwidth. A single pixel in the amplitude image was estimated as:
where is the initial frequency and is the end frequency in the sweep, and is the peak envelope of detected photocurrent. With adding the amplitude spectrum in a certain bandwidth, the result represents the sum of the intensity of the broadband signal with equivalent bandwidth. Phase compression is based on Equation (7). If the propagation speed changes in the observed sample, the phase will experience an additional shift, which can be detected in the unwrapped phase. Phase shifts caused by the dispersion in the observed sample are smaller than the wave shift resulting from a frequency sweep. Nevertheless, the latter will always be similar in value, since it depends on the frequency sweep and distance between the PCA emitter and the PCA detector. Phase compression can then be carried out as phase difference detection, and can be estimated as:
where is the unwrapped phase at the start frequency in the sweep, and is the unwrapped phase at the last frequency in the sweep. The proposed algorithm’s results are intensity image and phase image.
4. CNN for Material Classification
In a preliminary work [19], the CNN was used for pigment classification. Samples made from polyethene (PE) were chosen, since PE is opaque to THz waves, and different pigments could be detected in the material. The proposed preprocessing method uses the WSD algorithm for data ordering and measurement transformation. Lower frequencies are expected to have more impact on the material classification, since the amplitude of the detected photocurrents are several orders of magnitude higher than those seen at higher frequencies, as shown in Figure 3. However, the WSD algorithm shows promise in mitigating the THz-FDS system’s drawback with uncertainties in frequency tuning. Because of the nature of the WSD algorithm, it can be used to determine the appropriate bandwidth and frequency resolution with the greatest sensitivity on the measured spectral image of the target material. This section presents preprocessing, the WSD algorithm, the CNN structure and occlusion sensitivity used for frequency range optimization.
4.1. Samples
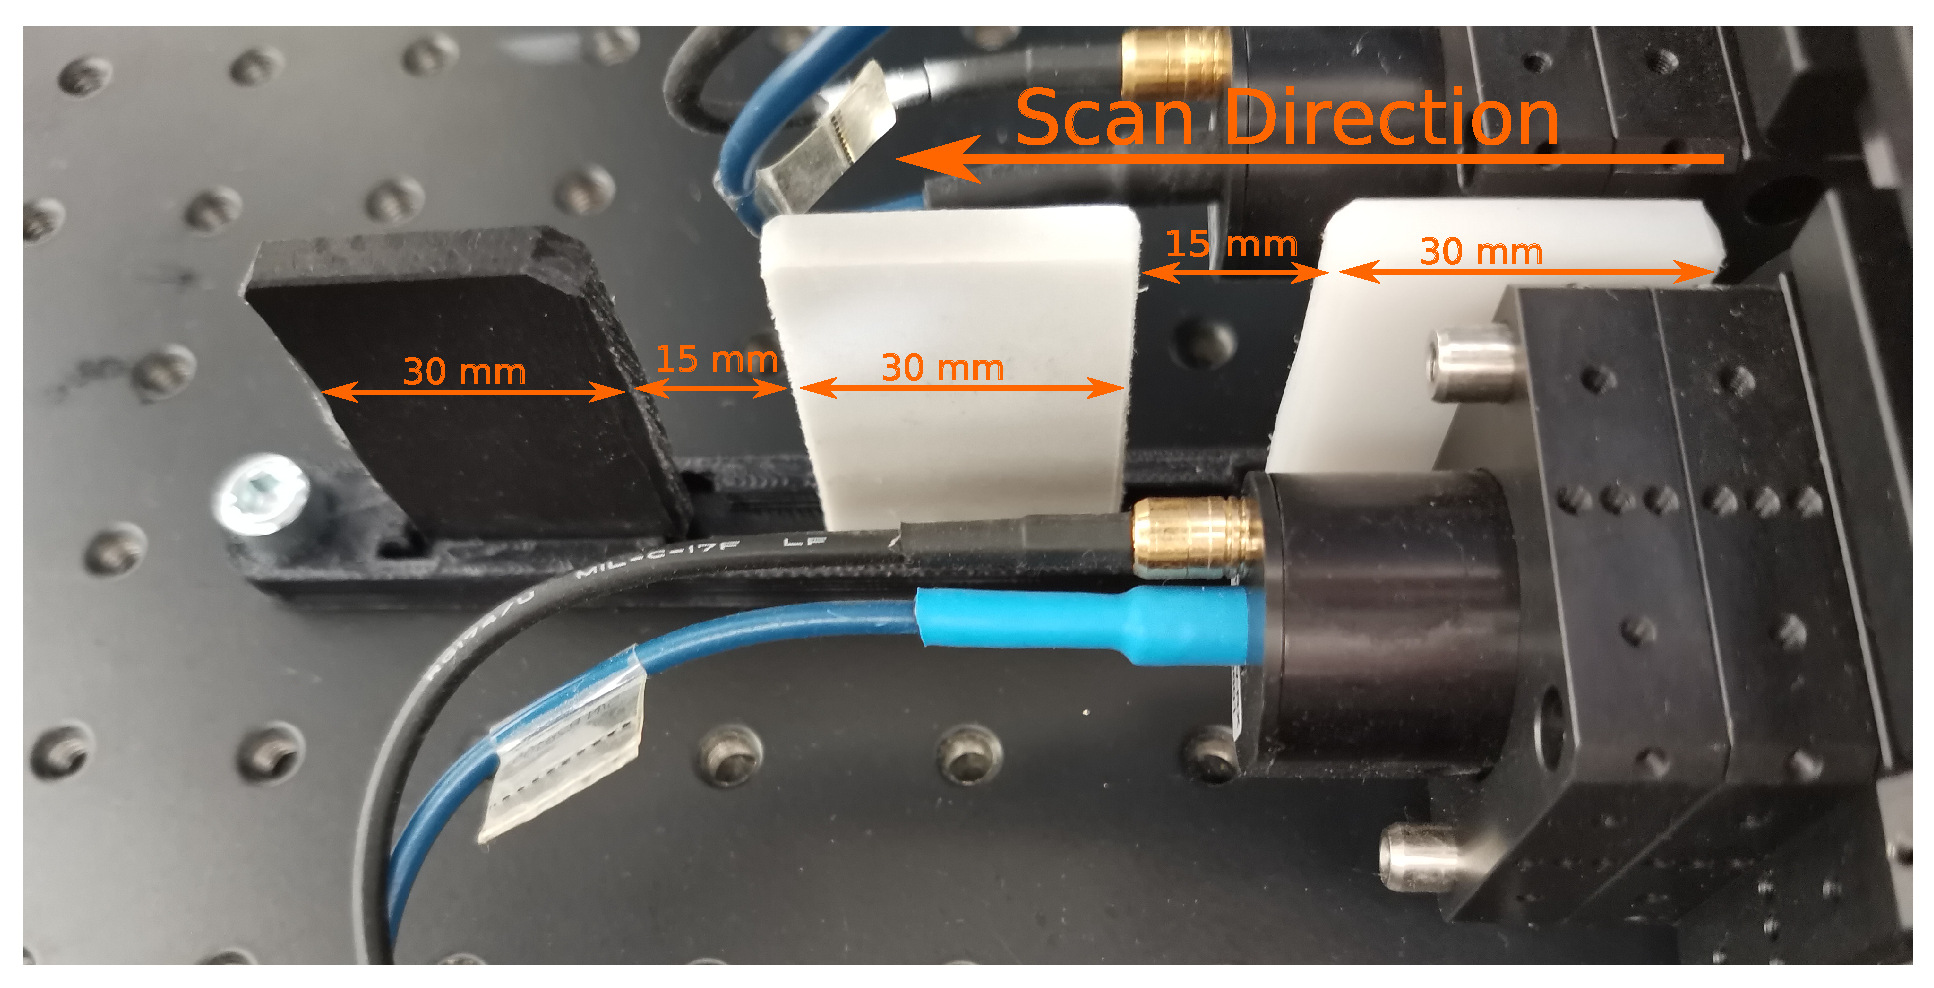
The Isokon company provided all the sample materials. The sample materials were PE plastic plates of different densities and with different additives. The material specifications are proprietary to Isokon, and will not be disclosed. The plastic plates were visually distinguishable by color, as shown in Figure 5. The geometry of the plastic plates was the same (30 × 45 mm, 5 mm thickness). For classification purposes, batches of 50 scans for each sample material were acquired using a TeraScan 1550 from Toptica Photonics. The spectral range was set from 50 GHz to 1210 GHz, which is the maximal range of the device. The frequency step was set to 0.1 GHz, and the integration time was set to 30 ms. Each frequency scan took around 12 min. All scans were performed in similar conditions with constant absolute humidity and temperature deviation of 3 °C. Both temperature and humidity deviations were desired, and will make classification more robust.
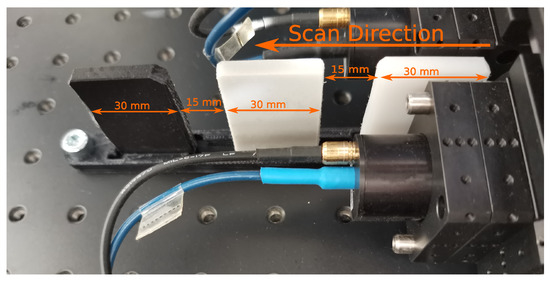
Figure 5.
Plastic samples in grey, black and white color. The dimensions of the plastic samples were 30 × 45 mm with 5 mm thickness.
4.2. Preprocessing Using the Windowing Spectrum Dilation Algorithm
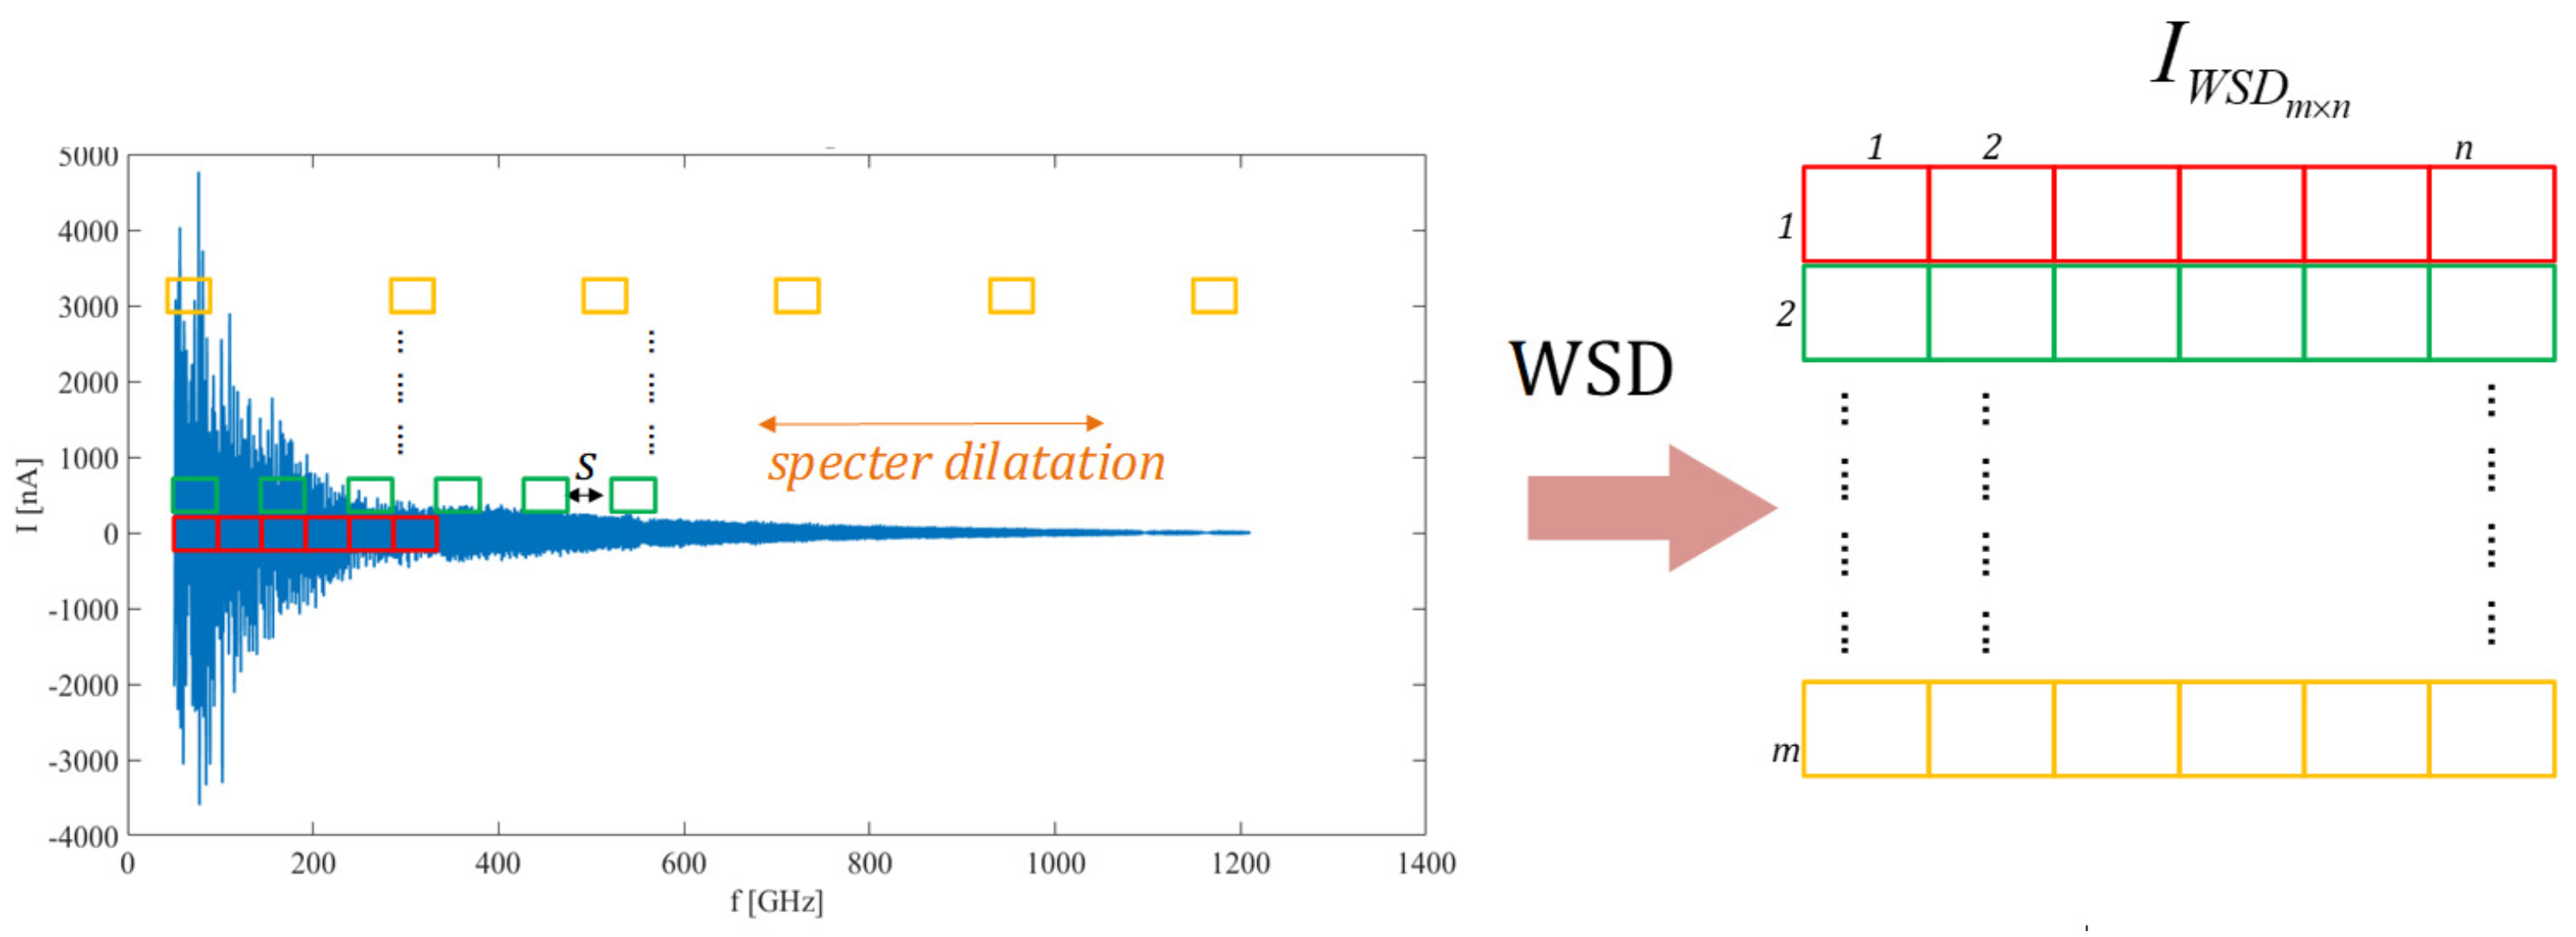
Since the WSD algorithm was shown to be a good preprocessing algorithm for material classification in the preliminary work, [19], it was chosen to determine the optimal frequency range for the imaging applications. The WSD algorithm transforms the series to a 2D array so that each image contains data from the preselected frequency span of the extracted envelope with the dilation factor. Each image row extends the spectrum with a dilation step. At the end of each consecutive row, the original data belongs to the higher or lower measured spectra, which depends on the WSD dilation direction. The dilation direction can proceed from lower to higher frequency or vice versa. Each subsequent row contains the data of the dilated spectra, where the first row represents only starting frequencies, while the last row embraces the whole spectra. The WSD reduces measurement uncertainty and overcomes the problem with spectrum alignment in THz-FDS systems. The WSD transformation for dataset D is described as:
where is the i-th row of the image, is the running index and k is dilation factor. The WSD can also be applied to a down-sampled dataset to lower image resolution and preserve the spectral characteristics of the dataset. Adequately down-sampled data preserves the peak envelope’s shape, and WSD preserves the shape of the envelope in all rows of the image. Those mentioned above confirm that WSD transformation should be more resilient to measurement uncertainties and data misalignment. The WSD data structure is presented in Figure 6. In the given experiment, the presented WSD algorithm focuses on lower frequencies, which have a higher amplitude, therefore, a higher impact on classification. To determine the optimal frequency range, the input series to the WSD algorithm should be normalized. Transmittance T based on Equation (2) was used to normalize the input series.
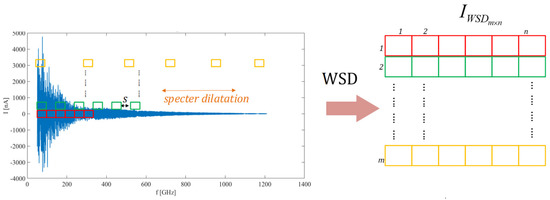
Figure 6.
WSD transforms series into a two-dimensional image.
4.3. CNN Structure and Machine Learning
Classification of different materials depends on their spectral characteristics. Each material has its spectral footprints, and this paper aims to detect the intersection of those spectral footprints. The advantage of CNN in the case of classification is recognition robustness, which can mimic the eye’s natural phenomena of cortex vision [25,26]. In the preliminary work [19], the WSD algorithm proved superior to algorithms using 1D THz-FDS data. One of CNN advantages is that the features can be extracted even if they are distributed randomly spatially. As described in Section 2, pseudo random spatial distribution is one of the shortcomings of THz-FDS systems, which is the result of the frequency tuning method.
The efficiency of the CNN depends on the prepared training dataset, network structure, and hyperparameter selection [27]. This paper’s single CNN structure was designed for moderate resolution, benefiting from short training time and high classification speed while maintaining high classification accuracy. Figure 7 shows the proposed CNN structure, where Conv, ReLu, Maxpool, FC and Cross are abbreviations for convolution operation, rectified linear activation function, max pooling, fully connected layer and cross-entropy, respectively. The number after the forward slash in Figure 7 represents the stride layer.

Figure 7.
Proposed CNN structure.
The CNN’s structure starts with the normalization function for scaling 2D input into an arbitrary span. The first layer in the proposed CNN structure starts with convolutional filters (CF) or kernels. The CF is a fixed-value moving window with a preselected structure and stride. Repeated pattern extraction is allowed with the convolution operation over the inspected image. The output from the convolution operation is a feature map. The CF selection is a trade-off between network complexity and extraction potential.
The rectified linear activation function (ReLu) is used as the activation function. ReLu speeds up the learning process and is not prone to a vanishing gradient. The second layer in proposed CNN is the pooling layer. The pooling layer reduces the data dimensions by extracting maximal values from a certain area. A max-pooling layer of size 2 × 2 was used in the proposed CNN. In the preliminary work it was determined that, if WSD was used, the pooling layer could be omitted, due to the down-sampling procedure of the WSD algorithm. However, max-pooling is used to minimize the proposed CNN’s complexity. Another convolution operation layer, ReLu and max pooling layer follows. The last layer of the proposed CNN is a fully connected layer. The fully connected layer turns 2D data into a single dimension vector. A cross-entropy layer’s dimension is the number of classes. In the case of this paper, the CNN was used to classify between three different plastic materials, as described in Section 4.1.
A The CNN’s hyperparameters are determined through training. The proposed network was trained using the ADAM optimizer [28]. The classification accuracy and reliability are related strongly to the number and types of layers and the preprocessing algorithm. The proposed CNN training parameters were similar as in [19]. Training dataset consisted of the 1D THz-FDS data acquired from different batches with three different plastic materials. Each batch contained 50 images. In the 1D THz-FDS data acquisition process, it was desired to have a limited temperature, atmospheric pressure, and absolute humidity fluctuations. Limited fluctuations in environmental parameters will increase prediction reliability and could reduce overfit. Ten batches were used for CNN training, representing 500 samples for each plastic material. The samples were divided into training (50% of samples), validation (30% of samples), and testing (20% of samples) groups. The CNN’s learning time and achieved accuracy are presented in Table 1.

Table 1.
CNN Training results, where is the learning accuracy, is the learning time in hours, is the initial learning rate, and is the maximal number of epochs.
5. Frequency Range Optimization
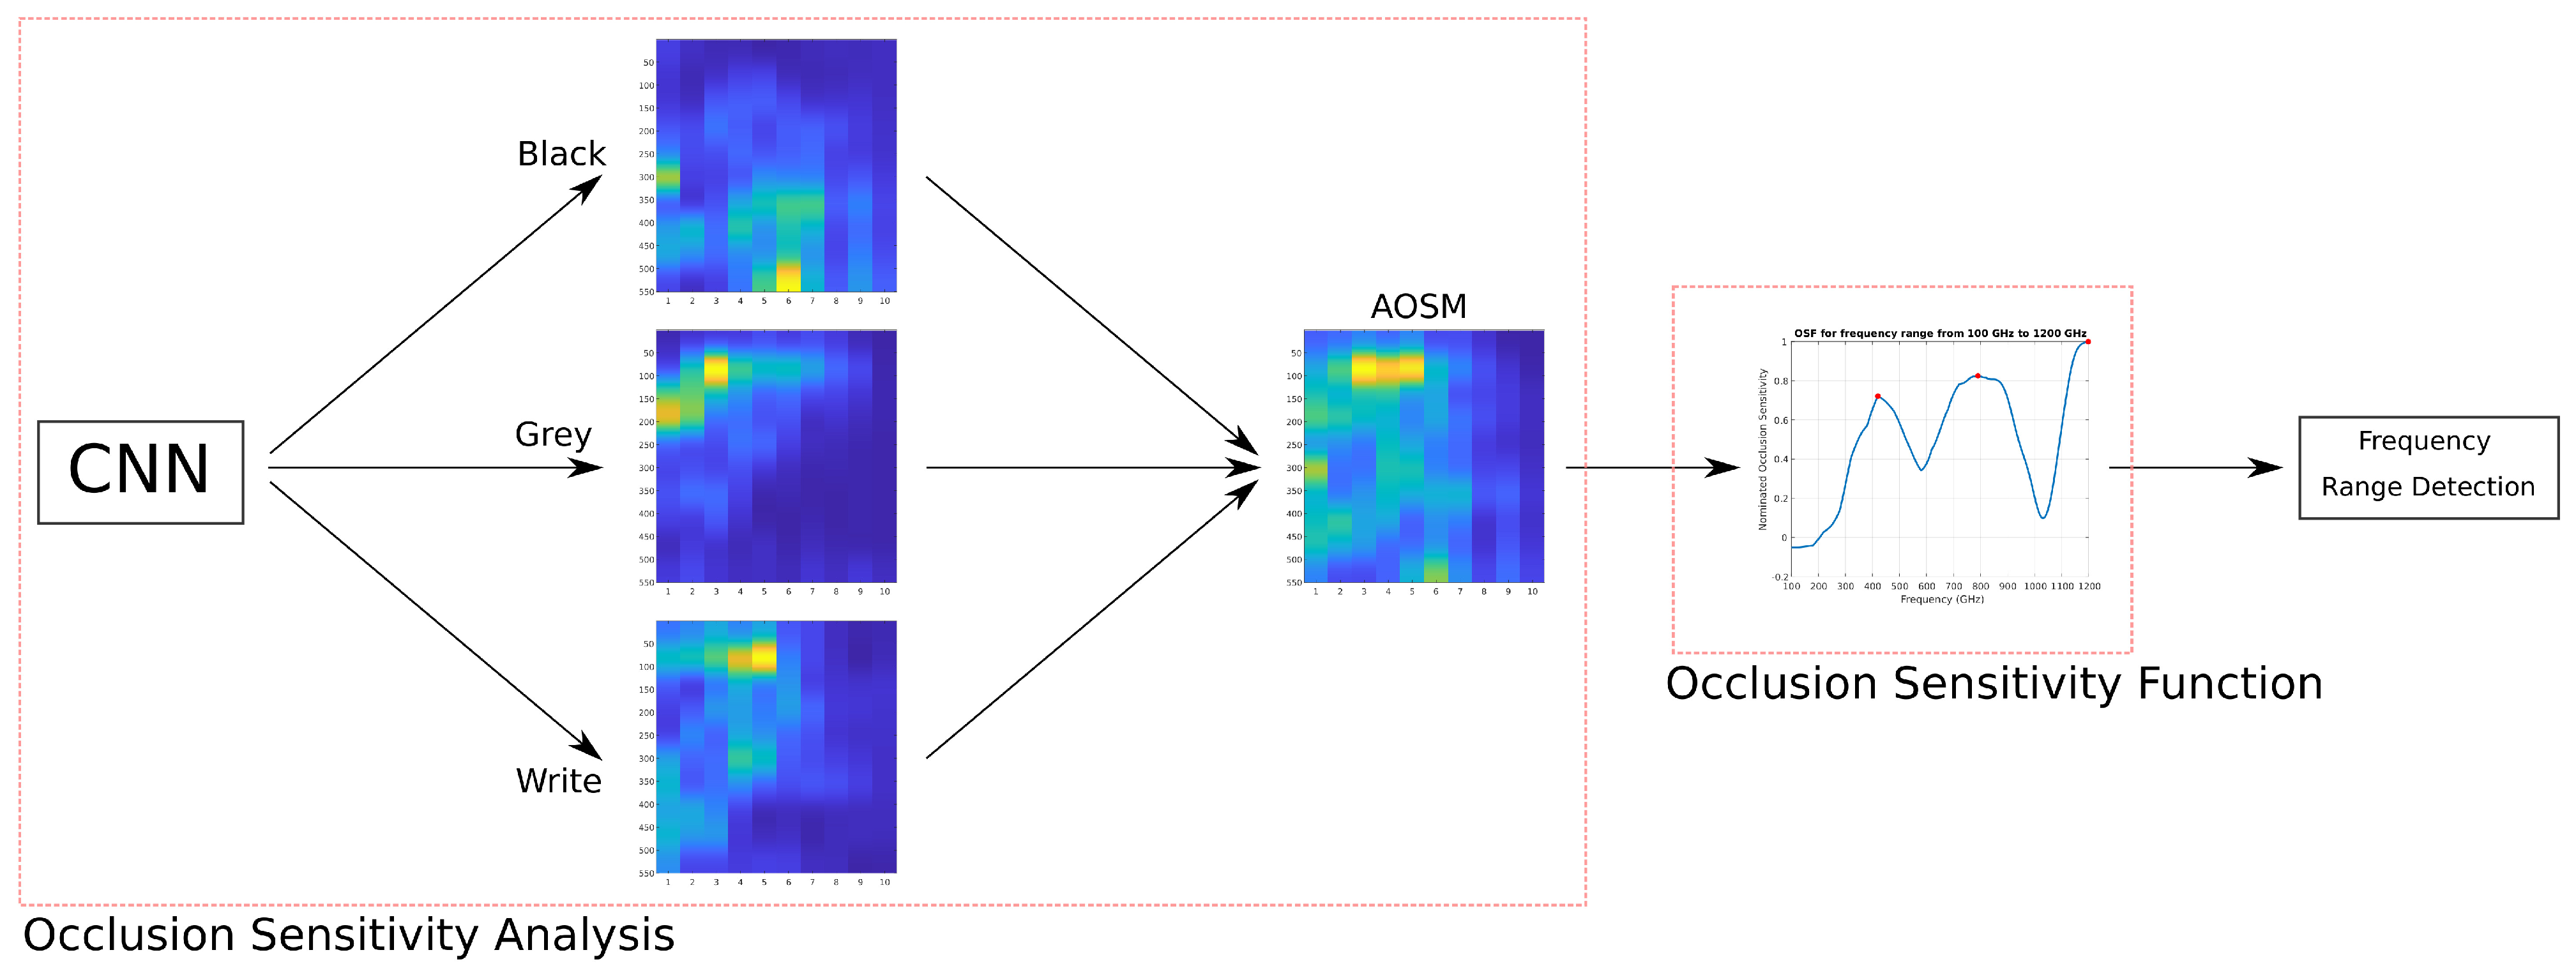
The frequency range in THz-FDS is linked directly to the longer acquisition times. To be able to estimate a phase shift using a zero-crossing detection algorithm, the frequency resolution needs to be high enough. The detected THz wave frequency dependent photocurrent in the PCA receiver is integrated over a set integration time to increase the fidelity of the measurement. This paper aims for the automatic selection of frequency range, while frequency resolution and integration time would stay the same. With a narrower frequency range, the acquisition time will be lower. Figure 8 shows the principle of this paper. A dataset for material classification was acquired in the first phase. The dataset consisted of 10 batches of 50 wide-spectrum measurements for each plastic plate used in the observed sample. The dataset was then transformed using WSD, and used for CNN training, as shown in Section 4. The trained CNN was utilized in the proposed frequency range optimization (FRO) algorithm. The first step in the proposed FRO is the CNN’s occlusion sensitivity estimation, followed by the occlusion sensitivity function estimation and frequency range selection using predefined criteria. The selected frequency ranges were to be used in image acquisition and compared against the empirically-determined frequency range by the expert in the field, as shown in the preliminary work [17].

Figure 8.
Principle of the proposed frequency range optimization.
The proposed frequency range optimization (FRO) algorithm, shown in Figure 9, is based on occlusion sensitivity. Occlusion sensitivity will provide a map of features that have a higher impact on classification. CNNs are typically a black box. With the help of CNN visualization tools, such as occlusion sensitivity, the inner workings of CNN can be inspected, as shown in [20]. How a CNN predicts the results and which features are important for predicting with high accuracy can be crucial in the CNN’s design and data preparation. CNN visualization tools can also present a unique opportunity for specific applications, such as [21]. Occlusion sensitivity analysis is a relatively simple process. It assumes that the probability score in the CNN’s class prediction will change if an area of the image is occluded. An occluded area, or occlusion mask, can be a single pixel or a larger area in the image. The probability score differences can be overleaped if the occluded area is moved across the image. The probability score differences will form an occlusion map—an image of the same size as the original image, but its pixel values are the probability score differences. The occlusion sensitivity principle is shown in Figure 10.
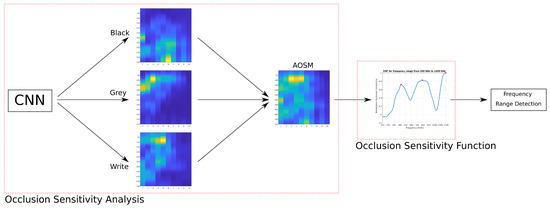
Figure 9.
Proposed frequency range optimization algorithm based on occlusion sensitivity.
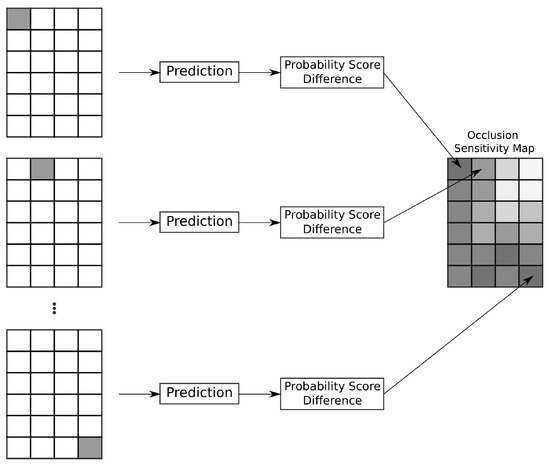
Figure 10.
Occlusion sensitivity principle.
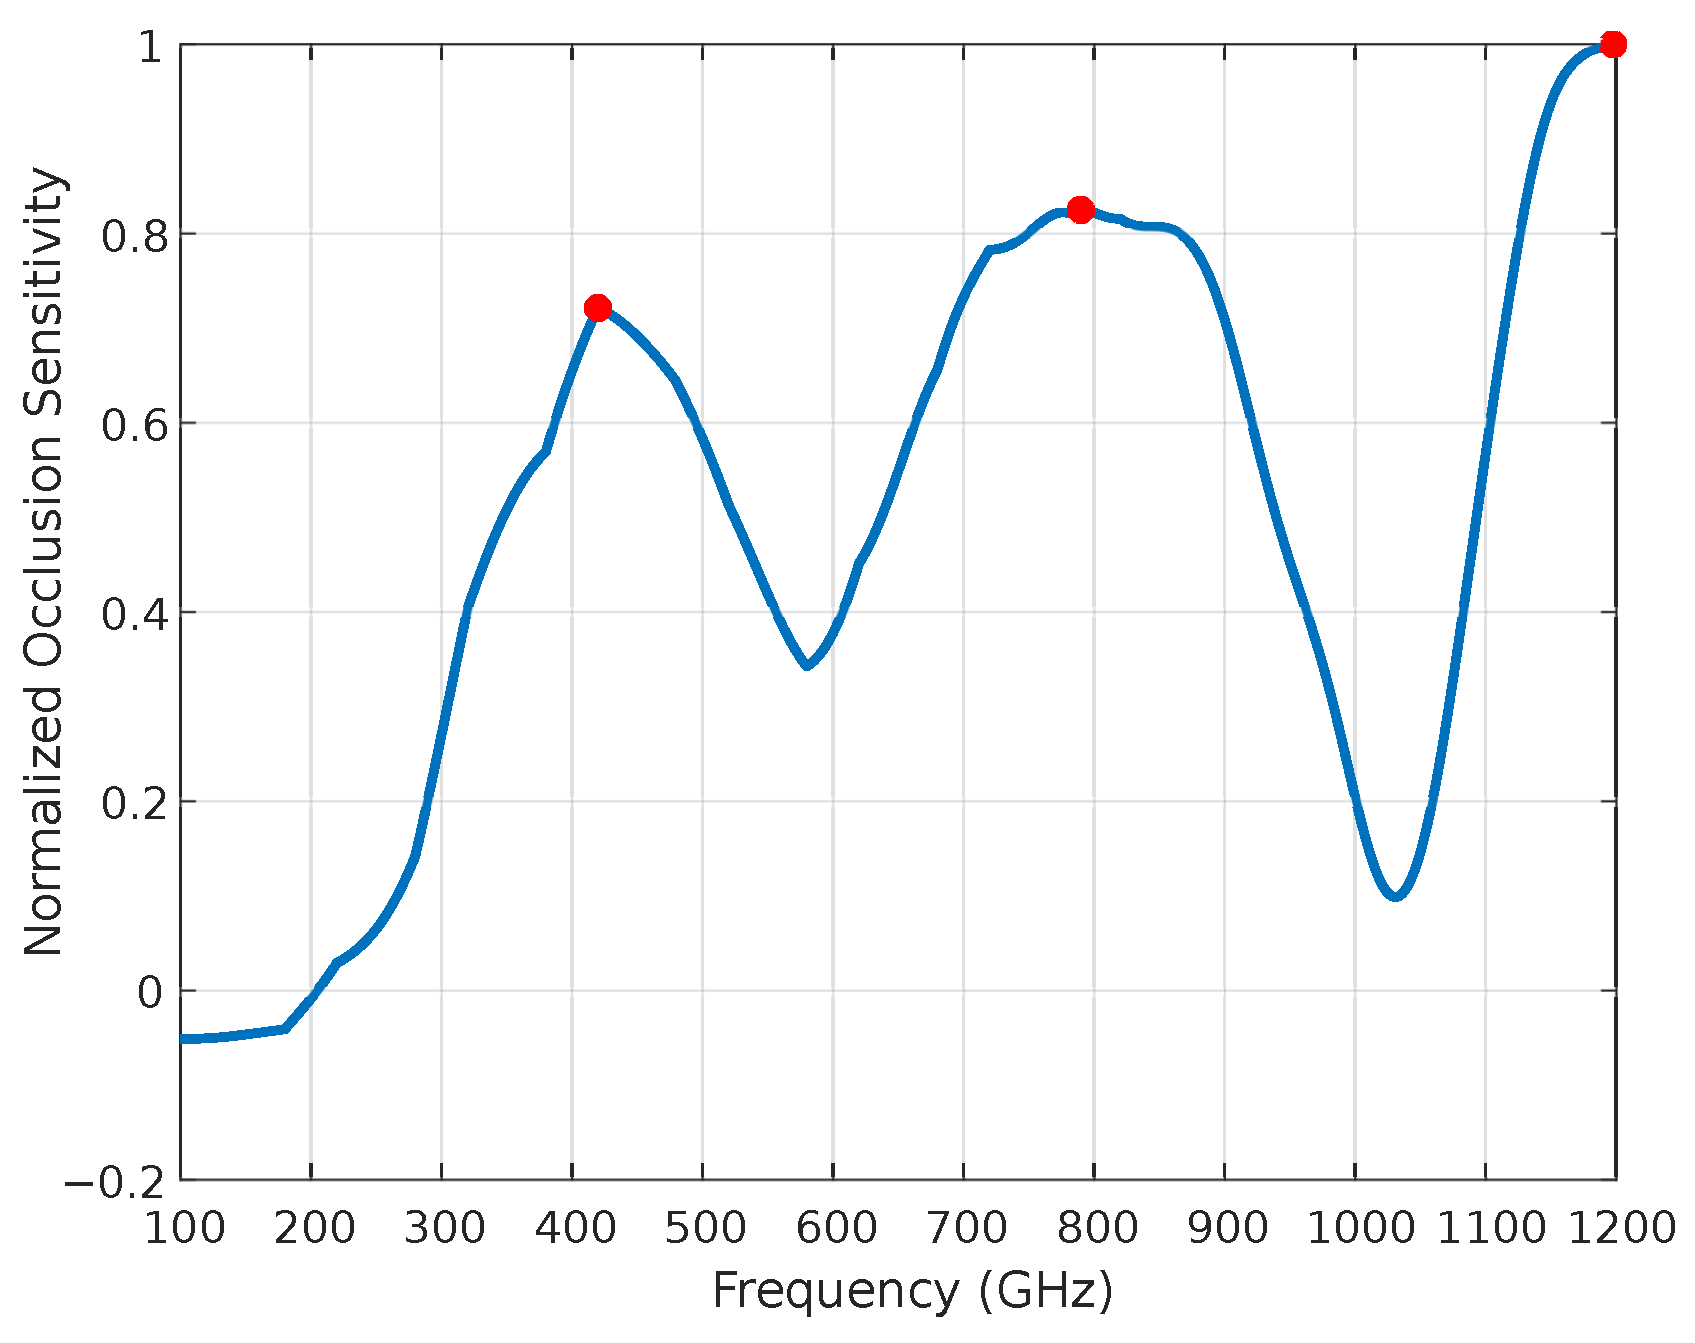
The occlusion map is created for a single class. Three different classes were chosen in the proposed solution—gray, white, and a black plastic plate. Several occlusion maps were estimated for each class, and all occlusion maps were averaged. In the resulting average occlusion sensitivity map (AOSM), an intersection was performed between points of interest. The AOSM withholds information on areas in the 2D image most important for successful prediction for all three classes. In the second step of the proposed FRO algorithm, rows in the AOSM are combined to form an occlusion sensitivity function (OSF). An OSF is a function of frequency and not a position in a 2D image. An inverse WSD algorithm and linear interpolation were used for creating the OSF. The data series’ length was estimated as ·n, where m is the number of columns, and n is the number of rows in the AOSM. The data in the first row of the AOSM represent the first m frequencies in the spectrum, and the data in the second AOSM’s row represent the first frequencies. Following this principle, the last row represents the full spectrum, dilated with dilation factor . The resulting OSF is shown in Figure 11. The OSF shows which frequencies are the most important for distinguishing between the three different materials in the observed sample.
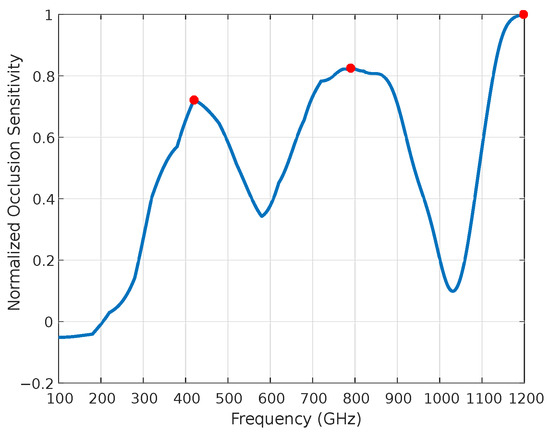
Figure 11.
OSF function with marked peaks.
The local maximums in the OSF were detected and the optimal frequency range was selected in the third step of the proposed FRO algorithm. Local maximums represent the frequencies at which the prediction obtained with the CNN would be the most sensitive (i.e., which frequencies in the observed spectrum were the most important in the prediction). The optimal frequency range can be determined around the detected local maximums using the following criteria:
where is the starting frequency and is the end frequency. Based on the proposed criterion, three frequency ranges were detected, and are shown in Table 2. The second optimized frequency range was wider between the determined frequency ranges. Therefore, the image acquisition speed improvement would be lower, but the acquired image could have a higher contrast. As it is, the most improvement in acquisition speed could be provided with the last frequency range, which was the narrower among the three selected ranges.

Table 2.
Extracted frequency ranges based on the proposed algorithm.
6. Experimental Results
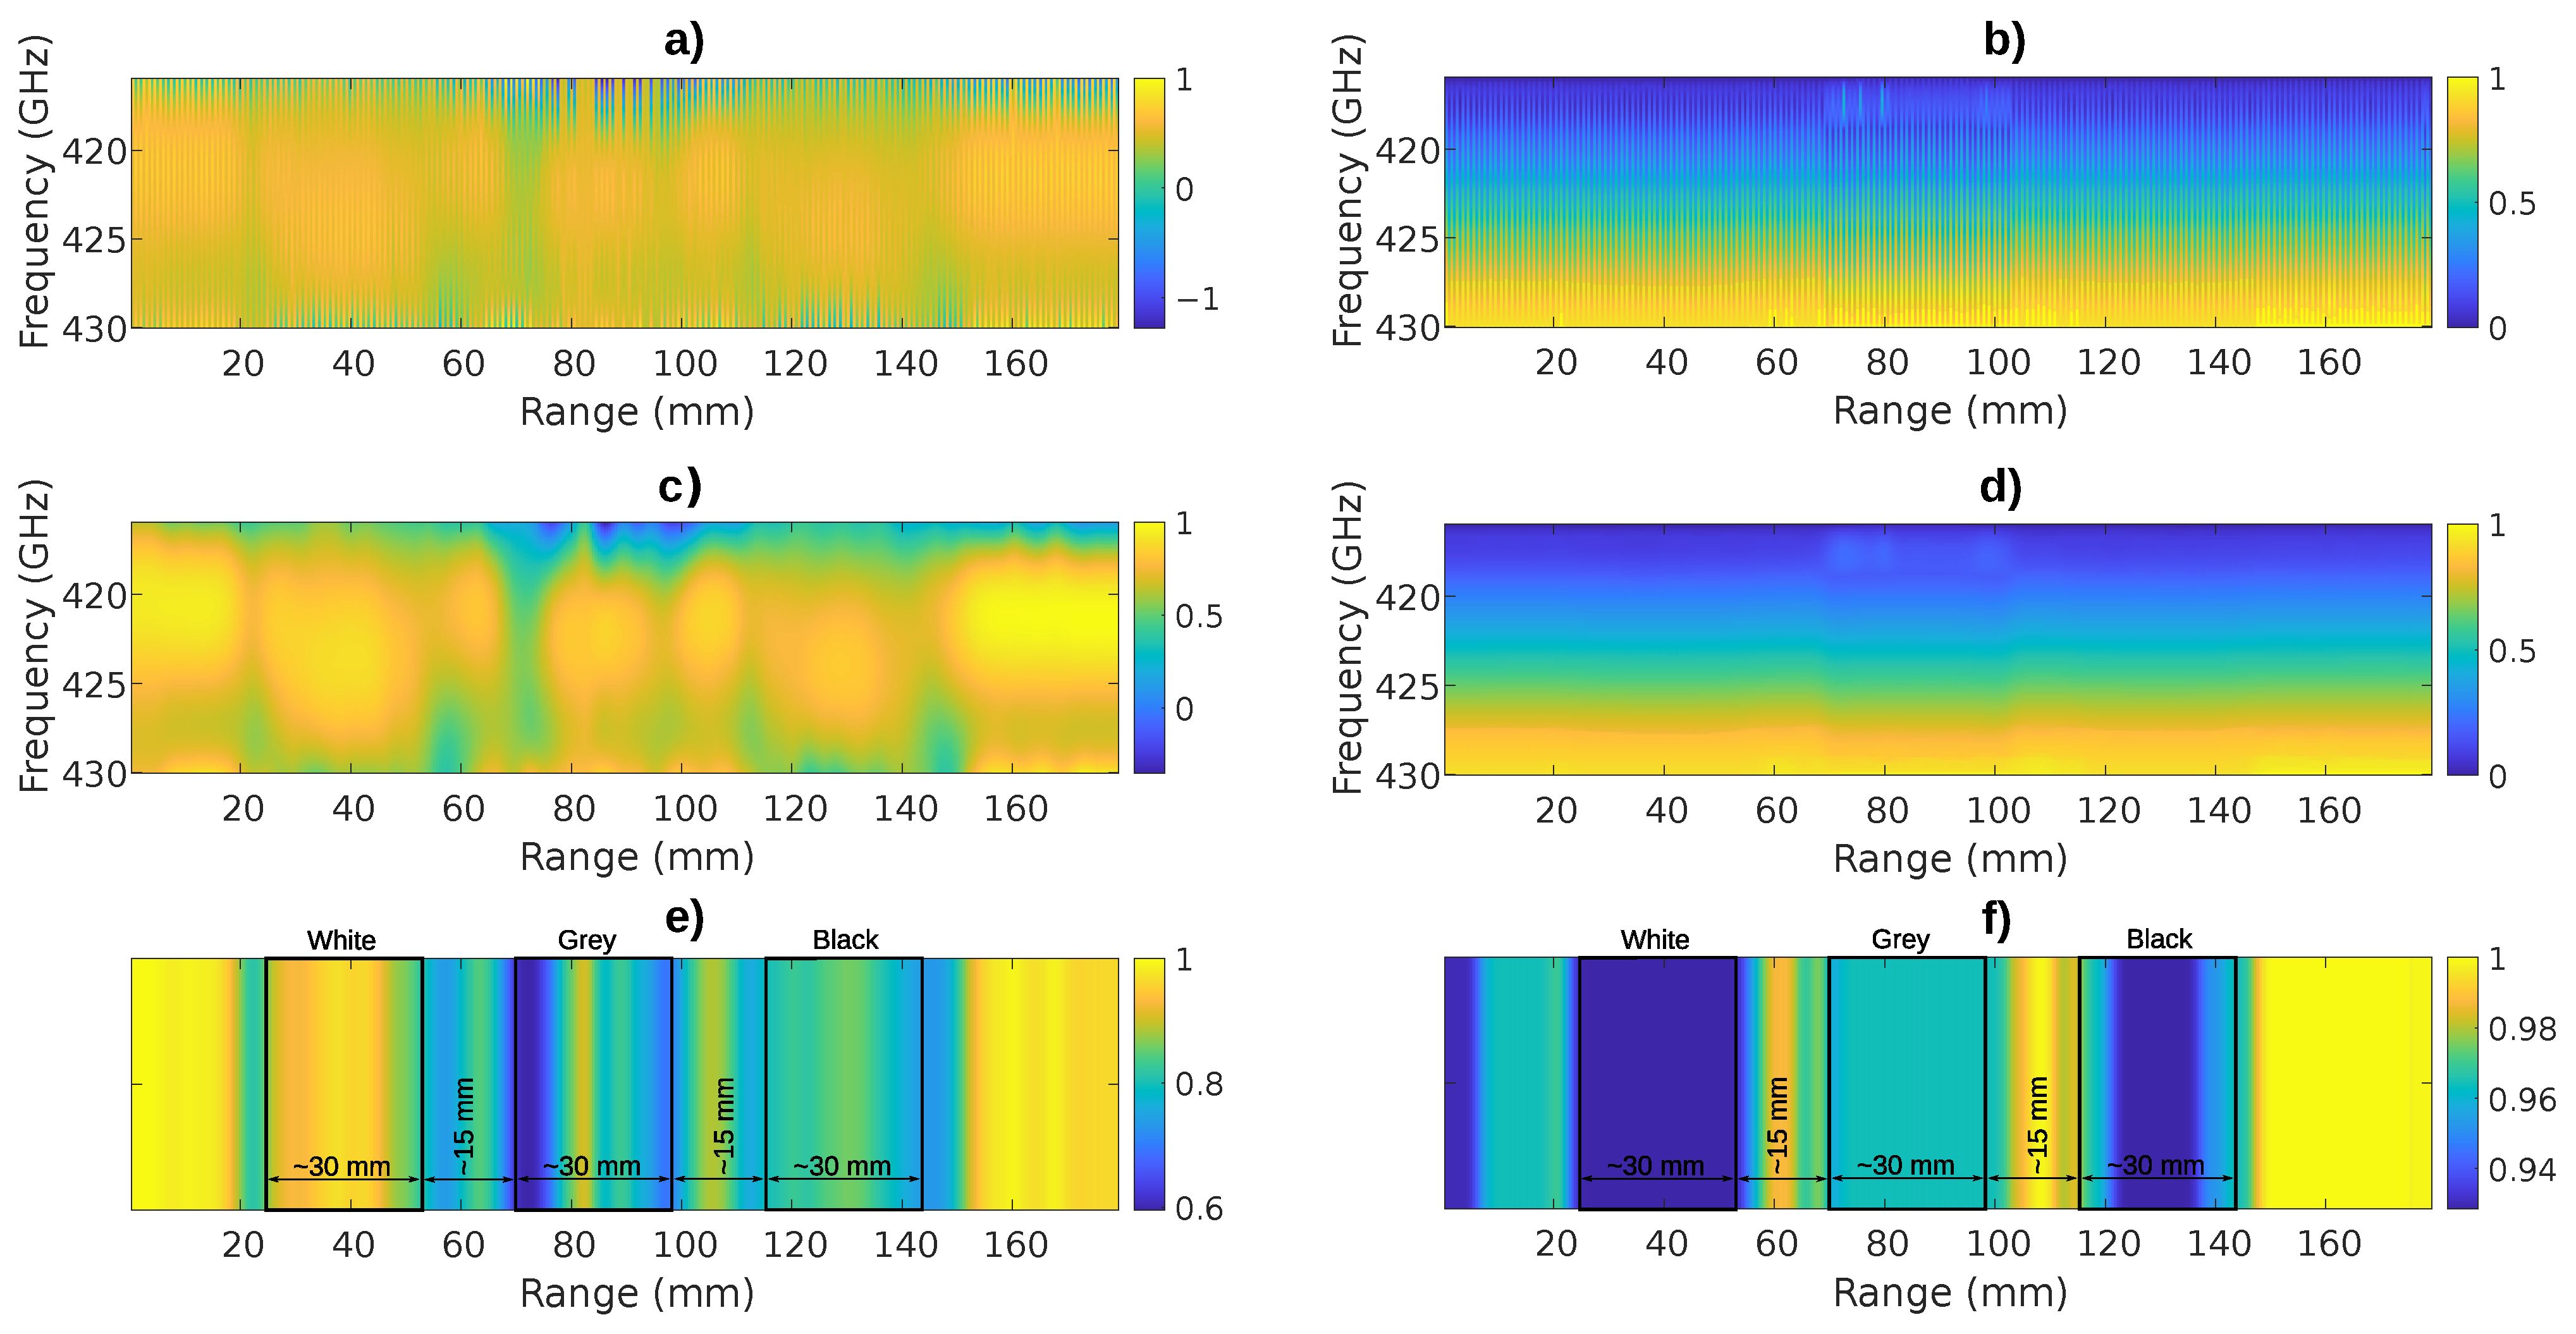
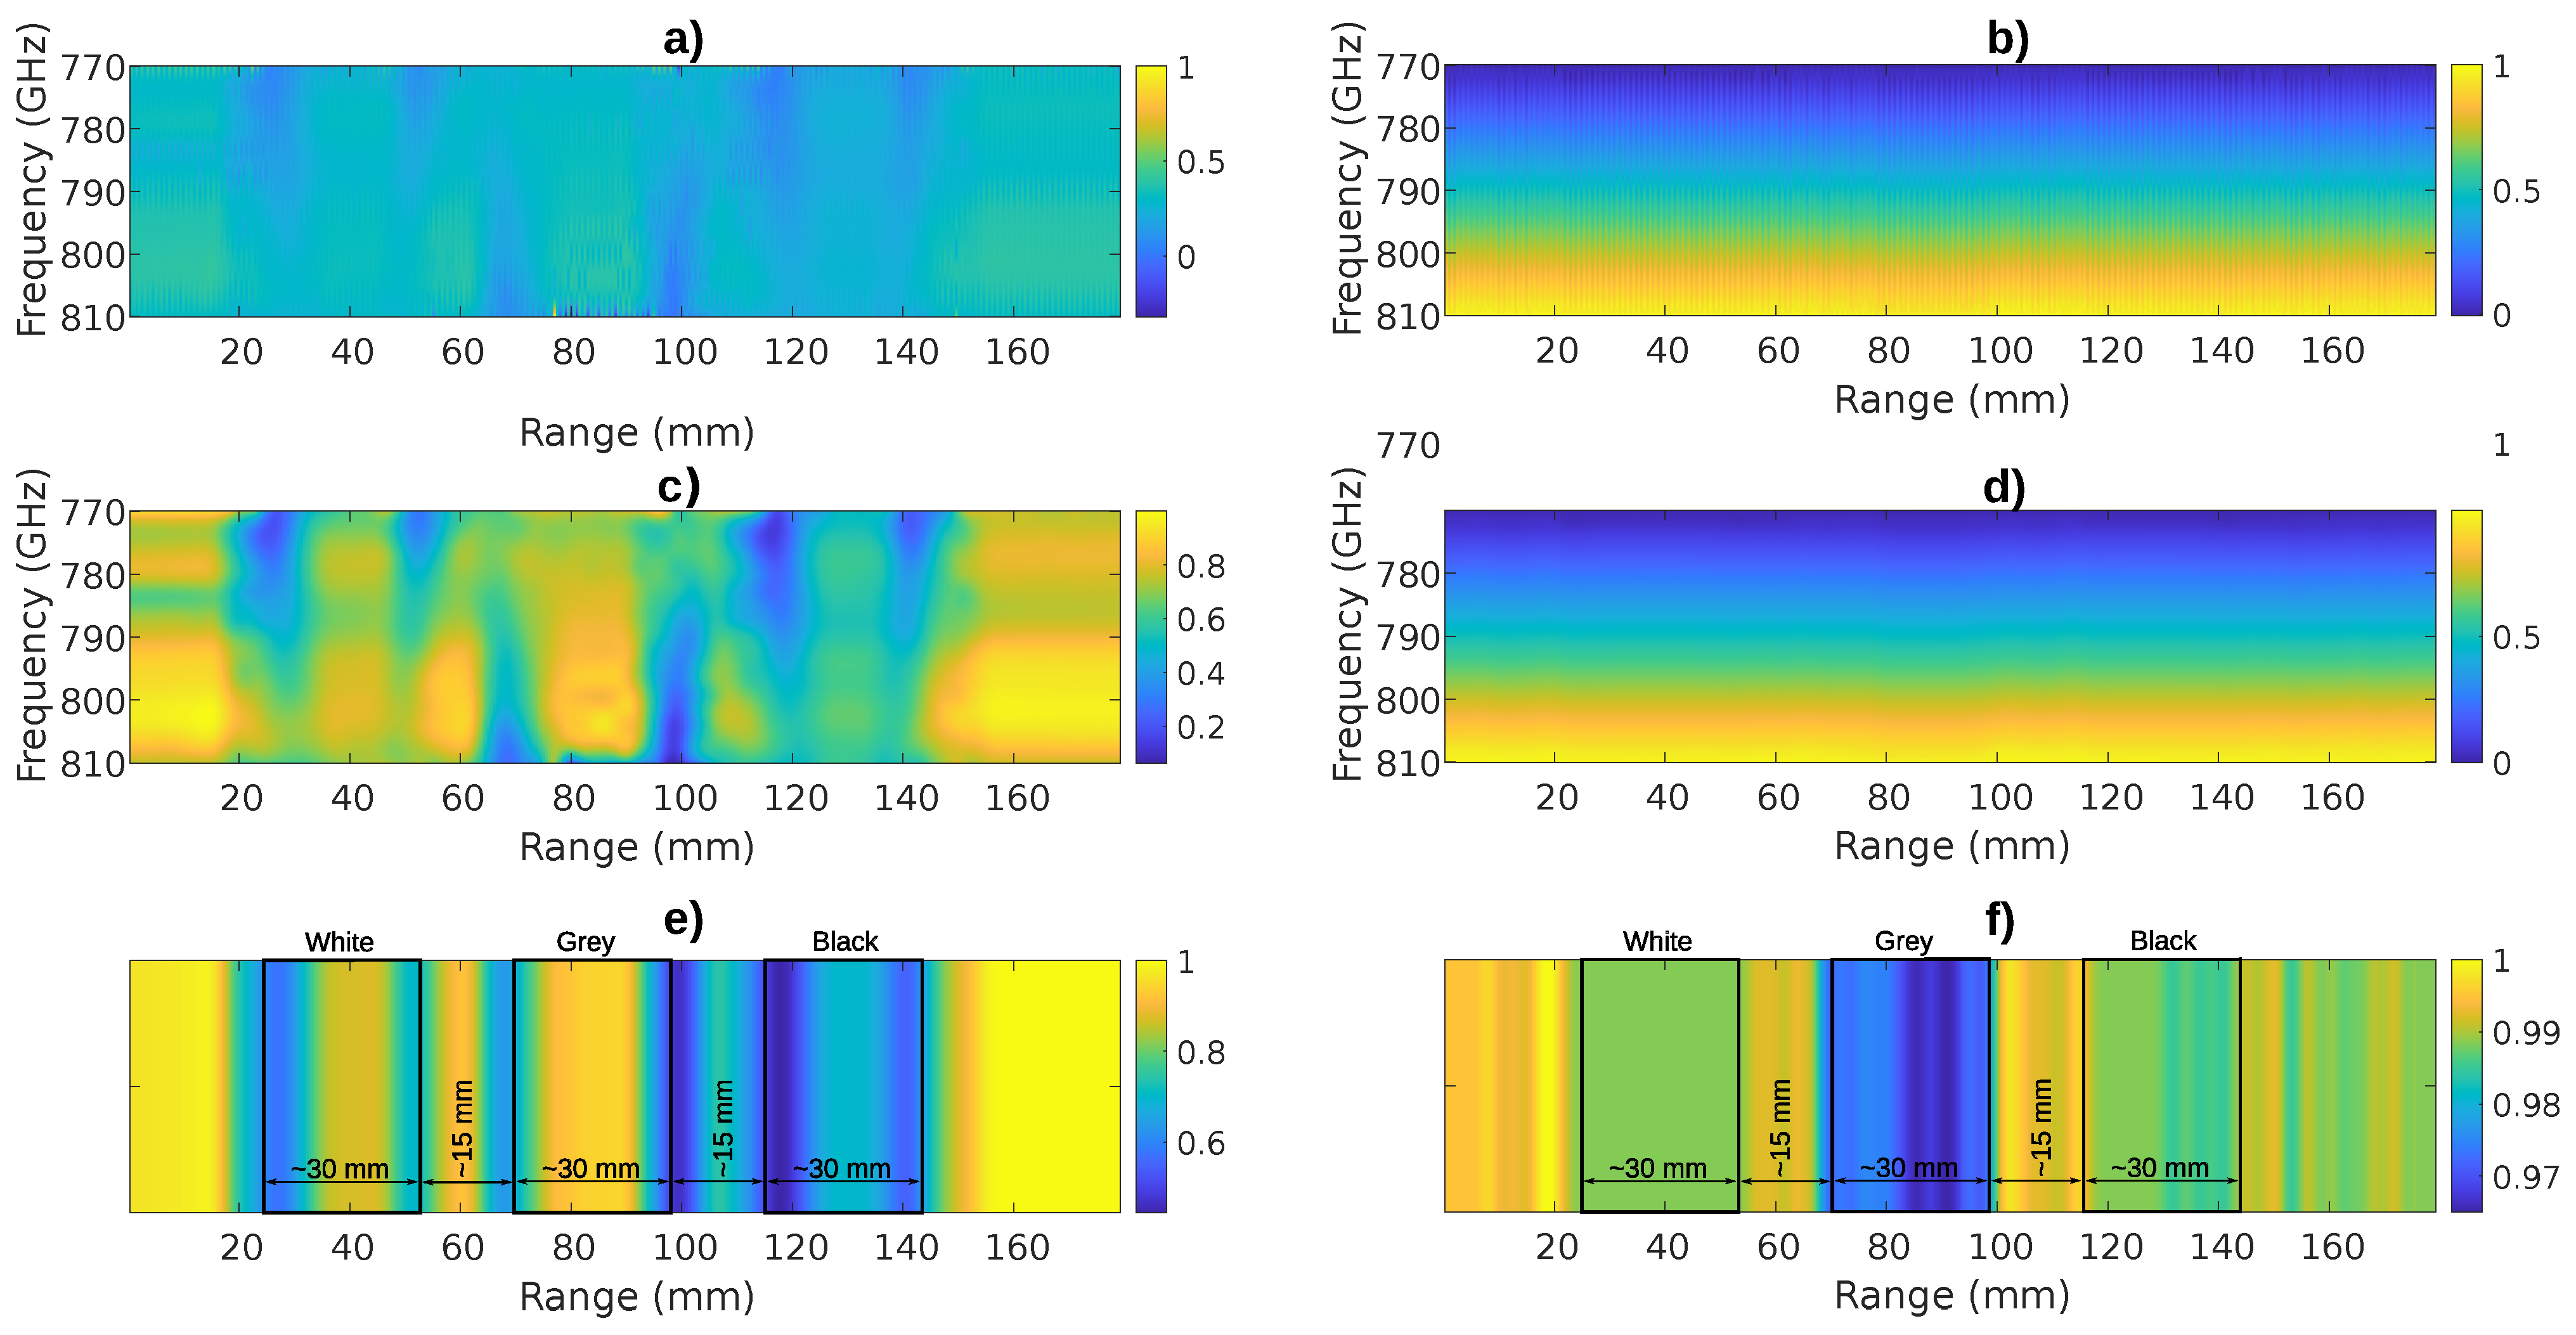
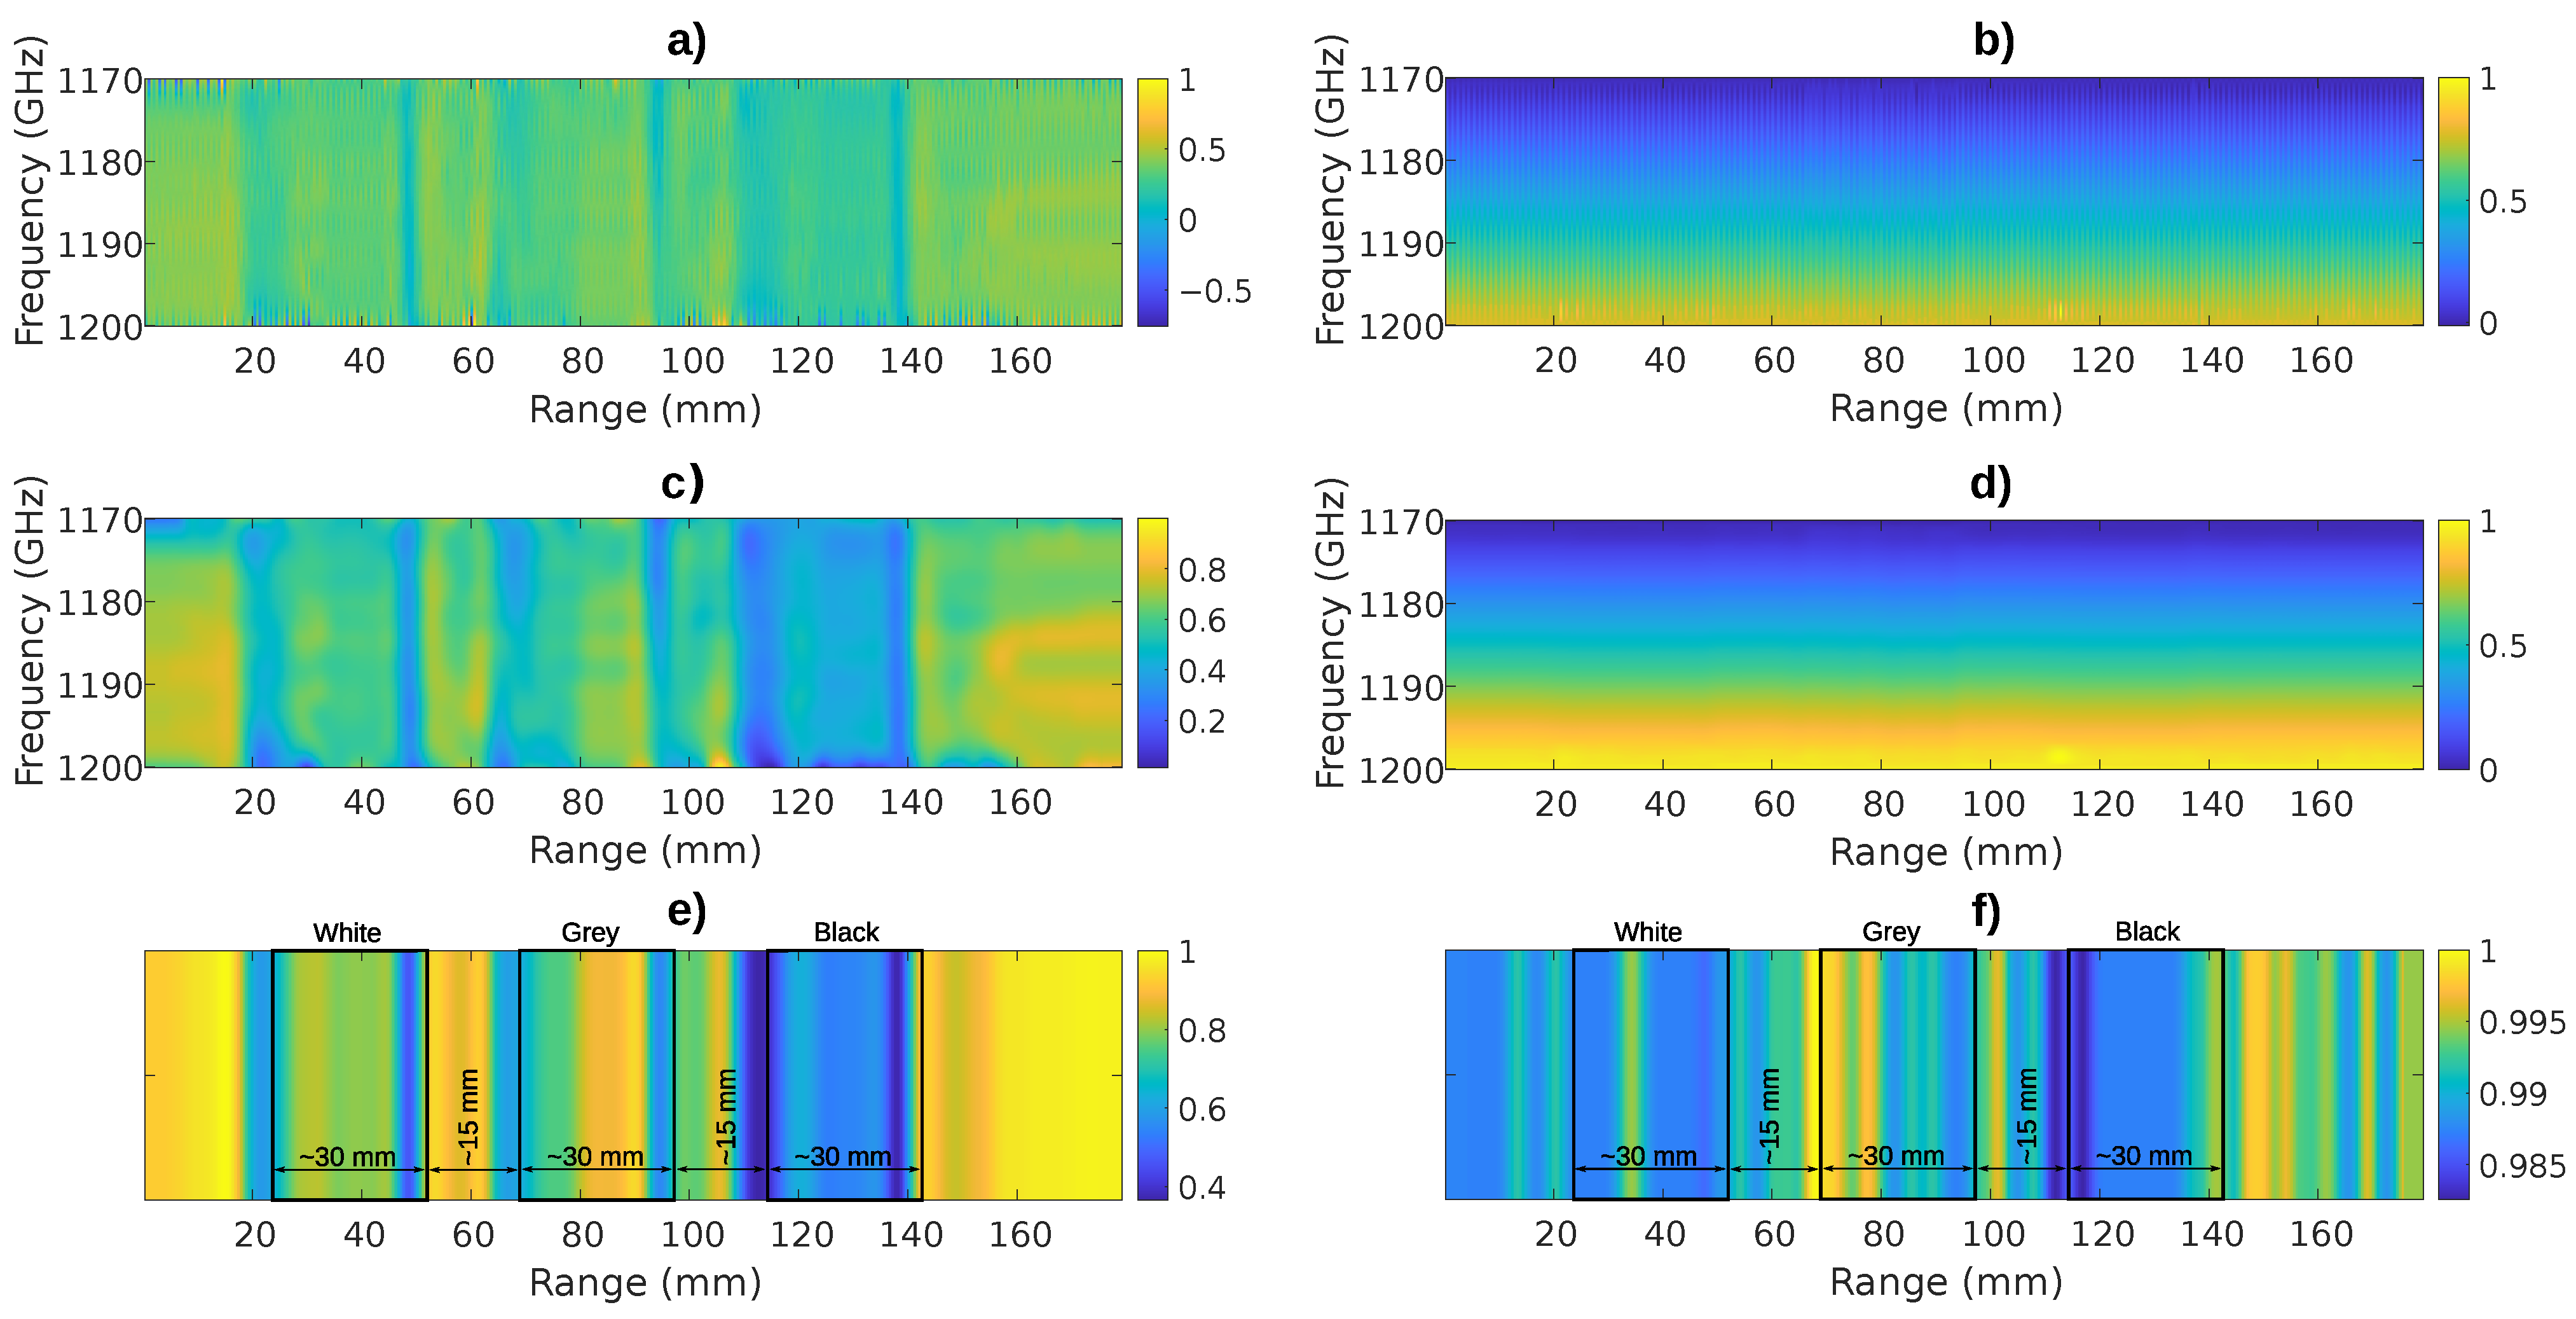
This paper proposes a frequency range optimization based on a CNN’s occlusion sensitivity. Proposed frequency range optimization was experimentally evaluated using the THz-FDS imaging principle proposed in preliminary work [17] and described in Section 3. In this paper, a CNN and occlusion sensitivity were used for frequency range optimization, as shown in Section 5. The optimal frequency range should have a relatively short bandwidth, and would have to retain the spectral characteristics of the observed sample or materials. The expert empirically determined the optimal frequency range from 710 GHz to 810 GHz, while the proposed algorithm in Section 5 determined three ranges: 1170 GHz to 1200 GHz, 770 GHz to 810 GHz, and 416–430 GHz. New datasets were acquired in frequency ranges stated in Table 3 and the 1D images were reconstructed for all the acquired datasets. Each of the images seemed to retain spectral information, but the most visually distinguishable was the frequency range between 770 GHz and 810 GHz. In addition, measurements in all frequency ranges were faster than the reference measurements.

Table 3.
Estimated image acquisition times for frequency ranges from Table 2 and for the reference measurement.
In the second part of the experiment, measurements were performed in the frequency ranges from Table 2. Other settings remained the same as in the reference measurement. Figure 12 shows the resulting images for measurements in the frequency range between 416 GHz and 430 GHz. Figure 12e,f show a compressed 1D intensity image and compressed 1D phase image, respectively. In both images the plastic plates are distinguishable. However, the spectral features are not as clearly visible as in the reference measurement.
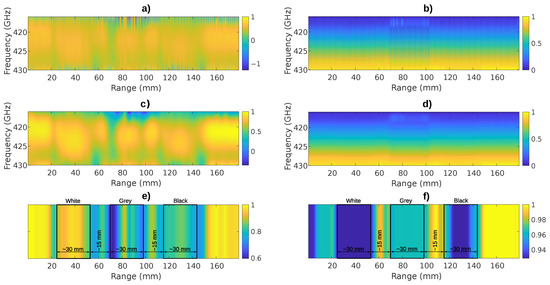
Figure 12.
Spectrograms and images for acquisition in the frequency range 416–430 GHz: (a) Peak envelope spectrogram. (b) Unwrapped phase spectrogram. (c) Peak envelope spectrogram processed using GSF. (d) Unwrapped phase spectrogram processed using GSF. (e) Compressed 1D intensity image with marked plastic plates‘ positions. (f) Compressed 1D phase image with marked plastic plates’ positions.
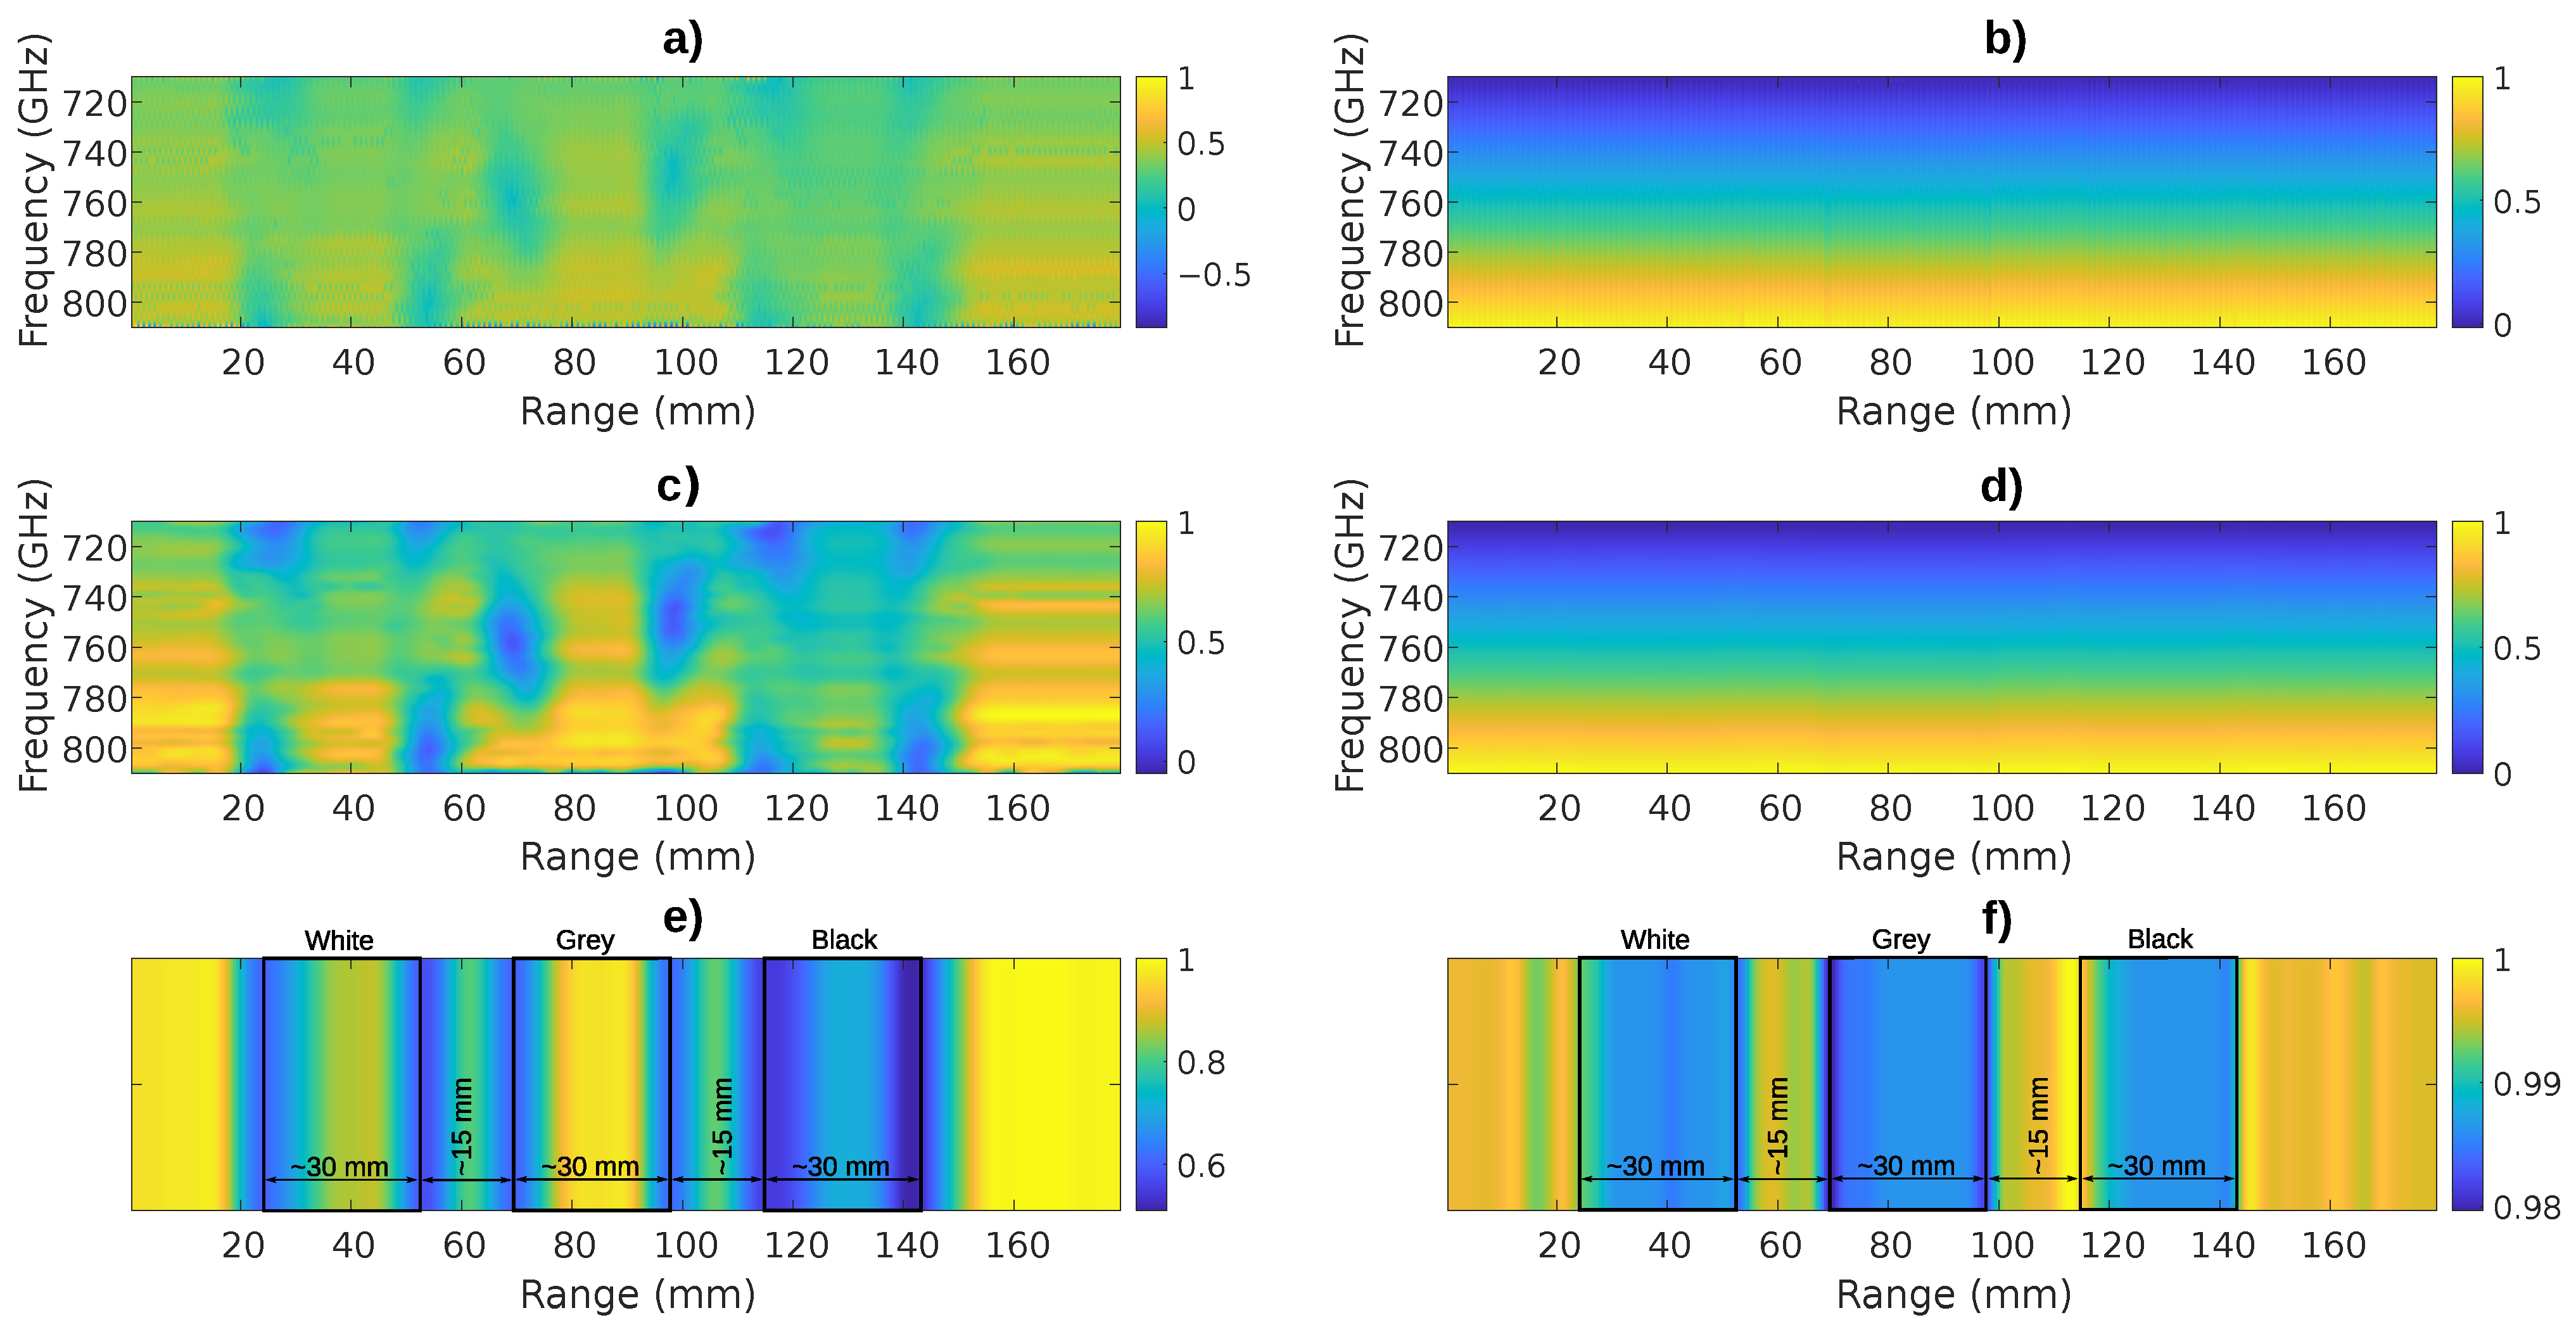
Figure 13 shows the resulting images for measurements in the frequency range between 770 GHz and 810 GHz. Figure 13e,f show a compressed 1D intensity image and compressed 1D phase image, respectively. The plastic plates are distinguishable among them and are clearly distinguishable from the environment. The results in Figure 13 are similar to the results from the reference measurements shown in Figure 14. However, because of the shorter frequency range, some uncertainties are present.
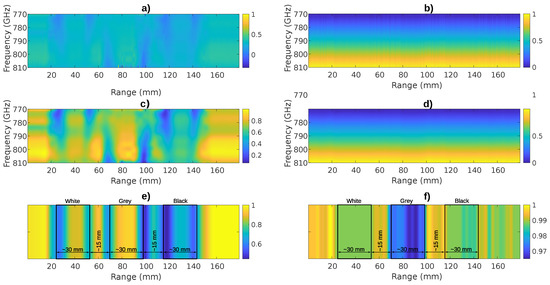
Figure 13.
Spectrograms and images for acquisitions in the frequency range 770–810 GHz: (a) Peak envelope spectrogram. (b) Unwrapped phase spectrogram. (c) Peak envelope spectrogram processed using GSF, (d) Unwrapped phase spectrogram processed using GSF. (e) Compressed 1D intensity image with marked plastic plates‘ positions. (f) Compressed 1D phase image with marked plastic plates’ positions.
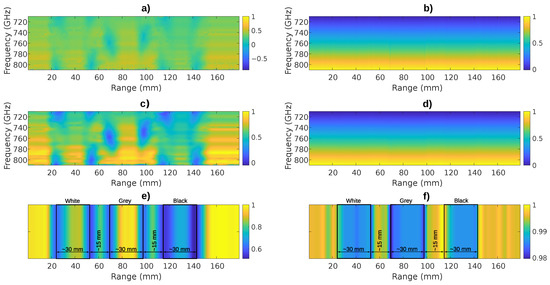
Figure 14.
Spectrograms and images for acquisition in the frequency range 710–810 GHz: (a) Peak envelope spectrogram. (b) Unwrapped phase spectrogram. (c) Peak envelope spectrogram processed using GSF. (d) Unwrapped phase spectrogram processed using GSF. (e) Compressed 1D intensity image with marked plastic plates’ positions. (f) Compressed 1D phase image with marked plastic plates’ positions.
Figure 15 shows the resulting images for measurements in the frequency range between 1170 GHz and 1200 GHz. Figure 15e,f show a compressed 1D intensity image and compressed 1D phase image, respectively. However, their spectral characteristics are not distinguishable, and this image could be deemed unusable for further processing.
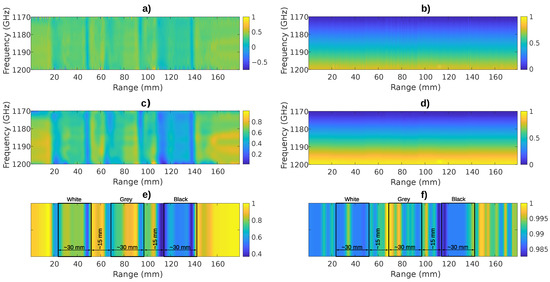
Figure 15.
Spectrograms and images for acquisition in the frequency range 1170–1200 GHz: (a) Peak envelope spectrogram, (b) Unwrapped phase spectrogram. (c) Peak envelope spectrogram processed using GSF. (d) Unwrapped phase spectrogram processed using GSF. (e) Compressed 1D intensity image with marked plastic plates’ positions. (f) Compressed 1D phase image with marked plastic plates’ positions.
The visual results show that the selected optimal frequency ranges could be adequate for further processing. The proposed FRO algorithm was intended to help mitigate the long acquisition times in CW THz imaging. The acquisition time of a single pixel is linked to bandwidth B, frequency step and integration time and can be estimated as . The frequency step and integration time were kept the same throughout all four measurements, while the bandwidth was changed. First row of Table 3 shows acquisition parameters for the whole available spectrum. Image acquisition utilizing the whole spectrum would take more than 34 hours to complete. The second row of Table 3 shows acquisition parameters for the empirically determined frequency range. With narrower bandwidth, there is a big drop in image acquisition time. The optimised frequency ranges all have a lot shorter single-pixel acquisition times, as shown in fourth column of Table 3. Shorter single-pixel acquisition times will improve the overall image acquisition times, as shown in the last column of Table 3.
7. Conclusions
This paper proposes an FRO algorithm for CW-THz imaging based on a CNN and an occlusion sensitivity algorithm. THz imaging is based mainly on THz-TDS systems. However, THz-FDS systems could be more suited for certain applications. THz-FDS systems suffer from two main disadvantages. The first disadvantage is low acquisition speed, and the second disadvantage is high tuning error and low repeatability. A novel imaging principle for THz-FDS imaging is proposed in this paper. The imaging principle is a combination of raster imaging and full-field imaging. A relatively wide collimated THz beam passes through the sample and is detected in transmission mode. With a linear rail, the position of the PCAs change in a way that overleaps other measurements. If the linear rail’s movement step is much smaller than the THz beam’s apperture, the proposed GSF can be used for the THz-FDS’s frequency tuning error mitigation. The proposed imaging principle solved the problem of long acquisition times. In this paper, a CNN and occlusion sensitivity are used for frequency range optimization, which, in principle, would find an ideal frequency range. The deal frequency range should have a relatively short bandwidth, and would have to retain the spectral characteristics of the observed samples or materials. The proposed frequency range algorithm was evaluated experimentally, and compared to an expert‘s opinion. The expert determined the ideal frequency range from 710 GHz to 810 GHz, while the proposed algorithm determined three ranges: 1170 GHz to 1200 GHz, 770 GHz to 810 GHz, and 416–430 GHz. One-dimensional images were reconstructed for all the optimized frequency ranges. Each of the images seemed to retain all the spectral information, but the most visually distinguishable was the frequency range between 770 GHz and 810 GHz. In addition, measurements in all frequency ranges were faster than the reference measurement. The proposed frequency range optimization was used successfully for frequency range optimization. The proposed THz imaging principle and frequency range optimization algorithm could mitigate the two shortcomings of THz-FDS systems in imaging applications: low acquisition speed and frequency tuning error. In further research, the proposed imaging principle and frequency range optimization could be used for 2D image acquisition and reconstruction.
Author Contributions
Conceptualization, B.P., A.S. and D.G.; methodology, B.P., A.S. and D.G.; software, B.P. and A.S.; validation, B.P. and D.G.; formal analysis, B.P. and D.G.; investigation, B.P.; resources, B.P.; data curation, B.P.; writing—original draft preparation, B.P. and A.S.; writing—review and editing, D.G.; visualization, B.P.; supervision, D.G.; project administration, D.G.; funding acquisition, D.G. All authors have read and agreed to the published version of the manuscript.
Funding
This research was funded by the Slovenian Research Agency (ARRS) Grant number J7-9408 and Research program number P2-0065.
Institutional Review Board Statement
Not applicable.
Informed Consent Statement
Not applicable.
Data Availability Statement
Not applicable.
Conflicts of Interest
The authors declare no conflict of interest.
Abbreviations
The following abbreviations are used in this manuscript:
| THz | Terahertz |
| CW | Continuous wave |
| PCA | Photoconductive antenna |
| TDS | Time Domain Spectroscopy |
| FDS | Frequency Domain Spectroscopy |
| SAR | Synthetic Aperture Radar |
| GSF | Gauss Spotlight Filter |
| 1D | One-dimensional |
| CNN | Convolutional Neural Network |
| WSD | Windowing Spectrum Dilation |
| 2D | Two-dimensional |
| OSF | Occlusion Sensitivity Function |
| DFB | Distributed Feedback |
| LIA | Lock-in-Amplifier |
| CF | Convolution Filter |
| FRO | Frequency Range Optimization |
| AOSM | Average Occlusion Sensitivity Map |
References
- Lee, Y.-S. Principles of Terahertz Science and Technology; Springer: New York, NY, USA, 2009. [Google Scholar] [CrossRef]
- Shi, C.; Ma, Y.; Zhang, J.; Wei, D.; Wang, H.; Peng, X.; Tang, M.; Yan, S.; Zuo, G.; Du, C.; et al. Terahertz time-domain spectroscopy of chondroitin sulfate. Biomed. Opt. Express 2018, 9, 1350. [Google Scholar] [CrossRef] [PubMed]
- Lu, J.H.; Chen, C.; Huang, C.; Leu, S.Y.; Lee, D.J. Glucose fermentation with biochar amended consortium: Sequential fermentations. Bioresour. Technol. 2020, 203, 122933. [Google Scholar] [CrossRef]
- Ren, A.; Zahid, A.; Imran, M.A.; Alomainy, A.; Fan, D.; Abbasi, Q.H. Terahertz sensing for fruit spoilage monitoring. In Proceedings of the 2019 2nd International Workshop on Mobile Terahertz Systems, IWMTS 2019, Bad Neuenahr, Germany, 1–3 July 2019; pp. 1–4. [Google Scholar] [CrossRef]
- Fuse, N.; Sugae, K. Non-destructive terahertz imaging of alkali products in coated steels with cathodic disbanding. Prog. Org. Coat. 2019, 137, 105334. [Google Scholar] [CrossRef]
- Stübling, E.M.; Rehn, A.; Siebrecht, T.; Bauckhage, Y.; Öhrström, L.; Eppenberger, P.; Balzer, J.C.; Rühli, F.; Koch, M. Application of a robotic THz imaging system for sub-surface analysis of ancient human remains. Sci. Rep. 2019, 9, 3390. [Google Scholar] [CrossRef] [PubMed]
- Batra, A.; Barowski, J.; Damyanov, D.; Wiemeler, M.; Rolfes, I.; Schultze, T.; Balzer, J.C.; Gohringer, D.; Kaiser, T. Short-Range SAR Imaging From GHz to THz Waves. IEEE J. Microw. 2021, 1, 574–585. [Google Scholar] [CrossRef]
- Zanotto, L.; Piccoli, R.; Dong, J.; Caraffini, D.; Morandotti, R.; Razzari, L. Time-domain terahertz compressive imaging. Opt. Express 2020, 28, 3795. [Google Scholar] [CrossRef]
- Fosodeder, P.; van Frank, S.; Rankl, C. Highly accurate THz-CT including refraction effects. Opt. Express 2022, 30, 3684–3699. [Google Scholar] [CrossRef]
- Tzydynzhapov, G.; Gusikhin, P.; Muravev, V.; Dremin, A.; Nefyodov, Y.; Kukushkin, I. New Real-Time Sub-Terahertz Security Body Scanner. J. Infrared Millim. Terahertz Waves 2020, 41, 632–641. [Google Scholar] [CrossRef]
- Gu, S.; Xi, G.; Ge, L.; Yang, Z.; Wang, Y.; Chen, W.; Yu, Z. Compressed Sensing for THz FMCW Radar 3D Imaging. Complexity 2021, 2021, 5576782. [Google Scholar] [CrossRef]
- Ahi, K.; Anwar, M. Developing terahertz imaging equation and enhancement of the resolution of terahertz images using deconvolution. Terahertz Phys. Devices Syst. X Adv. Appl. Ind. Def. 2016, 9856, 98560N. [Google Scholar] [CrossRef]
- Zhang, Y.; Wang, C.; Huai, B.; Wang, S.; Zhang, Y.; Wang, D.; Rong, L.; Zheng, Y. Continuous-wave thz imaging for biomedical samples. Appl. Sci. 2021, 11, 71. [Google Scholar] [CrossRef]
- Valušis, G.; Lisauskas, A.; Yuan, H.; Knap, W.; Roskos, H.G. Roadmap of terahertz imaging 2021. Sensors 2021, 21, 4092. [Google Scholar] [CrossRef]
- Zhang, Y.; Zhao, J.; Wang, D.; Li, K.; Rong, L.; Wang, Y. Lensless Fourier-Transform Terahertz Digital Holography for Full-Field Reflective Imaging. Front. Phys. 2022, 9, 60–66. [Google Scholar] [CrossRef]
- Recur, B.; Frederique, L.; Bousquet, B.; Canioni, L.; Mounaix, P. Review of Terahertz Tomography Techniques. J. Infrared Millim. Terahertz Waves 2014, 35, 382–411. [Google Scholar] [CrossRef]
- Pongrac, B.; Sarjaš, A.; Gleich, D. THz imaging based on Frequency Domain Spectroscopy. In Proceedings of the 2022 International Conference on Broadband Communications for Next Generation Networks and Multimedia Applications (CoBCom), Graz, Austria, 12–14 July 2022; pp. 1–5. [Google Scholar] [CrossRef]
- Jepsen, P.U.; Keiding, S.R. Radiation patterns from lens-coupled terahertz antennas. Opt. Lett. 1995, 20, 807–809. [Google Scholar] [CrossRef]
- Sarjaš, A.; Pongrac, B.; Gleich, D. Automated inorganic pigment classification in plastic material using terahertz spectroscopy. Sensors 2021, 21, 4709. [Google Scholar] [CrossRef]
- Zeiler, M.D.; Fergus, R. Visualizing and Understanding Convolutional Networks. In Proceedings of the Computer Vision—ECCV 2014, Zurich, Switzerland, 6–12 September 2014; Fleet, D., Pajdla, T., Schiele, B., Tuytelaars, T., Eds.; Springer International Publishing: Cham, Switzerland, 2014; pp. 818–833. [Google Scholar]
- Aminu, M.; Ahmad, N.A.; Mohd Noor, M.H. COVID-19 detection via deep neural network and occlusion sensitivity maps. Alex. Eng. J. 2021, 60, 4829–4855. [Google Scholar] [CrossRef]
- Safian, R.; Ghazi, G.; Mohammadian, N. Review of photomixing continuous-wave terahertz systems and current application trends in terahertz domain. Opt. Eng. 2019, 58, 110901. [Google Scholar] [CrossRef]
- Guo, R.; Lu, J.; Liu, S.; Shi, Y.; Zhou, Y.; Chen, Y.; Luan, J.; Chen, X. Multisection DFB Tunable Laser Based on REC Technique and Tuning by Injection Current. IEEE Photonics J. 2016, 8, 1–7. [Google Scholar] [CrossRef]
- Njegovec, M.; Donlagic, D. Rapid and broad wavelength sweeping of standard telecommunication distributed feedback laser diode. Opt. Lett. 2013, 38, 1999. [Google Scholar] [CrossRef] [PubMed]
- Lee, G.; Lee, S.J.; Lee, C. A convolutional neural network model for abnormality diagnosis in a nuclear power plant. Appl. Soft Comput. 2021, 99, 106874. [Google Scholar] [CrossRef]
- Yao, Y.; Wang, J.; Xie, M.; Hu, L.; Wang, J. A new approach for fault diagnosis with full-scope simulator based on state information imaging in nuclear power plant. Ann. Nucl. Energy 2020, 141, 107274. [Google Scholar] [CrossRef]
- Li, H.; Lin, Z.; Shen, X.; Brandt, J.; Hua, G. A convolutional neural network cascade for face detection. In Proceedings of the 2015 IEEE Conference on Computer Vision and Pattern Recognition (CVPR), Boston, MA, USA, 7–12 June 2015; pp. 5325–5334. [Google Scholar] [CrossRef]
- Jais, I.K.M.; Ismail, A.R.; Nisa, S.Q. Adam Optimization Algorithm for Wide and Deep Neural Network. Knowl. Eng. Data Sci. 2019, 2, 41. [Google Scholar] [CrossRef]
Disclaimer/Publisher’s Note: The statements, opinions and data contained in all publications are solely those of the individual author(s) and contributor(s) and not of MDPI and/or the editor(s). MDPI and/or the editor(s) disclaim responsibility for any injury to people or property resulting from any ideas, methods, instructions or products referred to in the content. |
© 2023 by the authors. Licensee MDPI, Basel, Switzerland. This article is an open access article distributed under the terms and conditions of the Creative Commons Attribution (CC BY) license (https://creativecommons.org/licenses/by/4.0/).

