Communication

Effect of Antimony Content on Transition Behavior and Electric Properties of (K0.44Na0.52Li0.04)(Nb0.9−xTa0.10Sbx)O3 Ceramics

1
Institute of Research in Materials Science and Technology (INTEMA), Av. Colón 10850, Mar del Plata B7606BWV, Argentina
2
Department of Electroceramics, Institute of Ceramics and Glass, CSIC, Kelsen 5, 28049 Madrid, Spain
3
Higher Polytechnic School, Antonio de Nebrija University, C/Pirineos, 55, 28040 Madrid, Spain
*
Authors to whom correspondence should be addressed.
Appl. Sci. 2023, 13(2), 992; https://doi.org/10.3390/app13020992
Submission received: 30 November 2022 / Revised: 4 January 2023 / Accepted: 6 January 2023 / Published: 11 January 2023
(This article belongs to the Section Materials Science and Engineering)

Abstract

:
Here, (K0.44Na0.52Li0.04)(Nb0.9−xTa0.1Sbx)O3 [KNL−(N0.9−xTSx)] lead-free ceramics with potential technological applications are made through B-position substitution on the perovskite structure by Sb ions. This strategy generates crystal structure changes and stabilizes a tetragonal symmetry, T, giving place to an orthorhombic (O–T) phase boundary close to room temperature. Specifically, our results establish that an increase in relative volume fractions of the T on the O–T phase boundary produces an increase in functional properties. More relevantly, this improvement in properties is accompanied by controlling the grain size. Therefore, an increase in grain size promotes the increased domain size, favoring more domain wall motion and domain switching. Both effects result in an increase in the d33 coefficient. Finally, we believe this work helps to understand the factors that determine the improvement in the functional properties of the KNN–based piezoelectric ceramics.

1. Introduction

Piezoelectric materials are used in a large number of applications, such as energy harvesting in traffic areas, ultrasonic imaging, and fine monitoring of structures, among others [1,2,3]. The choice of an optimum piezoelectric material is essential to enhance the effectiveness of electromechanical systems. The most significant and often-used materials for piezoelectric devices are lead titanate–zirconate (PZT) piezoceramics because of their high piezoelectric d33 and kp associated with the possibility of altering the characteristics of “soft” and “hard” piezoelectric responses, as well as the presence of a morphotropic phase boundary (MPB) [4,5,6]. Lead–free piezoelectric materials have gained much interest lately owing to the substantial danger that the compound’s toxicity poses to both human health and the environment [7,8,9,10,11].
The creation of novel, environmentally friendly piezoelectric materials has been the subject of several investigations in recent years [12,13,14,15]. In this way, potassium sodium niobate (KNN)-based ceramics should have good piezoelectric, ferroelectric, and dielectric properties near the MPB temperature [12,13,14]. Saito et al. revealed (K,Na)NbO3–LiTaO3–LiSbO3 to have incredibly high piezoelectric characteristics [16,17,18,19]. This investigation was carried out using simultaneous, intricate chemical substitutions (near the MPB of KNN) in the A– (Li) and B– (Ta and Sb) sites of the perovskite lattice. A solid–state process was used to create nano–powders with high sinterability and intriguing piezoelectric capabilities for a KNN–based ceramic that contains 4 mol% lithium, 10 mol% tantalum, and 4 mol% antimony [20]. When Li ions were incorporated in the A–site and niobium ions (B–site) were partially substituted by Sb or Ta ions, the lattice parameters were changed. Consequently, the structure distortion shifts to the MPB region at room temperature [12,17,18]. In KNL−NTS ceramics, sintering improves with the addition of Li, which also has a significant effect on the final stabilized phase. Additionally, according to many publications, antimony enhances electrical characteristics by increasing TR−O and decreasing TO−T as it approaches room temperature [19,20]. Furthermore, some researchers investigated the optimal Na:K ratio, finding a nominal composition of [(Na0.535K0.480)0.942Li0.058]NbO3. Although the effect of Sb on the dielectric properties and the morphotropic phase edge have not been extensively studied, in this nominal composition the orthorhombic phases are distinguished from the tetragonal and the highest electrical coefficient, d33, was obtained (~314 pC/N).
The influence of Sb on (K0.44Na0.52Li0.04)(Nb0.9−xTa0.1Sbx)O3 [KNL−(N0.9−xTSx)] ceramics synthesized using a traditional solid-state reaction technique is the central issue of this work. Experimental results were examined considering the influence of Sb on structure, microstructure, and ferroelectric and piezoelectric capabilities and revealed that Sb plays a key role in the functional characteristics of the piezoceramic under study. The Sb concentration used in this work was chosen based on the Saito composition and the studies of Rubio-Marcos et al. [9,21,22], who observed that 0.04 mol % of Sb showed the best properties. Here, we want to elucidate if it is possible to reduce the Sb concentration in these KNL−NTS piezoceramics.

2. Materials and Methods

2.1. Preparation Process

The traditional ceramic manufacturing method was used to obtain (K0.44Na0.52Li0.04)(Nb0.9−xTa0.1Sbx)O3 [KNL−(N0.9−xTSx)] powder. Na2CO3, Li2CO3 (Panreac, 99.5%), K2CO3 (Merck, 99%), Nb2O5, Ta2O5, and Sb2O3 (Sigma–Aldrich, ≥99.5%, 99.9%, 99%, and 99.995%, respectively) were used as initial raw materials. Powders with different Sb concentrations (x = 0, 0.02, and 0.04) were abbreviated as KNL−(N0.9−xTSx). The powders were weighed using an analytical balance and then ground for 3 h in an alcoholic medium at 500 rpm with a laboratory mill (zirconium balls as grinding media). The powder calcination was carried out for 2 h at 700 °C. These calcined powders were once again milled under the same conditions, and 200 MPa pressure was applied to form disks 8 mm in diameter and 0.8 mm thick. Finally, the pellets were sintered in air for two hours at 1125 °C. Archimedes’ method was used to determine the densities of the sintered samples.

2.2. Structural Characterization

X–ray diffraction (D8 Advance, Bruker, Germany) was used on the sintered and subsequently ground samples to determine the crystalline phases (CuKα radiation, λ = 0.154 nm, 40 kV, and 100 mA). The spectra were obtained in an angular range of 20–70° (2θ) with a step size of 0.0334° every 100 s. Peak locations were fitted based on the form of a Lorentz peak. Also, the Inorganic Crystal Structure Database (ICSD) was used to determine the crystalline phases. Additionally, the relative volume fractions of the T (VT ) and O (VO) phases were determined as:
V T = I 002 T + I 200 T I 002 T + I 200 T + I 022 O + I 200 O
V O = I 022 O + I 200 O I 002 T + I 200 T + I 022 O + I 200 O
where I(002)T, I(200)T, I(022)O, and I(200)O are the integrated intensities of the tetragonal (002) and (200) peaks, and orthorhombic (022) and (200) peaks, respectively [9].

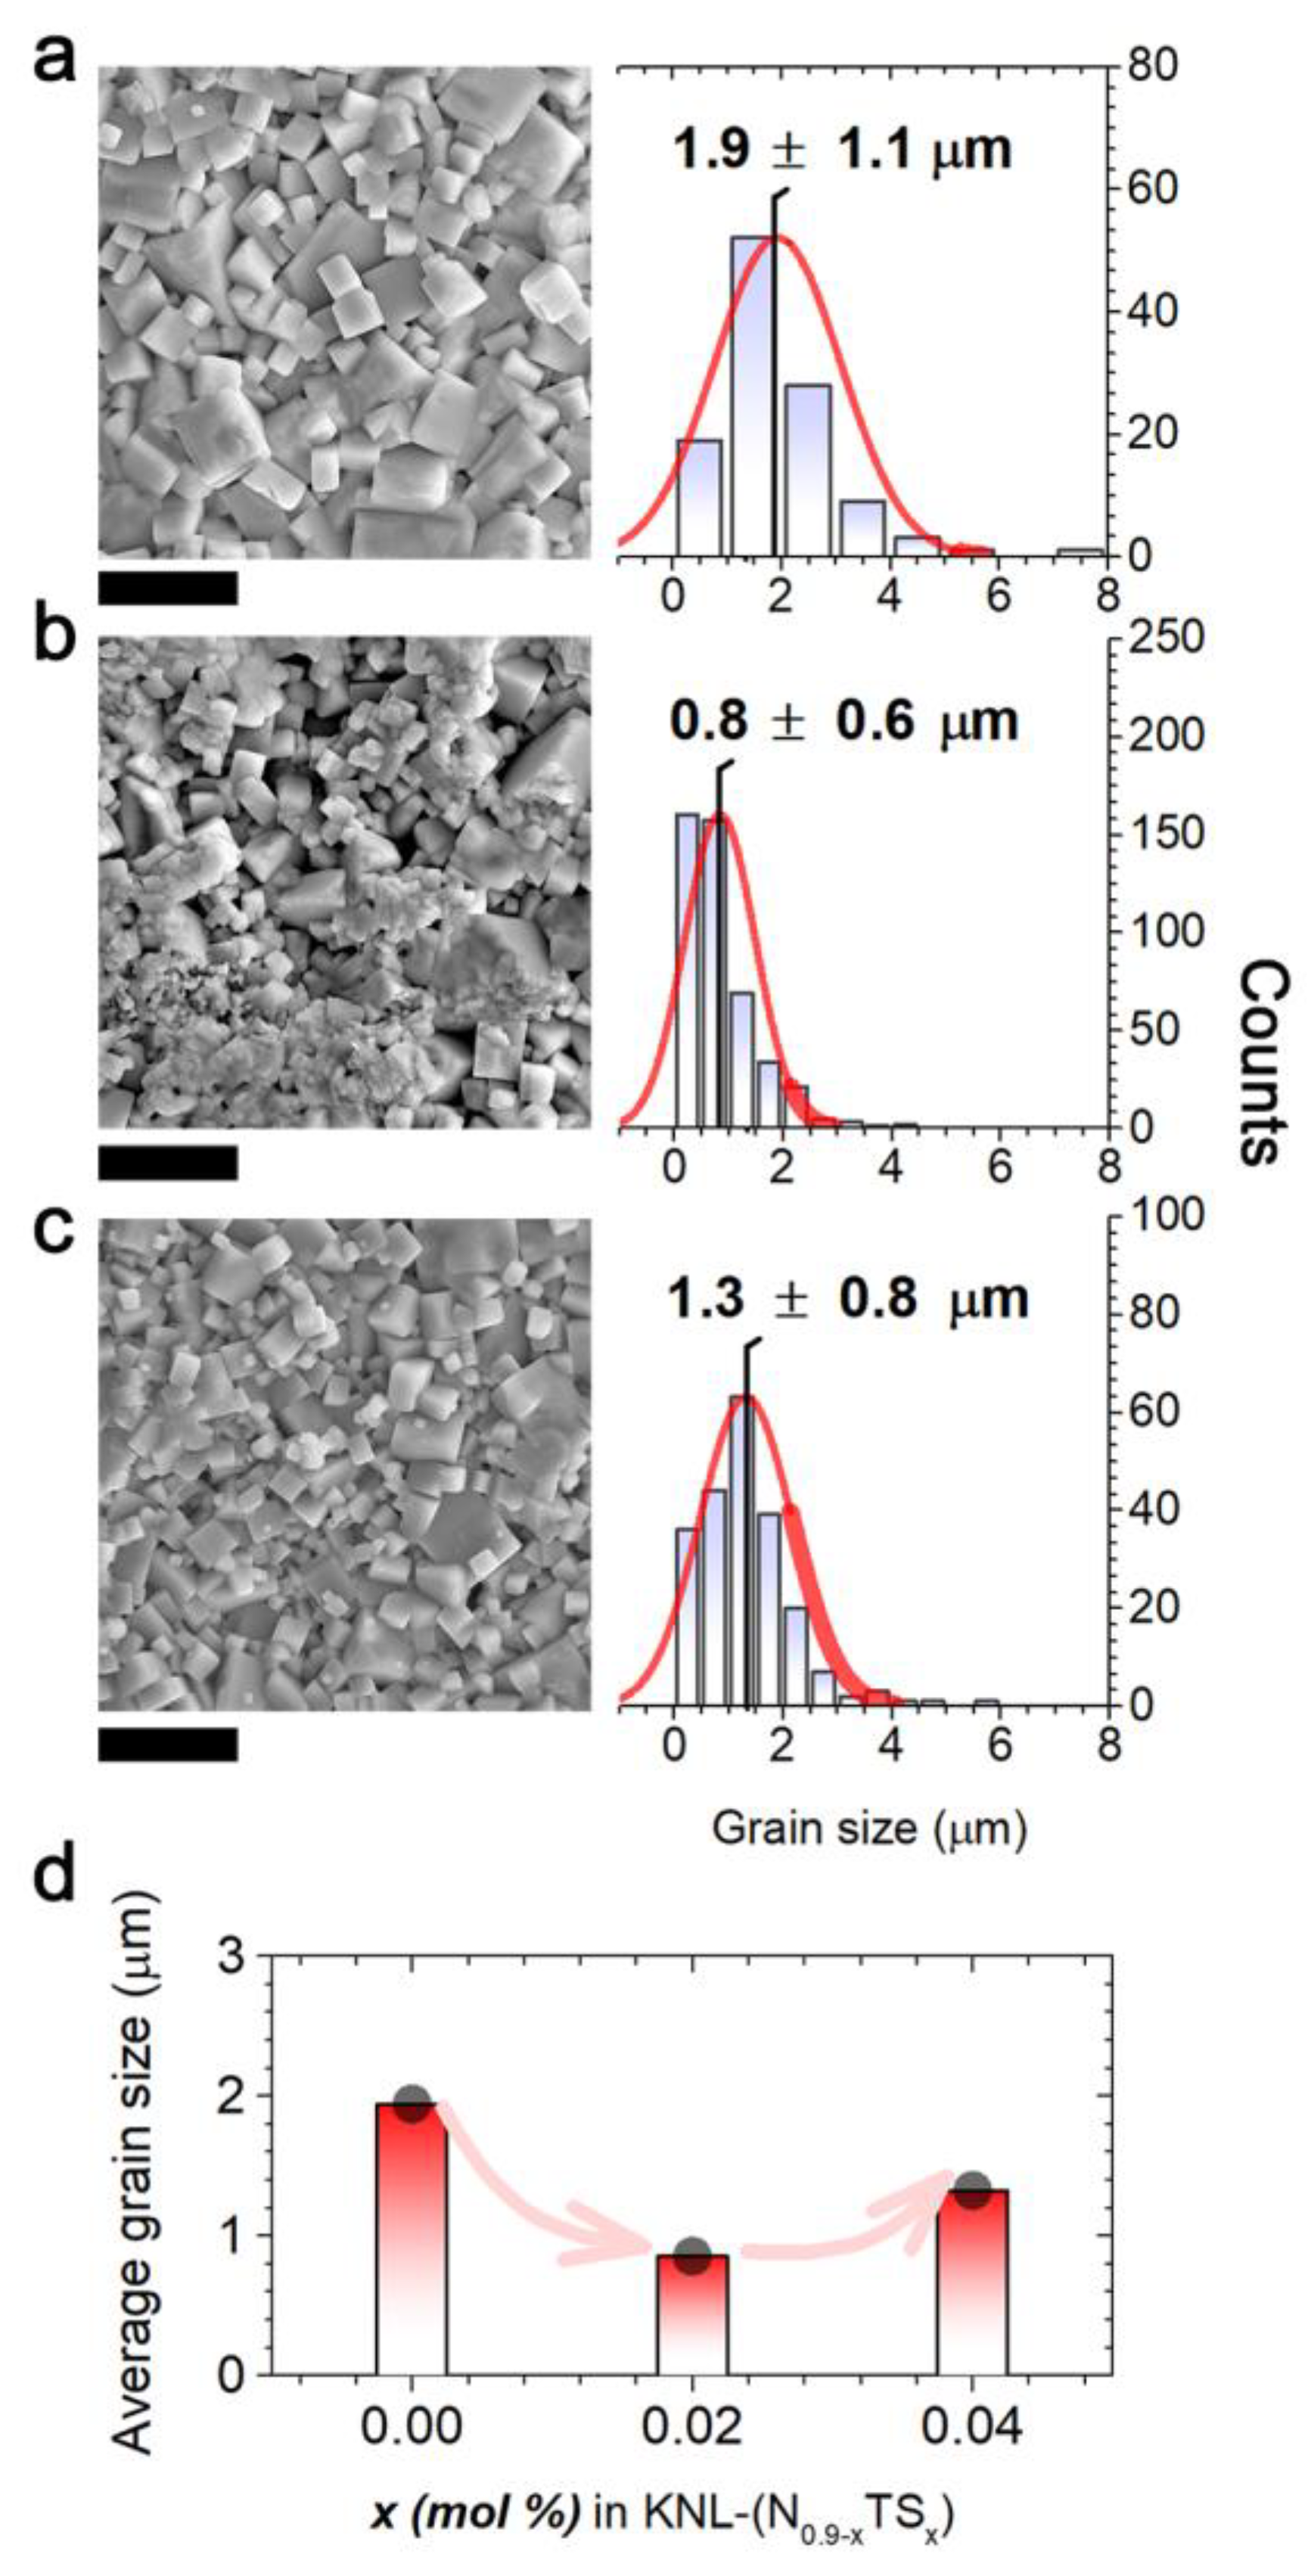
2.3. Microstructural Characterization

The microstructure was analyzed using a Field Emission Scanning Electron Microscope (FE–SEM, Hitachi S–4700) on samples thermally etched at 100 °C below the sintering temperature for 25 min. Energy Dispersive Spectroscopy, or EDS, was used to provide an approximation of the ceramics’ composition.

2.4. Electrical Characterization

By applying a DC field of 4.0 kV/mm for 30 min, the samples were poled in a silicon oil bath at RT using conductive silver paint as electrodes. The piezoelectric constant d33 was determined with YE2730A d33 METER equipment (APC International, Ltd., USA). It was determined that the ceramics were ferroelectric through a modified Sawyer–Tower circuit using a silicon oil bath, whilst the dielectric characteristics were evaluated at different temperatures between 25 °C and 500 °C and in the frequency range 100 Hz to 1 MHz using the HP4284A equipment.

3. Results and Discussion

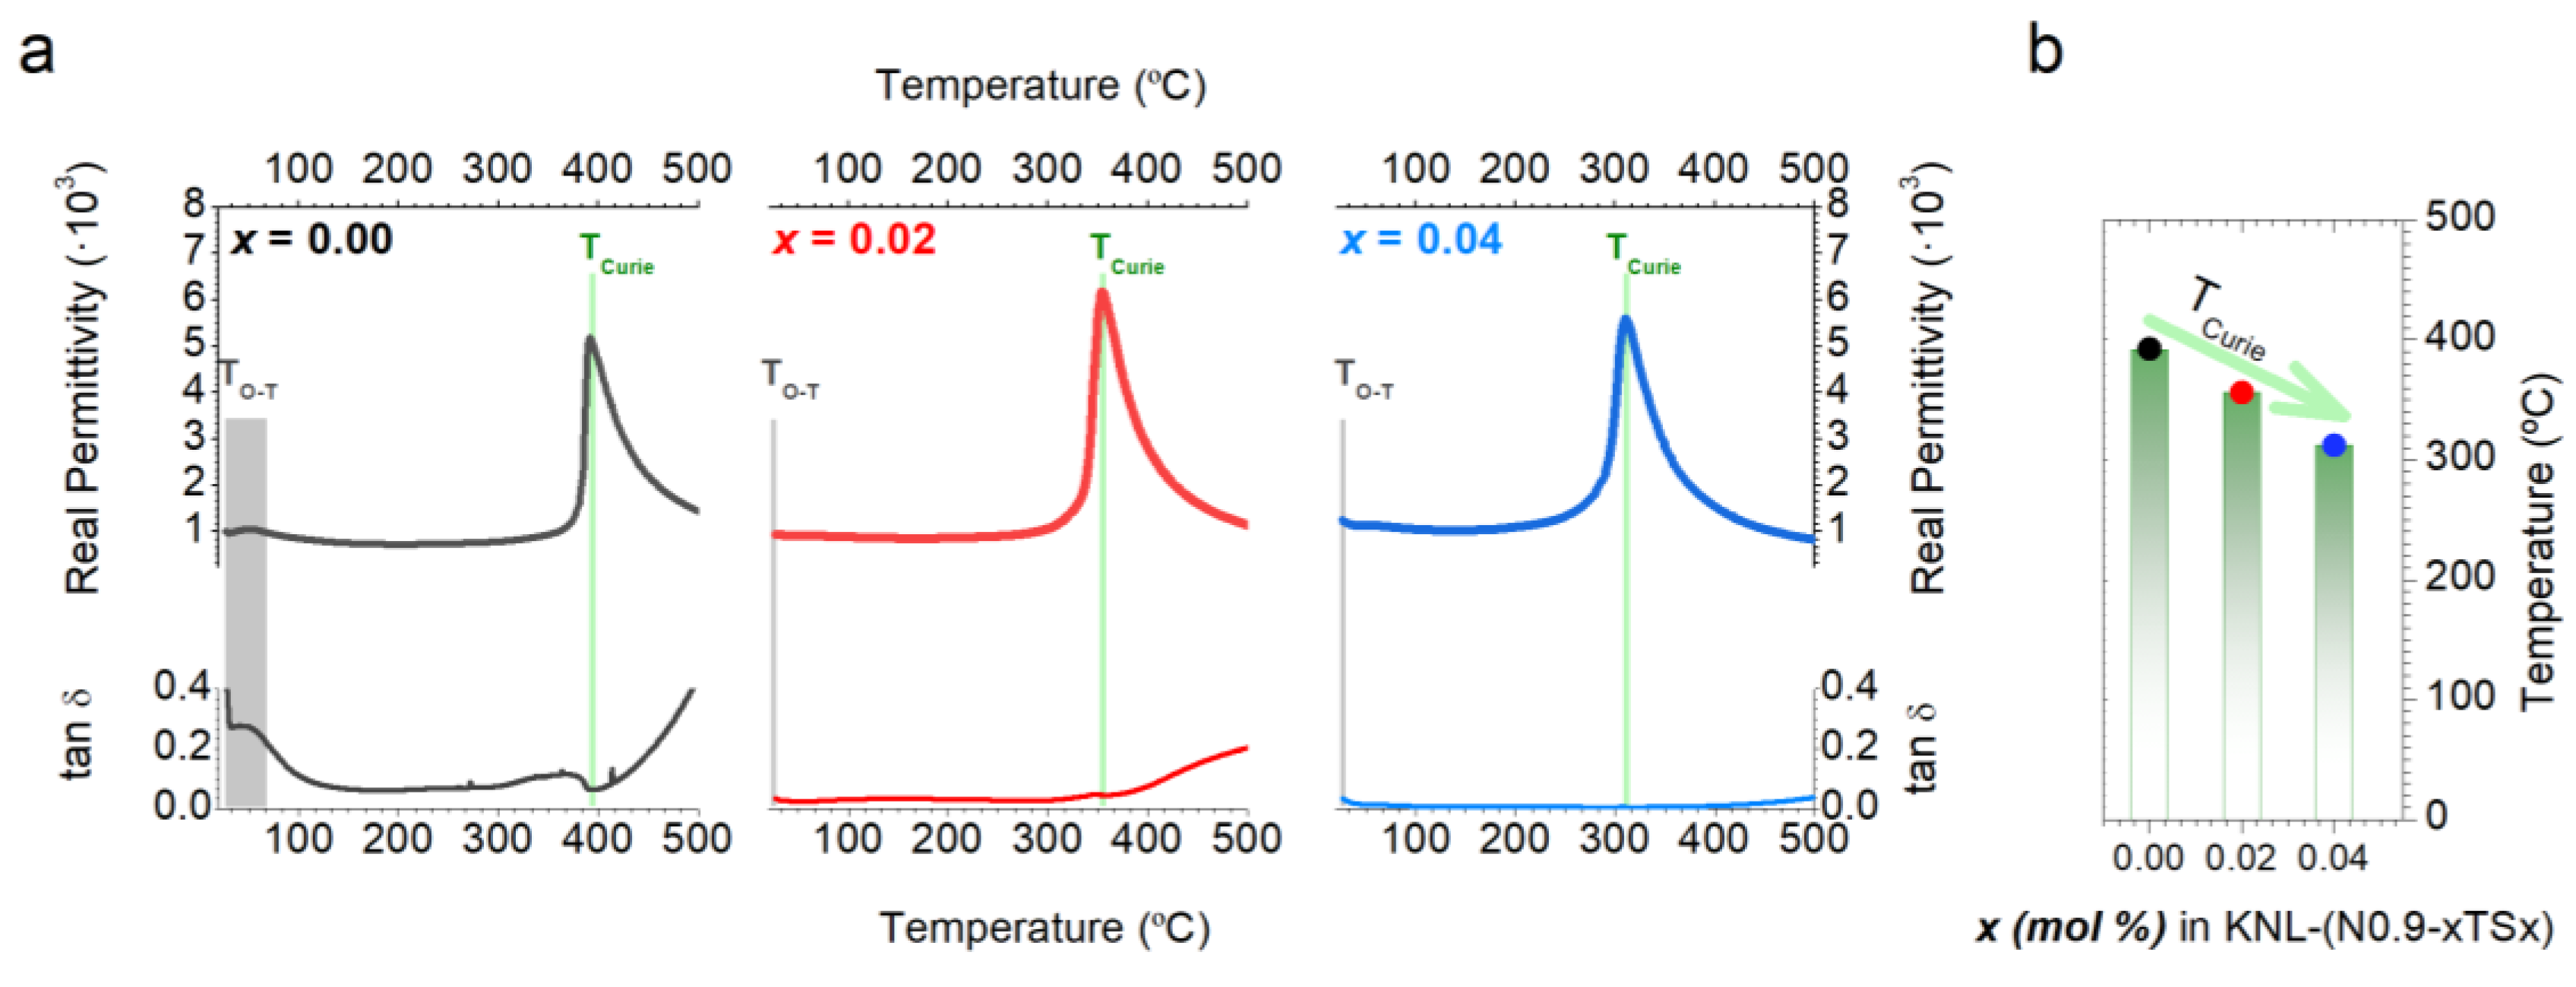
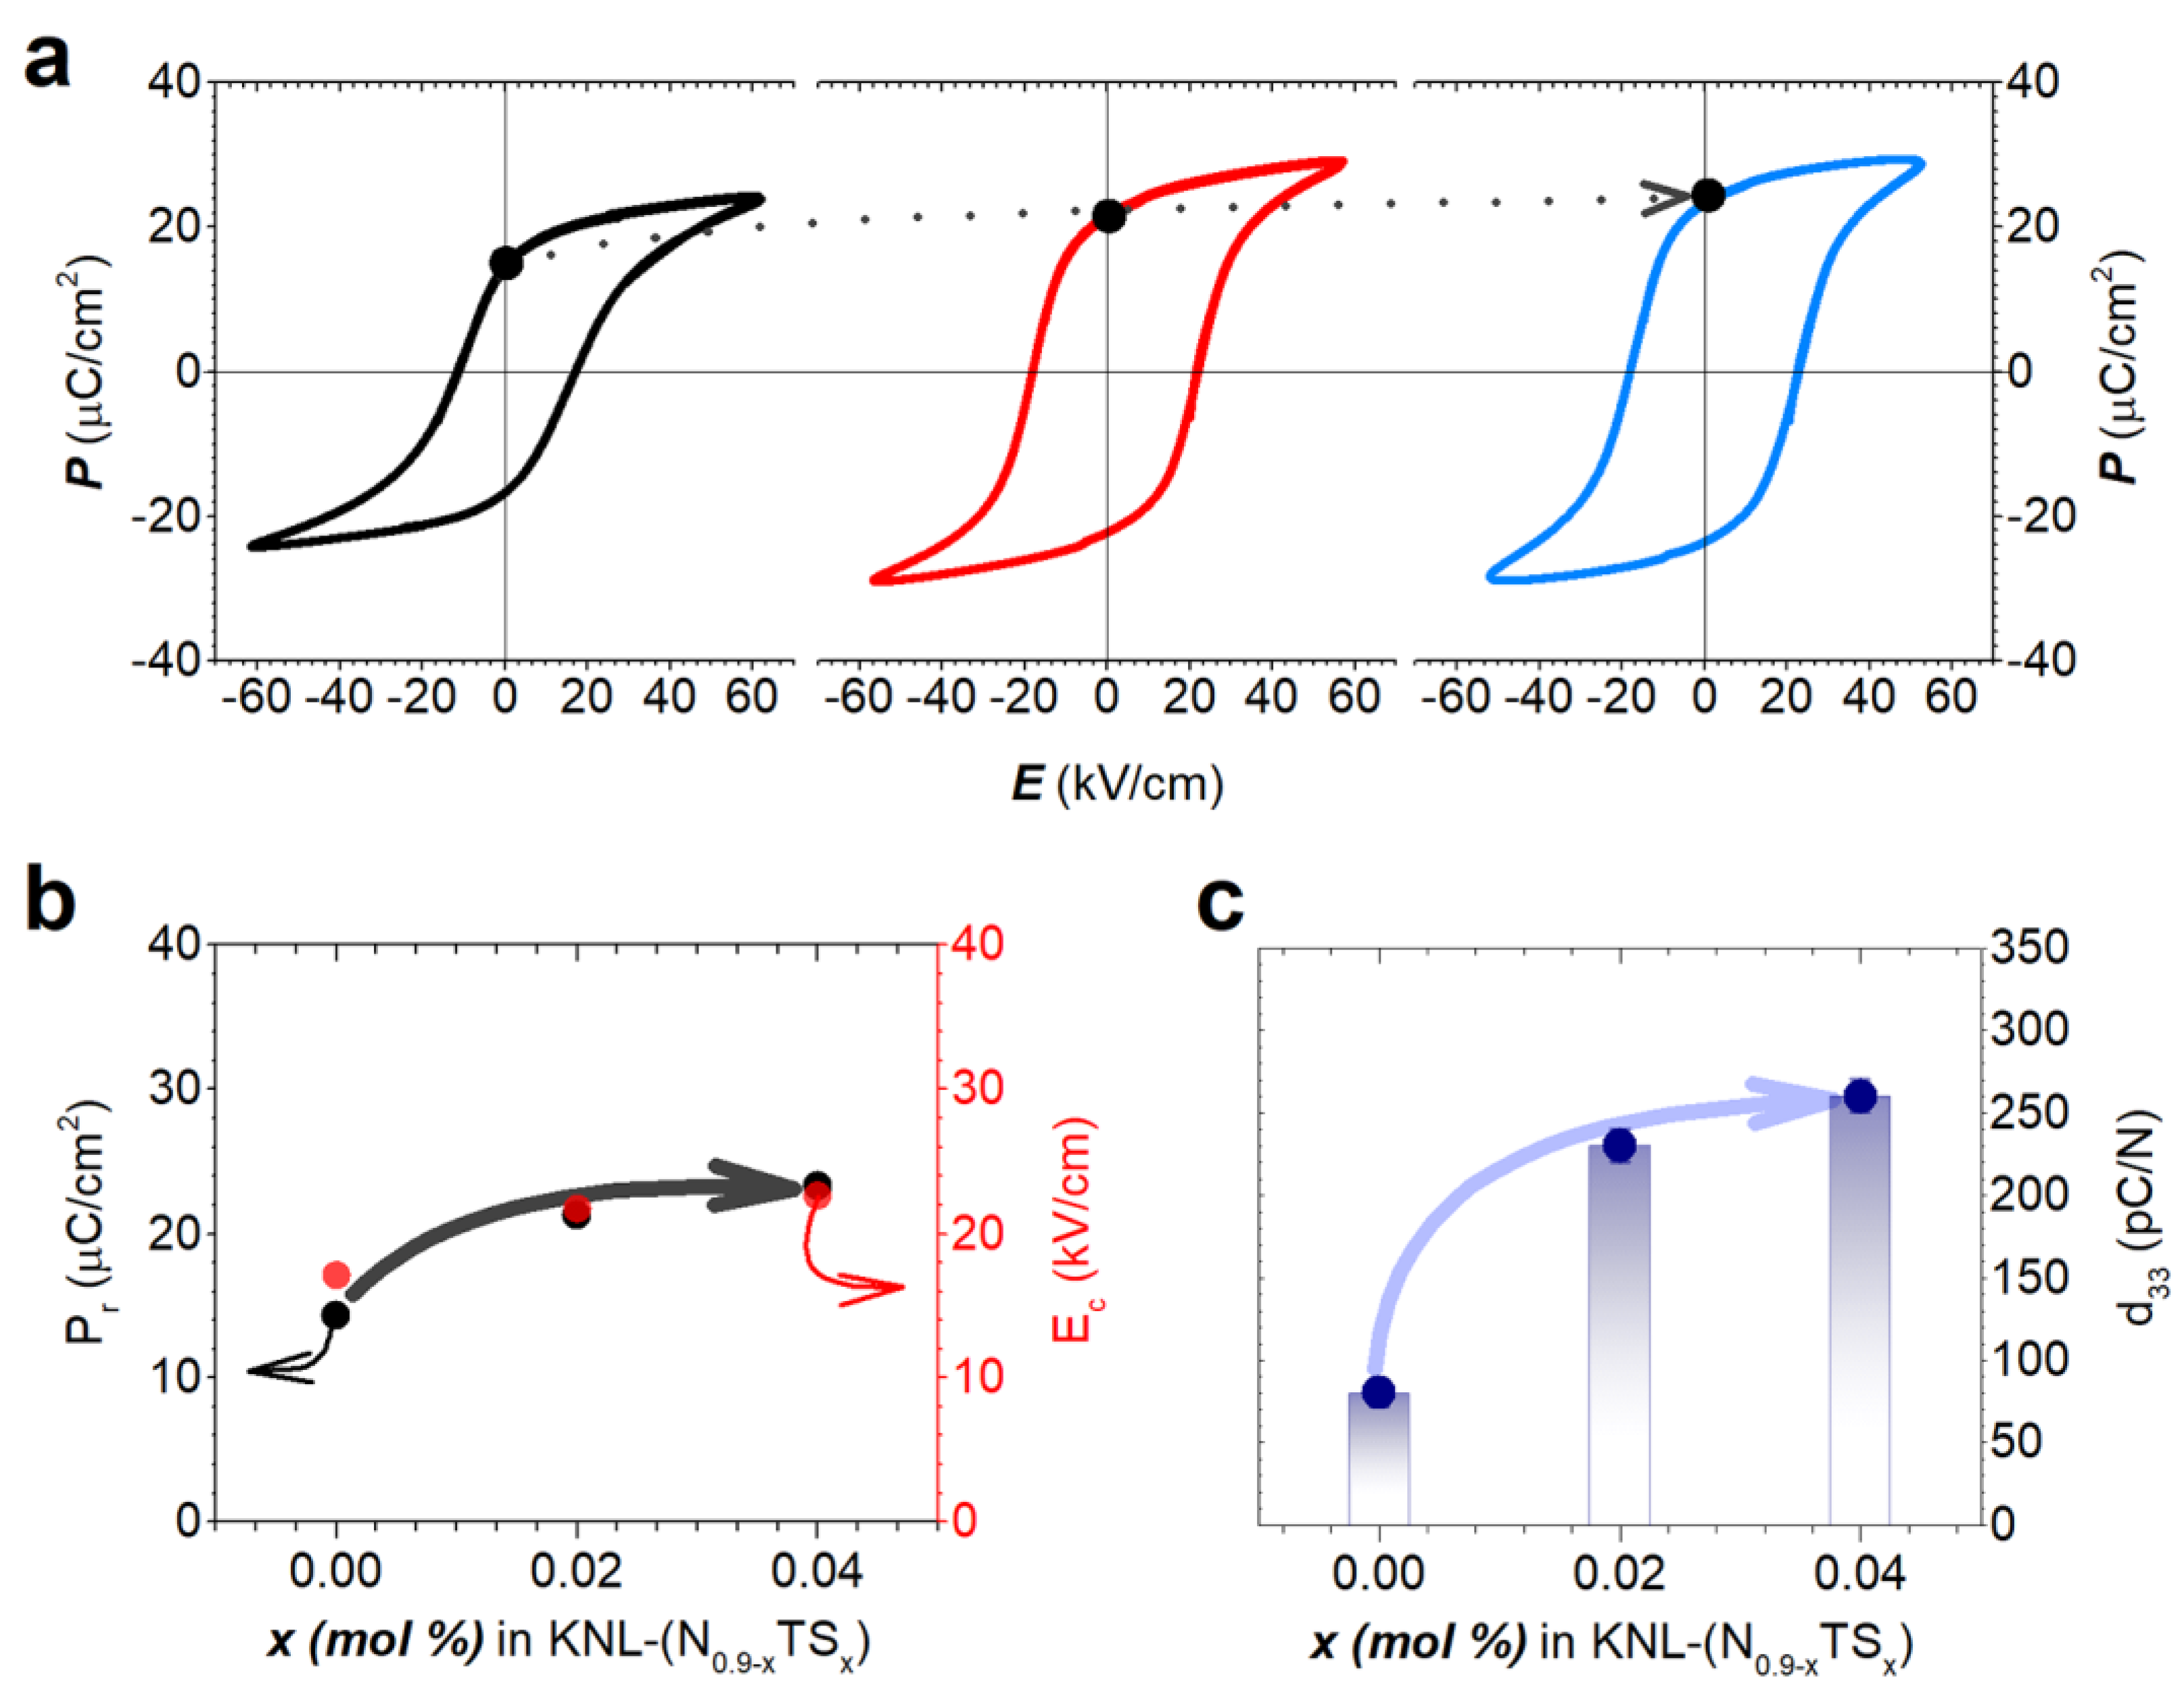
Structural and Microstructural Characterization

Figure 1 presents the X-ray diffraction patterns of (K0.44Na0.52Li0.04)(Nb0.9−xTa0.1Sbx)O3 [KNL−(N0.9−xTSx)]ceramics for different Sb amounts (x = 0, 0.02 and 0.04) sintered at 1125 °C for 2 h. At room temperature, the diffraction patterns within the XRD resolution are consistent with a perovskite structure that is devoid of secondary phases [21,22] (Figure 1a).
In addition, Figure 1b shows a zoomed-in area of the XRD pattern in the 2θ range 44.5° to 46.5° of the KNL−(N0.9−xTSx)ceramic system. A splitting connected to the coexistence of an orthorhombic symmetry, O, and a tetragonal symmetry, T, may be found in all samples. On KNL−NTS bulk ceramics, the coexistence of several polymorphs (including the tetragonal and orthorhombic phases) was documented [16]. This fact allows the deconvolution of the perovskite phase’s tetragonal symmetry into two Lorentzian peaks, (002)T and (200)T. Additionally, two peaks at 45.2 and 45.7 degrees (2θ) related to the orthorhombic symmetry are found in these samples. In the same way, a slight shift of the peaks towards higher angles is observed by the Sb effect. The peaks connected to the tetragonal symmetry are more significant in samples with greater Sb amounts. It can be suggested that differences in the ionic radius between Sb+5 (0.62Å) and Nb+5 (0.69Å) produce a distortion of the crystal lattice, with a diminution in the ‘a’ lattice parameter of the perovskite [23]. However, different effects are produced with the addition of Sb5+. On the one hand, the substitutional addition of Sb5+ should reduce the cell (due to the smaller ionic radius) displacing the peaks towards higher angles, but on the other hand, the increasing concentration of Sb5+ generates a structural change modifying the T/O content in the structure. Furthermore, similar results were reported by other researchers showing that small cations in B−sites facilitate the coexistence of different phases (from rhombohedral–tetragonal to orthorhombic–tetragonal) at room temperature, decreasing the TO−T toward room temperature, which can indicate that the TO−T was very near to or below room temperature [19,20].
The composition dependencies of VT and VO are shown in Figure 1c to support the previous explanation. A close examination of Figure 1c demonstrates that VT and VO are dependent on the Sb5+ content. VT rises as x rises, reaching a maximum value at VT ∼80% and a T/O ratio close to 4 for x = 0.04.
Raman spectroscopy was additionally used to evaluate the change in the crystalline structure with composition. The obtained spectra are shown in Figure 2a for samples with different Sb amounts (0.00 to 0.04). Furthermore, a series of main bands located at 250, 560, 615, and 860 cm−1, products of the vibration modes associated with the KNN and the NbO6 octahedron, can be observed. These bands are located at υ5, υ2, υ1 and υ1 + 5 Raman modes, respectively. The practically equilateral octahedral symmetry is found in systems similar to the KNN, and it is associated with the apparition of modes A1g and F2g. [24,25,26]. In addition, in Figure 2b a slight shift at higher frequencies can be observed due to the incorporation of a higher concentration of Sb, which could be related to a distortion of the system towards more tetragonal symmetries, decreasing the bond distance between the B5+ cations and their coordinated oxygen in the octahedral position. Therefore, the binding force constant would increase and the band υ1 would shift to higher wavenumbers. For illustrative purposes, in Figure 2c, we show the shift of the A1g Raman mode, which reflects the increase in T phase at the expense of O due to the progressive entry of Sb5+ ions. These results are in agreement with those observed with XRD where the change in the crystalline structure is detected (Figure 1). More important, as previously established, the evolution of A1g Raman mode shift is closely related to the piezoelectric coefficients (that is, functional properties); consequently, the functional properties of the system would be expected to be affected [27].
A field emission scanning electron microscope (FE-SEM) was used to study the effect of Sb content on the KNL−(N0.9−xTSx)system. For all compositions, grains show a cubic–like shape, which is characteristic of KNN-based ceramics (Figure 3a–c), and irregularly arranged large and small grains were observed. The sequence of grain size distributions (GSDs) is shown to the right of each SEM image, while the evolution of the average grain size (AGS) determined from GSDs can be observed in Figure 3c. Furthermore, it is shown that as Sb addition rises, the average grain size decreases from 1.9 μm to 1.3 μm for x = 0.00 to x = 0.04, respectively. In addition, for the lowest Sb concentration (x = 0.02), a non-homogeneous microstructure is observed. In fact, due to the inefficient additive distribution in the whole sample, grains containing antimony in their compositions show a restriction in their normal grain growth, whereas grains without or with low antimony concentration present grain sizes similar to the pure sample. Finally, for the highest antimony concentration (x = 0.04), the improvement in the additive distribution in the whole sample produces a more homogeneous microstructure with a reduction in the average grain size.
It is known that control of the composition is essential to obtain the optimal piezoelectric properties in the KNN system [23]. We have used EDS analysis for the semi-quantitative determination of the composition in the resultant KNN−based ceramic. EDS analysis was carried out on all the specimens in order to identify the composition of the sample. From the analysis, besides the KNL−NTS−based grains, the formation of a glassy phase during the sintering process is observed. Figure 4 illustrates the EDS analysis of the main grains (2 and 4) and of the glassy phase (1 and 3), while a table is also attached showing the compositional analysis (Atom % of Na, K, Nb, Sb and Ta ions) revealing a composition very close to KNL−NTS [the composition calculated by EDS analysis at points 2 and 4 is approx. (K0.37Na0.40Li0.04)(Nb0.85Ta0.11Sb0.04)O3]. Nevertheless, in the glassy phases, a lower Na/K ratio and a higher Ta concentration than the expected main phase is observed [approx. composition at points 1 and 3 is close to (K0.33Na0.29Li0.04)(Nb0.78Ta0.18Sb0.04)O3]. This suggests that this vitreous phase presents a loss of alkaline elements (specially Na) by evaporation at the sintering temperature [27]. Finally, it can be seen that the oxygen content was determined by the stoichiometry relation, although sometimes the O content in the sample was difficult to quantify accurately.
All samples exhibited a dense surface morphology, which was verified using Archimedes’ method (see Table 1). Considering that high density values are required to obtain piezoceramics with good electrical properties, the high density values registered for the complete set of KNL−(N0.9−xTSx)ceramic samples allow us to examine the dielectric, ferroelectric, and piezoelectric properties.
Real permittivity and dielectric losses as a function of temperature (10 kHz) are shown in Figure 5. The curves present two phase transitions with temperature. The first one, near room temperature, can be assigned to the orthorhombic–tetragonal (TO−T) phase transition, while the second, much clearer, one, between 300 to 400 °C, corresponds to the tetragonal–cubic (Tc) phase transition assigned to the ferroelectric–paraelectric transition. Furthermore, the Curie temperature (Tc), determined by the maximum of the dielectric constant, decreases when the Sb content increases (Figure 5b). In this way, the Tc value observed in the Sb–free sample (x = 0.00) was characteristic of K0.5Na0.5NbO3 ceramics (~400 °C), while the Tc value for the maximum Sb content (x = 0.04) was close to that observed by Saito et al. (290 °C) [27]. Similarly, the TO−T phase transition follows the same trend. As observed in Figure 5a (marked in gray), the TO−T drastically decreases with the Sb+5 content, evidencing that this phase transition is clearly sensitive to the Sb+5 content. However, this O–T phase transition is not enough clear because it is below or close to room temperature, depending on the x content. In addition, a slight widening of the Tc peak with Sb addition, due to an increase in the cation disorder in the perovskite structure, can be observed [28].
In short, considering the findings of both structural (Figure 1 and Figure 2) and εr–T curves (Figure 5), we can establish that the addition of Sb5+ to the structure stabilizes the coexistence of the O and T phases at room temperature (with a predominance of the T phase). Finally, the dielectric loss diminution with antimony addition encourages the use of these compositions for possible dielectric applications.
From a functional perspective, the stabilization of an O–T coexistence phase boundary close to room temperature has been considered to improve piezoelectric properties. Under this scenario, additional information concerning the effects of the Sb5+ substitution on the KNL−(N0.9−xTSx)ceramic can be achieved from the ferroelectric characteristics. For that, the samples were examined in a high external electric field, and all consistently displayed ferroelectric behavior because of spontaneous polarization. Hysteresis loops of KNL−(N0.9−xTSx)samples (at RT and Ep = 30 kV/cm) are shown in Figure 6. All cycles are modified by the Sb content and present ferroelectric characteristics. Figure 6b and Table 1 show the values of remnant polarization (Pr) and coercive field (Ec) extracted from the hysteresis loops to more clearly analyze the effect of adding Sb+5. It can be seen that Pr and Ec (remnant polarization and coercive field, respectively) increase with Sb content from Ec = 17.1 kV/cm and Pr = 14.3 μC/cm2, for x = 0.00 to Ec = 21.7 kV/cm and Pr = 21.3 μC/cm2 for x = 0.02, and to Ec = 22.6 kV/cm and Pr =23.3 μC/cm2 for x = 0.04.
The stabilization of the coexistence of O-T phases seems to be related to the evolution of Pr (Figure 6b) and the dielectric properties (Figure 5). In addition, the piezoelectric constant (d33) is proportional to the product εrPr, which makes the improvement of these properties desirable. The evolution of the d33 piezoelectric constant versus Sb5+ content in the KNL−(N0.9−xTSx)system is shown in Figure 6c. The piezoelectric constant increases with Sb5+ doping due to the stabilization of the orthorhombic and tetragonal phases close to RT (creating a limit of multiphasic coexistence where the tetragonal phase is predominant). The same reason should be responsible for improving the ferroelectric properties at x ≥ 0.02. In fact, it is known that these phases present different directions of polarization (six possible for the tetragonal phase and 12 for the orthorhombic phase). Consequently, when the coexistence of both phases is stabilized, 18 direction possibilities for polarization are obtained. The similar values obtained for samples with x = 0.02 and 0.04 could be attributed to the contribution of different factors such as grain size, final microstructure, dielectric permittivity, and density values as was observed by Wendari et al. [29]. From this perspective, the main difference between both compositions is the grain size. Therefore, the average grain size increases in the system with the highest Sb content (Figure 3), thus promoting the increased domain size and favoring more domain wall motion and domain switching. From our results, we can infer two parameters that govern the d33 piezoelectric constant: first, the stabilization of an O–T phase coexistence phase boundary close to room temperature with a predominant T phase; second, controlling the grain size is also an adequate parameter to improve the piezoelectric properties, considering that both parameters improve with the increase in the Sb content.

4. Conclusions

In this study, we demonstrate the possibility of stabilizing the O–T phase coexistence phase boundary close to room temperature, as well as controlling the relative volume fractions of the T (VT) and O (VO) phases of the O-T phase boundary in (K0.44Na0.52Li0.04)(Nb0.9−xTa0.1Sbx)O3 [KNL−(N0.9−xTSx)] lead-free piezoelectric ceramics by substituting Sb ions in the perovskite structure. Specifically, controlling the relative volume fractions of the T causes an elevated degree of polarization directions close to room temperature, facilitating the polarization process of the system. More interestingly, the improvement in the functional properties of the system is affected by controlling the grain size; indeed, an increase in the grain size promotes the increase in domain size, favoring more domain wall motion and domain switching. This behavior results in an increase in the d33 coefficient. Finally, our study shows that KNN-based piezoelectric ceramics are a promising substitution of PZT for different applications and devices.

Author Contributions

Conceptualization, F.R.-M. and M.D.; methodology, M.C.; software, M.D.; validation, L.R., M.C. and F.R.-M.; formal analysis, M.D.; investigation, F.G.; resources, L.R.; data curation, M.D.; writing—original draft preparation, M.D.; writing—review and editing, F.R.-M., L.R. and M.C.; visualization, F.R-M.; supervision, M.C.; project administration, F.R.-M. and L.R.; funding acquisition, F.R.-M. and L.R. All authors have read and agreed to the published version of the manuscript.

Funding

The authors would like to thank National University of Mar del Plata (Argentina) Project (15/G577) and CONICET (PIP 2487) for providing financial support. F. Rubio-Marcos is indebted to MINECO (Spanish Government) project PID2020-114192RB–C41 and acknowledges financial support from Comunidad de Madrid for the “Doctorados Industriales” project (IND2020/IND–17375), which is co-financed by the European Social Fund.

Data Availability Statement

The data supporting the reported results are all included in the article. For more information, it is suggested to contact the corresponding author.

Conflicts of Interest

The authors declare no conflict of interest. The funders had no role in the design of the study; in the collection, analyses, or interpretation of data; in the writing of the manuscript; or in the decision to publish the results.

References

  1. Gao, X.; Cheng, Z.; Chen, Z.; Liu, Y.; Meng, X.; Zhang, X.; Wang, J.; Guo, Q.; Li, B.; Sun, H.; et al. The Mechanism for the Enhanced Piezoelectricity in Multi-Elements Doped (K,Na)NbO3Ceramics. Nat. Commun. 2021, 12, 881. [Google Scholar] [CrossRef]
  2. Zhang, S.; Li, F.; Jiang, X.; Kim, J.; Luo, J.; Geng, X. Advantages and Challenges of Relaxor-PbTiO3 Ferroelectric Crystals for Electroacoustic Transducers—A Review. Prog. Mater. Sci. 2015, 68, 1–66. [Google Scholar] [CrossRef] [Green Version]
  3. Luo, H.; Ke, H.; Zhang, H.; Zhang, L.; Li, F.; Cao, L.; Jia, D.; Zhou, Y. Enhanced Ferroelectric and Energy-Storage Properties of Nb-Doped 0.94Na0.5Bi0.5TiO3-0.06BaTiO3 Ceramics Prepared by a Multi-Ionic Sol-Gel Method. Phys. B Condens. Matter. 2019, 567, 17–24. [Google Scholar] [CrossRef]
  4. Cortés, J.A.; Camargo, J.; Rachia, M.F.; Rubio-Marcos, F.; Ramajo, L.; Castro, M.; Ramírez, M.A. Influence of the Sintering Temperature on Ferroelectric Properties of Potassium-Sodium Niobate Piezoelectric Ceramics. J. Adv. Dielect. 2021, 11, 2140002. [Google Scholar] [CrossRef]
  5. Kang, W.-S.; Lee, S.-K.; Koh, J.-H. AC Conductivity and Dielectric Properties of (Bi,Na)TiO3–BaTiO3 Lead Free Ceramics. Ceram. Int. 2015, 41, 6925–6932. [Google Scholar] [CrossRef]
  6. Prado, A.; Ramajo, L.; Camargo, J.; del Campo, A.; Öchsner, P.; Rubio-Marcos, F.; Castro, M. Stabilization of the Morphotropic Phase Boundary in (1−x)Bi0.5Na0.5TiO3-XBaTiO3 Ceramics through Two Alternative Synthesis Pathways. J. Mater. Sci. Mater. Electron. 2019, 30, 18405–18412. [Google Scholar] [CrossRef]
  7. Hao, J.; Xu, Z.; Chu, R.; Zhang, Y.; Chen, Q.; Fu, P.; Li, W.; Li, G.; Yin, Q. Characterization of (K0.5Na0.5)NbO3 Powders and Ceramics Prepared by a Novel Hybrid Method of Sol–Gel and Ultrasonic Atomization. Mater. Des. 2010, 31, 3146–3150. [Google Scholar] [CrossRef]
  8. Shrout, T.R.; Zhang, S.J. Lead-Free Piezoelectric Ceramics: Alternatives for PZT? J. Electroceram. 2007, 19, 113–126. [Google Scholar] [CrossRef]
  9. Rubio-Marcos, F.; Fernandez, J.F.; Ochoa, D.A.; García, J.E.; Rojas-Hernandez, R.E.; Castro, M.; Ramajo, L. Understanding the Piezoelectric Properties in Potassium-Sodium Niobate-Based Lead-Free Piezoceramics: Interrelationship between Intrinsic and Extrinsic Factors. J. Eur. Ceram. Soc. 2017, 37, 3501–3509. [Google Scholar] [CrossRef] [Green Version]
  10. Wang, H.; Gou, G.; Li, J. Ruddlesden–Popper Perovskite Sulfides A3B2S7: A New Family of Ferroelectric Photovoltaic Materials for the Visible Spectrum. Nano Energy 2016, 22, 507–513. [Google Scholar] [CrossRef]
  11. Wendari, T.P.; Arief, S.; Mufti, N.; Blake, G.R.; Baas, J.; Suendo, V.; Prasetyo, A.; Insani, A.; Zulhadjri, Z. Lead-Free Aurivillius Phase Bi2LaNb1.5Mn0.5O9: Structure, Ferroelectric, Magnetic, and Magnetodielectric Effects. Inorg. Chem. 2022, 61, 8644–8652. [Google Scholar] [CrossRef]
  12. Chang, Y.; Poterala, S.; Yang, Z.; Messing, G.L. Enhanced Electromechanical Properties and Temperature Stability of Textured (K0.5Na0.5)NbO3-Based Piezoelectric Ceramics: Properties and Temperature Stability of Textured (K0.5Na0.5)NbO3-Based Piezoelectric Ceramics. J. Am. Ceram. Soc. 2011, 94, 2494–2498. [Google Scholar] [CrossRef]
  13. Chae, M.-S.; Lee, K.-S.; Koo, S.-M.; Ha, J.-G.; Jeon, J.-H.; Koh, J.-H. Improved Piezoelectric Properties of Ag Doped 0.94(K0.5–ΒNa0.5–δ)NbO3–0.06Li1–γNbO3 Ceramics by Templated Grain Growth Method. J. Electroceram. 2013, 30, 60–65. [Google Scholar] [CrossRef]
  14. Zhang, S.; Xia, R.; Hao, H.; Liu, H.; Shrout, T.R. Mitigation of Thermal and Fatigue Behavior in K0.5Na0.5NbO3-Based Lead Free Piezoceramics. Appl. Phys. Lett. 2008, 92, 152904. [Google Scholar] [CrossRef] [Green Version]
  15. Moure, A. Review and Perspectives of Aurivillius Structures as a Lead-Free Piezoelectric System. Appl. Sci. 2018, 8, 62. [Google Scholar] [CrossRef] [Green Version]
  16. Saito, Y.; Takao, H.; Toshihiko, T.; Toshihiko, N. Lead-Free Piezoceramics. Nature 2004, 432, 84–87. [Google Scholar] [CrossRef]
  17. Fuentes, J.; Portelles, J.; Pérez, A.; Durruthy-Rodríguez, M.D.; Ostos, C.; Raymond, O.; Heiras, J.; Cruz, M.P.; Siqueiros, J.M. Structural and Dielectric Properties of La- and Ti-Modified K0.5Na0.5NbO3 Ceramics. Appl. Phys. A 2012, 107, 733–738. [Google Scholar] [CrossRef]
  18. Carreño-Jiménez, B.; Villafuerte-Castrejón, M.E.; Reyes-Montero, A.; López-Juárez, R. Effect of Antimony Content on Electrical and Structural Properties of 0.98(K0.48Na0.52)0.95Li0.05Nb1−xSbx O3–0.02Ba0.5(Bi0.5Na0.5)0.5ZrO3 Ceramics. Bol. Soc. Esp. Ceram. V. 2021, 60, 266–272. [Google Scholar] [CrossRef]
  19. Carreño-Jiménez, B.; Reyes-Montero, A.; Villafuerte-Castrejón, M.E.; López-Juárez, R. Piezoelectric, Dielectric and Ferroelectric Properties of (1−x)(K0.48Na0.52)0.95Li0.05Nb0.95Sb0.05O3-XBa0.5(Bi0.5Na0.5)0.5ZrO3 Lead-Free Solid Solution. J. Electron. Mater. 2018, 47, 6053–6058. [Google Scholar] [CrossRef]
  20. Zhang, K.; Guo, Y.; Pan, D.; Duan, H.; Chen, Y.; Li, H.; Liu, H. Phase Transition and Piezoelectric Properties of Dense (K0.48Na0.52)0.95Li0.05SbxNb1−xO3-0.03Ca0.5(Bi0.5,Na0.5)0.5ZrO3 Lead Free Ceramics. J. Alloys Compd. 2016, 664, 503–509. [Google Scholar] [CrossRef]
  21. Rubio-Marcos, F.; Romero, J.J.; Fernandez, J.F. Effect of the Temperature on the Synthesis of (K,Na)NbO3-Modified Nanoparticles by a Solid State Reaction Route. J. Nanoparticle Res. 2010, 12, 2495–2502. [Google Scholar] [CrossRef]
  22. Rubio-Marcos, F.; Romero, J.J.; Ochoa, D.A.; García, J.E.; Perez, R.; Fernandez, J.F. Effects of Poling Process on KNN-Modified Piezoceramic Properties. J. Am. Ceram. Soc. 2010, 93, 318–321. [Google Scholar] [CrossRef]
  23. Bortolani, F.; del Campo, A.; Fernandez, J.F.; Clemens, F.; Rubio-Marcos, F. High Strain in (K,Na)NbO3 -Based Lead-Free Piezoelectric Fibers. Chem. Mater. 2014, 26, 3838–3848. [Google Scholar] [CrossRef]
  24. Trodahl, H.J.; Klein, N.; Damjanovic, D.; Setter, N.; Ludbrook, B.; Rytz, D.; Kuball, M. Raman Spectroscopy of (K,Na)NbO3 and (K,Na)1−xLixNbO3. Appl. Phys. Lett. 2008, 93, 262901. [Google Scholar] [CrossRef] [Green Version]
  25. Zhang, N.; Glazer, A.M.; Baker, D.; Thomas, P.A. Structures of K0.05Na0.95NbO3 (50–300 K) and K0.30Na0.70NbO3 (100–200 K). Acta Crystallogr. B Struct. Sci. 2009, 65, 291–299. [Google Scholar] [CrossRef] [Green Version]
  26. Yu, Z.; Ang, C.; Guo, R.; Bhalla, A.S. Piezoelectric and Strain Properties of Ba(Ti1−xZrx)O3 Ceramics. J. Appl. Phys. 2002, 92, 1489–1493. [Google Scholar] [CrossRef]
  27. Rubio-Marcos, F.; Romero, J.J.; Martín-Gonzalez, M.S.; Fernández, J.F. Effect of Stoichiometry and Milling Processes in the Synthesis and the Piezoelectric Properties of Modified KNN Nanoparticles by Solid State Reaction. J. Eur. Ceram. Soc. 2010, 30, 2763–2771. [Google Scholar] [CrossRef] [Green Version]
  28. Li, H.; Zhang, B.; Yang, W.; Ma, N. Influence of Sintering Temperature on the Structure and Piezoelectric Properties of ZnO-Modified (Li, Na, K)NbO3 Lead-Free Ceramics. Int. J. Miner. Metall. Mater. 2012, 19, 843–848. [Google Scholar] [CrossRef]
  29. Wendari, T.P.; Arief, S.; Mufti, N.; Baas, J.; Blake, G.R.; Zulhadjri, Z. Ratio Effect of Salt Fluxes on Structure, Dielectric and Magnetic Properties of La,Mn-Doped PbBi2Nb2O9 Aurivillius Phase. Ceram. Int. 2020, 46, 14822–14827. [Google Scholar] [CrossRef]
Figure 1. XRD patterns between the 2θ range 20 to 70° (a) corresponding to the KNL−(N0.9−xTSx)sintered at 1125 °C for 2 h, (b) zoomed in on the 2θ range of 44.5–46.5°, (c) orthorhombic and tetragonal fraction at different Sb amounts.
Applsci 13 00992 g001
Figure 2. Raman spectra of KNL−(N0.9−xTSx) (x = 0.00 to 0.04) sintered samples (a), the position of the υ1 band as a function of Sb concentration (b), and Raman shift evolution of the A1g Raman mode of the KNL−(N0.9−xTSx) ceramics as a function of x (c).
Applsci 13 00992 g002
Figure 3. Effect of Sb doping on microstructure. (ac) FE-SEM images (with their respective grain size distributions, GSDs) showing the evolution of the microstructure in the KNL−(N0.9−xTSx)) ceramics as a function of the Sb content, where (a) corresponds to x = 0.00, (b) to x = 0.02, (c) to x = 0.04. Scale bar, 10 μm. (d) Evolution of the average grain size with antimony addition.
Applsci 13 00992 g003
Figure 4. EDS analysis on different points in the KNL−(N0.9−xTSx)ceramics with x = 0.04. Scale bar, 10 μm. The table at the right presents the composition on the regions shown on a micrograph derived from EDS spectra. The table represents the atomic percentages of elements From the EDX analysis, the average compositions for the different points marked in Figure 4 could be calculated, obtaining compositions at points 1 and 3 (glassy phase), and at points 2 and 4 (main grains) of (K0.33Na0.29Li0.04)(Nb0.78Ta0.18Sb0.04)O3 and (K0.37Na0.40Li0.04)(Nb0.85Ta0.11Sb0.04)O3, respectively.
Applsci 13 00992 g004
Figure 5. (a) Dielectric permittivity and dielectric loss (tan δ) vs. temperature, at 10 kHz, of KNL−(N0.9−xTSx) ceramics with different Sb contents sintered at 1125 °C. (b) Curie temperature value (Tc) of the KNL−(N0.9−xTSx)ceramics decreases with Sb addition.
Applsci 13 00992 g005
Figure 6. Ferroelectric loop of the KNL−(N0.9−xTSx)ceramics (a). Pr and Ec (b), and d33 (c) evolution with antimony addition.
Applsci 13 00992 g006
Table 1. Real permittivity (ε’), tan(δ), remnant polarization (Pr), and coercive field (Ec) of KNL−(N0.9−xTSx) (x = 0.00 to 0.04) sintered samples measured at RT. Dielectric values were determined at 10 kHz.
Sb Content (x)ρ (g/cm3)d33 (pC/N)ε’tanδPr (μC/cm2)Ec (kV/cm)
0.004.5780933.80.2814.317.1
0.024.56230935.10.0421.321.7
0.044.552601211.20.0323.322.6
Disclaimer/Publisher’s Note: The statements, opinions and data contained in all publications are solely those of the individual author(s) and contributor(s) and not of MDPI and/or the editor(s). MDPI and/or the editor(s) disclaim responsibility for any injury to people or property resulting from any ideas, methods, instructions or products referred to in the content.

