Article

Analysis of Surface and Building Deformation by Shield Tunneling through Geology

1
College of Engineering, Liaocheng University, Liaocheng 252000, China
2
School of Civil Engineering, Qingdao University of Technology, Qingdao 266000, China
*
Author to whom correspondence should be addressed.
Appl. Sci. 2023, 13(20), 11155; https://doi.org/10.3390/app132011155
Submission received: 11 September 2023 / Revised: 7 October 2023 / Accepted: 8 October 2023 / Published: 11 October 2023

Abstract

:
The research in this paper relies on the Baochang shield construction section of Jinan Metro Line R2 and uses MIDAS GTS and MIDAS GEN to construct a three-dimensional calculation model to numerically simulate the process of shield tunneling through abrupt geology. The main research focuses on surface settlement and building deformation during excavation, as well as monitoring of building deformation and surface settlement after adopting settlement control measures. The research results are as follows: The maximum settlement of tunnel excavation from hard rock to soft rock and from soft rock to hard rock occurs at the longitudinal center of the tunnel, with values of 1.66 mm and 4.82 mm. The excavation direction has a significant impact on surface deformation. The tunnel is excavated from hard rock to soft rock and the maximum deformation values in the vertical and horizontal directions of the building are 2.04 mm and 1.92 mm. After adopting settlement control measures, surface settlement and deformation of buildings were monitored. The monitoring results showed that the deformation monitoring values of the surface and buildings, after adopting engineering measurements, were lower than the values of numerical simulation. This indicates that the engineering control measures adopted can effectively constrain surface settlement and the deformation of buildings.

1. Introduction

With the continuous expansion of China’s subway project scale, the laying route and surrounding environment of the shield tunnel become more and more harsh and it will inevitably pass through the abrupt geological environment [1] with uneven hardness. Different from the conventional single stratum or stratum with similar mechanical properties, when the shield machine crosses this kind of geological environment, it is affected by factors such as different mechanical properties of strong and weak geology and geological interface effects. It is easy to cause engineering problems [2], such as the instability of the excavation face, sliding failure of the geological interface, and stratum deformation. In the process of shield construction in an abrupt stratum, due to the uneven stress of the cutter head [3], it is easy to shift the actual tunneling direction, which leads to a decrease in tunneling efficiency and affects the smooth progress of the project. Zhu Weibin [4] thinks that when shield construction crosses abrupt geology, the reason for the drastic deformation of the stratum is that the complexity of the geological body causes the excavation parameters to fluctuate greatly during shield construction and then leads to the collapse of the soil around the excavation face. Xiao Guowei [5] obtained the law of ground settlement during shield tunneling by studying the composite soil layers with different ratios of soft to hard. When shield tunneling is carried out in the upper soft and lower hard strata, as the proportion of hard soil increases, the smaller the settlement value of the surface becomes. Based on the elastic-plastic theory, Chen Zhi [6] studied the mechanical properties and deformation of surrounding rock in the process of shield tunnel crossing abrupt geological interface. Wang Zhiwei [7] systematically analyzed the loosening mechanism of excavated surrounding rock in abrupt strata and studied the influence of slip and joint on the loosening zone. Xiong Liangxiao [8] adopted the ideal elastic constitutive model. The influence of the stress coefficient on surrounding rock deformation is studied.
The above research results play an important role in guiding the stability of excavation face and stratum deformation in abrupt strata, but the research on interface instability mechanism, interface failure characteristics, and interface parameter sensitivity of shield tunneling through abrupt geology with uneven hardness is relatively scarce. The existing studies on the interface stability of different geological bodies generally focus on the compression test and meso-failure mechanism of coal–rock combination in mining engineering, but there is a big difference between the interface failure mechanism and shield tunneling through abrupt geology. Chen Qiang [9] used numerical simulation to explore the influence of support of the excavation face of an abrupt geological body on surface deformation. The compound EPB shield machine independently developed by the Liu Guanliang [10] team, which has the function of pneumatic obstacle clearing, provides a technical guarantee for efficient support and stratum stability in shield construction. Liu [11] established a three-dimensional finite element model of shield tunnel excavation using MIDAS GTS (2018) software and conducted numerical simulation analysis on surface settlement, soil plastic zone, adjacent building influence, and shield tunnel segment stress caused by shield construction. The results showed that surface settlement caused by shield construction may damage adjacent buildings. Zou Jinjie [12] and others adopted the axisymmetric half-tunnel model to study the instability process and surface deformation law of a tunnel excavation face under different reinforcement conditions. Liu [13], etc., through field detection and numerical simulation, explored the influence law of the shield method on surface deformation and settlement in transition zones in uneven soft and hard strata. In abrupt stratum, the lateral settlement is obviously affected by the ratio of hard layer to hard layer and the surface settlement decreases with the increase of the ratio of hard layer to hard layer. Hesami et al. [14] compared the results obtained using the finite element method and the measurements with instrumentation and proposed that the finite element method can give an acceptable prediction of the settlements. Sun Xiaohao [15] passed the control physical model test. The two-dimensional particle flow program is used to simulate the excavation process under different densities and buried depths, and, finally, the failure mechanism of the soil in front of the shield tunneling is obtained. Wang [16] provided that the surrounding rock deformation of the tunnel is mainly concentrated in the arch crown and arch bottom and the surrounding rock of the arch crown has sudden settlement, large deformation rate, and amount.
Most of the above research results have established corresponding numerical models through numerical simulation and analyzed the instability mechanism and surface deformation law of tunnel excavation surfaces during shield construction. However, there is often a lack of experimental support for the stratum deformation mechanism and surface prediction model of abrupt geology, and the mechanism of stratum disturbance and deformation and settlement caused by the instability of the excavation face or failure of the geological interface is not well understood. Xiaowu Tang [17], in order to study the instability development process of the excavation face and the law of stratum deformation, has carried out relevant tests on the retreat of different supporting plates and obtained three stages of excavation face instability. Chen Renpeng [18], and others, passed the centrifugal test. The linear relationship between the ultimate effective support pressure and the water head pressure is analyzed, which lays a theoretical foundation for the stability of the shield tunneling face under the condition of rich water. Li Jiaoyang [19] studied the stability of the excavation face of the shallow shield tunnel using a large-scale physical model test. It was concluded that when the excavation face was unstable, the three stages of surface settlement corresponded to the internal deformation process of the soil. Li Chunliang [20] applied the two-parameter elastic foundation theory, established a longitudinal mechanical model based on the state space theory, and discussed the mechanical properties of the tunnel with variable stiffness under abrupt geological conditions, which provided a reference model for the calculation of the ultimate support force of the excavation face. Shi [21] presented a model describing the interaction between soil, and an EPB shield used in tunnels is presented, based on the classical elastic theory of Mindlin, which explains the derived ground deformation caused by ground loss due to shield tunnel construction using the stochastic medium theory. Xu [22] analyzed the sources, characteristics, and propagation patterns of vibrations generated during shield tunnel construction and summarized the impact of shield vibration on adjacent buildings. On the basis of establishing a three-dimensional finite element model of the dynamic construction process of shield tunneling, Pan [23] analyzed the impact of tunnel excavation on the surface settlement and building settlement around the tunnel, based on the comparison of numerical simulation results of the surface and building settlement with on-site monitoring values. Zhang [24] used ABAQUS software to establish a model of the shield tunnel and surface frame structure of the Tianjin Binhai Soft Soil Site Metro Line 4. By calculating the surface settlement, foundation settlement of the frame structure, horizontal displacement, and internal force of the frame columns and beams during the excavation process of the shield tunnel, the impact of shield tunnel construction on the surface frame structure was analyzed.

2. Model Establishment and Parameter Determination

2.1. Project Overview

Le Mansion is located near the intersection of Donggongshang River Road and Shangchang North Road in Jinan City. The main body of the mansion is a frame-shear wall structure, which is a six-story commercial building. The building has a floor height of 3 m, 36 m long, 16 m wide, and 18 m high. Considering the high bearing capacity of the building foundation and no basement, the pile foundation is selected because tunnel construction needs to cross the building from the front. Therefore, a three-dimensional calculation model is established according to the actual situation of the project. Firstly, the building model is established by MIDAS GEN, and then the established model is imported into MIDAS GTS for analysis and calculation. In this model, the soil layer, building beam, building slab, and building column are all solid units. In the process of tunnel excavation, this project involves four layers of soil. The boundary conditions of the established three-dimensional soil model constrain normal displacement in the front, back, left, and right directions, and constrain displacement in the X, Y, and Z directions at the bottom. The Hardening-Soil constitutive model (referred to as the H-S model) is adopted in the process of soil formation. The H-S model is an improved constitutive model based on the Mohr-Coulomb (M-C) model. The shear yield surface is the same as the yield surface of the M-C constitutive model, and the compression yield surface is an elliptical hat constitutive model. The H-S model can be used to simulate a combination of nonlinear elastic and elastic-plastic models with power law relationships, using soil layers more widely than M-C, especially materials with friction characteristics such as sand or concrete [25]. In this project, the tunneling pressure is set to 120 kN, and the application of tunneling pressure is realized using a 3D unit surface in surface pressure. The set value of jack force is 100 kN, and the application of jack force is realized using a 2D unit line in line pressure. The grouting pressure is set to 150 kN, and the application of grouting pressure is realized using a 2D unit plane in plane pressure. During the model grid division, considering the accuracy of unit grid and displacement and deformation, the grid length of the excavated soil is set to 1 m and the grid length of other soil layers is set to 2 m. The model grid division is shown in the following Figure 1.

2.2. Physical and Mechanical Indexes of Rock Mass and Segments

Without considering the influence of groundwater and rock fissures, according to the specific conditions of engineering geology and hydrology, the strength of soft rock is 15 MPa and that of hard rock is 60 MPa. The C and φ values of the surrounding rock are selected in reference [26]. According to the geological exploration report of the Baochang shield section of Jinan Metro Line 2, the physical and mechanical indexes of rock mass and segments are shown in Table 1 and Table 2.
According to the engineering practice, C30 reinforced concrete with a thickness of 300 mm, a weight of 25 KN/m3, an elastic modulus of 38 GPa, and a Poisson’s ratio of 0.20 is selected for the lining simulation.

3. Influence of Shield Tunnel Excavation on Surface Settlement

3.1. Shield Tunnel Excavation from Hard Rock to Soft Rock

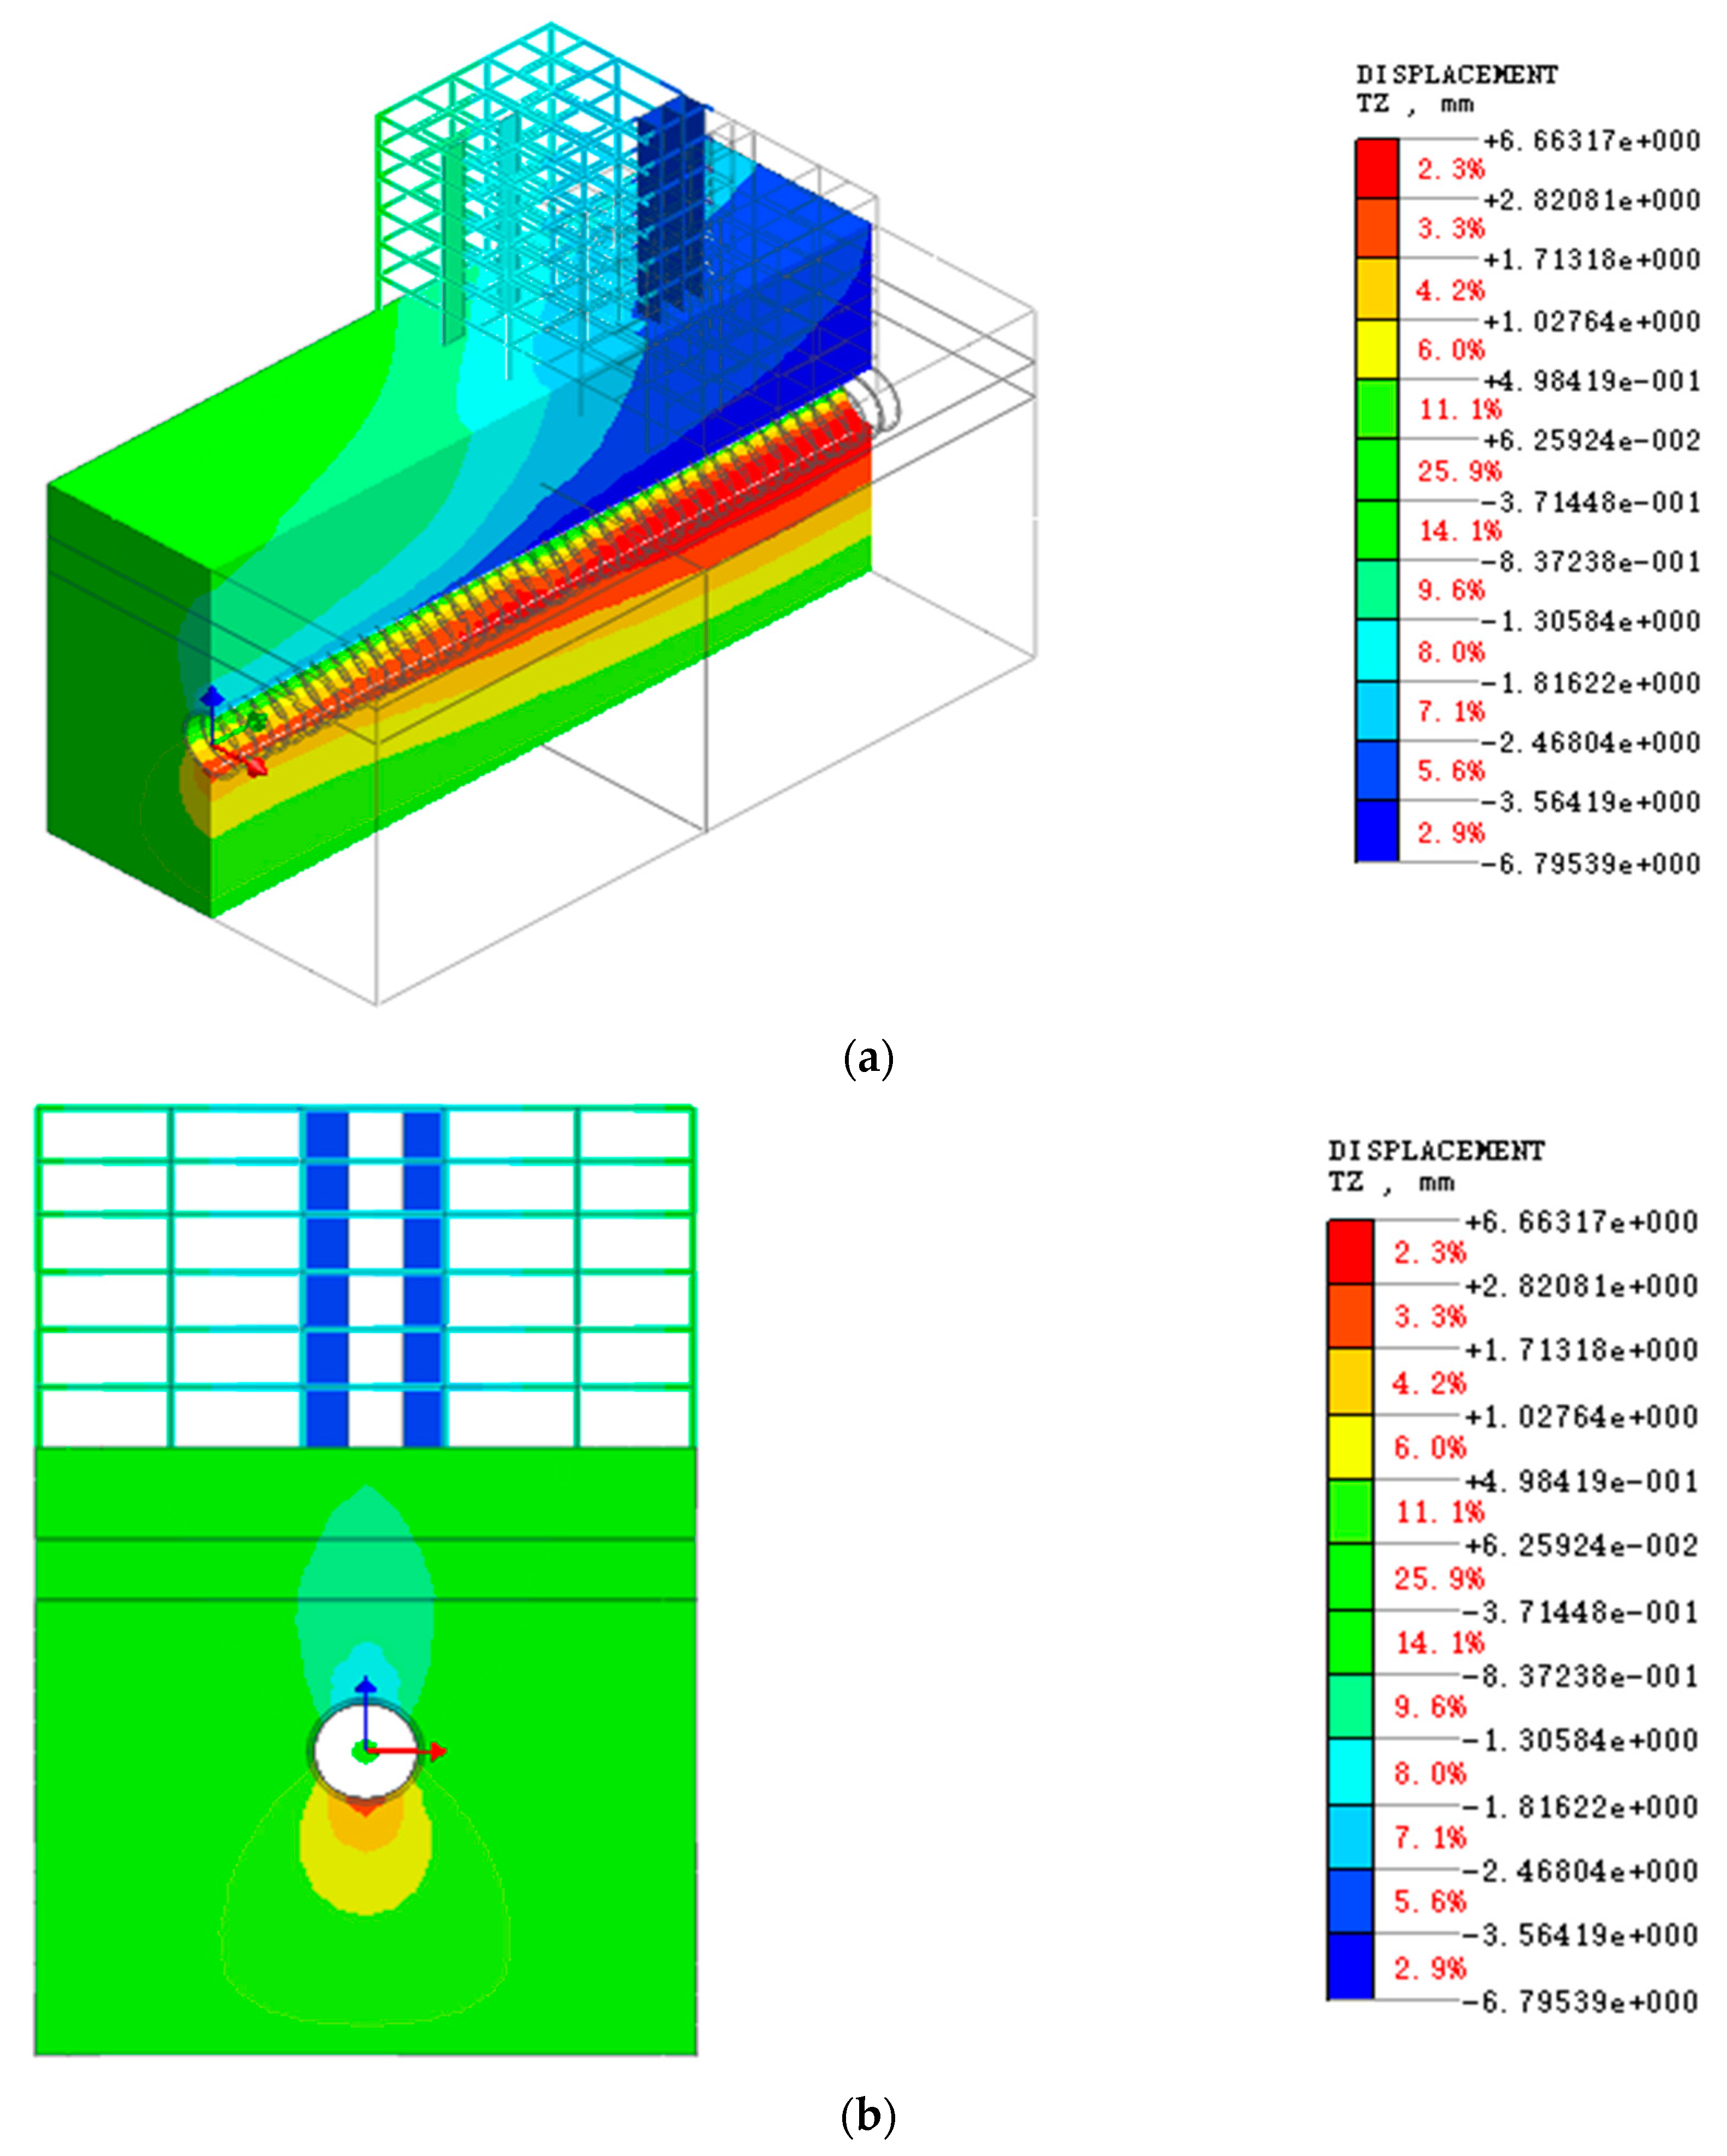
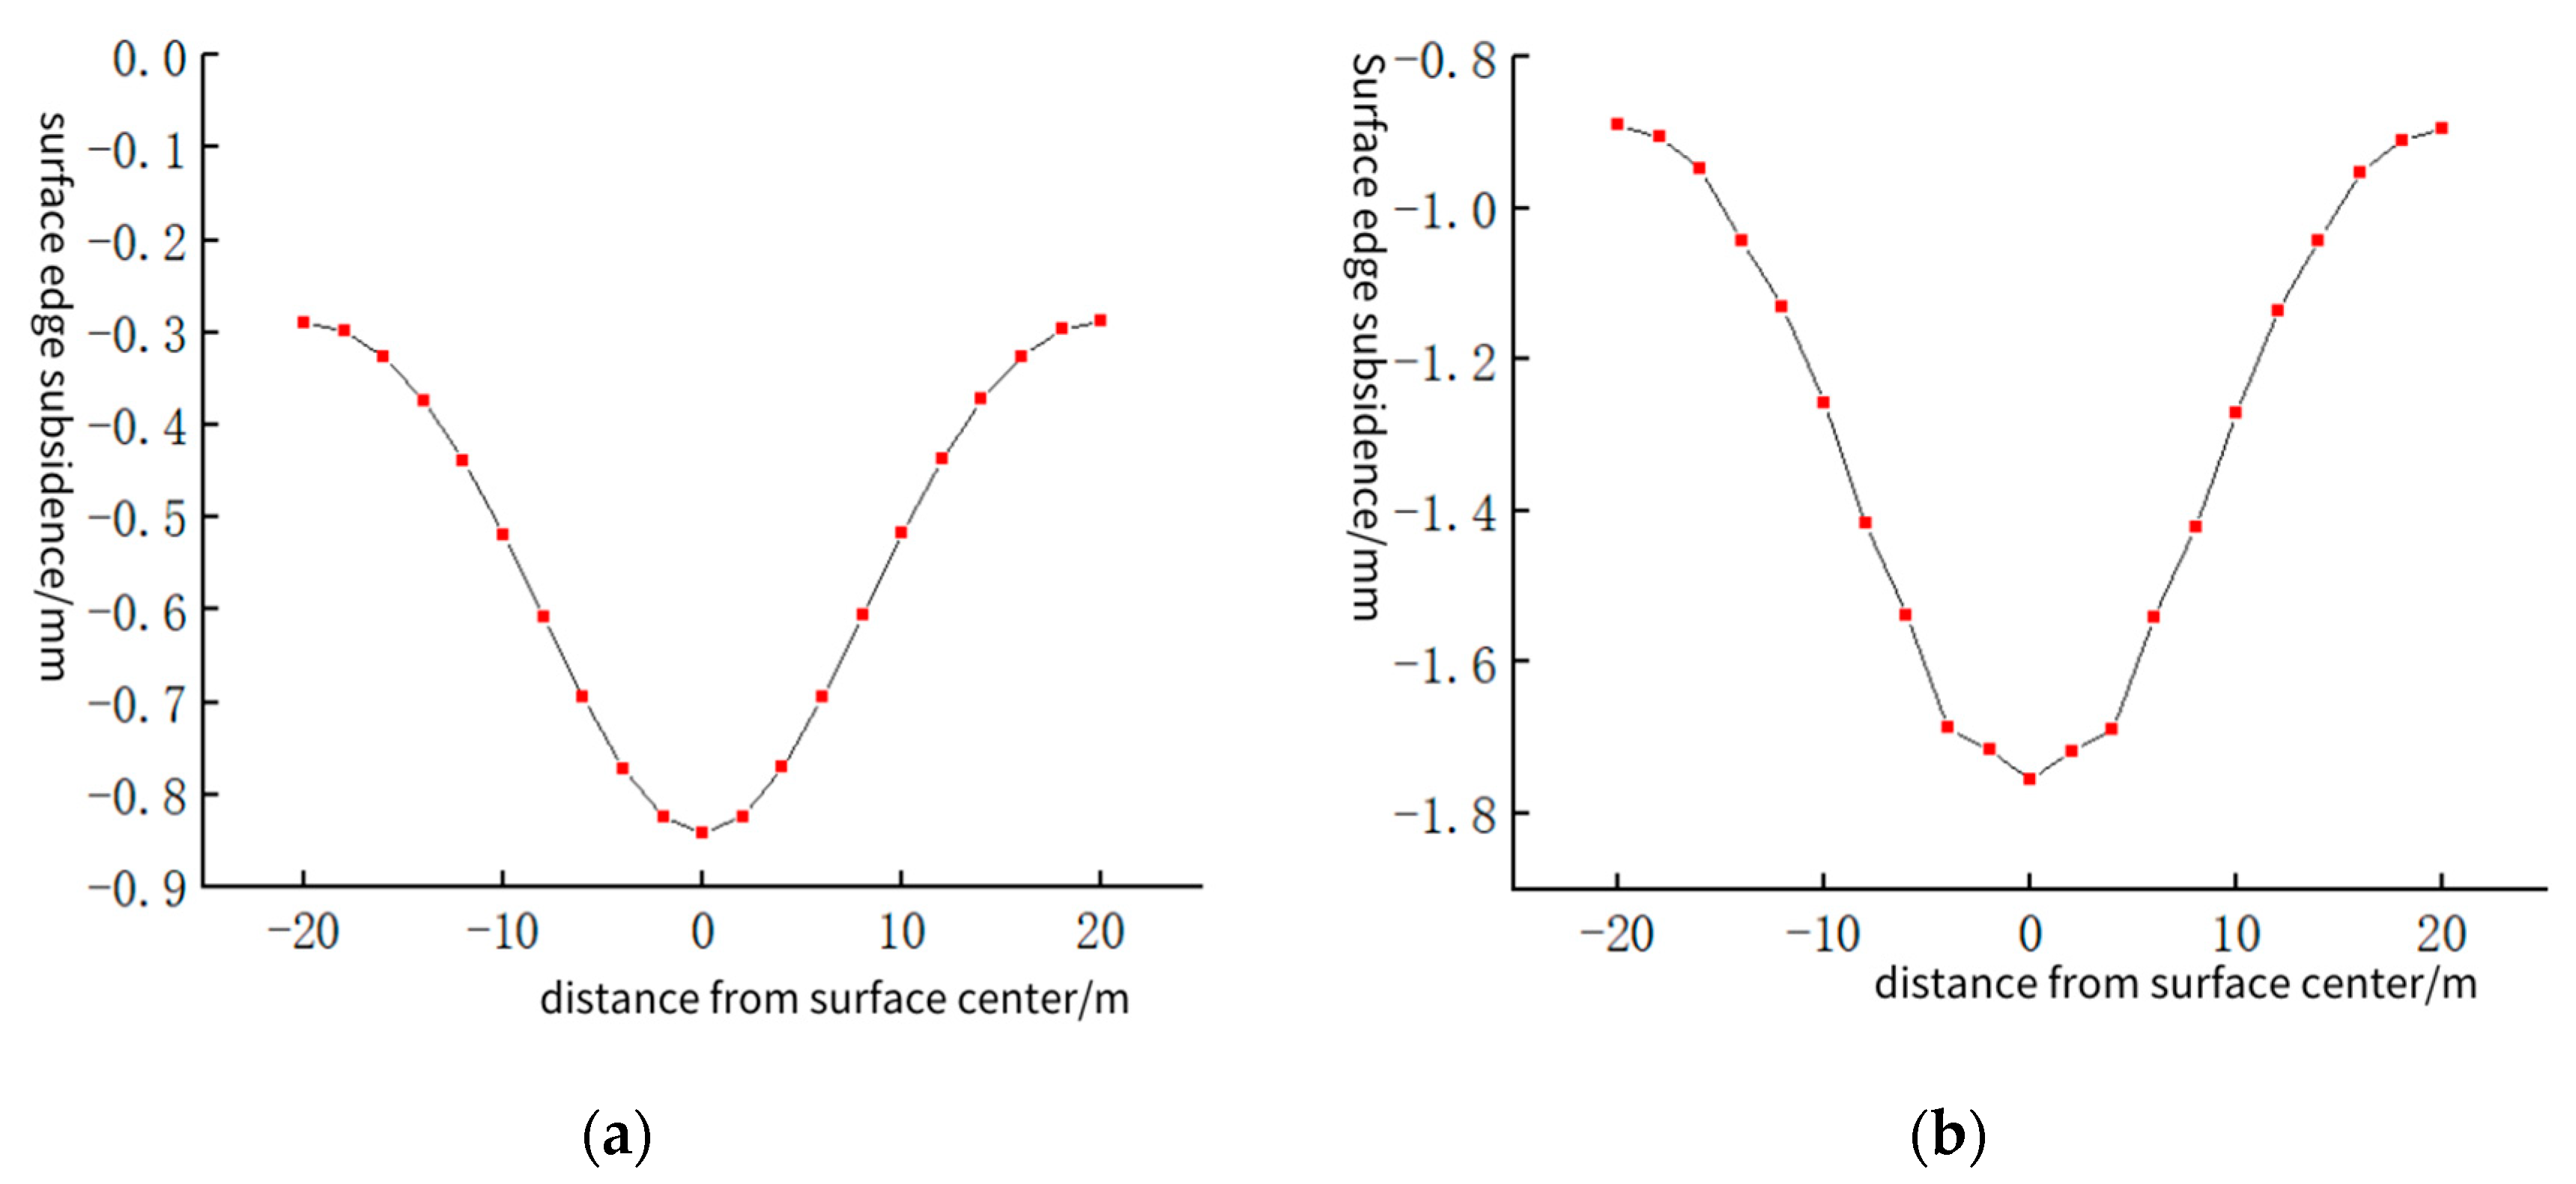
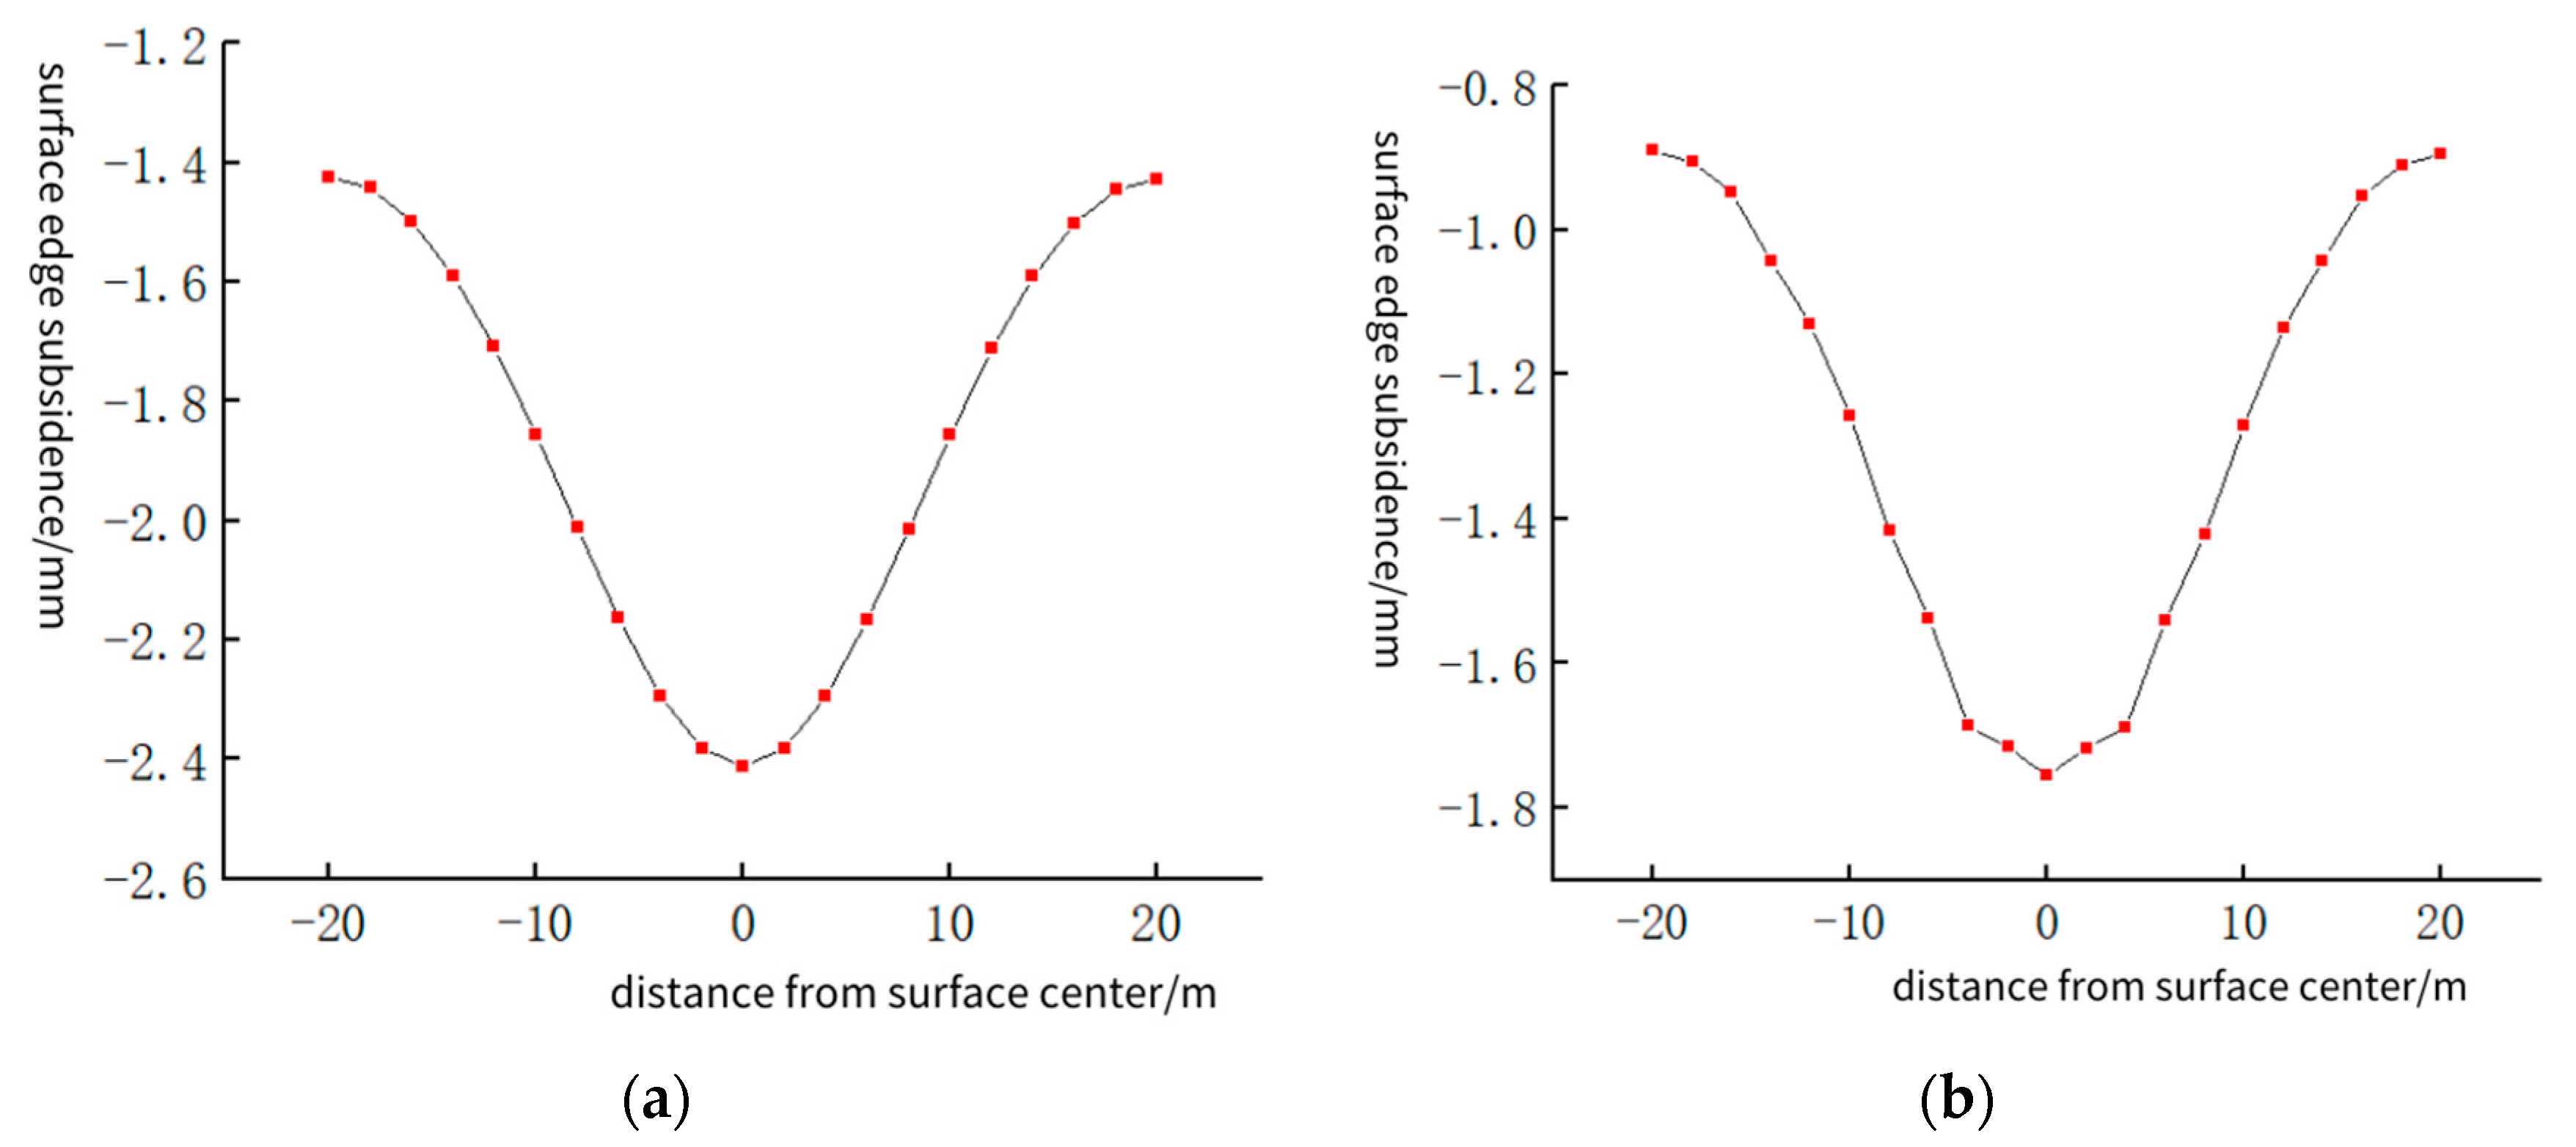
According to Figure 2 and Figure 3, the surface settlement curve is funnel-shaped and the maximum settlement of the vault is 6.36 mm. The stratum uplift occurs at the bottom of the tunnel, and the maximum uplift is 6.51 mm at the bottom of the tunnel arch. According to the surface settlement curve, the maximum surface settlement occurs at the center of the surface, which is 1.66 mm, and the settlements on both sides of the surface are symmetrically distributed along the direction of shield tunneling. According to the surface settlement curve, the settlement values of both sides are smaller than those of the middle, whether it is the center or the edge of the surface, and the maximum settlement control value is within the specification requirements, which is in line with the normal working conditions.

3.2. Shield Tunnel Excavation from Soft Rock to Hard Rock

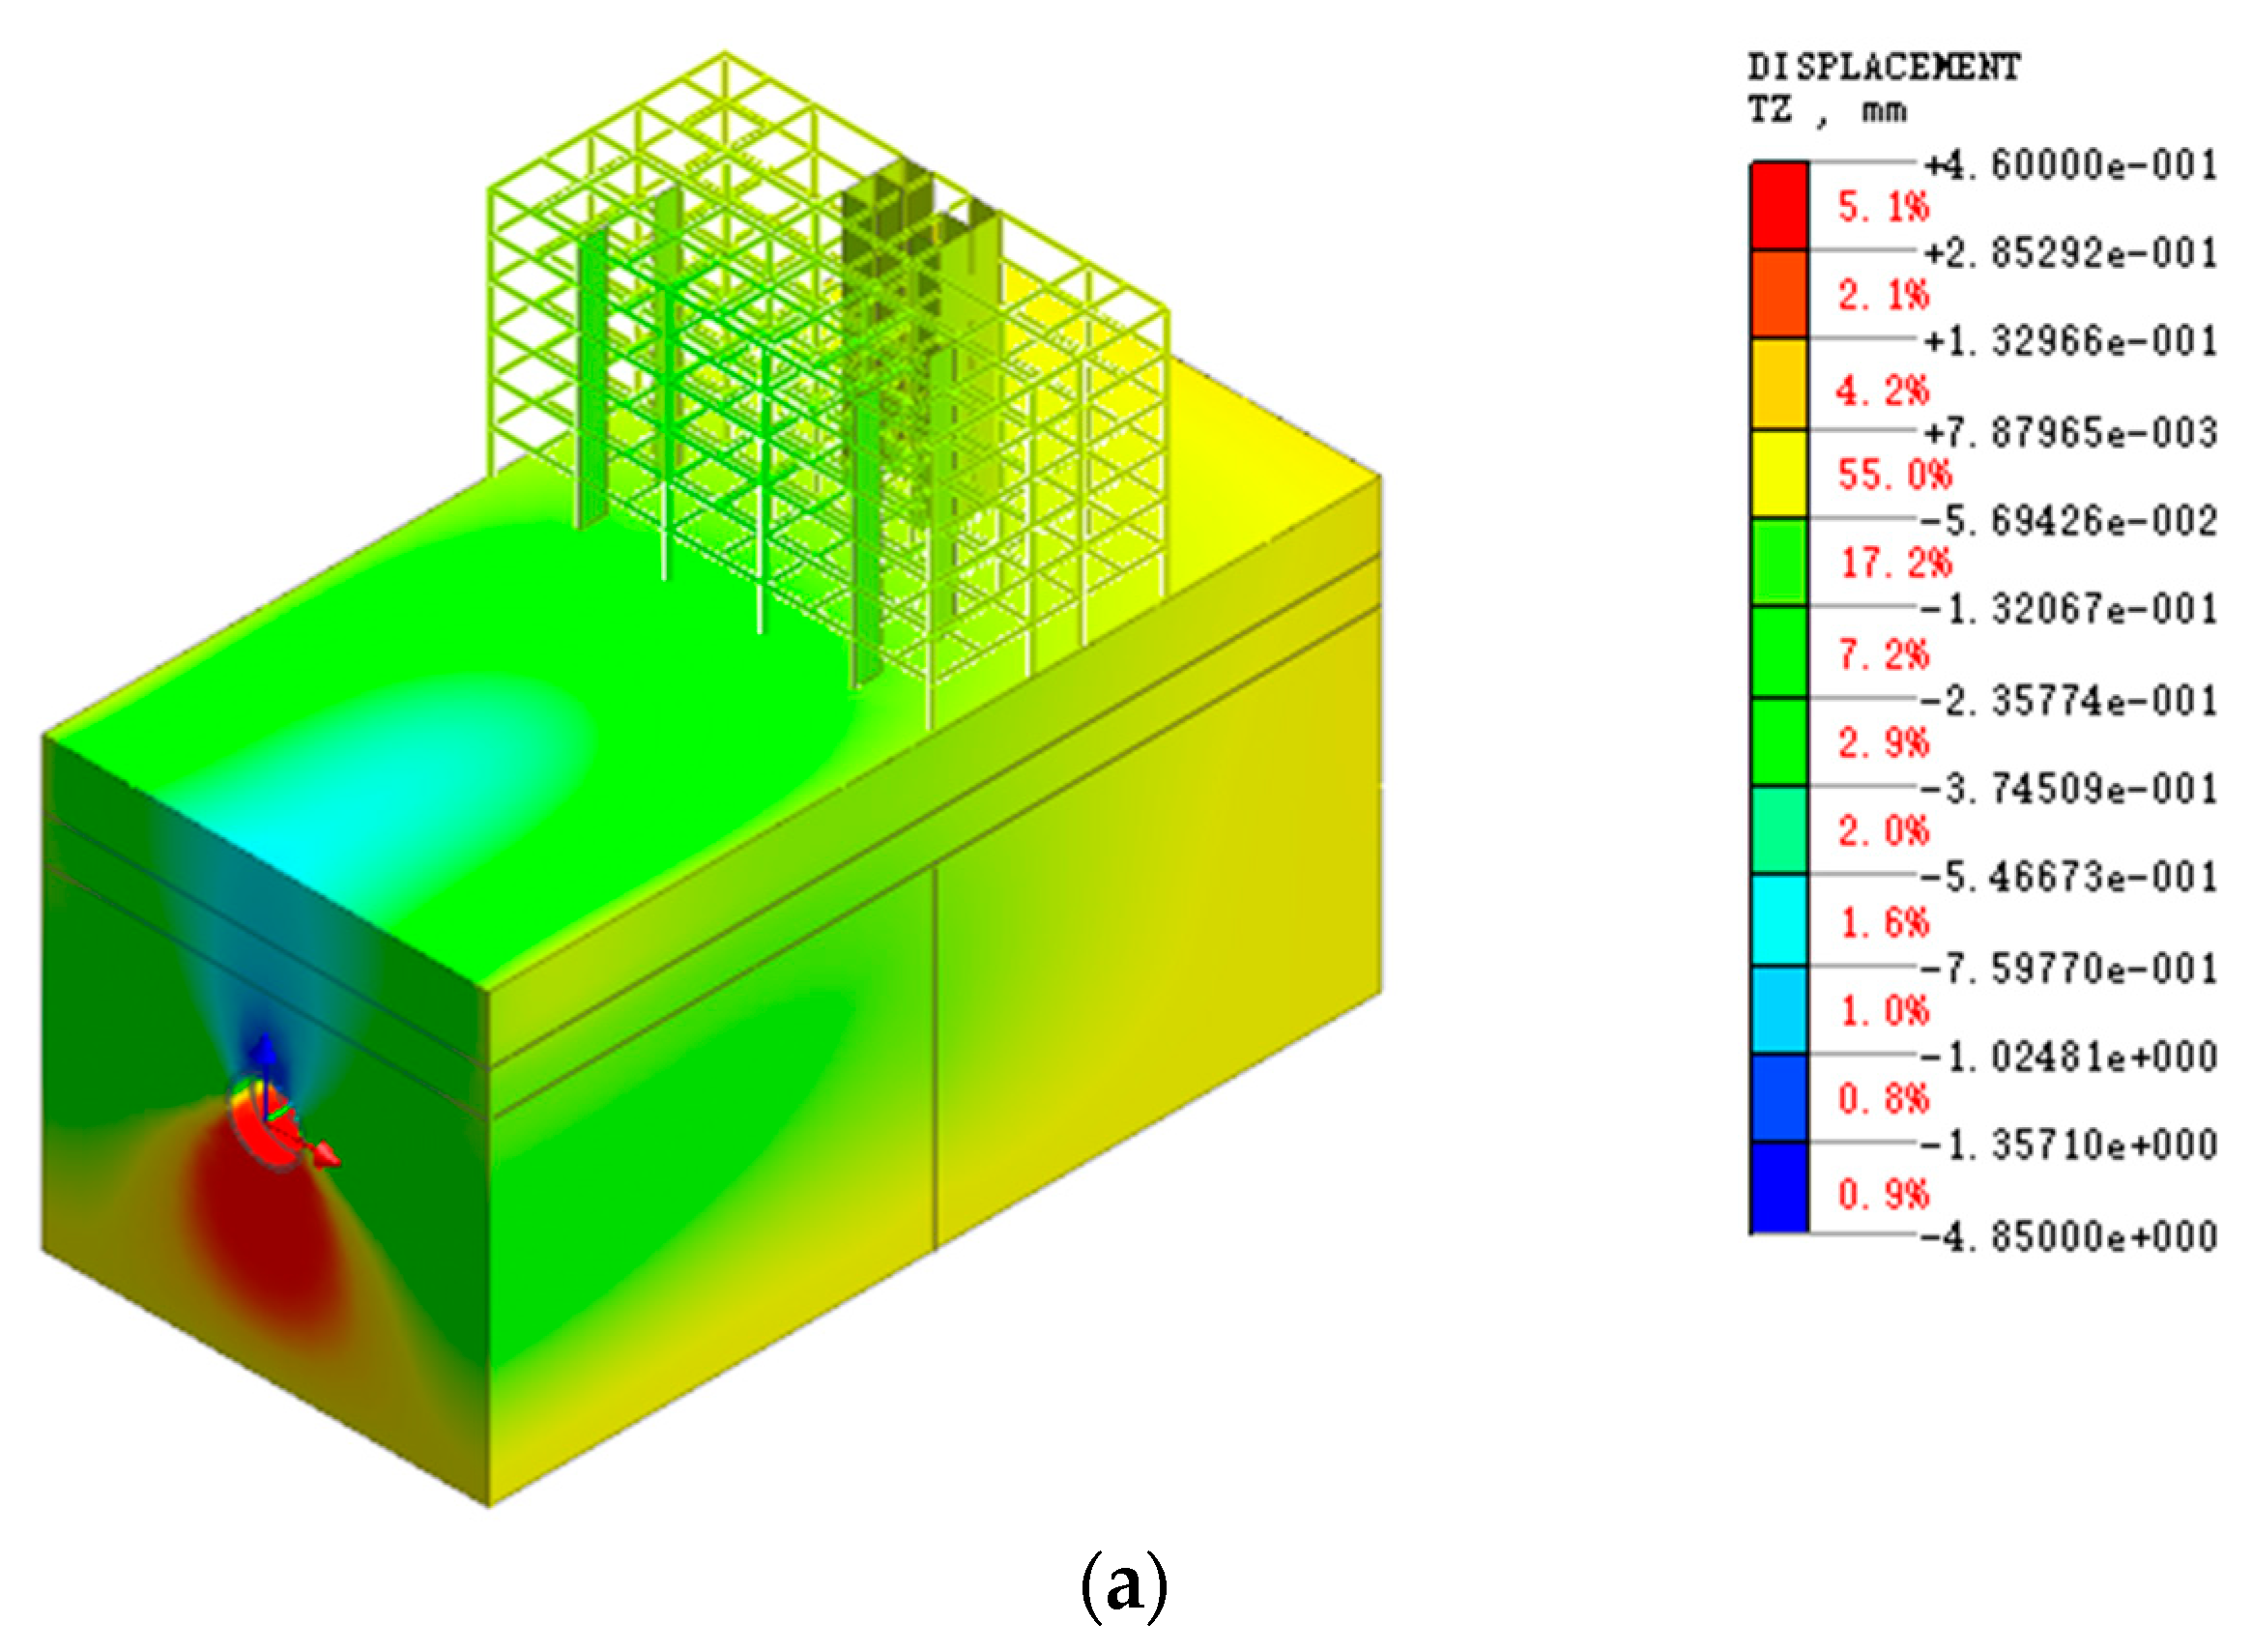
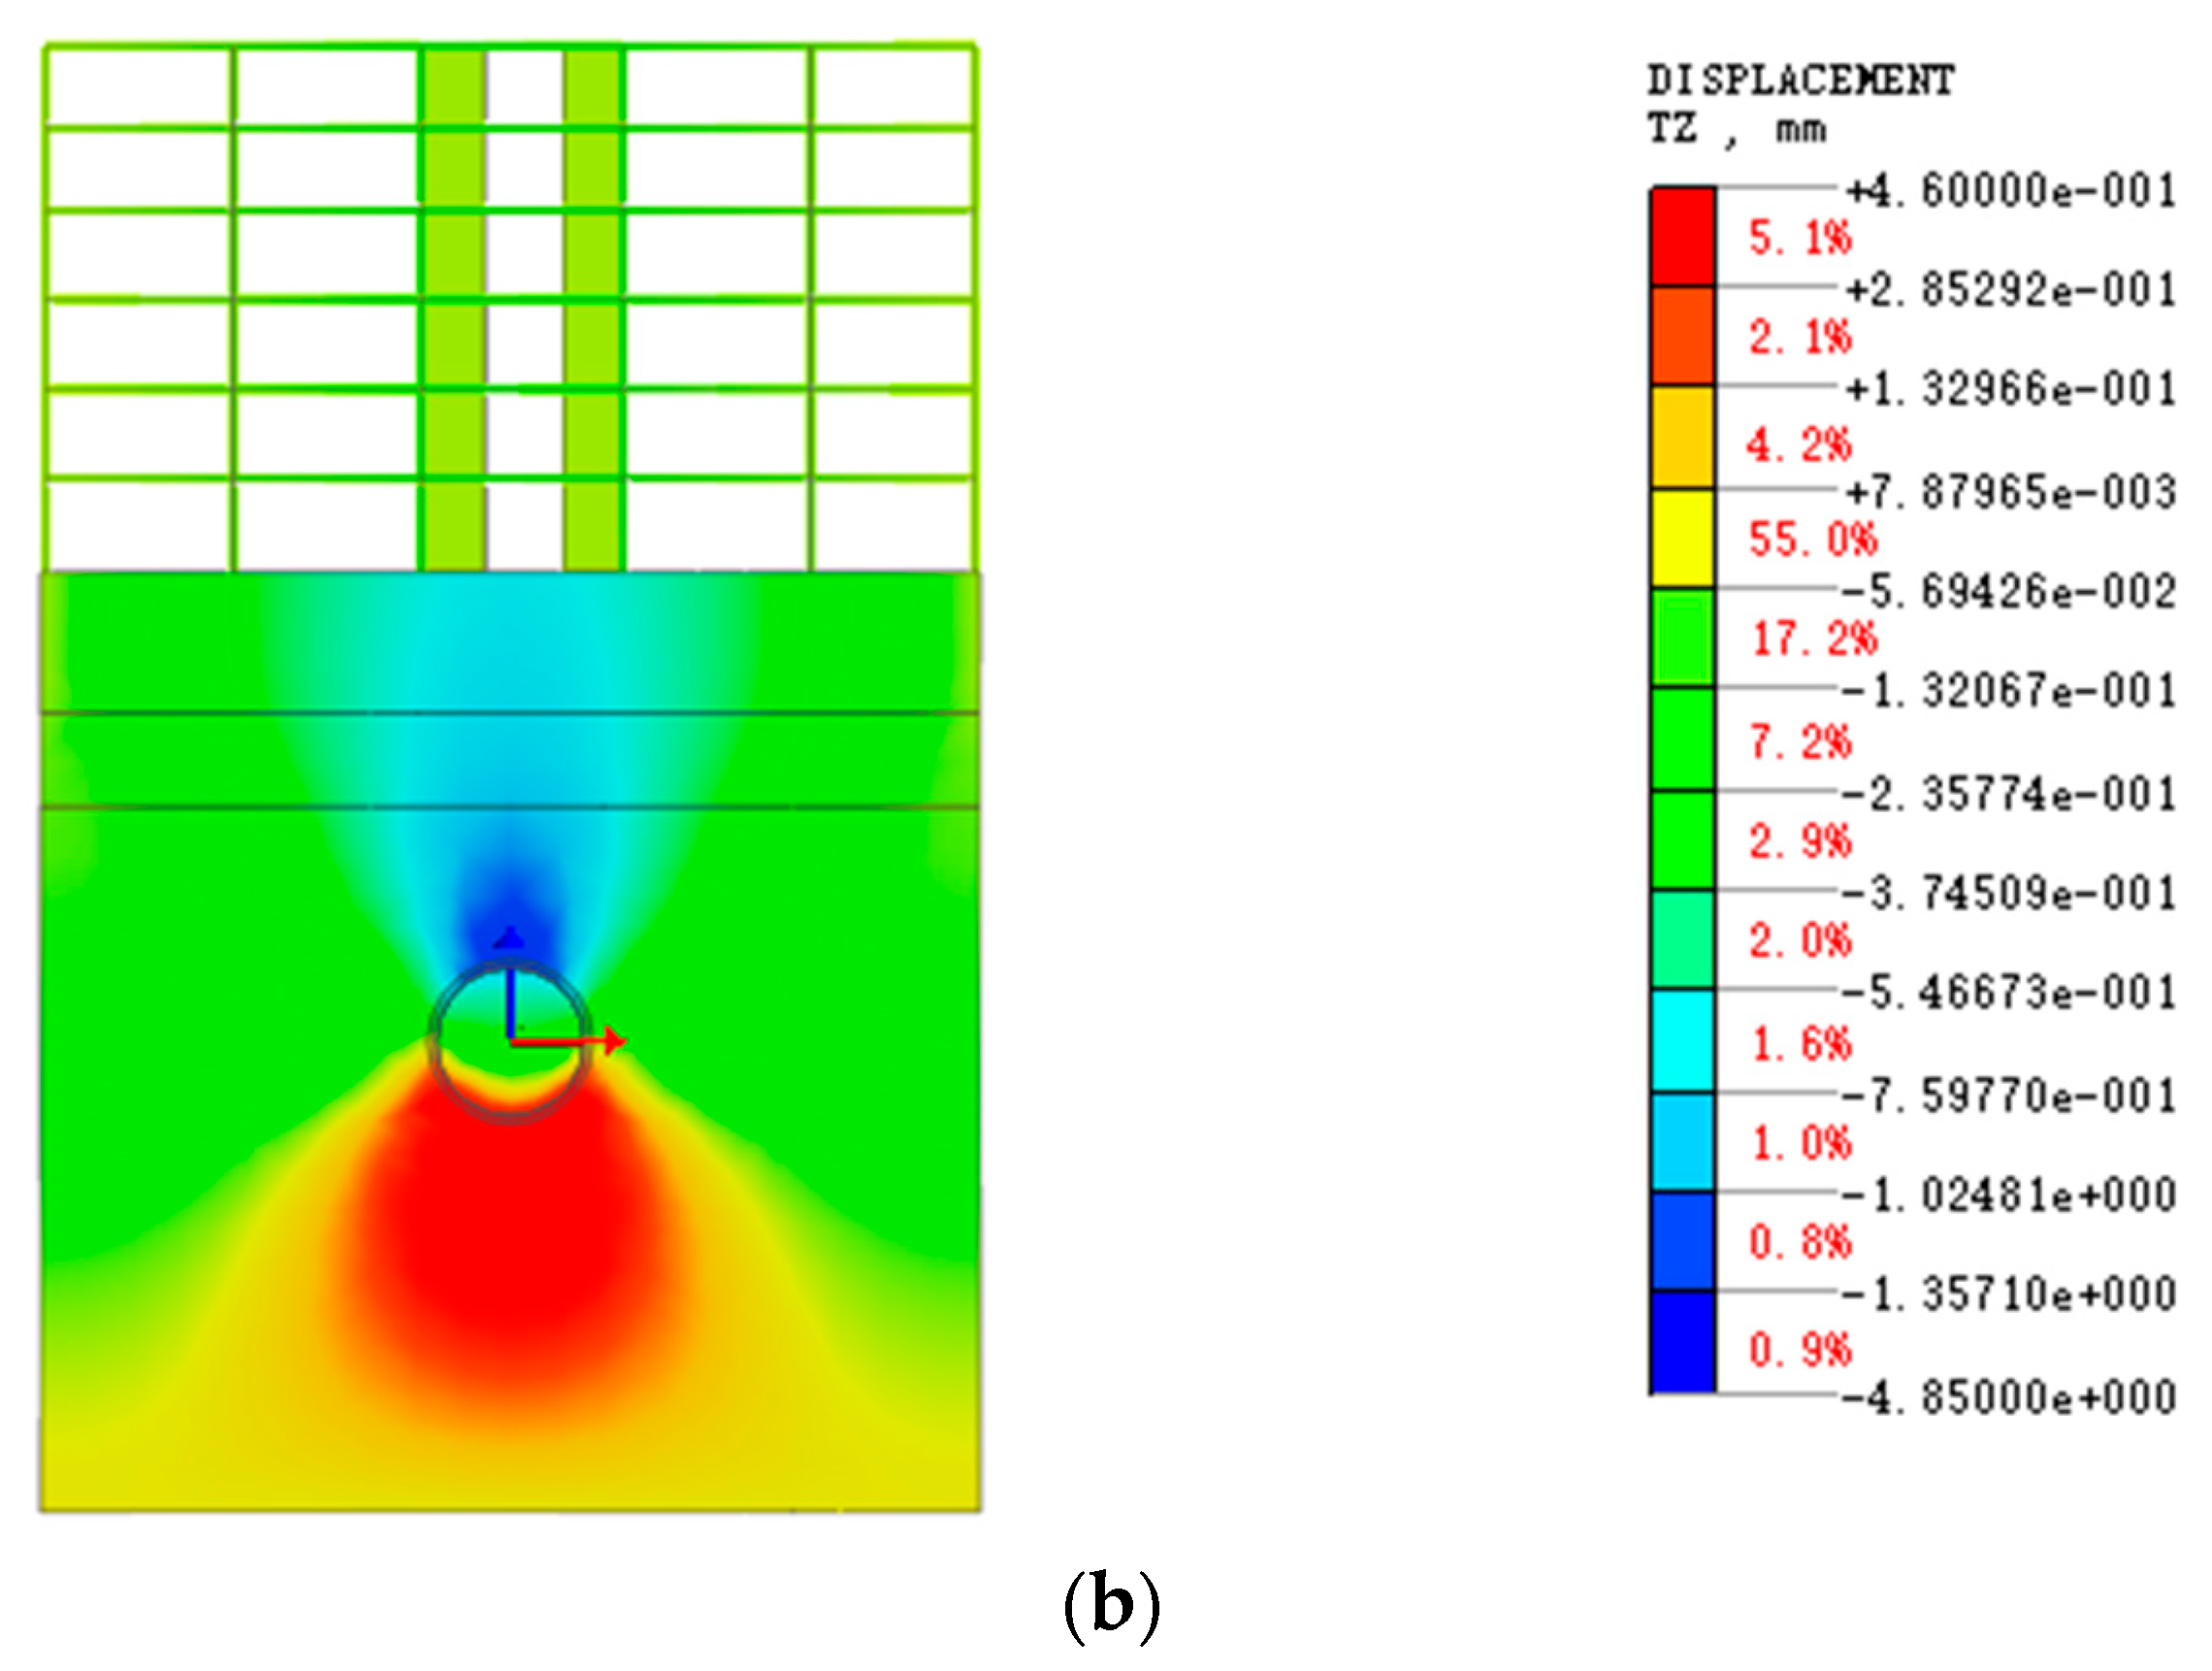
In Figure 4 and Figure 5, it can be seen that the surface settlement curve is funnel-shaped. According to the vertical displacement cloud chart, the maximum ground settlement occurs at the tunnel vault, which is 4.82 mm. The stratum uplift occurs at the bottom of the tunnel, and the maximum uplift is 0.44 mm at the bottom of the tunnel arch. According to the surface settlement curve, the surface settlement is the largest at the edge of the surface, which is 2.42 mm. Moreover, along the direction of shield tunneling, the settlement on both sides of the surface is symmetrically distributed. According to the cloud map of surface displacement, the overall displacement of the surface shows a settlement trend during shield tunneling, which accords with the actual working conditions. Compared with the results of the previous studies, the maximum settlement of the shield tunneling construction surface mostly occurs at the longitudinal center of the tunnel. In recent literature, the monitoring value of the maximum settlement of the shield tunneling construction surface of a subway in Xiamen, China, is about 2.5 mm [3] and the settlement value of the arch top of an underground comprehensive pipe gallery in Guangzhou, China, is between 2.2 and 4.09 mm [5] and is consistent with the results calculated in this model.

4. Influence of Shield Tunnel Excavation on Building Deformation

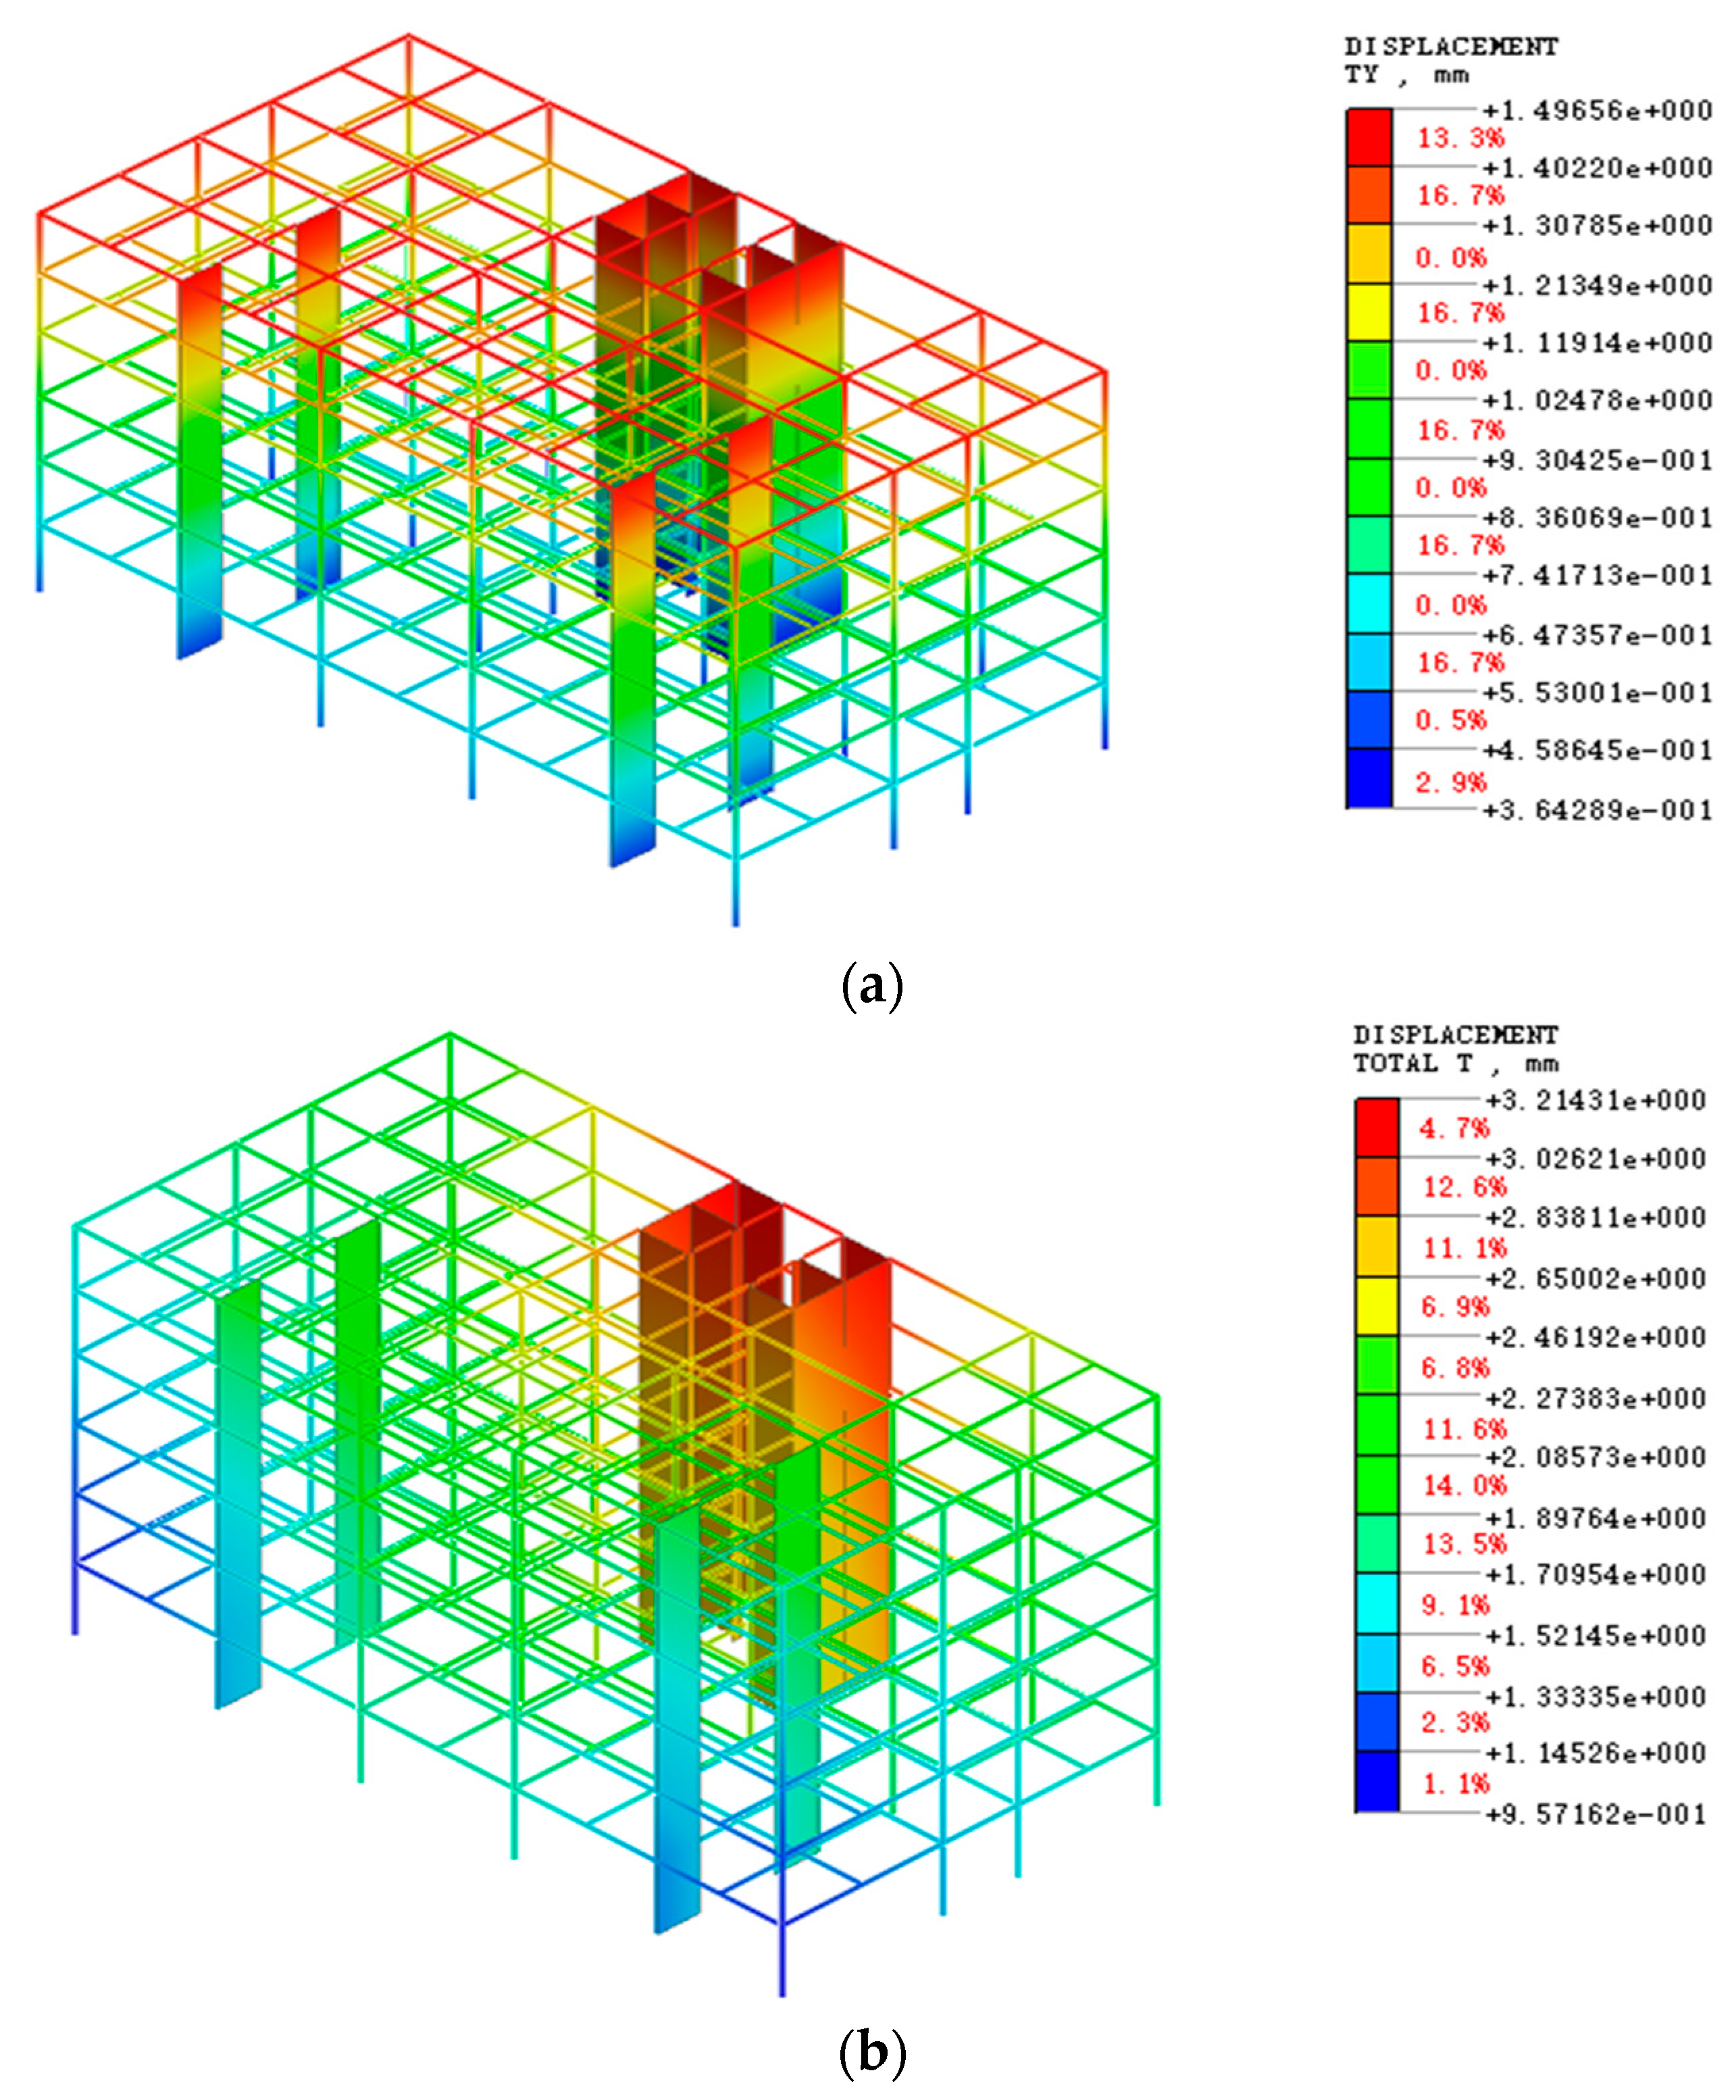
The following figure shows the cloud picture of vertical displacement, vertical displacement, and total displacement of the surface buildings when the shield tunnel is excavated from hard rock to soft rock.
When the shield tunnel is excavated under the surface buildings, it will have a certain impact on the surrounding buildings and make the buildings deform in horizontal and vertical directions. It can be seen in Figure 6, Figure 7 and Figure 8 that the vertical displacement of the building beam increases linearly along the tunneling direction and the maximum vertical displacement occurs at the end of the building beam, the maximum vertical displacement is 2.04 mm along the negative direction of the Z-axis. Along the positive direction of the Z-axis, the longitudinal displacement of building columns also shows an increasing trend. The maximum longitudinal displacement of building columns occurs at the top of columns, and the maximum longitudinal displacement is 1.29 mm, with the positive direction in the Y-axis. To sum up, the maximum vertical displacement of the building beam and the maximum longitudinal displacement control value of the building column are within the scope of the specification, which is in line with the actual construction conditions.

5. Control and Monitoring Measures for Abrupt Geological Deformation of Shield Crossing

5.1. Deformation Control Measures

5.1.1. Surface Settlement and Engineering Measures

(1) Synchronous grouting
In the construction process of this project, considering the economic cost, grouting is usually used to reinforce the soft soil layer in the Baochang shield section, which lays the foundation for the following tunnel excavation. If the grouting pressure is too small, it will be difficult to inject the slurry into the pores of the soil layer during the grouting process. On the contrary, excessive grouting pressure will cause certain disturbances to the soft layer of soil in front of the tunnel excavation. So, the grouting strength should be well controlled in the process of excavation to ensure that the granularity, viscosity, and moisture content of the slurry are within a reasonable range and conform to the grouting construction specifications.
(2) Correcting shield posture
When shield tunneling, especially in complex strata, the posture of the shield will inevitably change. When the jack is used to rectify the shield posture, the included angle between the tunnel center line and the shield axis should be guaranteed to change within the scope permitted by the project, so as to avoid the stratum loss caused by the excessive included angle and the surface deformation, but in the process of correction. To control the scale well, if the deviation correction is excessive, it will be difficult for the shield to keep straight ahead, which will greatly increase the disturbance to the surrounding rock and increase the ground settlement. Therefore, the excavation route should be planned in advance before construction. During the construction process, the monitoring of the surface deformation should be strengthened and the shield machine should not be adjusted as much as possible so that the shield machine can proceed in a straight line.

5.1.2. Deformation of Buildings and Engineering Measures

(1) As much as possible, ensure that the shield construction will pass through at one time and it is not allowed to change the cutting tools in the middle. If it is inevitable to change the cutting tools in the construction process, in the case of the complex strata, you should prepare sufficient plans in advance to ensure the smooth progress of the cutting tool replacement. Grouting is carried out on the soil through the advanced reinforcement device of the front shield of the shield machine, under the condition of ensuring the stability of the excavation face. After pressurizing the silo, start changing the cutter.
(2) When the shield machine crosses the building, check and adjust the shield posture of the shield machine in advance so as to reduce the number of corrections of the shield posture as much as possible in the process of tunneling. Control the excavation pressure. When there are buildings on the ground, slow down the excavation speed, reduce the disturbance to the stratum, and prevent the surface subsidence during excavation, thus causing the surface buildings to collapse.

5.2. Monitoring Measures

5.2.1. Monitoring of Surface Deformation

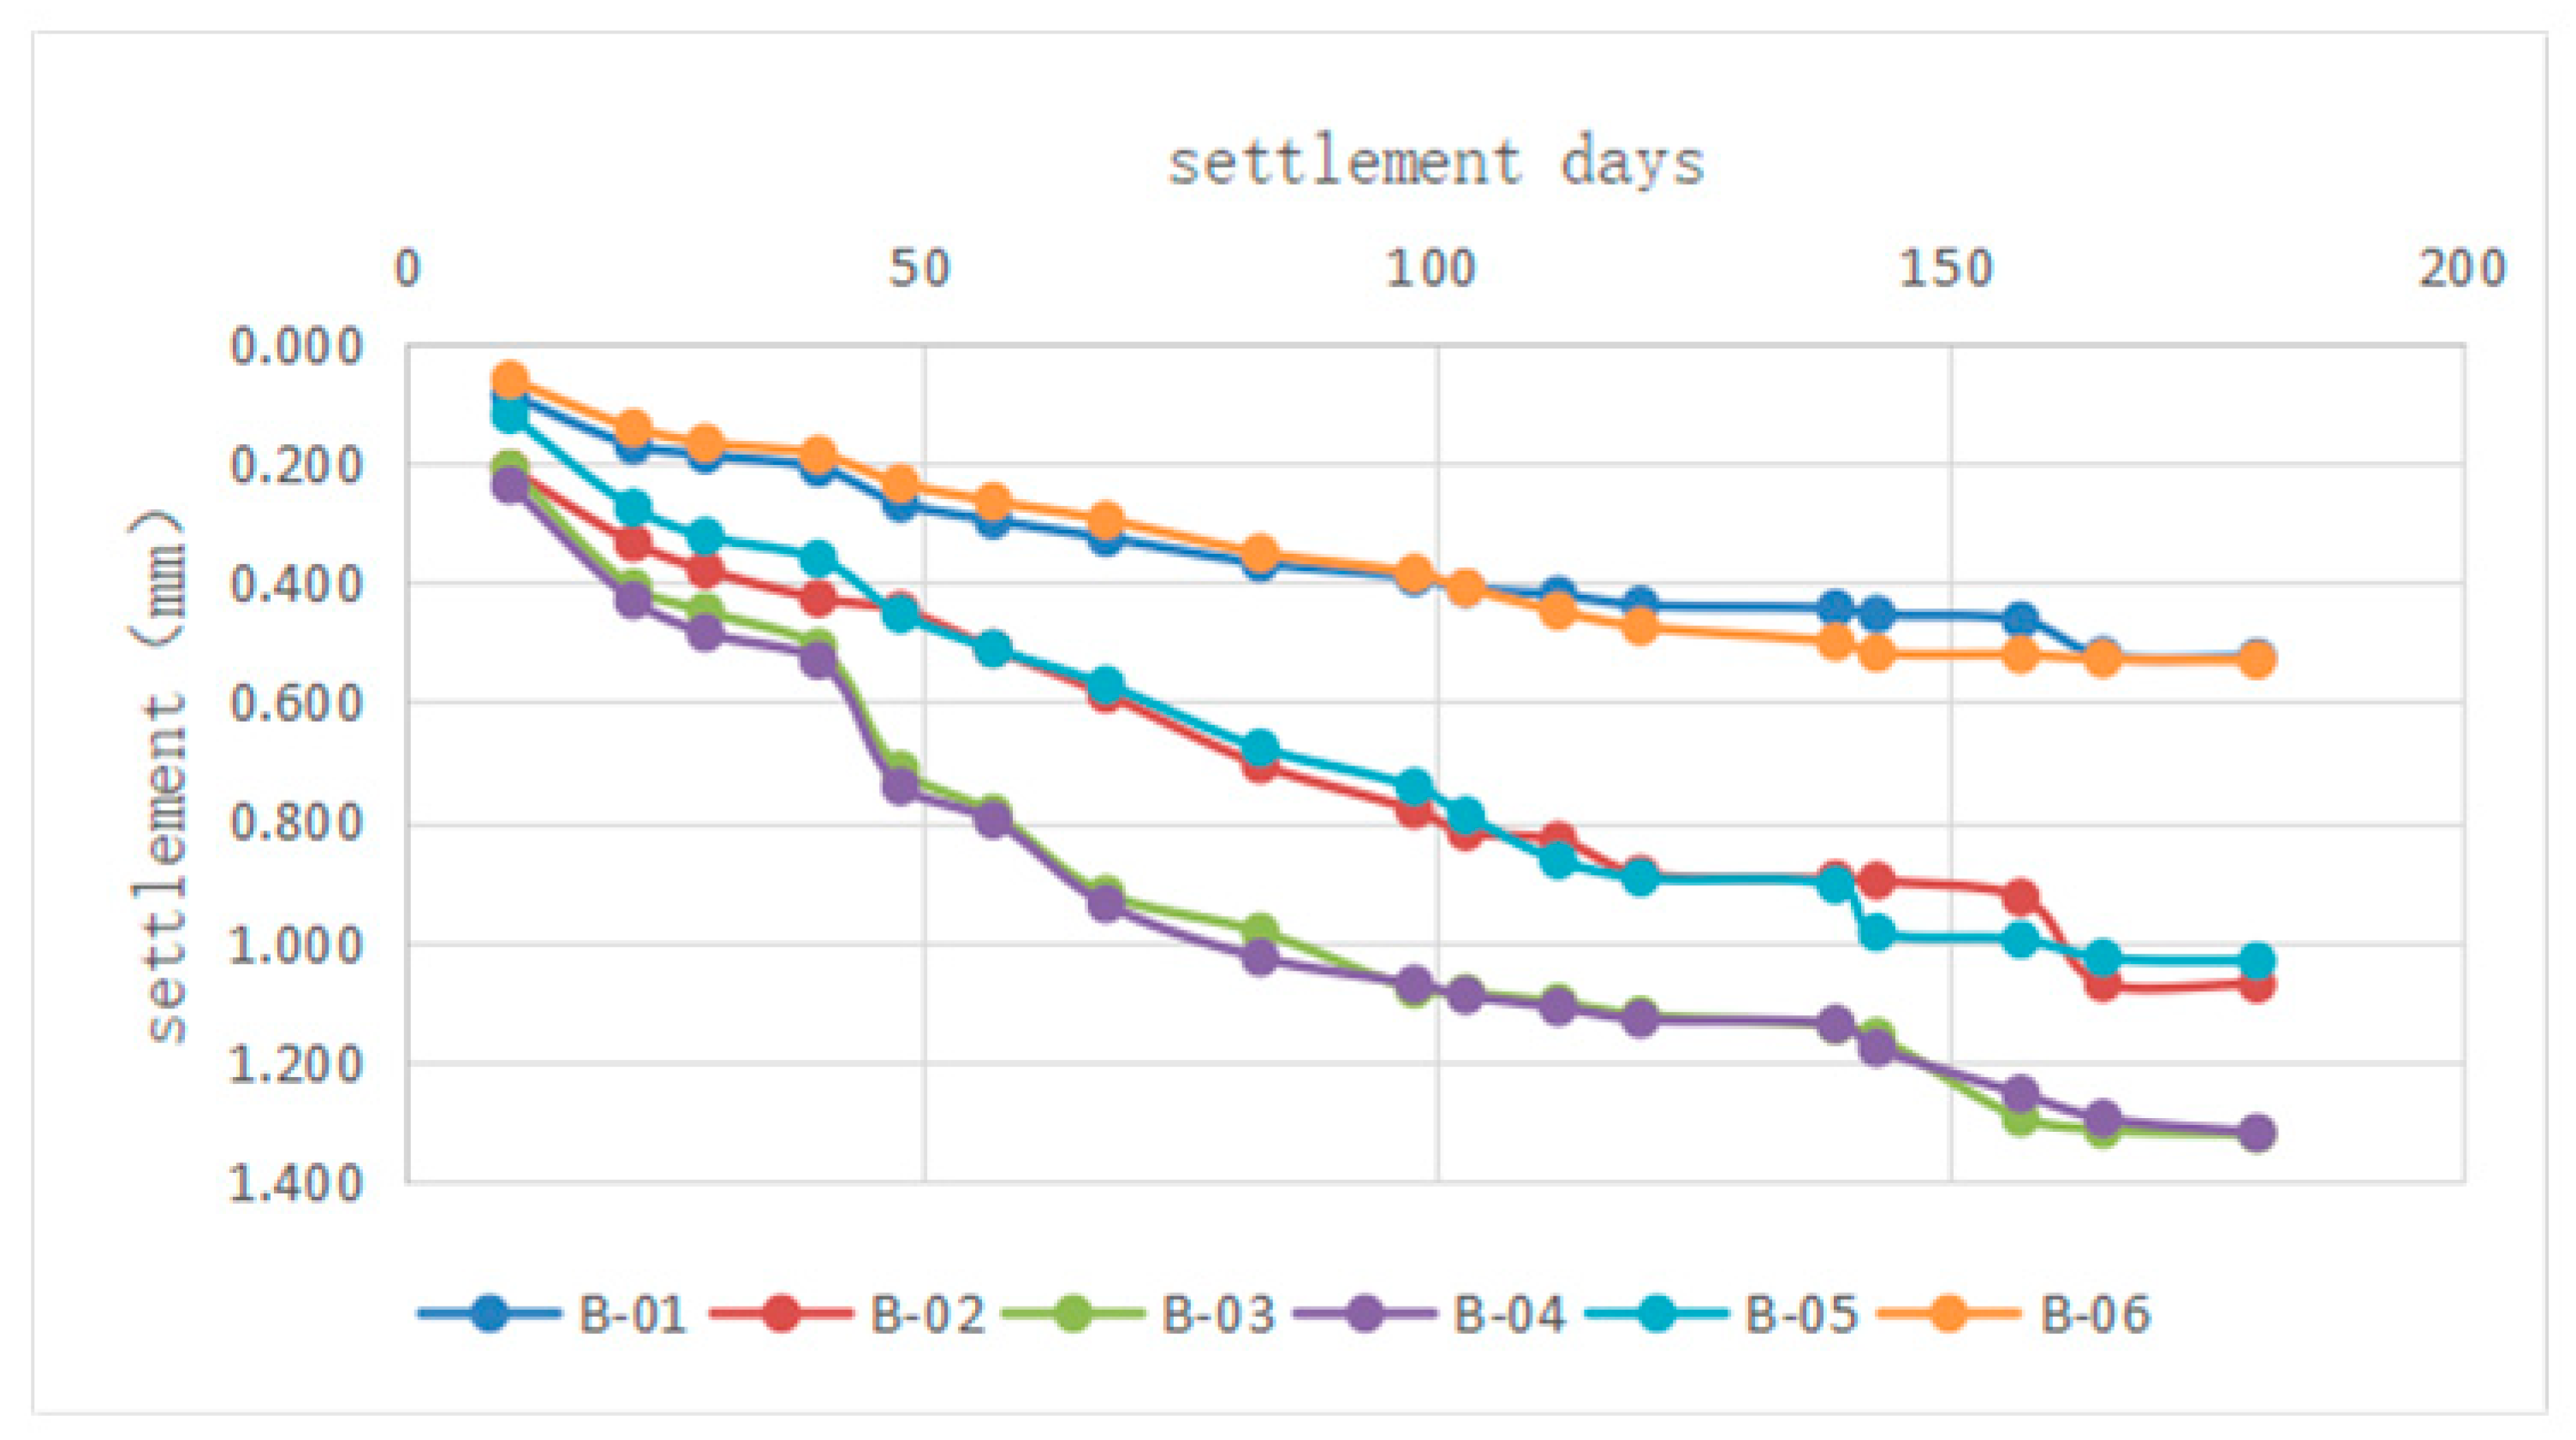
When arranging ground settlement observation points, first of all, a field survey should be carried out along the axis of tunnel excavation, and then the ground settlement observation points should be reasonably arranged according to the survey data. In order to accurately grasp the difference in the deformation of each pavement, a monitoring cross-section should be set up when the measuring points are laid out and controlled. As far as this project is concerned, according to the actual situation of the Jinan Metro Line R2 project since the beginning of 2019, monitor the surface subsidence for half a year. During the construction of the Baochang shield tunnel, six monitoring points were selected in the excavation range of the long-distance bus station and the numbers are B-01, B-02, B03, B-04, B-05, and B-06 from left to right. The distance between each monitoring point is 8 m, and the reliability of the numerical simulation is verified according to the obtained monitoring data. Figure 9 shows the layout of measuring points, and Table 3 shows the surface settlement table. Figure 10 shows the settlement of the monitoring points.
According to the layout position of the monitoring points on the construction site, the same positions are selected in the established three-dimensional numerical model, which is numbered as B-01, B-02, B-03, B-04, B-05, and B-06 in turn, corresponding to the on-site monitoring points. The comparison results are shown in Table 2, Table 3 and Table 4.
From the surface vertical monitoring results in Table 3, it can be seen that the results obtained from six monitoring points, B-01, B-02, B-03, B-04, B-05, and B-06, are all settlement values, the monitoring values of the surface vertical displacement vary from 0~2 mm to 2 mm, and the data of each monitoring point does not change much. In addition, there is no positive vertical displacement of the surface (i.e., surface uplift) in this project.
As can be seen from Figure 10, when monitoring the surface subsidence, the increase in the surface subsidence is large at the beginning and, with the increase in monitoring days, the increase in the surface subsidence is smaller and smaller and finally tends to be stable.
According to the comparison of the two groups of data in Table 4, it can be seen that the on-site monitoring values of ground settlement are generally smaller than those in the numerical simulation process, and the maximum ground settlement values monitored in the construction site are all smaller than those in the numerical simulation process in the same position, which indicates that the corresponding deformation control measures for ground settlement can better restrain the ground settlement.
When monitoring the surface subsidence, accurately record the monitoring results each time until the monitoring results become stable. If the measured data fluctuates greatly, the observation time and frequency should be increased. If the survey area is the entrance and exit of the cave and the area with high requirements, the survey section can be encrypted appropriately. Some protective measures should be taken for the measurement section with high requirements. In order to prevent the observation point from being damaged by external factors, it is generally protected by setting up shallow-buried protection or adding casing under the conditions permitted by the site.

5.2.2. Monitoring of Building Deformation

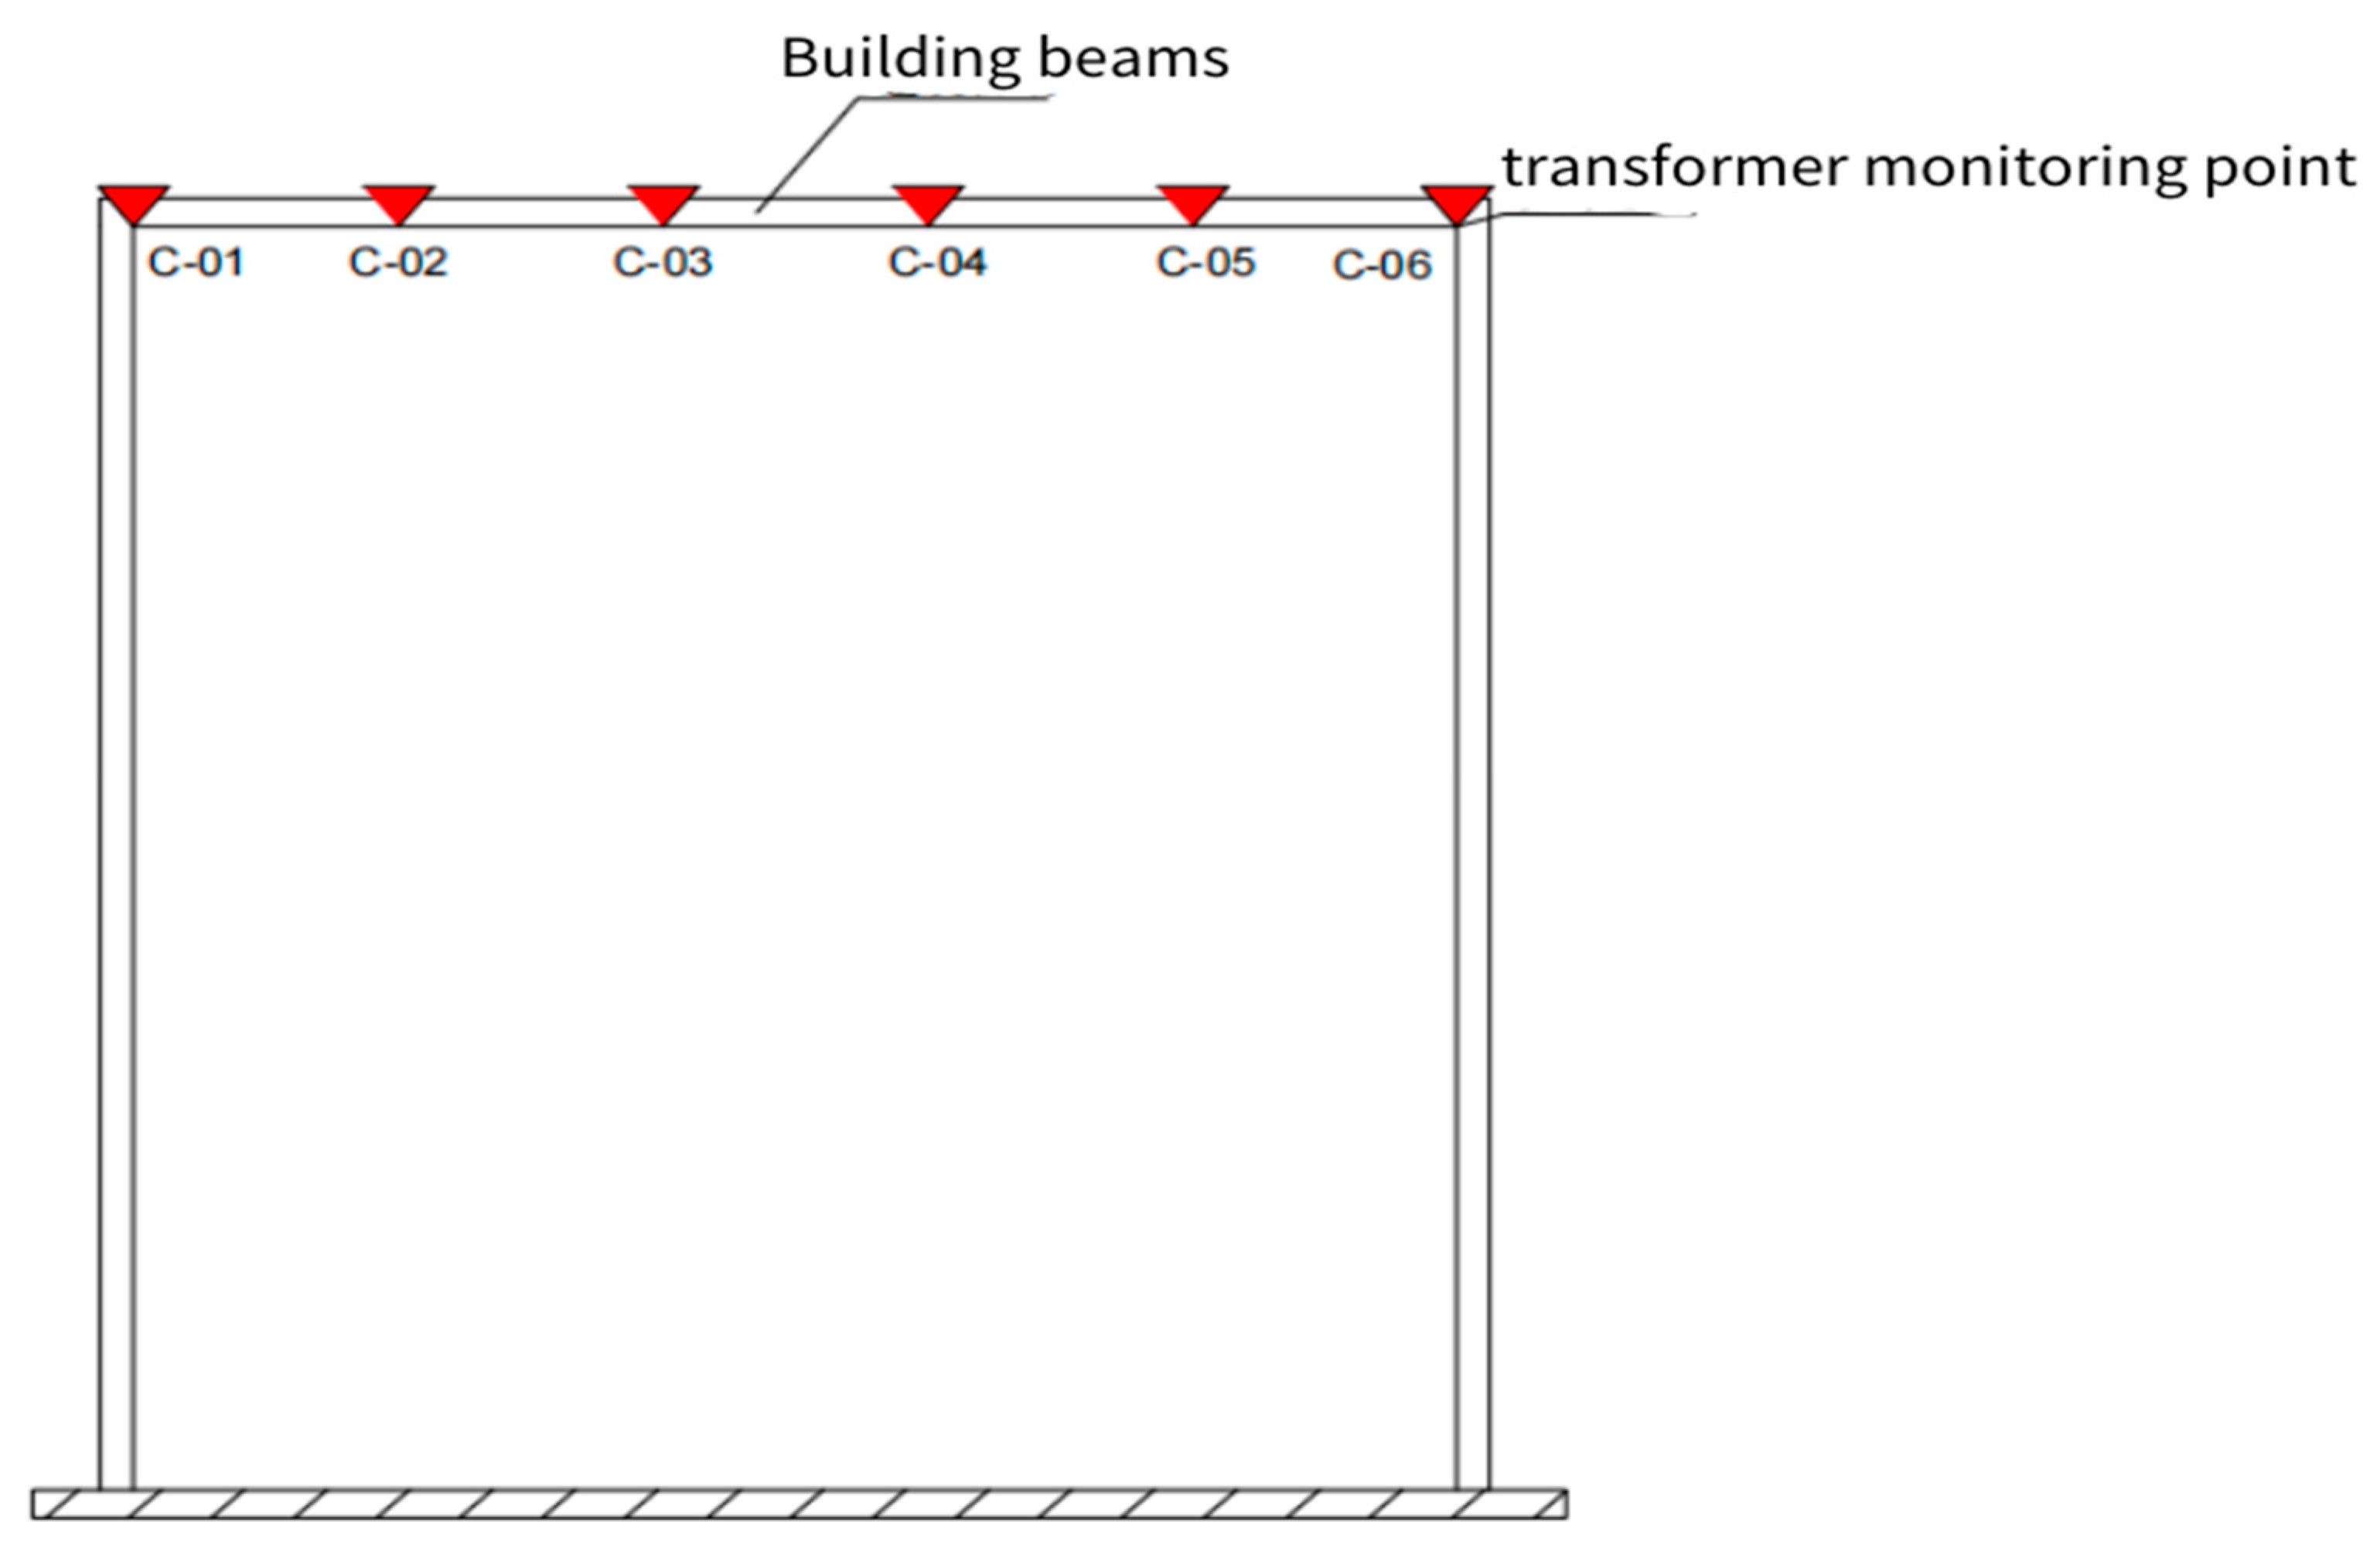
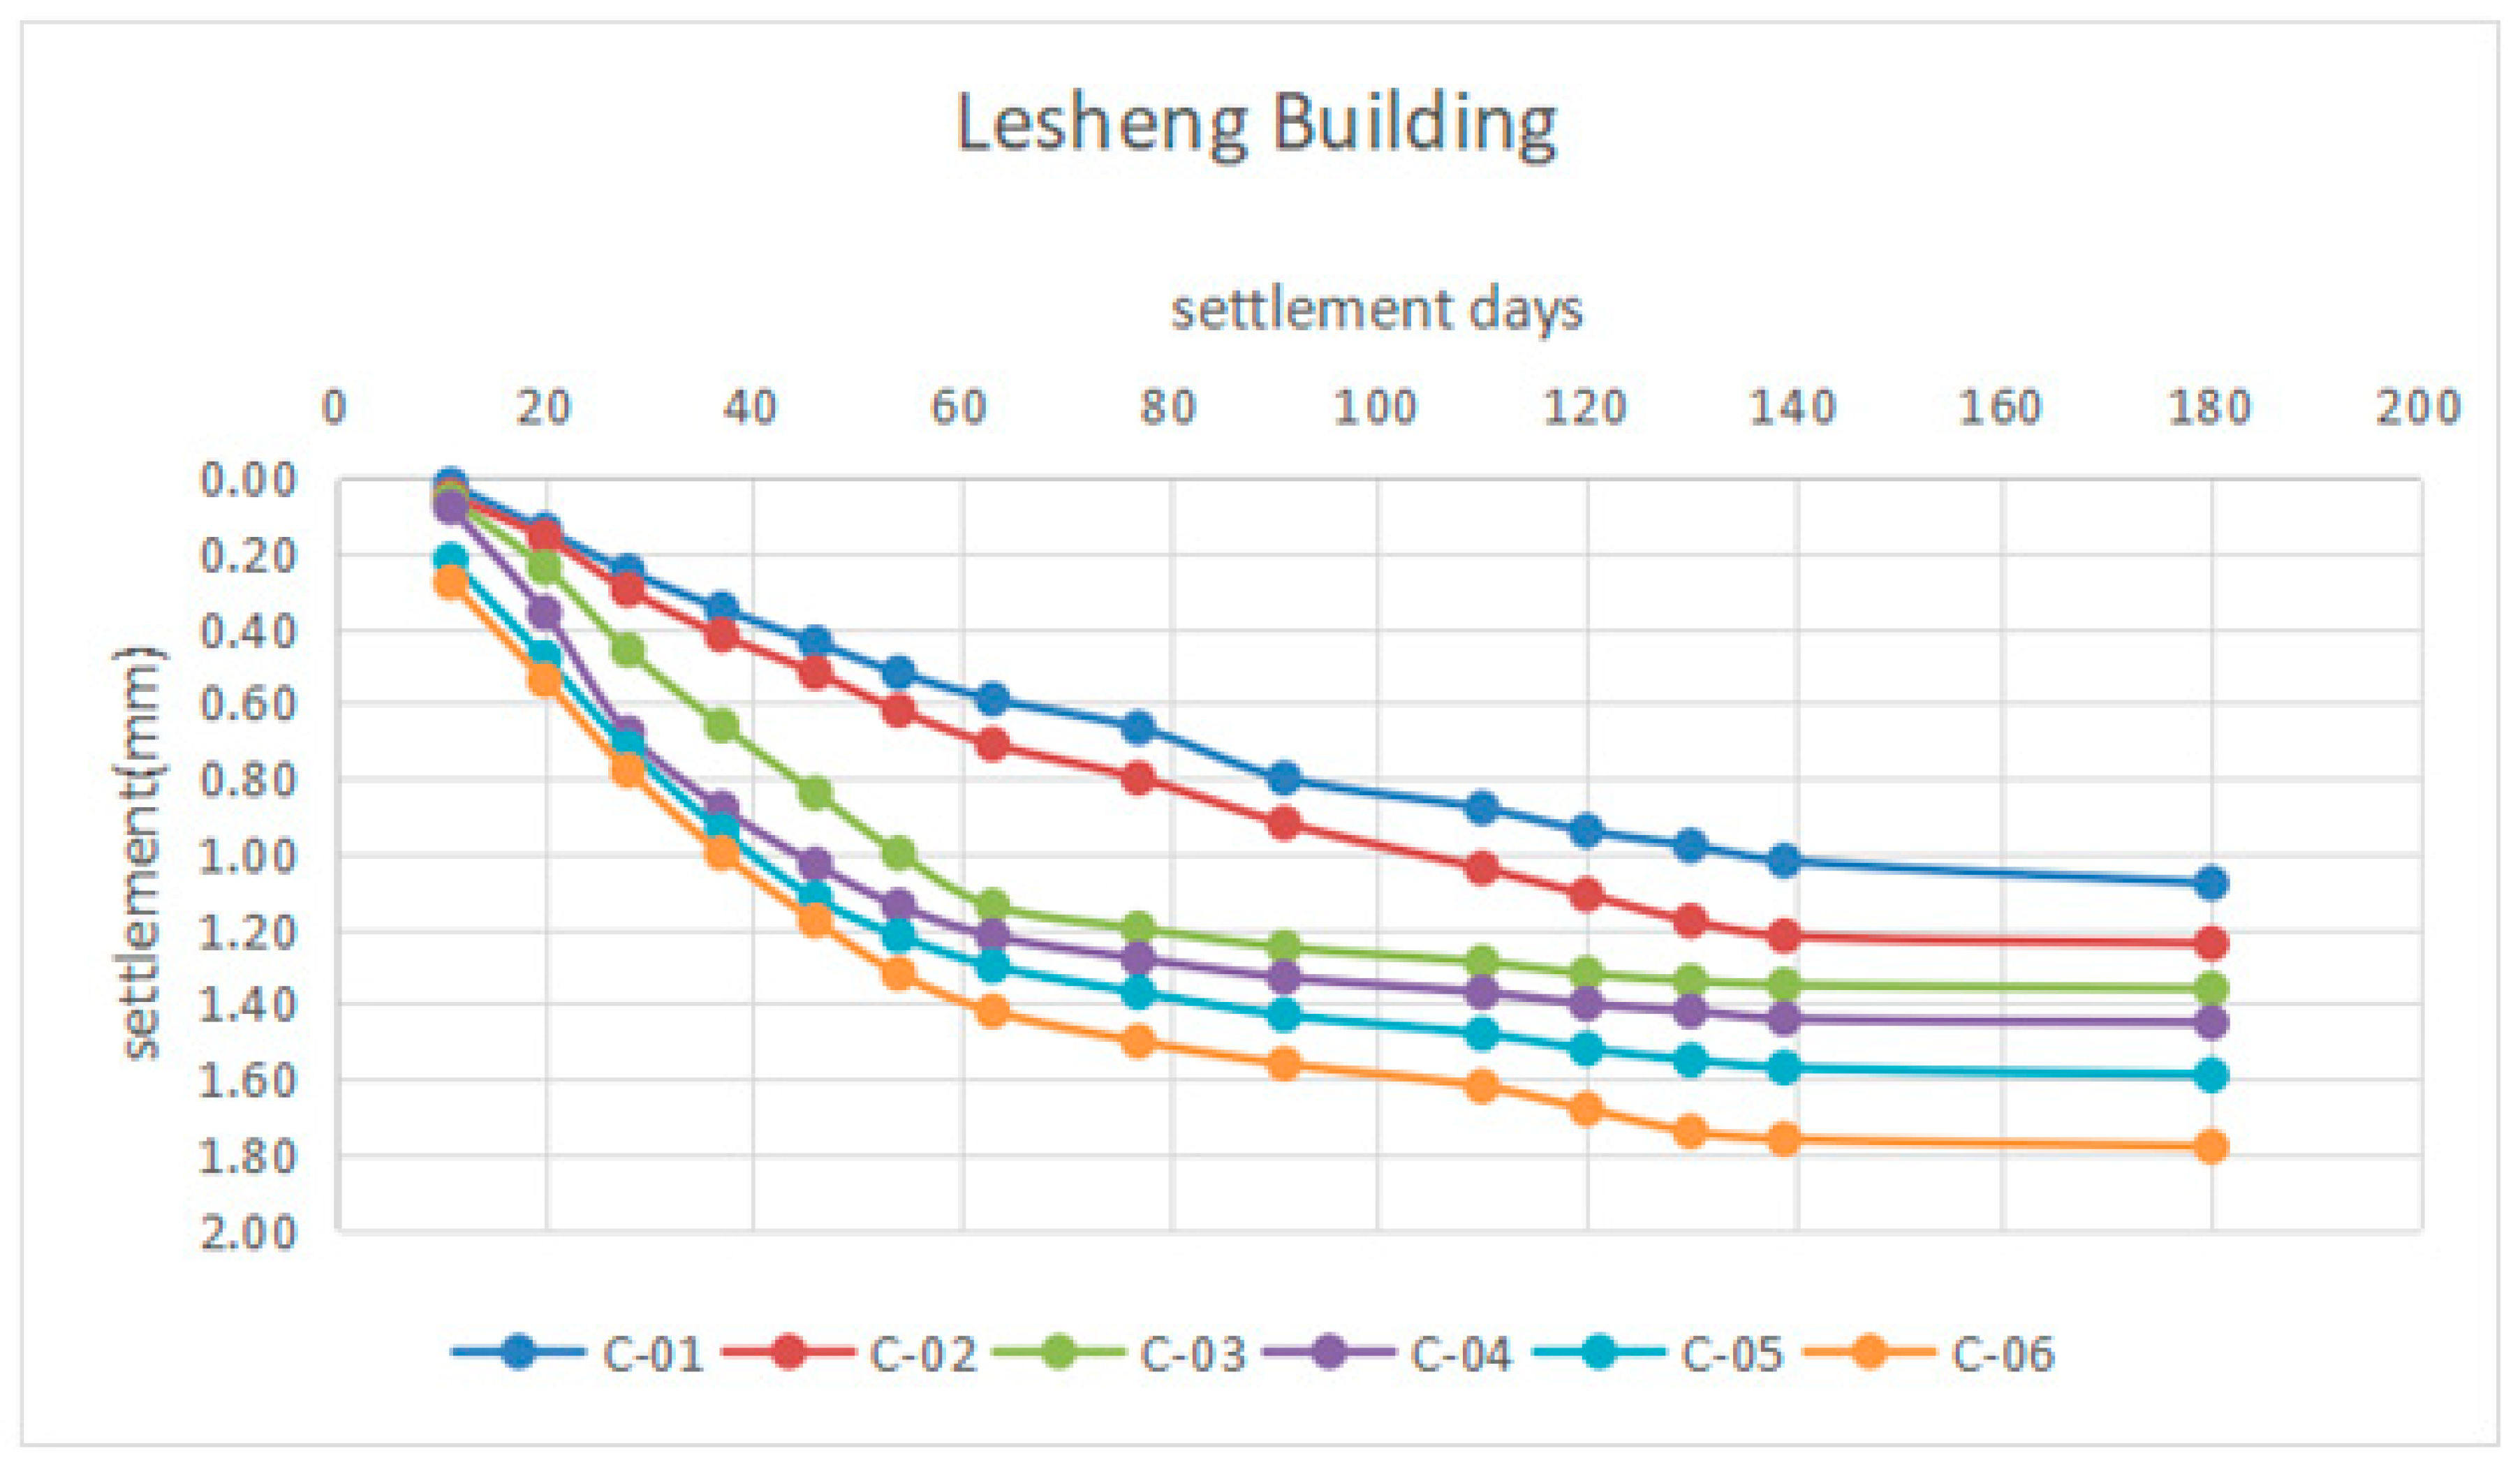
As far as this project is concerned, according to the actual situation of the Jinan Metro Line R2 project, the building deformation monitoring will be carried out for half a year from the beginning of 2019. According to the actual situation and distance of the building, the buildings at the long-distance bus station within the construction scope will be selected, and C-01, C-02, C-03, C-04, C-05, and C-06 will be arranged on the building beams. The distance between the adjacent measuring points is 3.2 m. The measuring points C-01 and C-06 are arranged at both ends of the beam, and the rest of the measuring points are evenly distributed in the middle of the beam. The vertical deformation of the building beam is measured, assuming that the vertical deformation of the building beam is positive along the negative direction of the Z-axis. Figure 11 shows the layout of the measuring points, Table 5 shows the deformation monitoring data of the building beams, and Figure 12 shows the deformation curves of the monitoring points.
Make the building deformation measurement records in the construction section until the measurement results tend to be stable, and make later observations regularly. If the obtained data changes greatly, the measurement times should be increased until the data becomes stable. If the deformation of the building during the tunnel construction exceeds the allowable range, corresponding reinforcement measures should be taken immediately, and the abnormal deformation of the building can be effectively reduced by setting a protective layer, foundation reinforcement, and foundation improvement.
According to the layout position of the deformation monitoring points of the building beams on the construction site, the same positions are selected in the established three-dimensional numerical model, which are numbered C-01, C-02, C-03, C-04, C-05, and C-06 in turn, corresponding to the on-site monitoring points, and the maximum deformation values of them are compared. The comparison results are shown in Table 6.
From the monitoring results of the vertical deformation of the building beams in Table 5, it can be seen that the results obtained by six monitoring points, C-01, C-02, C-03, C-04, C-05, and C-06, are all positive (negative along the Z-axis), the monitoring values of the building beams change between 0 and 0~2 mm, and the data of each monitoring point has little change.
From Figure 12, it can be seen that when monitoring the vertical deformation of the building beams, the increase of deformation is large at first, and, with the increase in monitoring days, the increase in deformation of the building beams becomes smaller and smaller, and finally tends to be stable.
According to the comparison of the two groups of data in Table 6, it can be seen that the monitored values of building beams are generally smaller than the deformation values of beams in the numerical simulation process, and the maximum deformation values of beams monitored on the construction site are all smaller than those in the numerical simulation process in the same position, which indicates that the corresponding control measures for building deformation can better restrain the deformation of buildings.
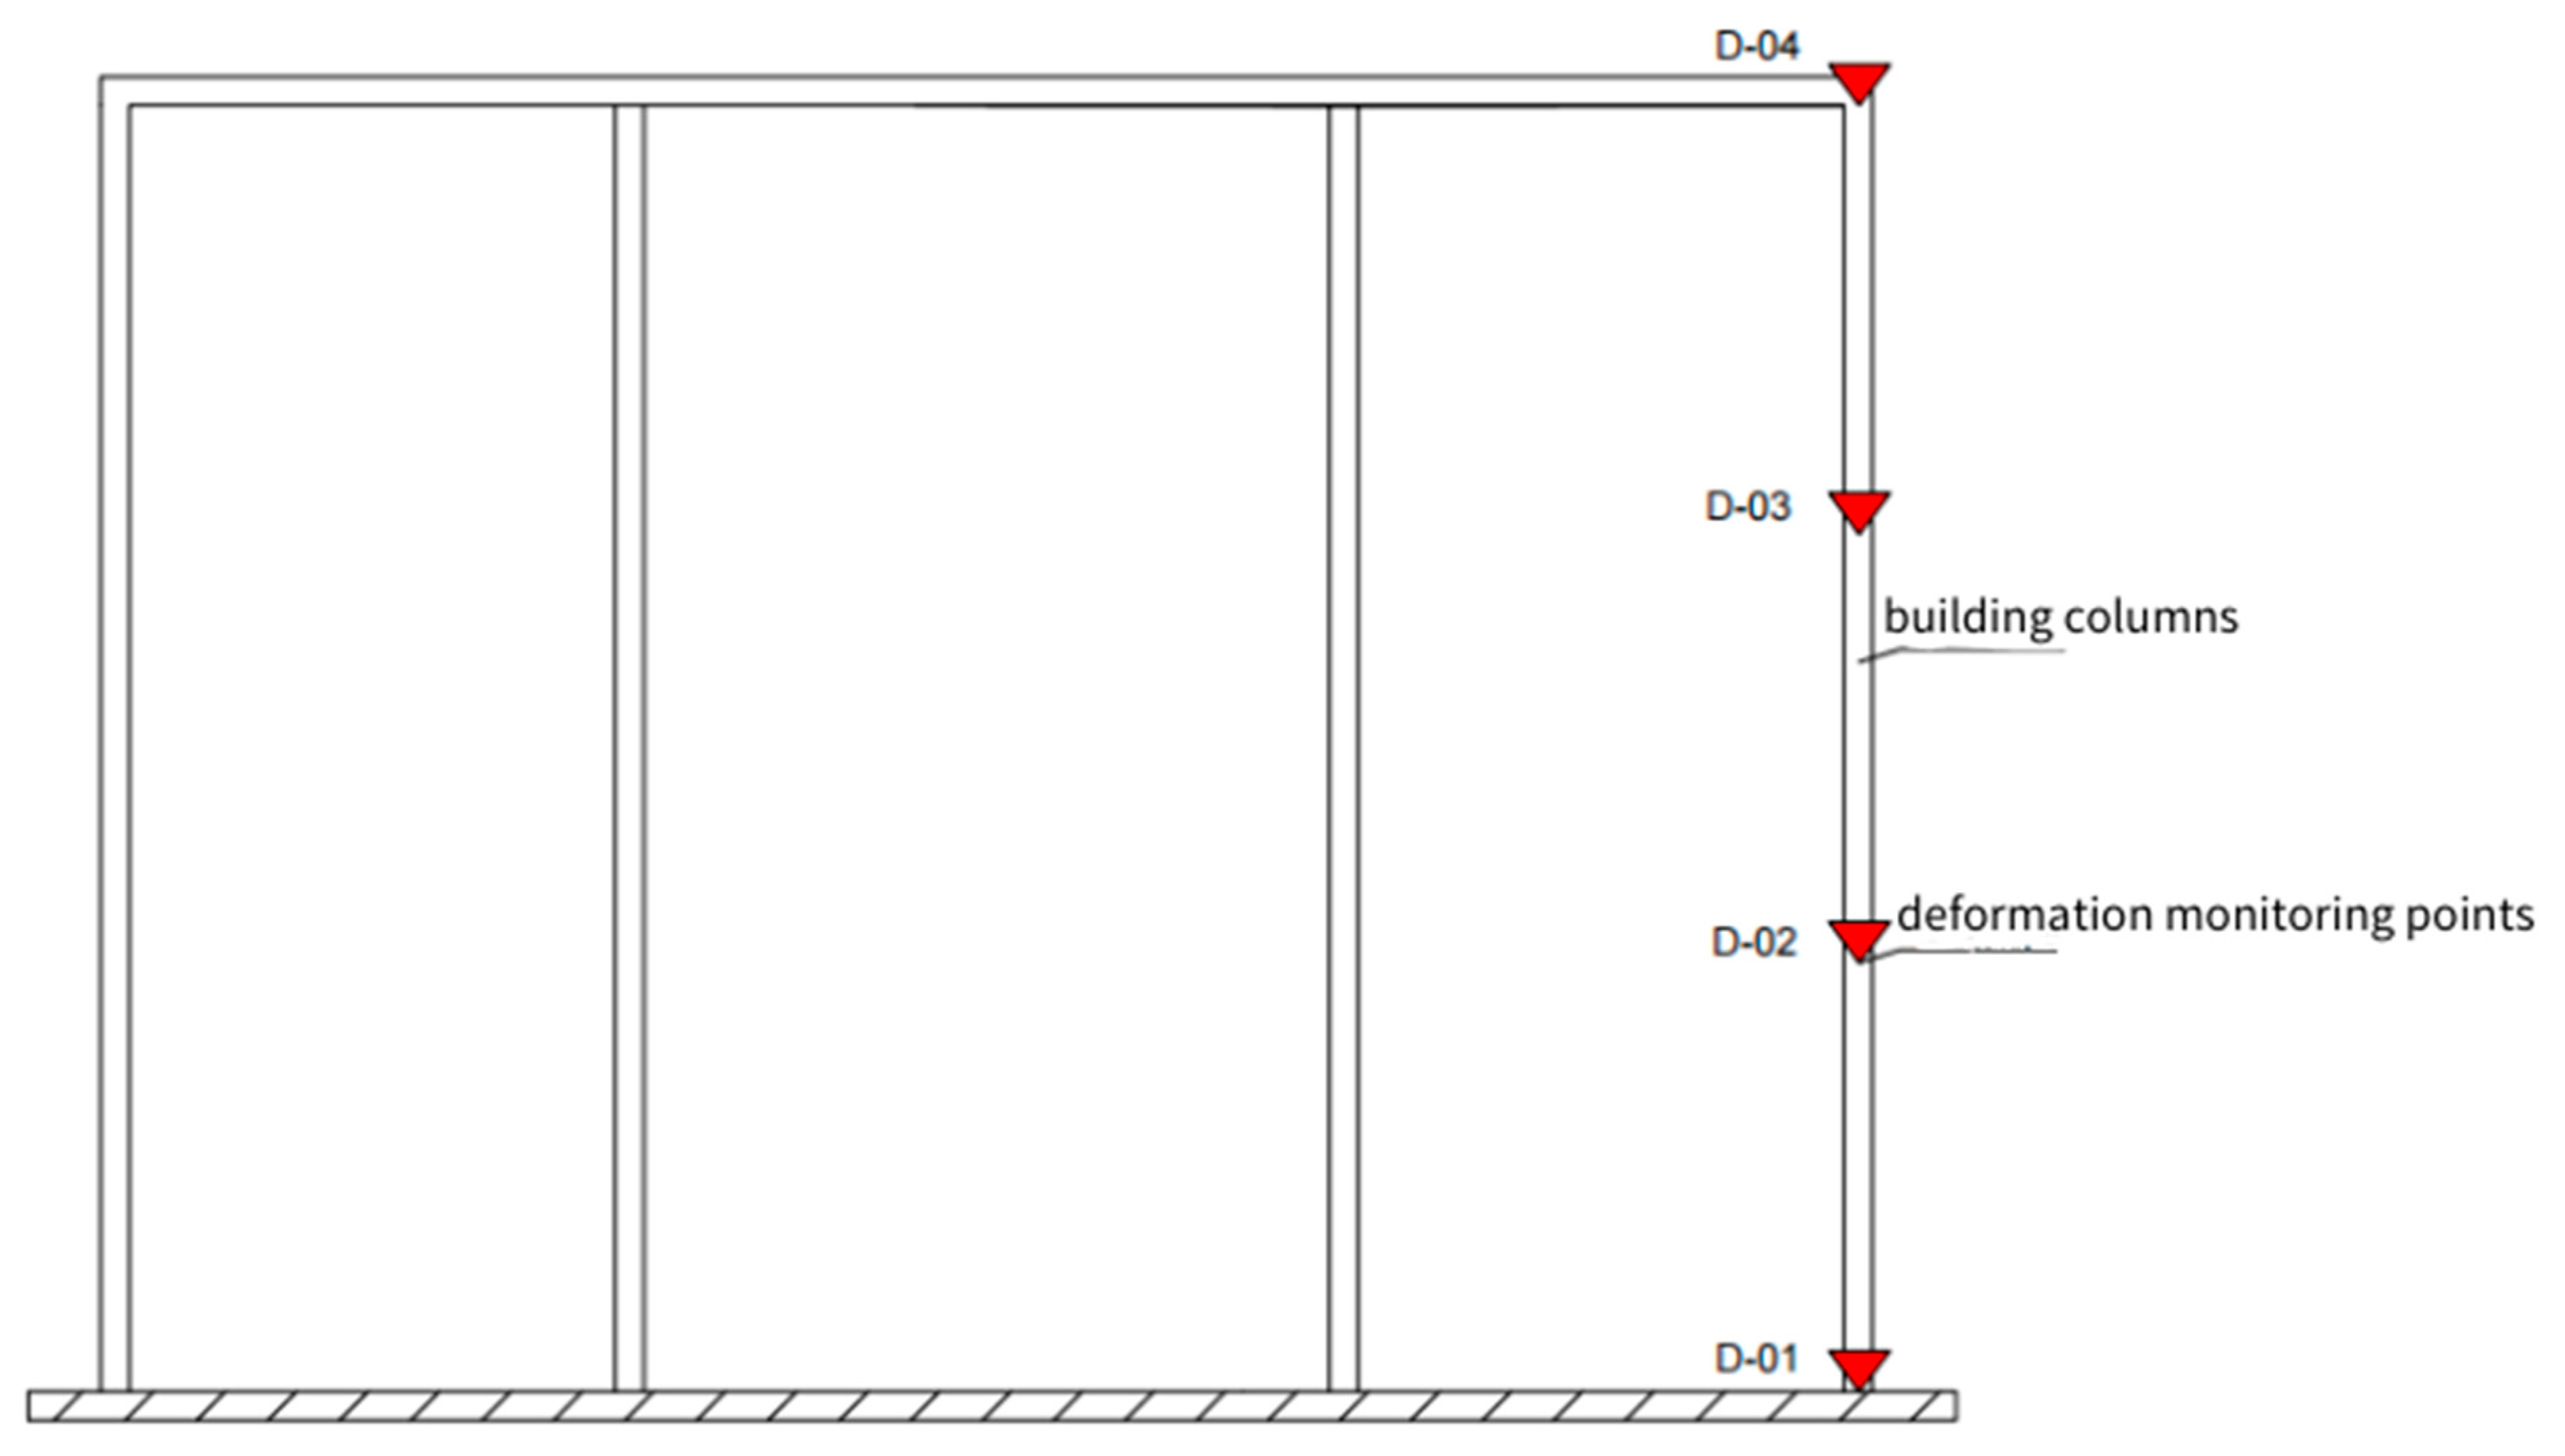
At the same time, four monitoring points, D-01, D-02, D-03, and D-04, are arranged on the column of the building, with the direction from bottom to top, and the distance between adjacent monitoring points is 6 m. The measuring points D-01 and D-04 are arranged at both ends of the column, and the rest of the measuring points are evenly distributed between both ends of the column. The deformation of the column is measured, assuming that the longitudinal deformation of the building column is positive along the tunnel excavation direction (the Y-axis is positive). Figure 13 shows the layout of the measuring points, Table 7 shows the deformation monitoring data of the building columns, and Figure 14 shows the deformation curves of the monitoring points.
According to the layout position of the deformation monitoring points of the building columns on the construction site, the same positions are taken in the established three-dimensional numerical model, and they are numbered D-01, D-02, D-03, and D-04 in turn, corresponding to the on-site monitoring points, and the maximum deformation values of them are compared. The comparison results are shown in Table 8.
From the monitoring results of the longitudinal deformation of the building columns in Table 7, it can be seen that the results obtained by four monitoring points, D-01, D-02, D-03, and D-04, are all positive values (along the excavation direction), the monitoring values of the building columns change between 0 and 0~2 mm, and the data of each monitoring point does not change much.
From Figure 14, it can be seen that when monitoring the longitudinal deformation of the building columns, the increase in deformation is large at first, and, with the increase in monitoring days, the increase in deformation of the building columns becomes smaller and smaller, and finally tends to be stable.
According to the comparison of the two groups of data in Table 8, it can be seen that the monitoring values of the building columns are generally smaller than the column deformation values in the numerical simulation process, and the maximum deformation values of the columns monitored on the construction site are all smaller than those in the numerical simulation process in the same position, which indicates that the corresponding control measures for building deformation can better restrain the deformation of buildings.

6. Conclusions

In this paper, taking the Baochang section of the Jinan Metro Line R2 as the engineering background, in the process of shield construction crossing the abrupt geological interface, three factors, i.e., the dip angle of the geological interface, the distance between the excavated surface, and the geological interface and the excavation footage, were considered, respectively, which affected the surrounding rock deformation, the ground settlement, and the deformation of the buildings. The deformation laws of the surrounding rock and surface buildings during shield construction are summarized. According to the actual engineering situation, the original model is improved, and then the actual engineering situation is predicted and analyzed. The following conclusions are summarized in detail in the process of the numerical simulation of shield construction:
(1) When excavating from hard rock to soft rock and from soft rock to hard rock, surface settlement increases with the increase of excavation footage. The maximum settlement occurs at the longitudinal center of the tunnel, which is 1.66 mm and 4.82 mm. It can be seen that the direction of tunnel excavation has a significant impact on surface deformation. To reduce the impact of tunnel excavation on surface buildings, the excavation direction should prioritize excavation from hard rock to soft rock.
(2) When there are buildings above the tunnel, shield tunneling will have an impact on surface buildings. Taking the excavation of the tunnel from hard rock to soft rock as an example, the maximum deformation values in the vertical and horizontal directions of the buildings are 2.04 mm and 1.92 mm, respectively.
(3) In response to the impact of shield tunneling on building deformation, two control measures, synchronous grouting and correction of shield tunneling posture, were adopted. The comparison between the monitoring results and numerical simulation results shows that the deformation of the surface and buildings is reduced.

7. Recommendations for Future Research

Although this article provides a comprehensive analysis of the effects of different geological interface inclinations, the distance between excavation surfaces and geological interfaces, and excavation footage on tunnel surrounding rock deformation, surface settlement, and building deformation, considering the dynamic nature of the on-site construction process and the impact of uncontrollable factors on the site, the above-analyzed factors cannot quantitatively judge the shield construction process and ignore the influence of some related factors:
(1) In the numerical simulation process of this article, it is assumed that the excavation route of the tunnel is a straight line, without considering the impact of curved shield tunnel construction on the abrupt formation.
(2) According to the geological survey report, the Jinan area belongs to strong water-rich geology, and the water level line in the shield tunnel section is between 1.5 and 4 m underground. Therefore, both the miscellaneous fill soil layer and the clay layer contain groundwater. However, in the analysis process of the shield tunnel in this article, the impact of groundwater on the construction process was not considered.

Author Contributions

Conceptualization, Z.T. and C.Y.; methodology, Z.T. and B.Z.; software, C.Y.; investigation, Q.Z. and Z.W.; data curation, Z.W.; writing—original draft preparation, C.Y.; writing—review and editing, Z.T., C.Y., B.Z., Q.Z. and Z.W.; visualization, Z.W.; supervision, Z.T., B.Z. and Q.Z.; project administration, Z.T. and Z.W. All authors have read and agreed to the published version of the manuscript.

Funding

This research received no external funding.

Data Availability Statement

Not applicable.

Conflicts of Interest

The authors declare no conflict of interest.

References

  1. Song, F.; Zhao, H. Research on key technology of open TBM construction under complex geological conditions of Gaoligongshan tunnel. Tunn. Constr. 2017, 37, 128–133. [Google Scholar]
  2. Zhen, J.; Jia, R. Analysis of railway tunnel construction under complex geological conditions. Jiangxi Build. Mater. 2021, 143–145. [Google Scholar]
  3. Liu, J. Application of shield technology in soft and hard interbedded strata of Nanjing Metro. J. Chang. Inst. Technol. Nat. Sci. Ed. 2020, 21, 14–16. [Google Scholar]
  4. Zhu, W.; Ju, S. Shield Construction Technology in Composite Stratum; China Science and Technology Press: Beijing, China, 2006. [Google Scholar]
  5. Xiao, G.; Wang, D. Settlement analysis and prevention measures of shield construction on upper soft and lower hard strata. Guangdong Civ. Eng. Archit. 2019, 26, 43–47. [Google Scholar]
  6. Chen, W. Elastic-Plastic Analysis of Tunnel Excavation Face Approaching Different Geological Interfaces; National Taiwan Province University of Science and Technology: Taiwan, China, 2004. [Google Scholar]
  7. Wang, Z. Study on the Loosening Characteristics and the Calculation Method of the Loosening Pressure of Underground Caverns in Jointed Rock Mass with Soft Upper and Hard Lower; Beijing Jiaotong University: Beijing, China, 2015. [Google Scholar]
  8. Xiong, L.; Yang, L. Analysis of displacement characteristics of surrounding rock and its influencing factors when the tunnel excavation face is close to the geological interface. China Railw. Sci. 2009, 30, 61–68. [Google Scholar]
  9. Chen, Q. Study on the Support Pressure of Shield Tunnel Excavation Face in Upper Soft and Lower Hard Stratum; Huazhong University of Science and Technology: Wuhan, China, 2010. [Google Scholar]
  10. Liu, G. Application and process improvement of EPB shield in complex geology. Archit. Constr. 2016, 38, 218–220. [Google Scholar]
  11. Liu, D. Impact and Control Measures of Shield Construction on Adjacent Buildings in Rich Water and Soft Soil Areas. Constr. Technol. Chin. Engl. 2022, 51, 127–130. [Google Scholar]
  12. Zou, J.; Zhao, Y.; Li, J.; Gan, P.; Yan, Z.; Liu, W. Model test study on the stability of excavation face of shallow clay tunnel. J. Xi’an Univ. Archit. Technol. Nat. Sci. Ed. 2017, 49, 478–484. [Google Scholar]
  13. Liu, C.; Zeng, Y.; Zhu, Z.; Li, B. Study on the ground settlement caused by shield construction in upper soft stratum and lower hard stratum in xiamen metro. J. Railw. Sci. Eng. 2018, 15, 444–449. [Google Scholar]
  14. Hesami, S.; Ahmadi, S.; Taghavi Ghalesari, A.; Hasanzadeh, A. Ground surface settlement prediction in urban areas due to tunnel excavation by the NATM. Electron. J. Geotech. Eng. EJGE 2013, 18, 1961–1972. [Google Scholar]
  15. Sun, X.; Miao, L.; Lin, H. Numerical simulation of the stability of excavation face of shield tunnel with different buried depth. J. Southeast Univ. Nat. Sci. Ed. 2017, 47, 164–169. [Google Scholar]
  16. Wang, X.; Li, S.; Wei, Y.; Zhang, Y. Analysis of Surface Deformation and Settlement Characteristics Caused by Tunnel Excavation and Unloading. Geofluids 2022, 2022, 5383257. [Google Scholar] [CrossRef]
  17. Tang, X.; Li, J.; Zou, J.; Zhao, Y.; Gan, P.; Liu, W.; Pan, C. Model test of instability development process of shallow shield tunnel excavation face. J. Zhejiang Univ. Eng. Ed. 2017, 51, 863–869. [Google Scholar]
  18. Chen, R.; Yin, X.; Tang, L. Centrifugal test study on instability of excavation face considering seepage. Geotech. Mech. 2015, 36, 225–229. [Google Scholar]
  19. Li, J.; Liu, W.; Zou, J.; Zhao, Y.; Gong, X. Large-scale model test study on instability of excavation face of shallow shield tunnel. J. Geotech. Eng. 2018, 40, 562–567. [Google Scholar]
  20. Li, C.; Wang, F.; Zhang, L.; Wang, J. Study on mechanical behavior of subway shield tunnel under complex conditions. J. Railw. 2016, 38, 103–109. [Google Scholar]
  21. Shi, C.; Cao, C.; Lei, M. An analysis of the ground deformation caused by shield tunnel construction combining an elastic half-space model and stochastic medium theory. KSCE J. Civ. Eng. 2017, 21, 1933–1944. [Google Scholar] [CrossRef]
  22. Xu, R.; Guo, Z.; Ding, P.; Chen, W.; Li, J.; Zhu, H.; Zhang, B. Summary of Research on the Impact of Shield Construction Vibration on Adjacent Buildings and Control Methods. Tunn. Constr. Chin. Engl. 2021, 41, 14–21. [Google Scholar]
  23. Pan, T. The Impact of Shield Tunnel Construction on Surrounding Surface and Building Settlement in Soft Soil Regions. Hydrogeol. Eng. Geol. 2022, 49, 101–108. [Google Scholar] [CrossRef]
  24. Zhang, Y.; Wang, D.; Zhang, Z.; Wang, X.; Li, C.; Zhang, X.; Chen, Y.; Lv, Y. Study on the Impact of Shield Tunnel Construction on Ground Structures in Tianjin Coastal Soft Soil Site. Constr. Technol. Chin. Engl. 2022, 51, 11–16. [Google Scholar]
  25. Xiong, J. Research on the Application of HS and HSS Models in Foundation Pit Calculation by Back Analysis Method. Shanxi Archit. 2011, 37, 34–35. [Google Scholar] [CrossRef]
  26. Hoeke, E.; Brown, E.T. Practical Estimates of Rock Mass Strength. Int. J. Rock Mech. Min. Sci. 1997, 34, 1165–1186. [Google Scholar] [CrossRef]
Figure 1. The model grid division: (a) schematic diagram of the building; (b) overall grid division diagram of the model.
Applsci 13 11155 g001
Figure 2. The cloud map of surface vertical displacement: (a) vertical elevation view of vertical displacement of the surface; (b) front elevation view of vertical displacement of the surface.
Applsci 13 11155 g002
Figure 3. The surface subsidence curve: (a) surface edge settlement curve; (b) surface center settlement curve.
Applsci 13 11155 g003
Figure 4. The cloud map of surface vertical displacement: (a) vertical displacement elevation of the surface; (b) front view of vertical displacement of the surface.
Applsci 13 11155 g004aApplsci 13 11155 g004b
Figure 5. The surface subsidence curve: (a) surface edge settlement curve; (b) surface center settlement curve.
Applsci 13 11155 g005
Figure 6. Cloud map of vertical displacement of buildings.
Applsci 13 11155 g006
Figure 7. The cloud map of displacement of buildings: (a) cloud map of longitudinal displacement of buildings; (b) cloud map of the total displacement of buildings.
Applsci 13 11155 g007
Figure 8. The displacement curve of the building beams and columns: (a) vertical displacement curve of the building beam; (b) vertical displacement curve of the building column.
Applsci 13 11155 g008
Figure 9. Layout of surface survey points.
Applsci 13 11155 g009
Figure 10. Monitoring chart of surface subsidence.
Applsci 13 11155 g010
Figure 11. Layout of measuring points of building beams.
Applsci 13 11155 g011
Figure 12. Monitoring diagram of building beam deformation.
Applsci 13 11155 g012
Figure 13. Layout of measuring points of building columns.
Applsci 13 11155 g013
Figure 14. Monitoring diagram of building column deformation.
Applsci 13 11155 g014
Table 1. Physical and mechanical parameters of formation.
Geologic ParameterFirst Layer:
Miscellaneous Fill
Second Layer:
Silty Clay
Hard RockSoft Rock
Unit weight/(kN/m3)19.120.52522
Uniaxial compressive strength/MPa1.6636015
Deformation modulus/GPa1.542.11137
Poisson’s ratio0.30.30.250.3
Cohesive force/kPa45561400600
Angle of internal friction/(°)16205030
Table 2. Mechanical parameters of shield segment.
Density (kg/m3)Material ModelModulus of
Elasticity (GPa)
Poisson’s
Ratio
Bulk Density (kN/m3)The Bulk
Modulus (GPa)
Shear Modulus (GPa)
2400The elastic380.22515.1212.65
Table 3. Surface subsidence monitoring table.
Monitoring the Number of DaysSurface Monitoring Point Settlement Value/mm
B-01B-02B-03B-04B-05B-06
100.090 0.213 0.213 0.240 0.123 0.064
220.174 0.336 0.411 0.432 0.278 0.144
290.189 0.381 0.450 0.486 0.325 0.169
400.211 0.428 0.510 0.532 0.363 0.189
480.270 0.448 0.714 0.742 0.455 0.237
570.298 0.512 0.786 0.798 0.513 0.267
680.328 0.588 0.921 0.938 0.573 0.298
830.370 0.706 0.984 1.027 0.678 0.352
980.393 0.781 1.080 1.071 0.743 0.386
1030.412 0.818 1.086 1.090 0.790 0.411
1120.423 0.832 1.102 1.110 0.865 0.450
1200.440 0.888 1.123 1.130 0.894 0.476
1390.445 0.897 1.140 1.138 0.906 0.501
1430.455 0.899 1.159 1.178 0.985 0.520
1570.465 0.927 1.294 1.254 0.997 0.522
1650.524 1.070 1.314 1.295 1.028 0.530
1800.527 1.071 1.321 1.319 1.033 0.532
Table 4. Comparison between field monitoring and numerical simulation.
The DotField MonitoringThe Numerical Simulation
The Biggest
Uplift/mm
The Largest
Settlement/mm
The Biggest
Uplift/mm
The Largest
Settlement/mm
B-0100.5300.85
B-0201.0701.16
B-0301.3201.62
B-0401.3301.61
B-0501.0301.14
B-0600.5400.87
Table 5. Building beam deformation monitoring table.
Number of DaysDeformation Value of Building Beam/mm
C-01C-02C-03C-04C-05C-06
110.02 0.05 0.06 0.08 0.22 0.28
200.14 0.16 0.24 0.36 0.48 0.54
280.25 0.30 0.46 0.68 0.72 0.78
370.35 0.42 0.66 0.88 0.94 1.00
460.44 0.52 0.84 1.03 1.12 1.18
540.52 0.62 1.00 1.14 1.22 1.32
630.59 0.71 1.14 1.22 1.30 1.42
770.67 0.80 1.20 1.28 1.37 1.50
910.80 0.92 1.25 1.33 1.43 1.56
1100.88 1.04 1.29 1.37 1.48 1.62
1200.94 1.11 1.32 1.40 1.52 1.68
1300.98 1.18 1.34 1.42 1.55 1.74
1391.02 1.22 1.35 1.44 1.57 1.76
1801.08 1.24 1.36 1.45 1.59 1.78
Table 6. Comparison between field monitoring and numerical simulation.
The DotField MonitoringThe Numerical Simulation
The Maximal Displacement/mmThe Maximal Displacement/mm
C-011.081.22
C-021.241.36
C-031.361.51
C-041.451.73
C-051.591.88
C-061.782.02
Table 7. Monitoring table for deformation of building columns.
Number of DaysDeformation Value of Building Column/mm
D-01D-02D-03D-04
110.080.150.220.29
200.150.280.410.54
280.210.390.570.75
370.260.480.700.84
460.300.550.800.96
540.340.580.821.02
630.370.600.831.03
770.390.620.851.07
910.410.640.871.09
1100.430.660.891.11
1200.450.670.891.11
1300.470.680.891.12
1390.490.700.901.12
1800.530.720.921.14
Table 8. Comparison between field monitoring and numerical simulation.
The DotField MonitoringThe Numerical Simulation
The Biggest Deformation/mmThe Biggest Deformation/mm
D-010.530.64
D-020.721.04
D-030.911.17
D-041.141.28
Disclaimer/Publisher’s Note: The statements, opinions and data contained in all publications are solely those of the individual author(s) and contributor(s) and not of MDPI and/or the editor(s). MDPI and/or the editor(s) disclaim responsibility for any injury to people or property resulting from any ideas, methods, instructions or products referred to in the content.