Article

A New Multi-Physics Coupled Method for the Temperature Field of Dry Clutch Assembly

School of Mechanical & Electrical Engineering, Guilin University of Electronic Technology, Guilin 541004, China
*
Author to whom correspondence should be addressed.
Appl. Sci. 2023, 13(20), 11165; https://doi.org/10.3390/app132011165
Submission received: 30 August 2023 / Revised: 7 October 2023 / Accepted: 8 October 2023 / Published: 11 October 2023

Abstract

:
The temperature field of the clutch assembly is critical for the clutch design and operation life. Current modeling methods of the temperature of the clutch assembly suffer from insufficient accuracy or a limited time scale for the complicated multi-physics coupling between the contact force, friction-generated heat, heat transfer, and thermal deformation in the clutch assembly in harsh operation conditions. In order to improve the accuracy of temperature field simulation and achieve long-term time scale, a new approach to modeling the temperature is proposed based on CFD simulation and decoupling technology. Firstly, the flow-thermal bi-directional coupling method is employed to determine the convective boundary conditions between the clutch assembly and the ambient air, improving the model’s accuracy. Secondly, the thermal-solid decoupling method is then used to reduce the computational time. The temperature of the clutch assembly during the continuous engagement and disengagement process is performed using this approach and verified by the rig test. The results demonstrate that the temperature of the outer, middle, and inner diameters of the pressure plate by the model agrees well with that by the rig test. For the first engagement and disengagement processes, the proportion of simulated temperature deviations exceeding 5 °C from the measured data is only 3.03%. For the last engagement and disengagement process, while the maximum temperature of the clutch is above 350 °C, the maximum temperature deviation between simulation and measurement is 4.99%. It proves that the approach proposed for modeling the dry clutch assembly temperature field has high accuracy while achieving long-term time-scale simulation.

1. Introduction

Heavy-duty commercial vehicles undergo harsh operating conditions, such as high engagement frequencies, high temperatures, and high energy. Under harsh conditions, clutch slippage, burning, initial judder, and incomplete disengagement issues arise [1,2,3,4], which reduce the dry clutch’s torque transmission capacity and lifespan. Under the harsh conditions, a significant amount of heat is generated due to the frequent sliding friction between the friction pairs of the dry clutch. Moreover, the thermal deformation is greatly increased at high temperatures, which results in more friction heat being generated. Consequently, the sliding friction, friction-generated heat, thermal deformation, and uneven contact of the dry clutch assembly are tightly coupled [5,6]. Since the coupling mechanism and the temperature field of the clutch are crucial for clutch design and reliability analysis, a large amount of research has paid attention to the temperature field of the clutch. Abdullah et al. [7] used the thermo-mechanical coupling method to analyze the radial temperature distribution of the friction surface of the pressure plate under different slipping speeds. Also, Abdullah et al. [8] performed the thermal analysis on the flywheel and clutch disc and pointed out that the deformation of the pressure plate approximately increases along the radial direction. Pisaturo M et al. [9] analyzed and discussed the friction behavior of friction discs at temperatures above 250 °C to 300 °C under three typical starting conditions. They found that factors such as contact pressure, rotational speed, and the initial temperature of the clutch affect the temperature distribution, and at high temperatures, the surface temperature distribution of the friction material is non-uniform, exhibiting hot spots. Regarding non-uniform heat distribution, Ovchinnikov et al. [10] found that the surface temperature distribution of the friction discs is non-uniform, and the thermal conductivity has a significant impact on temperature distribution. The operating conditions of the clutch and the thermal properties of the materials also influence the temperature distribution in the friction discs. Ding et al. [11] investigated temperature distribution issues in continuously variable transmission clutches and found that the central temperature distribution of the clutch is sensitive to changes in parameters such as pressure, contact time, thermal conductivity, and heat capacity. Meng et al. [12], through the exploration of temperature field distribution patterns under different clutch operating conditions, discovered that the convective heat transfer coefficients and thermal conductivity of the friction discs have a significant impact on the clutch temperature field.
Previous research shows that although the temperature fields of the clutch pressure plate and driven plate have been studied in depth, the temperature field of the clutch assembly has not been studied comprehensively, mainly due to the complexity involved. In the meantime, most studies only investigate the temperature field for a relatively short time range of several seconds. In fact, this bidirectional coupling in the clutch assembly often lasts more than 30 s in some extreme conditions. The temperature distribution of the clutch assembly under the long-term scale time range remains unclear enough, either. An effective approach to studying the coupling field of the clutch assembly over a long-term time scale is needed for clutch performance design under harsh conditions.
In this study, a new approach with high precision and a long time scale for modeling the temperature field of the dry clutch assembly is proposed. The temperature distribution of the Φ430 dry clutch assembly under continuous engagement and disengagement operation conditions is conducted using this approach, and the model accuracy is validated by the rig test.

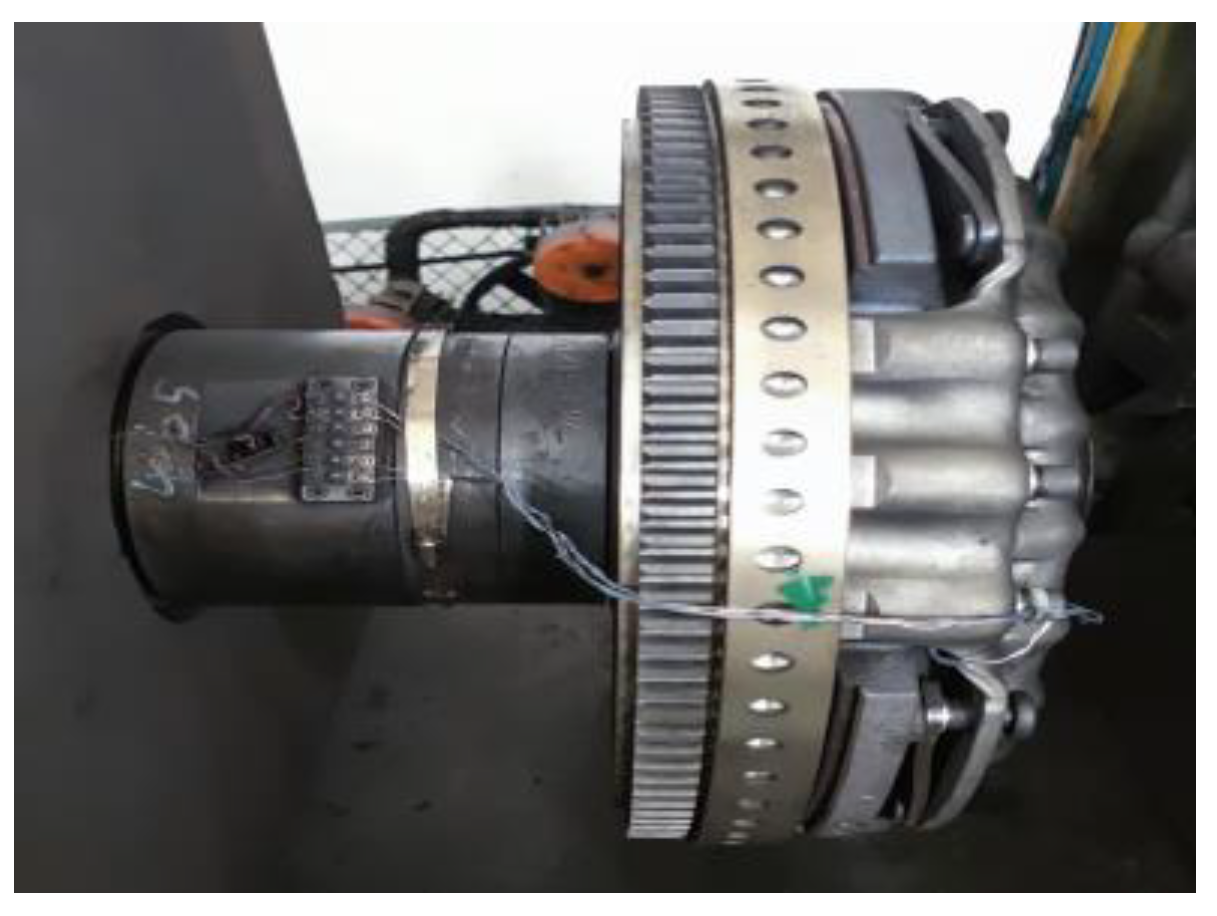
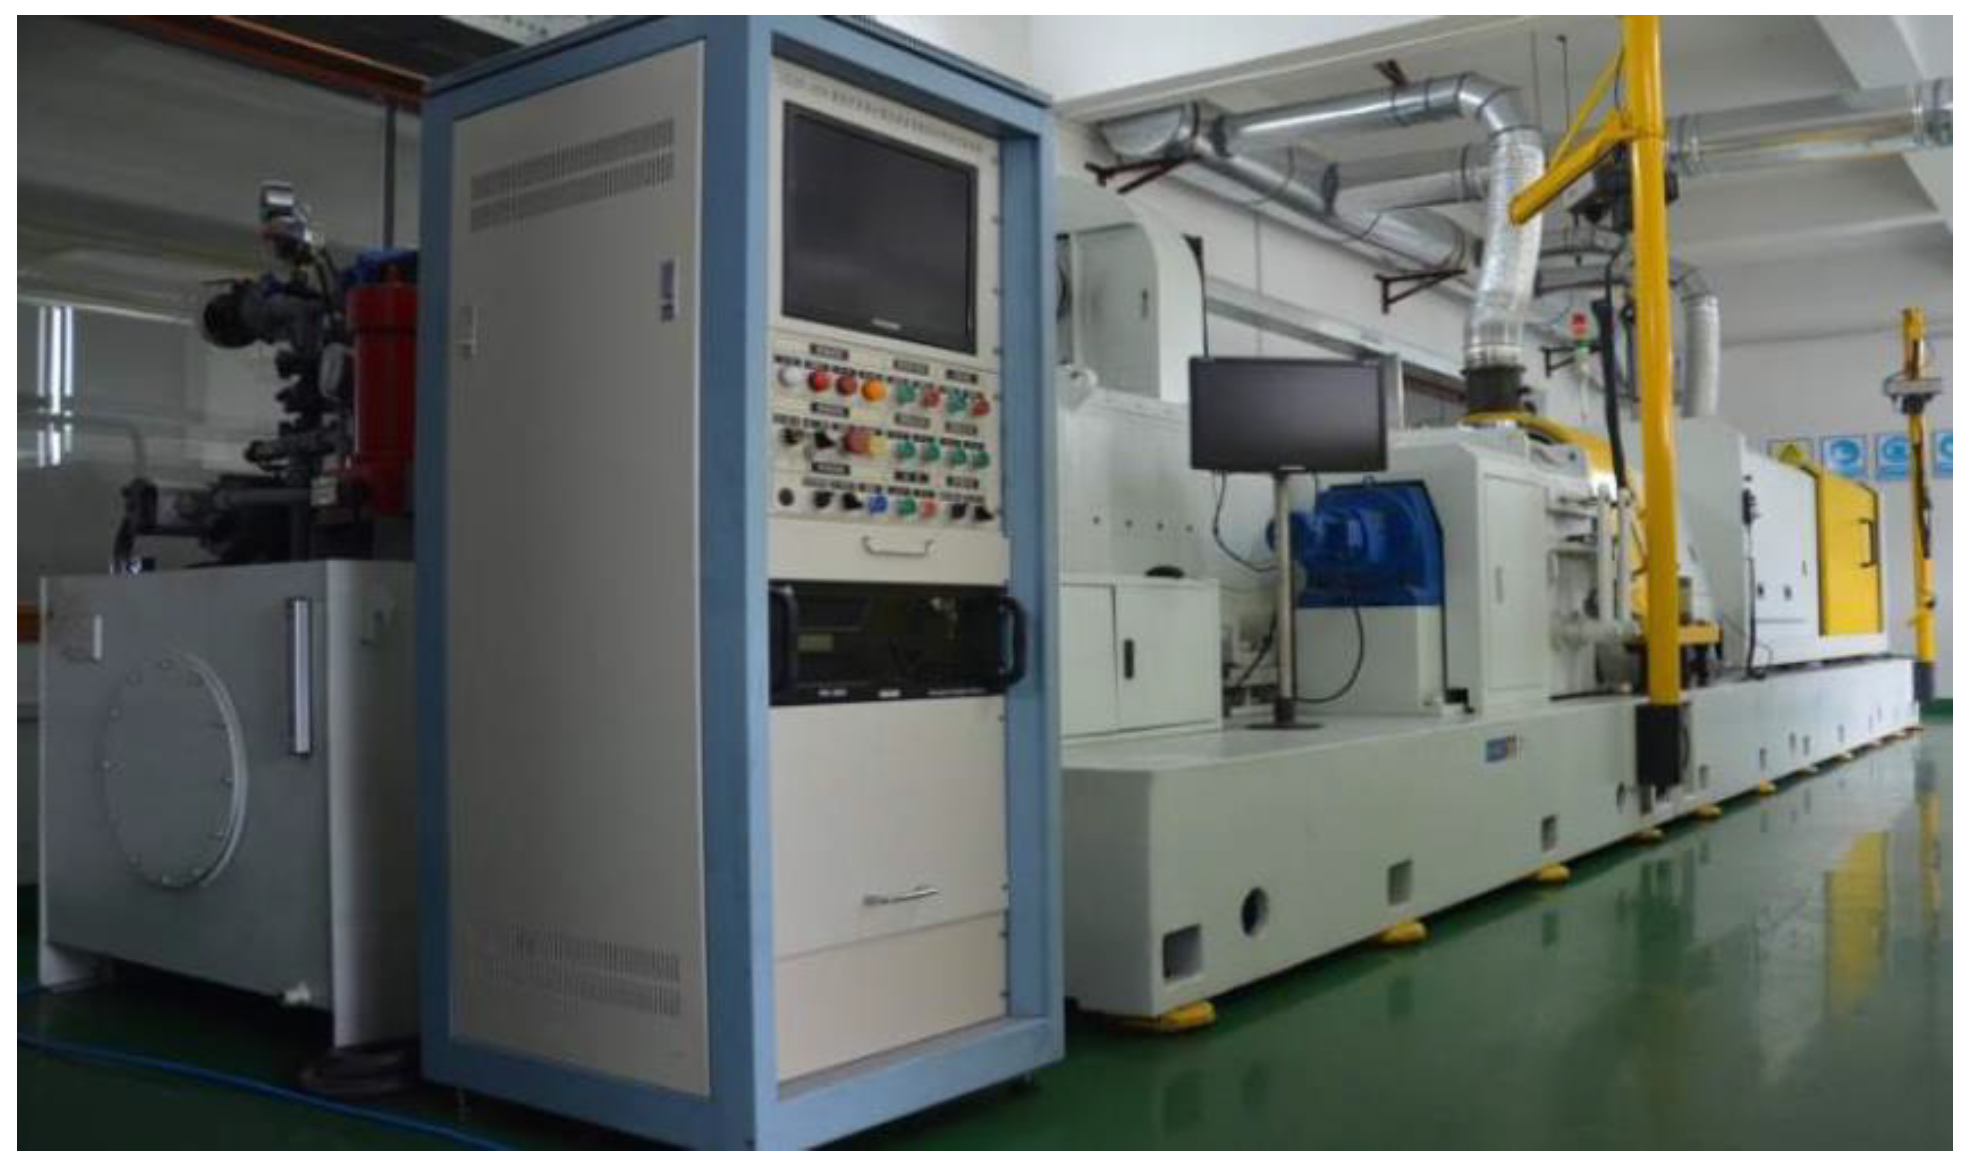
2. Temperature Test of Dry Clutch Assembly

The LZDZX-430A heavy-duty vehicle clutch assembly multifunctional performance test bench was used for the Φ430 dry clutch assembly. The bench consists of an electric control cabinet, oil supply station, lifting arm, operator console, test chamber, active components, and driven components, as shown in Figure 1. Thermocouples are embedded at a downward depth of 0.2–0.3 mm from the surface of the pressure plate and located in the outer, middle, and inner diameters of the pressure plate, respectively. Figure 2 shows the installation of the clutch assembly with K-type nickel-chromium/nickel-silicon thermocouples on the rig test bench.
Multiple sets of clutch thermal load tests are conducted under continuous engagement and disengagement operation conditions. The main structural parameters of the dry clutch assembly for the fifth test batch are shown in Table 1. The weight of the pressure plate is 28.5 kg, the outer diameter of the pressure plate is 430 mm and the inner diameter is 240 mm, the clamping force is 36,000 N, and the driven plate outer diameter is 420 mm. The B8090 type of friction material is applied to the driven plate assembly.
For general purposes, the fifth test batch labeled with batch A is selected for the thermal modeling. In this A group test, three temperature channels labeled 1, 4, and 6 are monitored, where channel 1 is located at the outer diameter of the pressure plate, channel 4 is at the middle diameter, and channel 6 is at the inner diameter of the pressure plate. The test undergoes 45 cycles of continuous engagement and disengagement tests, with each cycle lasting 30 s. The total accumulated time is 1400 s. The complete temperature profile of the A group is shown in Figure 3. From Figure 3, it is shown that as the engagement increases, the temperature of the clutch increases. The maximum temperature of the assembly is up to 350 °C at the last cycle. In the initial stage, the maximum temperature is in channel 1 at the outer diameter; however, in the later stage, the maximum temperature is in channel 4 at the middle diameter.

3. Multi-Physics Coupled Simulation

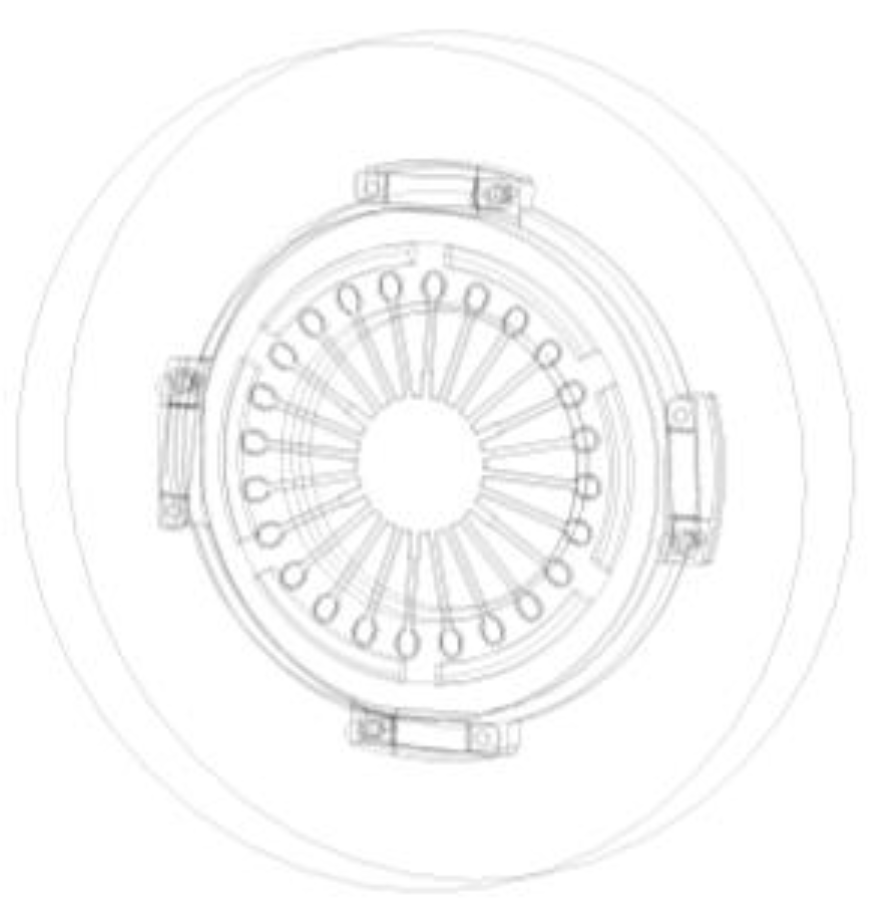
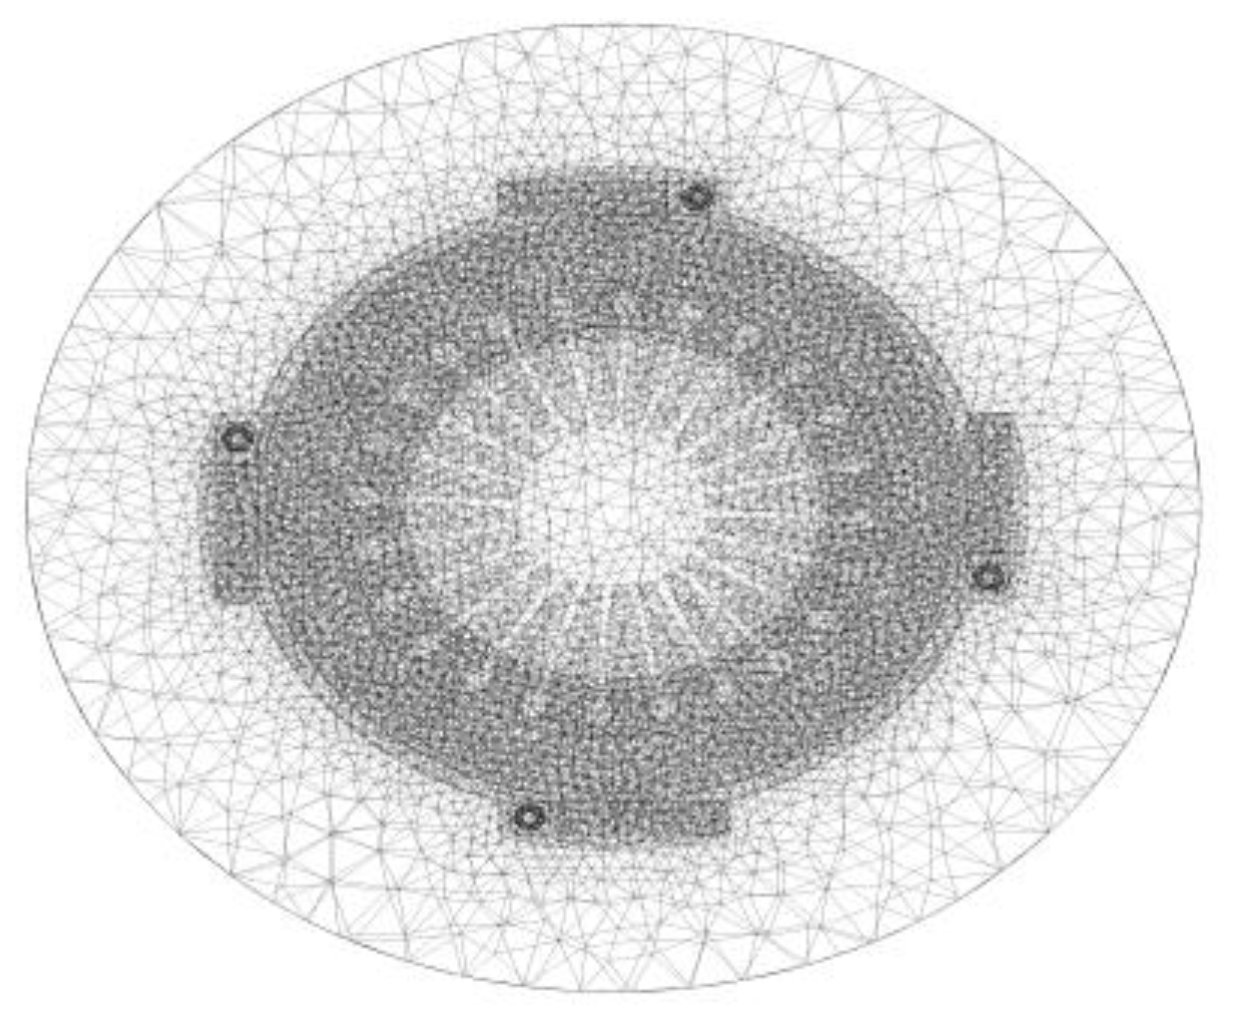
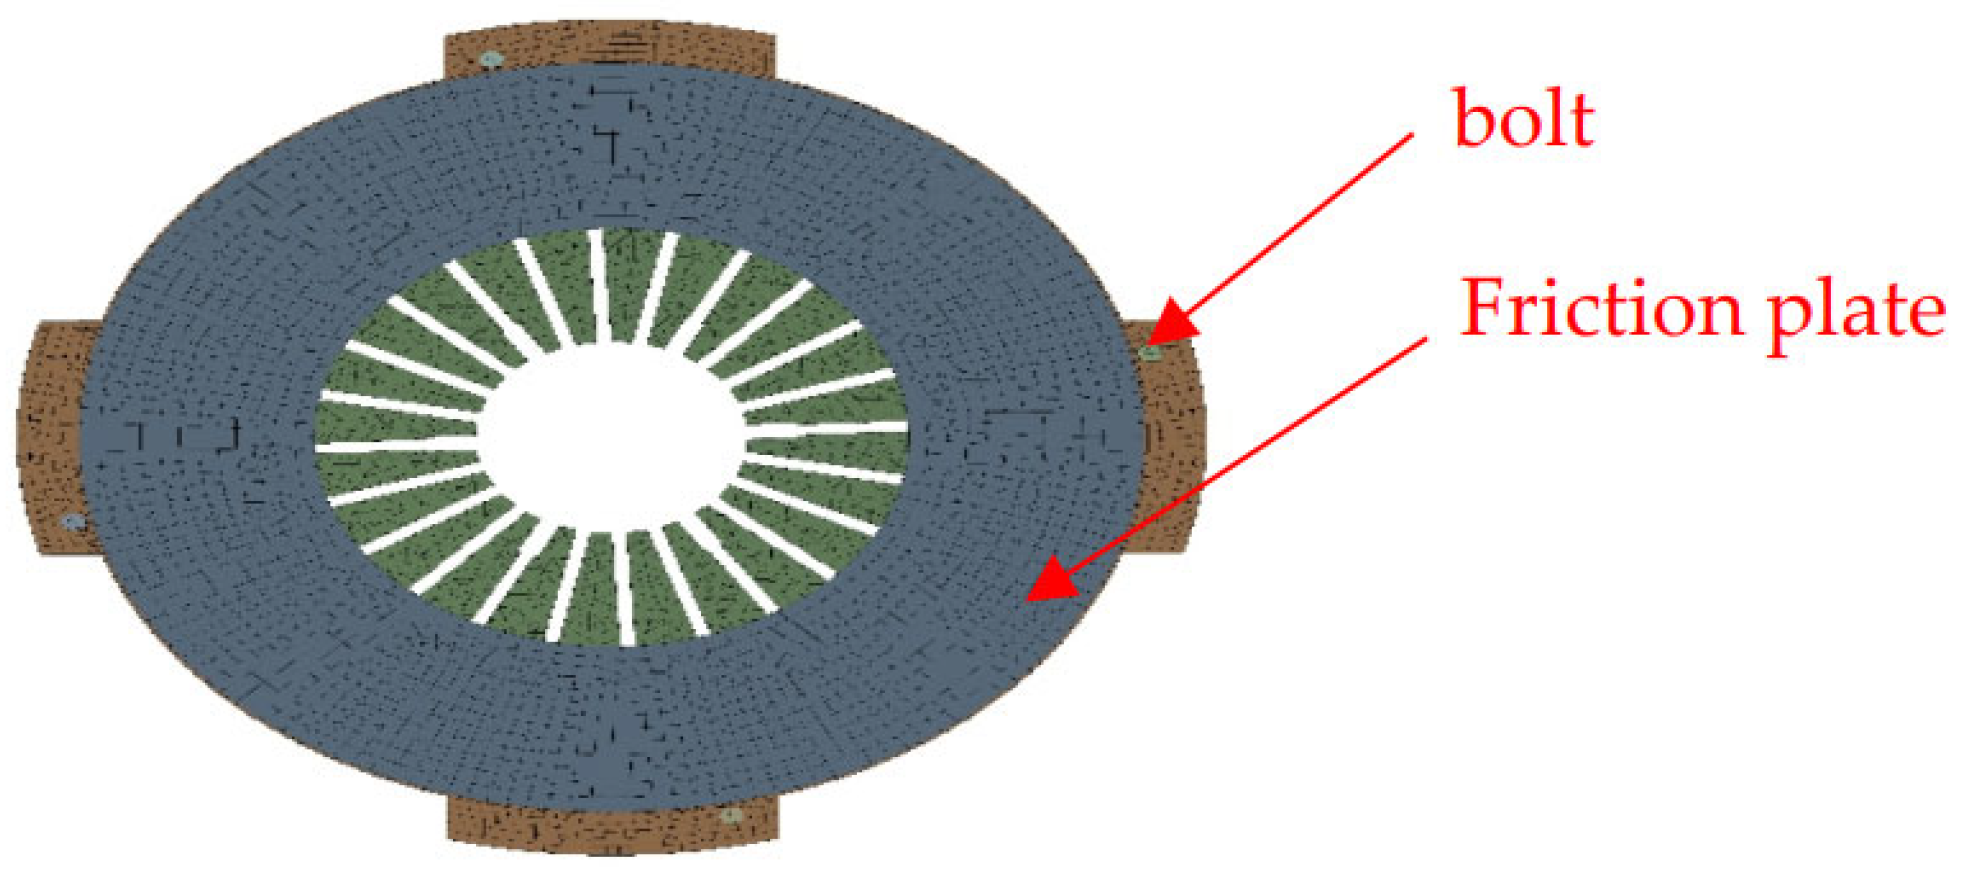
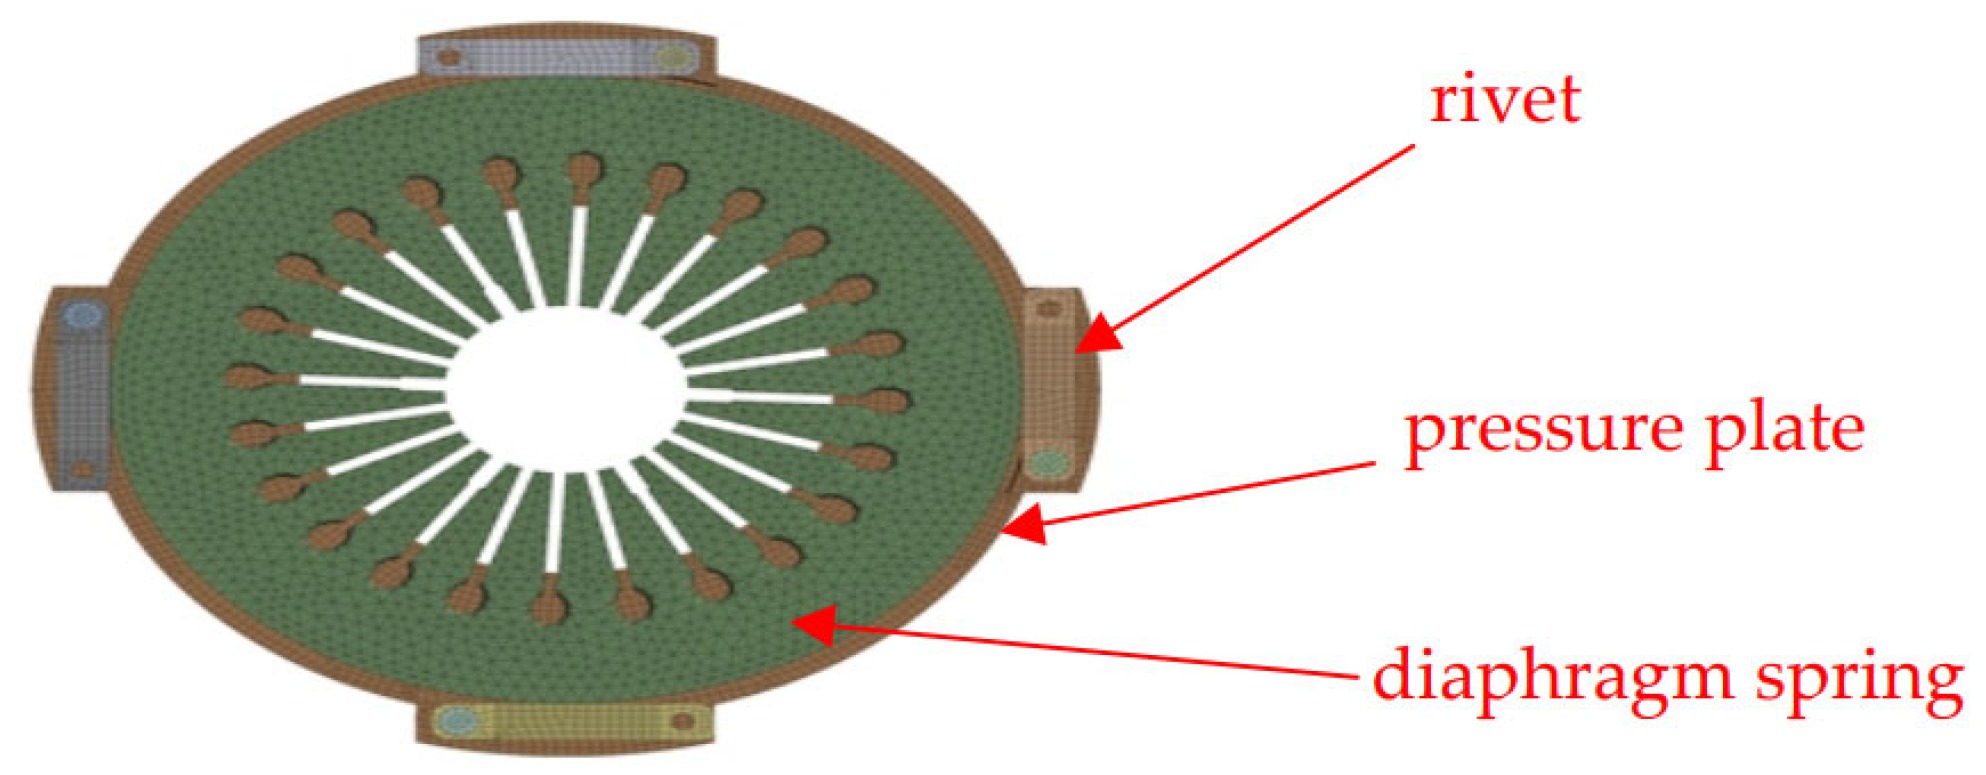
3.1. Geometric Model

In clutch design, to improve the friction force of the clutch assembly, a concave surface design (normally 0.3 mm) is implemented on the friction surface of the pressure plate. The geometric parameters of the pressure plate and friction disc in the dry clutch assembly are shown in Table 2. The thermophysical properties of the materials used in the dry clutch assembly are presented in Table 3.

3.2. Fluid-Solid Coupling Model

Since the dry clutch assembly is a more complex model, the hexahedral elements are used for relatively regular parts to improve accuracy and reduce the number of grids. The irregular structure parts are divided into tetrahedral unstructured grids to meet the grid quality and meet the convergence requirements of the numerical simulation.
The dry clutch assembly model contains the pressure plate, diaphragm springs, rivets, and transmission plates. To determine the convective heat transfer coefficient of the dry clutch assembly with the ambient air under different angular velocities, the enclosure tool in SCDM code is used to create the external flow field region of the clutch. A cylindrical shape is set to simulate the spatial domain of the fluid, as shown in Figure 4. The entire assembly is meshed using tetrahedral unstructured grids, with a total of 59,642 nodes and 340,175 elements. The mesh partitioning effect is shown in the diagram below, in Figure 5.
The determined fluid-thermal coupling boundary conditions and main parameters are as follows:
(1)
To ensure computational convergence, a time step of 0.1 s is set with a total of 300 steps. The energy equation is enabled.
(2)
The realizable turbulence model and Enhanced Wall Treatment (EWF) are used.
(3)
The rotational speed is applied to the coupled wall surfaces covered by the fluid domain. The fluid domain rotates around the Y-axis at a speed of 1400 rpm.
(4)
The material properties of the pressure plate, friction plate, transmission plate, rivets, and diaphragm spring are defined according to Table 3. The fluid domain is set to default air gas.
(5)
The heat flux model based on the sliding power is applied to the friction surface of the pressure plate. The sliding power is calculated using the test bench data for each engagement-disengagement cycle. The convective heat transfer coefficient required for solving the neighboring wall surface heat transfer is obtained.

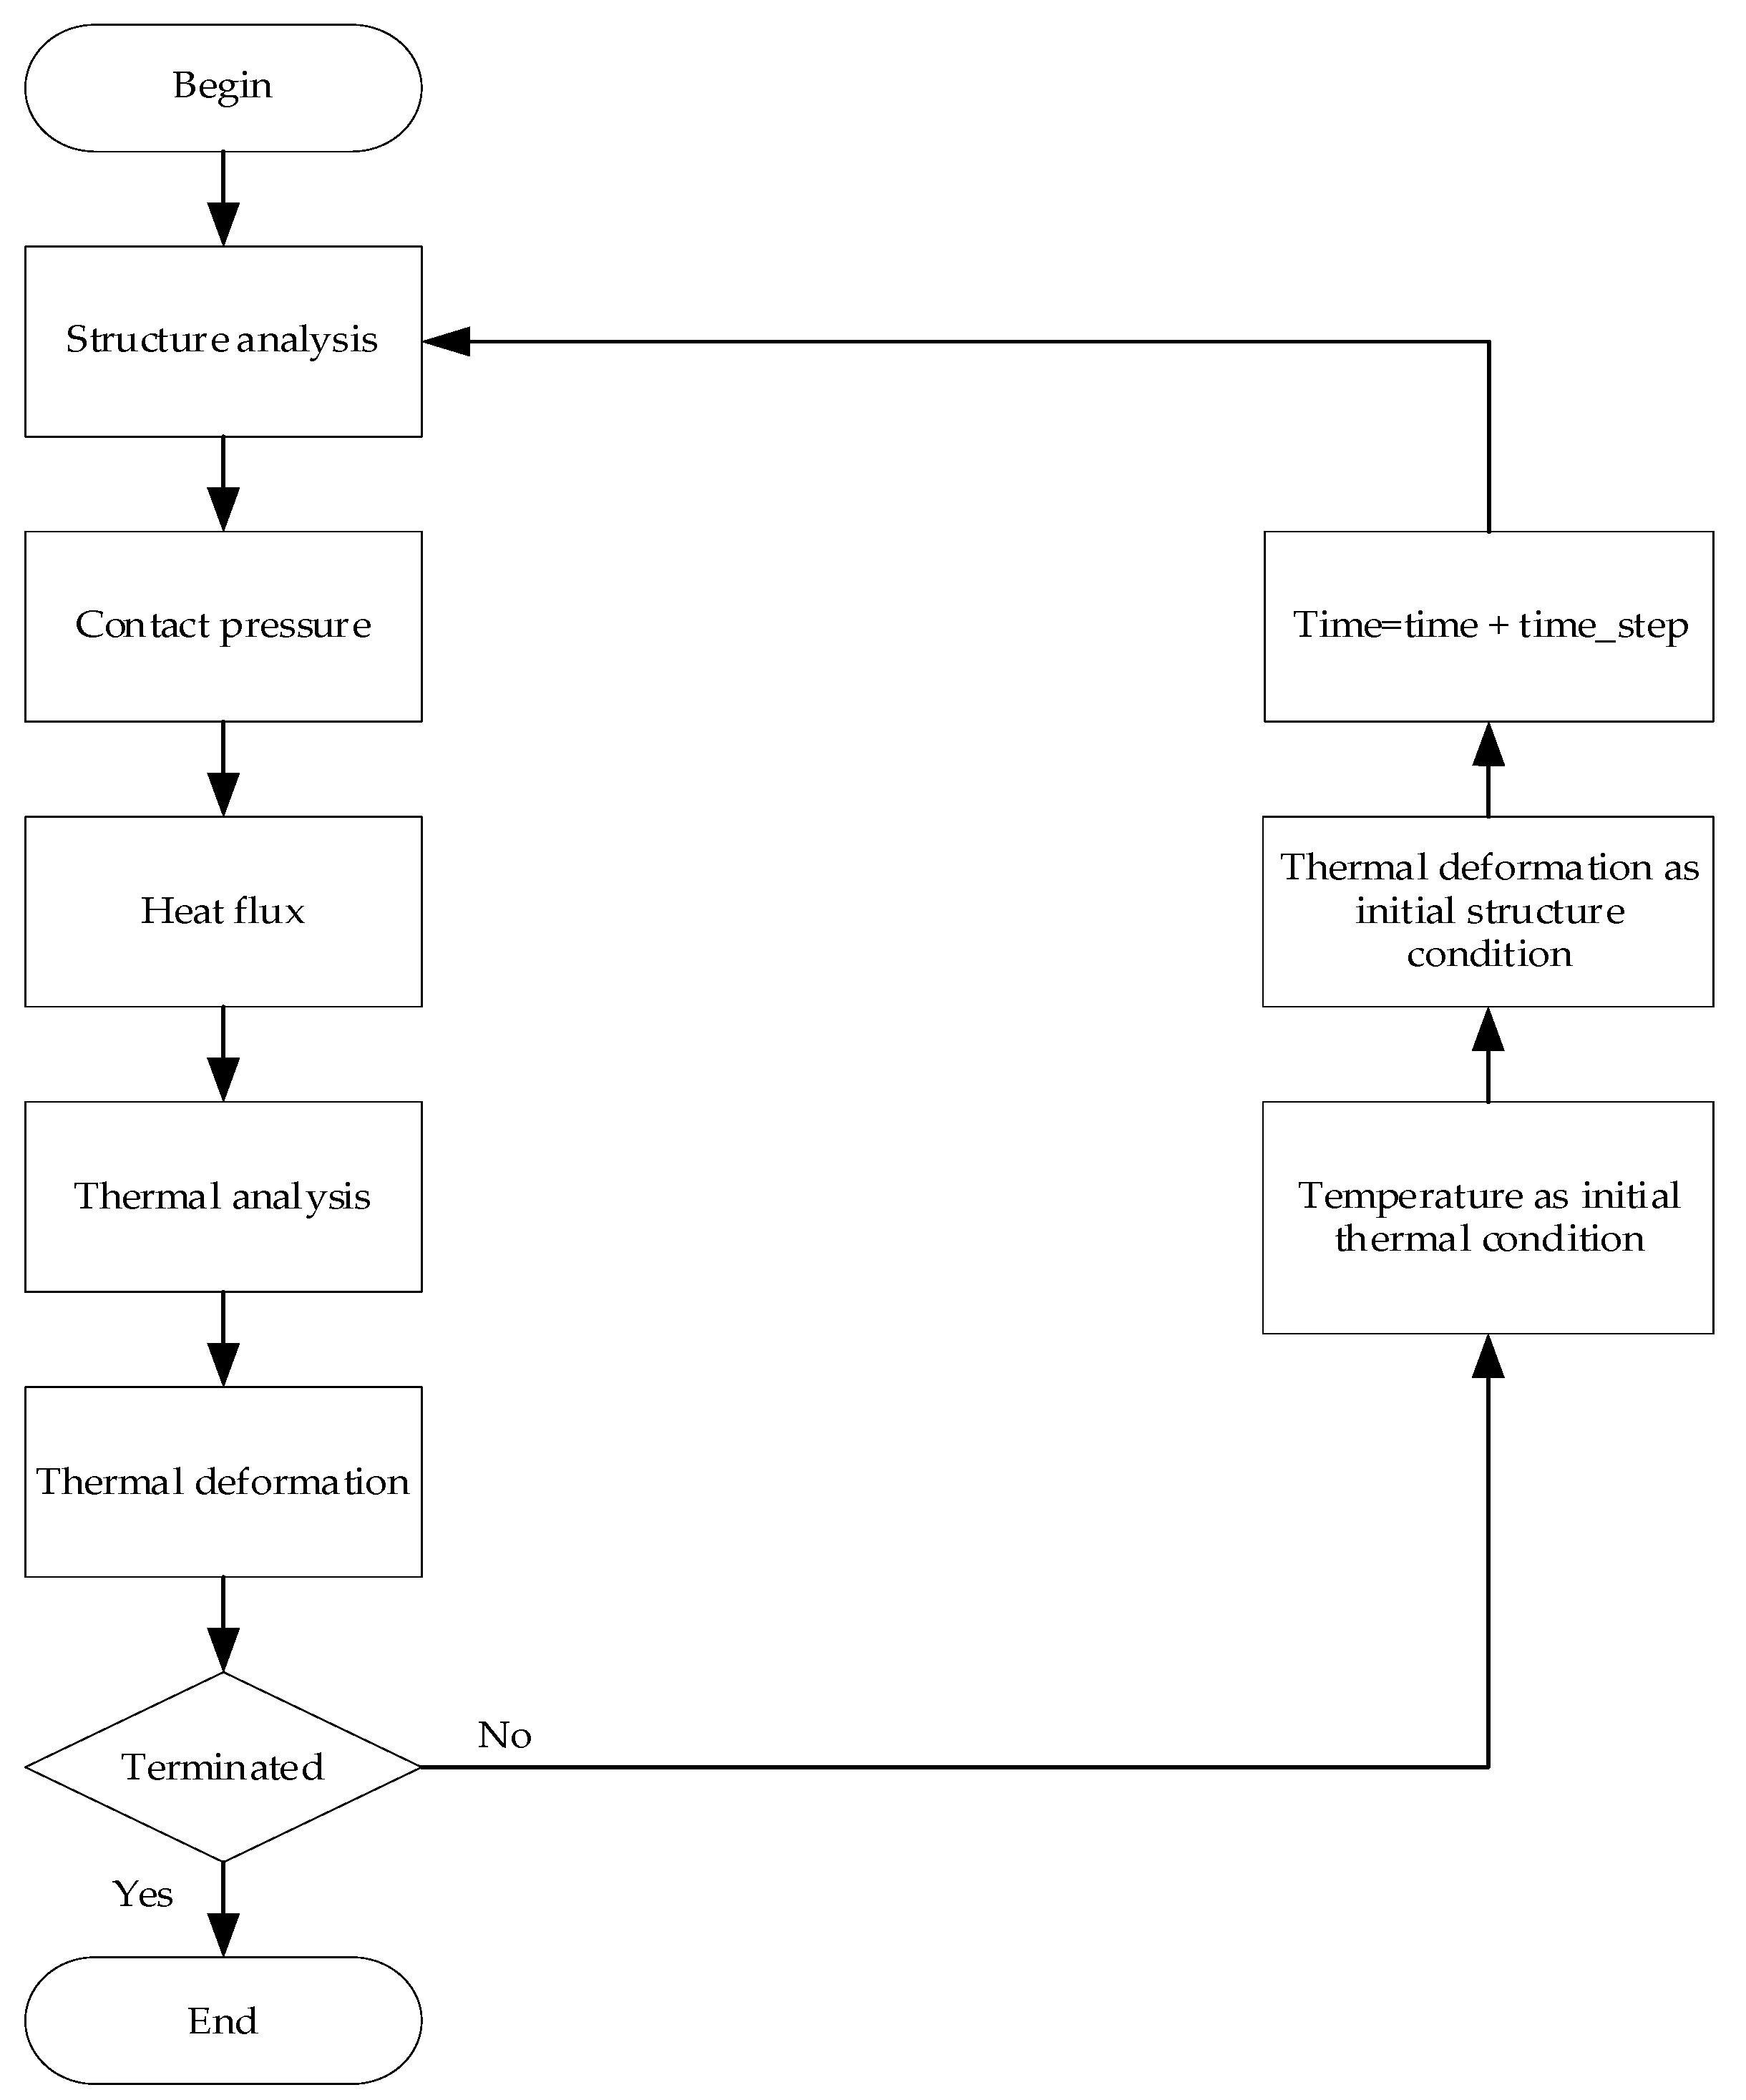
3.3. Thermal-Solid Decoupling Model

For the pressure plate, rivets, and bolt, the hexahedral element is used in the meshing of the model of the clutch assembly to improve accuracy. For the diaphragm springs and the transmission plates, the tetrahedral element is the only option to use in the meshing because of its complex structure. The whole FE model consists of 253,280 nodes and 73,814 elements, as shown in Figure 6 and Figure 7, respectively.
For reducing the computational resource and achieving long-scale simulation, the thermal-structure bidirectional coupling is decoupled with two steps of sequential unidirectional coupling. In the first step, the structure analysis of the clutch assembly is performed under the normal clamp force of the clutch. The contact pressure of the friction surface of the pressure plate is obtained. The time step of the simulation is specified, for example, 0.1 s during the engagement sliding process, and a time step of 1 s is specified during the disengagement process. Within the time-step-specified range, the contact is assumed to remain unchanged. Then the frictional heat generated can be easily calculated based on the contact pressure. Then, applying the heat flux to the surface of the pressure plate, the thermal analysis of the clutch assembly is conducted. The thermal deformation of the pressure plate is achieved correspondingly. In the second step or the next time step, the structure analysis of the deformed clutch assembly under the normal clamp fore of the clutch is performed successively, where the deformation of the pressure plates by the previous step is applied in the model as the initial displacement condition. And the contact pressure and heat flux of the deformed clutch plate are conducted as the first step. Then the thermal analysis of the clutch assembly is performed successively, where the temperature distribution from the previous step is applied to the model as the initial thermal condition. These two steps are repeated until the running time reaches the set value. The regulation of the time step in the simulation can compromise the accuracy and computational resource of the simulation. The following Figure 8 illustrates the flow of the decoupling technique.

3.4. Friction Surface Heat Flux Model

After each engagement-disengagement cycle, the friction surfaces of the clutch experience temperature changes due to friction-generated heat and heat transfer with the ambient. The temperature on the pressure plate friction surface gradually increases. Several effective heat flux density models on the sliding friction surface have been established based on the energy conversation theory. In this paper, it is assumed that almost all the frictional heat is converted into thermal energy at the contact surface of the friction pair. This is described by the heat flux density generated by the sliding friction during the clutch engagement process, as follows [13].
q ( r , t ) = η μ P ω ( t ) r
In Equation (1), q represents the heat flux density, η is the heat flow distribution coefficient between the pressure plate and the friction disc (assuming no material wear effects and considering that all sliding work is converted into heat), μ is the coefficient of friction, p is the contact pressure at the friction surface, ω is the angular velocity of the pressure plate, and r is the effective distance from the contact point to the symmetrical center of the pressure plate.

3.5. Boundary Conditions

The frictional contact between the pressure plate and friction plate is set to be asymmetric, with a friction coefficient of 0.3. The frictional contact between the diaphragm spring and heat dissipation fins is also established, with a friction coefficient of 0.12. The contact type for other components of the assembly is defined as bonded contact. According to the actual operating conditions of the clutch, the following boundary conditions and other loads are set:
(1)
For improving the computational efficiency, the engagement and sliding phase are calculated and analyzed with a time step of 0.1 s, while the synchronous rotation phase is calculated with a time step of 1 s. The material properties are set according to the thermal and physical parameters used in ANSYS-Fluent 2021 calculations.
(2)
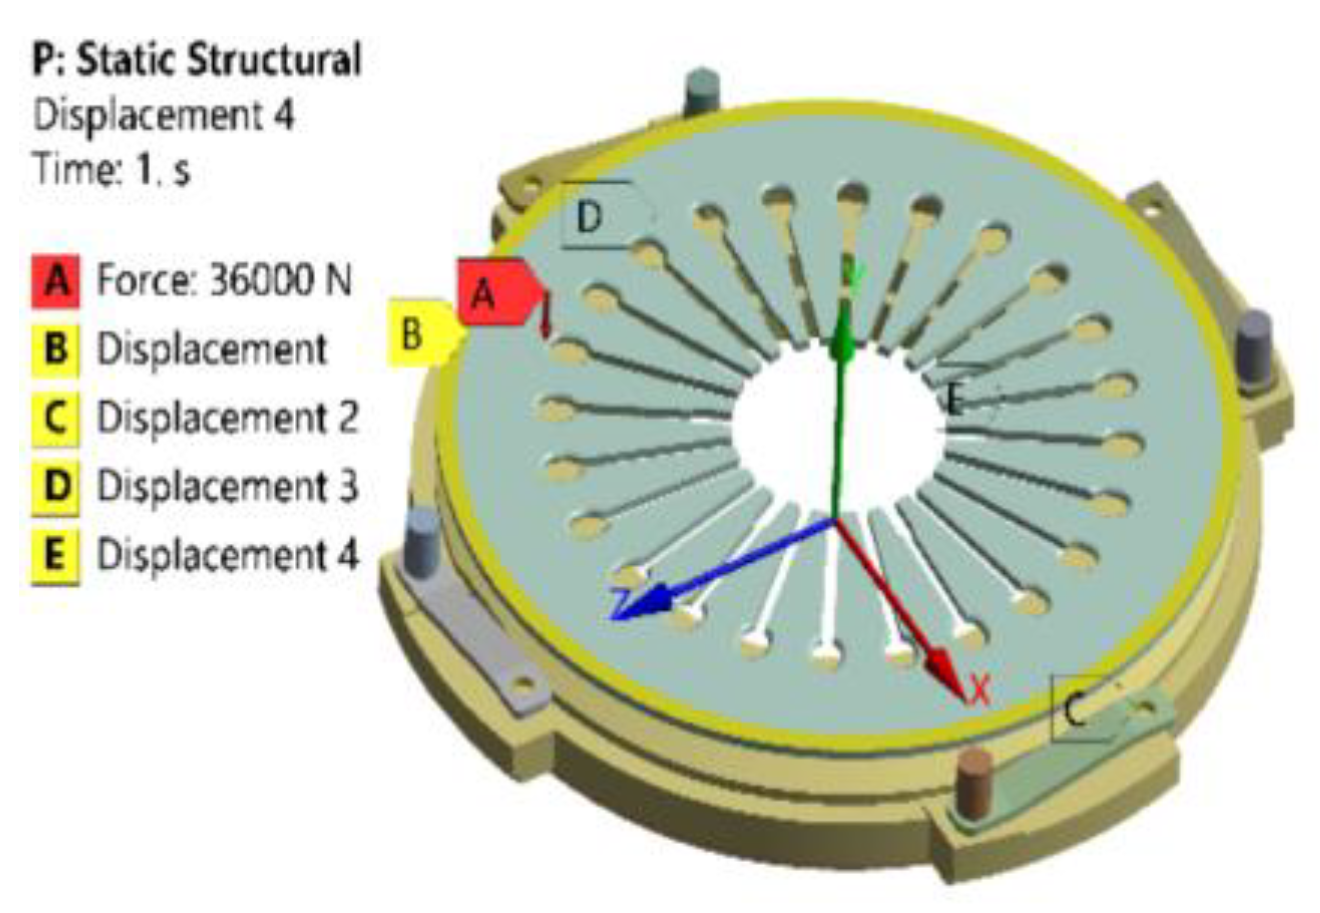
In the engagement and sliding phase, a compressive force of 36,000 N is applied at the back of the pressure plate. After the synchronous rotation phase, the pressure plate and friction plate start to separate, and the compressive force is released to 0 N.
(3)
The displacement constraints are applied to the convex ear at the outer edge of the pressure plate and the large-end support ring surface of the diaphragm spring. The friction surface in contact with the flywheel is constrained axially, and the inner diameter of the friction plate is constrained radially and circumferentially, as shown in Figure 9.
In the simulation, three temperature values of the monitoring points on the pressure plate are extracted, where point A represents the outer diameter, point B represents the middle diameter, and point C represents the inner diameter, as shown in Figure 10.

4. Results Analysis and Discussion

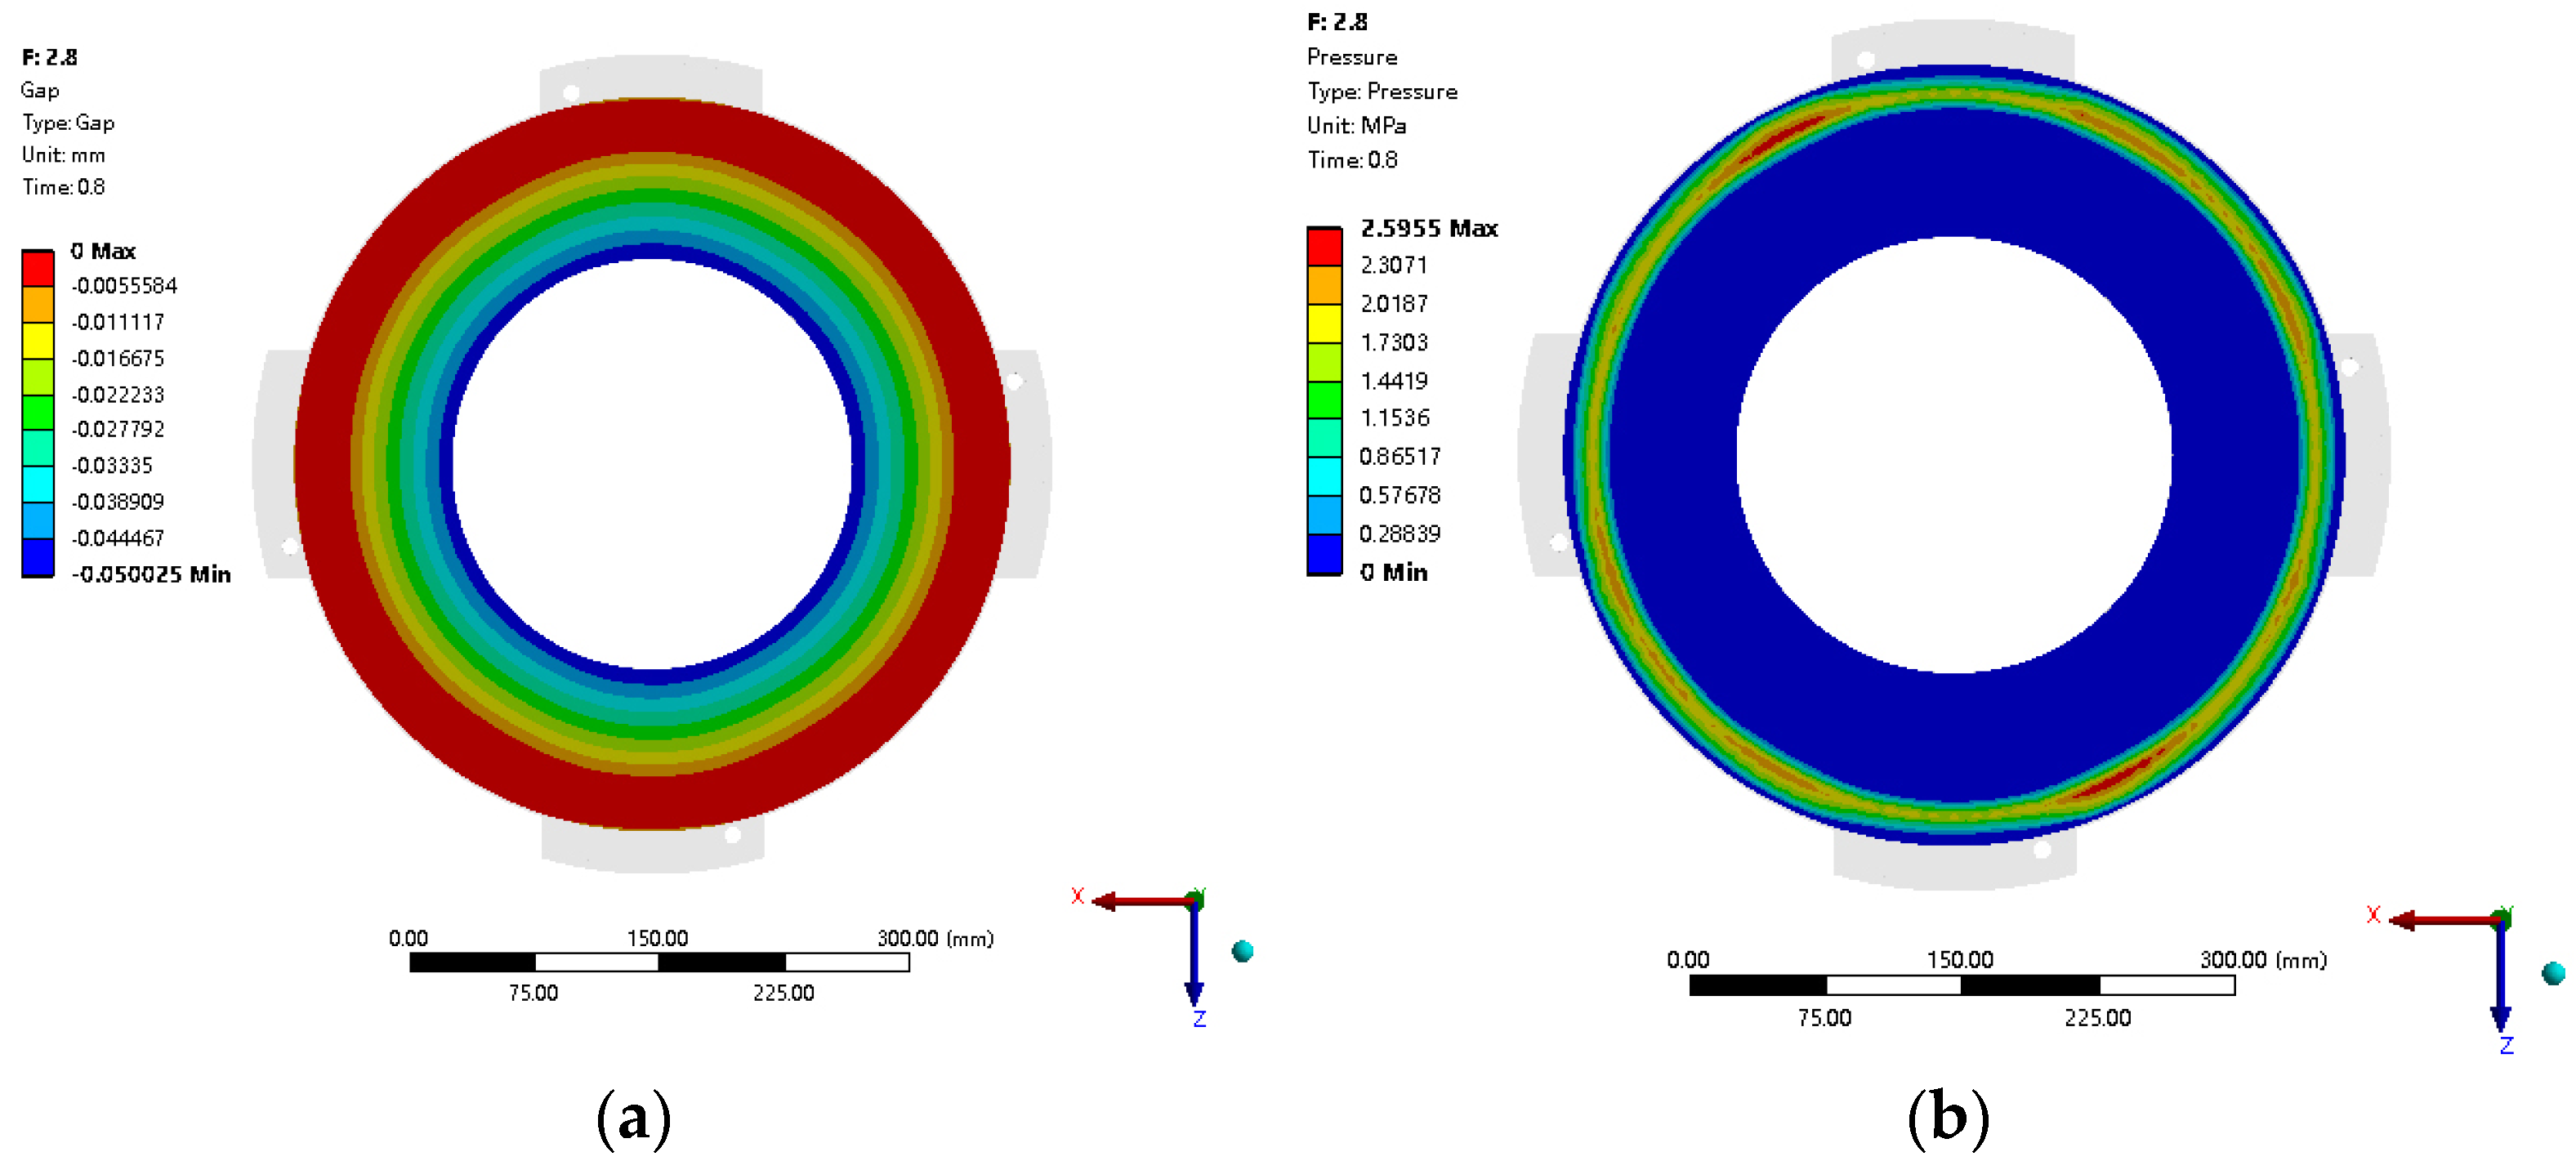
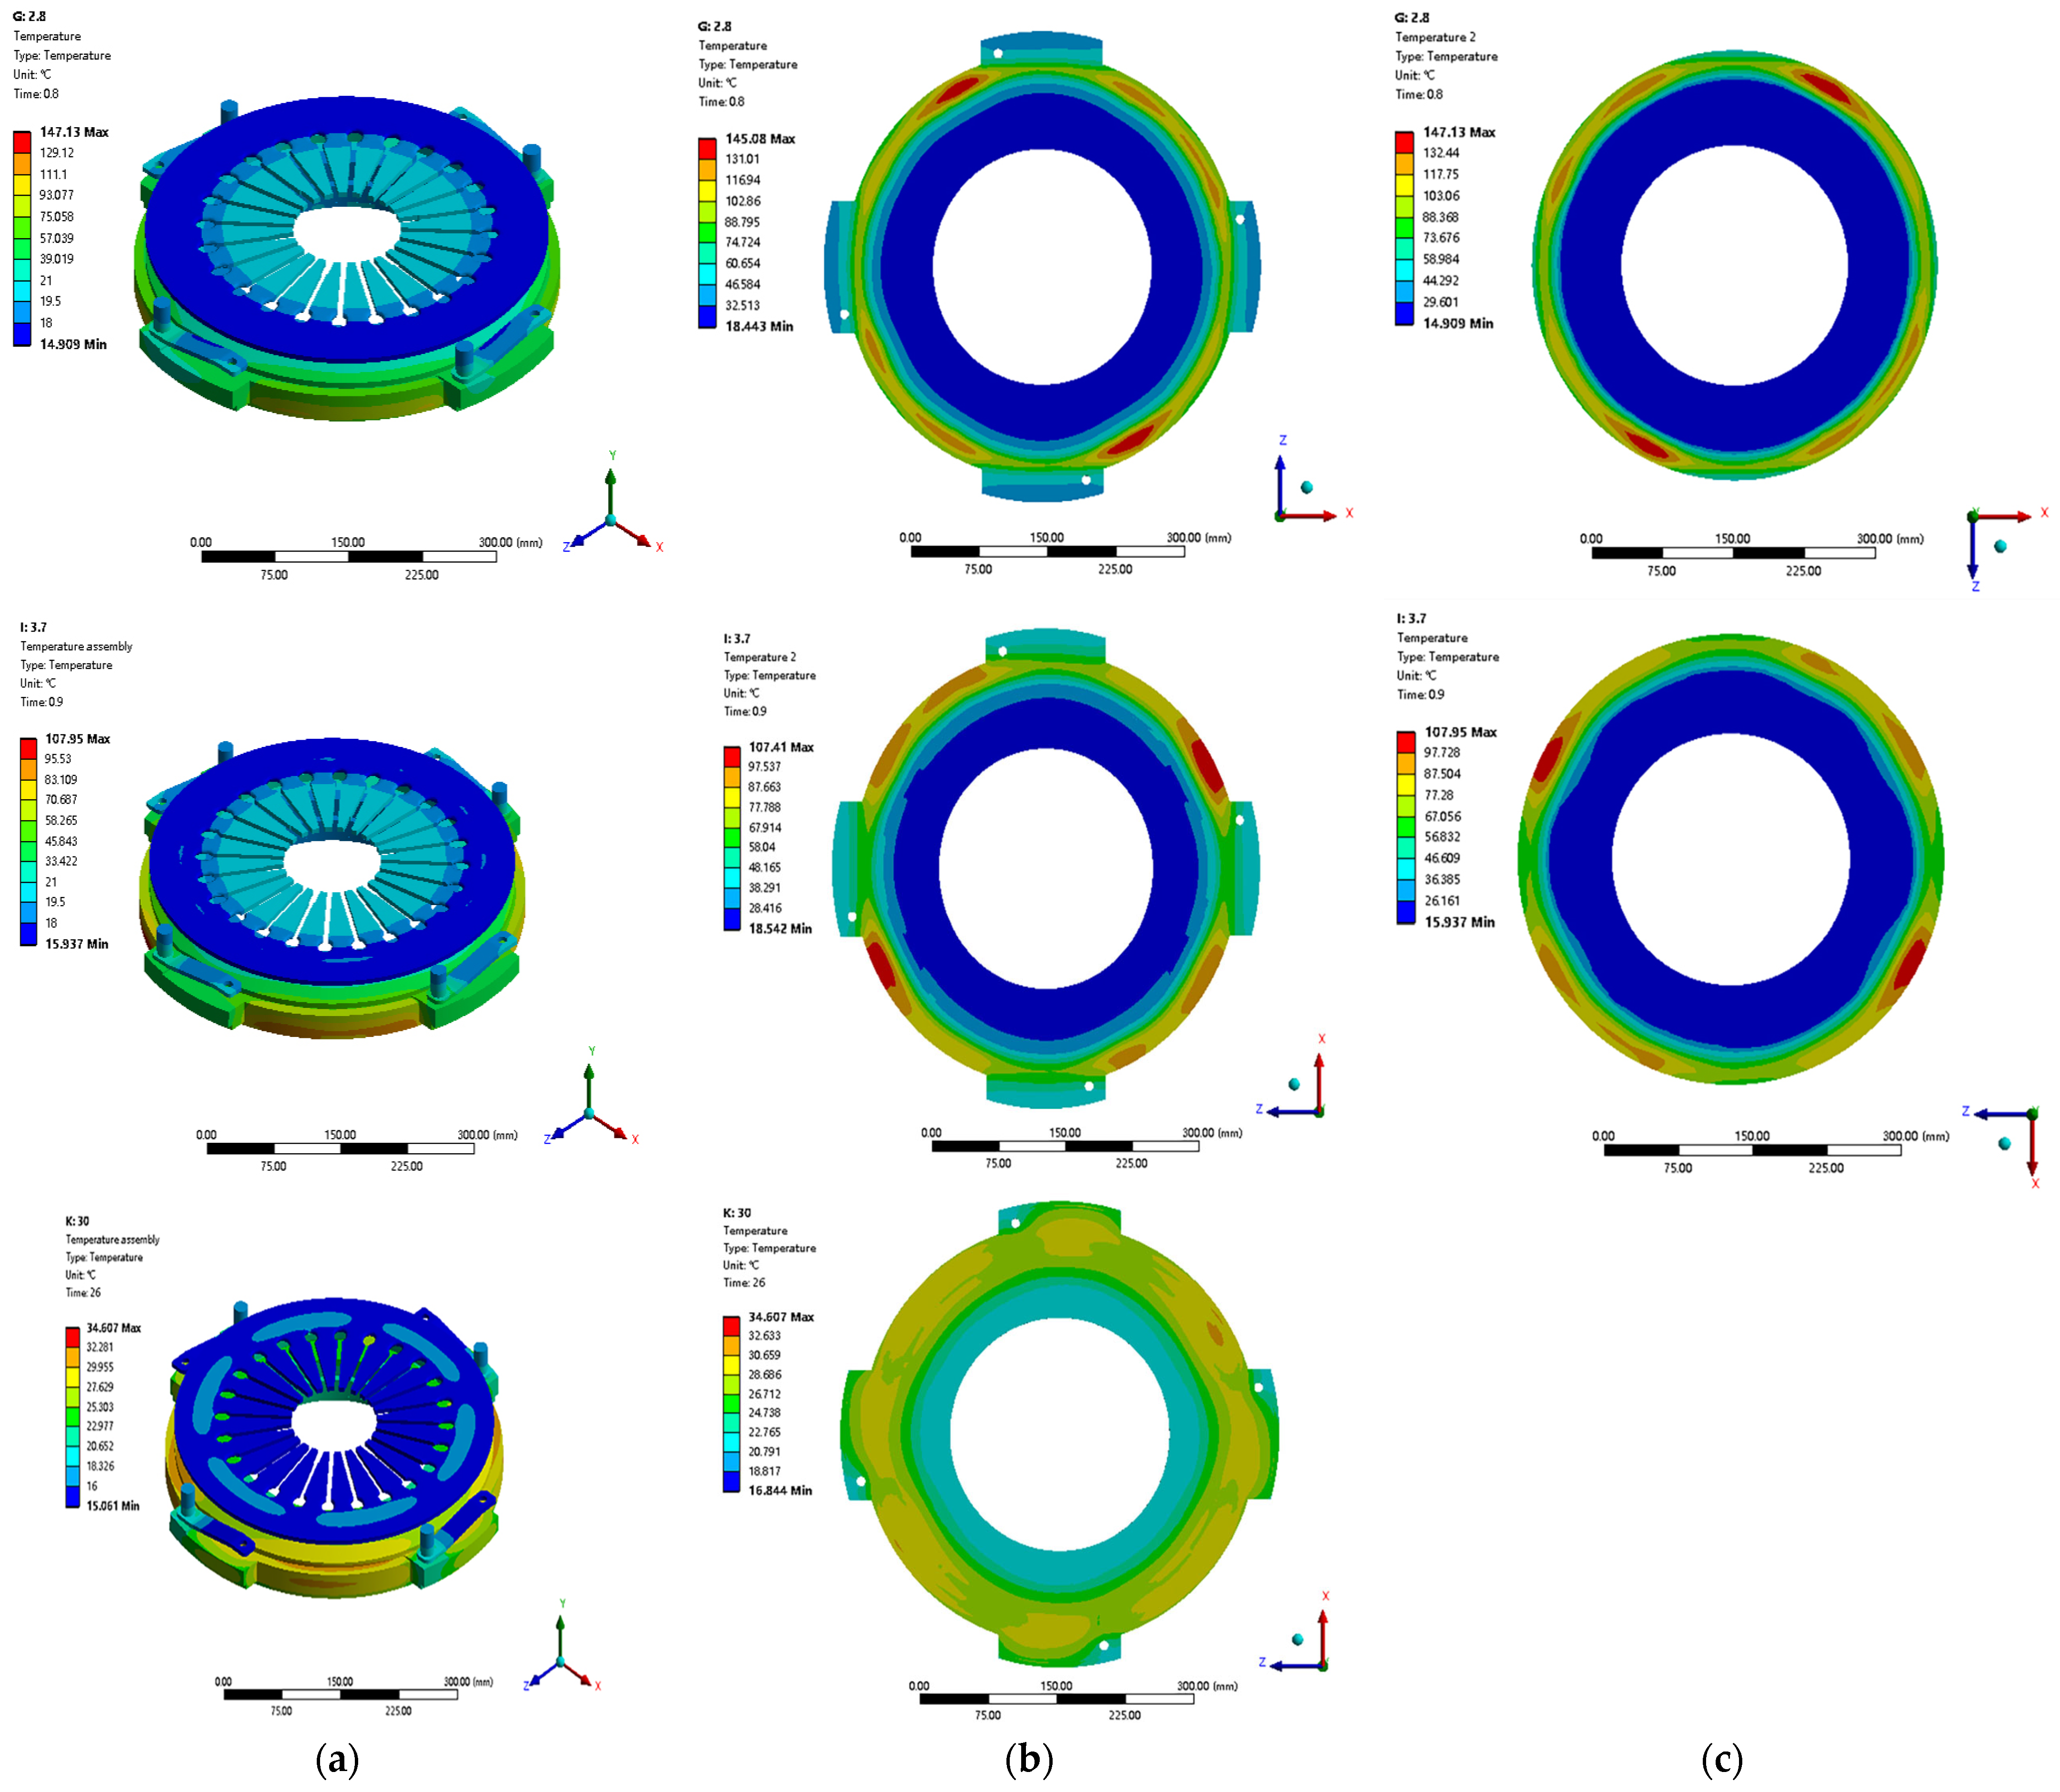
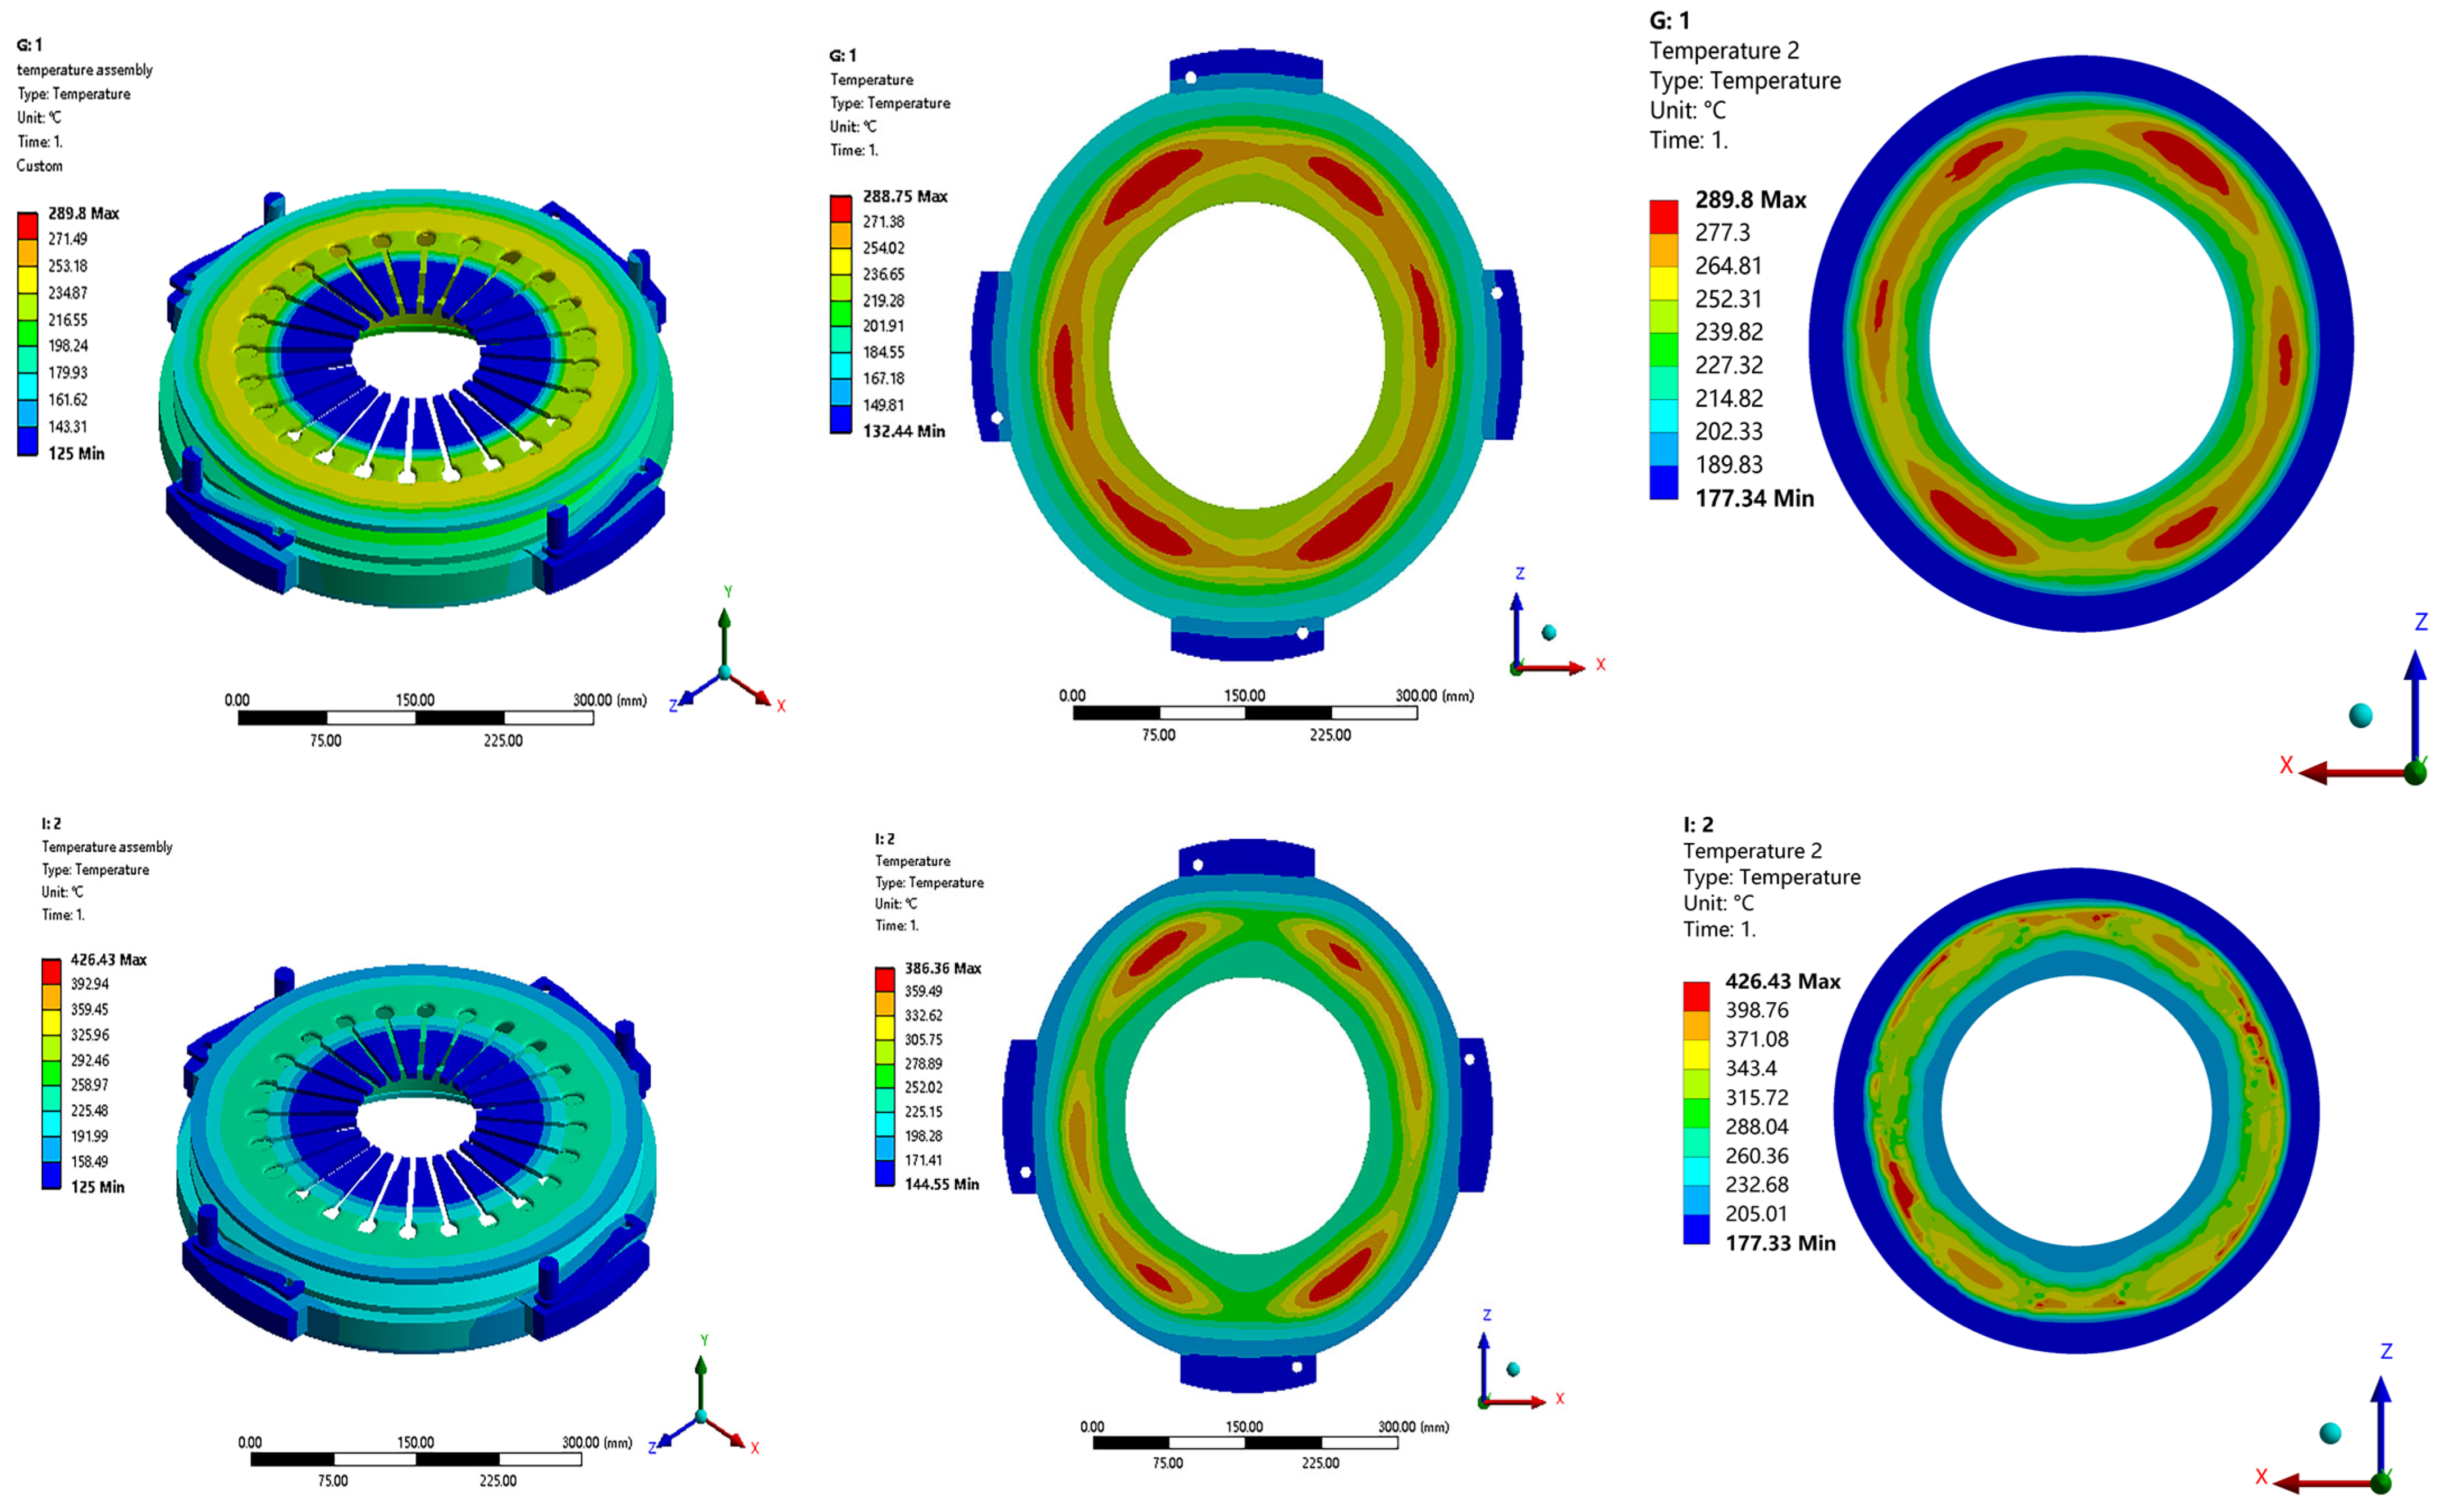
4.1. Temperature Field of the Clutch Assembly during the First Engagement

The contact between the friction pairs of the clutch first occurs in the maximum outer diameter region, then the contact gradually expands from the outer ring towards the center during the engagement sliding process, as shown in Figure 11. Figure 11 depicts the contact gap (a) and contact pressure (b) contour plots on the friction surface. This contact state evolution agrees well with the engineering experience.
As heat is generated from the friction between the friction pairs, the outer diameter of the pressure plate quickly heats up, while the middle and inner diameters, due to the slight concavity of the pressure plate’s friction surface, do not initially come into contact with the friction disc. Instead, a minor temperature increase in this region is primarily achieved through internal heat transfer within the clutch assembly. Figure 12 represents the temperature field contour map of the clutch assembly during the initial 30 s of engagement and disengagement. Figure 12a represents the temperature contour map of the dry clutch assembly, (b) represents the temperature contour map of the pressure plate’s friction surface, and (c) represents the temperature contour map of the friction disc’s friction surface. It can be observed from Figure 12 that the temperature difference between the monitoring points on the outer, middle, and inner diameters of the pressure plate’s friction surface gradually increases. The peak temperature of the assembly is 147.13 °C, occurring in the final stage of sliding, and after the heat dissipation during disengagement, the highest temperature drops to 34.61 °C.
Figure 13 shows the temperature profiles of the simulation and the test for the first cycle at the points of the inner diameter (a), middle diameter (b), and outer diameter (c), respectively. It can be seen from Figure 13 that for these three monitor points, the temperatures of the simulation agree well with those of the test.
Table 4 shows the comparison of the temperature between the simulation model and the rig test for the first engagement and disengagement processes. The maximum temperature difference at the outer diameter point is 5.14 °C, with a relative deviation of 5.13%. The maximum temperature difference at the middle diameter point is 3.02 °C, with a relative deviation of 14.0%. The maximum temperature difference at the inner diameter point is 3.3 °C, with a relative deviation of 14.8%. The absolute temperature difference for three monitor points ranges from 0.22 °C to 3.3 °C, which falls within the acceptable range of accuracy.

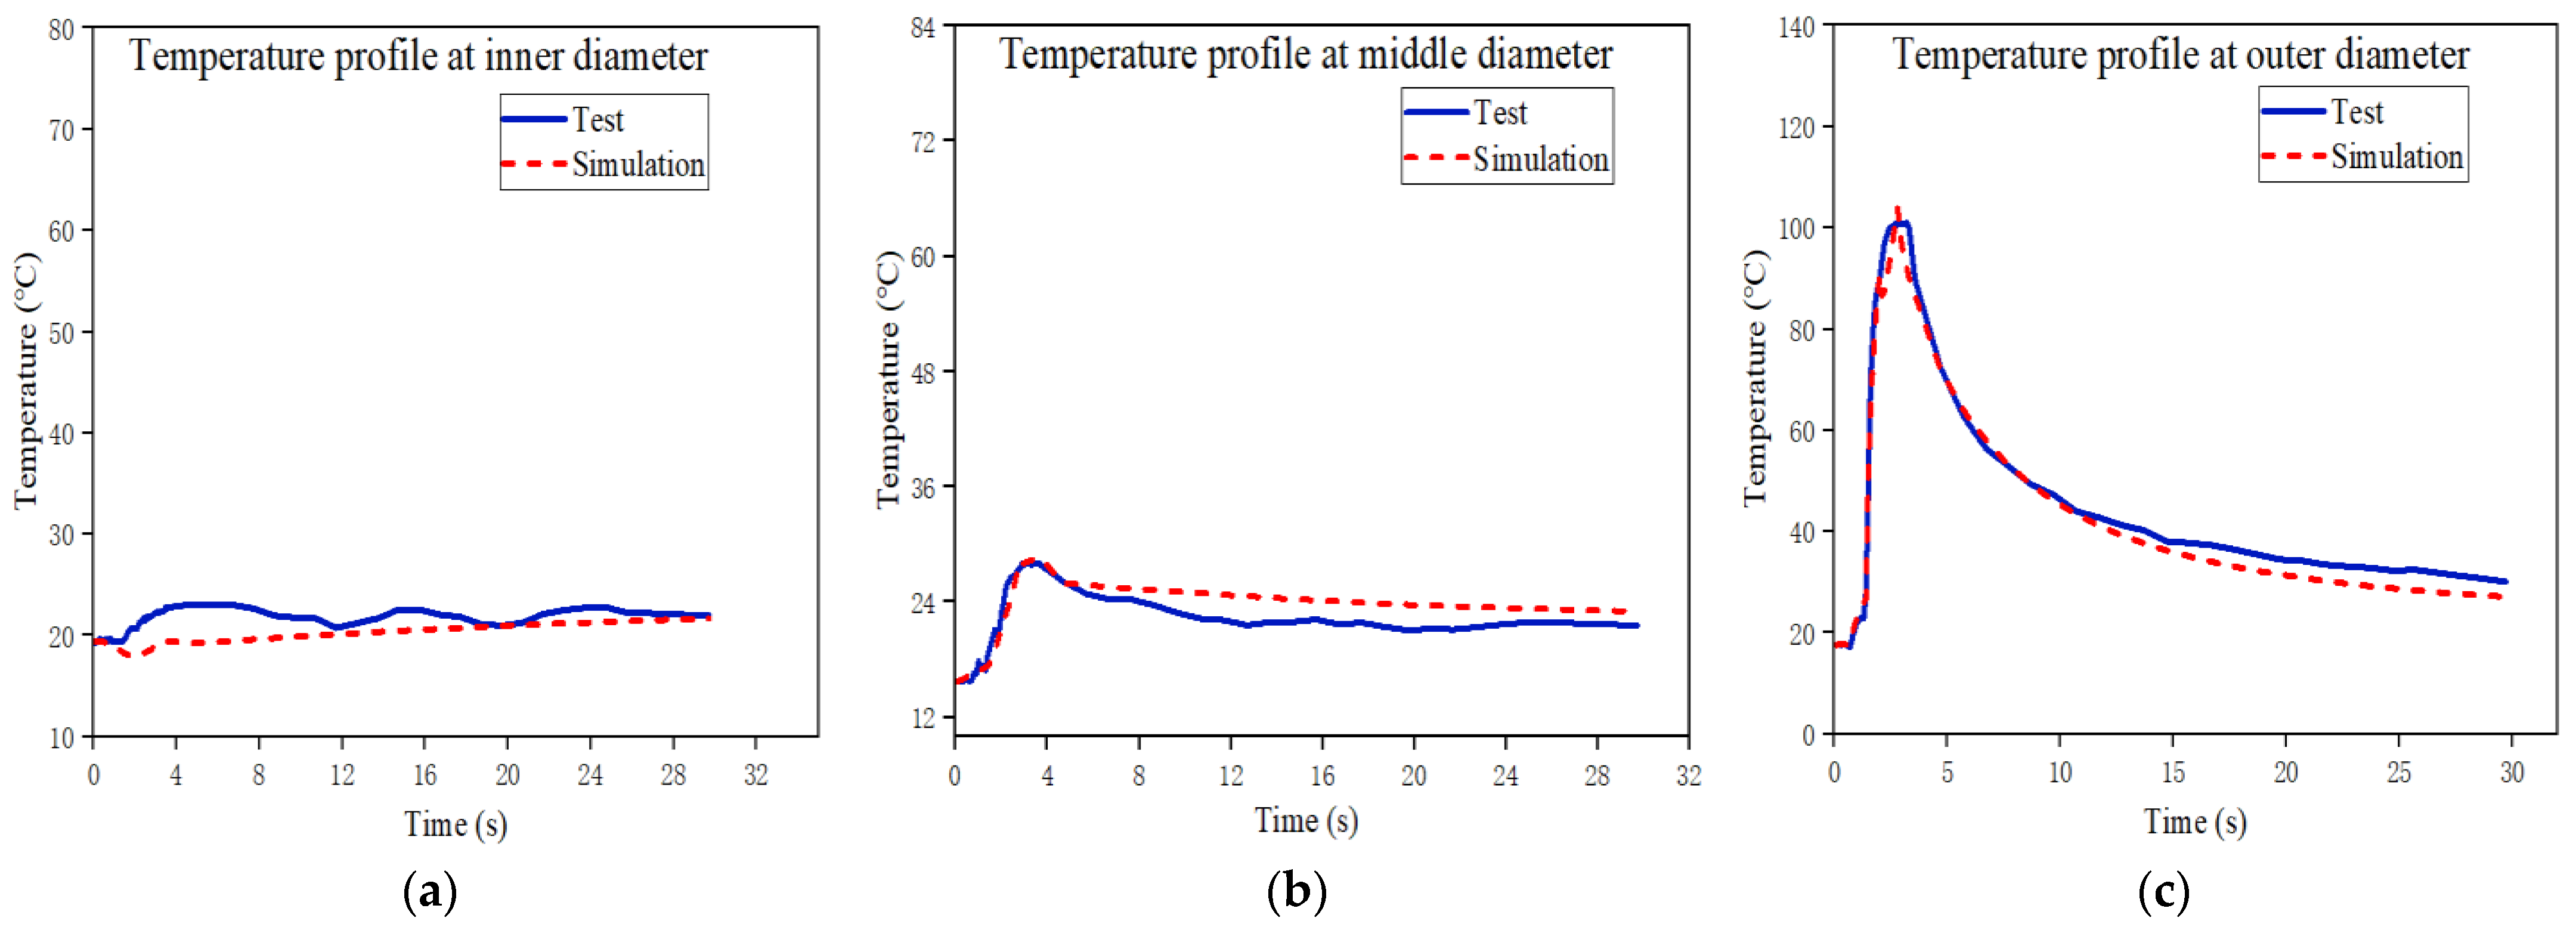
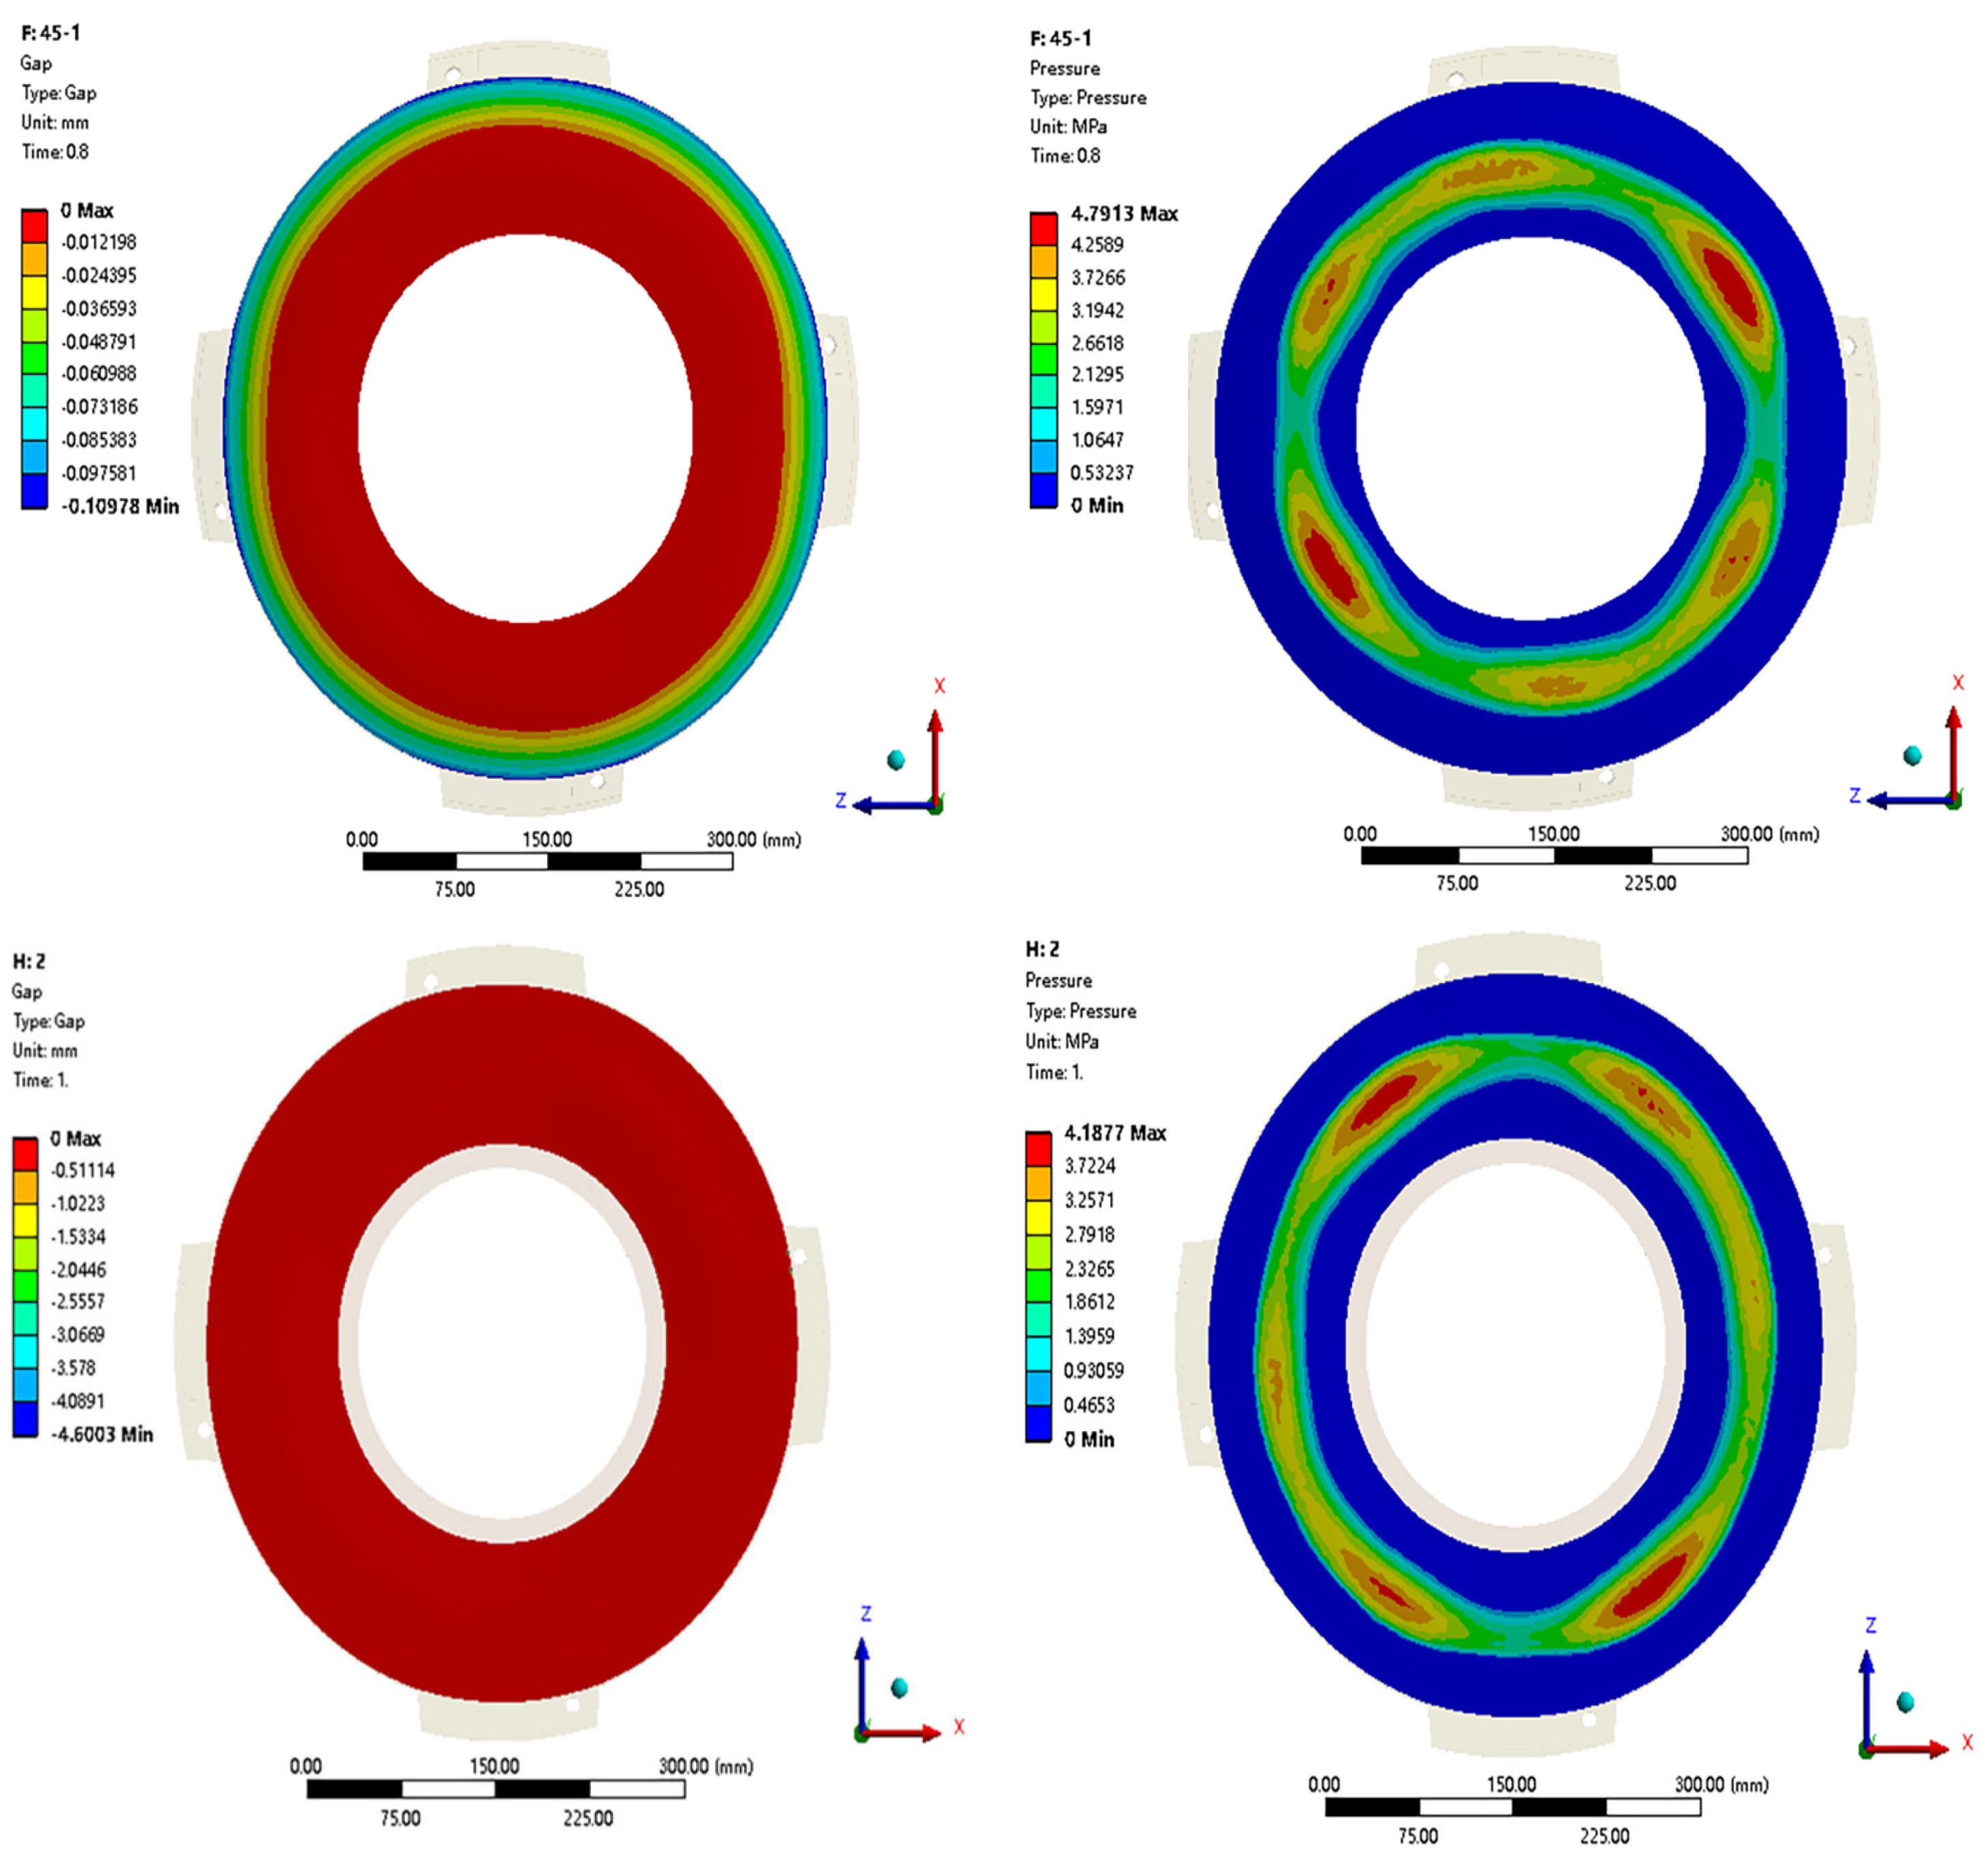
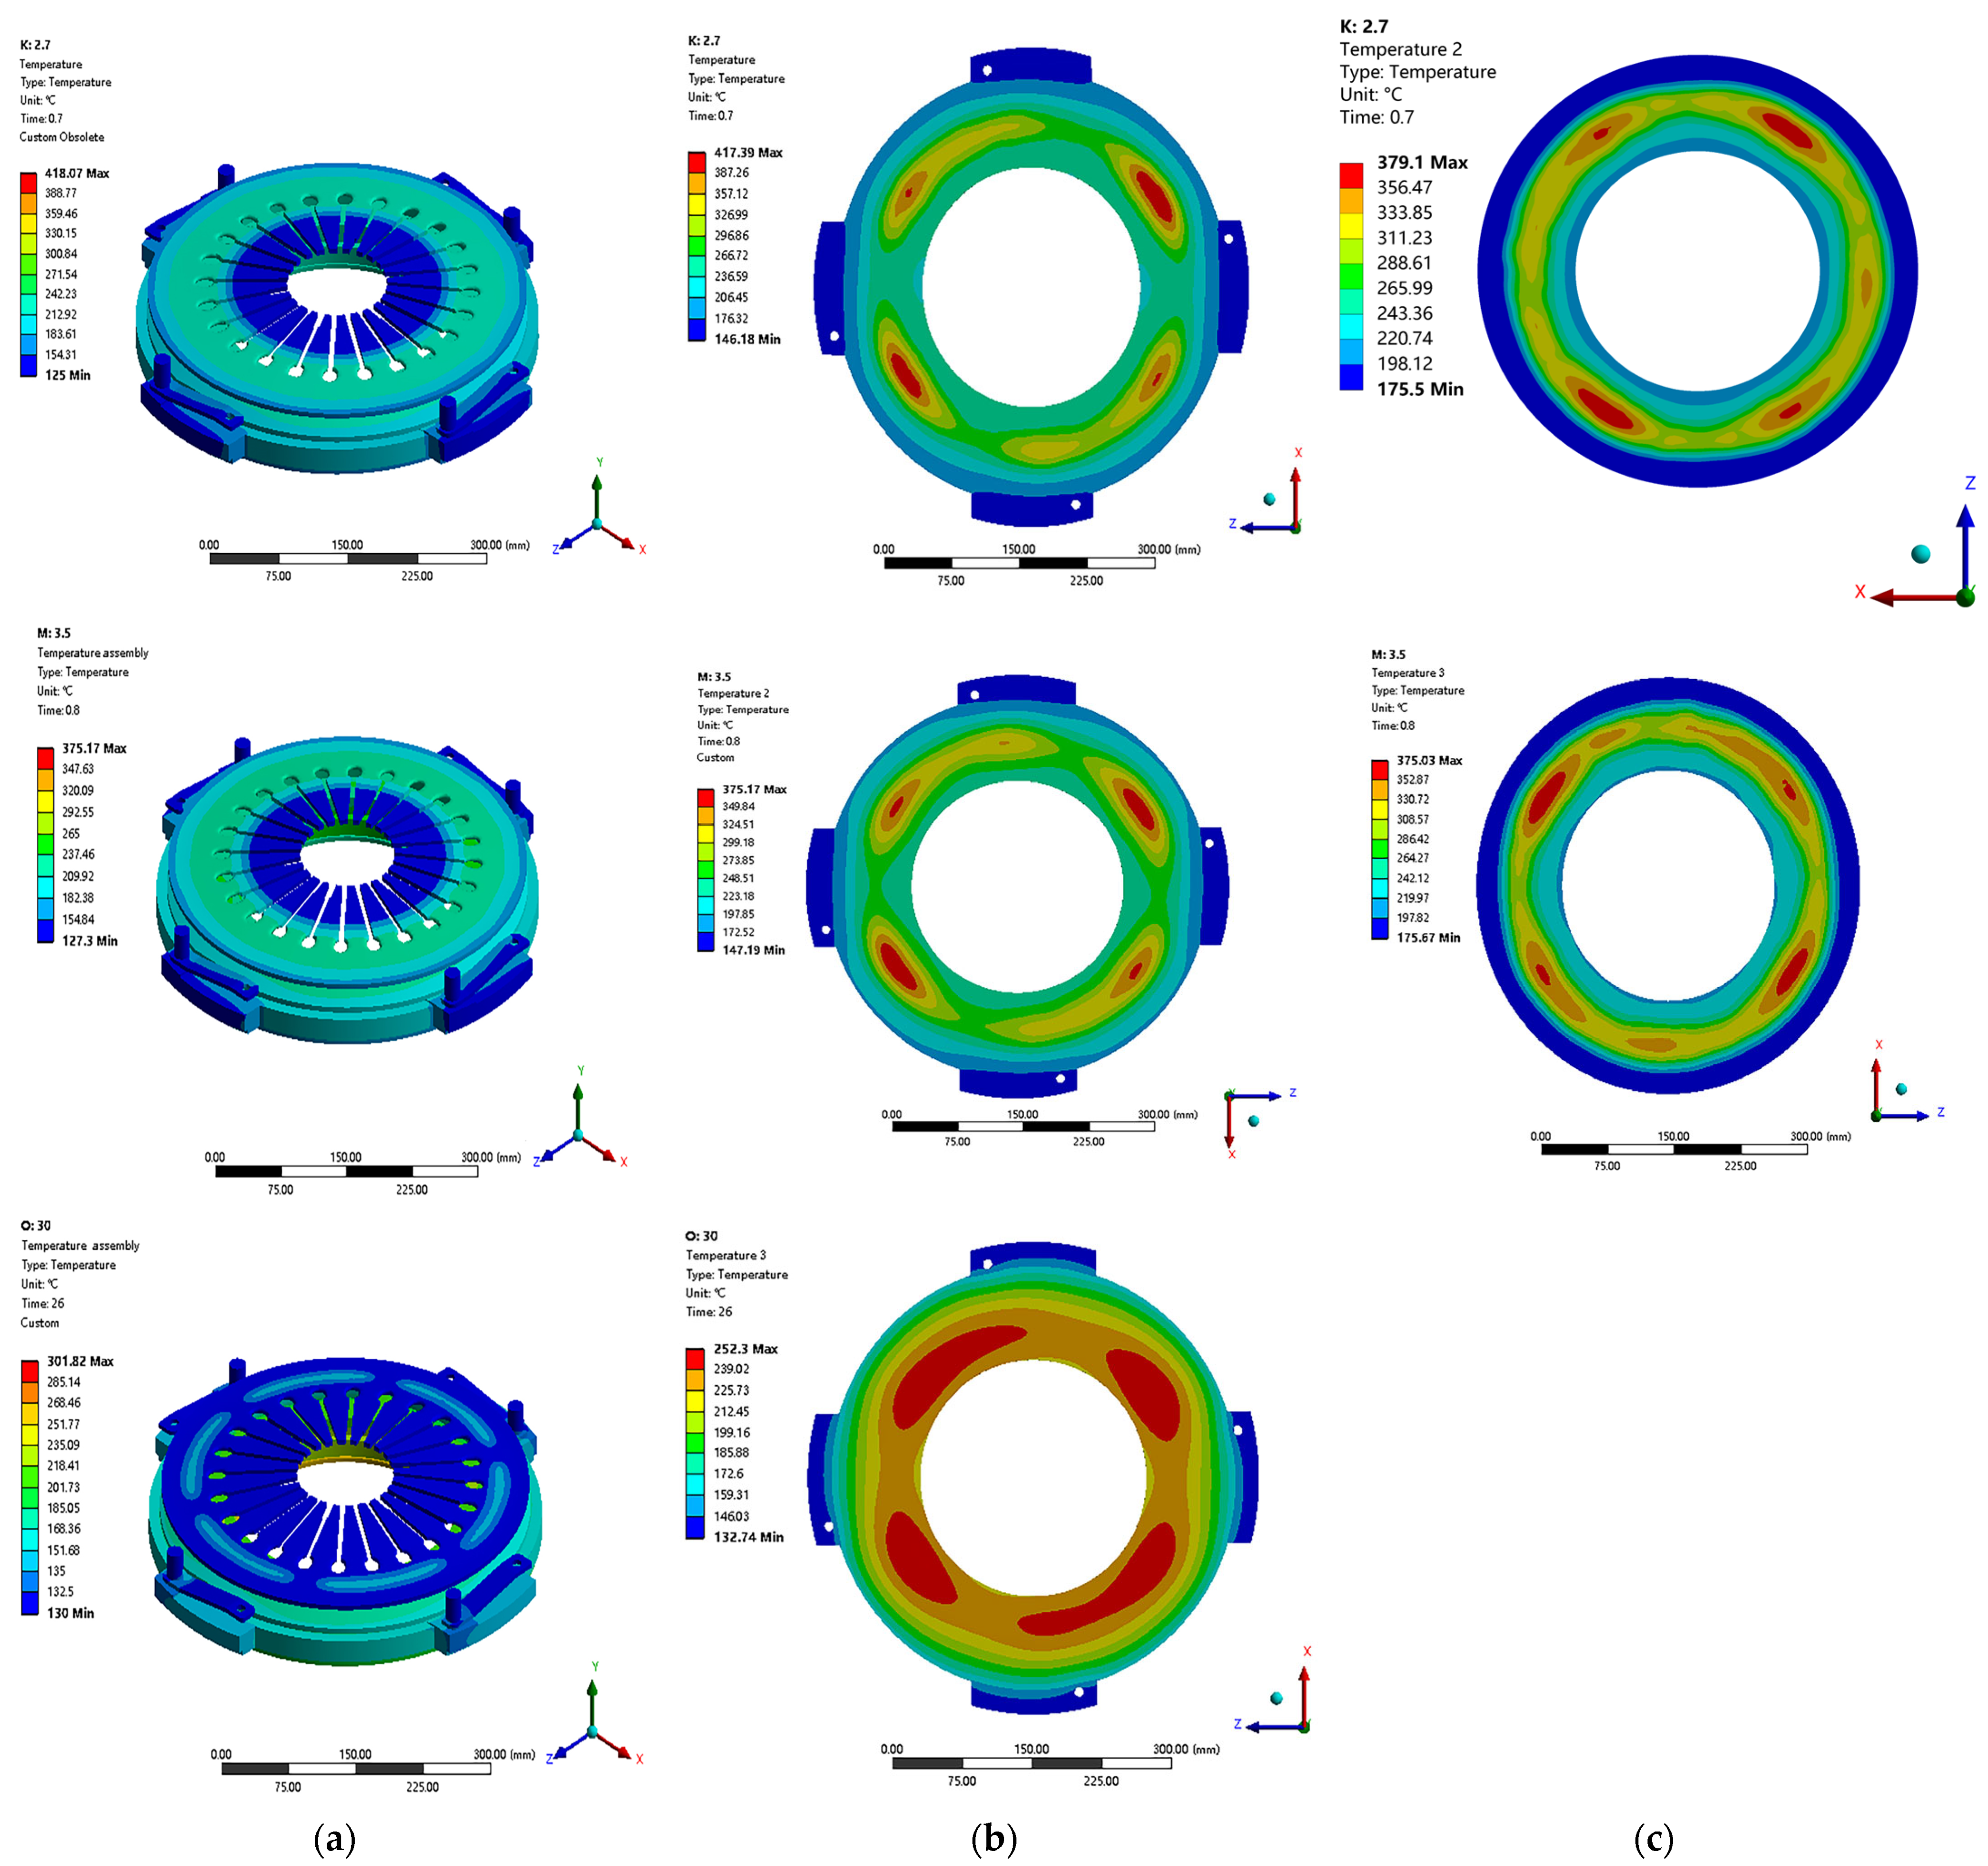
4.2. Temperature Field of the Clutch Assembly during the Last Engagement

In the last engagement-disengagement process, namely the 45th cycle, the temperature of the assembly is above 350 °C. Consequently, the contact pressure distribution on the friction surface of the pressure plate is mainly concentrated at the middle diameter position, while the outer and inner diameters do not make contact due to the curved thermal deformation. The following Figure 14 illustrates the contact gap (a) and contact pressure (b) contour plots on the friction surface of the pressure plate during the last engagement-disengagement process. These display a non-uniform distribution of contact pressure on the friction surface of the pressure plate, directly resulting in a non-uniform heat flux density distribution on the friction surface.
The temperature field distribution of the assembly during the last engagement is shown in Figure 15. It can be observed that after undergoing 45 consecutive engagement and disengagement processes, the overall temperature of the dry clutch assembly greatly increases. The middle-diameter region of the pressure plate friction surface exhibits a significant high temperature. Correspondingly, the friction disc friction surface also shows a higher temperature in that area. The temperature rises in the outer diameter regions of both the pressure plate and the friction disc, which are relatively small. In the final engagement and disengagement process, the peak temperature reaches 426.43 °C. Even after 26 s of heat dissipation during disengagement, the highest temperature remains at 301.82 °C.
Figure 16 shows the temperature profiles of the simulation and the test for the last cycle at the points of (a) the inner diameter, (b) the middle diameter, and (c) the outer diameter, respectively. It can be seen from Figure 16 that for these three monitor points, the temperatures of the simulation agree well with those of the test generally.
Table 5 shows the comparison of the temperature between the simulation model and the test rig for the 45th engagement and disengagement processes. It can be seen from Table 5 that for the last engagement-disengagement process, the temperature difference at the outer diameter point of the pressure plate reaches a maximum of 9.31 °C with a relative deviation of 4.99%. The average deviations of the simulated results for the outer, middle, and inner diameter monitoring points are 1.98%, 0.88%, and 1.05%, respectively. By analyzing both the initial low-temperature process and the final high-temperature process, it can be concluded that the simulated temperature curves for the three monitoring points exhibit high fitting accuracy.

5. Conclusions

(1)
To compromise the issues of long-term simulation and high model accuracy in clutch assembly temperature modeling, a numerical simulation method based on CFD simulation and decoupling theory is proposed. Firstly, the convection boundary conditions between the clutch assembly and the ambient air are determined using a fluid-thermal bidirectional coupling method for the sake of high precision. Subsequently, a thermal-solid multi-stage decoupling method is employed to achieve long-term simulation. Applying the approach, the temperature of the dry clutch assembly during the continuous engagement-disengagement process is measured.
(2)
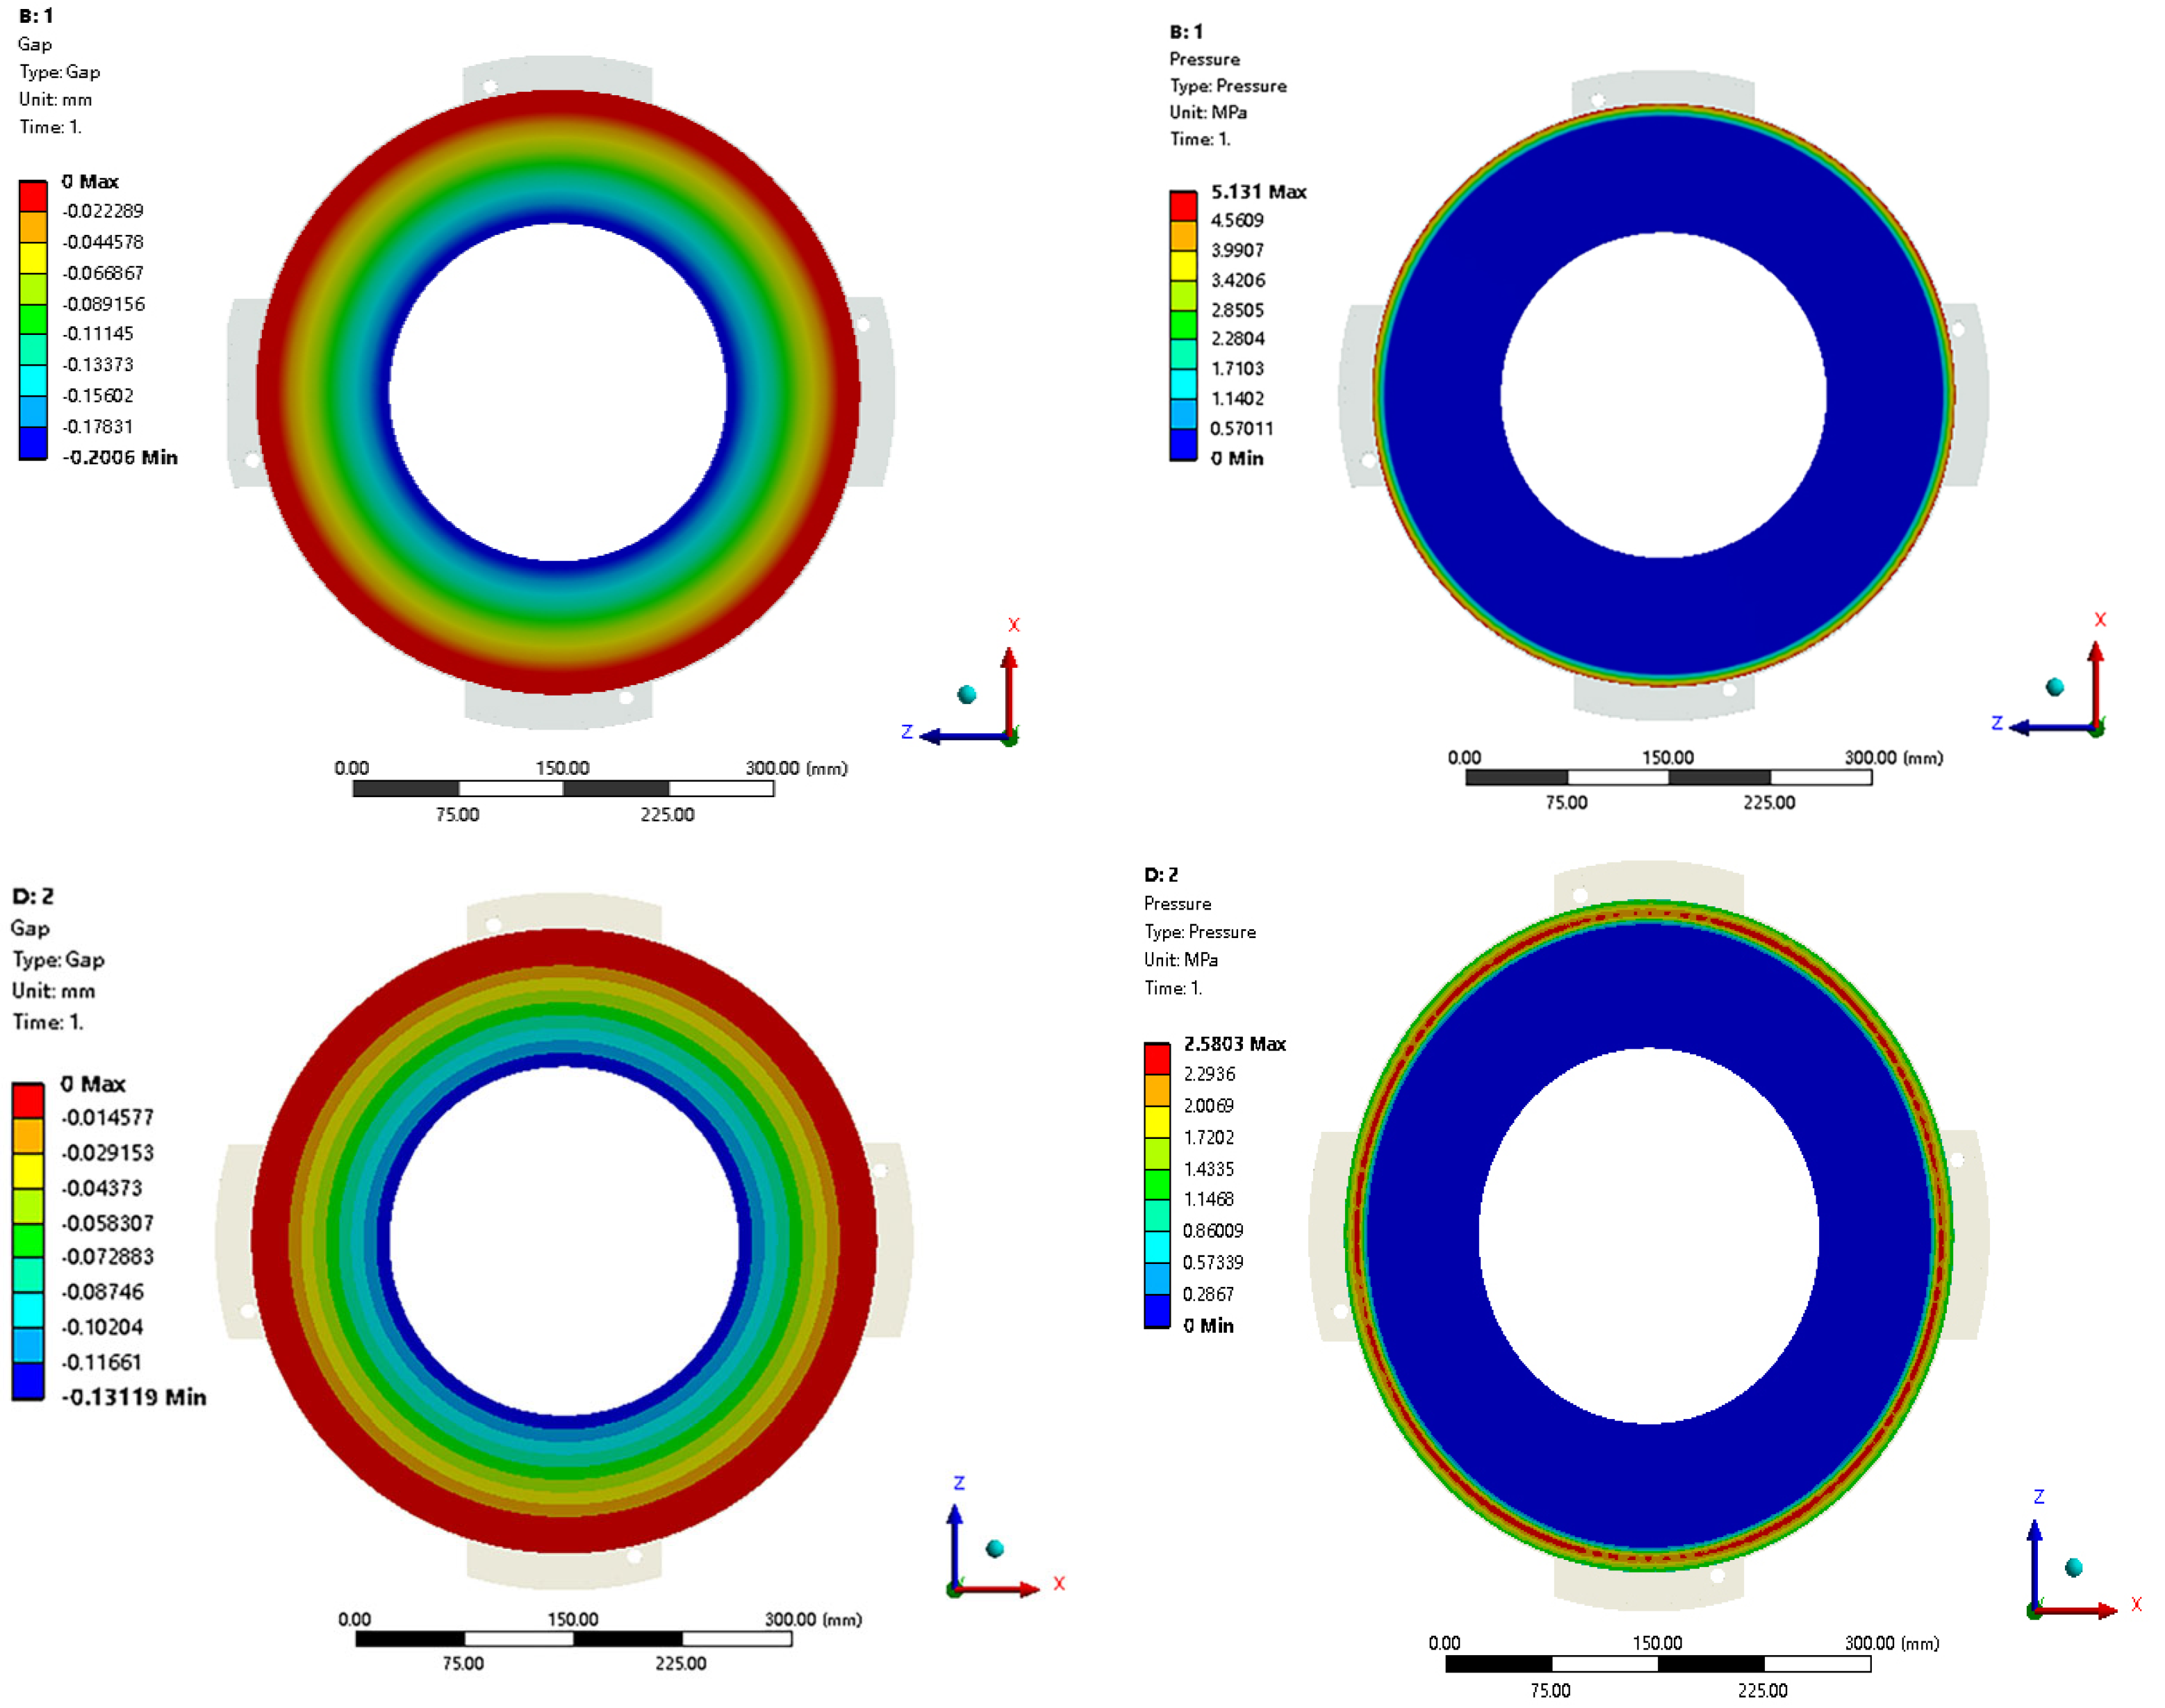
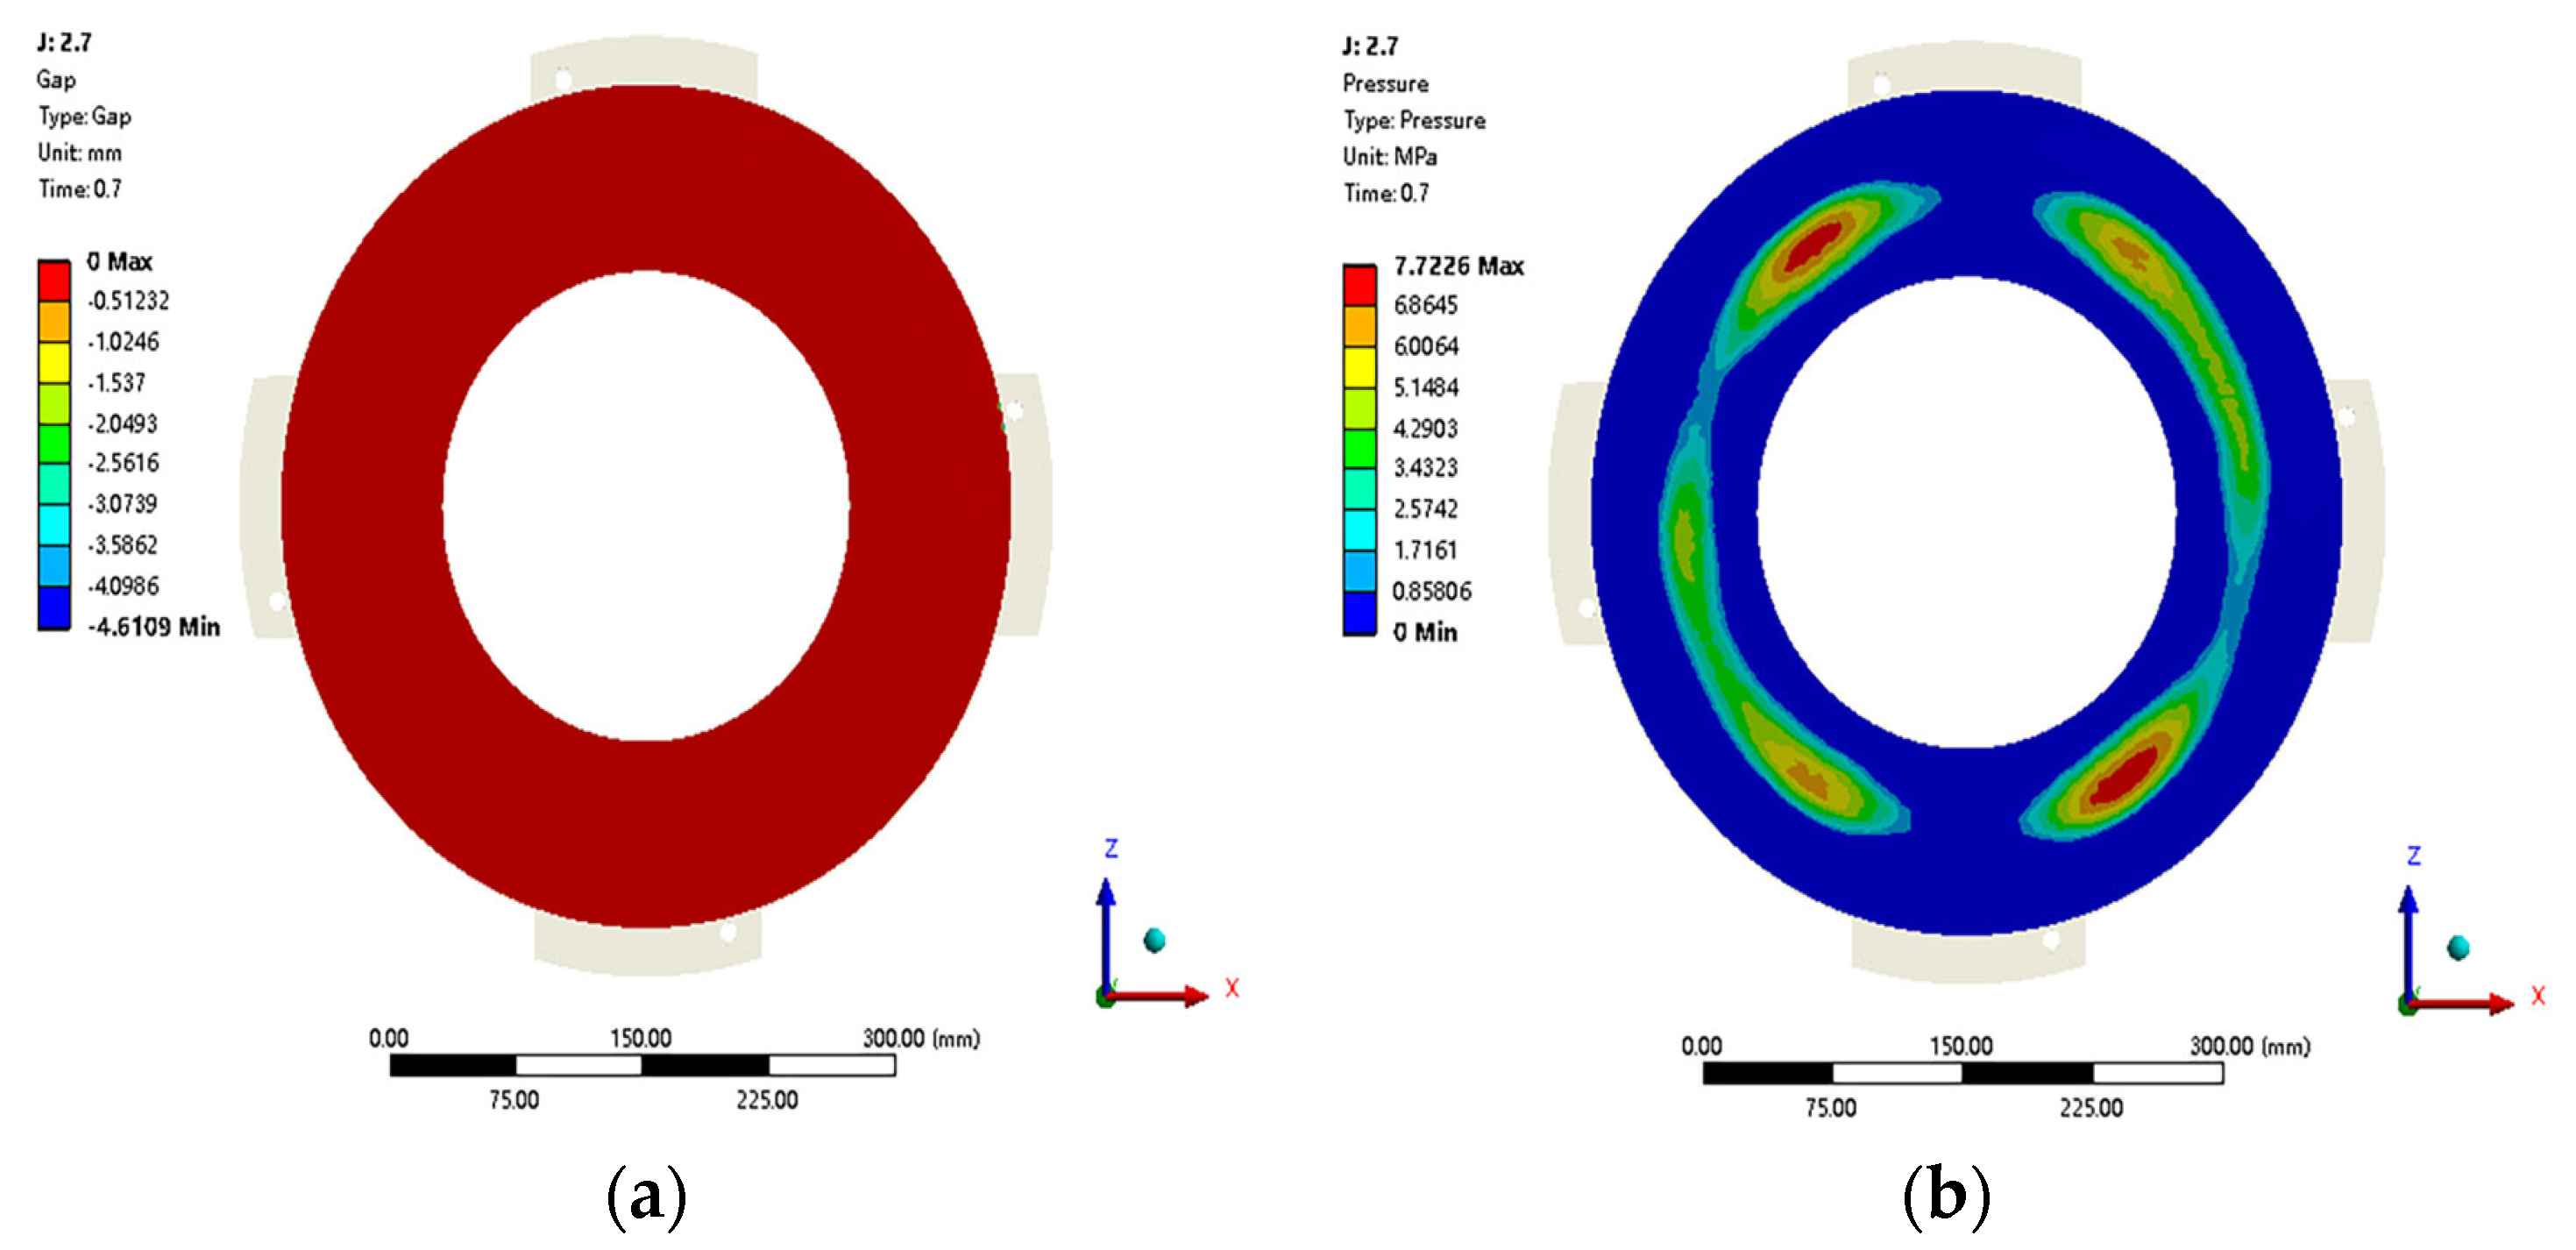
During the continuous engagement-disengagement process, the distribution of contact between the friction surfaces of the clutch changed from the outer diameter area to the middle diameter area of the surfaces, which in turn affects the temperature distribution on the friction surface. With the continuous engagement-disengagement cycles increasing, the initial concave state of the pressure plate surface transitions to a convex state, resulting in significant deformation and warpage of the pressure plate’s outer diameter.
(3)
The contact pressure, thermal conductivity, and thermal deformation of the pressure plate are coupled to each other. Using the approach proposed, the temperature of the model agrees well with that of the rig test at the outer, middle, and inner diameters of the pressure plate. The average deviations in the last cycle (45th cycle) of the engagement process are 1.98%, 0.88%, and 1.05% for the outer, middle, and inner diameters, respectively. This indicates that the accuracy of the model is higher while the long-term time scale (up to 30 s) of the temperature distribution of the dry clutch assembly is achieved.
(4)
This article did not consider the transient processes during the engagement and disengagement of the clutch, only presenting a static Coulomb friction model. This represents one of the main limitations of the model under consideration, and further research is needed in the future.

Author Contributions

Writing—original draft, J.Y.; Writing—review & editing, J.C. and Y.G. All authors have read and agreed to the published version of the manuscript.

Funding

The authors gratefully acknowledge the financial support for this work from the National Natural Science Foundation of China (NSFC) (No.51965012).

Institutional Review Board Statement

Not applicable.

Informed Consent Statement

Not applicable.

Data Availability Statement

The data for this project is confidential and cannot be disclosed.

Conflicts of Interest

The authors declare no conflict of interest.

References

  1. Abdullah, O.I.; Schlattmann, J. Thermal behavior of friction clutch disc based on uniform pressure and uniform wear assumptions. Friction 2016, 4, 228–237. [Google Scholar] [CrossRef]
  2. Abdullah, O.I.; Schlattmann, J.; Majeed, M.H.; Sabri, L.A. The temperatures distributions of a single-disc clutches using heat partitioning and total heat generated approaches. Case Stud. Therm. Eng. 2018, 11, 43–54. [Google Scholar] [CrossRef]
  3. Gong, Y.; Ge, W.; Yi, Y.B. Finite element analysis of thermal buckling characteristics of automotive 430 dry clutch pressure plate. Int. J. Veh. Des. 2018, 78, 108–130. [Google Scholar] [CrossRef]
  4. Wang, Q.; Wang, J.; Cui, H.; Wang, J.; Zhang, F. Numerical investigation into thermal buckling of friction pairs in hydro-viscous drive under nonlinear radial temperature distribution. Proc. Inst. Mech. Eng. Part J J. Eng. Tribol. 2022, 36, 1081–1090. [Google Scholar] [CrossRef]
  5. Gong, Y.; Wang, P.; Ge, W.; Yi, Y.-B. Numerical simulation and mechanism analysis on the concave deformation of automotive dry clutch pressure plate. Appl. Sci. 2019, 9, 5017. [Google Scholar] [CrossRef]
  6. Yu, L.; Zheng, C.; Wang, L.; Wu, J.; Jia, R. Influences of the Contact State between Friction Pairs on the Thermodynamic Characteristics of a Multi-Disc Clutch. Materials 2022, 15, 7758. [Google Scholar] [CrossRef] [PubMed]
  7. Muhammad, M.J.A.; Abdullah, O.I.; Josef, S. Transient thermoelastic analysis of dry clutch system. Mach. Des. 2013, 5, 141–150. [Google Scholar]
  8. Abdullah, O.I. Stresses and deformations analysis of a dry friction clutch system. Tribol. Ind. 2013, 35, 155–162. [Google Scholar]
  9. Pisaturo, M.; Senatore, A. Simulation of engagement control in automotive dry-clutch and temperature field analysis through finite element model. Appl. Therm. Eng. 2016, 93, 958–966. [Google Scholar] [CrossRef]
  10. Ovchinnikov, A.V.; Chernova, S.A.; Pavlov, V.A. Heat transfer in the friction elements of automotive clutches. simulation and experimental study. J. Phys. Conf. Ser. 2019, 1297, 012060. [Google Scholar]
  11. Ding, H.; Cai, S.; Zhang, Y.; Xu, H. Transient temperature field simulation of continuously variable transmission clutch. Int. J. Automot. Technol. 2020, 21, 57–65. [Google Scholar]
  12. Meng, F.; Xi, J. Numerical and experimental investigation of temperature distribution for dry-clutches. Machines 2021, 9, 185. [Google Scholar] [CrossRef]
  13. Zhao, H.; Lin, X.; Liu, R.; Chen, J.; Li, Z.; Xiong, X.; Liao, N. Frictional Temperature Field Study of Three Brake Rings with Copper-based Friction Material Pair. J. Powder Metall. Mater. Sci. Eng. 2022, 27, 129–139. [Google Scholar]
Figure 1. The test bench equipment.
Applsci 13 11165 g001
Figure 2. Installation diagram of the clutch assembly with the thermal couples.
Applsci 13 11165 g002
Figure 3. Temperature profile of three channels of group A during the 1400 s engagement and disengagement test.
Applsci 13 11165 g003
Figure 4. Fluid domain of the dry clutch assembly.
Applsci 13 11165 g004
Figure 5. Model mesh.
Applsci 13 11165 g005
Figure 6. Mesh of clutch (front view).
Applsci 13 11165 g006
Figure 7. Mesh of clutch (rear view).
Applsci 13 11165 g007
Figure 8. Thermal-structure decoupling flow.
Applsci 13 11165 g008
Figure 9. Boundary condition.
Applsci 13 11165 g009
Figure 10. Temperature monitoring points on pressure plate.
Applsci 13 11165 g010
Figure 11. Contact gap (a) and contact pressure contour plot (b) on the friction surface of the pressure plate during the first engagement.
Applsci 13 11165 g011aApplsci 13 11165 g011b
Figure 12. Temperature field contour maps of the first simulation model. (a) the temperature contour map of the dry clutch assembly. (b) the temperature contour map of the pressure plate’s friction surface. (c) the temperature contour map of the friction disc’s friction surface.
Applsci 13 11165 g012aApplsci 13 11165 g012b
Figure 13. Temperature profiles of the simulation and the test for the first cycle at the points of (a) the inner diameter, (b) the middle diameter, and (c) the outer diameter, respectively.
Applsci 13 11165 g013
Figure 14. Contact gap map (a) and contact pressure map (b) on the friction surface of the pressure plate during the last engagement sliding phase.
Applsci 13 11165 g014aApplsci 13 11165 g014b
Figure 15. Temperature field of the clutch during the 45th engagement. (a) the temperature contour map of the dry clutch assembly. (b) the temperature contour map of the pressure plate’s friction surface. (c) the temperature contour map of the friction disc’s friction surface.
Applsci 13 11165 g015aApplsci 13 11165 g015b
Figure 16. Temperature profiles of the simulation and the test for the last cycle at the points of (a) the inner diameter, (b) the middle diameter, and (c) the outer diameter, respectively.
Applsci 13 11165 g016
Table 1. Test sample details for the 5th thermal load test.
Clutch Cover AssemblyDriven Plate Assembly
Pressure Plate
Weight (kg)
Pressure Plate
Outer Diameter (mm)
Pressure Plate
Inner Diameter (mm)
Clamping Force (N)Friction
Material
Driven Plate Outer Diameter (mm)
28.5430Φ24036,000B8090240
Table 2. Detailed dimensions of key components in the clutch assembly.
ComponentInner Diameter R1 (mm)Outer Diameter R2 (mm)Thickness a (mm)
Pressure Plate120216.539
Friction Disc1202155
Table 3. Material parameters of components in the clutch assembly.
ComponentsPressure PlateFriction DiscFriction DiscDrive PlateRivets/Bolts
Material NameHT250Fiction plate51Crv465MnHT250
Density (kg/m3)72002595786078507200
Young’s Modulus (Pa)1.1 × 10111.5 × 1092.07 × 10112 × 10111.1 × 1011
Poisson’s Ratio0.260.250.290.30.26
Thermal Expansion
Coefficient (°C−1)
1.1 × 10−51.5 × 10−51.1 × 10−51.2 × 10−51.1 × 10⁻⁵
Table 4. Comparison of simulated and test temperature results for the first engagement.
ConditionsEngagement + Synchronization StageDisengagement Stage
Monitoring
Point
Outer Diameter Point
Time/s0.51.01.52.02.53.08.013.018.023.028.0
Measured Temperature/°C17.6822.3349.4389.73100.19100.8752.9341.2836.4533.1131.27
Simulated Temperature/°C17.6522.6851.9790.7395.0596.2553.1939.3033.0929.7327.68
Temperature Difference/°C0.030.352.541.005.144.620.261.983.363.383.59
Deviation%0.171.575.141.115.134.580.494.809.2210.2111.48
Monitoring
Point
Middle Diameter Point
Measured Te-mperature/°C15.8917.819.4122.8726.7227.8824.2421.5721.8521.3621.73
Simulated Te-mperature/°C16.2116.6417.7121.5925.2628.0925.4024.5923.9423.4723.14
Temperature Difference/°C0.321.161.701.281.460.211.163.022.092.111.41
Deviation%2.016.528.765.605.460.754.7914.009.579.886.49
Monitoring
Point
Inner Diameter Point
Measured Temperature/°C19.5519.3919.6920.6921.4522.2922.6821.2121.8422.4922.12
Simulated Temperature/°C19.3319.0818.2118.0418.3218.9919.6020.2320.7621.1921.54
Temperature Difference/°C0.220.311.482.653.133.33.080.981.081.30.58
Deviation%1.131.607.5212.8114.5914.8013.584.624.955.782.62
Table 5. Comparison of the simulated and test temperature data for the final engagement.
ConditionsEngagement + Synchronization StageDisengagement Stage
Monitoring PointOuter Diameter Point
Time/s0.51.01.52.02.53.08.013.018.023.028.0
Measured
Temperature/°C
179.45181.53190.64193.08193.54193.04186.58183.74182.48181.22181.06
Simulated
Temperature/°C
178.42181.35186.98194.51197.12198.52195.89191.50187.62184.03180.70
Temperature
Difference/°C
1.030.183.661.433.585.489.317.765.142.810.36
Deviation%0.570.101.920.741.852.844.994.222.821.550.20
Monitoring PointMiddle Diameter Point
Measured
Temperature/°C
247.53267.7332.89349.76351.36345.98295.91275.67263.44256.41250.36
Simulated
Temperature/°C
248.01268.77332.00349.88350.55339.96293.93273.60261.21251.71243.67
Temperature
Difference/°C
0.481.070.890.120.816.021.982.072.234.706.69
Deviation%0.190.400.270.030.231.740.670.750.851.832.67
Monitoring PointInner Diameter Point
Measured
Temperature/°C
229230.01237.43242.55244.61246.25243.67238.78237.55234.41234.75
Simulated
Temperature/°C
229.89232.09235.24240.06241.84242.90244.04243.18241.33238.72235.58
Temperature Difference/°C0.892.082.192.492.773.350.374.43.784.310.83
Deviation%0.390.900.921.031.131.360.151.841.591.840.35
Disclaimer/Publisher’s Note: The statements, opinions and data contained in all publications are solely those of the individual author(s) and contributor(s) and not of MDPI and/or the editor(s). MDPI and/or the editor(s) disclaim responsibility for any injury to people or property resulting from any ideas, methods, instructions or products referred to in the content.

