1. Introduction
The cyber hierarchy and interactional network (CHAIN) concept-based full-lifespan management method provides a new idea for carbon neutralization and carbon peaking, which enables integrated solutions at both the macro application scenario and micro mechanism levels [
1]. At the micro level corresponding to the vehicle itself, electric propulsion systems as secondary energy sources are added to conventional internal combustion engine (ICE)-based powertrain systems to form hybrid electric vehicles (HEVs) or plug-in hybrid electric vehicles (PHEVs) [
2,
3]. In these hybrid powertrains, the secondary energy sources can assist ICEs to always run in the high efficiency area and can improve the dynamic performance of the vehicles [
4,
5,
6,
7,
8]. Consequently, benefiting from such powertrain configurations, dependence on fossil fuels is reduced and thus less exhaust gas will be emitted, which will lead to a cleaner transportation system.
However, how to achieve an approximate global solution, as well as to provide sufficient energy according to changeable external power requirements, remains a great challenge for HEVs/PHEVs [
9,
10,
11,
12,
13,
14,
15,
16,
17,
18,
19,
20,
21,
22,
23,
24,
25,
26]. One of the most important reasons for this is the uncertainty of macroscopic physical boundary conditions, i.e., future driving behavior according to traffic environment judgments [
27,
28,
29,
30,
31,
32,
33,
34].
Based on the CHAIN concept, solutions can be sought from a new perspective at the macro level, i.e., using the macro continuous traffic flow method, which takes the transportation system as a whole. Macro flow models use the average value (e.g., the spatial average speed of continuous vehicles) in sampling, in which the most suitable q–k or u–k relationship is established by statistical regression. Thus, it is more suitable for large-scale driving behavior prediction than microscopic car following models, which have too many unknown factors and require a large amount of calculation. The results of macro flow models are certainly more stable, since the average parameter value is estimated by the average sample, which is not only easier for the collection of data, but also more consistent with the basic statistical assumptions in model calibration. Spiliopoulou et al. calibrate two well-known macroscopic traffic flow models, i.e., the first-order model CTM (Cell Transmission Model) and the second-order model METANET (Modéle d’Écoulement de Trafic sur Autoroute NETworks), based on various real traffic data, by three optimization algorithms: the deterministic Nelder–Mead algorithm, a stochastic genetic algorithm and the stochastic cross-entropy method, respectively. These resulting models are validated and able to converge in robust model parameter sets, albeit achieving different levels of accuracy [
35]. Poole et al. calibrate a macroscopic traffic flow model by determining the density and speed equation parameters with fundamental diagram parameter variation. Through the model calibration, using data from three different days for a motorway section, it is shown that properly selected data are capable of capturing the underlying dynamics of the traffic flow process [
36]. In the future, automatic vehicles can be controlled by a servo-mechanism, and driving behavior can be intervened upon and optimized, which can reduce or correct unreasonable driving behavior. At the same time, this can improve the predictability, orderliness and regularity of the system, and reduce random, uncertain driving behavior, which further improves the practical value of the macro traffic model.
In reality, driving behavior is sometimes in an unsteady state (i.e., acceleration and deceleration) and sometimes in a steady state (i.e., constant speed). The former state changes greatly, and it is difficult to accurately describe unsteady behavior in car following, even with a high-order macro model. Instead, the car following theory at the micro level is suitable for the description of car following behavior in the unsteady state, in which rules concerning how a driver follows his immediate leading vehicle are established. The car following theory attempts to describe driving behavior in detail at the micro level and is directly related to the driver’s safety, providing a solution to overcome the defects of the macro traffic flow [
37,
38,
39,
40,
41]. Many classic car following models have been proposed, including the intelligent driver model (IDM), the Gazis–Herman–Rothery (GHR) model, the full velocity difference (FVD) model, etc., which have been widely explored and have made great contributions to traffic theory.
Although macroscopic models (i.e., continuum methods) excel at large-scale traffic simulation with aggregated behavior, agent-based traffic simulations (i.e., microscopic models) excel at the modeling of individual vehicles with inhomogeneous governing behaviors, so Sewall et al. [
42] combined these two types of approaches and proposed a hybrid method to take advantage of these complementary features. Their approach simulates traffic in the areas of interest using an agent-based model, while the rest areas use a continuum model. On adjoining regions of a road network, vehicles passing from one regime to another must be converted to the representation used in the destination regime. They introduce flux capacitors to convert continuum flow to discrete agents, and use car averaging to handle discrete vehicles that flow into continuum regions. Hybrid models can combine mesoscopic models with microscopic or macroscopic models, as well as mixed-class and multi-class models. More valuable results can be obtained by combining ideas from different branches, as well as combining the advantages of different types of model [
43].
Micro traffic models represented by car following models can be applied to the development of a vehicle’s autonomous intelligent cruise control system (AICCS) [
44] and autonomous cruise control system (ACCS) [
45,
46], etc., to ensure more efficient and stable movement of connected automatic control vehicles.
However, to the best of our knowledge, few studies have considered the collaborative optimization control of the physical process, from the macro large-scale traffic system to the vehicle level of the micro subsystem. The purpose of this paper is to propose a CHAIN concept energy management strategy for hybrid electric vehicles under large scale macroscopic boundary conditions, which enables seamless and smooth combination from macro to micro.
A global energy planning method from the perspective of multi-scale mixed traffic management is proposed in this paper, where a macro traffic flow model is adopted at a large time scale and a corresponding car following model is used at a micro scale. In addition, energy trajectory replanning is carried out, when the expected driving behavior details at the micro scale change due to increase of uncertainty or information entropy. This novel method is suitable for system management from the macro traffic scenario to micro mechanism levels, taking the intelligent transportation system as the object, e.g., global energy management in the full temporal–spatial domain for plug-in hybrid electric vehicles.
2. Macro–Micro Physical Processes of Traffic Management
2.1. Multi-Scale Mixed Traffic Modeling
As a physical interface between the macro physical environment and the micro physical process, the vehicle provides a way for macro physical boundaries to control micro physical processes cooperatively. In this paper, a multi-scale mixed traffic-based model for predictive control of plug-in hybrid electric vehicles is developed for the collaborative optimization control from the macro physical boundary to the micro physical boundary, during the process of state change of the physical interface described by PHEV/HEV vehicles. In this method, a macro traffic flow model is adopted at the large time scale and a corresponding car following model is used at the micro scale.
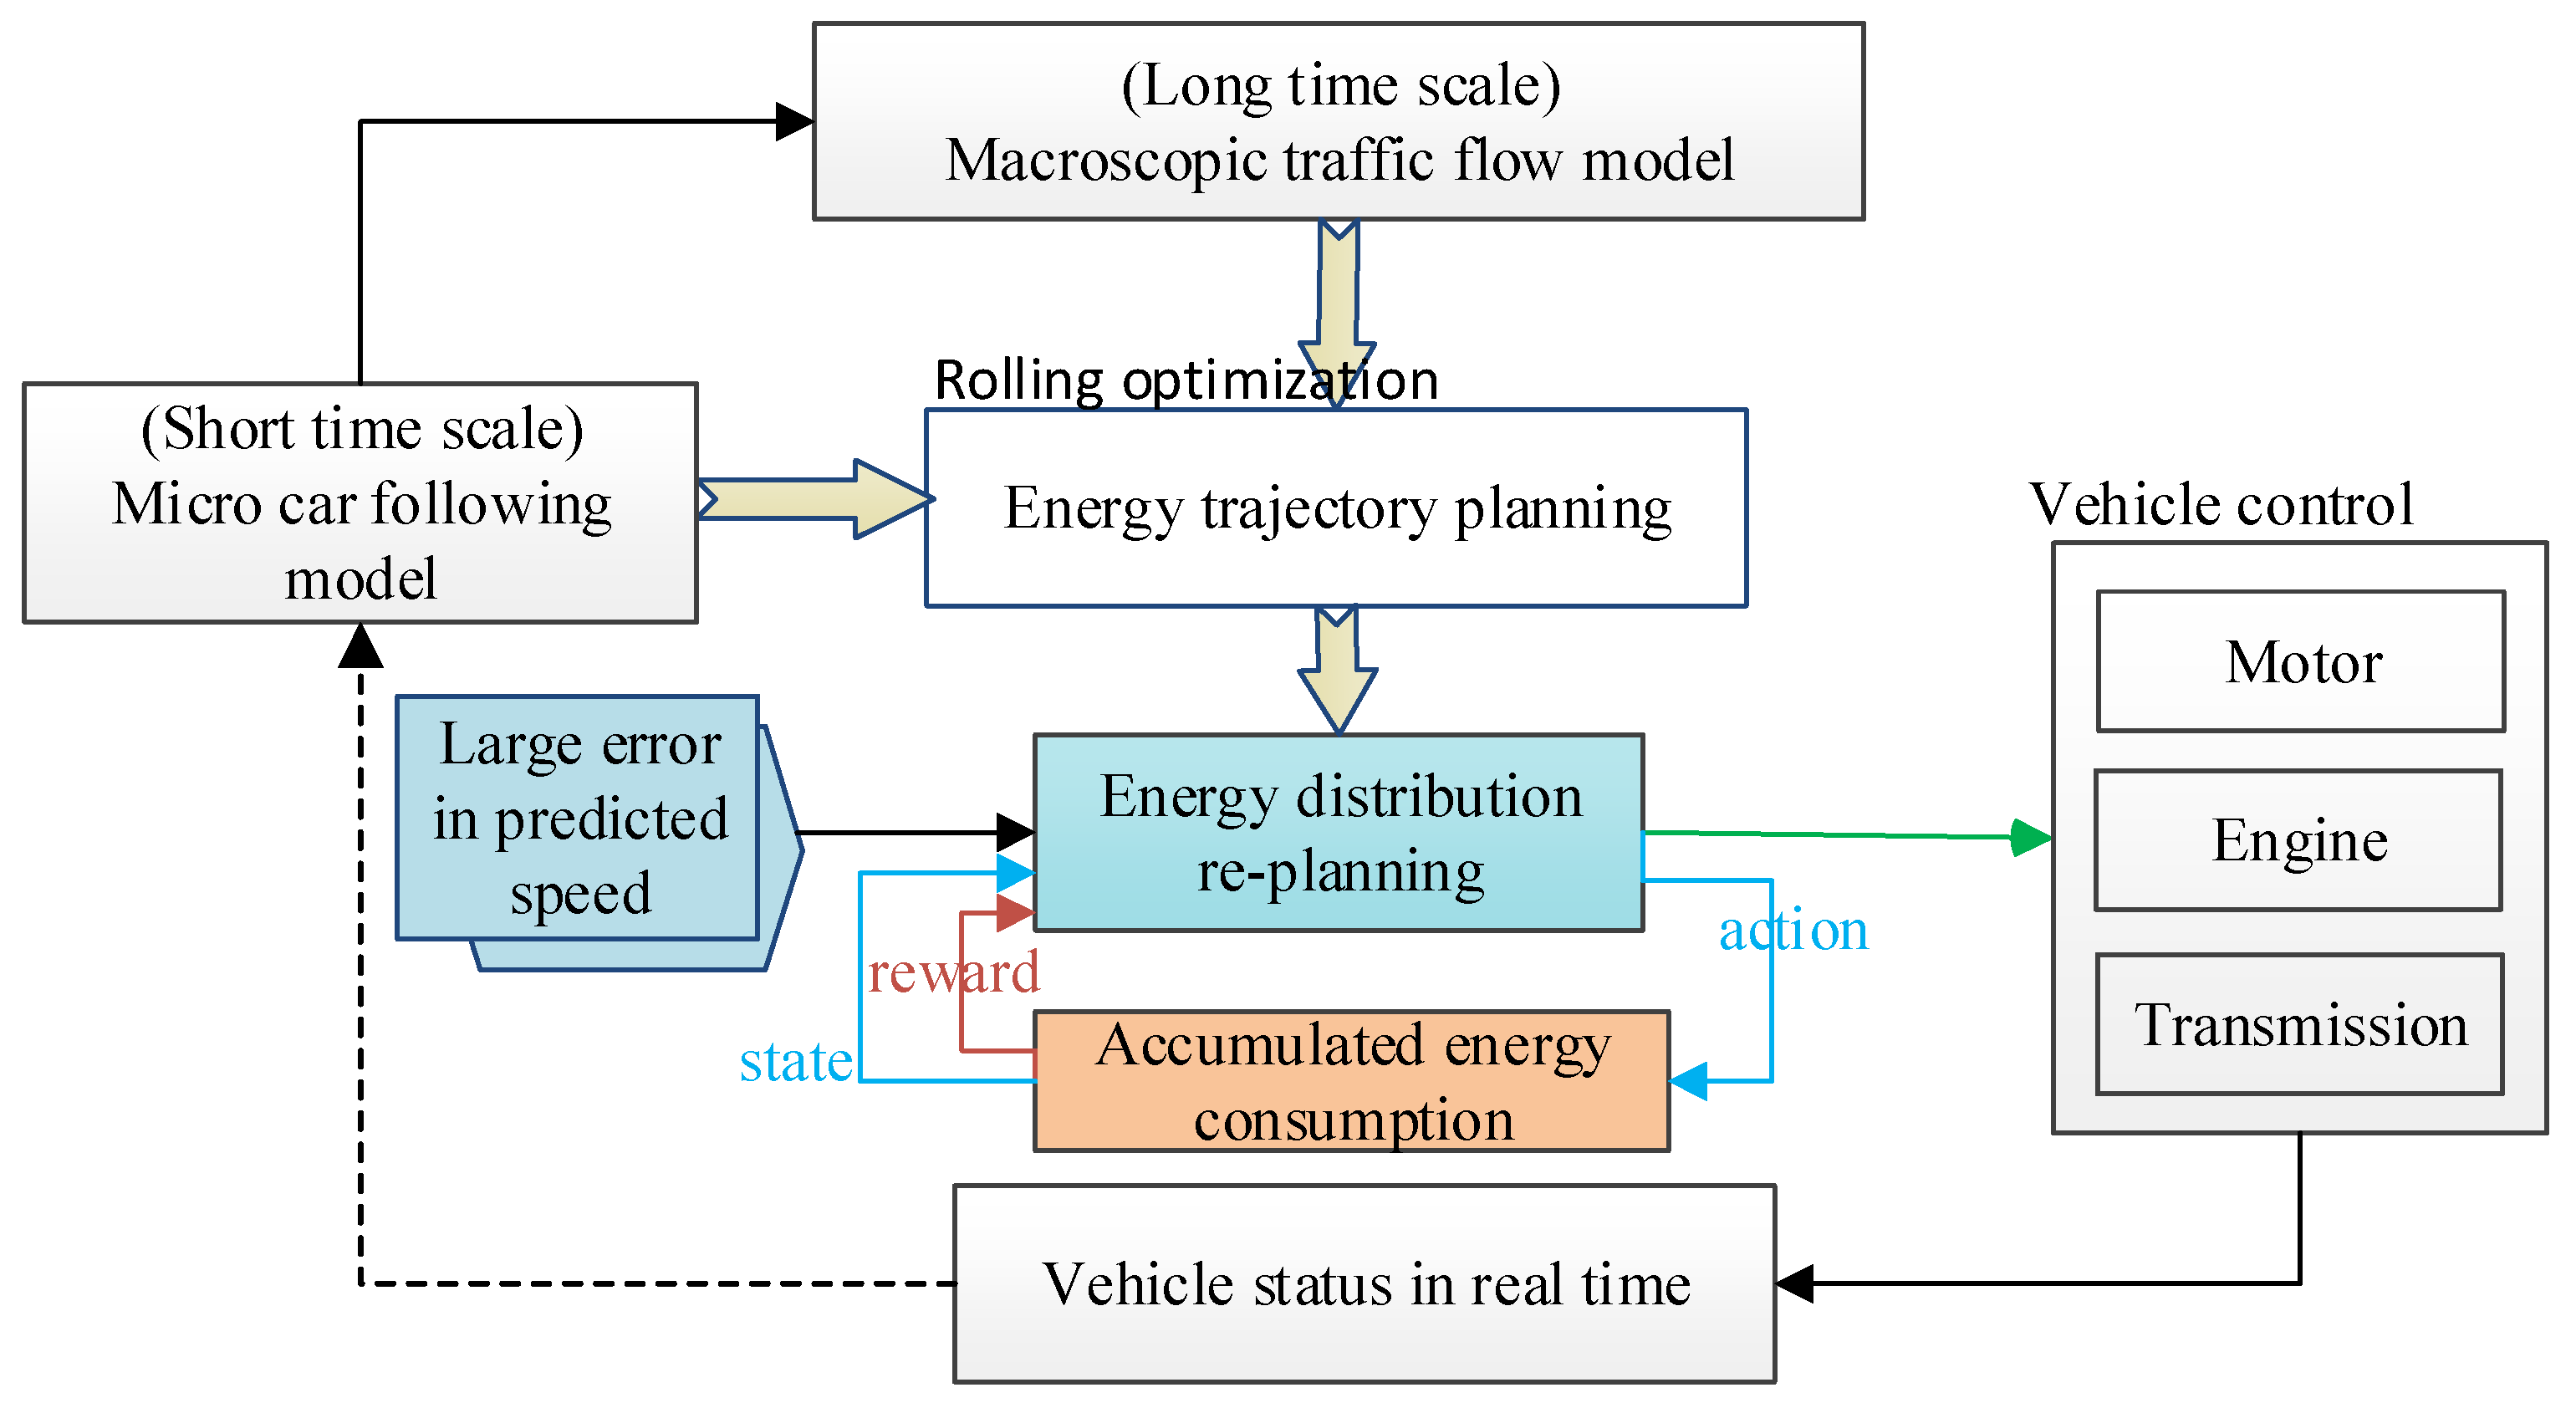
Figure 1 and
Figure 2 show the schematic of the multi-scale physical process management system. According to the future driving behavior predicted by the physical model from macro traffic flow to micro car following behavior, the energy distribution of the motor and engine belonging to the micro physical process can be optimized for plug-in hybrid electric vehicles. Moreover, when the actual speed is greatly different from the predicted speed in advance (e.g., due to a change in the traffic environment), energy distribution is locally replanned.
The specific treatment process for the multi-scale physical processes management system is as follows:
Step 1: Establishing the multi-scale traffic model
A multi-scale traffic model is used to predict the future driving behavior for optimizing energy distribution of plug-in hybrid electric vehicles. In this method, a macro traffic flow model is adopted to predict the future driving behavior at a long time scale, and a corresponding car following model is used at a short time scale.
- (a).
The macro traffic flow model derived from a micro car following model
In order to ensure the smooth transition between the macro traffic flow model and the micro car following model in time scale, the selected car following model needs to have a one-to-one correspondence in a steady state with the macro flow model. In order to achieve this goal, the macro model was derived from the micro car following model.
Future driving behavior at the short time scale can be calculated by a micro car following model of full velocity difference form, as follows [
47]:
This model considers the effects both of the distance and the relative speed of two successive vehicles, and many classical car-following models (e.g., the OVM) are special cases of this model.
In order to deduce the macroscopic traffic model, the microscopic variables of the car-following model can be transferred to the macroscopic variables as follows:
where
T is the relaxation time and
is the time needed for the backward propagated disturbance to travel a distance of
.
Unlike other researchers, we added the physical driving resistance term
, including rolling resistance, slope resistance, air resistance and acceleration resistance, into the car-following model (Equation (1)) to consider its impact on driving behavior, which can be rewritten as:
The motion equation for the high-order macroscopic traffic flow can be written as
where
,
are the nth vehicle’s velocity and headway at time
t (
is the
nth vehicle’s position),
k is the reaction time, and
V (·) is the optimal velocity function, respectively.
The conservation equation for the macro continuum traffic flow models is in the following form:
where
q is the generation rate and is set to 0 for simplification.
The macroscopic traffic flow model consists of Equations (4) and (6).
- (b).
The multi-scale mixed traffic model
In the multi-scale mixed traffic model proposed in this paper, the macro traffic flow model (Equations (4) and (6)) is used to calculate driving behavior for the long time scale, while the micro car following model (Equation (1)) is used for the short time scale. Therefore, the multi-scale mixed traffic flow model is in the following form:
Micro model of short time scale
Macro model of long time scale
Step 2: Establishing the vehicle dynamics model with the acceleration and velocity obtained in step 1 as the boundary conditions. With this model, the feasible working point set of the engine, motor and transmission system, which determine microphysical processes, can be obtained corresponding to the driving behavior in the prediction horizon of Step 1.
The structure of the PHEV vehicle used in this paper is shown in
Figure 3. The vehicle in this project has a single axle hybrid system, and thus the engine and motor have the same speed. The main parameters of the vehicle are shown in
Table 1.
With the acceleration and velocity obtained in Step 1, the required torque
TCVT and velocity ratio
iCVT of CVT transmission can be obtained according to the following formula:
where
is the transmission efficiency;
are the numerical ratios of the CVT and the final drive, respectively;
are the torque of CVT and brake system;
m is the vehicle weight;
is the rolling resistance coefficient;
is the road slope angle;
is the coefficient of rotational mass;
is the air density;
is the aerodynamic drag coefficient;
is the vehicle’s frontal area;
is the wheel radius; and
g is the gravitational acceleration.
The pump velocity n
HTC and pump torque
THTC of a hydraulic torque converter can be obtained by
K-factor and
C-factor [
48]:
The torque of the hydraulic torque converter is the coupling torque of the engine and the motor:
The engine efficiency, motor/generator efficiency and fuel consumption rate are obtained through the bench test:
where
are the engine’s torque and velocity; and
are the motor’s torque and velocity.
The fuel consumption can be calculated by the following formula based on the bench test data:
The motor/generator power and the
SOC changes are obtained as follows:
where
are the battery pack’s open circuit voltage, internal resistance, capacity and electric current respectively;
are the motor’s driving efficiency and generation efficiency; and
are constants.
Step 3: Rolling optimization of the feasible working point set of engine, motor and transmission system obtained in Step 2 for every time step, which dominate the micro process, including the chemical reaction of the engine and the electrochemical reaction of the battery. The state quantity x and control quantity u are defined as:
Considering the practicability of the energy management strategy, the constraints of state quantity and control quantity are as follows:
where
gCVT is gear position and
is the engine torque fluctuation.
The control variables are optimized within the above constraints, and the cost function of the multi-scale physical processes management is defined as:
where
is the time domain for prediction, and
are the weight coefficients for engine efficiency, the target SOC
r tracking and engine torque fluctuation.
The reference
SOCr is calculated according to the vehicle power:
where
SOCini,
SOCL are the initial SOC and the minimum
SOC,
K is the proportionality factor, and
is the vehicle’s demand power.
In order to extend the high-efficiency operating range of the engine, the engine efficiency weight
Le was improved through reinforcement learning (RL), which has the ability to learn anthropomorphic behavior:
where
and
are the high and low threshold of power, respectively, and
is the reduced engine power when it is too low.
represent the corrections to
and
respectively. For simplification, it is assumed that
=
.
Q() represents the learned knowledge and experience, and
represents the accumulated consumption of fuel and electricity. The subscript “next” represents the value of the next state.
represents the learning rate of the reinforcement learning.
Step 4: Return the real-time state of the vehicle to the multi-scale traffic model for the next time step.
2.2. Energy Distribution Trajectory Replanning
Since the macro traffic model cannot describe the driving behavior in sufficient detail, especially when the traffic environment changes, the actual driving behavior may be inconsistent with the planned driving behavior in advance. Thus, it requires local replanning for integrated driving behavior for macro traffic planning in real time.
When the driving behavior from the micro model at the short time scale conflicts with that from the macro model at the long time scale, the power threshold
,
and the weight
are adjusted accordingly. Specifically, the power threshold
,
and
are adjusted via the RL machine learning method as follows:
where
indicates the required vehicle power during planning, and
indicate the corrections to
and
, respectively.
In this paper, it is assumed that two typical types of short term velocity disturbance exist at a certain time. Two typical velocity disturbances are studied, respectively, i.e., the acceleration disturbance (Mode 1) and the deceleration disturbance (Mode 2) in
Figure 4. The velocity disturbance is assumed to change sinusoidally with time in the early stage [
49] but exponentially in the later period.
In the closed-loop tracking strategy, the motor current is controlled to track the vehicle speed, and the engine throttle to track the torque. In energy management replanning, only the speed (not the torque) of the motor/engine is adjusted, which can weaken the coupling effect between torque and speed control.
According to the method proposed in this article, the cross-sectional flow and density information can be obtained through V2X measurement. From this, macroscopic spatio–temporal traffic flow information corresponding to the microscopic vehicle operation can be obtained for global speed planning. Then, each vehicle automatically travels and obeys the global speed planning mentioned above. When there is a conflict between global planning and real-time traffic scenarios, short-term local replanning is carried out. This can achieve a vehicle’s autonomous cruise control based on the micro model, and meet the overall global planning of the macro traffic model.
3. Numerical and Experimental Results
To verify the effectiveness of the global energy management for the plug-in hybrid vehicles based on a multi-scale hybrid traffic model, we tested the PHEV powertrain on a vehicle in the loop (VIL) testing system, as shown in
Figure 5. A rapid prototype of a vehicle controller has been established on the dSPACE real-time simulation platform, which is used to send engine and motor load signals through the CAN bus. The engine and motor systems can be dynamically controlled independently or jointly, with great flexibility and reliability. All vehicle subsystems are connected to the CAN network. A high-performance parallel server computer was used to obtain target control sequences for engines, motors, and gearboxes under the multi-scale framework. The priority of motor speed is higher than that of other control variables, including engine torque, CVT speed, and motor torque, etc.
Numerical and experimental studies have been carried out to analysis the multi-scale energy management of PHEVs during the starting and braking processes in this paper, which are widely existing traffic situations. In all cases, the initial SOC is set to 60%, and the other initial conditions are as follows:
The boundary conditions are as follows:
where
and
are the starting and ending coordinates of the road section, respectively. The first two cars in the lane queue are studied in this paper, i.e., the leading car and the following car, since the behavior of the leading car determines that of all subsequent vehicles. The driving behavior of the following vehicle is used to analyze novel global energy management based on multi-scale traffic model, while the driving behavior of the leading car is obtained according to the macroscopic traffic flow model alone.
According to the macroscopic traffic flow model, the distribution of speed and density in the spatiotemporal domain can be obtained, as shown in
Figure 6. It can be seen that, from a global perspective, the speed variation and the density distribution in the whole road section can be obtained by the macro traffic flow model. For this method, only the initial conditions and the traffic flow information of key road sections are needed, and thus it is easier to collect data and more consistent with the basic statistical assumptions in model calibration. The vehicle speed for any time and space can be obtained through this method, which makes it global energy planning possible. This method, with faster runtime, is quite suitable for the large transportation domain where a large number of data sets and calculation resources are needed. In contrast, using the car following model to calculate the driving behavior of each vehicle in the whole space–time domain requires too many computing resources and too much time.
The traffic system can be design by an understanding of a servomechanism when the vehicle of the future is to be automatic as well as automobile. Automated vehicles can achieve servo-control to intervene and optimize driving behavior through AICCS and ACCS, thereby reducing improper driving behavior or correcting unreasonable driving behavior. Simultaneously, unlike human driving behavior, it has less randomness and can improve the predictability, orderliness and regularity of the system. In addition, with the support of vehicle-to-everything (V2X) communication [
50], it is possible to predict macro traffic flow and induce vehicle driving in practical application scenarios.
The prediction of driving behavior in the future can be used for energy management from the global perspective. Longer time scale prediction of driving behavior has the advantage of achieving longer time scale energy optimization. The method in this paper makes full use of the macro scale advantages of the macro traffic flow model and provides the possibility of long-distance and large-scale traffic energy management specific to each (hybrid) vehicle. Whether it is near or far away from the charging station, one can make a reasonable overall plan in advance. This can improve the overall efficiency of the engine while ensuring reasonable charging and discharging (e.g., SOC not too low) of the battery. Furthermore, the overall optimization control, from the overall system point of view, can ensure the smooth overall density of macro traffic flow and reduce the fluctuation and corresponding dissipation of the traffic system.
The disordered physical processes at the micro scale will present a certain order at the macro scale. A large number of driving behaviors in the whole transportation system are obtained by the car following model at the micro scale level, which show disorder characteristics and thus make it difficult to achieve global optimization. However, the order of the macro scale level obtained by the macro traffic flow model enables the overall optimization of the traffic system. Furthermore, by extending the prediction time of the micro car following behavior, it can become closer to the global prediction. The longer the prediction time domain, the closer the global optimal control achieved. In this paper, by adopting a unified model both at the macro level and the micro level, the micro driving behavior follows the macro traffic flow state smoothly, which avoids disturbance dissipation in the transmission process from macro variable to micro variable.
For multi-scale physical processes management in this paper, the macro traffic flow model is used to realize large-scale planning, and the car following model at the vehicle level is adopted to describe specific driving behavior in detail. In this hierarchical control method, the micro car following behavior obeys the evolution process of the macro state of the traffic system.
Figure 7 shows the car following behavior in macro traffic scenarios, where the driving behavior of the leading car is determined by the macro traffic flow model, but the rear car follows the leading car according to the micro car following model. The results show that the following car closely follows the leading car, indicating that the time scale of driving behavior obtained from the car following model is much smaller than that from the macro traffic flow model. This means that the time scale division of the multi scale model in
Figure 1 is reasonable. In the initial process of smooth acceleration, the micro car following model can track the macro planning objectives well. However, in the later deceleration process, the difference between the micro car following and the macro traffic behavior is relatively significant. This is because the acceleration in the decelerating process is larger than that of the accelerating process, as well as the effect of faster speed variations, which is consistent with the actual vehicle characteristics and the physiological response characteristics of the driver. Improving the ordering of the macro system can reduce the disorder of its micro subsystems. For example, according to the overall fluctuation trend of macro traffic flow, the time series of micro driving behavior can be improved appropriately to reduce the fluctuations of instantaneous driving behavior.
The macroscopic traffic flow is suitable for long time scale prediction, while the microscopic car following model is suitable for short time scale prediction. Multi-scale physical processes management in this paper fully utilizes the advantages of the micro and macro methods. This can describe not only short-term car following behavior, but also long-term integrated driving behavior.
The macro flow models use the average value (e.g., the spatial average speed of continuous vehicles) in sampling, in which the most suitable q-k or u-k relationship is established by statistical regression. The result is certainly more stable, since the average parameter value is estimated by the average sample. However, since the macro traffic flow does not focus on specific individual vehicles, but on regional average vehicles, the actual driving behavior of each vehicle will be different from that of the regional average statistics. In addition, some unknown factors, or the imprecision of the models, will lead to differences between real driving behavior and predicted driving behavior for the macro traffic flow model. Therefore, when there is a short term speed disturbance in the whole macro traffic flow, replanning of local driving behavior and the corresponding energy management is carried out.
Figure 8,
Figure 9 and
Figure 10 show the velocity evolution, velocity deviation component, and power evolution of the following car, when the car following behavior at the short time scale deviates from the driving behavior at the long time scale obtained by the macro traffic flow model, corresponding to Mode1 and the Mode2, respectively. The whole process is divided into three stages, i.e., the initial acceleration stage, the middle stable cruising stage and the final braking stage. In order to study the influence of speed fluctuation on the multiscale energy distribution, speed disturbance is assumed in the middle cruising stage to avoid the complex effects of the starting and braking process.
Figure 10 shows that the velocity disturbance causes obvious power fluctuation. It is assumed that the vehicles are in information interconnection via V2X communication, and thus the short term velocity fluctuation can be accurately predicted in time through the car following model. Therefore, the energy distribution can be replanned immediately when the disturbance occurs. Since the relationship between speed fluctuation and the power fluctuation is nonlinear, it is unreasonable to plan energy utilization based only on speed characteristics. In other words, the traffic model characterized by speed and acceleration cannot be directly applied simply to energy management planning. Reasonable energy planning needs to map the vehicle speed and acceleration characteristics to power characteristics, which directly determine energy efficiency and are suitable for optimal planning of energy utilization.
The novel model considers the impact of unknown disturbances on the planning, in order to reduce the deviation in the global optimal solution caused by the error for large macro planning, and thus the model has good robustness even when there are inevitable unknowns, such as unmodeled factors, or chaotic systems with sensitive initial values.
Figure 11 and
Figure 12 show the SOC trajectories planned by the original strategy and the replanning strategy for Mode 1 and Mode2, respectively, which determine the distribution of the battery energy and fuel energy.
In order to make a reasonable comparison, the initial and final SOC of the two disturbance modes are the same (see
Figure 11 and
Figure 12).
Figure 13,
Figure 14,
Figure 15 and
Figure 16 show the numerical and experimental results (i.e., the torque and speed of the engine and motor) of both the original and the replanning strategies for Mode 1 and Mode 2, respectively. The results show that the experimental results are in good agreement with the optimized target values.
In traffic planning, the traffic efficiency is closely related to the average speed of vehicles, which mainly involves a steady state or an equilibrium state. However, whether from the perspective of physical mechanism or data-based principal component analysis, the final energy consumption and emissions depend on the actual vehicle power, which mainly depends on the transient process away from equilibrium, so the replanning of instantaneous energy distribution needs to take the power factors into consideration [
51].
Figure 17 and
Figure 18 show the experimental results of the power distribution of the engine and motor under the original strategy and the replanning strategy for Mode 1. For convenience in distinguishing the original and the RL based replanning strategies,
Figure 19 shows the difference between them for Mode 1.
Figure 20 and
Figure 21 show the experimental results of the power distribution of the engine and motor under the original strategy and the replanning strategy for Mode 2, and
Figure 22 shows the difference between these two strategies for Mode 2.
Global energy optimization can be achieved via the short-to-long time scale prediction of the driving behavior. The original strategy for global optimization is to distribute the HEV energy according to the demand power of the vehicle on the road. When the vehicle’s demand power is relatively higher (Mode 1) than the original plan, the engine power should be appropriately increased in order to fully exploit the energy saving potential; while the vehicle’s demand power is relatively lower (Mode 2), the engine power should be appropriately reduced in order to reduce the operating range of high fuel consumption. Furthermore, in order to extend the high-efficiency operating range of the engine, the engine efficiency weight Le is increased when the vehicle’s demand power is very high. When the vehicle’s demand power increases, the engine power increases compared with the original plan; while the vehicle’s demand power decreases, the engine power decreases compared with its original plan.
For two typical types of speed deviation (i.e., Mode 1 and Mode 2), corresponding replanning is carried out, respectively. When significant deviation of speed occurs, the power threshold , and the weight are adjusted through reinforcement learning methods. For Mode 1, the power threshold , and the weight are increased when the actual power is higher than the predicted power of the original plan; but for Mode 2 the power threshold , and the weight are reduced when the actual power is lower than the predicted power of the original plan. This method further exploits the fuel saving potential of the engine at high power and reduces its inefficient operation at low power when the actual vehicle speed significantly deviates from the predicted speed of the original plan, not significantly affecting the original global optimization of the SOC trajectory.
Vehicle power has a nonlinear function with its speed, and the frequency and amplitude of the speed fluctuation directly affect that of power fluctuation. The fluctuation frequency is related to the response time of the engine and motor, and the fluctuation amplitude is related to the fuel consumption gradient and motor efficiency. When replanning, it is necessary to deeply couple the dynamic characteristics (e.g., time constant) of the engine and motor with the speed fluctuation, in order to ensure that the replanning strategy can be executed by the subassemblies.
For a clearer description of the results of reinforcement learning, the blue shaded area in
Figure 13,
Figure 14,
Figure 15,
Figure 16,
Figure 17 and
Figure 18 and
Figure 20 and
Figure 21 presents the replanning of the original strategy when the actual speed at the micro level deviates from that planned by the macro model, and the grey shaded areas A and B in
Figure 19 and
Figure 22 present the detailed difference for the engine operating area between the original strategy and the replanning strategy. The principle of re-optimization is to move the engine operation from the low efficiency area to the high efficiency area, that is, to replace area A with area B. The purpose of the replanning strategy is to convert the energy utilization of area A into that of area B, since the engine’s fuel consumption rate for area B is lower than that for area A. The fuel consumption for the original strategy and the replanning strategy for Mode 1 and Mode 2 are shown in
Table 2.
Table 2 shows that the replanning strategy can reduce the fuel consumption by 9–10% compared with the original strategy, indicating that the replanning strategy can make further utilization of the engine’s fuel saving potential by improving the efficient operation of the engine at high power and reducing its inefficient operation at low power. The replanning strategy has strong adaptability and can make energy management close to global optimization, despite the deviation in actual driving behavior from the initial predicted value, which may be caused by inevitable errors of the macro traffic flow model and traffic environment changes. The novel PHEV self-driving, from the perspective of the full space–time chain, achieved the integrated management of transportation planning and energy utilization.


 ,
, 


