Article

Real-Time Optical Detection of Artificial Coating Defects in PBF-LB/P Using a Low-Cost Camera Solution and Convolutional Neural Networks

1
High Tech Manufacturing, University of Applied Sciences Vienna, FH Campus Wien, Favoritenstrasse 226, 1100 Wien, Austria
2
Computer Science and Digital Communications, University of Applied Sciences Vienna, FH Campus Wien, Favoritenstrasse 226, 1100 Wien, Austria
3
Institute for Manufacturing and Photonic Technologies, Technische Universität Wien, Getreidemarkt 9, 1060 Wien, Austria
*
Authors to whom correspondence should be addressed.
Appl. Sci. 2023, 13(20), 11273; https://doi.org/10.3390/app132011273
Submission received: 9 September 2023 / Revised: 5 October 2023 / Accepted: 12 October 2023 / Published: 13 October 2023
(This article belongs to the Special Issue Pattern Recognition Based on Machine Learning and Deep Learning)

Abstract

:
Additive manufacturing plays a decisive role in the field of industrial manufacturing in a wide range of application areas today. However, process monitoring, and especially the real-time detection of defects, is still an area where there is a lot of potential for improvement. High defect rates should be avoided in order to save costs and shorten product development times. Most of the time, effective process controls fail because of the given process parameters, such as high process temperatures in a laser-based powder bed fusion, or simply because of the very cost-intensive measuring equipment. This paper proposes a novel approach for the real-time and high-efficiency detection of coating defects on the powder bed surface during the powder bed fusion of polyamide (PBF-LB/P/PA12) by using a low-cost RGB camera system and image recognition via convolutional neural networks (CNN). The use of a CNN enables the automated detection and segmentation of objects by learning the spatial hierarchies of features from low to high-level patterns. Artificial coating defects were successfully induced in a reproducible and sustainable way via an experimental mechanical setup mounted on the coating blade, allowing the in-process simulation of particle drag, part shifting, and powder contamination. The intensity of the defect could be continuously varied using stepper motors. A low-cost camera was used to record several build processes with different part geometries. Installing the camera inside the machine allows the entire powder bed to be captured without distortion at the best possible angle for evaluation using CNN. After several training and tuning iterations of the custom CNN architecture, the accuracy, precision, and recall consistently reached >99%. Even defects that resembled the geometry of components were correctly classified. Subsequent gradient-weighted class activation mapping (Grad-CAM) analysis confirmed the classification results.

1. Introduction

The technology of additive manufacturing (AM) enables the production of highly complex and qualitative components for a wide range of industrial and commercial applications such as automotive, aerospace, medical devices, dentistry, electronic components, and even microstructural applications [1,2,3,4,5,6,7,8]. In particular, the laser-based powder bed fusion of polymers PBF-LB/P and metals PBF-LB/M, in which powder is applied in layers and sintered or fused via a laser [9,10], has a wide range of applications and research areas [11,12,13,14,15,16,17,18,19,20]. Despite the many advantages of this technology, there are still certain limitations when it comes to reproducible component quality across multiple build jobs. For example, the quality of AM-produced parts varies from batch to batch and from machine to machine. There is also a lack of standards developed for AM processes, as compared to the tolerance requirements defined in DIN 16742:2013 [21] for the injection molding process, where the dimensional errors of AM exceed the defined ranges [22]. Another limitation is the inconsistent dimensional error, which is often outside the standard tolerance range [23]. When it comes to PBF-LB/P, any defect is critical, both in terms of endangering the process itself, which could lead to a process stoppage, and in terms of compromising the quality of the part in every way. Further investigation is required as part of process monitoring to understand the thermal interactions, ensure the part quality, and reduce the number of failures. PBF-LB/P has already made a remarkable breakthrough in certain industrial applications by reaching high standard requirements, but successful integration into the industrial process flow and supply chain is still limited by the lack of sustainable process control. The integration of suitable real-time quality control is difficult to implement due to the largely closed software and hardware solutions and the fact that it is almost impossible to interfere with the parameters during the running process [24,25]. Several simulation designs for real-time process control systems in powder bed fusion are proposed [26,27,28,29,30,31]. A good overview of important parameters and influencing factors is given in [32] by Vlasea et al. This review describes a testbed for implementing process monitoring methods, including simulation approaches for real-time process control algorithms. A measurement and process control strategy is presented based on an organizational structure that includes pre-processing, in situ defects or fault detection, in situ continuous feedback control, and signature deviation control. When this organizational structure of Vlasea et al. and the individual components are examined in more detail, a concept for the in situ defect detection component can be developed on the basis of the current study. For this defect detection concept, certain parameters, as shown in Figure 1, need to be defined and implemented in order to be integrated and processed within an overall process control structure.
Regarding the failures and defects that can occur in the processing of polyamides as well as metallic powders, there are synergies as well as independent effects. In addition to similar defects like curling, shrinkage, coating failures, part shifting, particle drag, powder contamination, and powder short feed, the manufacturing of metal powders might lead to additional defects like cracks, spatters, and porosity [25,33,34]. Figure 2 shows the effect of part shifting during the ongoing sintering process in the FORMIGA P 110 PBF-LB/P system via the EOS (Krailling, Germany) used for this work. As can be clearly seen, this event immediately leads to a complete stoppage of the build job.
Previous work has shown several different experimental approaches for the detection of defects in both metallic and plastic powder processing [24,25,28,35,36,37,38,39,40,41,42,43,44,45]. However, despite the promising results, these are always scientific experiments with expensive measuring instruments or complex experimental set-ups that are not yet suitable for industrial applications.
In this paper, a new approach to coating defect detection is proposed by installing a cooled camera system inside the PBF-LB/P system and evaluating the data via deep learning using a custom convolutional neural network (CNN). Since the artificial and reproducible induction of various defects in the field of powder bed fusion represents a major challenge without direct process termination [24,25,35], this approach represents a new experimental solution.

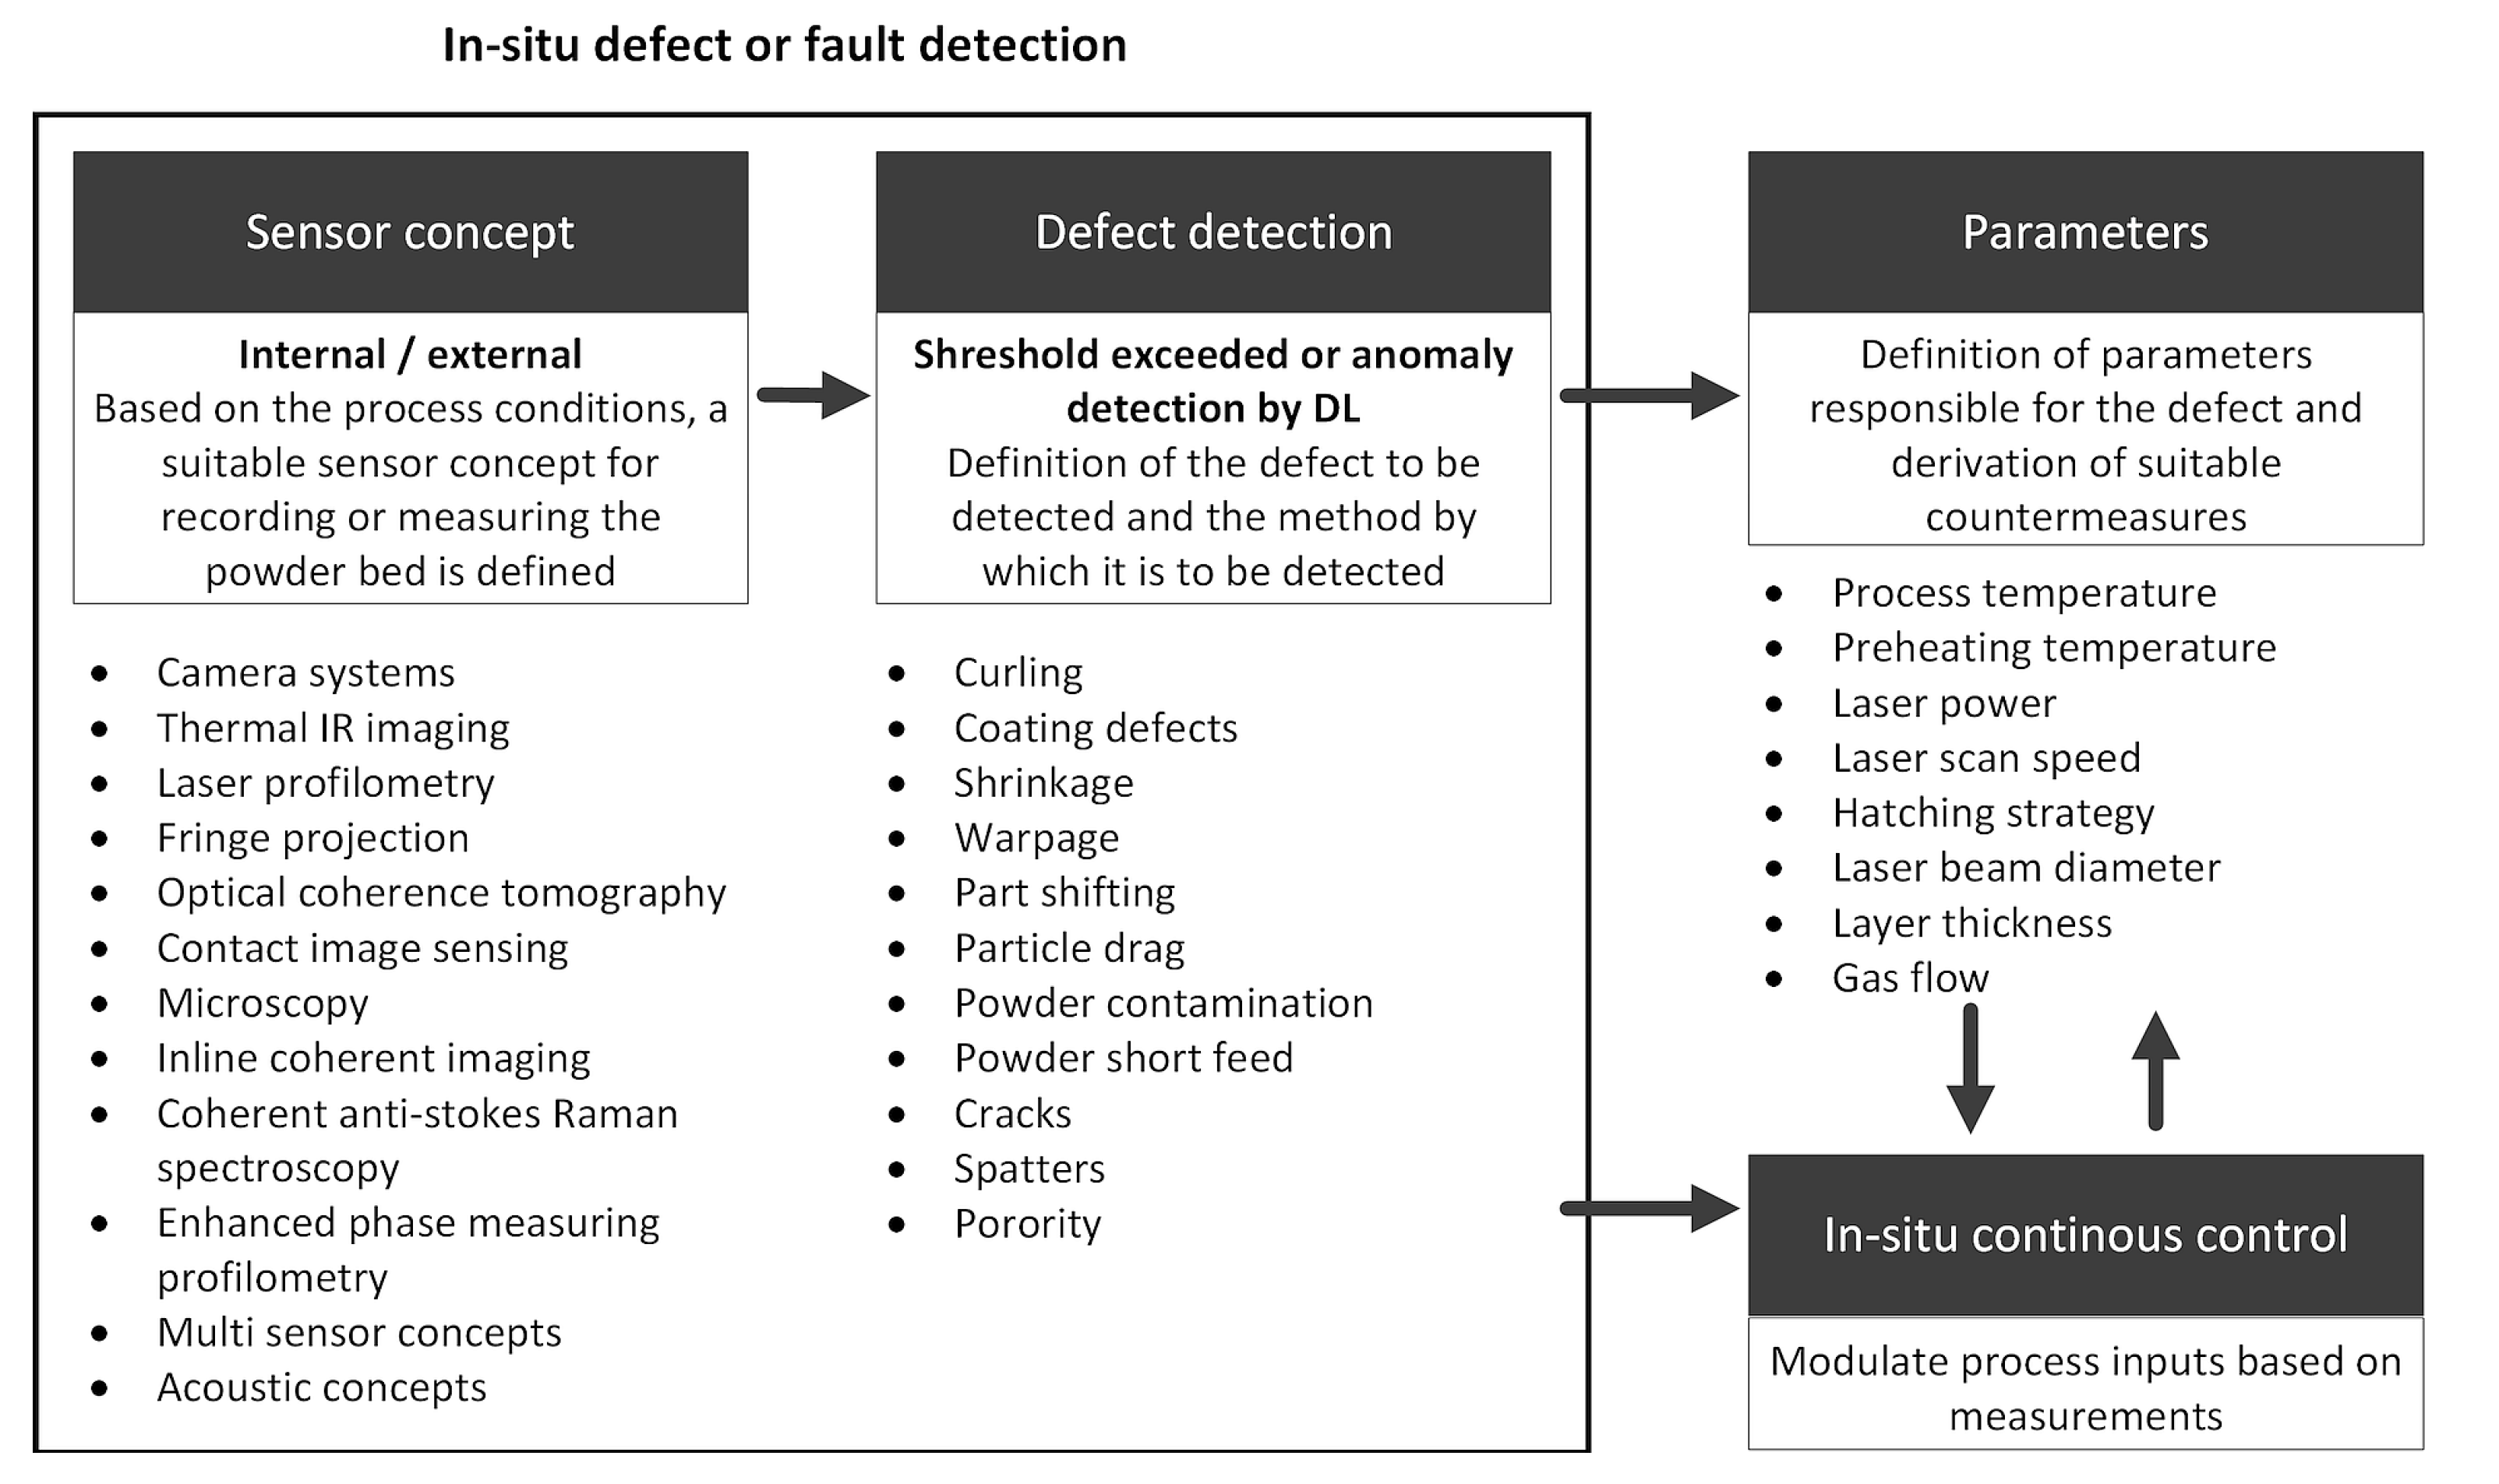
2. Background and Methodology

Recent studies and literature reviews show that the use of deep learning is becoming increasingly common, especially in the manufacturing industry, to monitor processes, detect defects, and predict component quality [46,47,48,49]. According to the literature, the application of supervised CNN in particular has often been used to check relevant components. The use of supervised CNN has shown promising results for tasks such as defect classification and defect segmentation. Classification works at the image level and recognizes the object in the image. Segmentation operates at the pixel level and detects the object type in each pixel of the input [46]. The following are a few examples of the use of supervised CNN in industrial and safety-related applications. In [50], Chen and Jahanshahi proposed a CNN to detect cracks in safety-relevant parts of a nuclear power plant. Dong et al. [51] addressed the identification of small abnormalities in applications such as industrial inspection. A steel plate defect inspection was proposed by He et al. [52] for real-time quality control of the manufacturing process. In [53], Shi et al. showed the effective deployment of CNN for automated underwater pipeline defect inspection. Tabernik et al. [54] introduced a segmentation-based deep learning approach for surface defect detection, which was designed to detect and segment surface anomalies and showed that the proposed approach is able to learn on a small number of defects, using only about 25–30 defective training samples instead of hundreds or thousands. Another industrial non-destructive testing (NDT) example is given by Tang et al. in [55], who inspected X-ray images of castings using spatial attention bilinear CNN. In [56], an online sequential classifier and transfer learning (OSC-TL) method was presented by Yang et al. for the training and classification of Mura defects in the manufacturing process of flat panel displays.
In the literature, unsupervised CNN models are mainly categorized into anomaly detection, GAN-based models (Generative Adversarial Networks), and hybrid models. Compared to supervised CNN architectures, unsupervised models are able to perform image labeling, pixel-level, defect image classification, and defect area localization. External and internal defect detection is possible within several computer vision tasks [46]. The following are a few examples of unsupervised CNN applications for anomaly detection, GAN-based, and hybrid models. In [57], Chow et al. proposed a convolutional autoencoder (CAE) to implement the anomaly detection of defects on concrete structures and further facilitate the visual inspection of civil infrastructure. Another example of an autoencoder is given by Yang et al. in [58]. A multi-scale, fully convolutional autoencoder (FCAE) was used, considering only defect-free images for surface defect detection. Ruff et al. [59] used a deep support vector description (D-SVDD) CNN architecture for semi-supervised and unsupervised anomaly detection.
Regarding unsupervised GAN models, Lian et al. [60] presented a model where GAN is combined with CNN to enable flawless image and identify miniature surface defects. Another approach for a surface defect-generation adversarial network (SDGAN) was presented by Niu et al. in [61]. The model was applied on accurate images to increase the dataset of defective images. For high-dimensional datasets, Zenati et al. in [62] presented a trained GAN-based model using a score function to increase the efficiency of defect detection. Another example for high-dimensional datasets was given in [63] by Deecke et al. by investigating a new anomaly method based on searching for a good representation of this sample in the latent space of the generator.
The final category of unsupervised CNN models for defect detection is the hybrid variant. A generic method for automated surface defect detection based on a bilinear model has been proposed by Zhou et al. in [64] by extracting the features globally and locally, applying subnetworks based on visual geometry and labelled Double-VGG16. Another approach of a hybrid unsupervised CNN model was presented by Tsai et al. [65] for automatic defect detection in material surfaces. The study included a two-stage deep learning scheme for pixel-wise defect detection on textured surfaces using two CycleGAN models and a U-Net semantic network. The previous studies showed that the use of deep learning is well suited for industrial manufacturing purposes in order to classify and identify both external and internal defects. The targeted use of CNN in additive manufacturing, especially in powder bed fusion, has already been discussed in several applications and has shown very good results in process monitoring, defect detection, and the prediction of component quality [47]. What is striking, however, is that most of the research is being carried out in the field of powder bed fusion of metals, and there are only a few cases of CNN being applied to the manufacturing of polymers. This could be due both to the nature of the defects, which are more visible and occur in greater numbers in the metal fabrication sector [33,34], and presumably to the interest from the manufacturing industry [66].
Our previous approach [35] showed good results in detecting curling defects on the same PBF-LB/P system using thermal imaging and defect classification using a VGG-16 CNN. An average accuracy of 98.54% for the detection of curling defects was achieved and the results encouraged the effective use of DL for the non-destructive, in situ quality control of powder bed fusion processes. Another study by Westphal and Seits [67] demonstrated the application of non-destructive defect detection in the field of powder bed fusion of polymers using complex transfer learning (TL) methods. Their approach used a VGG16 and Xception CNN model with pre-trained weights from the ImageNet dataset as the initialization. In [68], Arslan et al. demonstrated a DL defect detection system called “SLS-ResNet” to detect defects such as curling, part shifting caused by curling, and powder short feed on a DTM Sinterstation 2500 Plus PBF-LB/P system. Unfortunately, no further information on defect generation was given. Another approach on the same Sinterstation was presented by Xiao et al. in [69] to detect the same defects as in the previous study, but in this case, it was explained in detail how certain parameters such as process temperature were manipulated to create the defects. In [70], Schlicht et al. showed a method for the in-line assessment of part porosity to detect limitations in the reproducibility of manufactured parts by using deep residual neural networks. Their study used the same EOS PBF-LB/P system as the current study. Baturynska et al. [23] showed the influence of component positioning in the installation space of an EOS P 395 PBF-LB/P system on part dimension accuracy. This work aimed to predict the scaling ratio for each part separately, depending on its placement, orientation, and CAD characteristics, using artificial neural networks (ANN) such as Multi-Layer Perceptron (MLP) and CNN.

3. Materials and Methods

3.1. PBF-LB/P System

Just like in previous studies [24,35], all experimental trials were carried out on the same PBF-LB/P system. This laser-based powder bed fusion system for polymer powders uses high performance PA (PA2200) nylon fused via a CO2 laser and is capable of producing small batch prototypes as well as larger quantities of industrial-grade components. According to the technical description of the system [71] and the product information of the powder [72], the parameters are listed in Table 1.
A standard unadjusted laser scan speed and hatch spacing from the EOS default exposure strategy was used, but its parameters cannot be viewed or adjusted as EOS does not provide any further information about them.

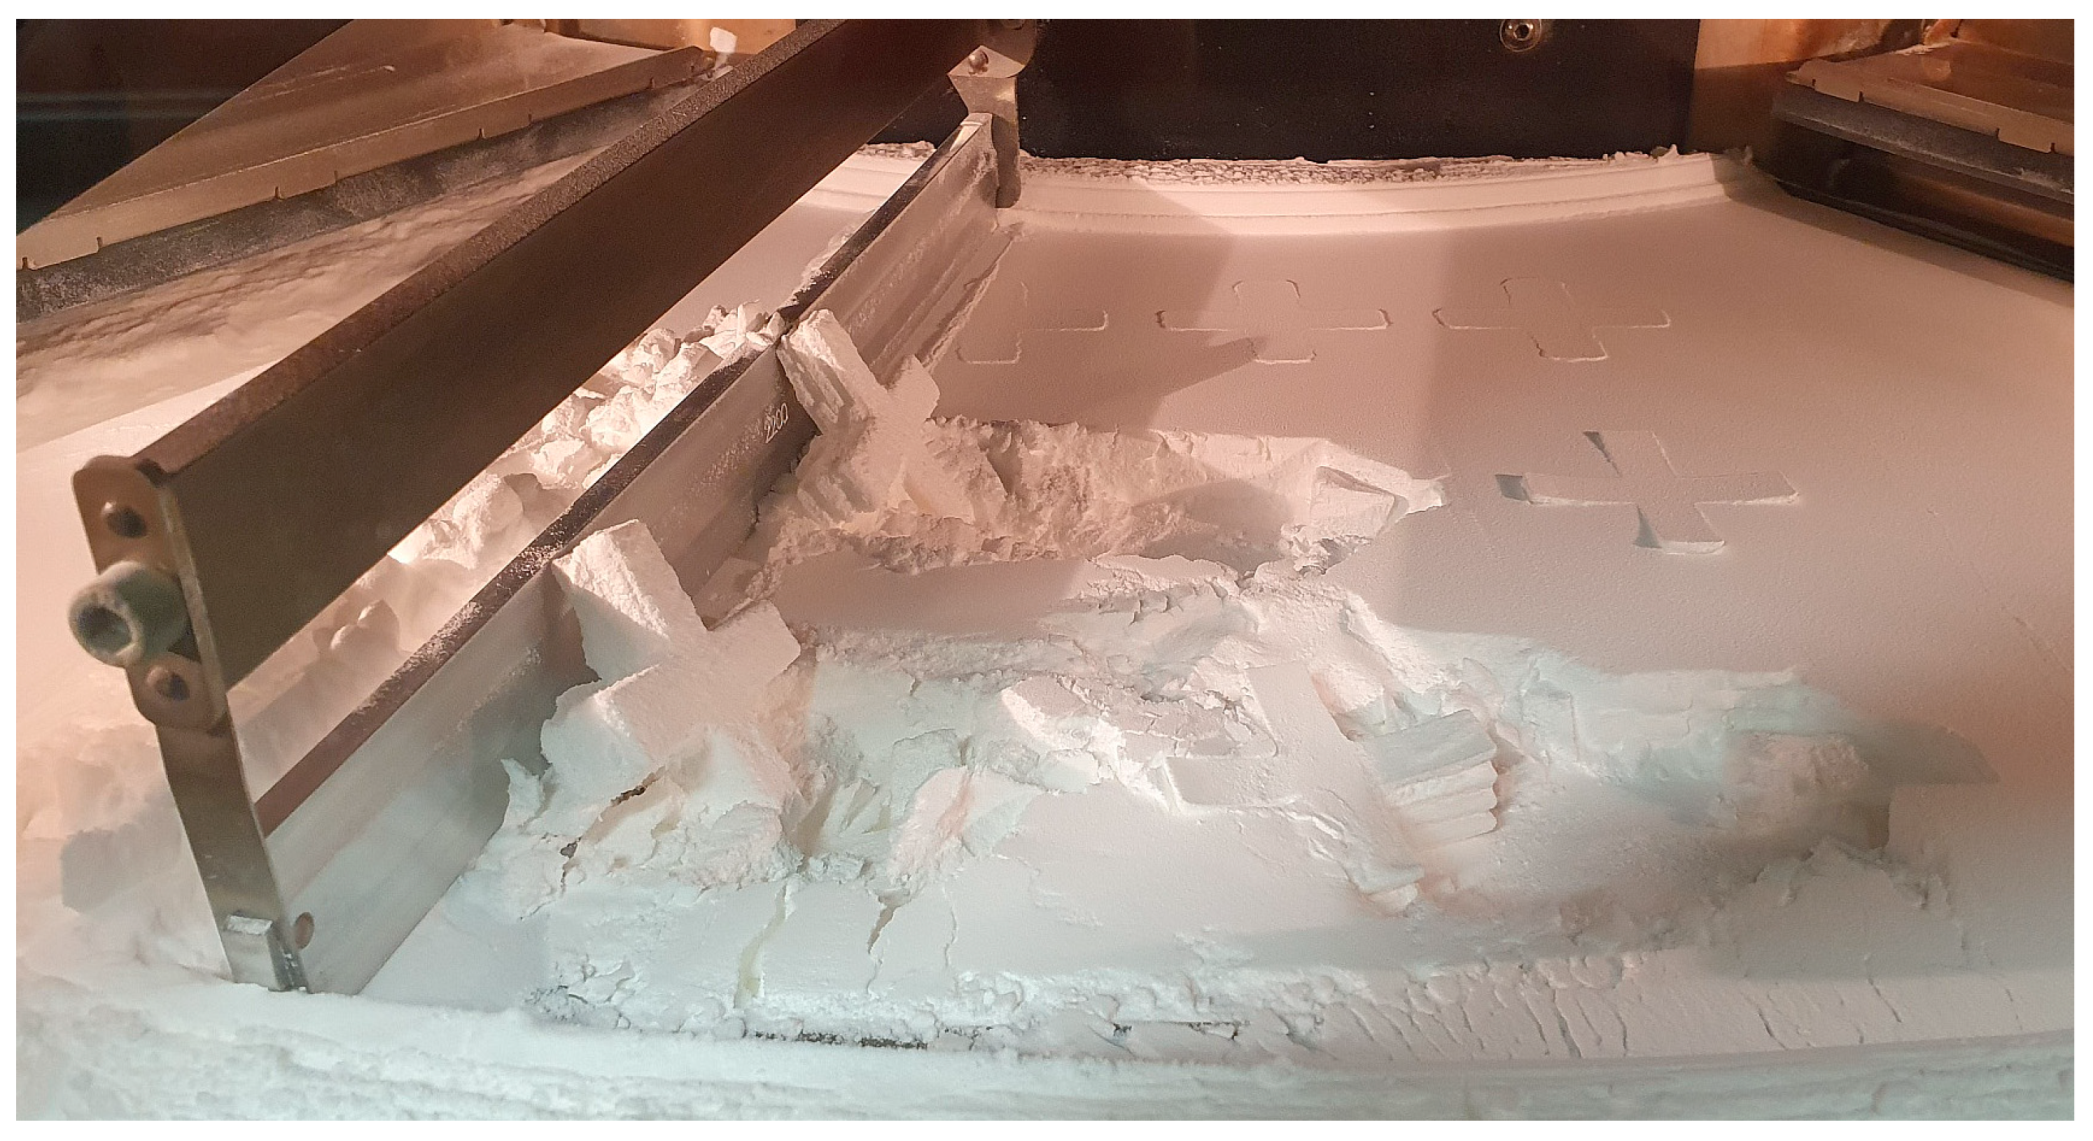
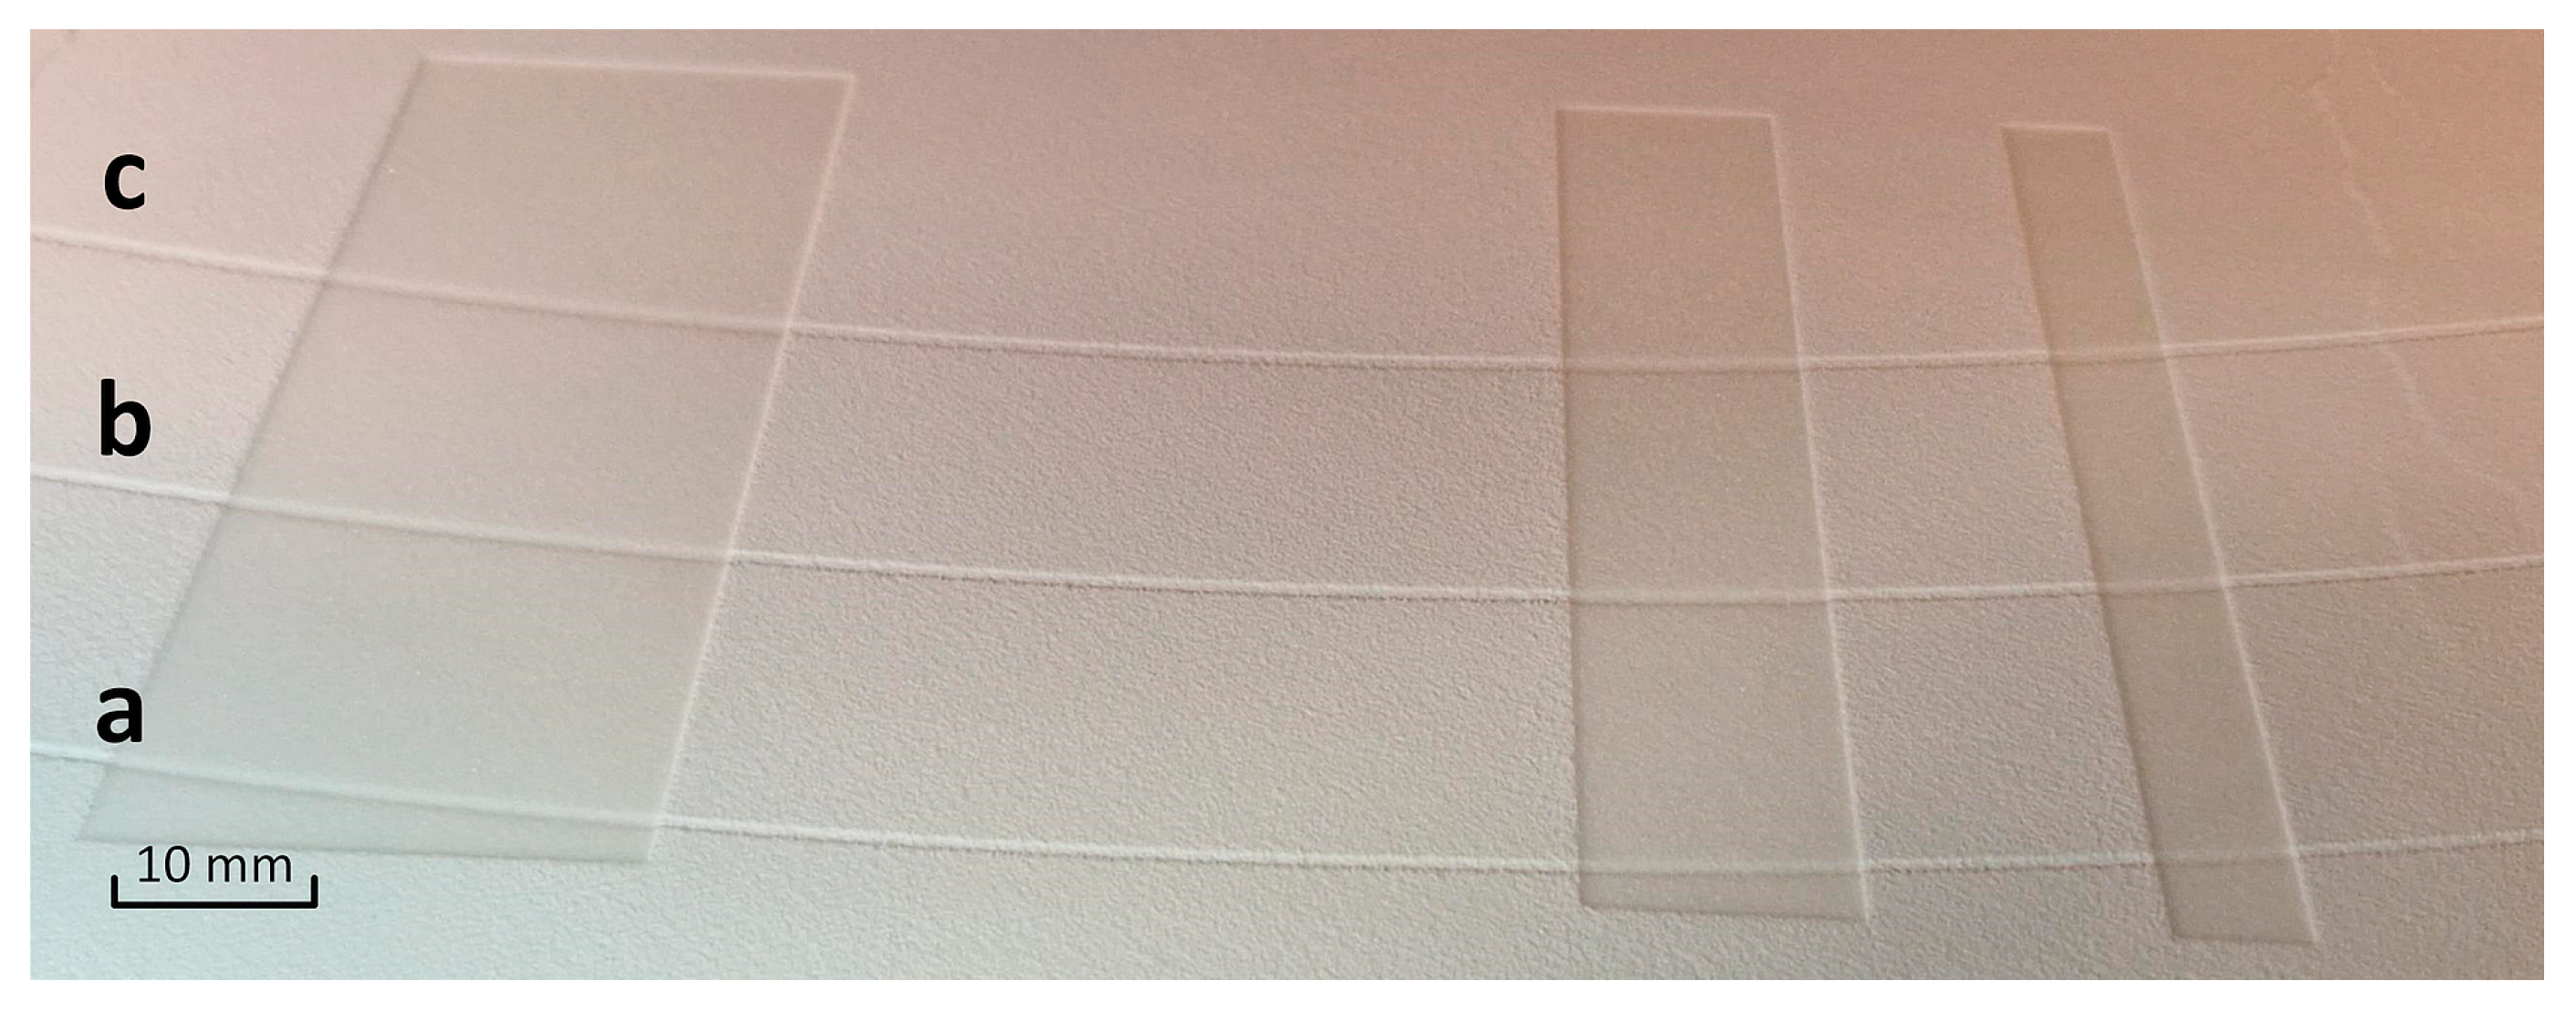
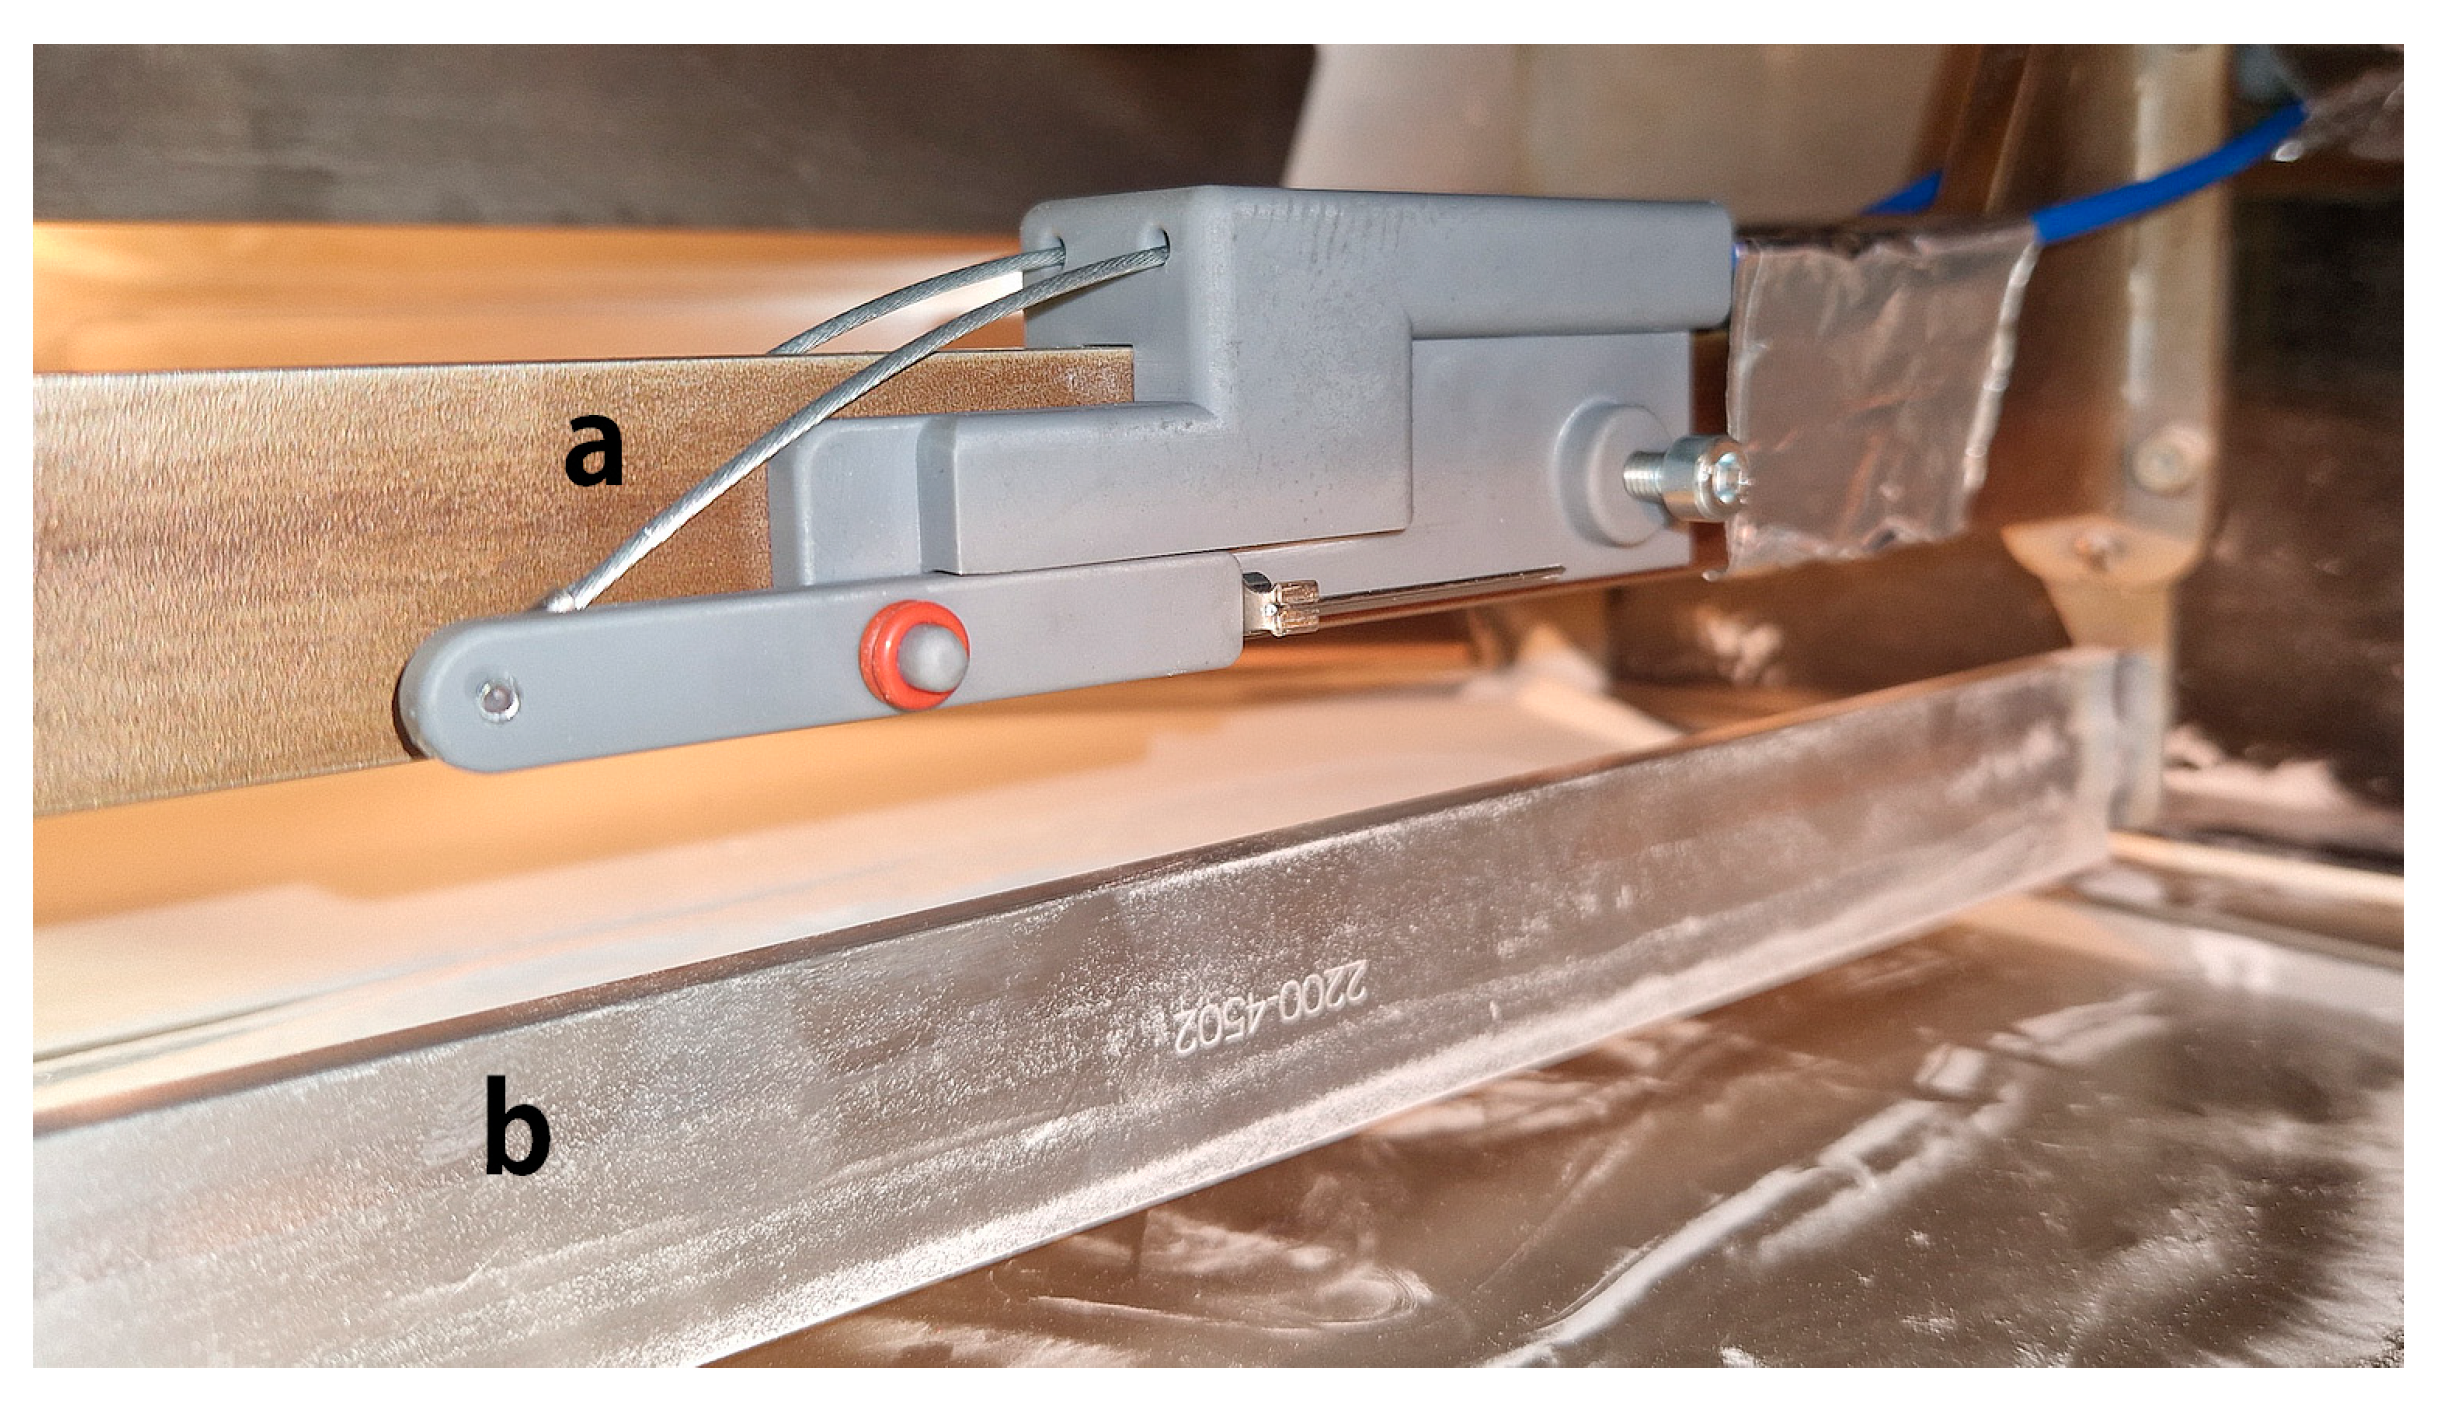
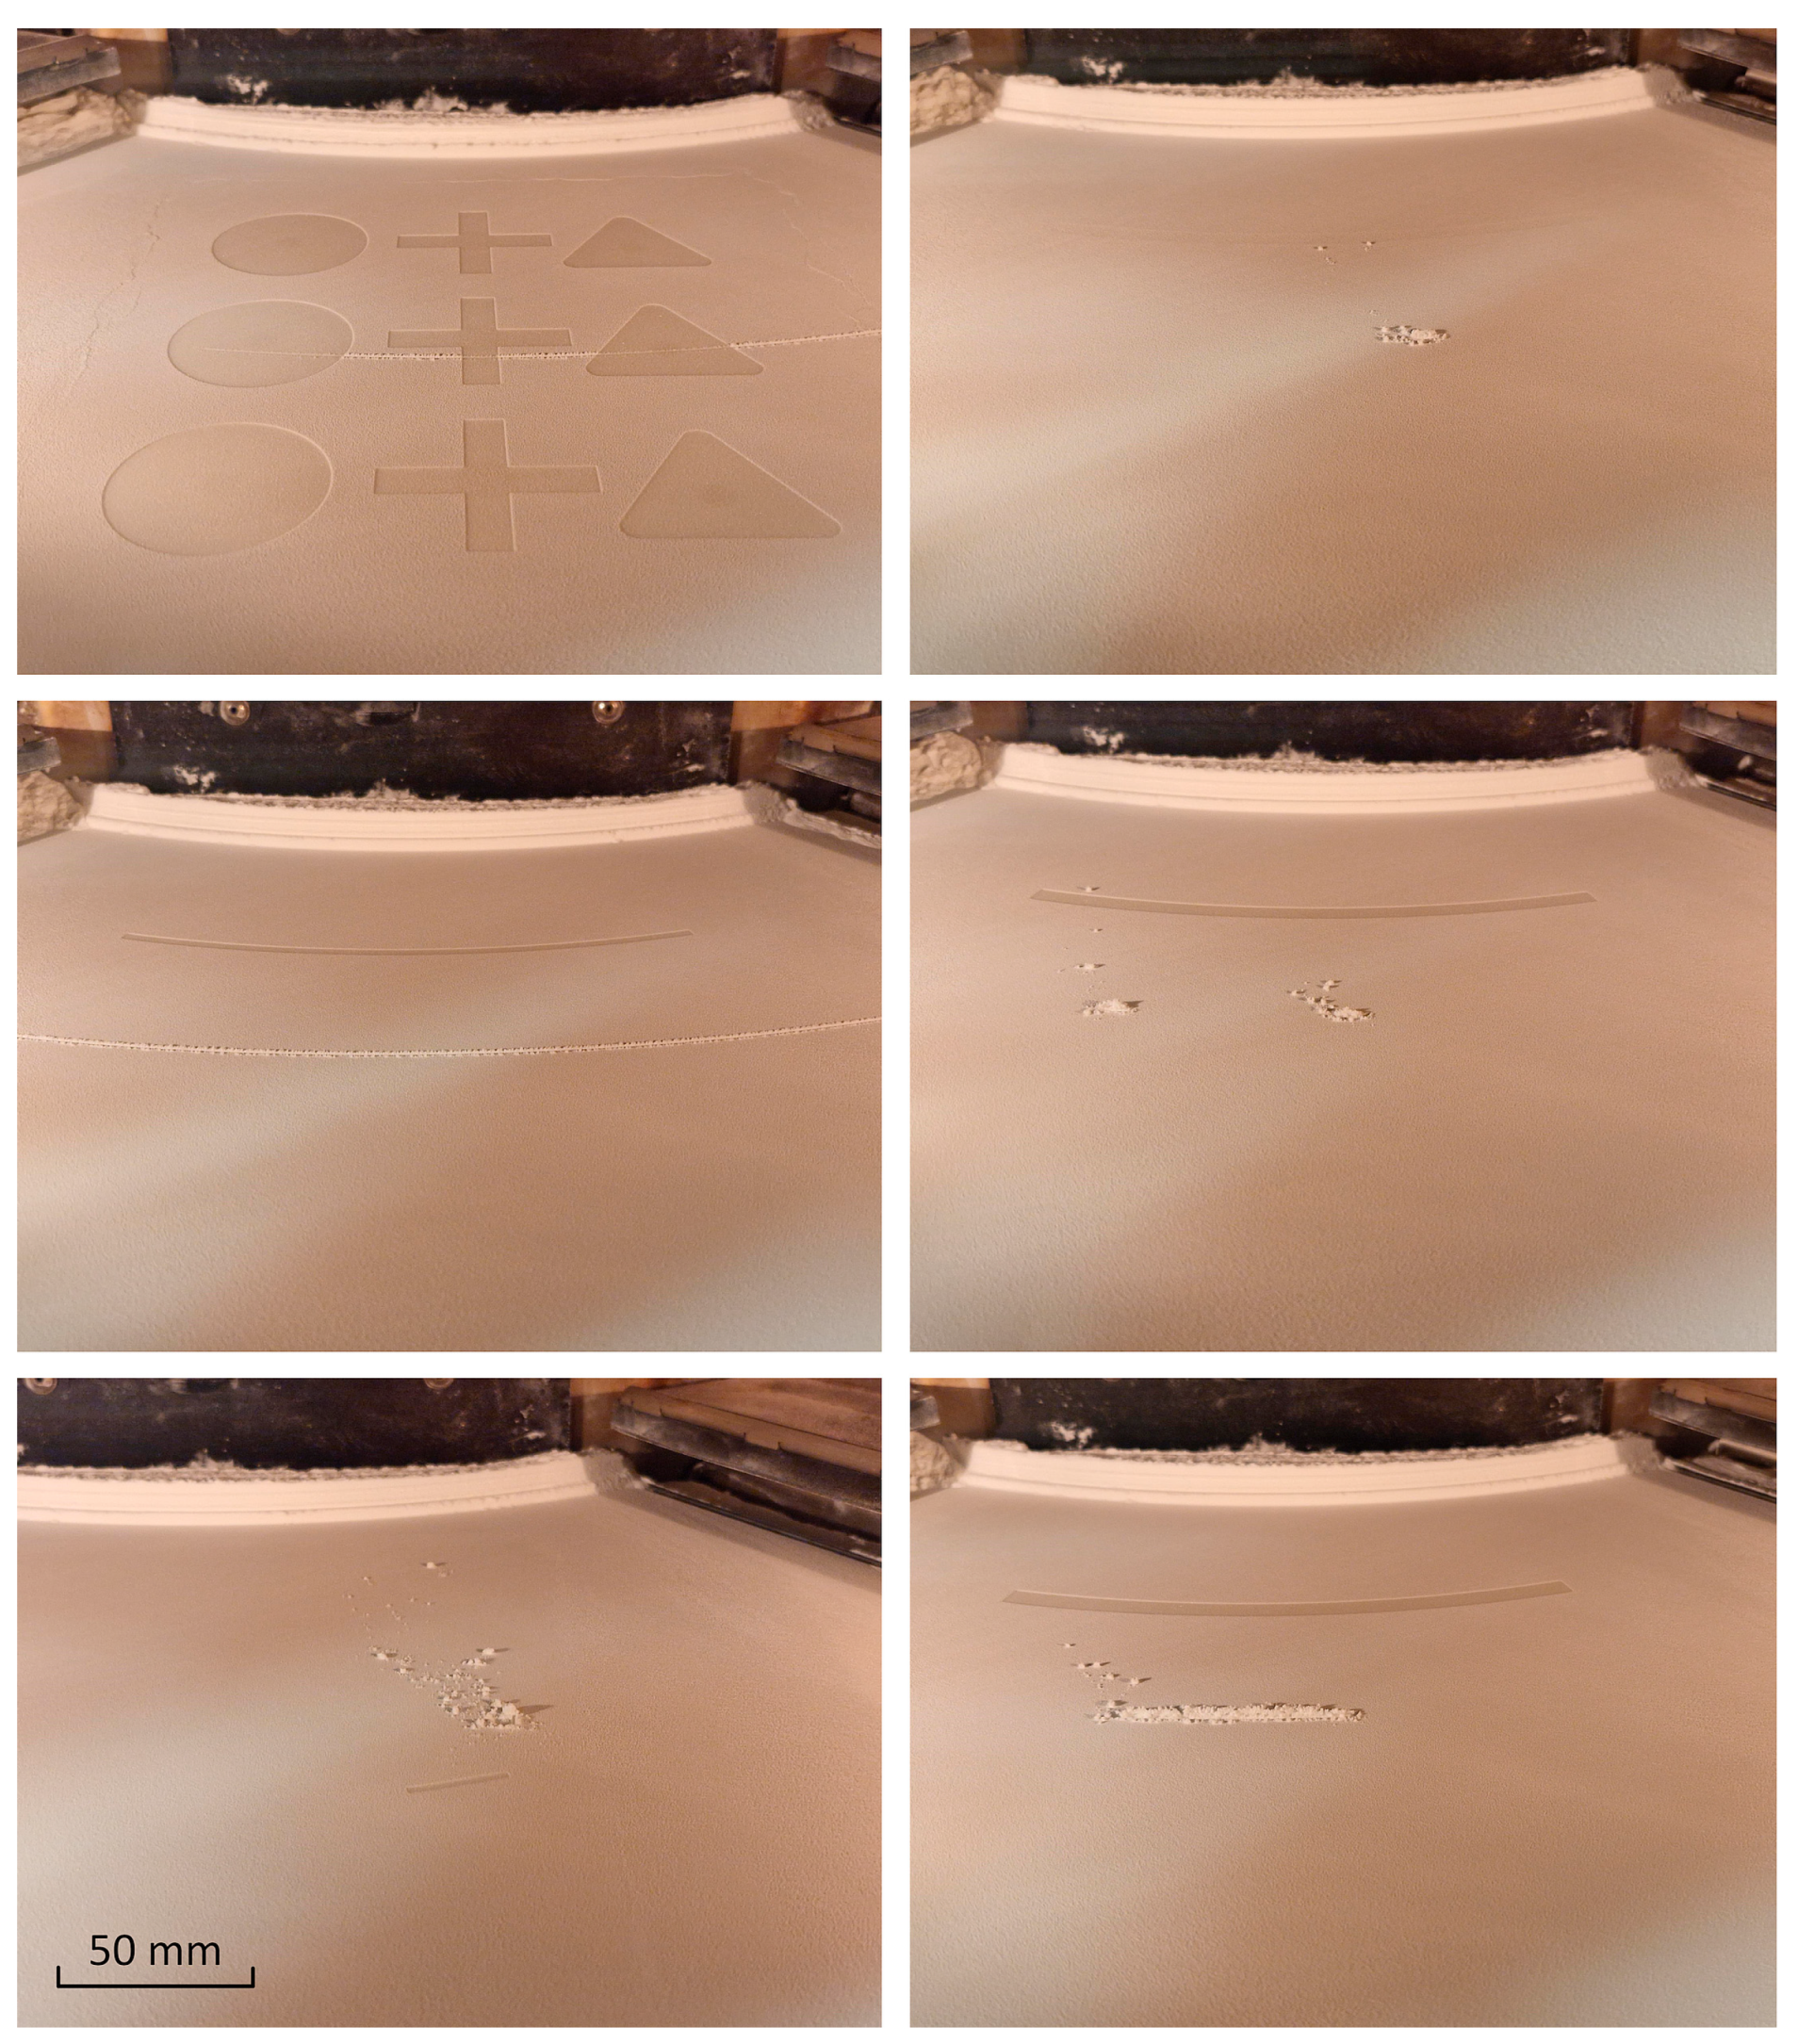
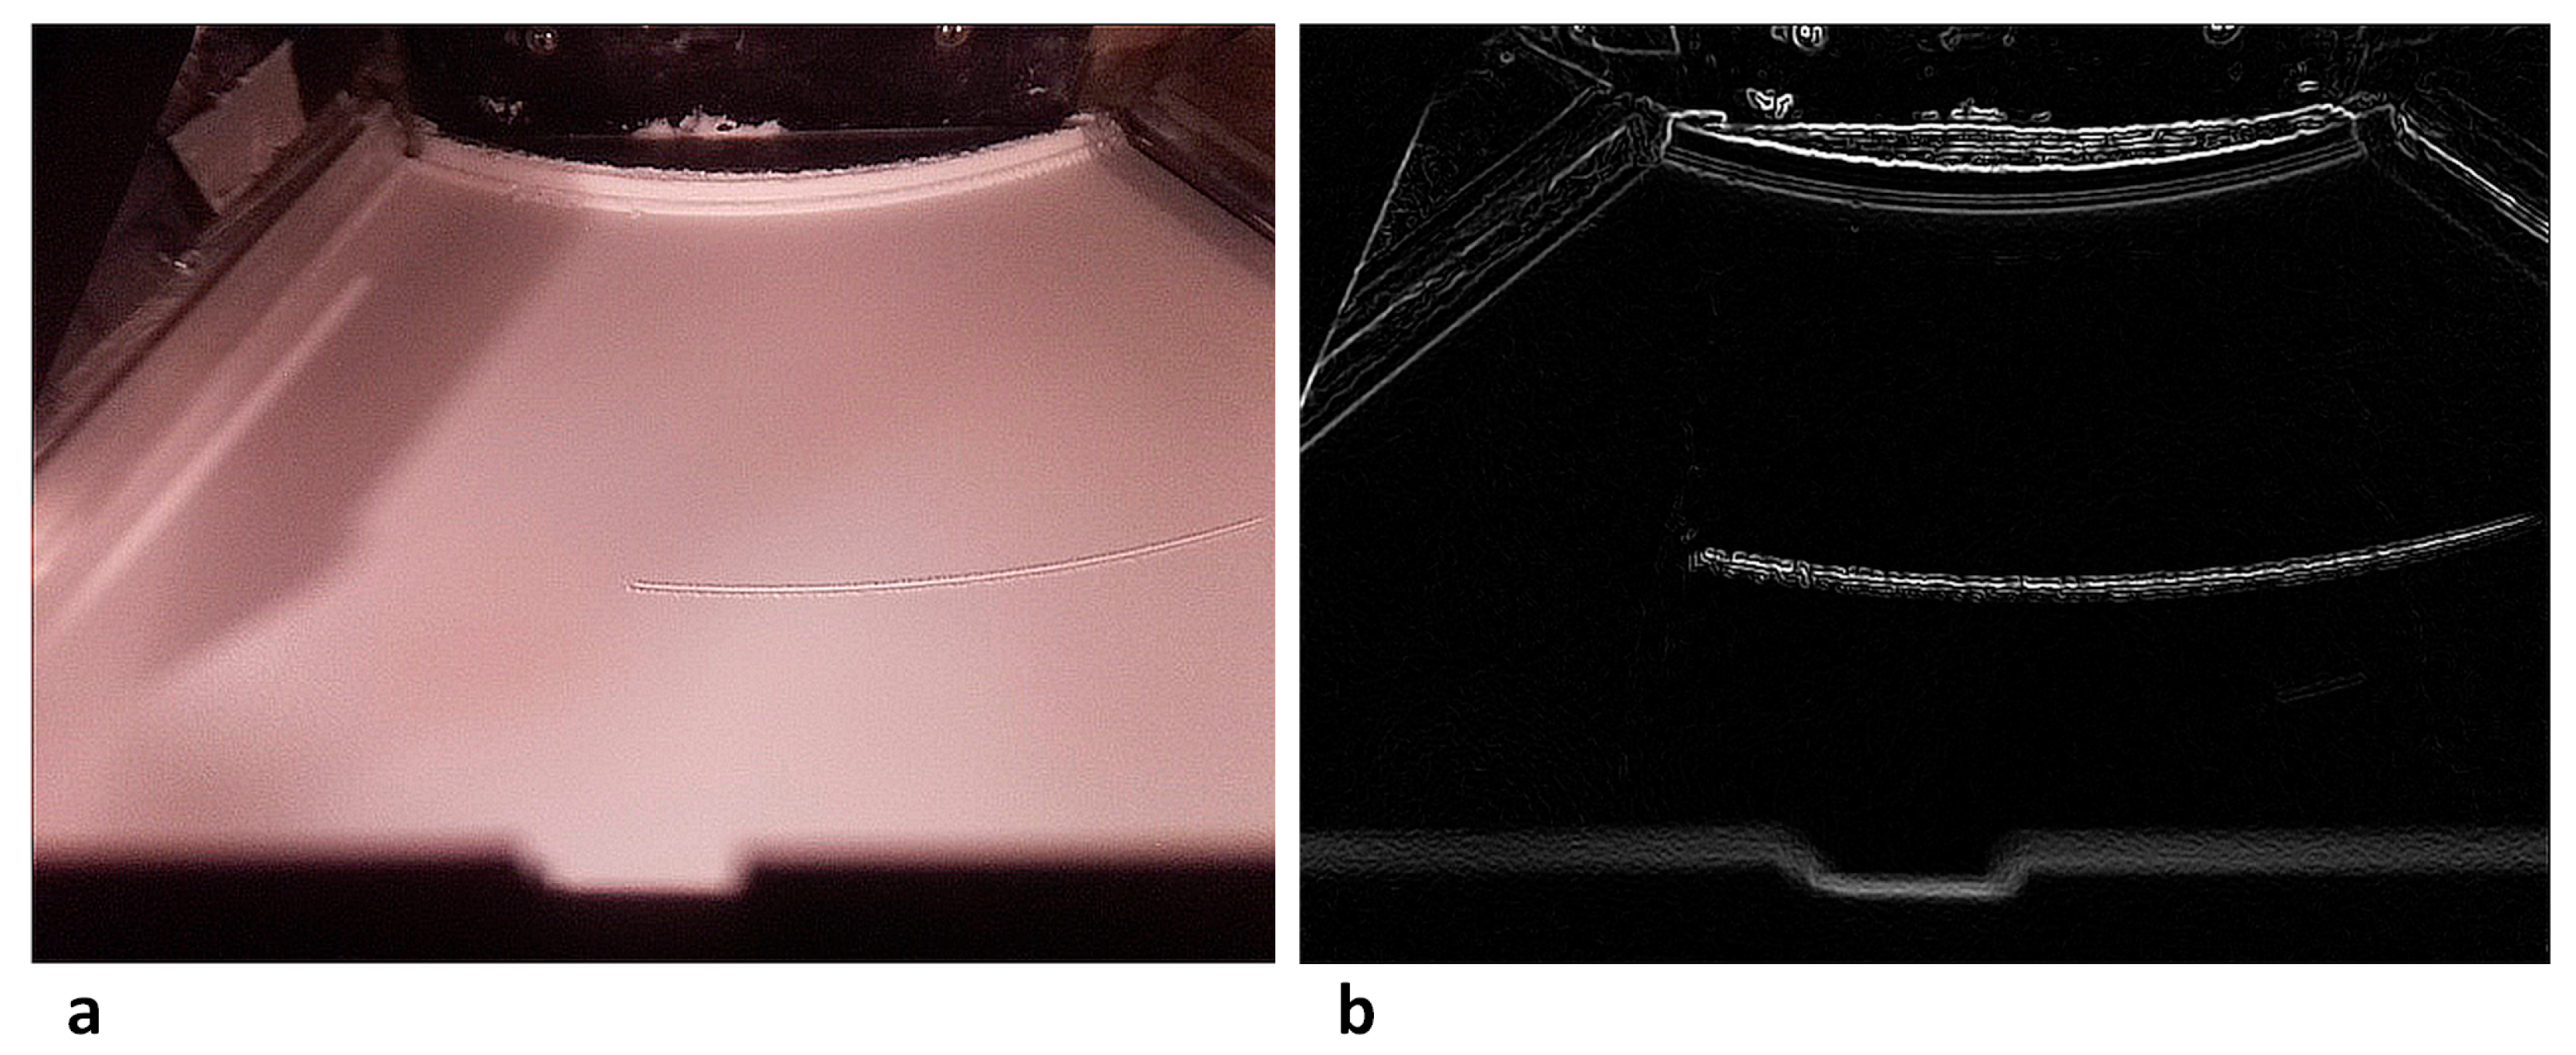
3.2. Simulation of Artificial Coating Defects as Part Shifting and Particle Drag

As described in [24,25,35,68,69], it is hardly possible to intervene in any kind of process parameters of industrial PBF-LB/P systems, to adjust them, or to obtain information about exposure strategies. Consequently, it is difficult to simulate any defects in a reproducible manner during the running process without causing a complete process termination. The studies showed that with the EOS system, it is only possible to manipulate the process temperature before the start of the process in order to artificially cause a curling defect. Curling, which is the thermally induced in-process distortion of the free edges of build parts [73], can lead to the shifting of whole components if too pronounced. Depending on the size of the displaced parts and the current process progress, this can lead to an immediate process termination. However, as the height of curling can only be determined using complex measuring methods, as described in [24], the actual occurrence of this effect is subject to chance, making reproducible generation impossible. The effect of particle drag can also only be caused accidentally by a manual contamination of the powder. One of the main goals of this study was to artificially generate these defects efficiently, in order to generate as much data as possible from both the defect-free and defective process sections, and then train a custom CNN for automated defect detection.
To determine the penetration depth of the foreign bodies at which the actual components are displaced from the powder bed, different wire thicknesses of copper and aluminum were applied to the coater blade, as shown in Figure 3, and the sintering process was then started normally.
A total of seven different thicknesses from 0.3, 0.5, 0.6, 1, 1.5, 2, and 3 mm were applied to the coater. As well as the depth of penetration into the powder bed, the current state of the process was also important, making it difficult to make an explicit statement, so a penetration depth between 0.1 mm and 0.5 mm was defined for further investigations. After these initial trials, however, it quickly became apparent that a stationary assembly of a simulated defect on the coater blade was not practical for further investigation, as the defect would be continuously implied with each layer. In order to train a CNN effectively, sufficient data from both the correct and defective process steps must be available. When it comes to the real-time monitoring of the process, and especially the simulation of randomly occurring defects, the defects must not occur permanently.
Based on these findings, a mechanical assembly was developed that is mounted on the coater blade and can be activated externally outside the machine. In order not to damage the machine, the activation of this defect simulation could only take place when the coater blade was in a certain area of the powder bed. To define the end positions of the coating blade, two limit switches have been fitted to the actuator cylinder inside the machine, as shown in Figure 4.
Within this time window, the coating defect can then be randomly simulated, controlled via a Raspberry Pi. The number of new layers after which the defect occurs can also be randomized. The mechanical actuation of the defect on the powder bed surface was achieved using components made from stereolithography-produced high temperature material mounted on the coating blade to withstand temperatures of up to 170 °C during the ongoing sintering process. This mechanical design includes a lever structure that can be operated from outside the machine via mechanical Bowden cables, as shown in Figure 5.
When the system is then activated during the application of a new layer of powder, contact is made with the powder bed surface and an artificially induced coating defect is created. Figure 6 shows the system in the activated state. In this study, a needle was used to simulate particle drag and the part shifting of small components. Depending on the depth of penetration into the powder, the intensity of the defect can then be individually adjusted.
The Bowden cables were routed inside the machine and then exited through a customized inspection hatch on one side of the machine. The mechanics were driven via two stepper motors using a lever system, which enabled very precise programming and control. The system could be used continuously under real conditions during the sintering process to produce a variety of coating defects, as shown in Figure 7.
This approach clearly demonstrates a novel and reproducible method of artificial defect simulation in PBF-LB/P without the risk of process termination. It was shown that the simulation could be run for many hours over several construction jobs to randomly generate defects without human supervision, in order to generate as much data as possible for both training the CNN and the subsequent classification of defective and defect-free images.

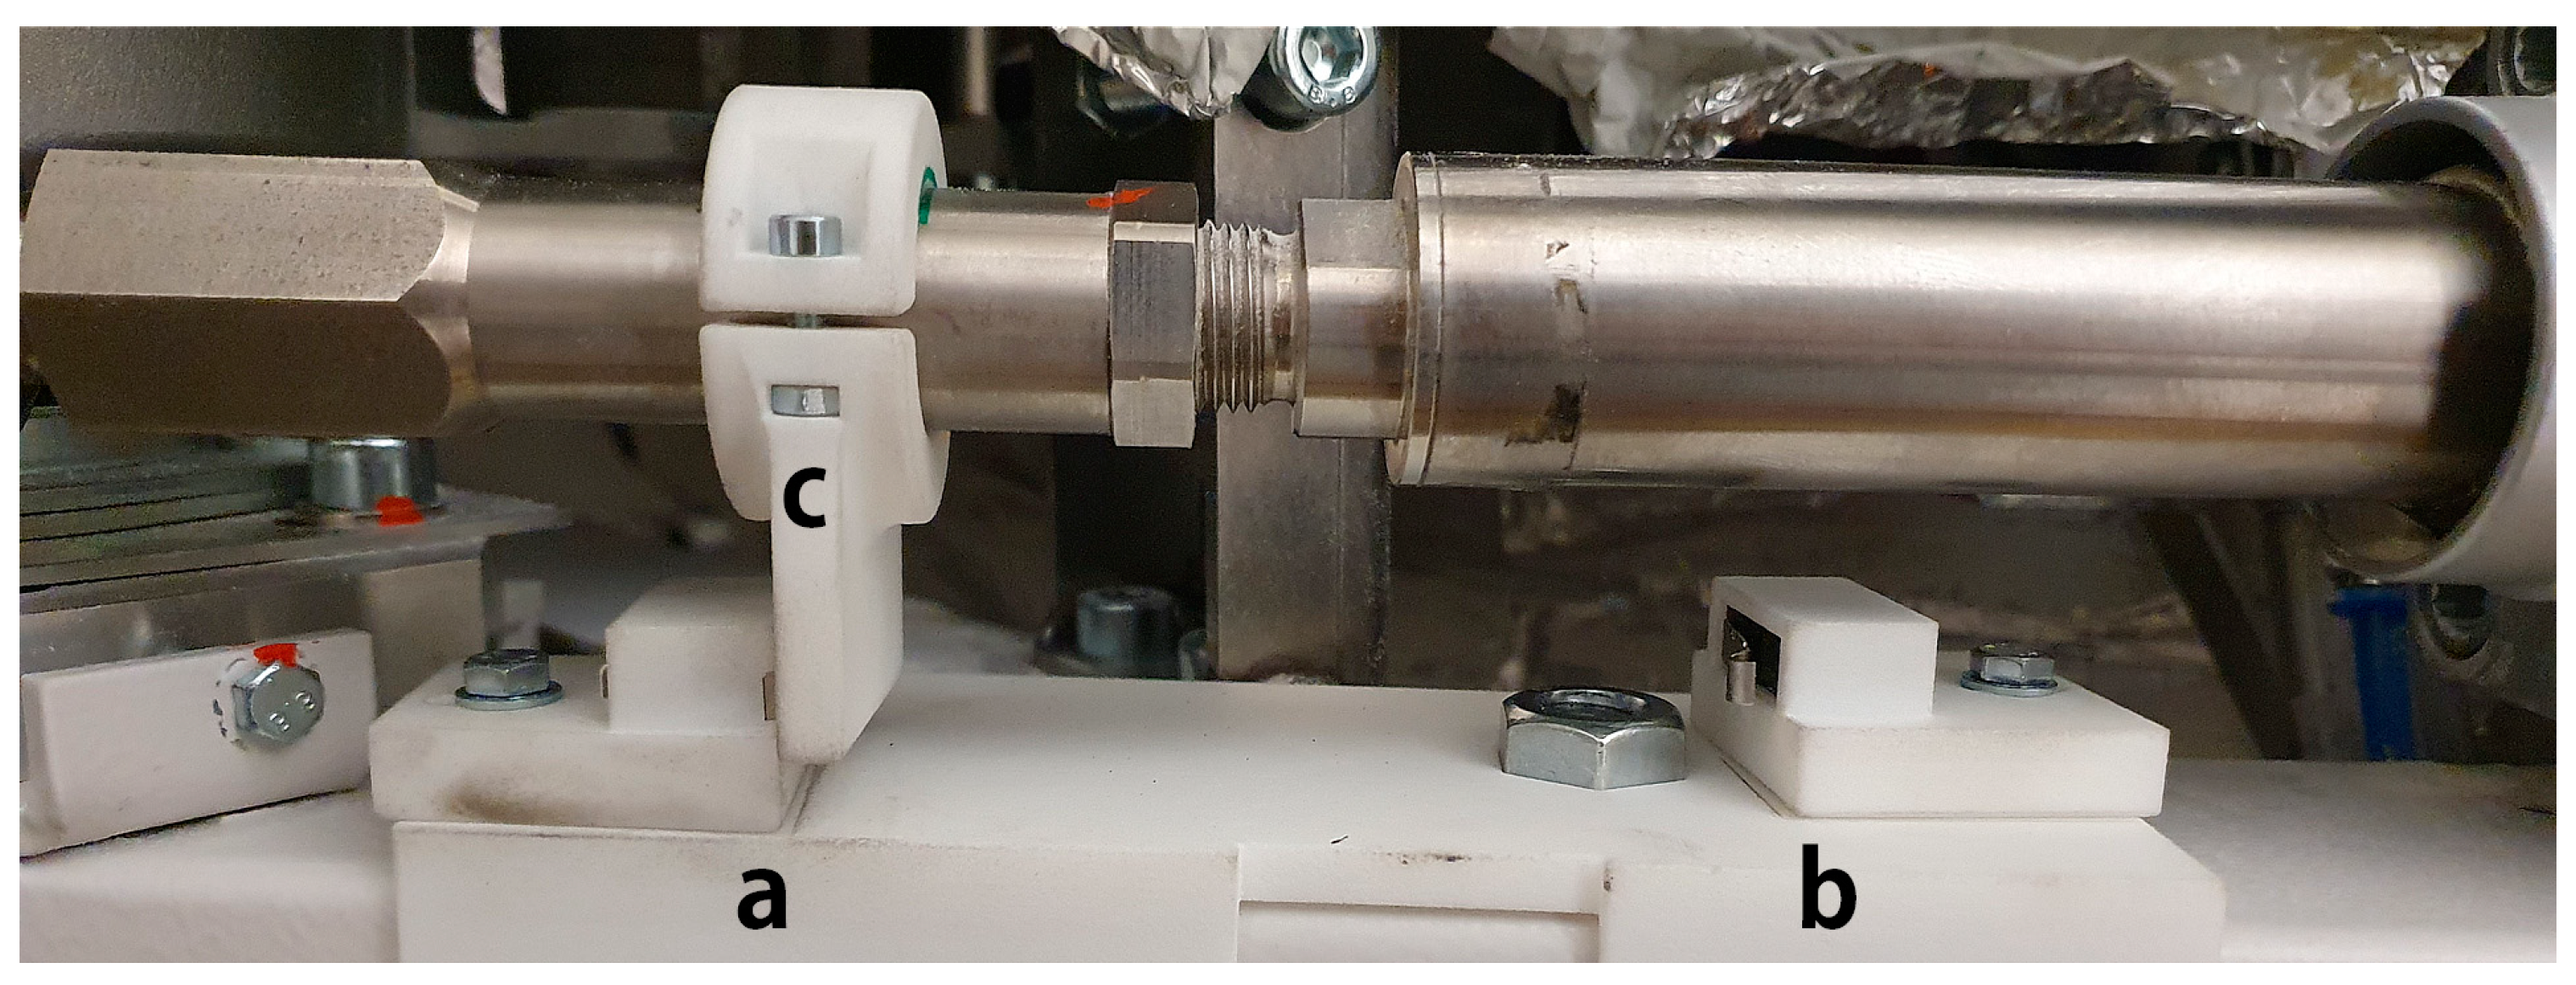
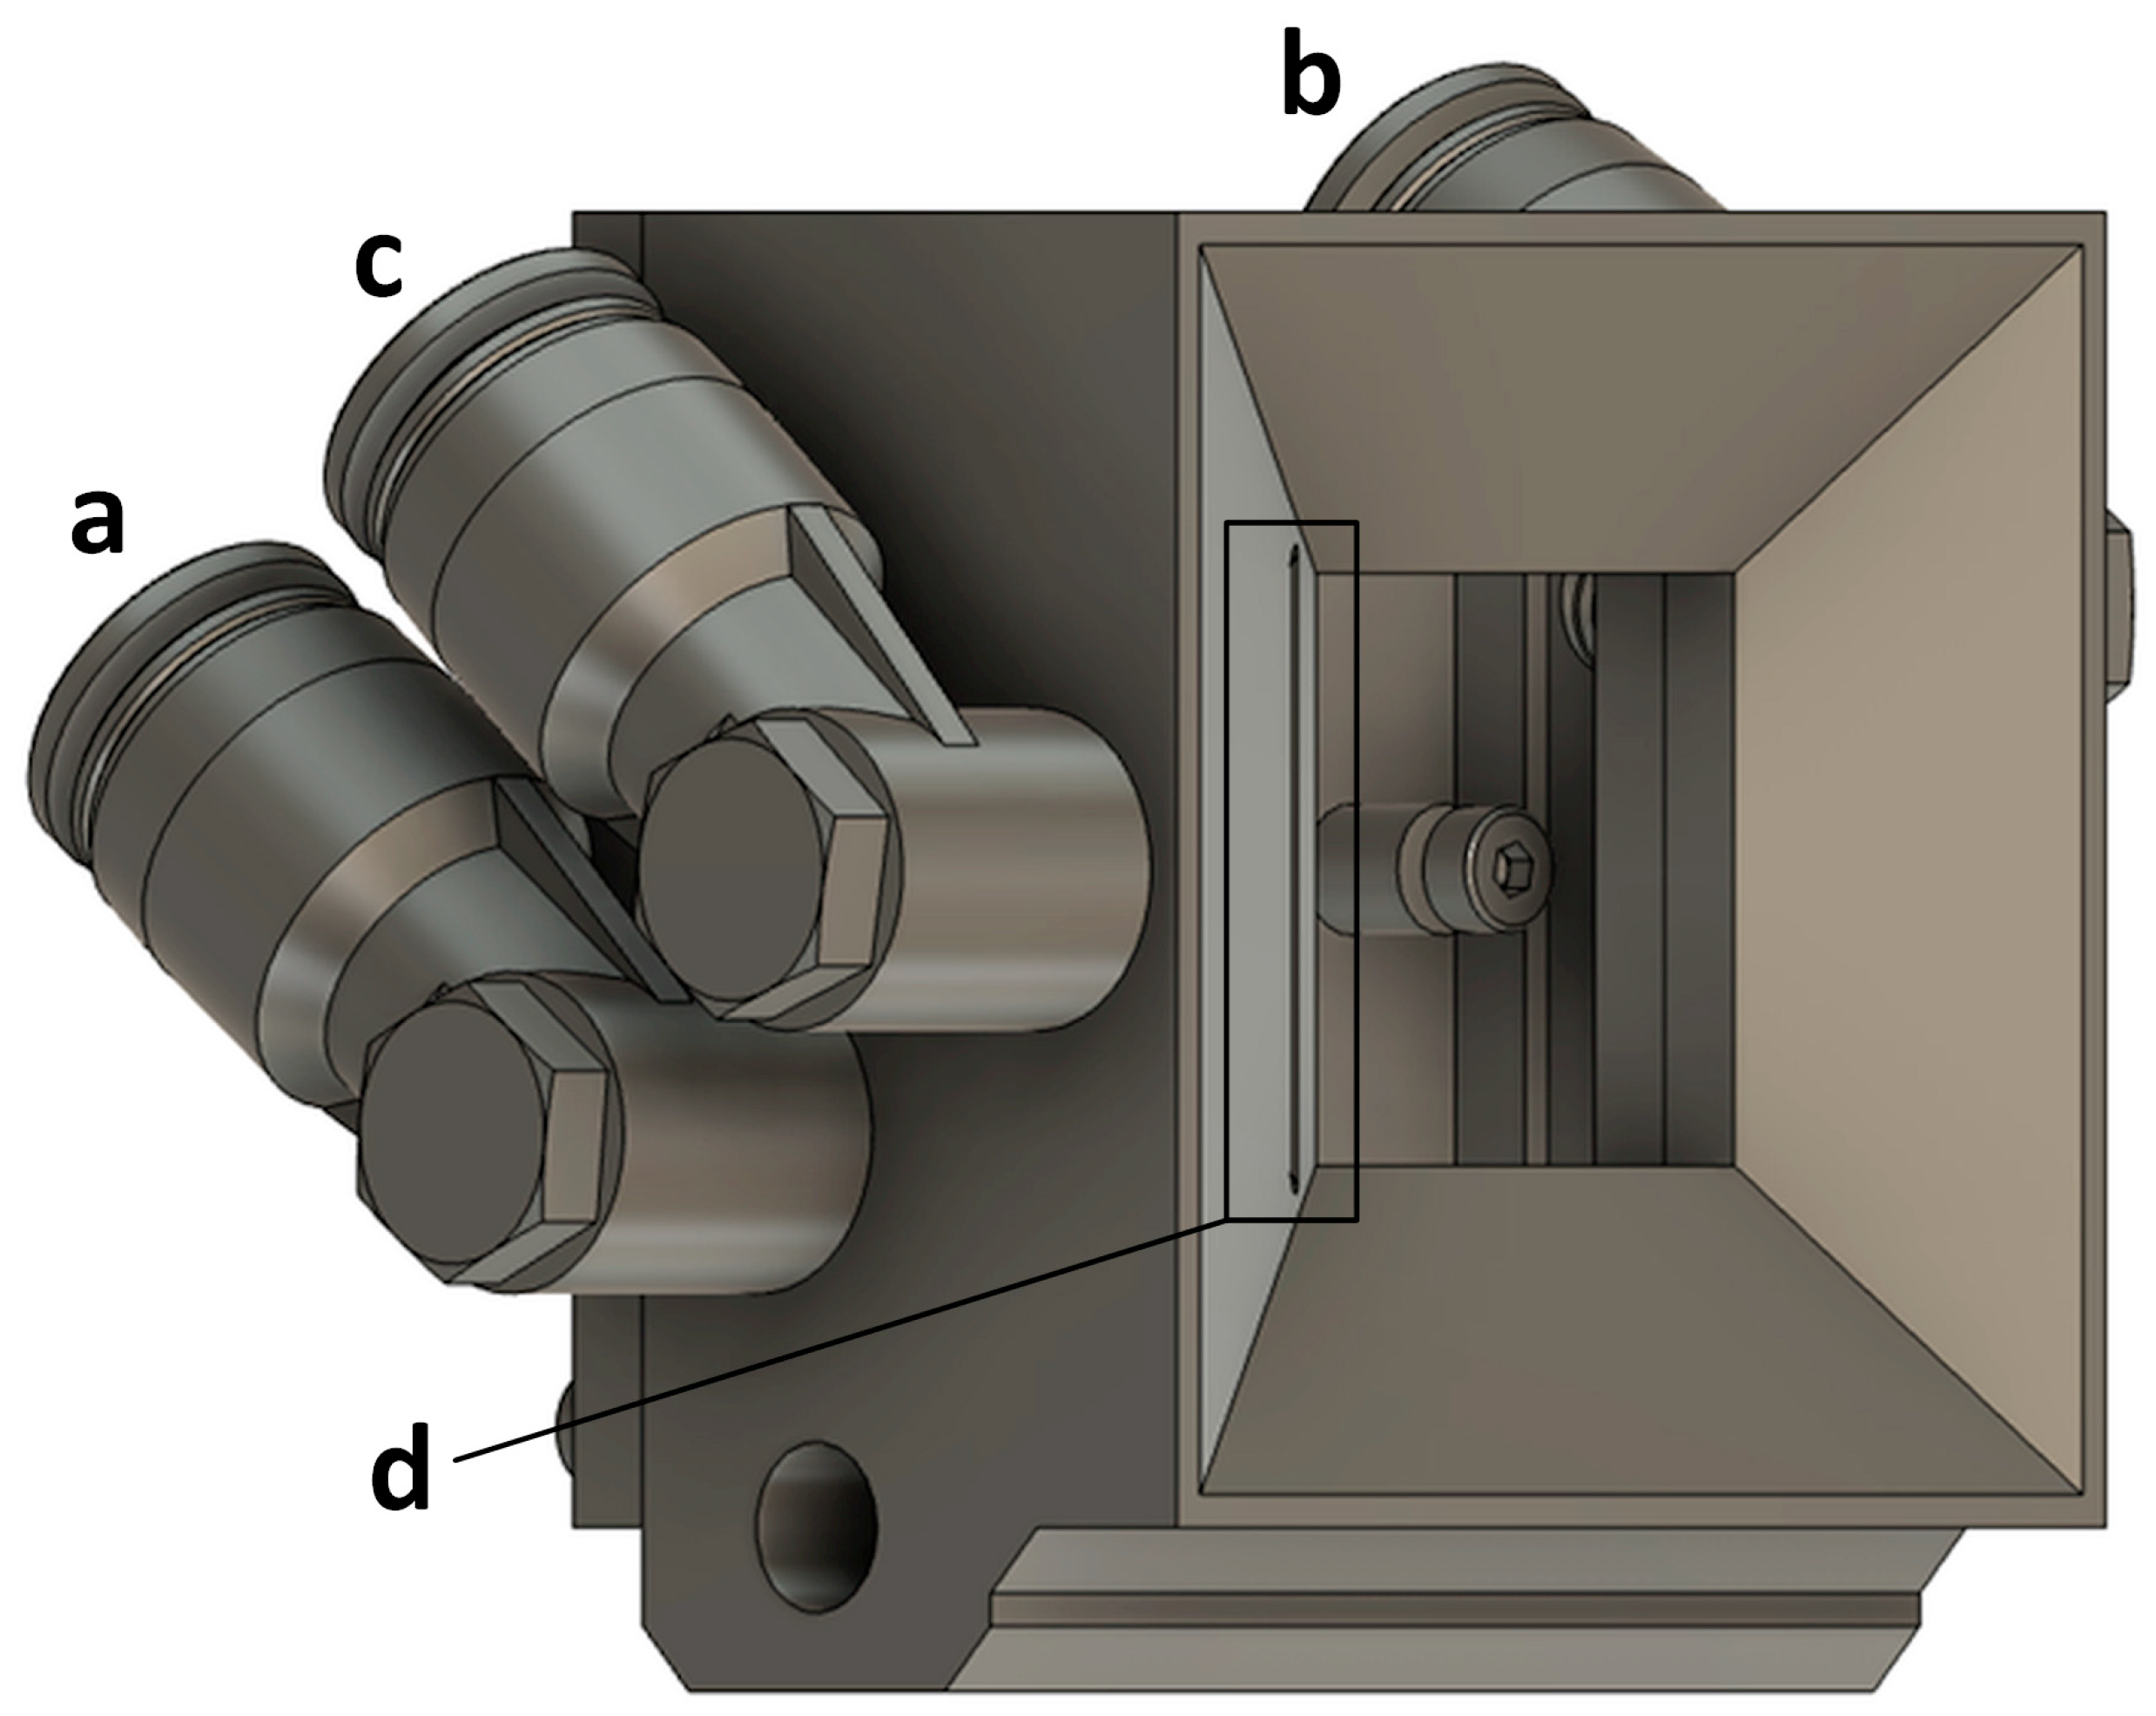
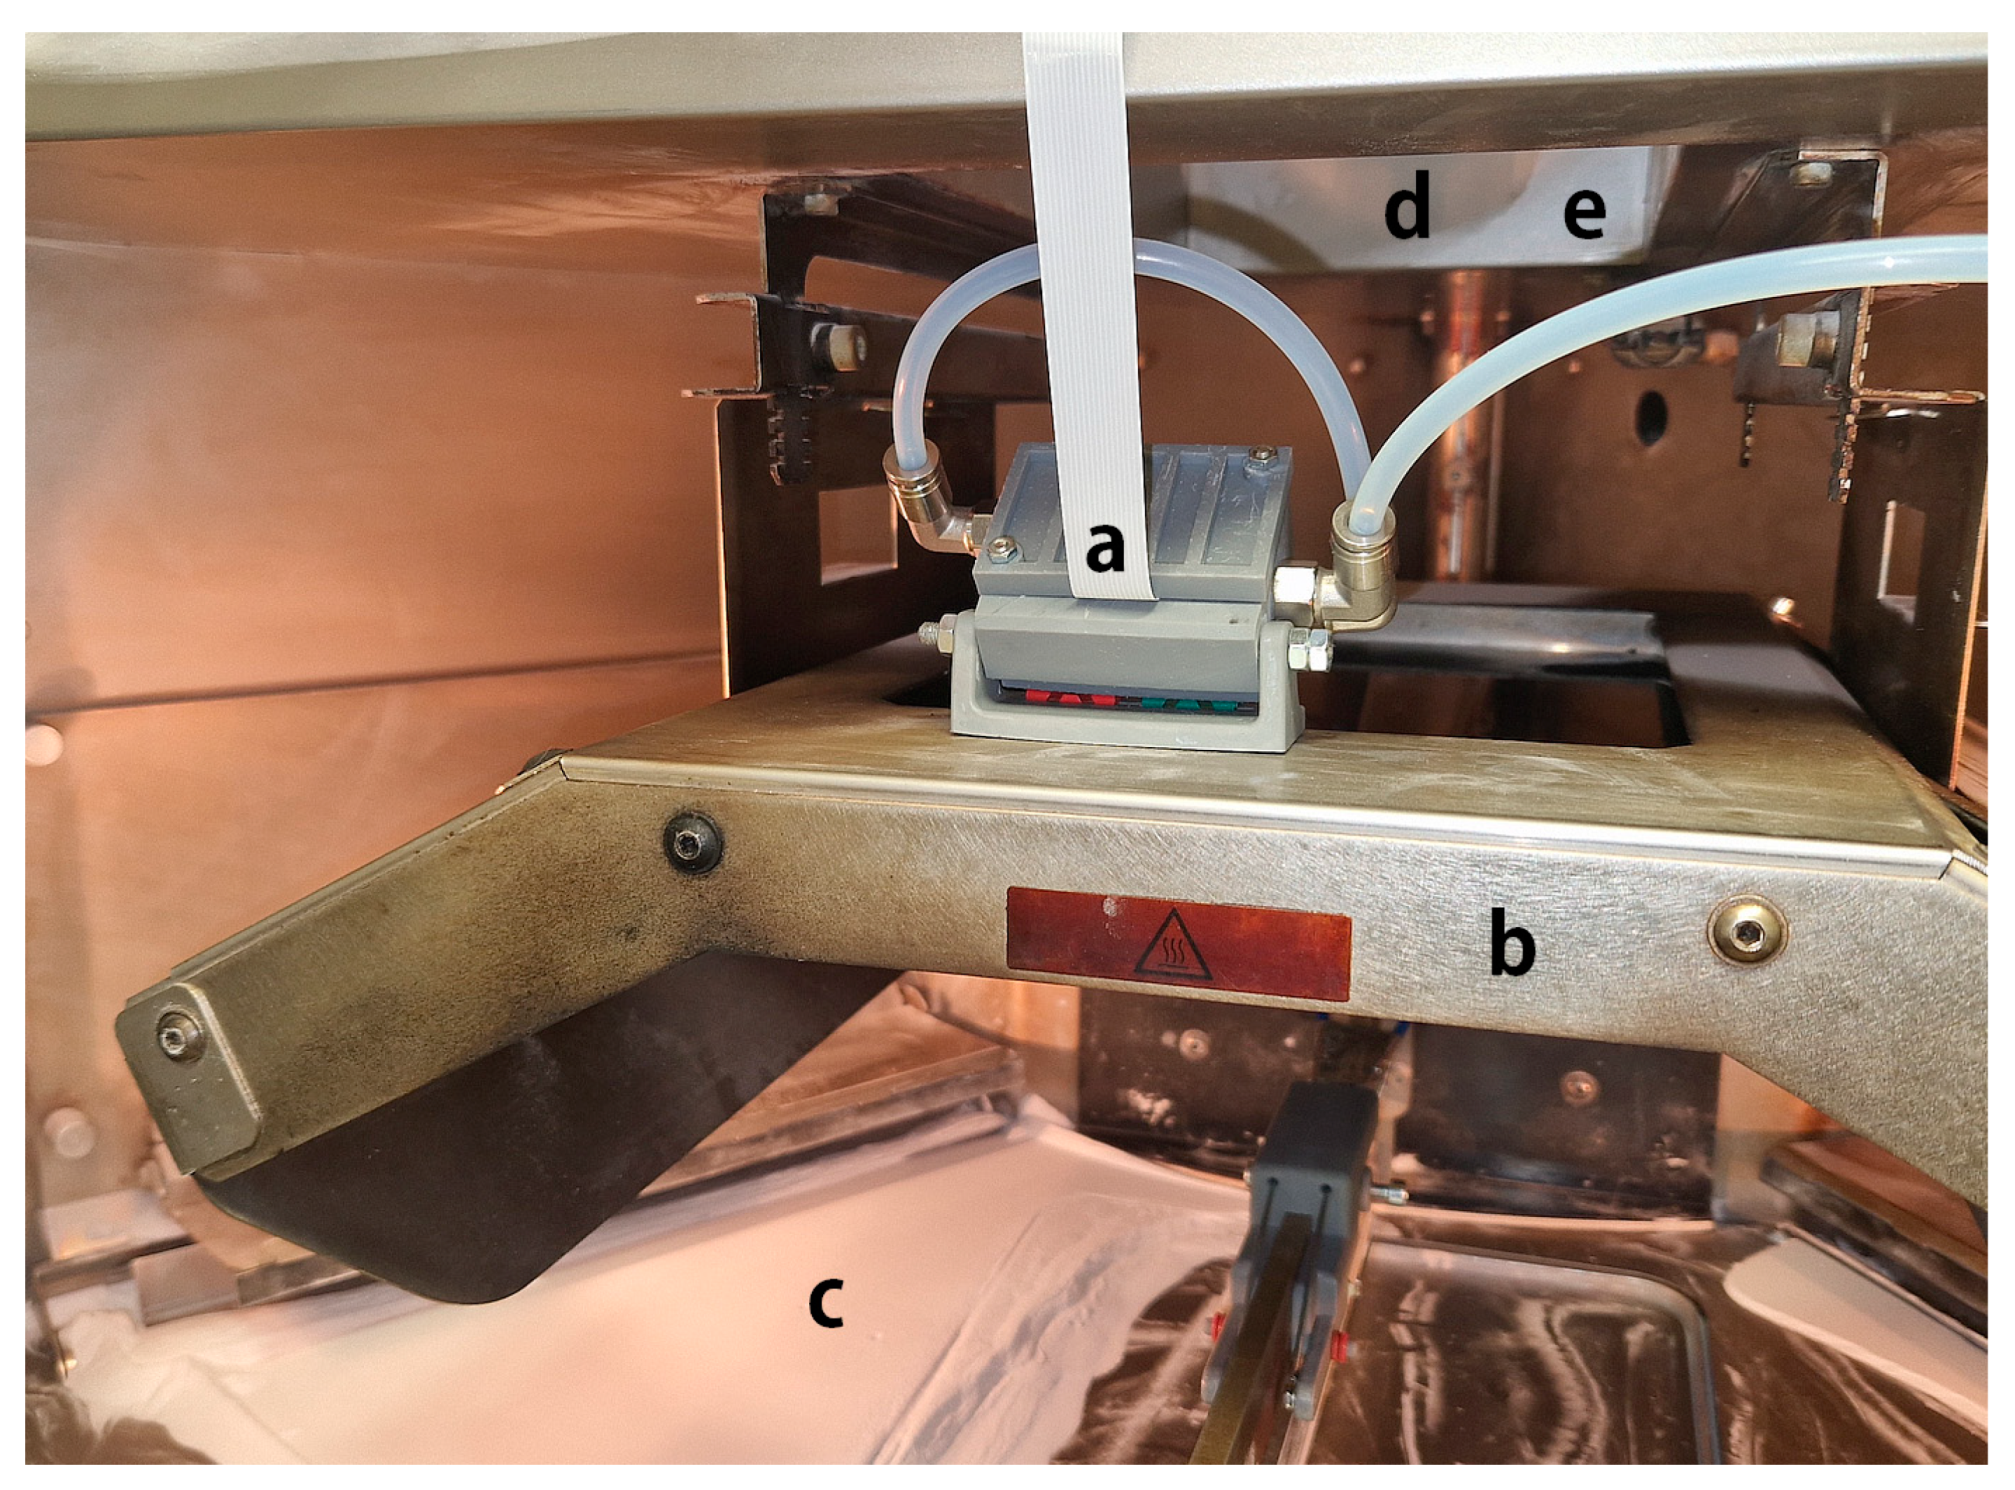
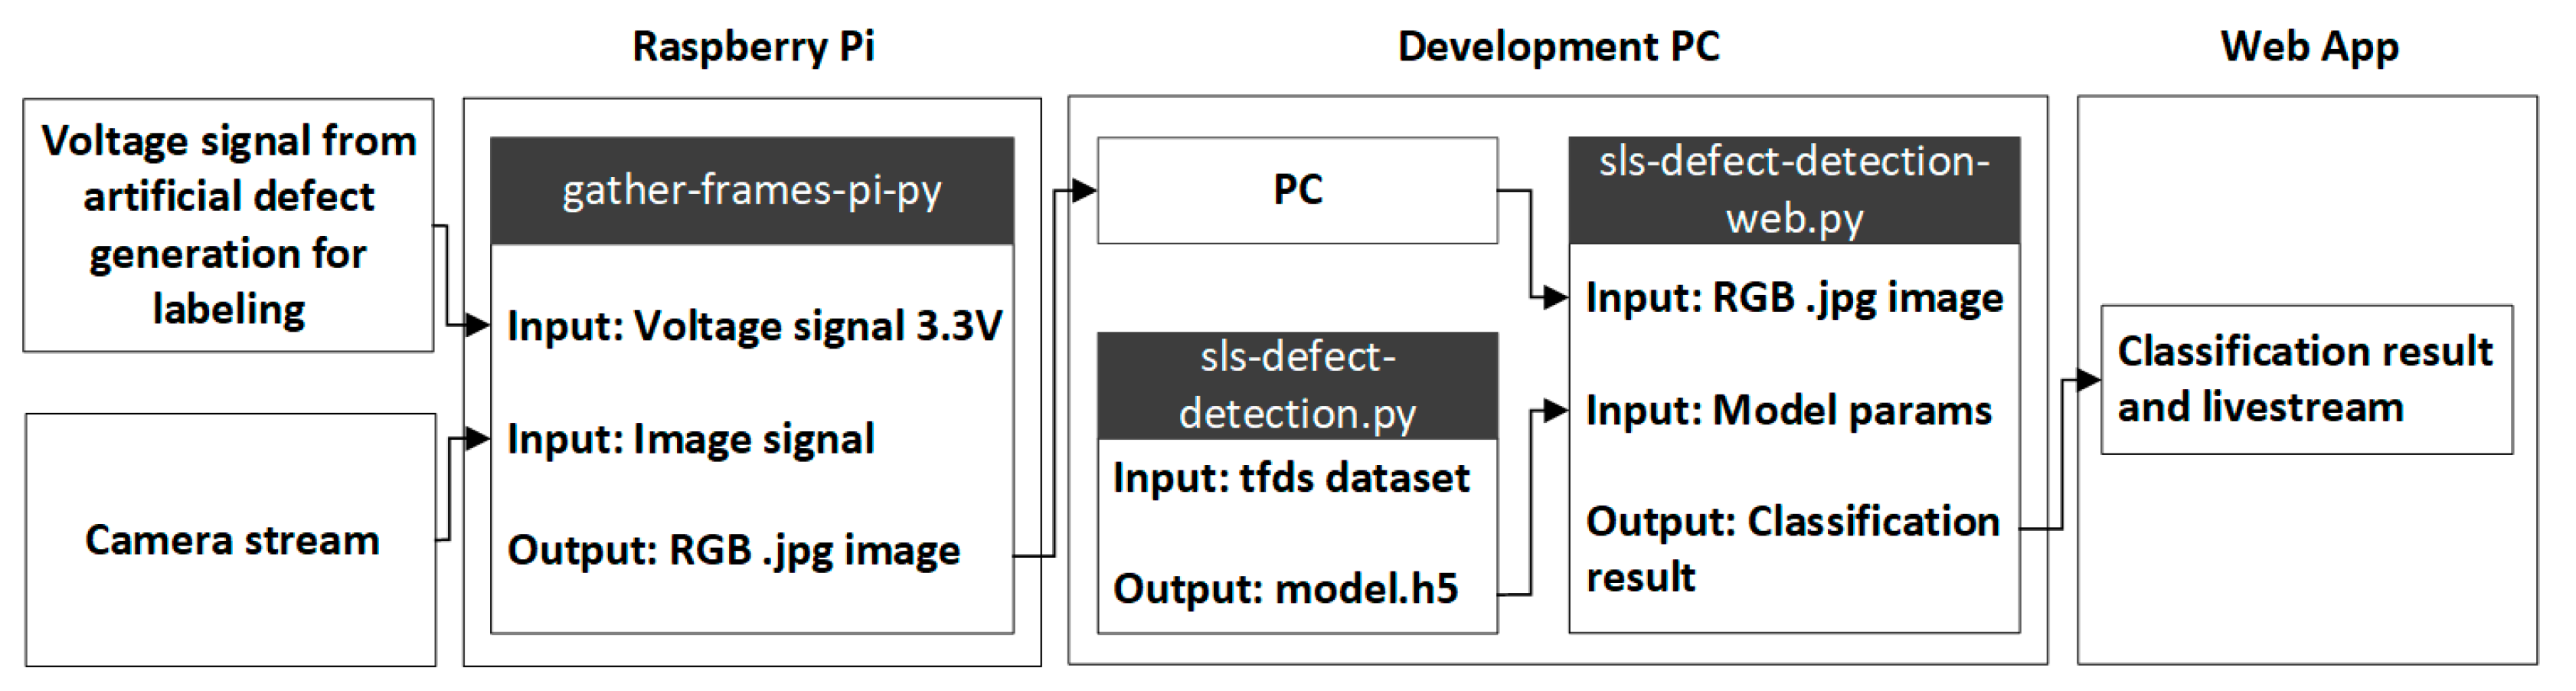
3.3. Camera Set-Up and Machine Integration

One of the main objectives of this study was to implement a suitable and low-cost process monitoring system for PBF-LB/P that allows both a simple set-up and operability as well as a permanent monitoring of the process without the need for complex experimental set-ups. It was also clearly shown that the non-machine-learning approaches to process the monitoring of PBF-LB/P and PBF-LB/M described in Section 1 were able to achieve the targeted results, but a complex test set-up with particularly cost-intensive measurement equipment was always required.
Based on the comparison of different camera systems, it was decided to use the Raspberry Pi Camera Module 2 for further investigation in this study. This HD camera module uses a Sony IMX219 sensor with 3280 × 2464 pixels and a maximum frame rate of 30 fps [74]. However, this inexpensive and readily available model has an operating temperature range of −20 °C to only 60 °C, which in turn raises the first considerations for a cooling option within the machine, as the temperature during the ongoing production process is more than 170 °C throughout. When the maximum operating temperature is reached, these components lose the signal due to their characteristics [75].
To summarize the key requirements for the cooling system, the camera housing should be additively manufactured and able to withstand a continuous operating temperature of 180 degrees. In addition, the camera lens must be flushed with nitrogen (N2) to avoid coating defects during the process due to evaporation effects. A camera housing was designed that is cooled via the machine’s internal N2 supply. There is virtually no information in the literature on solutions for cooling cameras or other measuring equipment used in the PBF-LB/P build chamber during the process. Only the study by Sillani et al. [25], in which the powder bed is measured using laser profilometry, mentions that the sensor is cooled inside the build chamber; unfortunately, no further information is available on the implementation of the cooling concept.
The components for the camera housing were produced on a stereolithography system using a high-temperature polymer. When cured, the resin can withstand sustained temperatures of just over 200 °C [76]. The camera window is a 20 × 20 × 0.13 mm piece of glass glued in place with high-temperature silicone. An additional line was installed on the N2 generator and routed into the machine’s build chamber. This leads into the body of the camera housing so that the camera is cooled throughout. The N2 then exits the other side of the housing and is returned to the housing via an additional line to flush the glass with an air-knife. The design of the cooling system is shown in Figure 8.
Tapered and airtight, 1/8” stainless steel fittings were installed, as shown in Figure 8. The positioning on the heating system was such that the entire powder bed could be captured at the best possible camera angle, as can be seen in Figure 9.
In summary, this approach provides a low-cost solution to capture the complete powder bed surface of the PBF-LB/P system with a standard RGB camera. The design of the housing allows the camera to be cooled, ensuring long-term use under the process conditions, even over multiple build jobs. By using the machine’s internal N2 generator, no external supply of coolant is required. This system enables permanent process monitoring without complex and cost-intensive test set-ups and the generation of high-quality data for evaluation using CNN.

4. Design and Optimization of the CNN Architecture

4.1. Data Quality and Interfaces

A custom Convolutional Neural Network (CNN) designed to identify particle drag is the method of choice for this evaluation. These deep learning networks are specifically designed for image classification and offer a high degree of customization via the layered structure and tuning of hyperparameters. The design is optimized for portability, so it can be used on devices such as standard laptops, workstations, and Raspberry Pi. Seven datasets were generated using the proposed method described in Section 3, containing various types of defects such as part shifting, particle drag, and powder contamination on different manufactured part shapes and also including an additional defect called overheating. Overheating can be caused by the manual cover of the internal pyrometer and leads to uncontrolled fusion of the powder bed surface. Table 2 shows the datasets by characteristics.
The data was automatically labelled by interfacing with the defect induction mechanism using GPIO pins on the Raspberry Pi and Arduino Mega, which control acquisition and induction, respectively. This allowed a lot of data to be labelled automatically without time-consuming sorting and the viewing of frames. The consolidated dataset was used for training purposes only. Evaluation results are derived exclusively from the test dataset. It was checked both manually and automatically using a custom function that the latter did not contain any duplicates found in the training data, so as not to bias the results. Figure 10 shows the applied interface structure with the communication, the data hierarchy, and the concept for automated labelling by signaling via the mechanical structure for defect generation.
As can be clearly seen in Table 1, there is a large difference in the amount of data divided into classes. More precisely, this imbalance can lead to classification problems in the field of computer vision [77]. This phenomenon can be avoided via a method proposed by Cui et al. [78], which uses a class-balanced loss by designing a reweighting scheme that uses the effective number of samples for each class to rebalance the loss, resulting in a class-balanced loss. By implementing an imbalance factor, the weights are adjusted based on the class imbalance, whereas a cross-entropy loss function does not address the unbalanced classes. Further steps are described in more detail in Section 4.3.

4.2. Initial Setup

The proposed setup has been evaluated for use with TensorFlow 2.0 (TF), Keras, and PyTorch (PT) open-source libraries, which are used to develop CNN in Python. All three libraries use both tensor data storage and neural networks as computational operational graphs, as well as automatic differentiation. TensorFlow implements more complex learning but provides a broader feature library than PT. The Keras library is implemented on top of TF and simplifies the learning process, albeit with slightly higher test environment accuracy but longer training times [79]. However, TF’s installation process is more complex than PT’s due to the lack of native GPU support [80]. PT, developed by Meta, has built-in GPU support for Apple Silicon, making it easier to install [79], and beats TF in the operating time cycles. Despite these differences, there is no objective superiority between the libraries [80]. In the end, TF was chosen to develop a custom CNN for defect identification, with portability for use in a variety of field devices, such as a Raspberry Pi or a standard laptop. Development was carried out in a virtual environment using Python 3.10.10.

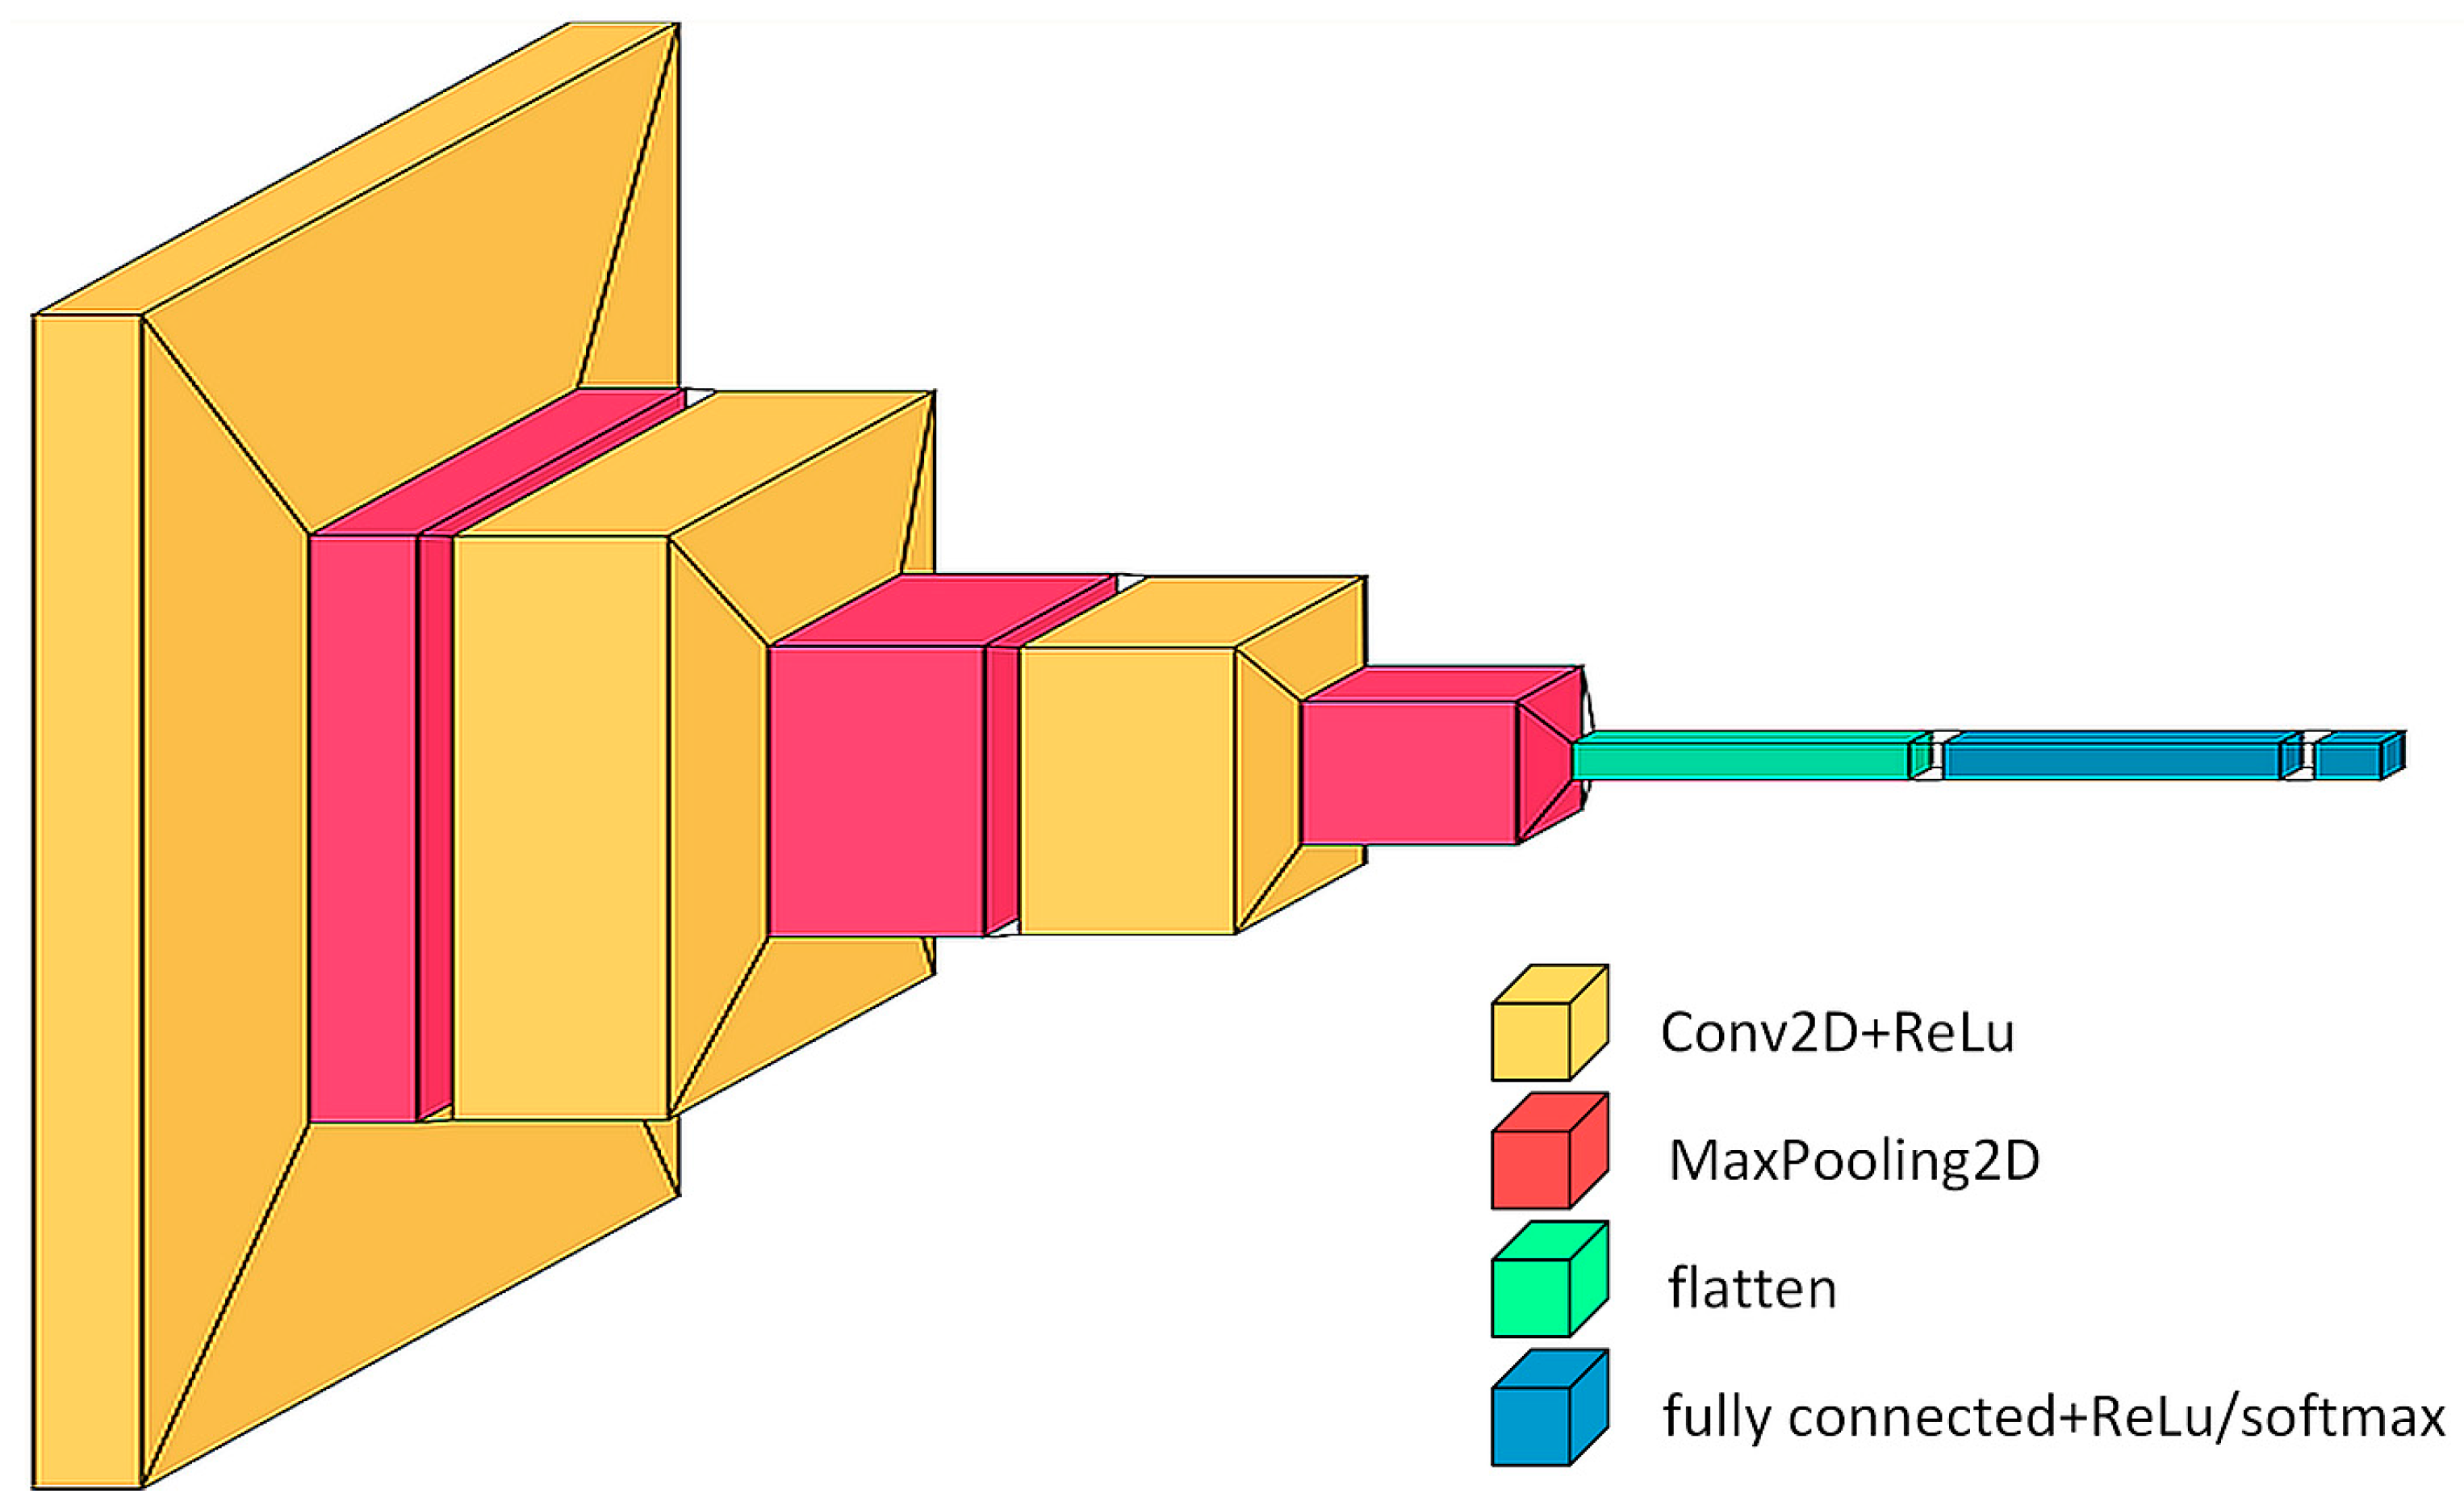
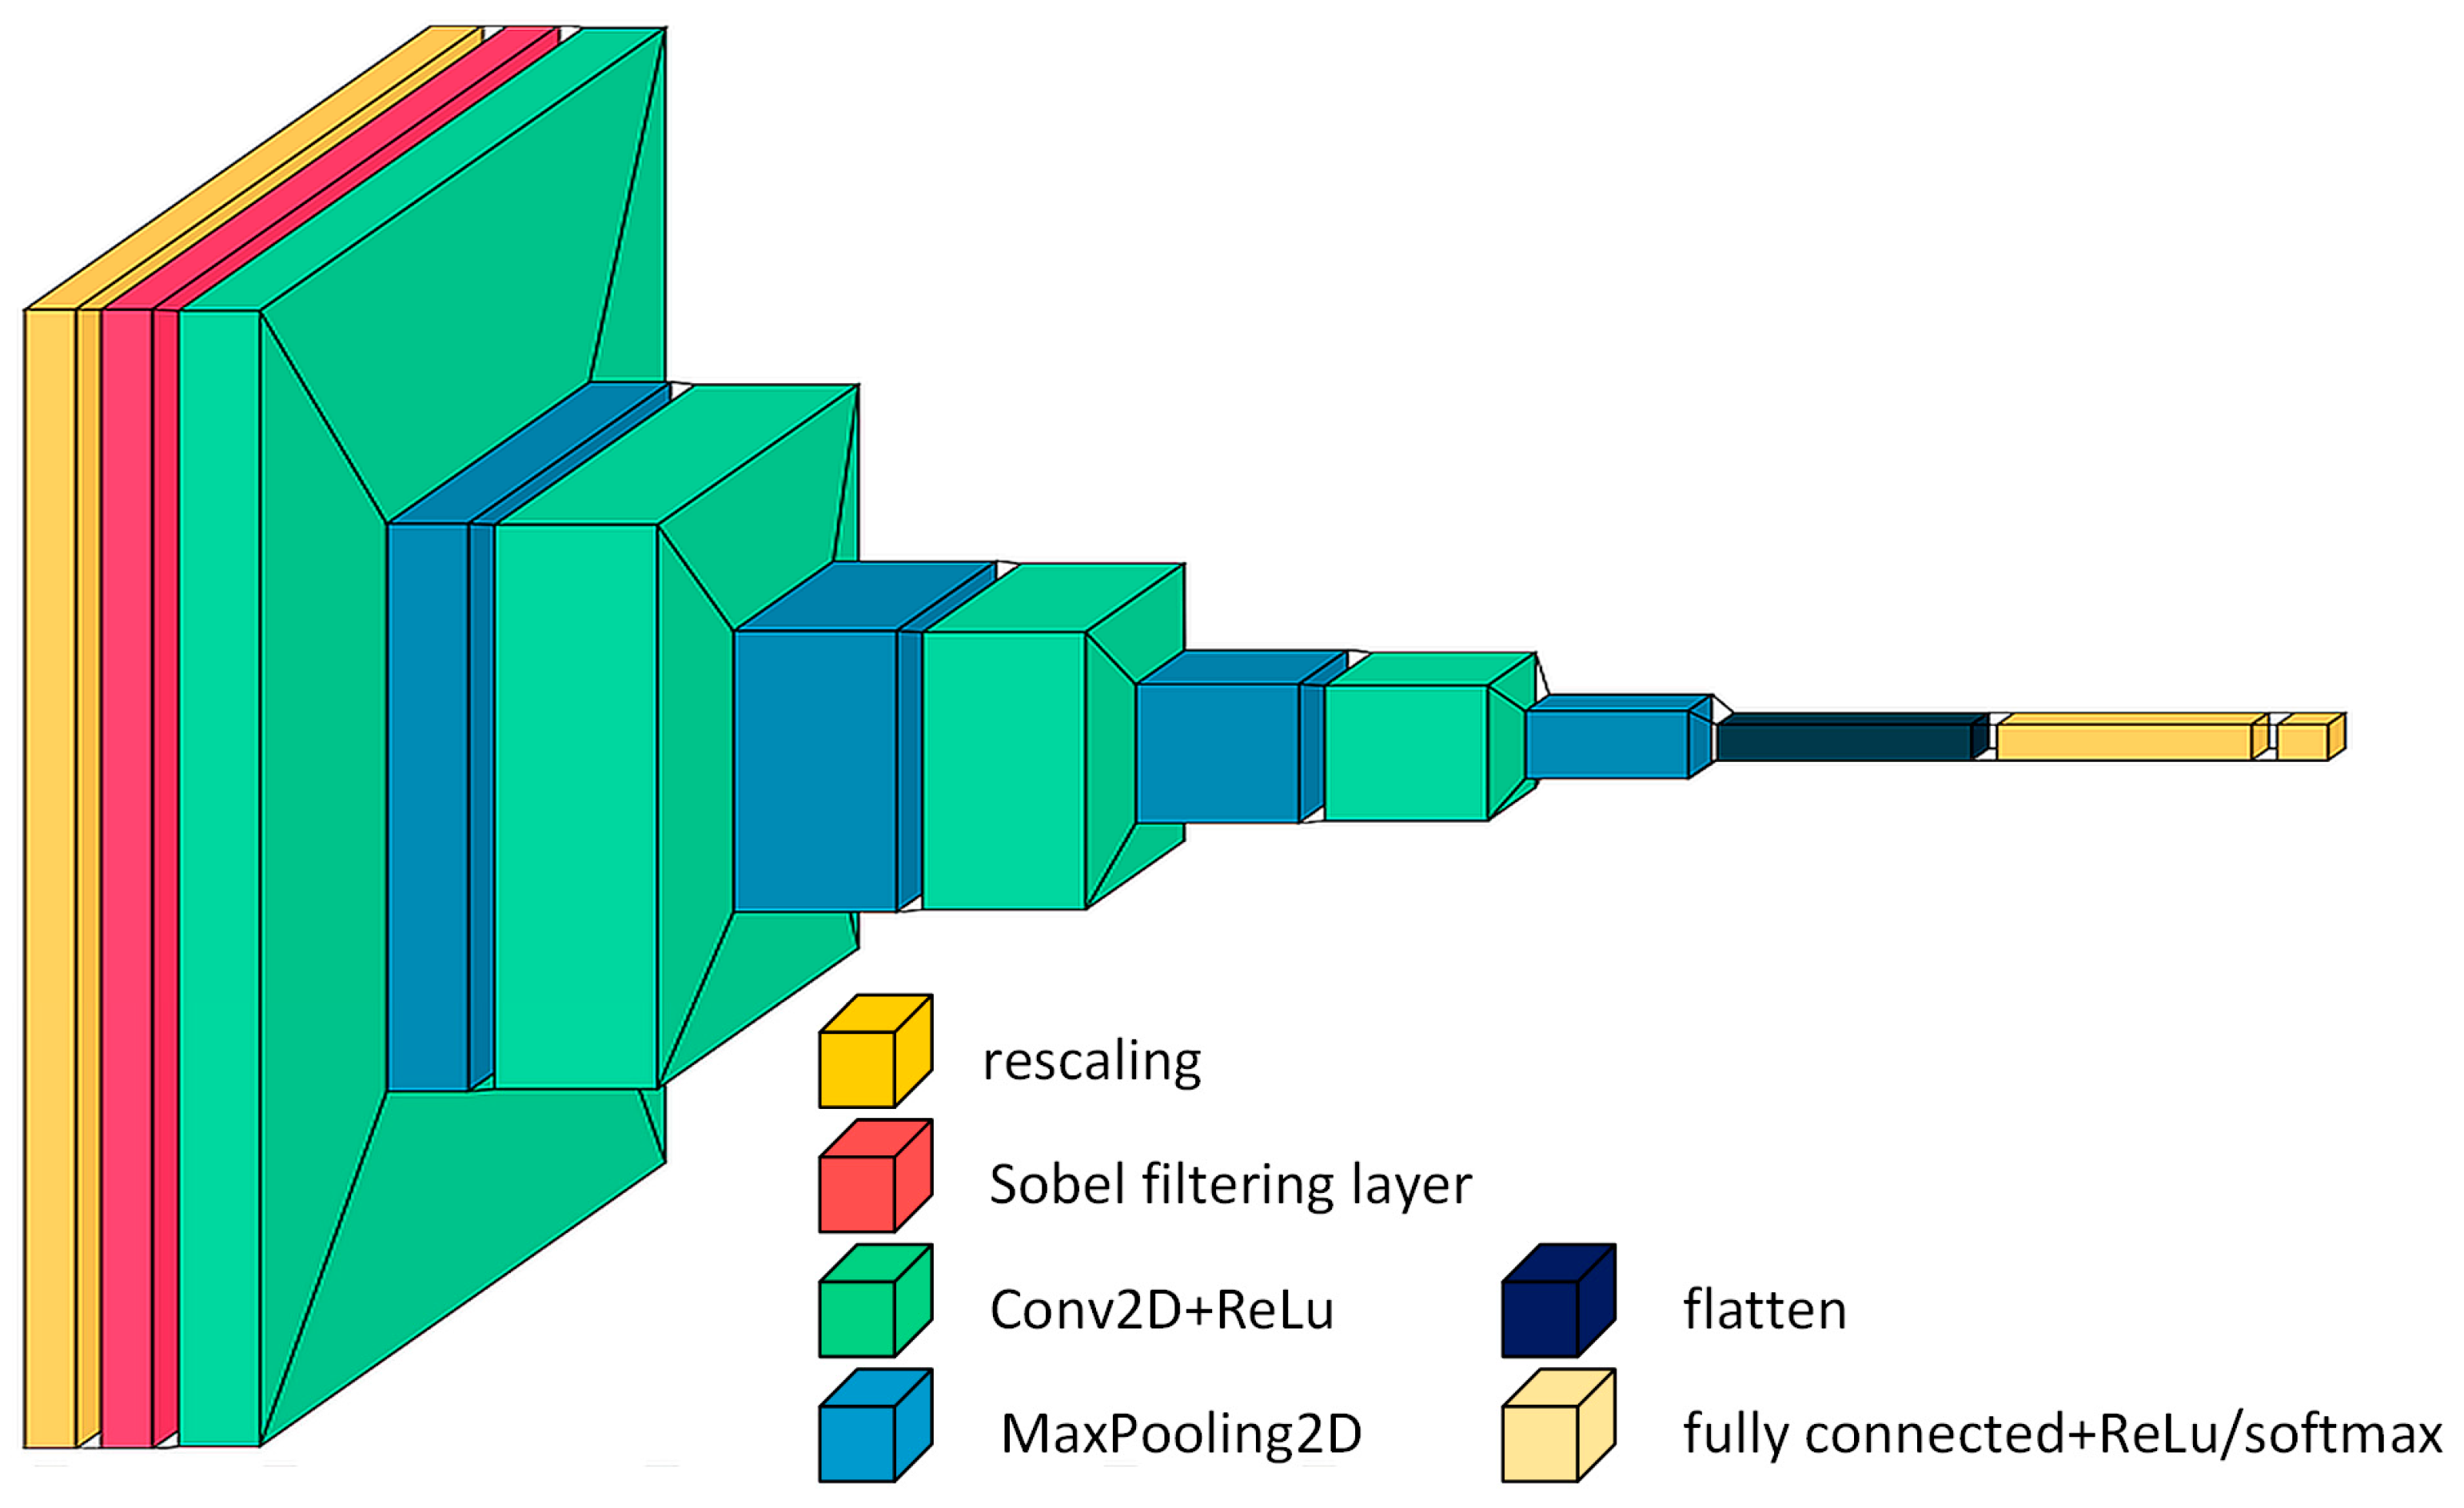
4.3. Model Architecture

The data preprocessing involves the removal of corrupt images and the loading of the data as a data set object using a directory function. This provided a quick way to ingest new data without a custom pipeline. The basic model used in this study adopts a training, testing, and validation split of 6:2:2. The input image shape is 480 × 640 pixels, with three channels following the RGB color chart. At the beginning of the model architecture, there is a Conv2D layer with a set of 32 filters. These filters are 3 × 3 in size and a convolution of stride 1, which acts as a feature identifier. Stride indicates how many steps are moved in each step of the convolution. This layer uses the ReLU activation function to introduce non-linearity, which is critical for handling real-world non-linear data. Following the Conv2D layer, a max-pooling operation is implemented for 2D spatial data for non-linear down-sampling, which divides the image into non-overlapping rectangles and outputs the maximum value for each sub-region, reducing the resolution of the feature map to simplify the computation and minimize overfitting. The model uses two more such pairs of layers, containing a series of 64 filters in the Conv2D section. These layers are used to recognize higher-level features, such as shapes or defined objects, via progressive learning and abstraction. A transformation of the pooled feature map is performed via a flattening layer after abstraction. The single column output of the transformation is then transferred to the final fully connected layers. High-level inference on the extracted features is then performed via a subsequent dense layer of 256 neurons using a ReLU activation function. Softmax activation is used by the final dense layer of the basic model to produce a two-class probability distribution indicating the model’s prediction of the input image. Figure 11 shows the design of the basic model architecture, which was then used as the basis for further adaptation.
As mentioned in Section 4.1, the class imbalance was tackled using the “Class-Balanced Loss” by Cui et al. [78]. Based on cross-entropy, this proposed loss function quantifies the performance of a model architecture that outputs the probabilities between two values (0/1). It can be used for both multi-class and binary classification. It shows an increase when the predicted probability deviates from the actual label [81]. If there is an imbalance, the classes are treated in the same way, which can lead to overfitting on the output. The weighted cross-entropy (WCE) used in the proposed method is calculated by applying these weights to the cross-entropy, a widely used loss function in classification problems that does not take into account the probabilistic distribution [82].
The required scalar value of the WCE loss is obtained by calculating the mean of the elements across the tensor’s dimensions. A study by Smith [83] identified the learning rate as a critical hyperparameter to be iteratively adjusted in deep neural networks to improve the model performance. The technique of “cyclic learning rates” describes a process where one starts with a lower learning rate that increases exponentially with each batch. The final iteration of the model trains an edge detection model using a Sobel filter. The idea was to explicitly detect grooves in the powder bed, i.e., sharp edges. Since defects such as part displacement or particle drag leave ridges in the powder bed, this approach produces a classification. Figure 12 shows the original image of a simulated defect and the image after Sobel filtering.
The final proposed model architecture based on the previous model is shown in Figure 13.

5. Results

To avoid distorting the results or creating a bias, only the test dataset was examined in more detail and used for the evaluation. However, TF does not include a function to output the F1 score, so a separate category had to be implemented for this. An evaluation script was used to compare the results of all model iterations and the results are shown in Table 3.
The results in the table clearly show how the performance of the model could be improved by adding new layers and adjusting the parameters. Accuracy was increased from 72.32% in the base model to 99.11% in the final model architecture by adding the WCE loss function, the learning rate scheduling, and the Sobel filter layer. After 10 epochs, the final model also achieved a 99.1% precision and an F1 score of 99.1%.
During the evaluation of the model, Grad-CAM heat maps were rendered for each image to provide insight into the model’s predictions. Gradient Weighted Class Activation Mapping is a class-discriminative localization technique that makes any convolutional neural network model more transparent by providing visual explanations [84]. This method, implemented via the “make_gradcam_heatmap” function, highlights sections that have significantly influenced the model’s prediction. This function takes four inputs as the image to be scored, the last layer of the model, the trained network, and the value of the predicted class to generate the explanatory heatmap. Gradients are calculated using the TF’s GradientTape function, a tool that documents operations for automated differentiation. It determines the gradients of the predicted class in relation to the output of the previous layer. The function averages the calculated gradients over each feature map in the output of the last convolutional layer, producing a set of individual weights for each feature map used. The feature maps are then multiplied by the assigned weights to produce weighted feature maps. A visual heatmap per class is then created by using the output images from the previous layer and calculating their weighted sum by averaging the resulting maps across all channels. The Grad-CAM images generated for each frame during the evaluation provided a visual explanation of the classification process. The randomized evaluation of these heatmaps clearly showed that the correct areas were marked and that the accuracies listed in Table 2 were correct and not due to false convergence. The Grad-CAM heatmaps make the classification of the CNN comprehensible and visually highlight the areas that were crucial for the prediction results.
In order to assess the actual usability of the custom CNNs used, a random comparison of the original frames with the Grad-CAM heat maps was performed, as shown in Figure 14. As can be clearly seen, all images without defects were classified as “True: ok” and “Predicted: ok”. In contrast, the images with a detected defect were classified as “True: defect” and “Predicted: defect”. During the various build jobs carried out as part of this work, attempts were also made to produce component geometries that looked as close to a defect as possible, and these geometries were also not classified as defects according to the Grad-CAM heat maps.

6. Discussion

This paper proposes an approach for real-time process monitoring and in situ defect detection in PBF-LB/P using a low-cost camera solution and a custom Convolutional Neural Network for data analysis and defect prediction. As previous studies have shown, the artificial creation of defects in powder bed fusion is severely limited by the ability to manipulate the process parameters, so new ways must be found to simulate these defects and further investigate their effects on the process. These approaches have shown promising results in the generation of curling and the detection of this effect via sensory measurement of the powder bed using laser profilometry, as shown in [24,25], and process monitoring using thermal imaging and CNN [35]. In order to investigate the effects of other defects on the process, a new method had to be developed that would influence the process in an independent mechanical way without causing a process termination. This is the only way to take a further step towards holistic process monitoring via defect detection. A mechanical assembly was therefore developed and mounted on the coater blade, which then penetrates the powder bed to a defined depth in a reproducible manner via an external actuator system. Controlled via a Raspberry Pi and triggered by an end switch on the coating blade actuator, the defects were randomly generated and the test series could then be run over several build jobs without the need for human intervention.
Many of the approaches discussed in Section 2 have already shown that deep learning computer vision is a mature method for monitoring various manufacturing processes, using supervised, unsupervised, GAN, and hybrid convolutional neural networks to detect or predict various defects. The use of a CNN enables the automated detection and segmentation of objects by learning spatial hierarchies of features from low to high-level patterns. In this case, a camera solution based on a Raspberry Pi Camera Module 2 was used to generate the data for training a CNN. In order to generate as much and as varied data as possible to train the CNN, several processes were filmed and the individual frames were automatically labelled via a separate interface triggered by the defect generation. The chosen camera system is low cost but offers a resolution of up to 8 MP. However, it was found that the resolution had less of an impact on the defects detected than the illumination, so the full capabilities of the camera were never used. This can be explained via the use of several filters and abstraction by means of a Sobel filter, depending on the model chosen. If, for certain applications (e.g., very small defects), the resolution were to be blamed for the poor performance, this approach would allow it to be increased simply by modifying the code, but in the setting chosen, this was not necessary, and both the file size and processing speed were favored.
There are already many well-known CNN model architectures [85] that can be used to classify the different tasks [86] and have been proposed in several studies as already discussed. In this study, a custom CNN has been proposed whose architecture is based on a standard model that includes Conv2D layers, MaxPooling2D layers, flattening, and fully connected dense layers to output two possible classes, indicating the model’s prediction of the input image class (0 or 1). The basic architecture was then gradually adapted and extended to achieve continuous performance improvements. To avoid class imbalance, the weighted cross-entropy loss function was added, increasing the accuracy from 72% for the base model to 98%. This method has already been proposed by Cui et al. [78] and leads to the avoidance of overfitting in the case of class imbalance caused by a large number of frames without defects and a relatively small number of frames with a detectable defect. In the first step, the standard cross-entropy values were calculated, followed by the extraction of each class label, resulting in the output of the highest value on the tensor axis. The (predefined) weights are then determined according to the class labels. The pre-defined weights provide the ability to highlight classes during training. The next step was to add learning rate scheduling to the model architecture. This method of cyclic learning was introduced by Smith [83] and results in an increase in the learning rate with each batch of data by starting at 0.001 for the first five epochs and then increasing exponentially. Accuracy has been improved by a further 0.5% to 98.5%. The scheduler is based on a mathematical decision of the fastest loss minimization. The final adjustment to the model architecture was the introduction of a Sobel filter which resulted in a final accuracy of over 99%. The simulated defects leave edges in the powder bed, and these sudden image discontinuities are detected via this edge detection [87]. The assumption was that edge detection would be well suited to this, as the abstraction makes defects visible rather than the actual components in the powder bed. The direction in which the intensity increases the most is represented by an image gradient. Consequently, a discrete variation is used to distil the concept of a derivative or gradient. Greyscale conversion is performed before the images pass through two directional Sobel filters stacked on top of each other.
The results of this study show that with the implemented method of artificially generating coating defects, a large dataset of defect-free and defective frames could be generated to successfully train a custom CNN for classification with very high accuracy. Manual comparison of the automatically labelled data with real labels has shown that random defects are correctly labelled. This is only true in any chosen setting and after manual validation—while an educated guess can be made about the detection rate, the best results are only expected when a manual check is performed. As the defects tend to occur randomly, the likelihood of a recurring defect being mislabeled is low—however, if it were to occur, the impact on a real-use case would be proportional to the severity of the mislabeled defect. While a decrease in the accuracy is likely to be small, a serious problem that goes undetected because it was mislabeled during training could affect the entire manufacturing process. A continuous increase in the accuracy was observed by tuning the hyperparameters and by adding and combining previously presented and well-established additional functions. This approach has clearly shown that it is not necessary to use a particularly high-resolution industrial camera system for monitoring; as long as the camera is positioned in the right place, the interfaces for the data transfer are correctly defined and the CNN architecture is properly designed.

7. Conclusions

The evaluation of the results clearly shows that the application of the custom CNN developed in this study is capable of detecting the artificially generated defects with an accuracy of over 99%, and a further step has been taken towards possible process monitoring. It has once again demonstrated and confirmed that the application of deep learning is suitable for monitoring industrial processes and providing data that can then be used in further steps to actively intervene in the process. As it is otherwise hardly possible to intervene in the running process, the developed mechanical set-up shows a new possibility to simulate defects. Compared to the experimental sensor-based methods of process monitoring, this study proposes an effective method of defect detection and process monitoring that only requires sufficient training data with many different component geometries and scenarios of the process. This approach proved capable of providing real-time data analysis via the CNN and an online interface. This is followed by a discussion of the next steps in a complete process monitoring system to define the parameters responsible for the failure and derive appropriate countermeasures and continuous interaction with the in situ process control to modify the process inputs based on the measurements. However, this would require intervention in the machine parameters such as the active control of the temperature or exposure strategies, which was not part of this study.
Once again, deep learning computer vision technology has demonstrated its ability to monitor industrial processes without human intervention. However, it should be emphasized that this approach has been adapted to the current PBF-LB/P system and that, from today’s perspective, it is not possible to say how the CNN would react if a different additive manufacturing technology were used and whether the high error detection rate could then be maintained. It would be useful to further investigate the use of deep learning to monitor the ongoing process, including additional data such as physical influences or recordings of other AM processes, to compare defect detection results, or possibly to implement online parameter optimization.

Author Contributions

Conceptualization, V.K., T.A. and E.T.; Data curation, V.K., T.A. and E.T.; Formal analysis, V.K., T.A. and E.T.; Funding acquisition, V.K., M.B. and A.O.; Investigation, V.K., T.A. and E.T.; Methodology, V.K., T.A. and E.T.; Project administration, V.K.; Resources, V.K., T.A. and E.T.; Software, V.K., T.A. and E.T.; Supervision, V.K., M.B. and A.O.; Validation, V.K., T.A. and E.T.; Visualization, V.K.; Writing—original draft, V.K. and T.A., Writing—review and editing, V.K., T.A., M.B. and A.O. All authors have read and agreed to the published version of the manuscript.

Funding

The research leading to these results was funded under the cooperative doctoral program “Digiphot” between FH Campus Wien and TU Wien. This work was also supported by the City of Vienna: MA23—Projekt 29-22, “Artificial Intelligence”, and MA23—Projekt 30-25, “AI & VR Lab”.

Institutional Review Board Statement

Not applicable.

Data Availability Statement

Not applicable.

Acknowledgments

A big thank you goes to David Nechi, who made this project possible with his expertise in handling and operating the laser sintering system.

Conflicts of Interest

The authors declare no conflict of interest. The funders had no role in the design of the study; in the collection, analyses, or interpretation of the data; in the writing of the manuscript; or in the decision to publish the results.

References

  1. Gisario, A.; Kazarian, M.; Martina, F.; Mehrpouya, M. Metal additive manufacturing in the commercial aviation industry: A review. J. Manuf. Syst. 2019, 53, 124–149. [Google Scholar] [CrossRef]
  2. Javaid, M.; Haleem, A. Additive manufacturing applications in medical cases: A literature based review. Alex. J. Med. 2018, 54, 411–422. [Google Scholar] [CrossRef]
  3. Snow, Z.; Nassar, A.R.; Reutzel, E.W. Invited Review Article: Review of the formation and impact of flaws in powder bed fusion additive manufacturing. Addit. Manuf. 2020, 36, 101457. [Google Scholar] [CrossRef]
  4. Clayton, J. Optimising metal powders for additive manufacturing. Met. Powder Rep. 2014, 69, 14–17. [Google Scholar] [CrossRef]
  5. Bourell, D.; Kruth, J.P.; Leu, M.; Levy, G.; Rosen, D.; Beese, A.M.; Clare, A. Materials for additive manufacturing. CIRP Ann. 2017, 66, 659–681. [Google Scholar] [CrossRef]
  6. Vafadar, A.; Guzzomi, F.; Rassau, A.; Hayward, K. Advances in Metal Additive Manufacturing: A Review of Common Processes, Industrial Applications, and Current Challenges. Appl. Sci. 2021, 11, 1213. [Google Scholar] [CrossRef]
  7. Eyers, D.R.; Potter, A.T. Industrial Additive Manufacturing: A manufacturing systems perspective. Comput. Ind. 2017, 92–93, 208–218. [Google Scholar] [CrossRef]
  8. Zhang, D.; Lim, W.Y.S.; Duran, S.S.F.; Loh, X.J.; Suwardi, A. Additive Manufacturing of Thermoelectrics: Emerging Trends and Outlook. ACS Energy Lett. 2022, 7, 720–735. [Google Scholar] [CrossRef]
  9. Zhang, Y.; Jarosinski, W.; Jung, Y.-G.; Zhang, J. Additive manufacturing processes and equipment. In Additive Manufacturing: Materials, Processes, Quantifications and Applications; Zhang, J., Jung, Y.-G., Eds.; Butterworth-Heinemann an Imprint of Elsevier: Cambridge, MA, USA; Oxford, UK, 2018; pp. 39–51. [Google Scholar]
  10. Zhang, J.; Jung, Y.-G. (Eds.) Additive Manufacturing: Materials, Processes, Quantifications and Applications; Butterworth-Heinemann an Imprint of Elsevier: Cambridge, MA, USA; Oxford, UK, 2018. [Google Scholar]
  11. Chueh, Y.-H.; Zhang, X.; Ke, J.C.-R.; Li, Q.; Wei, C.; Li, L. Additive manufacturing of hybrid metal/polymer objects via multiple-material laser powder bed fusion. Addit. Manuf. 2020, 36, 101465. [Google Scholar] [CrossRef]
  12. Dechet, M.A.; Baumeister, I.; Schmidt, J. Development of Polyoxymethylene Particles via the Solution-Dissolution Process and Application to the Powder Bed Fusion of Polymers. Materials 2020, 13, 1535. [Google Scholar] [CrossRef]
  13. Singh, D.D.; Mahender, T.; Reddy, A.R. Powder bed fusion process: A brief review. Mater. Today Proc. 2021, 46, 350–355. [Google Scholar] [CrossRef]
  14. Plessis, A.D.; Yadroitsava, I.; Yadroitsev, I. Ti6Al4V lightweight lattice structures manufactured by laser powder bed fusion for load-bearing applications. Opt. Laser Technol. 2018, 108, 521–528. [Google Scholar] [CrossRef]
  15. Emmelmann, C.; Sander, P.; Kranz, J.; Wycisk, E. Laser Additive Manufacturing and Bionics: Redefining Lightweight Design. Phys. Procedia 2011, 12, 364–368. [Google Scholar] [CrossRef]
  16. Kusoglu, I.M.; Doñate-Buendía, C.; Barcikowski, S.; Gökce, B. Laser Powder Bed Fusion of Polymers: Quantitative Research Direction Indices. Materials 2021, 14, 1169. [Google Scholar] [CrossRef]
  17. Fina, F.; Gaisford, S.; Basit, A.W. Powder Bed Fusion: The Working Process, Current Applications and Opportu-nities. In 3D Printing of Pharmaceuticals; Springer: Cham, Switzerland, 2018; pp. 81–105. [Google Scholar]
  18. Qian, M.; Bourell, D.L. Additive Manufacturing of Titanium Alloys. JOM 2017, 69, 2677–2678. [Google Scholar] [CrossRef]
  19. Zhao, X.; Wang, T. Laser Powder Bed Fusion of Powder Material: A Review. In 3D Printing and Additive Manufacturing; Art. No. 3dp.2021.0297; Mary Ann Liebert, Inc.: New Rochelle, NY, USA, 2022. [Google Scholar] [CrossRef]
  20. Tan, X.P.; Tan, Y.J.; Chow, C.S.L.; Tor, S.B.; Yeong, W.Y. Metallic powder-bed based 3D printing of cellular scaffolds for orthopaedic implants: A state-of-the-art review on manufacturing, topological design, mechanical properties and biocompatibility. Mater. Sci. Eng. C Mater. Biol. Appl. 2017, 76, 1328–1343. [Google Scholar] [CrossRef] [PubMed]
  21. DIN 16742:2013; Plastics Mouldings: Tolerances and Acceptance Conditions. German Institute for Standardization: Berlin, Germany, 2013.
  22. Baturynska, I. Statistical analysis of dimensional accuracy in additive manufacturing considering STL model properties. Int. J. Adv. Manuf. Technol. 2018, 97, 2835–2849. [Google Scholar] [CrossRef]
  23. Baturynska, I.; Semeniuta, O.; Wang, K. Application of Machine Learning Methods to Improve Dimensional Accuracy in Additive Manufacturing. In Advanced Manufacturing and Automation VIII 8; Springer: Singapore, 2019; pp. 245–252. [Google Scholar] [CrossRef]
  24. Klamert, V.; Schiefermair, L.; Bublin, M.; Otto, A. In Situ Analysis of Curling Defects in Powder Bed Fusion of Polyamide by Simultaneous Application of Laser Profilometry and Thermal Imaging. Appl. Sci. 2023, 13, 7179. [Google Scholar] [CrossRef]
  25. Sillani, F.; MacDonald, E.; Villela, J.; Schmid, M.; Wegener, K. In-situ monitoring of powder bed fusion of polymers using laser profilometry. Addit. Manuf. 2022, 59, 103074. [Google Scholar] [CrossRef]
  26. Wang, P.; Yang, Y.; Moghaddam, N.S. Process modeling in laser powder bed fusion towards defect detection and quality control via machine learning: The state-of-the-art and research challenges. J. Manuf. Process. 2022, 73, 961–984. [Google Scholar] [CrossRef]
  27. Soundararajan, B.; Sofia, D.; Barletta, D.; Poletto, M. Review on modeling techniques for powder bed fusion processes based on physical principles. Addit. Manuf. 2021, 47, 102336. [Google Scholar] [CrossRef]
  28. McCann, R.; Obeidi, M.A.; Hughes, C.; McCarthy, É.; Egan, D.S.; Vijayaraghavan, R.K.; Joshi, A.M.; Garzon, V.A.; Dowling, D.P.; McNally, P.J.; et al. In-situ sensing, process monitoring and machine control in Laser Powder Bed Fusion: A review. Addit. Manuf. 2021, 45, 102058. [Google Scholar] [CrossRef]
  29. Mani, M.; Feng, S.; Brandon, L.; Donmez, A.; Moylan, S.; Fesperman, R. Measurement science needs for real-time control of additive manufacturing powder-bed fusion processes. In Additive Manufacturing Handbook: Product Development for the Defense Industry (Systems Innovation Series); CRC Press Taylor & Francis Group: Boca Raton, FL, USA, 2017; pp. 629–652. [Google Scholar]
  30. Liu, J.; Ye, J.; Izquierdo, D.S.; Vinel, A.; Shamsaei, N.; Shao, S. A review of machine learning techniques for process and performance optimization in laser beam powder bed fusion additive manufacturing. J. Intell. Manuf. 2022, 34, 3249–3275. [Google Scholar] [CrossRef]
  31. Irwin, J.E.; Wang, Q.; Michaleris, P.; Nassar, A.R.; Ren, Y.; Stutzman, C.B. Iterative simulation-based techniques for control of laser powder bed fusion additive manufacturing. Addit. Manuf. 2021, 46, 102078. [Google Scholar] [CrossRef]
  32. Vlasea, M.L.; Lane, B.; Lopez, F.; Mekhontsev, S.; Donmez, A. Development of Powder Bed Fusion Additive Manufacturing Test Bed for Enhanced Real-Time Process Control; University of Texas at Austin: Austin, TX, USA, 2015. [Google Scholar]
  33. Chen, Y.; Peng, X.; Kong, L.; Dong, G.; Remani, A.; Leach, R. Defect inspection technologies for additive manufacturing. Int. J. Extrem. Manuf. 2021, 3, 22002. [Google Scholar] [CrossRef]
  34. Zhang, B.; Li, Y.; Bai, Q. Defect Formation Mechanisms in Selective Laser Melting: A Review. Chin. J. Mech. Eng. 2017, 30, 515–527. [Google Scholar] [CrossRef]
  35. Klamert, V.; Schmid-Kietreiber, M.; Bublin, M. A deep learning approach for real time process monitoring and curling defect detection in Selective Laser Sintering by infrared thermography and convolutional neural networks. Procedia CIRP 2022, 111, 317–320. [Google Scholar] [CrossRef]
  36. Gardner, M.R.; Lewis, A.; Park, J.; McElroy, A.B.; Estrada, A.D.; Fish, S.; Beaman, J.J.; Milner, T.E. In situ process monitoring in selective laser sintering using optical coherence tomography. Opt. Eng. 2018, 57, 041407. [Google Scholar] [CrossRef]
  37. Guan, G.; Hirsch, M.; Syam, W.P.; Leach, R.K.; Huang, Z.; Clare, A.T. Loose powder detection and surface characterization in selective laser sintering via optical coherence tomography. R. Soc. Proc. 2016, 472, 20160201. [Google Scholar] [CrossRef]
  38. Phuc, L.T.; Seita, M. A high-resolution and large field-of-view scanner for in-line characterization of powder bed defects during additive manufacturing. Mater. Des. 2019, 164, 107562. [Google Scholar] [CrossRef]
  39. Sassaman, D.M.; Ide, M.S.; Kovar, D.; Beaman, J.J. Design of an In-situ microscope for selective laser sintering. Addit. Manuf. Lett. 2022, 2, 100033. [Google Scholar] [CrossRef]
  40. Southon, N.; Stavroulakis, P.; Goodridge, R.; Leach, R. In-process measurement and monitoring of a polymer laser sintering powder bed with fringe projection. Mater. Des. 2018, 157, 227–234. [Google Scholar] [CrossRef]
  41. Kanko, J.A.; Sibley, A.P.; Fraser, J.M. In situ morphology-based defect detection of selective laser melting through inline coherent imaging. J. Mater. Process. Technol. 2016, 231, 488–500. [Google Scholar] [CrossRef]
  42. Baldacchini, T.; Zadoyan, R. In situ and real time monitoring of two-photon polymerization using broadband coherent anti-Stokes Raman scattering microscopy. Opt. Express OE 2010, 18, 19219–19231. [Google Scholar] [CrossRef]
  43. Li, Z.; Liu, X.; Wen, S.; He, P.; Zhong, K.; Wei, Q.; Shi, Y.; Liu, S. In Situ 3D Monitoring of Geometric Signatures in the Powder-Bed-Fusion Additive Manufacturing Process via Vision Sensing Methods. Sensors 2018, 18, 1180. [Google Scholar] [CrossRef]
  44. Maucher, C.; Werkle, K.T.; Möhring, H.-C. In-Situ defect detection and monitoring for laser powder bed fusion using a multi-sensor build platform. Procedia CIRP 2021, 104, 146–151. [Google Scholar] [CrossRef]
  45. Zhirnov, I.; Panahi, N.; Åsberg, M.; Krakhmalev, P. Process quality assessment with imaging and acoustic monitoring during Laser Powder Bed Fusion. Procedia CIRP 2022, 111, 363–367. [Google Scholar] [CrossRef]
  46. Jha, S.B.; Babiceanu, R.F. Deep CNN-based visual defect detection: Survey of current literature. Comput. Ind. 2023, 148, 103911. [Google Scholar] [CrossRef]
  47. Qin, J.; Hu, F.; Liu, Y.; Witherell, P.; Wang, C.C.; Rosen, D.W.; Simpson, T.W.; Lu, Y.; Tang, Q. Research and application of machine learning for additive manufacturing. Addit. Manuf. 2022, 52, 102691. [Google Scholar] [CrossRef]
  48. Yang, J.; Li, S.; Wang, Z.; Dong, H.; Wang, J.; Tang, S. Using Deep Learning to Detect Defects in Manufacturing: A Comprehensive Survey and Current Challenges. Materials 2020, 13, 5755. [Google Scholar] [CrossRef]
  49. Prunella, M.; Scardigno, R.M.; Buongiorno, D.; Brunetti, A.; Longo, N.; Carli, R.; Dotoli, M.; Bevilacqua, V. Deep Learning for Automatic Vision-Based Recognition of Industrial Surface Defects: A Survey. IEEE Access 2023, 11, 43370–43423. [Google Scholar] [CrossRef]
  50. Chen, F.-C.; Jahanshahi, M.R. NB-CNN: Deep Learning-Based Crack Detection Using Convolutional Neural Network and Naïve Bayes Data Fusion. IEEE Trans. Ind. Electron. 2018, 65, 4392–4400. [Google Scholar] [CrossRef]
  51. Dong, X.; Taylor, C.J.; Cootes, T.F. Small Defect Detection Using Convolutional Neural Network Features and Random Forests. In Proceedings of the European Conference on Computer Vision (ECCV) Workshops, Munich, Germany, 8–14 September 2019; pp. 398–412. [Google Scholar] [CrossRef]
  52. He, Y.; Song, K.; Meng, Q.; Yan, Y. An End-to-End Steel Surface Defect Detection Approach via Fusing Multiple Hierarchical Features. IEEE Trans. Instrum. Meas. 2020, 69, 1493–1504. [Google Scholar] [CrossRef]
  53. Shi, J.; Yin, W.; Du, Y.; Folkesson, J. Automated Underwater Pipeline Damage Detection using Neural Nets. In Proceedings of the ICRA 2019 Workshop on Underwater Robotics Perception, Montreal, QC, Canada, 24 May 2019. [Google Scholar]
  54. Tabernik, D.; Šela, S.; Skvarč, J.; Skočaj, D. Segmentation-based deep-learning approach for surface-defect detection. J. Intell. Manuf. 2020, 31, 759–776. [Google Scholar] [CrossRef]
  55. Tang, Z.; Tian, E.; Wang, Y.; Wang, L.; Yang, T. Nondestructive Defect Detection in Castings by Using Spatial Attention Bilinear Convolutional Neural Network. IEEE Trans. Ind. Inf. 2021, 17, 82–89. [Google Scholar] [CrossRef]
  56. Yang, H.; Mei, S.; Song, K.; Tao, B.; Yin, Z. Transfer-Learning-Based Online Mura Defect Classification. IEEE Trans. Semicond. Manufact. 2018, 31, 116–123. [Google Scholar] [CrossRef]
  57. Chow, J.K.; Su, Z.; Wu, J.; Tan, P.S.; Mao, X.; Wang, Y.H. Anomaly detection of defects on concrete structures with the convolutional autoencoder. Adv. Eng. Inform. 2020, 45, 101105. [Google Scholar] [CrossRef]
  58. Yang, H.; Chen, Y.; Song, K.; Yin, Z. Multiscale Feature-Clustering-Based Fully Convolutional Autoencoder for Fast Accurate Visual Inspection of Texture Surface Defects. IEEE Trans. Autom. Sci. Eng. 2019, 16, 1450–1467. [Google Scholar] [CrossRef]
  59. Ruff, L.; Vandermeulen, R.A.; Görnitz, N.; Binder, A.; Kloft, M. Deep Support Vector Data Description for Unsupervised and Semi-Supervised Anomaly Detection. arXiv 2019, arXiv:1906.02694. [Google Scholar]
  60. Lian, J.; Jia, W.; Zareapoor, M.; Zheng, Y.; Luo, R.; Jain, D.K.; Kumar, N. Deep-Learning-Based Small Surface Defect Detection via an Exaggerated Local Variation-Based Generative Adversarial Network. IEEE Trans. Ind. Inf. 2020, 16, 1343–1351. [Google Scholar] [CrossRef]
  61. Niu, S.; Li, B.; Wang, X.; Lin, H. Defect Image Sample Generation with GAN for Improving Defect Recognition. IEEE Trans. Autom. Sci. Eng. 2020, 17, 1611–1622. [Google Scholar] [CrossRef]
  62. Zenati, H.; Foo, C.S.; Lecouat, B.; Manek, G.; Chandrasekhar, V.R. Efficient GAN-Based Anomaly Detection. arXiv 2018, arXiv:1802.06222. [Google Scholar]
  63. Deecke, L.; Vandermeulen, R.; Ruff, L.; Mandt, S.; Kloft, M. Image Anomaly Detection with Generative Adversarial Networks. In Machine Learning and Knowledge Discovery in Databases: European Conference, ECML PKDD 2018, Dublin, Ireland, 10–14 September 2018, Proceedings, Part I 18; Springer International Publishing: Berlin/Heidelberg, Germany, 2019; pp. 3–17. [Google Scholar] [CrossRef]
  64. Zhou, F.; Liu, G.; Xu, F.; Deng, H. A Generic Automated Surface Defect Detection Based on a Bilinear Model. Appl. Sci. 2019, 9, 3159. [Google Scholar] [CrossRef]
  65. Tsai, D.-M.; Fan, S.-K.S.; Chou, Y.-H. Auto-Annotated Deep Segmentation for Surface Defect Detection. IEEE Trans. Instrum. Meas. 2021, 70, 1–10. [Google Scholar] [CrossRef]
  66. Abdulhameed, O.; Al-Ahmari, A.; Ameen, W.; Mian, H.M. Additive manufacturing: Challenges, trends, and applications. Adv. Mech. Eng. 2019, 11, 168781401882288. [Google Scholar] [CrossRef]
  67. Westphal, E.; Seitz, H. A machine learning method for defect detection and visualization in selective laser sintering based on convolutional neural networks. Addit. Manuf. 2021, 41, 101965. [Google Scholar] [CrossRef]
  68. Arslan, E.; Unal, D.; Akgün, O. Defect detection with image processing and deep learning in polymer powder bed additive manufacturing systems. J. Addit. Manuf. Technol. 2023, 2, 684. [Google Scholar] [CrossRef]
  69. Xiao, L.; Lu, M.; Huang, H. Detection of powder bed defects in selective laser sintering using convolutional neural network. Int. J. Adv. Manuf. Technol. 2020, 107, 2485–2496. [Google Scholar] [CrossRef]
  70. Schlicht, S.; Jaksch, A.; Drummer, D. Inline Quality Control through Optical Deep Learning-Based Porosity Determination for Powder Bed Fusion of Polymers. Polymers 2022, 14, 885. [Google Scholar] [CrossRef]
  71. EOS Formiga P 110; Technical Description. EOS: Krailling, Germany, 2023.
  72. EOS PA2200; Product Information. EOS: Krailling, Germany, 2023.
  73. Almabrouk, M.A. Experimental investigations of curling phenomenon in selective laser sintering process. Rapid Prototyp. J. 2016, 22, 405–415. [Google Scholar] [CrossRef]
  74. Raspberry Pi Camera Module 2 Technical Description; Raspberry Pi: Cambridge, UK, 2023.
  75. Wondrak, W. Physical limits and lifetime limitations of semiconductor devices at high temperatures. Microelectron. Reliab. 1999, 39, 1113–1120. [Google Scholar] [CrossRef]
  76. Phrozen TR300; Technical Description. Phrozen: Hsinchu, Taiwan, 2023.
  77. Japkowicz, N.; Stephen, S. The class imbalance problem: A systematic study1. IDA 2002, 6, 429–449. [Google Scholar] [CrossRef]
  78. Cui, Y.; Jia, M.; Lin, T.-Y.; Song, Y.; Belongie, S. Class-Balanced Loss Based on Effective Number of Samples. In Proceedings of the 2019 IEEE/CVF Conference on Computer Vision and Pattern Recognition (CVPR), Long Beach, CA, USA, 16–19 June 2019; pp. 9268–9277. [Google Scholar]
  79. Vasilev, I. Python Deep Learning: Exploring Deep Learning Techniques and Neural Network Architectures with PyTorch, Keras, and TensorFlow; Packt Publishing: Birmingham, UK, 2019. [Google Scholar]
  80. Chirodea, M.C.; Novac, O.C.; Novac, C.M.; Bizon, N.; Oproescu, M.; Gordan, C.E. Comparison of Tensorflow and PyTorch in Convolutional Neural Network-based Applications. In Proceedings of the 2021 13th International Conference on Electronics, Computers and Artificial Intelligence (ECAI), Pitesti, Romania, 1–3 July 2021; pp. 1–6. [Google Scholar] [CrossRef]
  81. Mannor, S.; Peleg, D.; Rubinstein, R. The cross entropy method for classification. In Proceedings of the 22nd International Conference on Machine Learning (ICML’05); Association for Computing Machinery: New York, NY, USA, 2005; pp. 561–568. [Google Scholar] [CrossRef]
  82. Polat, G.; Ergenc, I.; Kani, H.T.; Alahdab, Y.O.; Atug, O.; Temizel, A. Class Distance Weighted Cross-Entropy Loss for Ulcerative Colitis Severity Estimation. In 26th UK Conference on Medical Image Understanding and Analysis; Springer: Cham, Switzerland; Cambridge, UK, 2022. [Google Scholar] [CrossRef]
  83. Smith, L.N. Cyclical Learning Rates for Training Neural Networks. In Proceedings of the 2017 IEEE Winter Conference on Applications of Computer Vision (WACV), Santa Rosa, CA, USA, 24–31 March 2017; pp. 464–472. [Google Scholar] [CrossRef]
  84. Selvaraju, R.R.; Cogswell, M.; Das, A.; Vedantam, R.; Parikh, D.; Batra, D. Grad-CAM: Visual Explanations from Deep Networks via Gradient-Based Localization. Int. J. Comput. Vis. 2020, 128, 336–359. [Google Scholar] [CrossRef]
  85. Alzubaidi, L.; Zhang, J.; Humaidi, A.J.; Al-Dujaili, A.; Duan, Y.; Al-Shamma, O.; Santamaría, J.; Fadhel, M.A.; Al-Amidie, M.; Farhan, L. Review of deep learning: Concepts, CNN architectures, challenges, applications, future directions. J. Big Data 2021, 8, 53. [Google Scholar] [CrossRef]
  86. Villalba-Diez, J.; Schmidt, D.; Gevers, R.; Ordieres-Meré, J.; Buchwitz, M.; Wellbrock, W. Deep Learning for Industrial Computer Vision Quality Control in the Printing Industry 4.0. Sensors 2019, 19, 3987. [Google Scholar] [CrossRef]
  87. Amer, G.M.H.; Abushaala, A.M. Edge detection methods. In Proceedings of the 2015 2nd World Symposium on Web Applications and Networking (WSWAN 2015), Sousse, Tunisia, 21–23 March 2015; pp. 1–7. [Google Scholar] [CrossRef]
Figure 1. Concept for in situ defect or fault detection, including sensor concept and defect detection, either by exceeding defined thresholds with a specific measurement method, e.g., laser profilometry, or via image recognition based on deep learning, e.g., anomaly detection. As a non-part of this study, the connection to the next conditional points of a complete process monitoring is then presented. The parameters that are responsible for the defect and the derivation of suitable countermeasures and continuous interaction with in situ process control to modulate process inputs based on measurements.
Applsci 13 11273 g001
Figure 2. Part shifting leads to total process abortion at the PBF-LB/P system used in this study. Components were completely torn out of the powder bed via the coater blade. The inside of the machine must be completely cooled and cleaned before the entire job can be restarted.
Applsci 13 11273 g002
Figure 3. Different wire thicknesses were applied to the coater during the running process with (a) 0.3 mm, (b) 0.5 mm, and (c) 0.6 mm to check maximum penetration depth of simulated part shifting and particle drag.
Applsci 13 11273 g003
Figure 4. Definition of the end position of the coating blade. Two switches (a) and (b) have been installed inside the machine to be activated when the actuator (c) of the coater spreads a new layer of powder.
Applsci 13 11273 g004
Figure 5. Mechanical device (a) for simulating coating defects mounted on the coating blade (b) in the retracted state with no contact to the powder bed. The mechanical system is operated via high temperature resistant Bowden cables which run to the outside of the machine to be actuated.
Applsci 13 11273 g005
Figure 6. The lever structure for creating artificially induced coating defects in the activated state with the contact point of the needle (a) on the powder bed surface.
Applsci 13 11273 g006
Figure 7. Artificially induced coating defects on the powder bed surface in various shapes, intensities, and locations during the running process under real conditions. A wide variety of components have been manufactured to produce the highest possible number of different geometries in combination with different defects.
Applsci 13 11273 g007
Figure 8. The CAD Design of the cooled camera housing. The N2 inlet (a), the outlet (b), the return (c), and the flushing of the lens via the air knife (d) can be seen. The housing consists of two parts that are screwed together and sealed with heat-resistant material. The camera is positioned and fixed inside the housing with screws.
Applsci 13 11273 g008
Figure 9. Final position of the camera (a) inside the build chamber on top of the heating system (b). This position allows the entire surface of the powder bed (c) to be captured without shadowing the laser system (d) or internal pyrometer (e).
Applsci 13 11273 g009
Figure 10. The applied interface structure with three main functional blocks to implement real-time defect detection. The Raspberry Pi implementation is responsible for capturing frames from the stream and automatically labelling them using an external signal. An RGB .jpg image is then generated as output and sent to the developer PC. The data is then processed on the developer PC and the custom CNN model. The classification result and livestream are then displayed in real time via the web application.
Applsci 13 11273 g010
Figure 11. The basic model architecture of the CNN starts with a Conv2D convolutional layer using 32 filters and the ReLu activation function, followed by a MaxPooling2D layer for non-linear down sampling. This is followed by two more such layer pairs and a flattening layer to transform the pooled feature map. The single column output from the transformation is then transferred to the final fully connected layers for high-level inference on the extracted features using ReLu activation. A softmax activation function is used by the last dense layer of the base model to generate a two-class probability distribution.
Applsci 13 11273 g011
Figure 12. Original image (a) of an artificially simulated coating defect (particle drag) and the image after Sobel filtering (b). The edges created by the defect are clearly highlighted and contrast with the surrounding powder bed.
Applsci 13 11273 g012
Figure 13. Final model architecture. After the rescaling layer, the Sobel filtering layer was implemented. Compared to the base model architecture, this final iteration of the CNN also uses an additional Conv2D convolutional layer and ReLu activation function, and another MaxPooling2D layer for non-linear down sampling.
Applsci 13 11273 g013
Figure 14. Comparison of some original frames (a) with the corresponding Grad-CAM heatmaps (b) after classification. The evaluation of the Grad-CAM heatmaps clearly shows that the custom CNN classified correctly even over several design jobs with different component geometries. Even components with similar geometry to the actual defect were not classified as defects.
Applsci 13 11273 g014aApplsci 13 11273 g014b
Table 1. Parameters of EOS FORMIGA P 110 (EOS, Krailling, Germany).
Laser typeCO2
Laser power30 W
Laser wavelength10.6 µm
Scanning speed5 m/s
Exposed area (xy)200 mm × 250 mm
Maximum part height (z)300 mm
Layer thickness50 µm–200 µm
Defined layer thickness100 µm
Powder typePA2200 nylon
Table 2. Datasets and characteristics.
DatasetOk FramesDefective FramesResolutionDefect Info
116.5064.827480 × 640Overheating
23.007n.a.480 × 640Various defects
322.4492.356480 × 640Various defects
424.823388960 × 1280Various defects
540.6091.044960 × 1280Various defects
679.5633.400mixedConsolidated
73.0003.000mixedEvaluation
Table 3. Results of all model iterations.
Model ArchitectureLossAccuracyPrecisionF1 ScoreEpochs
Basic0.00020.72330.72330.723315
+ Weighted cross-entropy<0.00010.98380.98460.983510
+ Learning rate scheduling<0.00010.98520.98860.984715
+ Sobel layer<0.00010.99120.99100.991110
Disclaimer/Publisher’s Note: The statements, opinions and data contained in all publications are solely those of the individual author(s) and contributor(s) and not of MDPI and/or the editor(s). MDPI and/or the editor(s) disclaim responsibility for any injury to people or property resulting from any ideas, methods, instructions or products referred to in the content.

