1. Introduction
Helium gas measurement is required in various fields to indicate accurate values such as temperature, pressure, density, and so on [
1]. Particularly, regarding the measurement technology that uses helium gas, it is necessary to verify the expanding pressure characteristics, including particle mass fraction [
2]. These physical changes can be seen in a hydrogen storage vessel, chamber, or tank that includes volume [
3]. As much as hydrogen gas, helium gas is classified as an energy source that involves both input and output processes [
4].
Reactions with helium gas can cause a variety of climate changes depending on temperature and impact [
5]. The main effects can be expressed as the effect of temperature, the effect of pressure, Bernoulli’s principle, Reynolds number, etc. The temperature effect here is that the reaction of helium gas is very sensitive to temperature response. This means that as temperature rises, the body’s kinetic energy increases, causing the body to exert more force; because of this, it may increase [
6]. The pressure effect may be that as the pressure increases, the gas performance increases because it becomes denser. From Bernoulli’s principle, it can be defined that when helium gas flows through a certain structure, the pressure can increase as the flow rate increases. The Reynolds number of a helium gas exchange has a different effect compared to that of the flow. In other words, it can be flexible when the probability of Reynolds occurring is low, and it can be stochastic when the probability of Reynolds occurring is high [
7]. These several situations serve as important factors to control and predict the reaction of helium gas, and are utilized in various experiments and designs in scientific and engineering applications [
8].
The authors of this study decided to utilize helium gas because of the explosion risk associated with hydrogen. In other words, they deemed safety for the experiments to be of utmost importance. Additionally, although the chemical properties of hydrogen and helium are quite different, the study found that helium gas could be handled with a minimum level of safety concern [
9]. In particular, helium is considered to have a very low or virtually nonexistent likelihood of exploding in most situations. Helium is a non-flammable gas, and it is extremely difficult to ignite or cause it to explode under normal conditions [
10]. Due to this safety factor, helium is commonly used as a safe gas in many experiments and applications [
11]. In contrast, hydrogen is a flammable gas that can ignite and pose an explosion risk when mixed with air [
12]. Therefore, special precautions and safety measures are necessary when handling hydrogen. Due to the difference in flammability between helium and hydrogen, helium is generally considered to have a much lower risk of explosion compared to hydrogen [
13]. However, even when using helium in experiments or applications, it is essential to adhere to relevant regulations and guidelines for safety [
14]. Safety considerations that may arise when using helium should be taken into account based on the specific experiment environment and circumstances.
Helium has a lower molecular weight than hydrogen, so it diffuses faster under the same conditions and is more sensitive to pressure changes. Therefore, helium gas reacts relatively more sensitively to pressure changes. Because hydrogen has a higher molecular weight, its diffusion rate is slower than helium under the same pressure conditions [
15]. Therefore, hydrogen gas is relatively less sensitive to pressure changes than helium. Helium can change into a liquid at low to very cold temperatures [
16]. These properties are one of the reasons why helium is primarily used in low-temperature experiments and applications. Helium’s response to temperature changes is greater than that of other gases, and its relationship with pressure follows the ideal gas law [
17]. Hydrogen can also turn into a liquid at low temperatures, but it does not turn into a liquid at temperatures as low as helium. Hydrogen’s response to temperature changes is similar to that of helium, and its relationship with pressure also follows the ideal gas law. This difference is one of the important factors in choosing helium and hydrogen for experiments and applications. Helium is commonly used in low-temperature experiments, but hydrogen is also used in some cases in low-temperature experiments and is used in a variety of other industrial and scientific fields [
18]. The choice must be made by taking the properties of both gases into account with respect to pressure and temperature changes.
Therefore, this study aims to analyze the temperature and pressure characteristics of helium gas as an alternative to hydrogen gas in a vessel during gas filling and discharge. To minimize the risk of explosion, the important thing is to demonstrate the thermal circumstances of helium gas instead of hydrogen gas in this experiment. Another important objective of this study is to investigate the temperature and pressure increase resulting from the variable valve of a mass flow controller during the charging and discharging of helium gas, which is being used as an alternative to hydrogen gas in a vessel. The hypothesis of this study aims to experimentally verify whether the loss of pressure and temperature energy can be promptly observed through monitoring the helium gas mass flow rate upon filling the vessel. In simpler terms, the authors sought to confirm that the loss of pressure and temperature energy exhibits more significant changes under fast-flow supply conditions than under slow-flow conditions. This verification offers engineers a more dependable measurement solution for addressing this loss. The structure of this research work is explained in the subsequent sections, which include the experimental method, results and discussion, and conclusion. It can be observed that
Section 2 presents the research contents, which comprise the experimental method, system design, control, chemical properties of helium, and experimental conditions.
Section 3 presents the experimental results and discussions of temperature and pressure increases in relation to the mass flow controller valve rates during the charging and discharging of helium gas. The summary and conclusion are presented in
Section 4, followed by the references.
2. Experimental Methods
2.1. Chemical Properties of Helium
As far as the chemical properties of helium gas are concerned, a chemical element has the symbol He and atomic number 2. It is a colorless, odorless, tasteless, non-toxic, inert gas that heads the noble gas group in the periodic table. Its boiling and melting points are the lowest among all the elements and it exists only as a gas except in extreme conditions. Helium is the second lightest element and is the second most abundant element in the observable universe, being present at about 24% of the total elemental mass, which is more than 12 times the mass of all the heavier elements combined. It is extracted from natural gas wells, where it is produced by the radioactive decay of uranium and thorium. Helium is used for a variety of applications, including as a cooling medium for nuclear reactors and in medical imaging equipment like MRI machines. The summarized chemical properties of helium gas can be found in
Table 1.
Specifically, helium gas is quite sensitive to temperature. Helium is a catastrophically non-flammable gas, and the kinetic energy of its molecules changes significantly with changes in temperature. This causes temperature changes to affect the physical and chemical properties of helium gas. As the temperature of helium gas increases, the average kinetic energy of the molecules increases. This causes the gas molecules to diffuse further and increase in volume. Therefore, when the same amount of helium gas is placed in a fixed container, the volume becomes relatively larger at higher temperatures. As temperature increases, the frequency of collisions between gas molecules increases, which can lead to an increase in pressure. Therefore, within a given volume, higher temperature helium gas is likely to have a higher pressure. The speed of sound in helium gas varies with temperature. At higher temperatures, the speed of sound can become faster. The chemical properties of helium gas can also change with temperature. At higher temperatures, the rate of chemical reactions may increase. As a result, helium gas tends to be sensitive to temperature changes, and this sensitivity plays an important role in scientific and engineering applications.
2.2. System Design and Control
As shown in
Figure 1, this system is designed to control the charging time and helium gas flow. Pressure and temperature sensors are installed in the helium gas storage to measure its internal flow characteristics. An electric valve, which is controllable by LabVIEW, is installed with Teflon tape to prevent helium gas leaks. The main components for system operation include T-sensors, P-sensors, a mass flow controller, a LabVIEW cDAQ, an oscilloscope, and a pressure regulator.
The helium storage system using hydrogen gas as an alternative is specified as 5000 cc of AL-based material to facilitate easy repetition of charging and discharging. When using Al as the material for helium gas storage, changes in temperature and pressure within the storage unit can be easily observed. The pressure in this system is regulated by a gas regulator from 150 bar to 30 bar in order to match the low-pressure requirements of the mass flow controller. Electronic valves are used to provide automatic ventilation, and they are designed with a LabVIEW algorithm. A PT-100 temperature sensor is installed inside the helium gas storage to detect changes in the thermal environment. Moreover, a pressure sensor is used to compare the thermal data with changes in temperature. A cDAQ-9172 chassis offered to NI-INSTRUMENT is connected with various boards such as analog input, analog output, and counter pulse, and it is designed to control the helium gas storage management system. The physical characteristics of helium gas differ from those of hydrogen gas. However, helium is very similar to hydrogen. A mass flow controller is used to minutely control helium gas, and it is controlled up to 10 L/m.
In the operation of this experiment, the high-pressure gas stored in the main tank is first reduced to low pressure using an electronic solenoid valve within a regulator to control the flow rate. Subsequently, the flow rate is precisely measured using an MFC (Mass Flow Controller) and supplied to the experimental tank. Throughout this process, temperature and pressure sensors detect changes in physical behavior, collect data using LabVIEW cDAQ, and repeat the process of analyzing and verifying reliable data according to the experiment’s conditions.
In this experiment, a constant temperature and humidity system was employed to ensure consistent fluctuations in ambient temperature, allowing the experiment to commence when the temperature reached 20 degrees Celsius. Maintaining this ambient temperature can be seen as serving the purpose of ensuring the safety of the helium gas within the reservoir because it may undergo alterations depending on the movements of individual sensors and valves.
In this experiment, the 0–5 V voltage control method was set to control the valves within the mass flow controller. The experiment was conducted with careful consideration of valve opening deviation, voltage control deviation, and current flow deviation to minimize the impact of orifice errors in situations where gas movement, especially when charging helium gas, can be highly variable. Furthermore, to address any potential issues arising from micro-leakage during the helium gas charging process, we verified the integrity of all valves and gas lines by employing bubble testing.
Additionally, a check valve is used with a maximum pressure of 12 bar, and the power supply applies 12.5 V entirely in this hydrogen storage management system. Furthermore, the summarized specification of helium gas storage management system can be seen in
Table 2.
2.3. Experiment Condition
In this section, the experimental conditions are described, which outline the important elements needed for using the hydrogen gas storage management system to analyze thermal events that are measured by temperature and pressure sensors. As seen in
Table 3, the MFC (Mass flow controller) valve opening is set at 20%, 60%, and 100% while controlling the LabVIEW programming. Also, this experiment was conducted at 20 °C ambient temperature and 0 bar gauge pressure.
The position of the temperature sensor was located in the middle of the storage vessel, and the experiment was repeated 10 times. Another crucial aspect of this experimental setup is the data acquisition method, which allows for obtaining consistent results by repeating the same experimental conditions. In essence, after completing the initial experiment, a verification experiment could be conducted to ensure accurate reproducibility. If the error rate exceeded 5%, it would indicate low reliability of the experiment. In such cases, a re-experiment was carried out, and efforts were made to enhance the reliability of the data through further investigation and adjustments. The MFC working algorithm includes a system warmup of 20 min, a valve open time of 10 min, a valve close time of 16 min, and a ventilation time of 10 min. Furthermore, the main experimental results can be shown in
Section 3.
3. Results and Discussions
3.1. Initial Valve Oppening of Mass Flow Controller
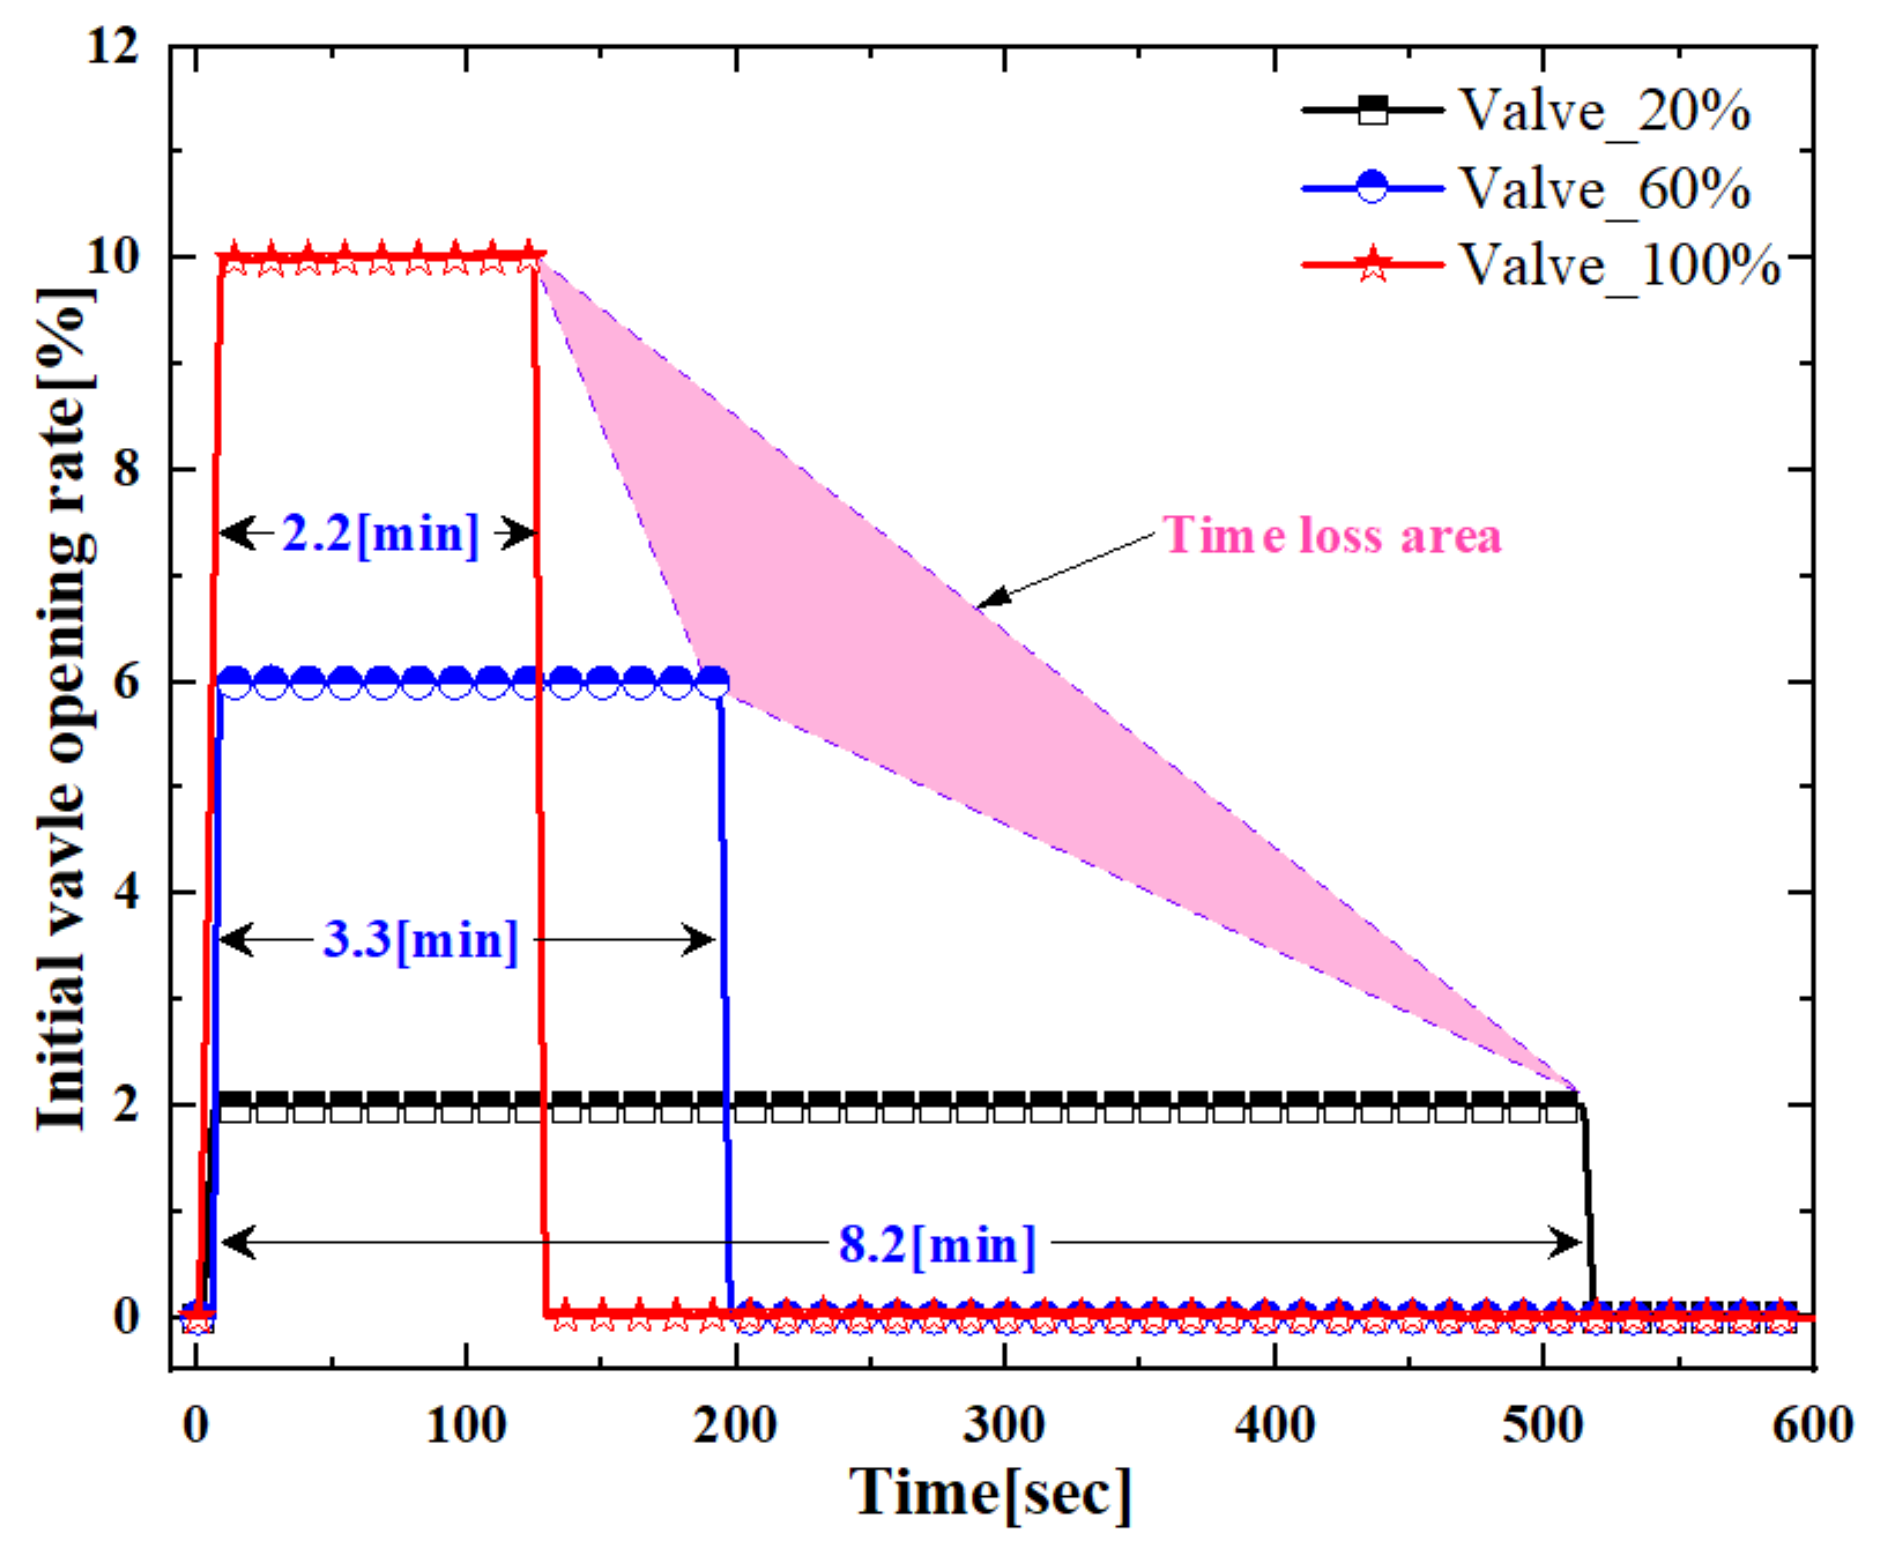
Figure 2 shows the initial valve opening rate when charging helium gas in the order of 20%, 60%, and 100% instead of hydrogen gas. The x-axis of the graph indicates the measuring time, while the y-axis shows the initial valve opening rate.
As shown in
Figure 2, at a valve opening of 20%, the gas charging time was about 8.2 min. During the charging of helium gas, the input data remained stable. When the valve is 60% open, the gas charging time is reduced by 3.3 min due to increased gas induction from the back pressure and flow. Significantly, when the valve is fully open at 100%, the gas charging time is reduced by 2.2 min compared to other valve positions.
By analyzing the three different rates, one can see that the time loss is represented by the shaded area in
Figure 2. As valve opening increases, the charging time of helium exhibits a nonlinear trend. The reason for the nonlinear characteristics is verified that as density increases, the compression pressure is also increased from the charging times. More specifically, Gas particles collide and interact with each other. When compression occurs, the average distance between gas particles decreases, leading to an increase in the frequency of collisions between particles. These collisions convert the kinetic energy of the particles, causing compression. The temperature and pressure of a gas are closely related. When the temperature rises, the kinetic energy of gas particles increases, resulting in more collisions and interactions between particles. Consequently, the pressure also increases, leading to compression. In other words, it can be seen that hydrogen gas can generate more loss depending on the MFC valve opening amount and charging time than the characteristics of helium gas.
The loss of compression due to valve opening is generally known to follow a linear relationship in theoretical terms. These linear findings can provide valuable insights when visualizing gas flow patterns rather than focusing solely on loss issues using the ideal gas equation of the state. However, as observed in this experiment, it was confirmed that the transient loss of gas during compression, losses through the orifice, and losses arising from temperature differences among gases already present inside the reservoir are all variables. Instead of considering these losses as problems, the authors were able to analyze them as characteristics of gas expansion resulting from thermal changes, a phenomenon that commonly occurs in various environments and gas charging facilities.
3.2. Temperature and Pressure Characteristics
The result of helium temperature and pressure characteristics is related to
Section 3.1. As seen in
Figure 3, the x-axis of the graph indicates the measuring time, while the y-axis shows the initial valve opening rate.
This section describes the internal temperature and pressure results obtained from helium gas in a vessel at three different valve openings. As seen in
Figure 3a, the temperature increased with a valve opening of 20% during 10 min because the helium gas was charged in a vessel. After 10 min, the temperature decreased due to the influence of the ambient temperature for 16 min. Additionally, it can be observed that temperature trends exhibit nonlinear characteristics when helium gas is compressed at higher flow rates.
When the ventilation system is operating, the temperature undergoes a sharp decrease due to the orifice effect, resulting in a change of 7.5 degrees Celsius in the negative direction. As the temperature increases, the range from 20 °C to 49 °C shows a greater magnitude of change, and the maximum pressure recorded was 30 bar.
It can be observed that pressure characteristics exhibit a linear relationship with temperature characteristics, allowing for direct comparison between the two. Namely, if the temperature increases, the pressure also increases. Specifically, it can be observed that the increase in pressure exhibits a linear relationship with time, likely due to the fact that the pressure does not change as much as the temperature. As seen in
Figure 3b,c, the temperature and pressure values both increased up to 62 °C and 30 bar, respectively, when the valve was opened to 60%. The reason for the sudden increase in temperature is that the helium gas flow exceeded the orifice effects of the 20% valve opening control. It can be shown that at a valve opening of 100%, the temperature and pressure values significantly increased up to 84 °C and 30 bar, respectively, when compared to the other settings.
Upon completion of the valve opening in the mass flow controller, it is observed that the pressure of helium gas instantaneously decreases and then increases. This phenomenon can be considered a challenge that may not be readily noticeable in facilities or measurement devices where all gases are typically charged. For instance, when filling natural gas, LPG, or propane gas into a reservoir, these errors may go unnoticed. In essence, it can be analyzed as a physical issue rather than a measurement problem, with the cause being more critical in situations requiring rapid and high-pressure charging. In the future, it appears that post-measurement technologies will be necessary to address these challenges, as indicated by the findings from this experiment.
Consequently, both the temperature and pressure increase as the MFC valve opens further because the helium gas flow is accumulating during the valve opening time. Furthermore, in the case of helium temperature, it increases significantly when the gas is charged rapidly, compared to the pressure characteristics. The gas behavior principle as this increase in temperature and pressure becomes evident when the flow rate inside a constant volume vessel is rapidly compressed leads to an increase in particle collisions and internal energy changes within the helium gas.
3.3. Peak Temperature and Pressure Values
With regards to the peak pressure characteristics, as shown in
Figure 4, they can be compared to different trends at the same time. Here, the gap between pressure values increases gradually as the valve opening condition increases because the gas pressure is affected by the inflowing gas flow. The maximum pressure value is recorded in the order of 20%, 60%, and 100% valve opening. The pressure difference can be shown to decrease over time as the ventilation algorithm operates and pressure energy is dissipated.
Furthermore, it is shown that when the valve is opened quickly, there is energy loss in the pressure when the valve is closed. Namely, these losses can be observed just after the peak pressure points. With respect to temperature characteristics, it was found that there are higher changes when charged with helium gas because the increases in pressure are converted to temperature energy in the vessel. As shown in
Figure 5, the temperature increased up to 49 °C, 62 °C, and 84 °C, respectively, at valve openings of 20%, 60%, and 100%. The reason for the higher temperature increases is that the pressure is compressed in a vessel when helium gas is charged into it, and the gas is delivered rapidly as the valve opening changes during the charging process.
Therefore, the temperature of the helium gas gradually increases in the order of 20%, 60%, and 100% as the valve opening rate changes. However, the maximum pressure is maintained by setting the condition of the initial target algorithm.
As a result of an experiment analyzing temperature variations based on the opening levels of the three valves within the mass flow controller, it was observed that the highest temperature readings were obtained when the flow control valve was opened widely, resulting in high-pressure gas charging. This occurrence can be attributed to the rapid concentration of gas flow, leading to a compression effect. Consequently, the gas particles within the reservoir, as they attempted to move in response to the reaction force, collided with each other, causing even greater flow losses and contributing to the elevated temperature measurements. In summary, these experiments have revealed several key findings. Similar to the charging of electric vehicles, it was observed that reducing the flow rate during helium gas charging led to a decrease in charging errors. Furthermore, rapid movement of the helium gas flow rate can introduce risks associated with temperature increase and significant gas flow losses. The experimental results also confirmed that the loss amount, particularly in the case of hydrogen gas, can be proportionally higher compared to helium gas when rapid flow rates are involved.
Helium has a higher density than hydrogen, but its physical properties are remarkably similar. As a result, helium gas is frequently employed as a substitute for hydrogen gas in numerous settings. Also, based on the research results of this experiment, it becomes evident that efforts to mitigate energy losses associated with measurements in natural gas, hydrogen gas, LPG, and auxiliary gas supply systems should be a priority. In other words, while these systems are commonly used for instant gas supply in various industries, it is recommended to consider implementing pressure and temperature sensors to rectify situations where losses may occur and to ensure the accurate supply of flow energy. Consequently, it is anticipated that employing the data acquired from this experiment to scrutinize the physical attributes of various errors that should be taken into account during gas charging or discharging will be advantageous in achieving more precise and accurate measurement outcomes.
Using helium gas, the authors were able to confirm that temporal losses, dependent on the duration of flow supply and valve opening, exhibit differential behaviors. However, it remains challenging to predict whether even greater losses would occur if this experiment were replicated using actual hydrogen gas instead of helium. Consequently, it is advisable to subdivide the experimental conditions into high and low-temperature settings, and to apply high-pressure conditions of 100 bar or more. Conducting experiments that allow for comprehensive control and conditioning of mass flow rates will enable more reliable research outcomes. Such efforts are expected to yield valuable results for both scientific and industrial research.


