1. Introduction
Nowadays, reducing energy consumption in the context of an increasing need for comfort is a global trend that can improve the performance of buildings. Residential or office building users can adapt their own routines in order to maintain indoor air quality at a desired level by using a continuous monitoring device. In this way, they are able to understand the impact of their behaviour on the quality of the indoor environment and can undertake appropriate measures.
In recent years, global population growth has led to increased housing and job needs, which has made it imperative to adopt innovative solutions embedded in the built space of residential and office buildings. It is well known that buildings significantly contribute to global energy consumption due to their heating, ventilation and air-conditioning (HVAC) systems, having a major impact in terms of greenhouse gas emissions [
1].
Even though energy efficiency is a key element in the process, occupants’ health and comfort must also be considered, with the aim of finding an optimum between the two. A perfectly insulated house is, of course, optimal in terms of energy needs, but from the occupants’ point of view, it can prove unhealthy, presenting the so-called Sick Building Syndrome [
2]. The evolution of smart technologies and the Internet of Things (IoT) has set a path for improving energy efficiency, energy savings, and occupants’ comfort and health in the built environment, as well as for enhancing the overall building performance [
3]. Thus, Moreno et al. showed that [
3] by controlling specific parameters like lighting, HVAC, switches and blinds in a test lab of the University of Murcia, energy savings from 14% to 30% can be achieved. According to Vardoulakis et al. [
4], as well as Fyfe et al. [
5], a deterioration in occupants’ health is associated with exposure to high levels of indoor pollutants and compounds emitted by building materials. In order to prevent the harmful effects of exposure, it is important to correlate energy efficiency actions with adequate ventilation rates. Air tightening and inadequate ventilation might affect indoor air quality and raise radon (
222Rn), total volatile organic compound (TVOC) and formaldehyde (HCHO) concentrations. Vardoulakis et al. [
4] performed extensive research on indoor air pollutants by analysing 226 articles and revealed that the most monitored parameters are suspended particulate matter (PM), nitrogen dioxide, TVOCs including formaldehyde, polycyclic aromatic hydrocarbons and carbon monoxide. Zanni et al. [
6] analysed indoor air quality in several spaces in a hotel in Turin. The results of PM2.5 monitoring showed that mean values from 4.09 to 9.33 µg/m
3 were registered; TVOCs varied from 108.4 to 162.41 ppb, while CO
2 values from 457.1 to 463.44 ppm were registered.
Smart IoT systems represent promising solutions that, through the integration of various sensors, devices and data analysis algorithms, offer the possibility of integrated control, automated diagnostics and users’ proactive control.
Interest in the development of local or remote comfort-monitoring and control systems in residential or office buildings underwent an increased trend after the 2000s [
7,
8,
9,
10]. If the energy efficiency of a residential area is the objective, then consumption monitoring must be carried out for the entire building [
9], as well as its surroundings (for example, public lighting). Systems dedicated to monitoring and analysing environmental parameters and consumption in residential and office spaces mainly consist of the following [
8]: a hardware module for data acquisition, a software module for collecting and processing the measured data and a storage module (cloud—repository). When monitoring environmental parameters in residential and office buildings, challenges are often encountered regarding the communication of the sensors (wired or wireless), the sampling rate and/or data storage, as well as cybersecurity aspects. Most of the recent research has aimed at studying and analysing energy consumption and comfort parameters for a residential block or district [
11,
12,
13]. The monitoring and control of such areas pose complex challenges, involving not only communication between different sensors and between sensor subsystems but also communication with the network.
Addressing the issues of sustainability, energy security and access to electricity supply at the decentralized level was also facilitated by the integration of renewable energy sources in buildings. In this regard, building-integrated photovoltaic panels (BIPVs) [
8], solar thermal facades (STFs) and energy storage systems are noteworthy. Also, a series of directives that facilitate the integration of renewable energy sources in buildings have been adopted by the European Union [
14,
15].
The existence of different sensor types, smart electronic and household appliances and the IoT has facilitated the undertaking of numerous studies aiming at comfort monitoring. Aspects regarding the consumption curve and user comfort are carried out either by nature-inspired algorithms [
16] or on the basis of a harmonic model [
17]. Some studies have investigated user behaviour in order to create patterns that allow the development or improvement of monitoring solutions. To study the interaction of the user with the environment, in the research carried out by Chimamiwa et al. [
10], several sensors were used—motion sensors (on some household appliances, to detect, for example, when the refrigerator door is opened), pressure sensors (on the bed, sofa), light, temperature, humidity and smart sockets. Some research [
8] analysed the hardware and software architectures of different monitoring and forecasting systems for residential clusters.
The concept of IoT and smart systems for the management and monitoring of health and comfort parameters is also addressed by numerous works in the healthcare field. For example, in a review by Mohammed et al. [
18], a series of research studies that investigated how to communicate, connect and control different devices that can improve the health and comfort of patients, doctors, caregivers, etc., are analysed. Among the devices to be monitored and controlled in real time are healthcare and therapeutic gadgets, well-being-checking devices and external or internal gadgets that monitor electrical, thermal, chemical and other parameters related to the patient body. These data enable better information and emergency management of the patient and medical system.
The security issue of monitoring and control systems is also of great importance. Some of the reported studies in the literature have already approached this subject [
19,
20,
21,
22], highlighting both the possible vulnerability of cloud-stored data and the user’s lack of expertise.
Moreover, many articles report the development and application of wireless sensor instrumentation solutions in order to register and analyse as much data as possible. These solutions are widely used to monitor indoor environmental quality in public and residential buildings [
23,
24,
25]. Some studies envisaged user-friendly interfaces that provide concise visualization and interpretation of the registered comfort data through wireless sensor networks (WSNs) [
24]. Others [
26] focused on designing autonomous sensor nodes that register data and take further automatic decisions and actions. Bourdeau et al. [
24] used a wireless sensor network to monitor the air quality inside three newly retrofitted collective residential buildings (apartments and common areas) from June to December, 2021. It was found that CO
2 values ranged from 400 to 3000 ppm. The WSN system helped in checking the normal operation of the ventilation system to ensure adequate air quality in apartments and to detect certain deficiencies.
The current research explores the concept of energy-efficient buildings and how integrating an IoT monitoring system can contribute to improvements in the overall comfort and health of occupants. The proposed system includes sensors for the continuous, real-time monitoring of the concentrations of various parameters, pollutants like radon, CO2, suspended particulate matter, formaldehyde and TVOCs, as well as meteorological factors like temperature and relative humidity. To test and validate the system, preliminary experiments were conducted in an office building with specific settings. The data provided by the new modular, custom-made and replicable system for the monitoring of indoor comfort and health set the path for the end-user to control and adjust its parameters. Although the experimental model of the system was used to monitor comfort in an office building, this can be easily applied or adjusted to end-user needs in residential or other types of buildings as well by adding or removing specific sensors.
While most existing solutions focus on monitoring common parameters related to either health or comfort [
27], the innovative character of the proposed system allows it to provide accurate measurements of a multitude of parameters related to both health and comfort. Moreover, apart from the frequently measured health parameters [
27], the current research also includes
222Rn monitoring. A recent literature review of 163 papers performed by Chakraborty et al. [
27] showed that radon is not monitored by current IoT systems. The current research also addresses the new legislation requirements in Romania published on 27 July 2023 [
28]. The regulation states the obligation to determine the indoor radon concentration in public and office buildings. Thus, the system provides users with access to real-time data on potentially harmful pollutants in order to undertake appropriate control and reduction measures. Not only are users able to protect their health, but, at the same time, they can also control and improve comfort in living and working spaces. In this regard, one of the novelties of the proposed monitoring system consists of implementing an Arduino microcontroller with a unique code written using a specific programming language tailor-made for this specific application. This code enables data acquisition from multiple sensors and devices, making it suitable for subsequent integration with an energy management system. This facilitates the automation of HVAC systems, contributing to the improvement of the energy efficiency of the building.
The conducted tests are considered preliminary since only health and comfort parameters were monitored in a short time period. The researchers aim to extend the measurements to long time periods and to add a dedicated energy efficiency module based on smart plugs and switches, as well as indoor occupancy sensors.
This paper is structured in six chapters.
Section 1 reviews the current state of the research field and presents the main achievements in IoT monitoring system development.
Section 2 highlights the main definitions and standards related to indoor comfort parameters. While
Section 3 proposes a methodology for IoT system development,
Section 4 provides the description, analysis and interpretation of the experimental results following the system testing in an office building.
Section 5 points out the limitations of this article.
Section 6 concludes the main findings of the paper.
2. Indoor Comfort
The concept of comfort refers to a specific condition of well-being [
29] based on the indoor environment perception through the occupants’ senses [
29] and comprises all of the parameters monitored and controlled through installations, which directly influence peoples’ moods and act on their senses, such as thermal, acoustic, olfactory and visual comfort [
30].
Indoor environmental quality (IEQ) can positively or negatively influence occupants’ health. Thus, IEQ includes a series of factors, four of which are considered of maximum importance. These directly influence the perception of the indoor environment and, at the same time, can also have an effect on the physical and mental states of users [
27,
30]. The main factors regard thermal comfort or the indoor climate, which is mainly based on temperature and humidity, air movement/speed and temperature; visual comfort or the quality of lighting, determined by the visual field, the illumination level, reflection and other parameters; indoor air quality, which is a complex factor that includes odours, indoor air pollution and the maintenance of clean air; and acoustic quality, influenced by indoor/outdoor noise and vibrations [
31,
32].
Thermal comfort is defined by ASHRAE in the ANSI/ASHRAE 55-2013 standard [
33], but also by ISO 7730:2005 [
34], as that state of mind that expresses satisfaction in relation to the surrounding environment. These standards propose thermal comfort equations only for naturally ventilated buildings, which are not conditioned. Adaptive thermal comfort is quantified by comfort equations established by specific data from certain climates. According to Romanian legislation, the I5 standard [
35] is used for the design of ventilation installations, which are based on the comfort categories provided by EN 15251:2007 (currently withdrawn) and are referred to as ambiance categories. Regarding adaptive thermal comfort, the standards are more restrictive, and the design and evaluation of buildings according to this method are only allowed by ISO 7730 and ASHRAE 55 standards.
A study performed by the World Green Building Council [
36] led to the following conclusions and recommended values:
Indoor air quality: The improvement in occupants’ health and productivity in office buildings as a result of increased indoor air quality is well known. Increased CO2 concentrations, pollutants and low ventilation rates affect these buildings. The main findings of the conducted study revealed an improvement of 8 to 11% in productivity provided by increased air quality.
Thus, when analysing the indoor CO
2 concentration values shown in
Table 1, it can be noticed that they increase when the building is occupied and there is no ventilation.
At the end of the day, in a classroom without natural or mechanical ventilation, CO
2 concentrations can reach values of up to 4000–5000 ppm [
37]. An improvement in air quality can be achieved by mechanical ventilation by exhausting the used indoor air and introducing fresh outdoor air. This air movement is performed by using fans [
37]. The role of ventilation inside buildings is mainly to maintain increased air quality by diluting pollutants. Specifically, the steady-state concentration of a pollutant at a given emission rate is dependent on the ventilation rates. As the ventilation rate increases, the final steady-state pollutant concentration decreases [
38].
The fundamental goal of the smart ventilation concept is to reduce the consumption and cost of ventilation energy while maintaining at least the same level of air quality compared to a continuously operating ventilation system [
39].
Humidity values, as shown in
Table 2, play an important role in the thermal comfort state. For example, high humidity accentuates the heat sensation in the summertime, while low humidity in the wintertime causes discomfort related to the respiratory system. During the winter season, generally, the outdoor humidity is lower, which is also reflected indoors [
37].
Volatile organic compounds are organic substances that evaporate very easily. About 150 such substances have been identified, with the most harmful and frequently found within indoor spaces being formaldehyde, acetaldehyde, benzene and toluene. The main sources of TVOCs are cleaning substances, processed wood furniture and paint, including those for textile and plastic products [
37]. The recommended TVOC values are max. 100 ppb.
Dust includes all suspended particulate matter of various sizes and origins. Particulate matter is classified into two significant size categories: PM 10 (particles with a maximum size of 10 micrometres) and PM 2.5 (particles with a maximum size of 2.5 micrometres). High concentrations of suspended particles are found in urban agglomerations, with the sources of PM 10 being represented by construction sites or road dust raised by traffic and wind, while PM 2.5 particles come from combustion processes [
37]. The recommended maximum values of suspended particles are suggested in
Table 3.
Thermal comfort is closely related to the air quality index and has a strong impact on workplace satisfaction. However, the studies reported in [
36,
37] show that work productivity can be improved even with reduced levels of control achieved by the occupants. Air temperature is the main parameter that influences the occupants’ thermal comfort. Usually, this is the only parameter that is taken into account, but it is not the only one that influences the hot or cold sensations [
37].
Table 4 indicates the recommended temperature values.
Table 4.
Recommended values of temperature [
36].
Table 4.
Recommended values of temperature [
36].
| Living Rooms, Wintertime |
| Increased comfort | 21 °C |
| Average comfort | 20 °C |
| Satisfying comfort | 18 °C |
| Living Rooms, Summertime |
| Increased comfort | 25.5 °C |
| Average comfort | 26 °C |
| Satisfying comfort | 27 °C |
According to the California Department of Public Health [
39], the permissible exposure limit (PEL) for formaldehyde is 0.75 parts of formaldehyde per million parts of air (0.75 parts per million, or 0.75 ppm). Legally, the exposure may be above the PEL at times, but the average exposure for any 8 h period has to fall under 0.7 ppm. Also, in July 2023, the European Union established specific limits for both formaldehyde and formaldehyde-releasing substances in different products, like furniture and wood-based items [
40]. Taking into account that these regulations must be implemented by July 2026, there is a need to develop accessible IoT systems for formaldehyde monitoring. The requirements specify that the maximum values should fall under 0.062 mg/m
3 (0.05 ppm) for formaldehyde released by furniture and wood-based articles [
41].
Radon measurements were also considered because this radioactive gas has a significant impact on people’s health. According to the World Health Organization (WHO), radon is the second leading cause of lung cancer in the general population after smoking. It emanates from rocks and soils and tends to concentrate in enclosed spaces like underground mines or residential spaces. Soil gas infiltration is recognized as the most important source of residential radon. This pollutant is a major contributor to the ionizing radiation dose received by the general population [
42]. Regarding the permissible values of radon, the European Environment and Health Information System (ENHIS) recommends action levels between 200 Bq/m
3 and 400 Bq/m
3. According to the IAEA safety standards, an appropriate reference level for
222Rn associated with dwellings and other buildings with high occupancy rates, taking into account social and economic circumstances, must not exceed an annual average activity concentration of 300 Bq/m
3 [
43]. According to Aquilina and Fenech [
44], a correlation was found between indoor and outdoor radon concentrations and different meteorological parameters at four different locations in the Maltese Islands. Independently of the stratigraphy, the maximum outdoor concentration of radon in the investigated sites was 3.5 Bq/m
3, while indoor radon concentrations ranged from 0.35 up to 54 Bq/m
3.
Table 5 [
22] shows a selection, adaptation and update of currently active standards and directives regarding the internal environmental quality.
3. Methodology of the Proposed IoT System Development
Providing a healthy and comfortable indoor environment is a basic need of people, whether this environment is a residential building, an office, a hospital or an educational institution. Parameters correlated with indoor environmental quality, temperature, humidity, carbon dioxide concentration and airborne particles are factors influencing comfort, health and productivity. Monitoring these parameters provides a series of advantages. For example, monitoring air temperature and humidity helps to identify inadequate thermal comfort conditions, while monitoring the levels of carbon dioxide, volatile organic compounds or formaldehyde may reduce their negative effects on health. These actions enable appropriate measures and therefore may lead to energy savings, with a positive impact on the environment. The data collected from the sensors can be used to adopt automatic or manual optimization measures regarding energy consumption with HVAC systems, lighting and appliances while ensuring an adequate indoor environment adapted to the user’s needs.
In order to develop a smart IoT monitoring system, the first step is to determine the main factors to be considered for assessing the complexity of specific requirements related to the building, user, environment and data privacy:
Local needs assessment in order to identify the specific indoor environmental quality and the main physical parameters to be monitored, such as temperature, humidity, air quality, the users’ roles and their requirements;
Building type, such as office, residential, hospital, educational, industry, heritage and their energy performance;
Compatibility with already-installed systems in the building, such as building management systems (BMSs), HVAC, lighting and security, age and condition of the building’s systems;
Costs for monitoring, installation and system maintenance, as well as the available budget;
Flexibility, scalability and replicability of the developed system, as the system must be able to adapt to changes in local needs in the building, which may require additional sensors or new sensors to monitor other parameters;
Flexibility of the entire data chain, from registration, storage and analysis up to visualization;
Data privacy protection represents another important factor considered in system design.
3.1. Solution of the Smart IoT System for Monitoring of Indoor Comfort and Health
The selection of the relevant sensors for the solution development begins with the establishment of the physical parameters that are considered important for monitoring. Based on the main physical parameters to be measured related to the environmental quality and comfort, the sensors and other components of the IoT system were selected. The components as well as their performance are shown in
Table 6.
Table 6 highlights the sensors suitable for implementing the experimental model and their technical specifications. Subsequently, several sensors measuring the same parameters were selected for the purpose of validating the measurement process of the proposed IoT system.
The Sensirion SCD30 (CO2, humidity, and temperature) sensor module was set to use I2C communication. For CO2 measurement, the sensor uses NDIR technology. CMOSens® technology for IR detection enables the highest-accuracy carbon dioxide measurements at a competitive price and has dual-channel detection for superior stability. Ambient humidity and temperature were measured by Sensirion’s algorithm expertise through modelling and compensating the external heat sources without the need for any additional components using a temperature and humidity sensor integrated into the very same module.
The Sensirion SFA30 formaldehyde sensor module for HVAC and indoor air quality applications was also set to use I2C communication. The sensor is based on electrochemical sensing technology optimized for the lowest false alarm rates.
The MiCS-VZ-89TE is an integrated sensor board for indoor air quality monitoring and combines state-of-the-art MOS sensor technology (semiconductor gas sensor, detecting a wide range of VOCs) with intelligent detection algorithms to monitor total volatile organic compounds and CO2 equivalent variations in confined spaces. The sensor was set to send data via I2C communication.
Each I2C sensor has a unique address that can use up to 127 devices on the communication bus.
PM 1, PM 2.5 and PM 10 are measured using the PMS5003 particle sensor, which uses serial UART communication. This sensor uses laser scattering to radiate particles suspended in the air and then collects scattered light to obtain the curve of scattered light changes with time. The microprocessor calculates the equivalent particle diameter and the number of particles with different diameters per unit volume.
RadonEye Plus 2 is a device that measures the indoor radon concentration and is designed to connect to a web database and IoT systems. The device is characterized by a pulsed ion chamber and data communication through Wi-Fi (internet) and Bluetooth LE (Android/iOS).
The connection of the Netatmo smart home weather station is achieved between the main indoor module and the internet router through Wi-Fi 802.11 b/g/n (2.4 GHz) or is made wirelessly through long-range radio (868 MHz).
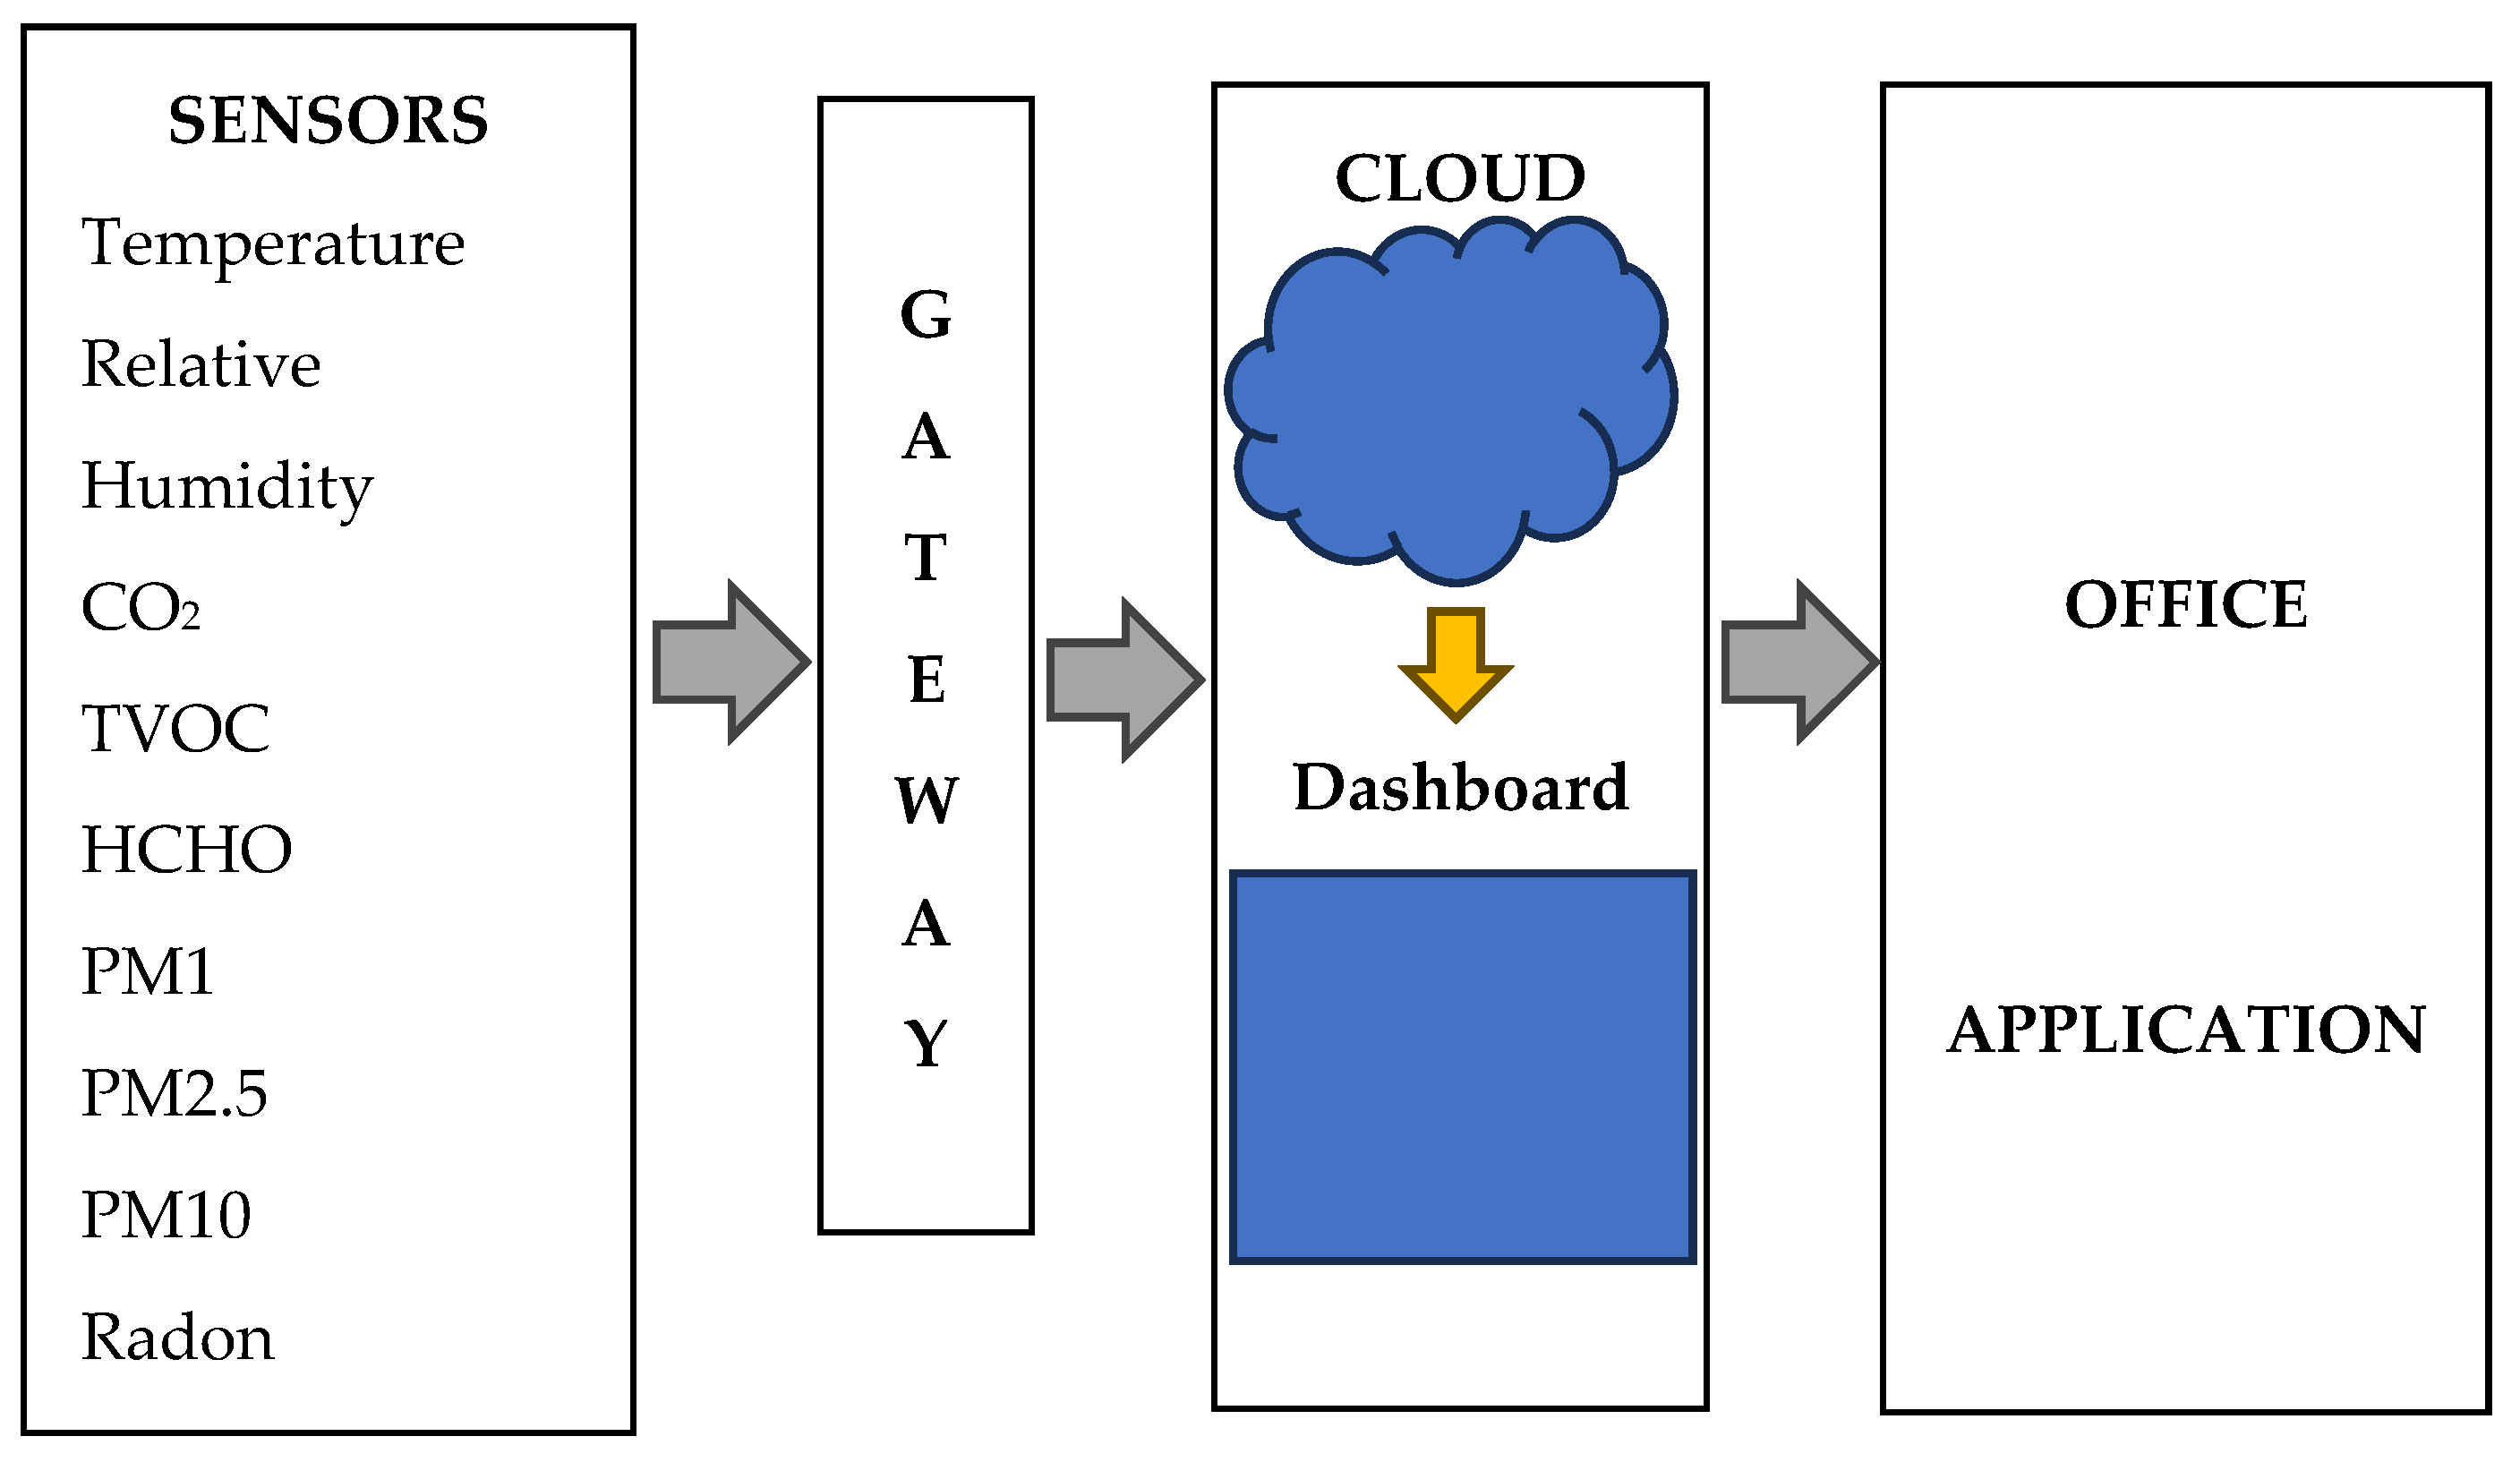
The IoT system configuration for indoor comfort and health parameter monitoring is shown in
Figure 1, while
Figure 2 shows the connection of the sensors to the Arduino development board.
The real-time environmental monitoring system (air quality) design is based on Arduino MKR WiFi 1010, as specified in
Table 6. It is an IoT system that is connected to the Arduino IoT Cloud. An Application Programming Interface (API) enables the integration of this system with other possible ones, thus making the system modular, custom-made and replicable. A preliminary interface for the user was implemented.
The following paragraph details the sensors’ specifications and their communication. The Sensirion SCD30 module needs a DC supply voltage in the range of [3.3 V; 5.5 V] and uses a maximum current of 75 mA during measurement. The module has I2C and UART communications and PWM output. The Sensirion SFA30 module requires a DC supply voltage in the range of [3.15 V; 5.5 V] and has a maximum supply current of 5 mA during the measurement. For communication, the module has i2C and UART interfaces. The MiCS-VZ-89TE module is supplied with 3.3 V and has a maximum current of 40 mA, being provided with I2C communication and PWM output. As mentioned above, the Sensirion SCD30, Sensirion SFA30 and MiCS-VZ-89TE modules were configured to use I2C communication, which requires two wires, with each module having a distinct address. The PMS5003 particle sensor needs a DC supply voltage in the [4.5 V; 5.5 V] range and requires 100 mA. It is also provided with UART communication, with logic on 3.3 V.
An example of indoor condition information gathered by all of the sensors connected to the Arduino board (temperature, relative humidity, TVOC, HCHO, CO
2) can be seen on the developed dashboard shown in
Figure 3. At this preliminary stage, the other parameters provided by the RadonEye Plus 2 and the Netatmo smart home weather station are independently monitored by the user. In the following stages, there is a more user-friendly IoT system envisaged in which all the data are integrated through a Node-RED.
3.2. Characteristics of the Monitored Office Spaces
In order to demonstrate the system’s functionality, a series of parameters were monitored over a 7-day period (18 July 2023–25 July 2023) in 3 office spaces: Office 1, Office 2 and a photovoltaic (PV)-testing laboratory (see
Table 7).
The study case was performed in an office building constructed during the 1950s and improved over the years. Thus, 12,000 BTU air-conditioning (AC) as well as LED lighting systems have been installed in each office space. Office 1 is shared by 3 persons and has a total volume of 120 m
3, while Office 2, with the same shared volume, is used only by 2 persons; see
Figure 4 and
Figure 5. The third room that was monitored has a 200 m
3 volume and a different purpose, since it is a research laboratory. It is used for temporary tests conducted by a single person. It should be mentioned that Office 1 is located right next to the Chemical Analysis and Testing Laboratory (CATL), which usually develops tests and experiments with volatile substances. Given that this laboratory was retrofitted from a previous office space, several changes and adaptations in the sanitary installations had to be performed. Due to the imperfect insulation between the rooms, some small gaps still remain, thus facilitating limited air flow from one room to another.
It should be mentioned that Office 1 and Office 2 were used for 8.5 h per day, from 7:30 am to 4 p.m., between 18 July and 20 July 2023 and between 24 July and 25 July 2023, respectively, for 6 h per day, and from 7.30 a.m. to 1.30 p.m. on 21 July 2023. The PV-testing laboratory was used every working day from 9 am to 1 pm. None of the monitored spaces was used during the weekend. During working hours, the LED lights were switched on by the occupants of the three spaces, and the windows and doors were kept closed while the AC was in operation only in the PV laboratory.
4. Results and Discussion
The meteorological and comfort parameters (temperature, relative humidity, CO2) were simultaneously monitored in all three spaces, while the health parameters (TVOCs, HCHO, PM and 222Rn) were monitored only in Office 1.
The parameter variation during the preliminary testing time frame led to the plot of the following diagrams.
Figure 6 shows the variation in meteorological parameters over the testing period inside Office 1. Considering that the monitoring period was characterized by high outdoor temperatures (34–39 °C) and also the fact that AC systems were not used, the registered values constantly exceeded (indicated with a green line in
Figure 6) the satisfying comfort values from
Table 4. The data analysis showed that the average comfort value of 26 °C was exceeded for 91.66% of the working time. However, the relative humidity values fell within the values recommended for the summertime, below 60% (indicated with a blue line in
Figure 6).
The results of the temperature and the relative humidity for the other two monitored spaces are shown in
Figure 7 and
Figure 8. Office 2 and PV-testing laboratory data analysis also showed that the temperature threshold value (indicated by green lines in
Figure 7 and
Figure 8) was constantly exceeded: 99% of the working time in Office 2 and 83.33% of the working time in the PV-testing laboratory, respectively. Reduced temperature values of around 23 °C can be noticed in
Figure 7 on 21 July 2023, when the AC was running while performing tests of photovoltaic modules, which required specific thermal conditions. As in the case of Office 1, the relative humidity values in these monitored spaces were in accordance with the values recommended for summertime comfort.
Figure 9 shows the variation in CO
2 over the testing period in Office 1. As expected, the highest CO
2 values, up to 1500 ppm, were registered in the late afternoon of the working days when the room became unventilated, in accordance with
Table 1. This is due to the fact that the occupants kept the windows and door closed. During night-time, the values dropped to 500–600 ppm, which is appropriate for ventilated spaces. The weekend period can be easily identified since the values had almost no variations, oscillating around 500–550 ppm. The recorded data suggest the need for a new ventilation system installation. Based on the CO
2 measurement, when reaching certain thresholds, the system should automatically start ventilation until the comfort parameters are achieved. This is intended to be achieved considering that exposure to high CO
2 values can lead to health issues like inflammation, a reduction in cognitive abilities, bone demineralization, kidney calcification or oxidative stress [
45].
The CO
2 values in the other two monitored spaces are shown in
Figure 10 and
Figure 11. Office 2 and PV-testing laboratory data analysis showed that the occupants’ comfort was ensured most of the time, with a single exception when a peak of 1140 ppm was registered. This happened in Office 2 due to an increase in the occupancy level for a work meeting.
Figure 12 shows the variation in TVOCs over the testing period inside Office 1 as well. It should be mentioned that this Office space is located right next to the CATL, which usually develops tests and experiments with volatile substances. Also, according to the U.S. Environmental Protection Agency [
46], the guideline values must fall below 120 ppb. A significant variation in TVOCs was registered from 18 July 2023 to 21 July 2023, when several experiments were carried out in the CATL, leading to temporary values of up to 1000 ppb, which might indicate high chances of experiencing health symptoms. The remaining monitoring period was characterized by values falling in the recommended intervals of approximately 100 ppb (indicated with a blue line in
Figure 12). A proper ventilation system and better insulation should be installed, especially in the Chemical Analysis and Testing Laboratory, in order to prevent possible pollutants from spreading to other offices.
Figure 13 shows the variation in HCHO over the testing period inside Office 1. All of the registered values fell below the permissible exposure limit of 0.75 ppm according to [
41], usually 0.02 ppm on average. The spike of 0.07 ppm, which was registered due to the unpacking of new equipment, is lower than the PEL suggested by the California Department of Health and was registered on a different day than the period with high TVOC values. However, this peak exceeds the maximum formaldehyde value of 0.05 ppm, which is currently just a recommendation from the European Union. The monitored values indicate that HCHO is not the main chemical component of the monitored TVOCs. The conditions resulting from the formaldehyde-releasing equipment were temporary since this was moved to another laboratory.
The variation in PM over the testing period inside Office 1 is shown in
Figure 14, with a display of PM 1, PM 2.5 and PM 10 values as well. The maximum average values over a year period are 10 μg/m
3 for PM 2.5 and 20 μg/m
3 for PM 10, while for PM 1, there are no limitations. In the case of Office 1, for the monitoring period, there were maximum average values of 13.88 μg/m
3 registered for PM 2.5 and 14.94 μg/m
3 for PM 10. The values suggest that, generally, the monitored concentrations do not put any individuals at risk. The peaks registered between 21 July and 24 July 2023 are due to a cumulative effect given by the fact that the office space was cleaned in the respective period only on 19 July 2023 as well as on 25 July 2023.
In order to test the validity of the IoT system for monitoring indoor comfort and health, a Netatmo weather station was used simultaneously in the same environment. The comparative variation in values registered by the two systems is presented in
Figure 15.
The comparative variation in CO2 shows very similar registered values, proving the functionality of the newly developed IoT system. Generally, the IoT system shows slightly higher values (6% higher, on average) than the Netatmo weather station. This is due to the higher sampling interval of the sensors included in the IoT system, which measures the envisaged parameters each minute, while the Netatmo weather station registers a value once every 5 min.
Being a commercial and widely used weather station, Netatmo has been placed on several office premises in order to determine the comfort of the users and the variation in CO
2 depending on the purpose of the monitored office as well as on the occupancy rate in each room. As expected, the highest CO
2 values were registered in Office 1, shared by three persons, while the lowest values were recorded in the PV-testing laboratory, used by a single person. The day/night cycles, as well as the weekend period, are easily noticed in
Figure 16, as shown by the gaps. The highest values, up to 1700 ppm, were registered at the end of the working day, when the comfort dropped and the room became unventilated in accordance with
Table 1, inducing the low efficiency of the occupants.
Regarding the radon variation over the testing period inside Office 1 shown in
Figure 17, it can be noticed that the increased values are especially encountered when the doors and windows are closed during the weekend days (22 July 2023–23 July 2023). This happens due to the fact that the air exchange rate is significantly reduced and the accumulated radon gas cannot be evacuated. During working days, when windows and doors are opened frequently, the radon values decrease and vary from 10 up to 45 Bq/m
3. An exception was registered on 18 July 2023 until noon (55 Bq/m
3) due to the fact that the room was not used or ventilated. Generally, the registered values correspond to IAEA safety standards. Besides the air circulation between rooms and the external environment, outside meteorological parameters play an important role regarding the variation in the indoor radon values, as stated by Schubert et al. [
47].
6. Conclusions
IoT-based smart sensor systems have significant potential for sensitive housing-related aspects of comfort, health, productivity and energy efficiency in buildings.
The IoT system for indoor comfort and health monitoring developed and presented within this article has focused on the following parameters’ variation: temperature, relative humidity, CO2, TVOC, HCHO and PM. Additionally, 222Rn has been monitored using an independent sensor.
The testing of the monitoring system over a one-week period showed that the proposed solution operated adequately, representing a reliable tool for data acquisition via the Arduino IoT Cloud.
Generally, for the preliminary testing period, the registered values using the IoT system fell within the recommended values mentioned in the paper. However, the analysis of the recorded data showed that thermal comfort was low for more than 90% of the working time in the two office spaces and for more than 80% in the PV-testing laboratory, respectively. Still, the relative humidity values were below 60%. Also, some increased values were observed in the case of CO2, TVOC, HCHO and PM. Up to 1500 ppm CO2 values were measured in the late afternoon when the spaces became unventilated, given the fact that the doors and windows were not opened. Thus, special attention must be paid to natural ventilation or to the improvement of building characteristics, as well as to increasing the cleaning frequency of the premises. The measured data showed that the current weekly cleaning interval is not sufficient, leading to high indoor PM accumulation. Also, the time intervals when experiments in the Chemical Analysis and Testing Laboratory are carried out should be communicated to other personnel from the nearest offices. Significant variation in TVOCs was registered when experiments were carried out, leading to a peak of 1000 ppb. As regards the HCHO parameters, formaldehyde-releasing equipment led to a temporary increase to 0.07 ppm.
Therefore, more appropriate ventilation or better isolation between the office spaces and the laboratory must be considered. It is worth recalling that the monitored spaces are located in a relatively old building with reduced retrofitting over time. The results show the need for new and improved retrofitting actions in order to eliminate the spreading of volatile pollutants and increase the occupants’ comfort.
A holistic approach that takes into account the human factor, the particular needs of the occupants, their behaviour and the integration of the developed system into the inhabited built space can lead to sustainable results.
In terms of scientific impact, it is noted that the program running on Arduino MKR WiFi 1010 was custom-made for the specific application envisaged within our work. It can be easily upgraded in order to control HVAC devices, such as heat recovery fans or air-conditioning systems, when the quality of the indoor air is below the set thresholds. Energy parameters are also taken into account for further monitoring using the same code in order to establish a correlation between energy demand and air quality. In this way, the system will determine how much energy is needed to maintain optimal living and working conditions in the monitored environment. Furthermore, the measured parameters were analysed and discussed when certain values fell outside the comfort and health ranges. Moreover, there were proposed measures to be taken to reestablish the indoor air quality, and there were identified causes leading to some values of the monitored parameters exceeding thresholds.
In the future, the IoT system will be improved either by adding other sensors for monitoring parameters and correlating them with occupancy levels or by setting thresholds for certain values of the parameters. Sensors for occupancy and open/closed doors and windows can be integrated, leading to better data correlations and local pattern prediction. The aim is to obtain a modular and reliable system that can be adapted to different applications and remain affordable at the same time.
For all of the monitored IEQ parameters, thresholds can be implemented for maximum and/or minimum values (e.g., for maximum and minimum temperatures), setting a warning mode when exceeding these thresholds (local audible or visual warning or remote warning by SMS or e-mail messages). The default thresholds will be set according to the current recommendations/directives, so users can adjust these values to their personal preferences. Once these thresholds are set, automation programs can be implemented for HVAC, dehumidifiers, humidifiers, air purifiers, ventilators, etc., which also take into account the external environmental parameters (temperature, humidity, particulate matter, TVOCs, etc.).


 ,
, 