Article

Comparative Study of the Seismic Response Characteristics of Three Special Soils

1
Key Laboratory of Earthquake Engineering and Engineering Vibration, Institute of Engineering Mechanics, China Earthquake Administration, Harbin 150080, China
2
Institute of Disaster Prevention, Sanhe 065201, China
3
Hebei Key Laboratory of Earthquake Disaster Prevention and Risk Assessment, Sanhe 065201, China
4
Xian Research Institute of China Coal Research Institute, Xi’an 710077, China
*
Author to whom correspondence should be addressed.
Appl. Sci. 2023, 13(20), 11375; https://doi.org/10.3390/app132011375
Submission received: 17 September 2023 / Revised: 6 October 2023 / Accepted: 10 October 2023 / Published: 17 October 2023

Abstract

:
Because of its special material composition, formation environment and special structure, special soil usually shows different seismic response characteristics from general soil, and sometimes causes serious seismic disasters. Therefore, the study of seismic response characteristics of special soil has important practical significance for engineering construction and disaster prevention in special land areas, and a site seismic response analysis is an important way to study the impact of site conditions on ground motions. Based on the existing research work, the uniform and single ideal soil layer profiles of three special soils are established, and the seismic response analysis program of the soilquake soil layer is used to study the effects of the dynamic shear module ratio, damping ratio and shear-wave velocity of soft soil, loess and laterite on the characteristic period and platform value of the design response spectrum under different input ground motion intensities. At the same time, three typical actual drilling data values are selected to establish the calculation model of the site soil layer. On the basis of the seismic response analysis and calculation of the soil layer, three special soil dynamic characteristics are compared from the aspects of peak acceleration and characteristic parameters. Based on the research results of this paper, the recommended values of the dynamic shear module ratio and damping ratio of three special soils are given. This work has important reference value for seismic design in soft soil, loess and laterite areas, and also enriches the research results of soil dynamic parameters.

1. Introduction

Earthquake damage indicates that the damage of strong earthquakes to engineering structures is closely related to site conditions, especially the amplification effect of soil conditions on ground motion [1]. Wood proposed that site conditions would have an impact on seismic motion after the 1906 San Francisco earthquake in the United States. Since then, in the postdisaster investigations of several major earthquakes, such as the Kanto earthquake in Japan and the Mexico earthquake, it has been found that the buildings on the soft soil sites are severely damaged. Under seismic loads, the internal structure of special soil is prone to damage, leading to a rapid decrease in strength, resulting in seismic damage such as soft soil subsidence, loess liquefaction and foundation cracking in red soil areas, resulting in casualties and economic losses.
Research on the seismic response characteristics of soft soil mainly focuses on two aspects: the existence of soft soil in the form of interlayers and the presence of soft soil sites. Bo Jingshan et al. [2,3,4] studied the influence of soft interlayers on the surface acceleration peak, response spectrum characteristic period and platform value by establishing models of soft interlayers with different positions and thicknesses. The results showed that the surface acceleration peak and response spectrum platform value were inversely proportional to the buried depth of the soft interlayers, while the response spectrum characteristic period was directly proportional to the buried depth of the soft interlayers. When the weak layer is located at the bottom of the special layer, the amplification factor is less than 1, indicating that the weak layer has an isolation effect. Lan Jingyan [5] used the equivalent linearization method to investigate the influence of the dynamic parameters of silted soil on the characteristic period and platform value of the response spectrum. The results showed that the characteristic period is inversely proportional to the ratio of the dynamic shear modulus, and this change trend slows with increasing input seismic intensity. The characteristic period is directly proportional to the change in input seismic intensity and inversely proportional to the change in shear-wave velocity and is not sensitive to changes in the damping ratio. The platform value is directly proportional to the change in the dynamic shear modulus ratio and shear-wave velocity and inversely proportional to the change in the damping ratio. The platform values of strong seismic motions are higher than those of moderate seismic motions, and under the same input strength conditions, the platform values change relatively smoothly with shear-wave velocity. Miao et al. [6] studied the effect of the loading waveform under drainage conditions on the dynamic characteristics of soft soil and found that under a certain number of cyclic loading times, the axial strain rate of the sample under the sine wave loading waveform is greater than that under the triangular or square loading waveform. Liu Shuai et al. [7] studied the dynamic characteristics of soft soil in the Pearl River Delta under cyclic loading of variable confining pressure and found that the cumulative axial strain and normalized damping ratio decreased with increasing cyclic confining pressure, and the maximum pore pressure and minimum pore pressure both increased with increasing cyclic confining pressure.
There are many slopes in the loess area, combined with basic landforms such as loess plateaus, beams, hills, etc., which have an impact on the stability of the site in the loess area. Ma Linwei [8] studied the seismic characteristics of loess valley type sites and found that as the input seismic intensity increases, the seismic motion at each monitoring point of the bedrock and loess valley type sites also increases. Wang Lanmin et al. [9] studied the dynamic response of loess slopes under the coupling effect of earthquakes and rainfall through shaking table tests and found that the deformation evolution and instability failure of the slope mainly occur in the top area of the slope, which is divided into four stages: elastic dynamic deformation stage, residual deformation rapidly increasing stage, liquefaction sliding stage and creep sliding stage. Wei et al. [10,11] studied the seismic effects of unsaturated loess in the southern region of Ningxia and found that with the increase in input seismic intensity and water content, the peak acceleration and response spectrum values of the site both show an increasing trend. Li Shuai [12] applied electron microscopy scanning to the field of dynamics and, based on studying the effects of moisture content, consolidation confining pressure, the consolidation stress ratio and vibration frequency on the damping ratio and dynamic shear modulus, explained the reasons for the differences in dynamic characteristics from a microscopic perspective.
As the depth changes, the physical and mechanical properties of red soil show a phenomenon of upper hard and lower soft (“reverse profile” law), which is exactly opposite to the changes in the physical and mechanical properties of normal soil. The special “reverse profile” phenomenon of red soil has an impact on the stability of the site in red soil areas. Liao Yiling [13] and Qin Gang [14] used red soil in the southwest region as an example to describe in detail the “reverse profile” characteristics of red soil and believed that the special soil-forming conditions of red soil were the main reason for the formation of the phenomenon of upper hard and lower soft soil. Fang Wei [15] conducted indoor experimental research on the stability of residual red soil cutting slopes, and the results showed that rainfall has a significant impact on the stability of red soil slopes. At the same time, it is proposed that the shear strength should be selected as the evaluation index for the stability analysis of red soil slopes. Liu Zhong [16] used GeoStudio software 2012.v8.11.1.7283 to analyze the seismic stability of red soil slopes. The research results showed that as the seismic intensity increased, the maximum horizontal displacement of the slope top and slope angle began to increase, and the slope stability coefficient gradually decreased. At the same time, it was noted that rainfall had an impact on the seismic stability of the slope.
In standard seismic design, the characteristic spectral period and platform value are important parameters for the response spectrum. Consequently, in recent years, research on the influences of site conditions on the characteristic period and platform value of the response spectrum has attracted increasing attention from both academic and engineering circles. In particular, due to their special engineering and dynamic characteristics, special soils will exhibit unique responses to earthquake loads, causing earthquake disasters that occur in the distribution area to be more serious [17,18]; therefore, studying the seismic response characteristics at special soil sites has important theoretical and practical significance.
A site seismic response analysis is an important method for studying the impacts of site conditions on ground motions. Based on the existing research work, this paper establishes two different soil and special soil models using the SOILQUAKE soil seismic response analysis program. One model is a uniform model. A single ideal soil section is used to study the influences of different special soil sites on the characteristic period and platform value of the design response spectrum under different input ground motion intensities. The other model is a soil section model based on measured data to study different kinetic parameters and the differences in the peak acceleration of the design response spectrum, the characteristic period and the platform value. The recommended values of this article are given through a comparative analysis. Accordingly, the research results of this paper have certain reference significance for further research on the seismic response characteristics of special soils.
Regionality is an important feature of special soils. To thoroughly analyze the seismic response characteristics of special soils, three soils are investigated. First, in terms of soft soil, Tianjin, located on the west side of Bohai Bay, has a silty coastline stretching 153 km. Soft soils are widely distributed in the Tianjin area and are somewhat representative of the region, so the soft soil in Tianjin is selected as a research object. Second, since most of the collapsible loess in China is concentrated atop the Loess Plateau, the School of Disaster Prevention Science and Technology has conducted detailed research since 2015 involving an investigation of the geological disasters associated with the Haiyuan earthquake. A large amount of actual data have been accumulated, so the loess in the Haiyuan area is selected as a research object. Third, laterite is a special regional soil that is distributed mainly in Southwest and Central-south China. Because the laterite in Liuzhou, Guangxi, has been studied in the most detail, the laterite in this area is chosen as a research object.
In this paper, three special soil homogeneous single-soil-layer calculation models are established, and the SOILQUAKE soil layer seismic response analysis program is used for the calculation and analysis. The influence of the dynamic shear modulus ratios, damping ratio and shear-wave velocity on characteristic parameters of the design response spectrum is discussed. In addition, on the basis of actual drilling data of typical areas, three soil layer calculation models of actual special soil sites are established, which are used to calculate the dynamic characteristics of the special soil that are studied in terms of peak acceleration and characteristic parameters.

2. Materials and Methods

2.1. Establishment of a Uniform Single-Soil-Layer Profile

To facilitate a comparative analysis among the seismic response characteristics of the three special soils, this paper establishes a uniform single-soil-layer section for each of the three special soils. The thickness of each special soil profile is 10 m. The bottom is mudstone with a shear-wave velocity of 500 m/s, and the top surface of the mudstone is assumed to be the input surface of the soil layer seismic response. The soil layer parameters of the three special soils are given according to the calculated seismic response of the soil layer (see Table 1 and Table 2 for details). Notably, the authors collected and organized a large amount of experimental data on the dynamic parameters of soft soil in Tianjin, loess in Haiyuan and red soil in Liuzhou in the early stage and established a preliminary database. The special soil layer parameters selected in this article were all obtained from the authors’ previous research, and the average values of typical areas of special soil were selected [19].

2.2. Establishment of the Soil Profile at the Actual Sites

To comparatively study the dynamic responses of the three special soil sites, this paper selects measured borehole data from each site in the typical special soil areas and establishes a calculation model of the special soil layer. Table 3, Table 4, Table 5, Table 6, Table 7 and Table 8 represent the sections of the soil layer seismic response analysis model, including schematic diagrams and the parameters of each soil layer.

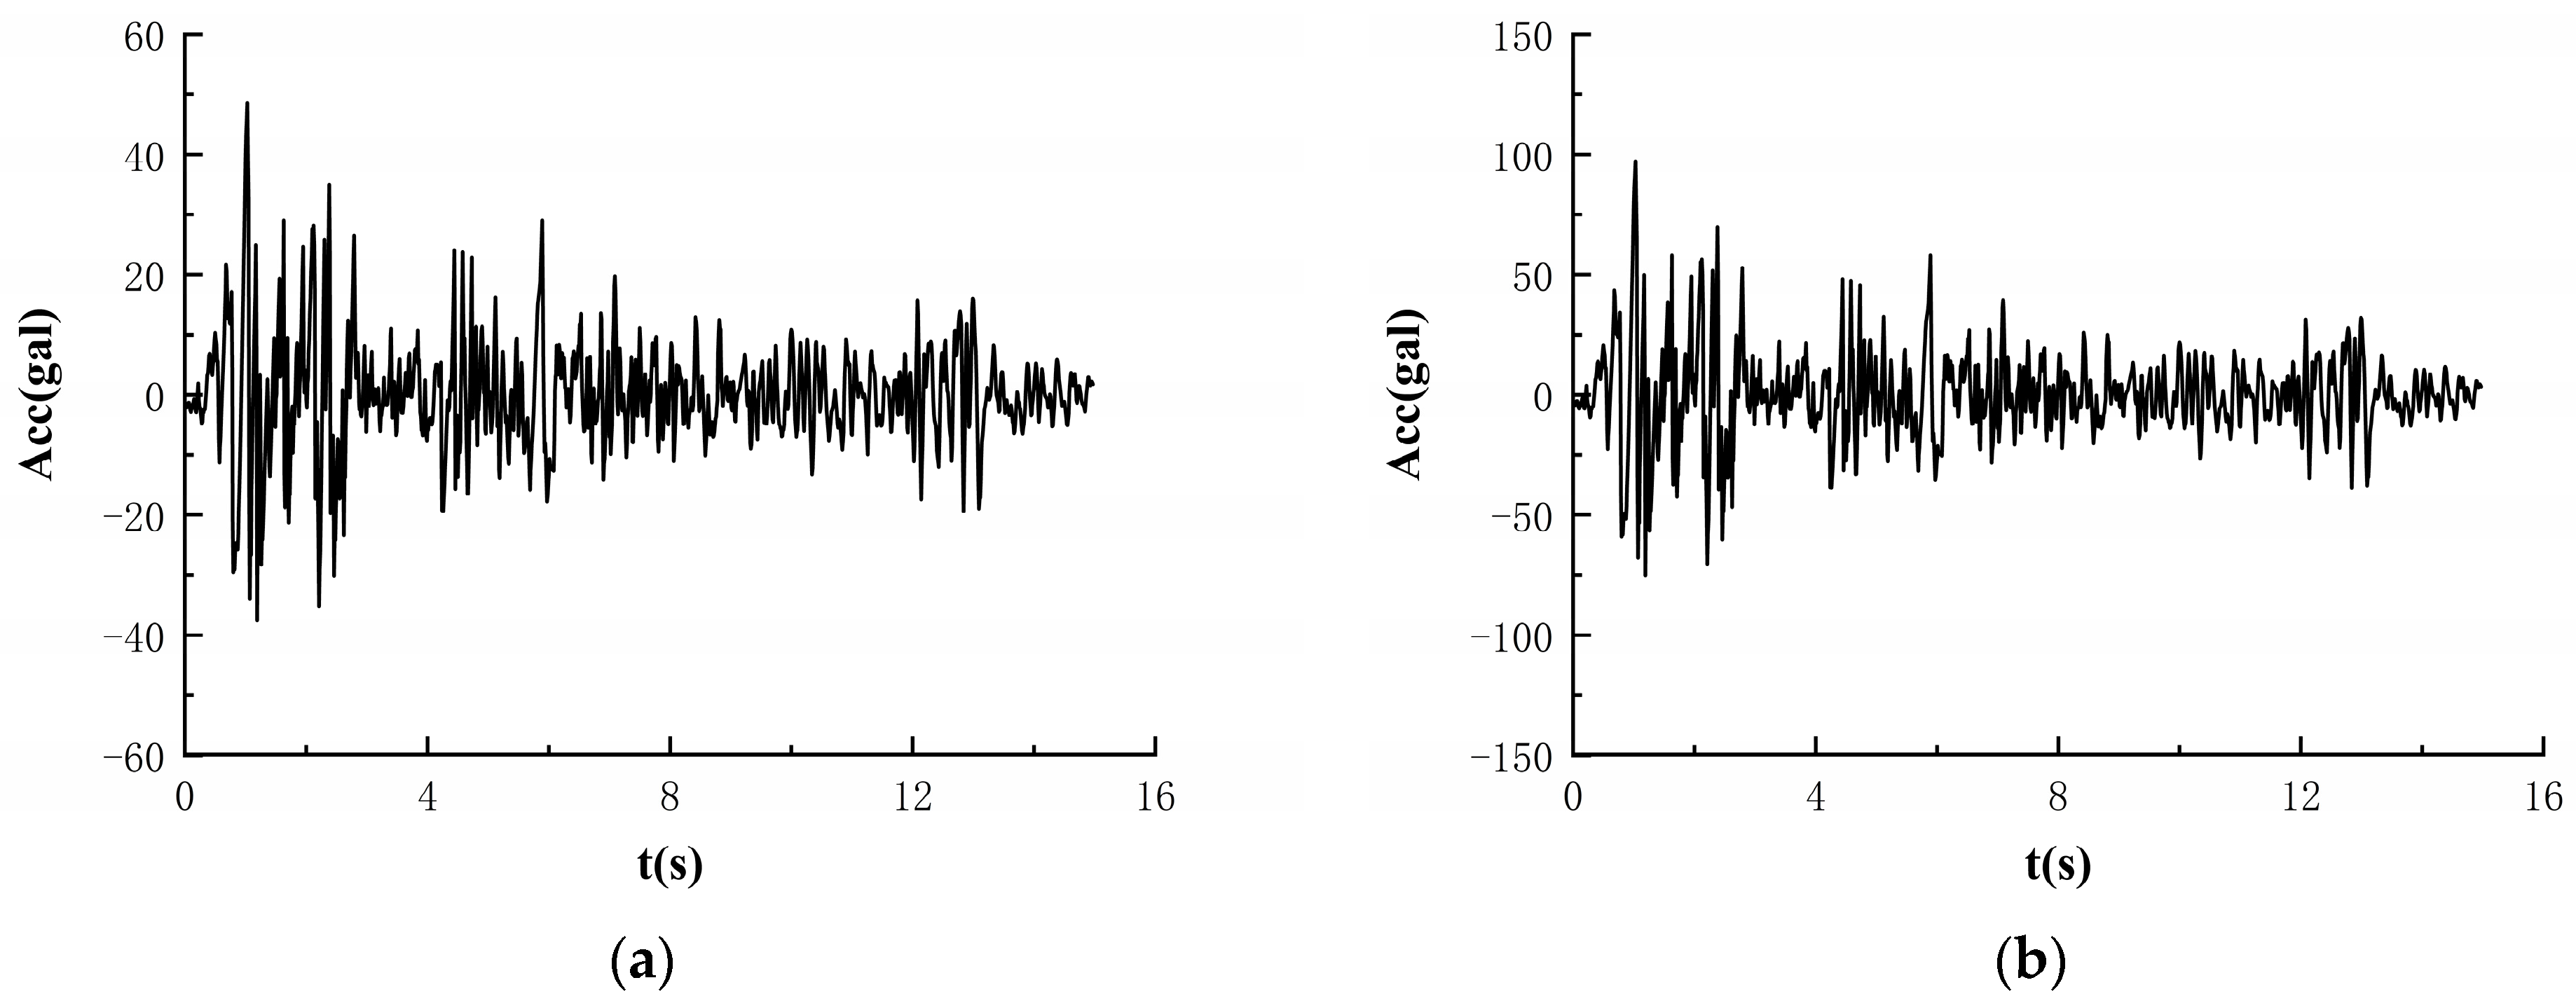
3. Selecting the Input Ground Motion

On 18 May 1940, an earthquake with a magnitude of 7.1 occurred in Imperial Valley, United States. The complete seismic waveform of the earthquake was recorded at the El Centro Strong Seismological Station located in the basement of the El Centro Substation of the Nancy Ala Power Company in southern California, United States. This earthquake is of special significance in the history of strong earthquake seismology. For the first time, a high peak acceleration record was obtained during this earthquake. This strong earthquake wave, known as the El Centro wave, is a typical strong motion record and is widely used in seismic engineering research and structural seismic analyses. The duration of the El Centro wave is 53.71 s; the peak acceleration of the horizontal north-south component is 341.7 cm/s2; the peak acceleration of the horizontal east-west component is 210.1 cm/s2; and the peak acceleration of the vertical component is 206.3 cm/s2. It should be emphasized that this strong earthquake record has made an important contribution to the development of seismic engineering, and many scholars have conducted many structural and site dynamic response analyses using this strong earthquake record as the input seismic motion history.
Due to its undisputed acceptance by the seismic community, this section selects El Centro waves as the input seismic motion time history for a soil layer response analysis, with vertical incidence from the bedrock. The amplitude of the seismic waves is adjusted to 0.05 g, 0.1 g, 0.2 g and 0.4 g (corresponding to the acceleration time history of seismic intensities VI, VII, VIII and IX); the first 15 s containing strong seismic motion are intercepted; and baseline correction is performed. Four input seismic waves (seismic waves A, B, C and D) are formed, as shown in Figure 1. For the semi-infinite space problem of elastic uniform media, the seismic field at the free surface is twice the value of the incident wave field. Based on this theoretical result, the actual problem is approximated, and it is specified that the seismic wave at the seismic input interface should be input as half of the seismic time history of the free bedrock.

4. Determination of the Calculation Method

At present, there are many calculation methods for a seismic response analysis of soil layers in engineering sites [20,21,22,23,24,25], but the commonly used calculation method in engineering is still the frequency domain equivalent linearization method, which is an approximate method for dealing with soil nonlinearity. In 2016, Yuan Xiaoming and Li Ruishan [26] proposed a new method for a soil seismic response analysis, namely, the SOILQUAKE program, which proposes a new method for solving shear strain. The calculation method for the dynamic shear modulus and damping ratio directly considering load frequency conditions is obtained through experiments. By comparing the calculation results of four types of sites, it was found that for Class I and Class II sites, the calculation results of the SOILQUAKE program and other programs are relatively close and are close to the actual records. For Class III and IV sites, the SOILQUAKE program is closer to the actual records, effectively overcoming the phenomenon of “short, coarse and fat” in the seismic response analysis calculation results of weak soil layers.
This article focuses on the seismic response characteristics of soft soil, loess and red soil. Due to the more reasonable calculation results of the SOILQUAKE program for soft soil sites compared to other programs, the SOILQUAKE program is selected as the seismic response analysis method for three special soil layers.

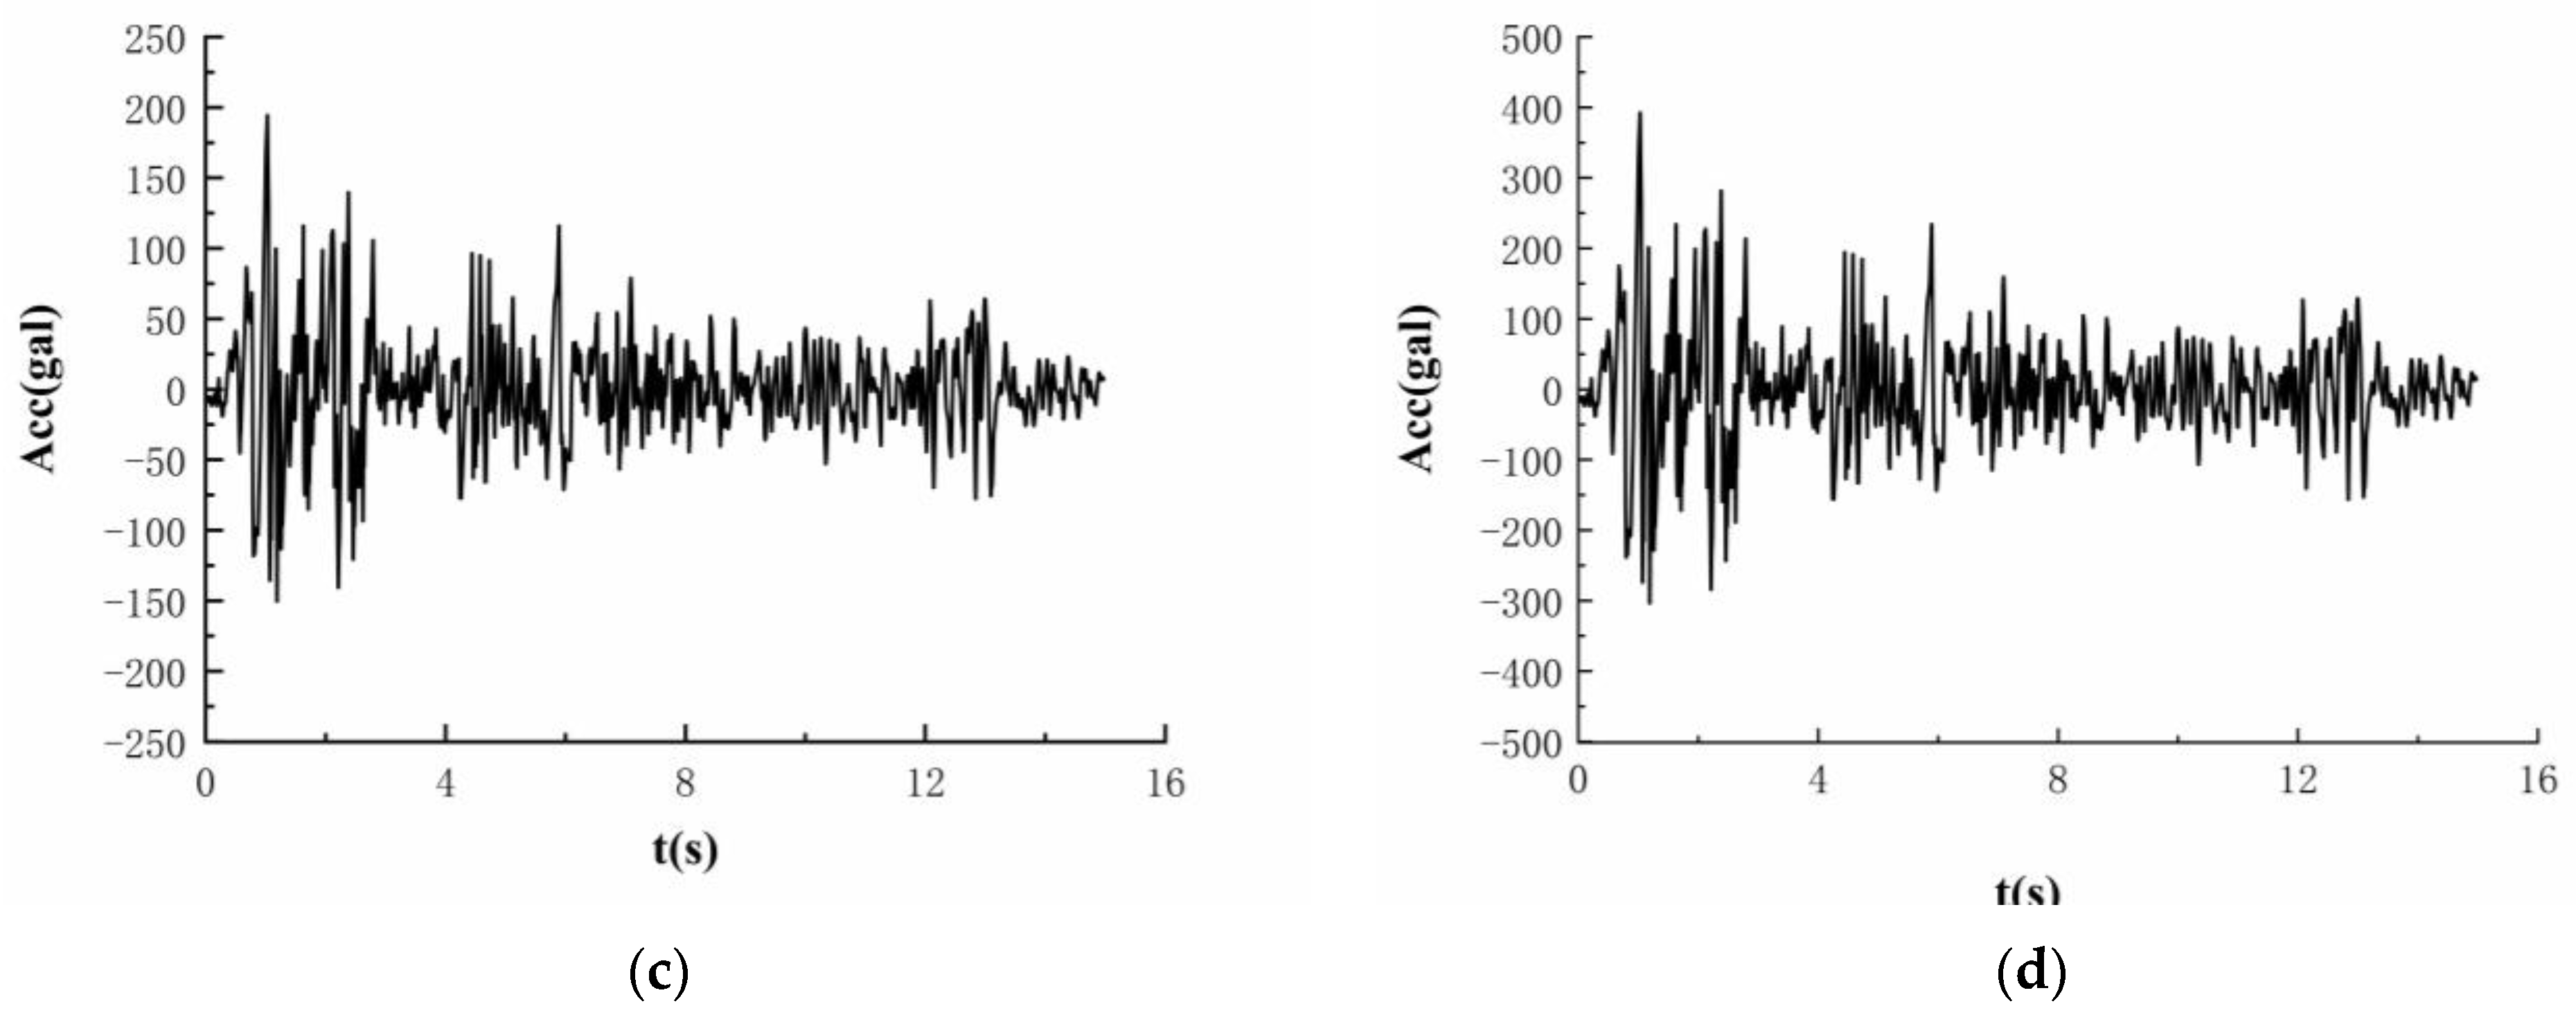
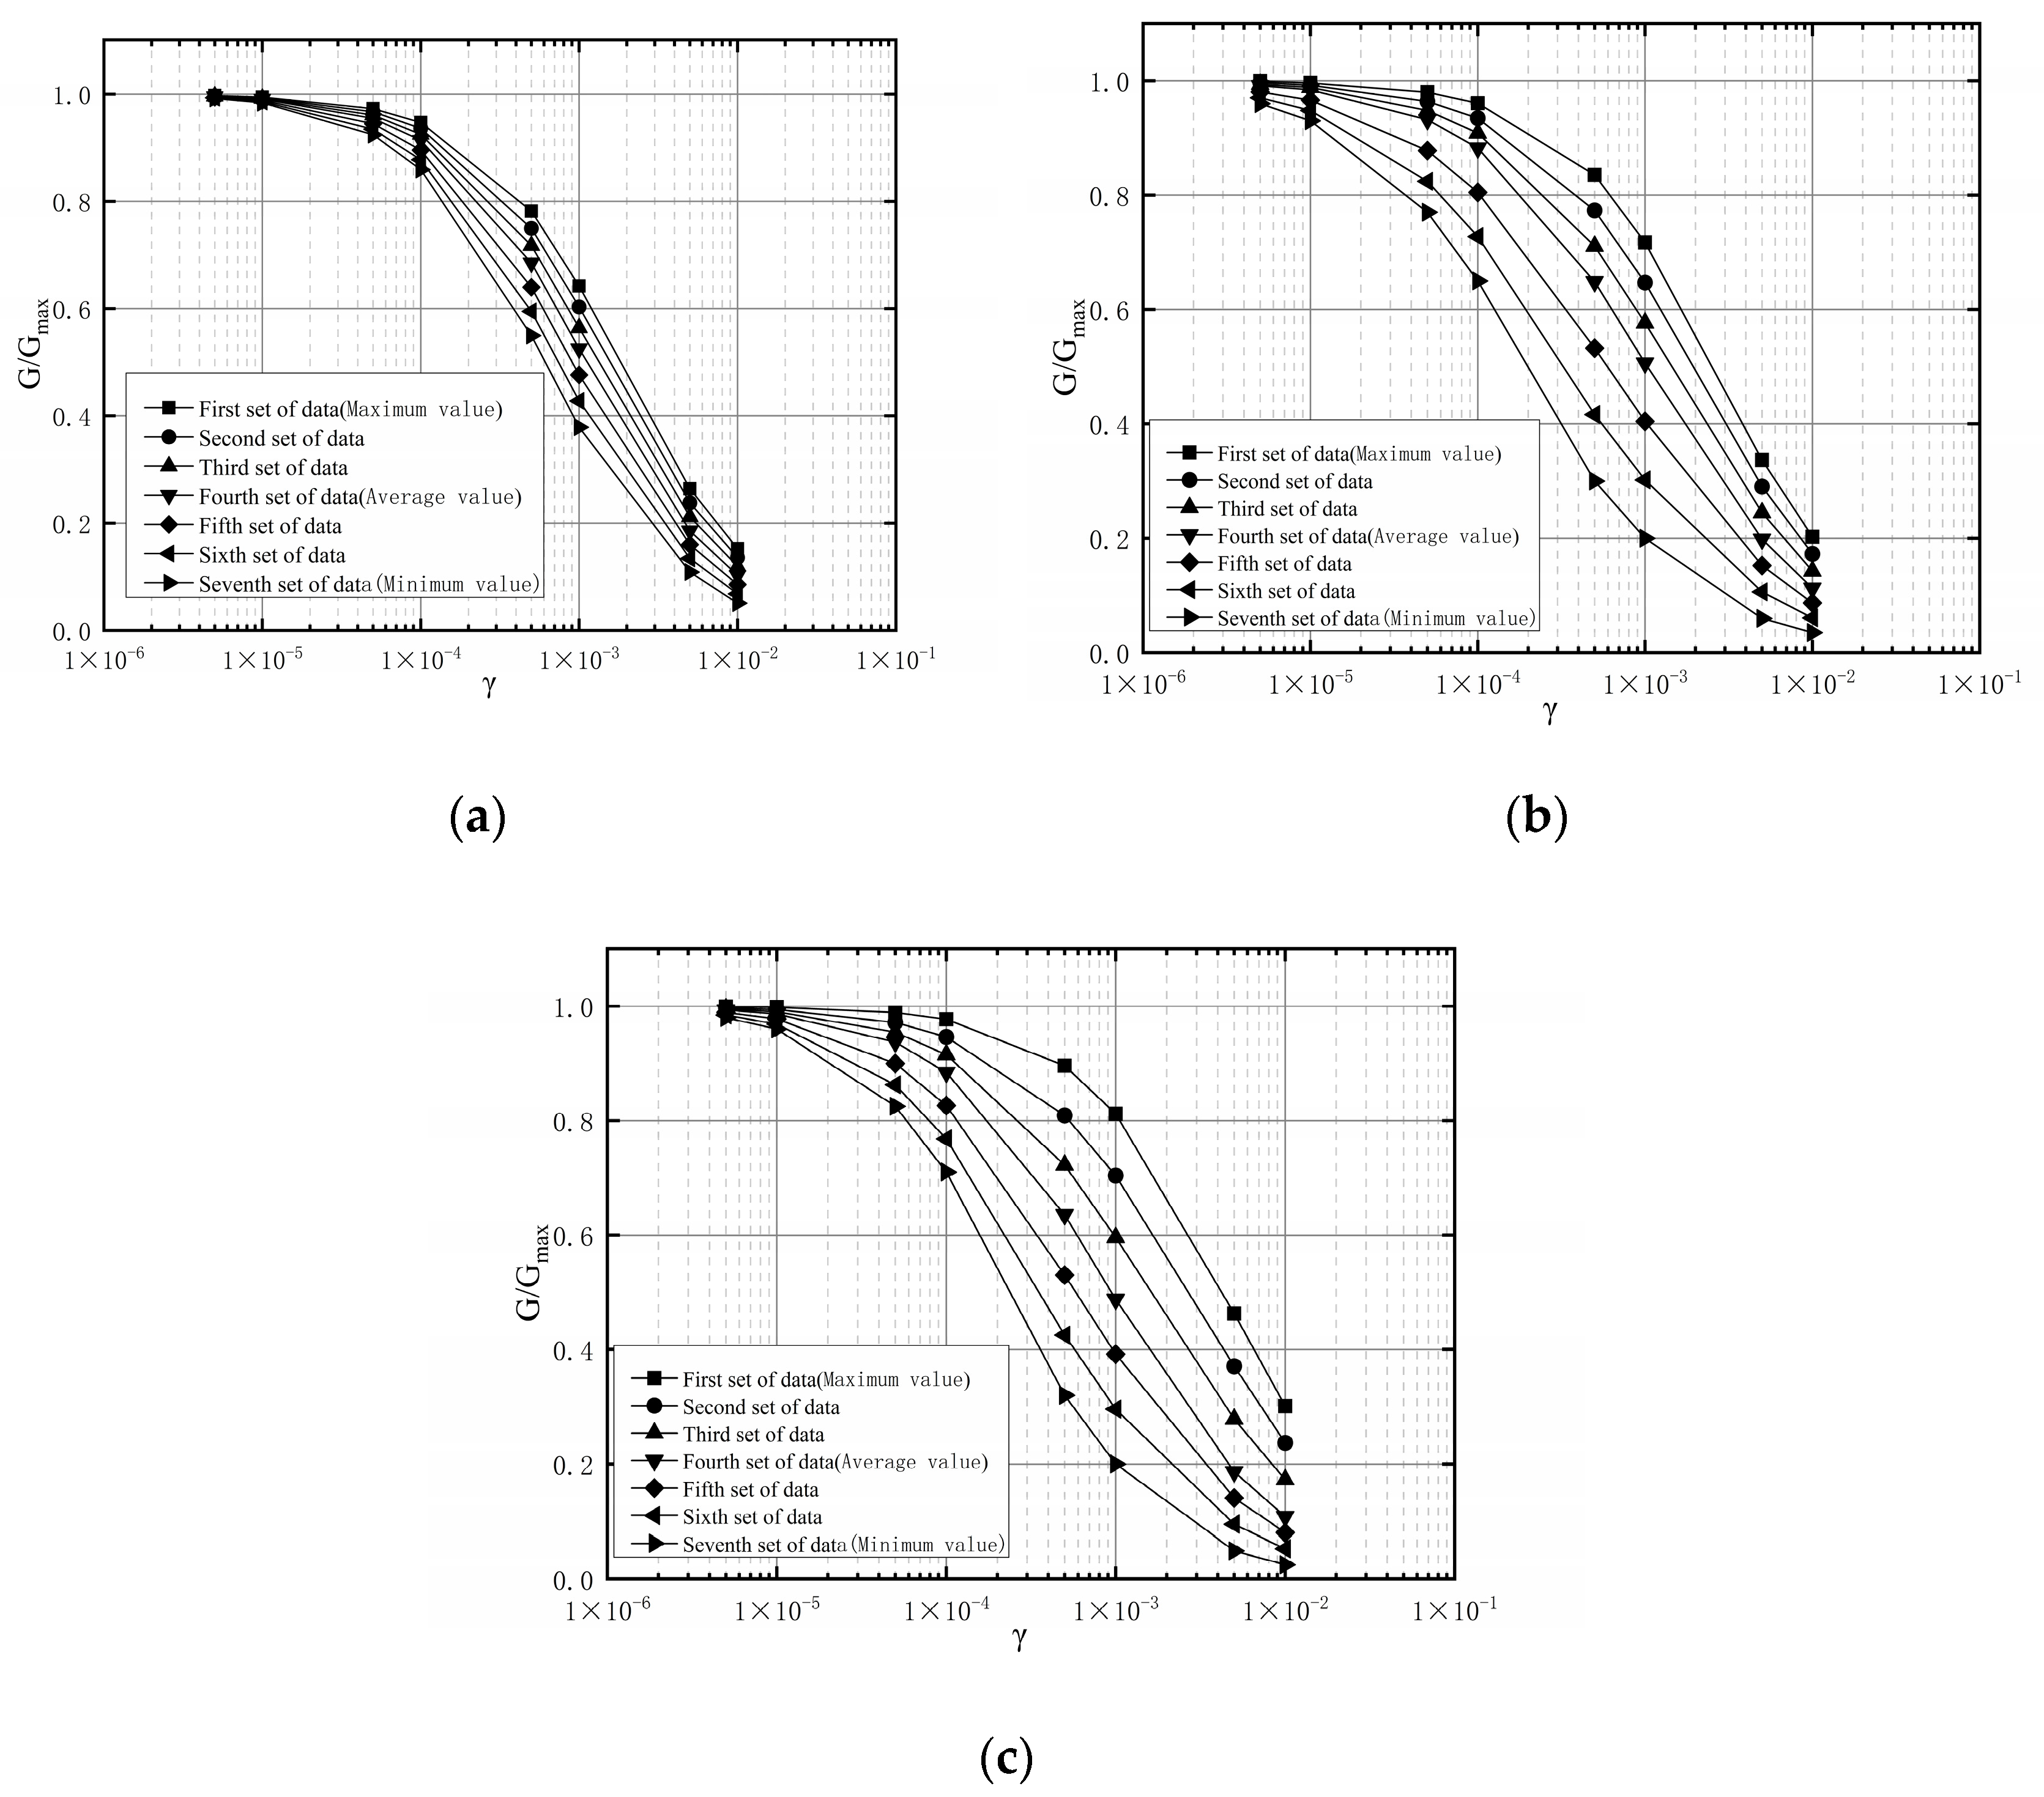
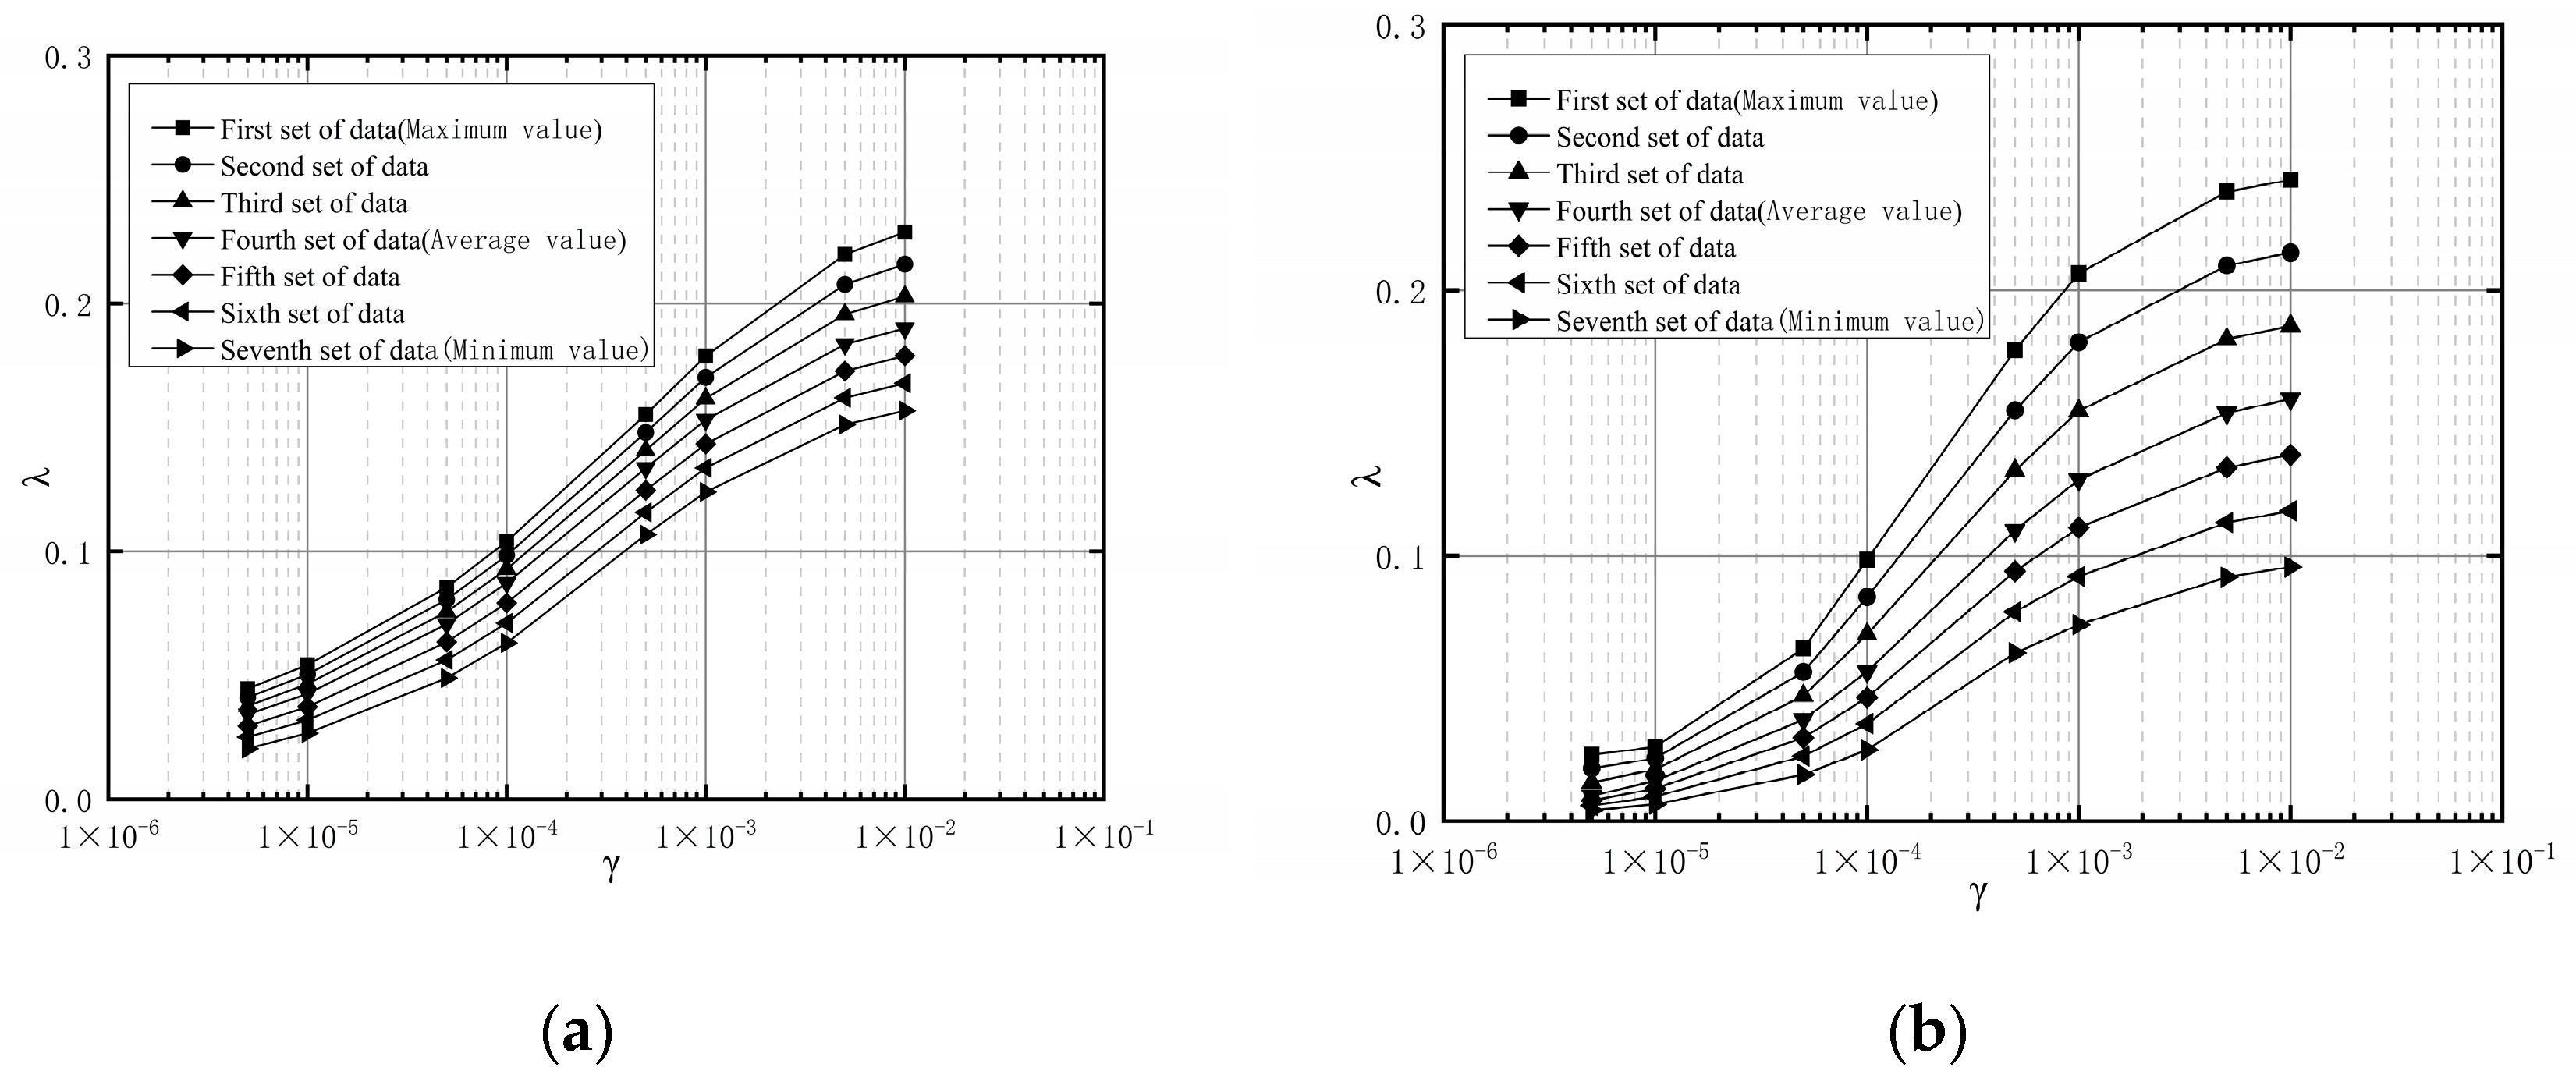
5. Calculation Results and Analysis

5.1. Analysis of the Calculation Results of a Uniform Single-Soil-Layer Profile

In this paper, a uniform and single ideal soil section for each of the three special soils is used for the calculation model. Four ground motion time histories obtained by modulating the El Centro wave amplitude are used as input seismic waves, and the SOILQUAKE program is used to calculate and comparatively analyze the characteristics and seismic responses of the three special soils.
Three typical areas of special soils are chosen [19]. The dynamic shear modulus ratio, damping ratio and shear-wave velocity within the range from the maximum to the minimum are employed, totaling seven groups of values that change sequentially and replace the corresponding values in Table 2 for the calculations. Figure 2 and Figure 3 present group diagrams of the three special soil dynamic shear modulus ratios and damping ratios, and Table 9 provides a group list of the shear-wave velocities of the three special soils.
Figure 4 depicts a schematic diagram of the calculated characteristic parameters of the design response spectrum for the three special soils under different input ground motion intensities.
As shown in Figure 4, (1) the characteristic parameters of the three special soils are proportional to the input seismic intensity; that is, the greater the intensity is, the greater the characteristic period and platform value. (2) When the input ground motion intensity is constant, the characteristic periods of the design response spectra of the three special soils are inversely proportional to both the dynamic shear modulus ratio and the shear-wave velocity but are not sensitive to changes in the damping ratio; in terms of the platform values, the dynamic shear modulus ratio is directly proportional to the shear-wave velocity and inversely proportional to the damping ratio.
To further compare and analyze the influences of the three special soils on the characteristic parameters of the design response spectrum, a fourth group comprising soft soil, loess and laterite (i.e., the averaged dynamic shear modulus ratio, damping ratio and shear-wave velocity) is selected in this paper. Figure 5 schematically compares the corresponding calculation results.
According to the comparison of the three special soil characteristic parameters in Figure 5, it is not difficult to determine the following: (1) Under an identical ground motion input, the characteristic period of soft soil is the largest, followed by that of laterite, while the characteristic period of loess is the smallest. Moreover, the characteristic periods of loess and laterite are relatively small, and the characteristic periods of both are identical, but they are quite different from (close to half of) that of soft soil. (2) When the input ground motion intensity is constant, the platform values of loess and laterite are relatively close, and both are higher than the platform value of soft soil. As the input ground motion intensity increases, the platform values of loess and laterite alternately rise to a maximum value. (3) The calculation results basically conform to the dynamic characteristics of three special soils, with similar soil strengths of loess and red soil, and all of them are higher than that of soft soil.

5.2. Analysis of the Calculation Results of the Actual Soil Profiles

This paper selects the actual soil profiles of the three special soils as the calculation models and takes the four ground motion time histories obtained by modulating the El Centro wave amplitude as the input seismic wave inputs. The SOILQUAKE program is utilized for the calculation, and the dynamic shear modulus ratios of the three special soils in typical areas are selected. The maximum, minimum, average and measured values of the damping ratio are calculated for each profile, and the results are compared and analyzed to ascertain the influences of different dynamic parameter values on the design response spectrum of each special soil site. Table 10, Table 11, Table 12 and Table 13 list the dynamic shear modulus ratios and damping ratios of the special soils.
In this paper, SOILQUAKE_1.3 soil layer response analysis software is used for the group calculation. The time step is 0.02 s, the acceleration unit is gal and the modulated peak amplitude of the input ground motion acceleration is half of the proportional modulated amplitude. The seismic response spectrum obtained is calibrated with the differential evolution algorithm. Figure 6 presents a schematic diagram of the deviations in the characteristic period, platform value and peak acceleration obtained under different dynamic parameter values from the actual measured characteristic period, platform value and peak acceleration.
Analyzing Figure 6 readily reveals the following: (1) Under different dynamic parameter values, the deviation between the characteristic periods of the design response spectra of special soils is mostly between −5% and 5%, and the largest deviation appears in the laterite model. At 0.2 g, when the kinetic parameter takes the minimum value, the calculated characteristic period of the design response spectrum is quite different from the measured characteristic period of the design response spectrum, with a deviation of 21%. Furthermore, when the input earthquake intensity is 0.4 g, the deviations between the values of the dynamic parameters of the site models and the measured values are between 10% and 20%. (2) The difference between the design response spectrum platform values obtained from the various dynamic parameters of the soft soil is small, mostly between −5% and 3%. When the input ground motion intensity is 0.2 g and 0.4 g, when the kinetic parameters of silty clay are taken as the minimum, the calculated platform value of the design response spectrum is quite different from the measured platform value, with deviations of −16% and −17%, respectively; for loess, the platform value deviates mostly between −10% and 10%; finally, the design response spectrum platform value of red clay fluctuates greatly, where the absolute range of the deviation obtained from different kinetic parameters is 0–24%. When the ground motion intensity is 0.2 g and the dynamic parameters are the maxima, the calculated platform value of the design response spectrum is different from the actual measured platform value, and the deviation is −24%. (3) When the dynamic parameter values are different, the peak accelerations of the three special soils have only small differences, with deviations mostly between −10% and 10%, and the difference between the peak accelerations of the silty clay is the smallest (the deviation is between −1% and 3%). The maximum deviation occurs on the plane surface of the soft soil layer. When the input ground motion intensity is 0.05 g and 0.2 g and the silty clay dynamic parameters are set to the minima, the calculated peak acceleration is quite different from the measured peak acceleration, and the deviations are 14% and 11%, respectively.
In summary, the maximum deviations between the peak acceleration and design response spectrum characteristic parameters of the three special soils and the actual measured values mostly appear at the minima. Therefore, when these three special soils are present at an actual project site and measured data are lacking, this article does not recommend using the minimum values in the statistical ranges of the special soil dynamic parameters. Comparing the results of the three special soil dynamic parameters under different strength conditions with the actual measured values reveals that with the input ground motion intensity, if the actual project is located in an area where the seismic fortification intensity is high (VIII or IX) and there are special soil layers in the area, these statistical values should not be used for the dynamic parameters of the special soil layers, and experiments should be conducted to acquire the corresponding values.
According to the deviations in the peak accelerations of the special soils under different dynamic parameter values and the differences in the characteristic parameters of the design response spectra from the actual measured values, this article gives the recommended values for the dynamic shear modulus ratio and damping ratio in the typical areas of these three special soils (see the details in Table 14).
Figure 7 compares the suggested curves of the dynamic shear modulus ratio and damping ratio with the shear strain in the typical areas of the three types of special soils. Evidently, the difference among the dynamic shear modulus ratios of the special soils is small, decreasing in the order of silty clay, loess and laterite. In contrast, the damping ratio is more complicated. The damping ratio of loess varies greatly; when the shear strain is lower than 5 × 10⁻⁵, the damping ratio of loess is smaller than that of either laterite or silty soil, but when the shear strain is higher than 5 × 10⁻⁵, the damping ratio of loess exceeds that of laterite, and when the shear strain is higher than 3 × 10⁻³, the damping ratio of loess exceeds the damping ratio of silty soil and becomes the maximum.

6. Conclusions

In this paper, taking the uniform single ideal profile of three special soils as the calculation model and using the soilquake program as the soil seismic response analysis software, the factors affecting the characteristic parameters of the design response spectrum of three special soils are studied. Under any same seismic input conditions, when the three special soil dynamic parameters take the same number of groups, the characteristic periods of loess and laterite are less than those of soft soil; on the contrary, the plateau value of soft soil is lower than that of loess and laterite. At the same time, it is found that the design response spectrum parameters of laterite and loess are close when the seismic intensity and the number of dynamic parameters are certain, and the characteristic period of laterite and loess is about half of that of soft soil under the same conditions.
In this paper, the measured drilling data of three typical areas of special soil are selected to establish a calculation model, and the seismic response of the soil layer is analyzed and calculated with the soilquake program. The seismic response spectrum obtained is calibrated with the differential evolution algorithm. Comparing the differences between peak acceleration and characteristic parameters under different dynamic parameters, the dynamic parameters with the smallest deviation from the measured values are selected as the recommended values in this paper.
According to previous experience, there are some differences in engineering and dynamic characteristics of special soil in different areas. In this paper, only three typical areas are selected to study the dynamic response characteristics of special soil, so the results obtained in this paper can only represent the seismic response characteristics of special soil in three typical areas. In the future, it is necessary to study the special dynamic characteristics of different regions and explore the similarities and differences between the dynamic characteristics of the same special soil in different regions.

Author Contributions

Methodology, J.B.; Software, C.C.; Formal analysis, L.W. and C.S.; Data curation, F.Q.; Writing—original draft, F.Q. and C.C.; Writing—review & editing, F.Q. and J.B. All authors have read and agreed to the published version of the manuscript.

Funding

Funding from Scientific Research Fund of Institute of Engineering Mechanics, China Earthquake Administration (Grant No. 2021D35) and National Natural Science Foundation of China (U1939209). Support from the Earthquake Technology Spark Program of China (code number: XH22023YA) and Fundamental Research Funds for the Central Universities (ZY20215149) is gratefully acknowledged.

Institutional Review Board Statement

Not applicable.

Informed Consent Statement

Not applicable.

Data Availability Statement

No new data were created.

Conflicts of Interest

The authors declare no conflict of interest.

References

  1. Dingyi, X. Soil Dynamics; Higher Education Press: Beijing, China, 2011. [Google Scholar]
  2. Jingshan, B.; Xiuling, L.; Hongshuai, L. Effects of soil layer construction on peak accelerations of ground motions. Earthq. Eng. Eng. Vib. 2003, 3, 35–40. [Google Scholar]
  3. Jingshan, B.; Xiuling, L.; Dedong, L.; Hongshuai, L. Effects of soil layer construction on platform value of response spectra. Earthq. Eng. Eng. Vib. 2003, 4, 29–33. [Google Scholar]
  4. Jingshan, B.; Xiuling, L.; Dedong, L.; Hongshuai, L. Effects of soil layer construction on characteristic periods of response spectra. Earthq. Eng. Eng. Vib. 2003, 5, 42–45. [Google Scholar]
  5. Jingyan, L. Study on Dynamic Charactistis and Seismic Ground Motion Effect of Soft Soil. Ph.D. Thesis, Institute of Engineering Mechanics, China Earthquake Administration, Harbin, China, 2016. [Google Scholar]
  6. Miao, Y.H.; Sheng, R.Y.; Yin, J.; Zhou, F.B.; Lu, J.F. Dynamic characteristics of saturated soft clays under cyclic loading in drained condition. KSCE J. Civ. Eng. 2020, 24, 443–450. [Google Scholar] [CrossRef]
  7. Shuai, L.; Zhihua, G.; Bo, H.; Song, Y.; Yongfeng, Z.; Xiaoling, Y.; Juehao, H. Experimental study on dynamic characteristics of soft soil in Pearl River Delta under cyclic confining pressure. Acta Sci. Nat. Univ. Sunyatseni 2023, 62, 131–138. [Google Scholar]
  8. Linwei, M. The Study on Characteristic of Ground Motion in Site of Loess Valley. Master’s Thesis, Lanzhou Earthquake Research Institute of China Earthquake Administration, Lanzhou, China, 2016. [Google Scholar]
  9. Lanmin, W.; Xiaowu, P.; Zhijian, W.; Junjie, S.; Ping, W.; Shaofeng, C.; Shunhua, X.; Jin, D. The shaking table test of the instability sliding of loess slope under the coupling effects of earthquake and rainfall. Chin. J. Rock Mech. Eng. 2017, 36 (Suppl. S2), 3873–3883. [Google Scholar]
  10. Wei, L. Study on Seismic Ground Motion Effect of Unsaturated Loess Site in Ningnan Hilly Area. Master’s Thesis, Lanzhou Earthquake Research Institute of China Earthquake Administration, Lanzhou, China, 2019. [Google Scholar]
  11. Lai, W.; Yuxia, L.; Zhenghua, Z.; Qian, W.; Bo, Y.; Hongmin, T.; Tonglint, L. Dynamic characteristics of unsaturated loess and their influences on ground vibration parameters of sites. Chin. J. Geotech. Eng. 2019, 41 (Suppl. S2), 145–148. [Google Scholar]
  12. Shuai, L.; Jiading, W.; Chenglin, L.; Yubo, S. Dynamic characteristics and microstructure of loess under cyclic loading. J. Arid. Land Resour. Environ. 2021, 35, 142–149. [Google Scholar]
  13. Liao, Y.; Qin, G. Research on the Composition and Structure of Red Clay in Guiyang Area and Analysis of the Essence of the Special Characteristics of Red Clay. Guizhou Sci. 1989, 2, 39–51. [Google Scholar]
  14. Qin, G.; Liao, Y. Analysis of the “reverse profile” characteristics and formation conditions of red clay. Guizhou Geol. 1994, 1, 89–93. [Google Scholar]
  15. Fang, W. Research on Stability Analysis Method of Cutting Slope of Residual Red Clay. Ph.D. Thesis, Central South University, Changsha, China, 2011. [Google Scholar]
  16. Liu, Z. Research on the Stability of the High Fill Slope at the North of the KM New Airport’s West Runway. Master’s Thesis, Chengdu University of Technology, Chengdu, China, 2013. [Google Scholar]
  17. Hu, Y.X.; Sun, P.S.; Zhang, Z.Y.; Tian, Q.W. Effects of Site Conditions on Earthquake Damage and Ground Motion. Earthq. Eng. Eng. Vib. 1980, 1, 34–41. [Google Scholar] [CrossRef]
  18. Zhang, J.Y.; Zhang, Y.D.; Xu, G.D.; Wang, Q. Analysis and engineering application of soft soil seismic settlement discrimination methods. World Earthq. Eng. 2012, 28, 53–59. [Google Scholar]
  19. Qiao, F. Study on Dynamic Characteristics of Three Kinds of Special Soils. Ph.D. Thesis, Institute of Engineering Mechanics, China Earthquake Administration, Harbin, China, 2020. [Google Scholar]
  20. Liao, Z. Seismic District Planning: Theory and Practice; Beijing Publishing House: Beijing, China, 1989. [Google Scholar]
  21. Liao, Z.; Li, X. Equivalent Linearization Method for Seismic Response of Surface Soil. In Seismic District Planning (Theory and Practice); Seismological Press: Beijing, China, 1989; pp. 141–153. [Google Scholar]
  22. Li, X. One-dimensional soil layer seismic response linearization calculation program. In Seismic District Planning (Theory and Practice); Seismological Press: Beijing, China, 1989; pp. 265–350. [Google Scholar]
  23. Idriss, I.M.; Sun, J.I. User’s Manual for SHAKE91—A Computer Program for Conducting Equivalent Linear Seismic Response Analyses of Horizontally Layered Soil Deposits Center for Geotechnical Modeling; Department of Civil and Environmental Engineering, University of California: Davis, CA, USA, 1992. [Google Scholar]
  24. Qi, W. Study on the Comparison of Soil Layers Seismic Response Analysis Methods. Master’s Thesis, Institute of Engineering Mechanics, China Earthquake Administration, Harbin, China, 2004. [Google Scholar]
  25. Hashash, Y.M.A. Deepsoil V3.7 User Manual and Tutorial; University of Illinois at Urbana-Champaign: Champaign, IL, USA, 2009. [Google Scholar]
  26. Yuan, X.; Li, R.; Sun, R. A new generation method for earthquake response analysis of soil layers. China Civ. Eng. J. 2016, 49, 95–105+122. [Google Scholar]
Figure 1. Time history curve of El Centro wave after amplitude modulation. (a) Seismic wave A (0.05 g); (b) Seismic wave B (0.1 g); (c) Seismic wave C (0.2 g); (d) Seismic wave D (0.4 g).
Applsci 13 11375 g001aApplsci 13 11375 g001b
Figure 2. Grouping curves of dynamic shear modulus ratio of three special soils. (a) Soft Soil; (b) Loess; (c) Laterite.
Applsci 13 11375 g002
Figure 3. Three kinds of special soil damping ratio grouping curves. (a) Soft Soil; (b) Loess; (c) Laterite.
Applsci 13 11375 g003aApplsci 13 11375 g003b
Figure 4. Schematic diagram of calculation results of characteristic parameters of design response spectra of three special soils under different input ground motion intensities. (a) Schematic diagram of calculation results of dynamic shear modulus ratio; (b) Schematic diagram of damping ratio calculation results; (c) Schematic diagram of shear wave velocity calculation results.
Applsci 13 11375 g004aApplsci 13 11375 g004b
Figure 5. Characteristic periods and platform values of three special soils under different input ground motion intensities.
Applsci 13 11375 g005
Figure 6. Schematic diagram of the deviation of characteristic parameters obtained by comparing the values of different kinetic parameters with the measured values. (a) Schematic diagram of characteristic period deviation; (b) Schematic diagram of platform value deviation; (c) Schematic diagram of peak acceleration deviation.
Applsci 13 11375 g006
Figure 7. Comparison of suggested curves of dynamic shear modulus ratio and damping ratio with shear strain for three special soils.
Applsci 13 11375 g007
Table 1. List of physical and mechanical parameters of three special soils.
Soft SoilLoessLaterite
H (m)101010
Vs (m/s)125270280
ρ (g/cm3)1.771.831.74
In Table 1, H is the burial depth, Vs is the shear wave velocity, and ρ is the density.
Table 2. List of three kinds of special soil dynamic shear modulus ratio and damping ratio.
ParameterShear Strain (×10−4)
0.050.10.5151050100
Soft SoilG/Gmax0.99150.99950.94910.89670.70370.58990.25430.0791
λ0.03240.04680.08100.09610.13200.14780.18540.2019
LoessG/Gmax0.99820.97810.88130.81800.62080.51430.21680.0670
λ0.00710.02550.06770.08570.12680.14430.18430.2013
LateriteG/Gmax0.99860.98550.89890.83740.63830.52830.21670.0582
λ0.00530.00880.02490.03520.06710.08420.13190.1558
MudstoneG/Gmax1.00001.00001.00001.00001.00001.00001.00001.0000
λ0.00400.00800.01000.05100.02100.03000.03600.0460
Table 3. List of soft soil layers.
NumberSoilBuried Depth
(m)
Shear Wave Velocity
(m/s)
Density
(g/cm3)
T1Silty Clay3.9134.01.81
T2Clay16.8139.01.74
T3Clay22.3204.01.99
T4Silt32.4293.02.08
T5Clay36.7285.01.99
T6Silt49.0373.02.09
T7Clay53.4365.01.98
T8Sand-Silt63.3492.02.07
T9Clay69.5442.01.98
BedrockSand-Silt72.1526.02.07
Table 4. List of loess soil layers.
NumberSoilBuried Depth
(m)
Shear Wave Velocity
(m/s)
Density
(g/cm3)
H1Loess222701.83
H2Gravel Soil404592.02
BedrockMudstone 8002.40
Table 5. List of Laterite soil layers.
NumberSoilBuried Depth
(m)
Shear Wave Velocity
(m/s)
Density
(g/cm3)
H1Fill Soil3.22551.8
H2Laterite183291.75
BedrockLimestone 6452.40
Table 6. The list of dynamic shear modulus ratio and damping ratio of each soil layer in the seismic response analysis model of Tianjin area.
Soil
Number
ParameterShear Strain (×10−4)
0.050.10.5151050100
T1G/Gmax0.99630.99260.96390.93030.72750.57170.21070.1178
λ0.02260.03130.05440.06850.11040.12930.16020.1665
T2G/Gmax0.99660.99330.96740.93680.74770.59710.22860.1291
λ0.04360.05340.08480.10280.15410.17670.21360.2214
T3G/Gmax0.99550.99110.95690.91740.68960.52630.18180.1000
λ0.02730.03510.06230.07900.12810.14950.18250.1890
T4G/Gmax0.99680.99360.96880.93940.75620.60790.23670.1342
λ0.04360.05340.08480.10280.15410.17670.21360.2214
T5G/Gmax0.99690.99370.96950.94070.76040.61350.24090.1370
λ0.02580.03230.05430.06740.10630.12430.15500.1616
T6G/Gmax0.99600.99200.96110.92510.71180.55260.19810.1099
λ0.01940.02530.04640.05970.10020.11870.14860.1547
T7G/Gmax0.99820.99650.98260.96580.84950.73830.36070.2201
λ0.02650.03320.05600.06990.11350.13600.18220.1944
T8G/Gmax0.99620.99240.96330.92930.72430.56780.20810.1161
λ0.01560.02650.04750.06060.10010.11820.14790.1540
T9G/Gmax0.99660.99320.96700.90610.72560.53440.22660.1278
λ0.02460.03140.05500.06740.11310.13340.16760.1748
BedrockG/Gmax0.99610.99230.96280.92820.68130.50850.20550.1145
λ0.01870.02470.04700.06130.10640.12760.16280.1750
Table 7. The list of the dynamic shear modulus ratio and damping ratio of each soil layer in the seismic response analysis model of the Haiyuan area.
Soil
Number
ParameterShear Strain (×10−4)
0.050.10.5151050100
H1G/Gmax0.98500.97500.85800.75400.41700.28500.09500.0360
λ0.00500.00900.02600.04000.09500.11700.14800.1590
H2G/Gmax0.99000.97000.90000.85000.70000.55000.32000.2000
λ0.00400.00600.01900.03000.07500.09500.11000.1200
BedrockG/Gmax1.00001.00001.00001.00001.00001.00001.00001.0000
λ0.00400.00800.01000.05100.02100.03000.03600.0460
Table 8. The list of the dynamic shear modulus ratio and damping ratio of each soil layer in the seismic response analysis model of the Liuzhou area.
Soil
Number
ParameterShear Strain (×10−4)
0.050.10.5151050100
L1G/Gmax0.96000.95000.80000.70000.30000.20000.15000.1000
λ0.02500.02800.03000.03500.08000.10000.11000.1200
L2G/Gmax0.99310.98620.93520.87900.60050.43360.13620.0735
λ0.01190.01630.03340.04490.08020.09520.11720.1213
BedrockG/Gmax1.00001.00001.00001.00001.00001.00001.00001.0000
λ0.05000.05000.05000.05000.05000.05000.05000.0500
Table 9. Three kinds of special soil shear wave velocity grouping list (m/s).
OneTwoThreeFourFiveSixSeven
Soft Soil110115120125130135140
Loess180210240270300330360
Laterite220240260280300320340
Table 10. List of values for dynamic shear modulus ratio and damping ratio of silty clay.
ParameterShear Strain (×10−4)
0.050.10.5151050100
Measured ValueG/Gmax0.99630.99260.96390.93030.72750.57170.21070.1178
λ0.02260.03130.05440.06850.11040.12930.16020.1665
Maximum ValueG/Gmax0.99720.99450.97290.94720.78210.64220.26420.1522
λ0.04460.05430.08550.10400.15520.17880.21980.2288
Average ValueG/Gmax0.99530.99060.95480.91390.68530.52530.18560.1028
λ0.03420.04260.07070.08730.13360.15310.18360.1900
Minimum ValueG/Gmax0.99190.98390.92430.85920.54970.37900.10880.0508
λ0.02050.02670.04890.06300.10680.12400.15120.1568
Table 11. List of values for dynamic shear modulus ratio and damping ratio of clay.
ParameterShear Strain (×10−4)
0.050.10.5151050100
Measured ValueG/Gmax0.99660.99330.96740.93680.74770.59710.22860.1291
λ0.04360.05340.08480.10280.15410.17670.21360.2214
Maximum ValueG/Gmax0.99780.99560.97870.95830.82290.70100.32510.1955
λ0.06580.07420.09960.11360.16720.18680.22450.2330
Average ValueG/Gmax0.99590.99190.96110.92570.72180.57040.21920.1227
λ0.03680.04530.07340.09010.13580.15620.18790.1957
Minimum ValueG/Gmax0.98780.97580.88970.80130.44550.28740.07470.0388
λ0.01510.02010.03850.05060.09040.11080.14900.1572
Table 12. List of values for dynamic shear modulus ratio and damping ratio of loess.
ParameterShear Strain (×10−4)
0.050.10.5151050100
Measured ValueG/Gmax0.98500.97500.85800.75400.41700.28500.09500.0360
λ0.00500.00900.02600.04000.09500.11700.14800.1590
Maximum ValueG/Gmax0.99860.99670.98040.96110.83600.71790.33720.2030
λ0.02530.02830.07070.09910.17800.20690.23770.2422
Average ValueG/Gmax0.98860.98060.91700.85930.61230.47640.19190.1099
λ0.00810.01320.04250.06670.13510.15750.18400.1892
Minimum ValueG/Gmax0.96430.93160.77070.65000.30690.20030.06160.0355
λ0.00410.00810.02530.03500.08090.10220.11080.1201
Table 13. List of values for dynamic shear modulus ratio and damping ratio of laterite.
ParameterShear Strain (×10−4)
0.050.10.5151050100
Measured ValueG/Gmax0.99310.98620.93520.87900.60050.43360.13620.0735
λ0.01190.01630.03340.04490.08020.09520.11720.1213
Maximum ValueG/Gmax0.99900.99800.98900.97700.89600.81200.46300.3010
λ0.02520.03490.07180.09360.15960.18550.23500.2540
Average ValueG/Gmax0.99340.98650.93720.88440.63540.48780.18630.1083
λ0.01170.01500.02970.04110.08270.10460.14530.1555
Minimum ValueG/Gmax0.98000.96000.82500.71000.32000.20000.04930.0250
λ0.00020.00050.00280.00580.02670.04570.07400.0754
Table 14. List of recommended values of dynamic parameters for special soils in typical areas.
ParameterShear Strain (×10−4)
0.050.10.5151050100
Silty ClayG/Gmax0.99530.99060.95480.91390.68530.52530.18560.1028
λ0.03420.04260.07070.08730.13360.15310.18360.1900
ClayG/Gmax0.99590.99190.96110.92570.72180.57040.21920.1227
λ0.03680.04530.07340.09010.13580.15620.18790.1957
LoessG/Gmax0.98860.98060.91700.85930.61230.47640.19190.1099
λ0.00810.01320.04250.06670.13510.15750.18400.1892
LateriteG/Gmax0.99340.98650.93720.88440.63540.48780.18630.1083
λ0.01170.01500.02970.04110.08270.10460.14530.1555
Disclaimer/Publisher’s Note: The statements, opinions and data contained in all publications are solely those of the individual author(s) and contributor(s) and not of MDPI and/or the editor(s). MDPI and/or the editor(s) disclaim responsibility for any injury to people or property resulting from any ideas, methods, instructions or products referred to in the content.

