Abstract
The design of the front face of a truck can directly affect the user’s sensory evaluation of the vehicle. Therefore, based on Kansei Engineering theory and deep learning technology, this paper proposes an intelligent design method for the rapid generation of truck front face modeling solutions driven by user images. First, through Kansei Engineering’s relevant experimental methods and scientific data analysis process, the emotional image of the truck’s front face is deeply excavated and positioned, and the corresponding relationship between the characteristics of the truck’s front face and the user’s emotional image cognition is explored. Then, we used the generative confrontation network to integrate the user’s emotional image of the front face of the truck into the intelligent and rapid generation process of the new design scheme of the front face of the truck. Finally, the physiological data of the Electroencephalogram (EEG) experiment are used to evaluate the degree of objective matching between the generated modeling design scheme and the expected image. The purpose of this research is to improve the efficiency, reliability, and intelligence level of truck front face design, and to achieve a more personalized, precise, and high-quality design. This helps to improve the conformity of the modeling design scheme under specific image semantics.
1. Introduction
Kansei Engineering (KE) is a comprehensive discipline that involves knowledge from multiple disciplines such as sociology, psychology, and ergonomics. It aims to use quantitative and qualitative analysis methods to study users’ experiences and emotional reactions to products, providing a scientific basis for designing products and services that better meet users’ needs and expectations. The core concept of Kansei Engineering is to consider user emotions and perceptions as key factors in product design and development. Emotional design plays an important role in Kansei Engineering. Emotional design emphasizes the impact of sensory characteristics such as the appearance, touch, and sound of products on users’ emotional experiences. By incorporating emotional elements into product design, it can stimulate users’ emotional resonance and enhance the attractiveness and emotional value of the product. Kansei Engineering is both a theory and a method. As a theory, it involves research on human feelings, emotions, and behaviors, with the aim of helping designers better understand users’ needs and preferences for products or services and integrating these factors into product design. As a method, it provides a series of tools and techniques for analyzing and evaluating the performance of products in terms of user perception, in order to provide a reference for designing and improving products or services.
Emotional imagery refers to a specific image or feeling in line with inner expectations produced by the fusion of the Kansei attributes of a certain object and one’s own psychological cognitive state [1]. It is a deep-level consciousness activity of people’s emotional cognition [2]. In product modeling design, imagery refers to the emotional associations related to cognition conveyed through modeling elements. Specifically, the shape design of a product can convey a certain image through the combination and expression of various elements [3], such as fashion, dynamics, simplicity, comfort, etc.
The modeling features of a product can directly and effectively convey the emotional image contained in the product [4]. Mining the emotional imagery contained in product modeling can help companies understand consumers’ feelings and cognition of products to better design and position products. At present, the methods for researching product modeling image positioning mainly include questionnaire surveys, in-depth interviews, focus groups, cognition scales, etc. [5,6]. In addition, some emerging technologies such as virtual reality, eye tracking, and EEG technology have also begun to be applied to the research process of product modeling image positioning [7,8]. Most of the existing research on image mining and positioning of target products is based on the relevant theories of Kansei Engineering, which is a commonly used method for analyzing and measuring user emotional needs in early research [9]. This method can help designers understand what users really need and reduce design deviations. However, it should be noted that the process of this method is a more subjective evaluation, and the accuracy of the analysis results depends on the representativeness of the selected survey population and the scale of the survey, so it needs to be further verified and confirmed in combination with other research methods [10]. With the continuous development of network technology needed increase the scale of survey data and improve the overall interpretability of sample groups, some scholars have begun to use online comments to mine product images [11]. This method can easily obtain a large amount of user feedback at a low cost, making the acquisition of emotional imagery more timely, efficient, and comprehensive [12].
After completing the positioning of the modeling image, the designer needs to further establish a mapping relationship between the modeling features and the emotional image to clarify what design elements cause the emotional image and improve design efficiency [13]. Xue, Yi, and Zhang [14] and Wu and Chen [15], on the basis of the above research methods, used the method of quantitative Ⅰ class to assign characteristics to design elements and established a mathematical model of design elements and emotional imagery, which provided relatively objective data support for modeling design. Cong, Chen, and Zheng [16] and Zhang, Su, and Liu [17] used entropy theory to weight the emotional imagery space of users, designers, and engineers, and constructed a composite imagery space evaluation model to establish the correspondence between emotional imagery and product modeling and to guide the modeling design of new products. Xue [18] and Hu [19] coupled the imagery and shape of the product to optimize the design and established an optimization model by genetic algorithm to obtain a refined form that meets the emotional imagery of consumers, which can generate a product form that better meets consumer expectations. Dong et al. [20] and Wang, Li, and Wang [21] used the principle of extension design to model the quantitative relationship between product image and modeling features and realized the idea of quickly matching the optimal modeling design scheme according to user image needs.
The above studies all start from the one-way mapping relationship between imagery and product modeling, but in fact, the mapping relationship between imagery and product modeling is complex, multi-directional, and non-linear [22]. Yang et al. [23] and Wu and Jia [24] have studied the matching of the correspondence between multi-directional emotional imagery and stylistic features and established a non-linear model of the relationship between multi-directional imagery and stylistic design. Ding et al. [25] and Zeng et al. [26] used multiple regression analysis to establish a product modeling design prediction model reflecting imagery. Luo, Zhao, and Chen [27] and Chen and Cheng [28] used the BP neural network model to explore the relationship between design features and emotional responses, which improved the accuracy of predicting emotional imagery for products. Barmpalexis et al. [29] used multiple regression analysis and artificial neural networks to build prediction models, respectively. The results showed that both had the ability to predict the matching relationship between modeling and imagery, but the artificial neural networks had better prediction results. Ng [30] and Wang and Liu [31] added an ant colony algorithm and particle swarm algorithm to the artificial neural network model, which optimized the accuracy and scalability of the mapping relationship between image and shape, improved the image conformity of the generated scheme, and reduced the information loss in the design process. Compared with the single-dimensional mapping relationship mentioned above, the multi-dimensional model is more consistent with the actual situation of modeling and imagery correspondence, and the interpretation rate of the mapping relationship is also higher [32,33]. Nowadays, the use of artificial neural networks to construct non-linear mapping models has become a common method for studying the relationship between modeling and imagery.
With the development of physiological measurement technology, Zhou et al. [34] began to obtain the implicit data of the subjects with the help of physiological measurement equipment, such as eye movement and EEG, and determined the emotional image cognition of the subjects through an objective analysis of the data. Lin, Guo, and Xu [35] and Kuo et al. [36] used eye-movement data to study the degree of subjects’ attention to product features and combined with questionnaire data to jointly evaluate product modeling, a combined subject–objective evaluation system with higher credibility and less cognitive error. Guo et al. [37] and Deng and Wang [38] obtained subjects’ perceptions of product imagery by recording and analyzing brain activity and used waveform changes in time-related potentials to derive subjects’ preferences for multiple modeling designs, which is conducive to an objective judgment of the correspondence between product modeling and imagery.
In the traditional design process, in order to design an imagery modeling scheme to meet the emotional needs of users, designers usually need to repeatedly modify the hand-drawn and modeling effects, which consumes a lot of time and labor costs [39]. To optimize this process, a number of product design tools and methods based on deep learning and computer vision techniques have emerged in recent years, which are designed to help designers more quickly and accurately translate users’ emotional needs into design solutions [40]. These methods can automatically generate new and unique design concepts and elements by learning and training a large amount of data, helping designers discover more ideas [41]. At present, the research on introducing deep learning techniques in modeling design mainly includes several aspects such as style migration, image generation, image recognition, and 3D modeling [42].
In terms of image style transfer, Wang [43] used the style transfer algorithm to apply Shanghai-style watercolor paintings to the design of cultural and creative products, providing reference and technical guidance for the design and development of cultural and creative products. Duan, Zhang, and Gu [44] took the personalized design of art painting-derived images as the starting point of their research, used intelligent technology for sentiment analysis, and established a correspondence between image style and emotional imagery, providing new ideas for the design of art derivatives with personalized needs. However, the research objects mentioned above are all static images. For the style transfer of dynamic products, such as video and animation, Ruder, M, etc., Ruder, Dosovitskiy, and Brox [45], Akber et al. [46], and Quan, Li, and Hu [47] introduced algorithms, improved losses, and optimized parameters and other methods that are used to solve the problem, and finally, the stylized transfer of video materials is realized, which provides a new carrier for artistic creation. To sum up, the application of style transfer technology can bring more possibilities for the innovative development of digital art, film production, product design, and other fields [48].
In terms of image generation, Yan et al. [49] used StyleGAN2 to learn the style of Peking Opera facial makeup to generate new facial makeup images. The research conclusions can promote the protection and development of facial makeup. Wu and Zhang [50] used deep convolutional neural networks to learn to generate some classic oil paper umbrella patterns, which can inspire more design inspiration for designers. Burnap et al. [51] proposed a variational self-encoder after deconstructive analysis of the modeling elements and used it for the automatic generation of two-dimensional images of cars.
The above studies all use product images as training data; the generated images cannot be effectively combined with semantic features, and the designer’s ability to control the product shape needs to be improved. For this situation, Ramzan, Iqbal, and Kalsum [52] used the BERT model and the text-image affine combination module (ACM) to improve the model architecture of the generative confrontation network, realized the effect of controlling image generation with text, and improved the consistency of image and semantics. For the case that some semantics are difficult to reuse, Liu, Xu, and Chen [53] used a saliency edge detection algorithm to obtain local features and then sketch mapping from local to global to generate realistic images. This learning model requires learning a large number of correspondences between sketches and realistic images. Dai, Li, and Liu [54] used smart watch images for the training of generative adversarial networks, which can convert sketches into high-quality color design proposals. Some scholars also calculate the shape coefficients of the product after mapping to obtain a three-dimensional wireframe model; the method provides a new design idea for a three-dimensional design to obtain a more comprehensive design model [55].
In summary, deep learning techniques have made a lot of research progress in the generation of new solutions for product modeling [56]. Deep learning has many advantages in image generation, it can quickly and efficiently generate high-quality images, and can be personalized according to different needs [57]. Applying a generative adversarial network (GAN) to the rapid generation process of new solutions for product modeling can generate a large number of feasible design solutions in a relatively short period of time [58], which greatly reduces the cycle time and cost of product design. However, in the current research, there are still relatively few related research methods that bring emotional imagery into the neural network modeling scheme generation process.
In this paper, taking the front face of a truck as an example and using theories and research methods in related fields such as Kansei Engineering, computer graphics, and deep learning, this paper summarizes a method for quickly generating an image of a truck’s front face based on a generative adversarial network. Firstly, the user’s emotional imagery is deeply excavated and located, and the mapping relationship between emotional imagery and modeling design is established; then, the study focuses on how to quickly generate a new truck front face modeling scheme that meets the user’s imagery expectations; finally, the objective matching degree between the generated modeling design scheme and the desired imagery is analyzed using the physiological data of the EEG experiment.
The contribution of this paper can be described as three innovations: (1) A self-made truck front face modeling dataset based on image pattern and imagery classification, and unsupervised learning using generative adversarial networks to obtain a truck front face generation model with the best generation effect under different imagery semantics, completing the exploration of rapid generation of imagery-driven intelligent design solutions for truck front face modeling. (2) The EEG experiments were used to obtain the EEG waveform maps of the subjects. Then, extract the ERP components related to cognition and evaluate the degree and accuracy of the generated solutions in line with the emotional imagery words to verify the feasibility and reliability of the user imagery-driven intelligent design method for truck front-end modeling. (3) The dataset is divided into three types of image modes: color map, grayscale map, and line drawing, and the comparison of the generation effects under the three modes is conducted by EEG experiments to analyze the different situations of the design solutions of different image modes for aiding designers to carry out secondary design in terms of the degree of stimulation. The applicability of the generative adversarial network to these three different image pattern datasets is also verified in this paper.
2. Methods
2.1. Research Framework
The front image of a truck is one of the most prominent parts of truck design, which needs to be fully considered in terms of functionality and aesthetics. The design of the front face of a truck involves various types and sizes of vehicles, with complex appearances and structural features. This makes the image of the front face of the truck a rich and diverse research object that can explore different types of design elements and styles. This study is based on local truck manufacturing enterprises and actively seeks cooperation with them so that we can have faster access to first-hand information about the enterprises. In theory, the application of image generation technology can promote the continuous development of the truck design industry toward digitization and intelligence and provide more possibilities and innovative space for truck front face design.
In order to obtain the consumers’ perceptions of truck front face modeling imagery, this paper adopts the inverse inferential Kansei Engineering procedure and uses the Kansei imagery measurement method, which combines the qualitative and quantitative measurements that used to mine and locate the Kansei imagery of truck front face modeling and construct the emotional imagery space of truck front face modeling design. Then quantify the mapping relationship between truck front face modeling and emotional imagery words, establish the truck front face modeling emotional imagery evaluation system, and provide data support for the generation of new truck front face modeling solutions based on emotional imagery. The main research methods and techniques used in this process include the focus group method, Delphi method, KJ method (Affinity Diagram), multi-dimensional scale analysis, system clustering analysis, K-means cluster analysis, factor analysis, principal component analysis, and semantic difference method. The specific content includes the collection and clustering of truck front face modeling samples; the establishment of an emotional image semantic lexicon and selection of representative words; and quantitative analysis of an emotional image of representative samples. The application and explanation of the specific method described in the text are as follows:
- (1)
- Focus group method: This article used the focus group method at multiple stages of the research process. Firstly, this method was used for the preliminary screening of truck front face sample images. Secondly, this method was used for preliminary clustering of sample appearance similarity. Finally, this method was used in the screening of representative image vocabulary. The purpose of using the focus group method is to remove image vocabulary that is not suitable for evaluating the image of the front face of a truck and reduce the testing burden for participants in perceptual–cognitive measurement experiments. Large amounts of data are not conducive to research or participants answering questions, and they will affect the accuracy and reliability of measurement results. So, it is necessary to use focus groups to reduce the data and select representative data for emotional imagery research.
- (2)
- Delphi method: This study used a combination of the Delphi method and the focus group method in screening image vocabulary. This can comprehensively utilize the advantages of individual expert thinking and group collaboration to obtain more comprehensive and diverse information. At the same time, it can also supplement the shortcomings of the focus group method and ensure the independence of individual decision-making.
- (3)
- KJ method (Affinity Diagram): This method used the KJ method to cluster truck front face samples and image vocabulary. The main purpose of using the KJ method is to classify and organize similar samples and image vocabulary in order to discover the connections and commonalities between these samples and image vocabulary or better understand data features and find appropriate clustering partitions. At the same time, using focus groups for KJ clustering also enhances the reliability of clustering and avoids personal subjective emotional interference with clustering results.
- (4)
- Multi-dimensional scale analysis: This method uses multi-dimensional scale analysis to calculate similarity data between samples in order to evaluate their correlation and convert high-dimensional data into sample coordinates in low-dimensional space, reducing data dimensionality, thereby simplifying the model and improving computational efficiency.
- (5)
- System clustering analysis: This method used a systematic clustering method to determine representative samples and representative image vocabulary. The purpose is to view the clustering status of sample data through a tree graph and the clustering evolution process of the data through a lineage graph.
- (6)
- K-means cluster analysis: This method uses K-means clustering analysis to obtain the categories to which each representative sample belongs and the distance from the center of the category to which it belongs. The purpose is to find representative samples in each cluster category.
- (7)
- Factor analysis: This method uses factor analysis to obtain a gravel map. Then, by observing the curve changes of the gravel map, it identifies the turning point where the difference in feature values within the group suddenly increases significantly in order to determine the appropriate number of clustering groups.
- (8)
- Principal component analysis: This method uses principal component analysis to identify representative image vocabulary pairs, which are the words with the highest component score within the group.
- (9)
- Semantic difference method: This method uses the semantic difference method to determine the mapping relationship between representative image vocabulary and representative samples. Among them, the positive values in the questionnaire tend to favor the vocabulary on the right side of the number axis, while the negative values tend to favor the vocabulary on the left side of the number axis. The higher the absolute value, the higher the degree of inclination.
This article also explores an intelligent design method for truck front face shape driven by user emotional semantic vocabulary. This method is based on the Kansei Engineering theory and deep learning technology implementation. The specific experimental process includes building a truck front face dataset based on image pattern and imagery classification; comparing the generation effect of the deep convolutional generative adversarial network (DCGAN) and style-based generative adversarial network (StyleGAN2) through pre-experiments; designing a generative adversarial network model that meets the task requirements for the shortcomings in the experiments; debugging the network parameters and visualizing the training generative model; and outputting images and verifying the generation efficiency.
Finally, by letting the subjects watch the picture of the front face of the truck played on the computer and the corresponding image semantic words behind it, the EEG waveforms of the subjects when they saw the image semantic words were obtained, and the ERP signals related to cognition were extracted [59], which were used to summarize the objective matching degree of the truck front face shape picture generated by the generative confrontation network and the corresponding image semantic words behind it in the minds of the subjects. The flowchart of the proposed method is shown in Figure 1.

Figure 1.
Technical method flowchart.
2.2. Experimental Methods and Evaluation Process
2.2.1. Kansei Imagery Measurement Stage
Firstly, collect truck front face sample images and imagery vocabulary through various channels such as online networks, offline magazines, and books. In order to increase the differences between collected data, it is necessary to use the focus group method to conduct preliminary cleaning and screening of the collected sample data. Then, it is necessary to standardize the sample images. The purpose of doing so is to remove other factors that may affect sensory measurement and ensure non-specific differences in the sample. Afterward, for the sample screening process, it is necessary to form a focus group again and use the KJ method to preliminarily cluster the sample images in order to reduce the total number of samples by selecting representative samples through clustering. Afterward, use multi-dimensional scale analysis to calculate the similarity between samples. Finally, use system clustering and K-means clustering to determine the clustering situation of the samples and identify representative samples in each category. For the screening of image vocabulary, a research method combining the focus group method and the Delphi method is first used for image vocabulary screening. Then, form a focus group again and use the KJ method to perform preliminary clustering, screening, and pairing of image vocabulary. Finally, the data from the questionnaire survey were used for lexical similarity clustering analysis, factor analysis, and principal component analysis to screen out representative emotional image words for each category. It is worth noting that these three analysis methods complement each other: the cluster analysis displays category information, the factor analysis results provide a basis for dividing into several categories, and the principal component analysis can be used to select the vocabulary with the most prominent rating. Finally, using the semantic difference method to survey data, a mapping relationship can be established between representative image vocabulary and representative samples.
2.2.2. Design Implementation Stage
Designing a neural network training model suitable for the research objectives is the foundation for achieving intelligent design of truck front faces. This method takes the emotional image of the truck front face shape as the control variable and uses a generative adversarial network to generate a targeted truck front face shape scheme. This experiment utilized dataset classification to incorporate perceptual images into the image generation process and created 15 generation models. Each model contains two attributes: image mode and perceptual imagery. When it is necessary to generate a new design scheme for the front face of a truck that conforms to a certain emotional image, simply call the corresponding generation model to quickly generate a specified number and form of new scheme images. The specific experimental process of this scheme includes (1) establishing a truck front face dataset based on image patterns and image classification; (2) comparing the generation effect of DCGAN and StyleGAN2 through pre-experiments; (3) designing a generative adversarial network model that meets the task requirements to address the shortcomings of the original StyleGAN2 in the pre-experiment; (4) debugging and generating parameters and the network structure of adversarial networks, visualizing the training process, and training them into models; and (5) using the generated model to output images and verify the generation effect.
2.2.3. Design Evaluation Stage
This study obtained the EEG waveform of participants when they saw image vocabulary through EEG experiments. Afterward, the ERP signals related to cognition were analyzed and extracted to summarize the objective matching degree between the newly generated truck front face styling scheme and its corresponding image vocabulary in the minds of the participants. Verify whether the matching degree between the new scheme image generated by the network and its corresponding image vocabulary is the highest among the 5 image semantic words. Simultaneously measure which image mode, grayscale image, line draft image, and color image has the best cognitive effect under the same image vocabulary. The ERP component studied in this experiment is mainly P300, which is a positive wave generated around 300 ms after the appearance of visual stimuli. The formal experiment adopts three image processing modes: “grayscale image”, “line draft image”, and “color image” × 5 (each image processing mode has five network-generated images corresponding to five image semantic words) × A mixed experimental design method of five (five image semantic words: “domineering”, “dynamic”, “innovative”, “minimalist”, and “rounded”), which will be conducted for a total of seventy-five trials. Among them, the standard process for a trial is as follows. First, a fixation point “+” will appear in the center of the screen, with a duration of 1000 ms; next, a pre-trained network-generated truck front face new scheme will appear as the “starting material”, with a duration of 3000 ms; after that, a blank screen of 1000 ms will appear; then, present an image semantic word as the “target material” for a duration of 1000 ms; and finally, a blank screen of 1000 ms will be presented. Finally, the EEG signals stimulated by the same stimulus were superimposed and averaged among all participants to obtain the total average waveform. Then, observe the peak response of the total average waveform under different stimuli at around 300 ms and select the area of 270–330 ms as the observation interval in this experiment.
2.3. Summary of Methods
Image-driven intelligent modeling is an innovative design method that uses information technology and artificial intelligence algorithms to translate a user’s desired imagery, concepts, or needs into concrete product modeling solutions. This method combines human emotional imagery cognition with computer intelligence algorithms to deeply analyze the emotional imagery space of product modeling features, and by simulating and analyzing a large amount of data, it can automatically and quickly generate modeling design solutions to meet user needs. For this method, the front face shape of the truck is just a carrier, and any product that meets the sample size requirements can be used as the research carrier for this method. By exploring the intelligent design of truck front face styling, readers can apply similar design principles and technologies to other fields. This design method can improve the efficiency and innovation of product styling design and aims to provide designers with more efficient and scientific design ideas and methods.
3. Methods
3.1. Construction of Emotional Imagery Sample Set
3.1.1. Collection of Truck Front Face Sample Images
- (1)
- Determine the collection method.
In this study, manual browsing and manual storage are used to collect truck front face sample pictures. When collecting, manually select the overall front view of the truck front face with clear images, complete outlines, no background interference, or less background interference than the dataset image.
- (2)
- Determination of sample collection targets and data sources.
Considering the differences in the shape of truck fronts in different countries and the timeliness of model innovation, this study sets the truck front face samples to be collected as the cab front views of heavy lorries released in the Chinese market between 2015 and 2021. Through comprehensive websites such as “Truck Home” and “China Truck Network”, official websites of various brand car companies, magazines, and books, the front view of the truck front was widely collected, and 712 front views of the truck front were finally collected.
3.1.2. Preliminary Screening of Truck Front Face Sample Images
In this study, the sample images with cumbersome backgrounds of the subject, too low image clarity, too large, obscured areas of the subject, and deviations in the frontal view angle were eliminated from the above-collected images, leaving 635 sample images with clear images, complete subjects, and easy separation from the background. Afterward, 11 graduate students majoring in design who have received professional design training and experience in automotive exterior design were invited to form a focus group to conduct a secondary screening of the sample data based on the appearance similarity of the cab front samples of lorries of the same brand and to screen out samples with greater appearance similarity picture. Finally, through focus group discussion, one of the best images in each group of similar images is selected and retained, and the rest are eliminated. Through the above screening operation, the number of samples was further screened to 597, and the preliminary screening results of the samples are shown in Figure 2.
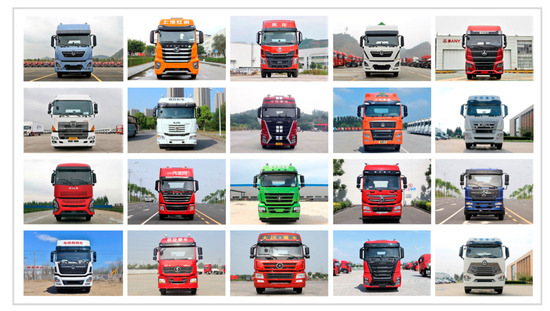
Figure 2.
Truck sample after preliminary screening (partial).
3.1.3. Standardization of Sample Images
In order to remove the influence of other factors on the perceptual measurement and ensure the non-specific differences of the samples, it is necessary to standardize the 597 frontal views of the cab fronts of the lorries initially screened above. The specific operation steps of standardization processing are as follows:
- (1)
- Adjust the aspect ratio of each sample image to square.
This study uses a Python program to traverse the sample images in the folder, starting from the first image to obtain the original size of the image, and then using the size of the long side of the image as the basis, extending the short side to both sides at the same time so that the short side size is equal to the long side size, and the new area extended on both sides of the short side is filled with a white background. A comparison of the results before and after the sample image aspect ratio adjustment is shown in Figure 3.

Figure 3.
Example of effect comparison before and after aspect ratio adjustment.
- (2)
- Adjust the main content of the sample to be in the middle of the picture and have the same proportion.
In this study, manual cropping is used to make the truck sample subject image located in the center of the whole image, and the ratio of the area of the truck subject to the area of the whole sample image in each sample image is kept consistent or similar.
- (3)
- Remove the background of the sample image of the front face of the truck.
In this study, we tested various methods of batch background removal, and finally chose to use the “API key” of the “removebg” website to realize the batch removal of the background of the truck front face sample image. This method can save a lot of time and human labor, and its removal effect is even better than the non-professional manual removal effect. The effect comparison before and after background removal is shown in Figure 4.
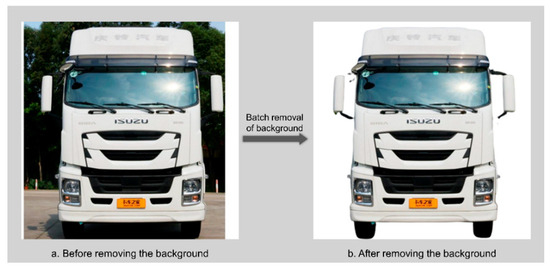
Figure 4.
Comparison of effects before and after batch removal of background.
- (4)
- Remove the confounding factors on the front-facing subject of the truck that affect the Kansei cognitive measures.
In the removal of interfering factors, all truck front face samples need to be covered or removed without a trace where the brand information can be displayed, such as the license plate, car logo, and text. All truck front face samples need to be decolorized. All truck front face samples need to remove the wheels, chassis, rearview mirrors, and accessories on the roof that do not belong to the factory. All sample pictures should keep the brightness and contrast of the image consistent in actual display. The windshield has large reflections that are not easy to remove, so a uniform glass template is specially made to replace the windshield area of each sample picture. The effect comparison before and after removing the interference factors is shown in Figure 5.
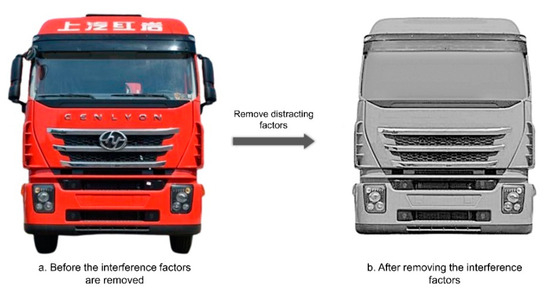
Figure 5.
Comparison of the effect before and after the removal of disturbing factors.
3.1.4. Establishment of Representative Samples of Truck Front Face
- (1)
- Preliminary clustering based on sample appearance similarity using focus groups.
The 597 images of the truck front faces mentioned in the previous section are too large a volume of data for an affective imagery test. To reduce the burden on subjects, a small number of representative samples are identified according to certain rules before conducting the Kansei cognitive measurement experiment. First, a focus group of 7 industrial design graduate students was invited to classify 597 truck front samples using the KJ method based on the appearance similarity among the samples, and the results classified the truck front samples into 27 categories. After that, each focus group member was asked to select 1–2 sample images in each category of sample clusters that best represent that category, and the sample with the highest frequency of selection in each category was counted as the representative sample of that category. The representative samples obtained from the initial clustering are shown in Figure 6.
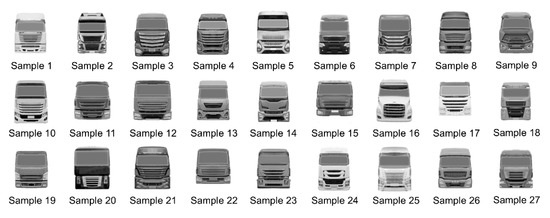
Figure 6.
Representative sample plot of preliminary clustering.
- (2)
- Style similarity measurement among representative samples.
Since the number of representative samples is still too large for a two-by-two comparison, a subjective classification method was used to measure the similarity of emotional imagery styles among the 27 representative samples. The specific measurement steps are as follows:
- First, 5 graduate students majoring in design are invited to pre-classify 27 representative samples, and the classifiers are required to classify the representative samples according to the similarity of emotional image style between the samples, without specifying the classification criteria or the number of classifications in advance. The results show that when the number of categories is 12–15, categories with obvious differences can be obtained.
- Invite 22 testers for formal classification. The 22 testers include 12 graduate students majoring in design, 4 graduate students majoring in mechanics, and 6 graduate students majoring in vehicles. Let each subject divide the 27 samples with similar emotional image styles into a group according to their subjective feelings, and the number of classifications is 12–15 categories. After the experiment, a total of 22 pieces of emotional image style similarity classification data were obtained.
- For the convenience of statistical analysis, the 22 emotional imagery style similarity classification data were summarized and made into a sample style similarity matrix. In the process of making, start from the sample with the smallest number in each category, compare the samples with higher numbers one by one, and mark them on the pre-prepared form. The labeling method is cumulative scoring until all samples from all classes are recorded. Then, count the number of times every two representative samples is classified into the same group and fill it into the similarity matrix. The representative sample imagery style similarity matrix (partial) is shown in Table 1.
 Table 1. Similarity matrix of representative sample image style (partial).
- (3)
- Use IBM SPSS Statistics 25 software (https://www.ibm.com/support/pages/downloading-ibm-spss-statistics-25, accessed on 21 October 2020) to analyze the data of the sample image style similarity matrix.
- Analyze the data of the sample image style similarity matrix on a multi-dimensional scale and evaluate the analysis results through the pressure index “SK” and the coefficient of determination “RSQ”. The analysis results show that the value of “Stress” in the 6-dimensional space is 0.02423 and the value of “RSQ” is 0.99558, indicating that the multi-dimensional scale analysis in the 6-dimensional space is a very good fit and the spatial coordinate data can be fully utilized. The partial coordinates of the representative samples in the six-dimensional space are shown in Table 2.
Table 2. Coordinates of the representative samples in the six-dimensional space (partial).
- 2
- To further group the samples with high similarity in emotional imagery styles into one class and those with low similarity into different classes, this study continued to analyze the 6-dimensional coordinates of the representative samples using systematic analysis. The partial clustering coefficient table of the representative samples (Table 3) and the cluster analysis spectrum chart of the representative samples (Figure 7) were obtained through systematic clustering.
Table 3. Clustering coefficients of the representative samples (partial).
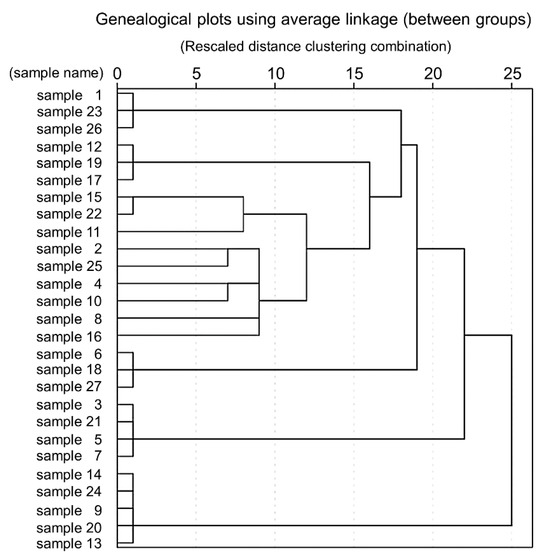 Figure 7. Pedigree diagram of the representative sample cluster analysis.
- 3
- According to Table 3 and Figure 7, the clustering process of the 27 representative samples can be clearly seen. To better understand the classification of the 27 representative samples, the clustering coefficients in Table 4 were imported into Excel for curve fitting to find the turning point of the change in the clustering coefficients, as shown in Figure 8.
Table 4. Clustering distance table of the original representative samples.
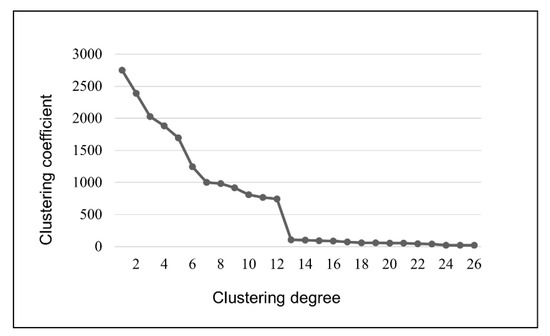 Figure 8. The change curve of the clustering coefficient.
It can be seen in Figure 8 that when the 27 representative samples are divided into 13 classes, the clustering coefficient is still relatively small, indicating that the differences between the different clusters are small. However, when the 27 representative samples were divided into 12 categories, the clustering coefficient increased suddenly and sharply, indicating that the gap between the samples in the same group was large after merging the clusters. Therefore, this experiment chooses to divide 27 representative samples into 13 categories.
- 4
- To find new representative samples in each of the 13 categories just classified, this study performed K-means clustering on the six-dimensional coordinate data to obtain the categories to which each representative sample belongs and the distance between the centers of the categories to which it belongs, as shown in Table 4.
The samples in the same class that are closest to the center of clustering are more representative. According to the results in Table 4, we can obtain 13 new representative samples: sample 2, sample 4, sample 6, sample 8, sample 10, sample 11, sample 15, sample 16, sample 19, sample 21, sample 23, sample 24, and sample 25.
3.2. Construction of the Semantic Space of Emotional Imagery
3.2.1. Collection of Imagery Vocabulary
We collected a wide range of imagery words that could be used to describe the exterior design of lorries from the relevant research literature, professional website reviews, and manufacturer promotional materials. We invited seven designers with modeling experience to form a focus group to add new imagery words that could be used to describe the exterior of lorries. In order to avoid personal subjective preferences affecting the collection of image words, these words should be recorded based on objective principles during collection, without considering restrictive factors, such as whether the meanings of the words are similar. Finally, 261 emotional words were collected that could be used to describe the exterior design of lorries.
3.2.2. Preliminary Screening of Emotional Imagery Vocabulary
(1) Invite seven focus group members to meet offline, and combined with the Delphi method, the imagery vocabulary assembled in the previous section was initially screened to remove the emotional imagery vocabulary that was not suitable for evaluating the imagery of the front face of the truck and the less relevant emotional imagery vocabulary. The group members focused on the emotional imagery words that were selected more than 4 times, confirming that there were 63 imagery words that needed to be removed. (2) The focus group used the KJ method to cluster the screened imagery words according to their semantic similarity and clustered the semantically similar imagery words into one category. In order to reduce cognitive differences between people and enhance the accuracy of semantic classification, this study uses an open-source word forest program based on the extended version of the synonym word forest as an auxiliary tool for synonym clustering. We arrange the words in descending order according to the size of semantic similarity values and select vocabulary with similarity values above 80% as semantic references. The clustering results grouped the 198 imagery words into 70 categories. (3) The members of the focus group independently read 70 categories of emotional image vocabulary about the design of the front face of trucks, selected a vocabulary that they thought was the most representative in each category, and then found out each category by summarizing the frequency of selection. Words that are selected more than 4 times will be the representative image vocabulary, and the categories that have been selected less than 4 times will be communicated in the group. After reaching an agreement, the representative image vocabulary of this category will be selected. Finally, a total of 70 representative image words will be selected. The representative emotional image words after screening is shown in Table 5.
Table 5.
Summary of representative imagery words after preliminary screening.
In order to understand the semantics of emotional imagery words more intuitively, the selected representative emotional imagery words were paired with antonyms to form emotional imagery adjective pairs. Adjective pairs are composed of two sets of image words, positive and negative. In order to ensure the effective conduct of subsequent experiments, it is necessary to avoid negative image words as much as possible. The 70 imagery words were synthesized into 45 pairs of emotional imagery adjective pairs, and the imagery word pairs are shown in Table 6.
Table 6.
Summary of emotional imagery adjective pairs.
3.2.3. Establish Imagery Semantic Space
This research needs to take into account the factors of human cognitive differences. In order to understand the emotional image of the front face of the truck more comprehensively, it is necessary to expand the scope of the research and allow subjects with different knowledge backgrounds to participate. However, the semantic space of the above emotional image adjective pairs is relatively wide and complex, and the subjects will feel a greater test burden. Therefore, it is necessary to further extract the image vocabulary with a high degree of conformity with the truck front face image through a questionnaire survey.
First, create an online survey questionnaire. The focus group members were asked to conduct a pre-experiment, and it was found that the number of vocabulary pairs selected for the pre-experiment ranged from 15 to 20 groups. Afterward, 16 design students, 3 product designers with modeling experience, 2 car drivers, and 40 car enthusiasts were invited; a total of 61 people were invited to conduct formal tests. The age range of the testers is between 24 and 57 years old. The investigators were asked to select 15–20 pairs of imagery words that they thought were most suitable for describing the front face of the truck. Finally, 50 valid questionnaires were recovered in the experiment, including 29 males and 21 females. The results of the questionnaires are shown in Figure 9. In the final screening, 12 pairs of vocabulary pairs with a voting rate of more than 67% were selected as representative emotional image vocabulary pairs. The screening results are shown in Table 7.
Figure 9.
The selected frequency of imagery word pairs.
Table 7.
Summary of the screening results of emotional image word pairs.
In order to balance the cognitive bias between perceptual vocabulary pairs, this experiment uses a five-point Likert scale to measure the perceptual similarity between the above twelve pairs of imagery vocabulary. A total of 88 postgraduates of different majors were invited to conduct questionnaire surveys, and 75 valid questionnaires were recovered, including 41 males and 34 females. The experiment requires 12 image vocabulary pairs to be compared and scored in pairs. Finally, the comprehensive average score of the image vocabulary pair is counted, and it is filled into the image vocabulary pair feeling similarity matrix. Part of the similarity matrix data are shown in Table 8.
Table 8.
Perceptual similarity matrix between image word pairs (partial).
This study used SPSS software to conduct factor analysis method and principal component analysis on the similarity matrix of feeling of imagery word pairs to obtain the similarity clustering of emotional imagery word pairs and the percentage of their influencing factors. The results of the factor analysis are shown in Figure 10, and the results of the principal component analysis are shown in Table 9.
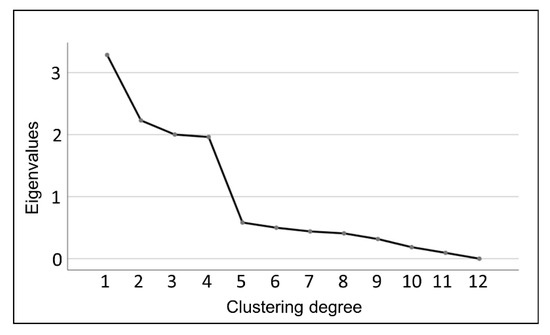
Figure 10.
A gravel diagram of the factor analysis results.
Table 9.
Principal component analysis matrix.
According to the results of the principal component analysis, classifying the 12 image word pairs into 5 categories is a good result. In Table 9, the most prominent image-word pair components can be found according to the scores of each component in the group. However, there is no component clustering and scoring for the “innovative-retro” and “individualistic-popular” pairs; so, in order to verify whether these two pairs can be classified into one category, further systematic clustering of the similarity questionnaire data is needed. The results of the systematic clustering are shown in Figure 11.
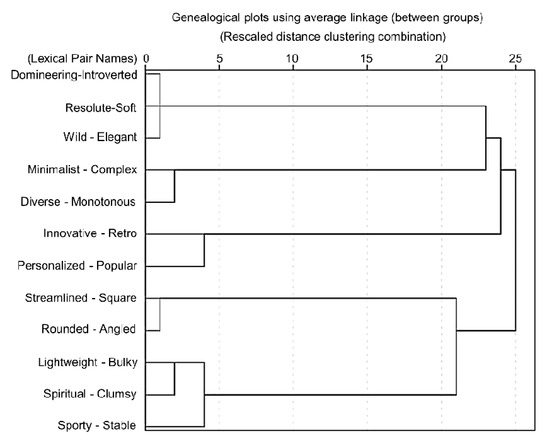
Figure 11.
Spectrum diagram for the cluster analysis of imagery vocabulary pairs.
According to Figure 11, it can be seen that the two image word pairs “innovative-retro” and “individual-popular” are classified into one category. Next, through the focus group discussion, select “innovative-retro” as the representative sample of this category.
3.3. Construct the Mapping Relationship between Representative Imagery Words and Representative Samples
In this study, the semantic difference method was used to investigate users’ evaluation of the emotional imagery of truck front modeling. The experiment took 5 representative imagery word pairs as the evaluation semantics and 13 representative sample images of truck front faces as the evaluation objects and established a 7-order semantic difference method questionnaire using the evaluation interval of −3~3. The experiment invited 19 design and mechanical graduate students, 6 designers with experience related to modeling design, 27 truck drivers, and 30 automotive enthusiasts, for a total of 82 people, to conduct the questionnaire research. Finally, 62 valid questionnaires were collected, among which 35 were male and 27 were female. The data of the questionnaires were collated, the comprehensive average scores of each representative sample were calculated, and the scores of each representative sample corresponding to the representative imagery vocabulary pairs are shown in Table 10.
Table 10.
Summary of the average scores of emotional imagery research.
The following conclusions were drawn from the evaluation of the emotional imagery of the representative samples. The most prominent emotional imagery of samples 10 and 21 was “dominant”; the most prominent emotional imagery of samples 4, 6, 8, and 25 was “dynamic”; the most prominent emotional images in samples 16 and 23 are “rounded”; the most prominent emotional images in samples 11, 15, and 19 are “simple”; and the most prominent emotional images in samples 2 and 24 are “innovative”. Accordingly, the 597 truck front samples were classified into “dominant”, “dynamic”, “rounded”, “simple”, and “simple” based on the emotional imagery of the other samples in the sample category represented by the representative sample. The 597 truck front samples were thus classified into five categories based on the sentiment imagery: “dominant”, “dynamic”, “round”, “simple”, and “innovative”.
3.4. Imagery Product Generative Adversarial Network
3.4.1. Truck Front Face Dataset Production and Data Enhancement
For a deep learning training project, a good dataset will directly affect the efficiency of network learning and the accuracy of training results. The images in the dataset have been matched with the sentiment semantics in the previous section, and then we need to continue to standardize the dataset samples to meet the requirements of the dataset samples for network training. The specific steps of dataset processing are as follows: unify the size, naming rules, and format of sample images within the dataset.
In this experiment, due to the limitation of computer hardware conditions and to ensure that both DCGAN and StyleGAN2 can achieve the best generation effect, we need to adjust the resolution of the dataset samples to 64 × 64 pixels and 256 × 256 pixels, respectively, and name the sample images in the dataset in the “001.jpg” format. Considering that designers usually use three forms of hand-drawn line drawings, grayscale effects, and rendered color effects when conceiving and presenting solutions, in order to conform to designers’ usage habits, this paper divides the dataset into three modes: grayscale drawings, line drawings, and color drawings, and compares the generation effects of the three modes.
The production of color mode datasets only requires fewer color removal steps than the production of grayscale mode datasets, and this article will not elaborate on it. For the production of the line draft dataset, a new fusion-type line draft production method based on Adobe Photoshop Creative Suite 6 software (https://helpx.adobe.com/creative-suite/kb/cs6-install-instructions.html, accessed on 25 November 2017) has been summarized through multiple attempts. The specific operation of the method is as follows: (1) First, copy a layer named “Layer 1” from the original layer and then execute the “Decolor” command on that layer. Then, find the “Illuminate Edges” command in the filter library, execute it, and set relevant parameters as needed. Then, execute the “Invert” command and change the “Layer 1” mode to “Overlay”. (2) Copy “Layer 2” from the original layer, execute the “Decolor” and “Invert” commands on “Layer 2” and then execute the “Minimum” command in the filter and change the “Layer 2” mode to “Overlay”. (3) Copy a layer named “Layer 3” from the original layer, execute the “Decolor” command on that layer, and then find the “Find Edge” command in the filter and execute it. (4) Delete or hide the original layer.
At this point, a dataset of three different image modes for network training has been produced. Each dataset contains folders named after five representative terms, and sample datasets of the three modes are shown in Figure 12.
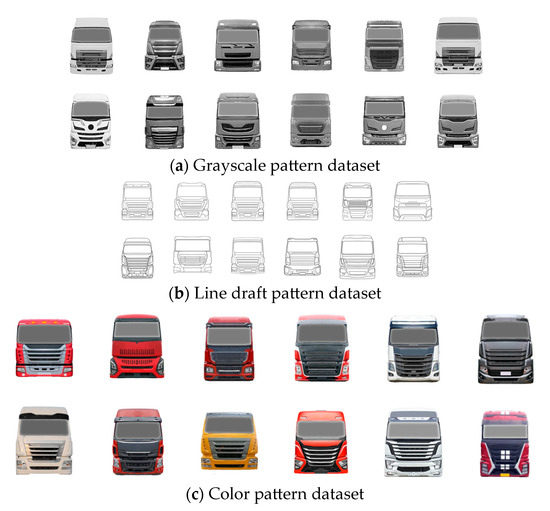
Figure 12.
Example of sample images in the dataset with three patterns.
The dataset of truck front modeling emotional imagery described above contains 112 “dominant” imagery samples, 165 “dynamic” imagery samples, 109 “innovative” imagery samples, 131 “simple” imagery samples, and 81 “round” imagery samples. The sample size of the dataset is too thin for training StyleGAN2, so it is necessary to use the existing dataset sample images by data augmentation to generate new sample data and increase the data size. In this paper, through the training process of the visualization model, we find out the applicable ways to enhance the data of the truck front face samples, which are scaling, panning, contrast transformation, and color perturbation. By data augmentation, the sample size of the dataset is expanded to 6 times that of the original.
3.4.2. Comparison of the Generation Effect of Original DCGAN and StyleGAN2
There are many kinds of neural network models for deep learning. In this experiment, the original DCGAN suitable for small-sample image learning and the original StyleGAN2, a high-precision generation model with a controllable process, were selected as the pre-experimental objects, and the grayscale model after data enhancement was used, respectively. The dataset is used to train the generation model. By debugging and training the original DCGAN and the original StyleGAN2 models, the best generation effect of the two models is shown in Figure 13. It can be seen that the original StyleGAN2 model has a better learning effect, so this experiment uses the original StyleGAN2 model as the basis, further modifies and debugs it to optimize the generation effect of the model and designs a network model that can meet the directional generation of truck front face modeling.
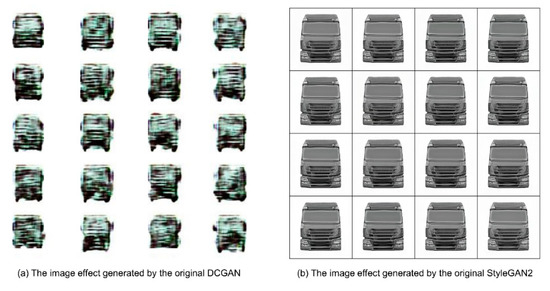
Figure 13.
Comparison of the generative effects of two generative networks.
3.4.3. Overview of the StyleGAN2 Principle and the Interpretation of Equations
StyleGAN2 is a high-resolution image synthesis model based on generative adversarial networks, which includes multiple generator and discriminator networks. The generator network learns the features and distributions in the dataset, operates on potential vectors, and gradually converts low-resolution images into high-resolution images, ultimately obtaining realistic and high-quality image output. Specifically, the generator network of the StyleGAN2 network adopts a progressive approach for training, which gradually increases resolution from lower-resolution images until the target resolution is reached. In addition, StyleGAN2 also introduces orthogonal regularization technology to constrain the parameters of the generator network to reduce the correlation between parameters, increase the diversity and controllability of the model, and generate images with more diverse features. Therefore, StyleGAN2 is a widely recognized and used efficient and high-quality image synthesis network. It is worth noting that the term “Style” in StyleGAN2 does not refer to the artistic style of the dataset image but rather to the characteristic attributes of the dataset image.
The overall formula of the StyleGAN2 network is shown in Equation (1):
The parameters of the equation are introduced as follows:
- is the letter specified in the original GAN paper to represent the cross entropy;
- is a network that generates images and receives random noise ;
- is a binary discriminant network that distinguishes between true and false for a given image;
- is the degree of difference between the real sample and the generated image;
- is a parameter that represents sample images;
- is the distribution interval of real data for all samples;
- is a logarithm with a natural base e;
- is a real image, and the corresponding label is 1;
- represents the probability that is a real image;
- is the distribution interval of all noise-generated data;
- is random noise;
- is the image generated by a given noise , with a corresponding label of 0;
- is the probability that the network determines whether the image generated by is true.
The loss function formula for generator is shown in Equation (2):
The loss function formula of discriminator is shown in Equation (3):
The parameters in the equation are introduced as follows:
- represents a total of samples;
- represents the number of iterations of training;
- is a logarithm with a natural base e;
- represents any real data;
- represents the result determined by the discriminator on real data ;
- represents any random data with the same structure as real data;
- represents false data generated in the generator based on ;
- represents the result determined by the discriminator on false data ;
- and are both probabilities of the sample being ‘true’.
3.4.4. Improving the Original StyleGAN2 Model
- (1)
- The image effect generated by the original StyleGAN2 training is blurred and distorted and the detail processing is not in place, which may be due to the small sample size of the dataset and the small total number of iterations during training. Therefore, this experiment introduces a generative model with 550,000 iterations of a large dataset of cars as the initialized model, which makes the StyleGAN2 network less demanding on the sample size of the dataset and becomes a small sample training model.
- (2)
- In order to solve the problem that the detail transition in the generated image is not natural enough, this experiment defines a function accumulate, which is used to realize the sliding average of the model parameters, and the decay rate of the specified sliding average coefficient is 0.999. This function uses the model1.named_parameters() and model2.named_parameters() methods to obtain all the parameters of the models, model1 and model2, and then calculates the parameters of the model1 approach the parameters of model2 to achieve a moving average. Later in the training process, the generated network can periodically call the accumulate() function to update the parameters in model2, which can better control the generalization ability of the model.
- (3)
- The training process of the original StyleGAN2 needs to be observed by entering the visualization program. In order to facilitate the viewing of the loss values of the generator and discriminator, this experiment stores the discriminator loss value “d_loss_val” and the generator loss value “g_loss_val” obtained from each training iteration in the “d_losses” and “g_losses” arrays, which is convenient. After the training, the Matplotlib library is used to plot the loss curves of the discriminator and generator during the training. The variation of the loss function for the discriminator is shown in Figure 14, and the variation of the loss function for the generator is shown in Figure 15.
 Figure 14. Example of loss function changes for the discriminator.
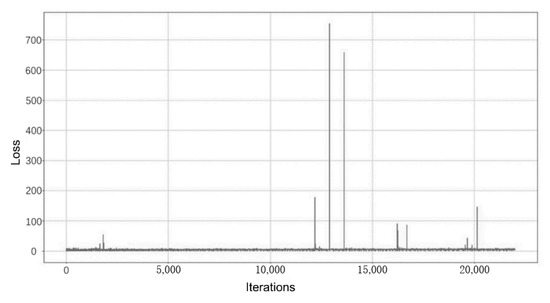 Figure 15. Example of loss function changes for generators.
3.4.5. Results and Analysis of the Directed Generation Experiments
The whole experiment requires a total training of 3 (three image processing modes: “grayscale image”, “line drawing”, “color drawing”) × 5 (five imagery semantic terms: “dominant”, “dynamic”, “revolutionary”, “minimalist”, and “rounded”), for a total of 15 generative models. After the training, the loss function curve and the training process graph are observed to find out the training times with better generative effects, and the corresponding generative models are saved. Combined with the generative process graph saved by following the models in training, the number of iterations of training when the 15 training models achieve the best results can be obtained, and detailed information is shown in Table 11.
Table 11.
The situation when each training model achieves the best generation effect.
In Table 11, the number of samples in the dataset is the total number of samples obtained after the data enhancement described in the previous section. The optimal number of iterations refers to the number of iterations corresponding to the process graph with the best performance generated according to regulations during the training process. Usually, the learning model corresponding to this number of iterations is used to generate images, which can achieve the best learning image effect. The availability of generated images refers to the proportion of the number of images where artifacts can be ignored, using the best learning model to generate 100 new images. According to the results, the best learning effect in the dataset of the three image modes with fixed imagery words is the line draft mode dataset, with a combined usability rate of 89.4%, followed by the color mode dataset, with a combined usability rate of 86.6%, and finally the grayscale mode dataset, with a combined usability rate of 82.6%. The results of the generated images for the three mode datasets are shown in Figure 16.

Figure 16.
Example of the image generation effect for the three pattern datasets.
3.5. EEG-Based User Emotional Imagery Matching Metric Experiment
3.5.1. Overview of Experimental Design
The stimulus type of this experiment is visual stimulation, which aims to verify the matching degree of the new scheme image generated by the trained network model and its corresponding image semantic word and recognize image scheme of the three modes under the same image semantic word. Knowing the effect is the best, the ERP component studied in this experiment is mainly P300, which is the positive wave generated about 300 ms after the appearance of visual stimulation. The experiment adopts the “prime-goal” paradigm and divides an experimental trial into two stages: the “prime stage” and “target stage”, corresponding to “prime material” and “target material”, respectively. Using the 15 generative network models trained in the previous section, 10 new images of the truck front face were generated, and then 1 image with better generation effect and higher recognition was selected as the “starter material” for the EEG experiment through focus group discussion, as shown in Figure 17. The five imagery semantic words were used as the “target material” of the stimulus event, and the EEG experiment was designed in conjunction with the “priming material”.

Figure 17.
Three modes of generating images for the EEG experiments.
This experiment uses a 16-channel head-mounted EEG device, as shown in Figure 18, including an amplifier, electrode cap, lead wire, sponge, tape measure, charger, and software dongle. The EEG device uses Bluetooth wireless transmission to collect EEG data. The sampling frequency of the device is 256 Hz and, the accuracy is 24 Bits. Electrode leads are used, and the distribution of electrode leads is shown in Figure 19. The test environment was divided into the main test area, the subject area, and the rest area. The subject area was free of noise and electromagnetic interference and far from various electrical equipment. A total of 15 graduate students, 9 males and 6 females, aged 22 to 27 years old, were recruited as subjects during the experiment. All subjects were right-handed, had normal naked-eye vision or corrected vision, normal color perception, and had no history of psychiatric disorders or experience of brain disease. Prior to the start of the experiment, all subjects were adequately rested and signed a subject-informed consent form.
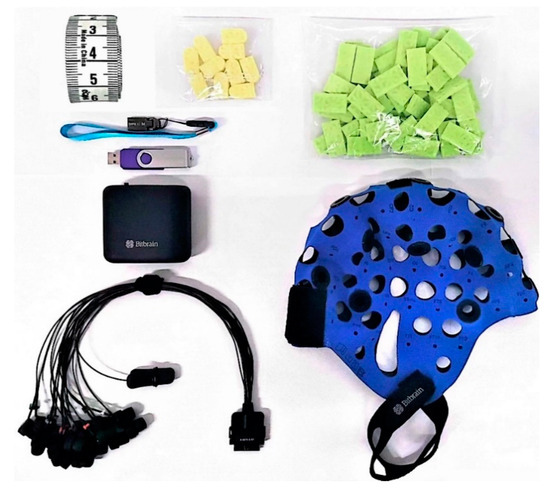
Figure 18.
EEG experimental equipment.
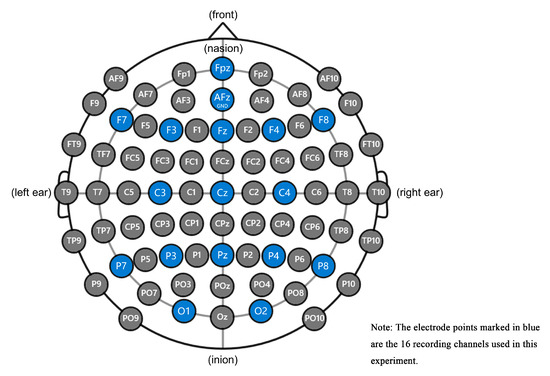
Figure 19.
Distribution of electrode leads.
3.5.2. Experimental Procedures and Methods
The experimental procedure was prepared by “ErgoLAB 3.0” software according to the experimental paradigm, and the EEG data were collected while the subjects were viewing the screen. The experiments were conducted in 3 (three image processing modes: “grayscale”, “line drawing”, “color”) × 5 (five network-generated images for each image processing mode, corresponding to five imagery semantics) × 5 (five imagery semantics: “dominant”, “dynamic”, “innovative”, “minimalist “, “mellow”) in a mixed experimental design approach, and a total of 75 trials (trials) were conducted. In order to reduce the subjects’ experimental stress, the experimental design was divided into 3 blocks (blocks) according to the 3 image processing modes, and each block contained 25 trials. The average duration of the experiment was 12 min. The standard procedure of a trial is as follows. First, a “+” will appear in the center of the screen for 1000 ms; then, a new scheme of the truck’s front face generated by the pre-training network will appear as the “start material” for 3000 ms; and after that, 1000 ms will be presented. A blank screen of 1000 ms is then presented; an imagery semantic word is then presented as the “target material” for 1000 ms; and finally, another blank screen of 1000 ms is presented. The flow of the whole EEG experiment is shown in Figure 20.
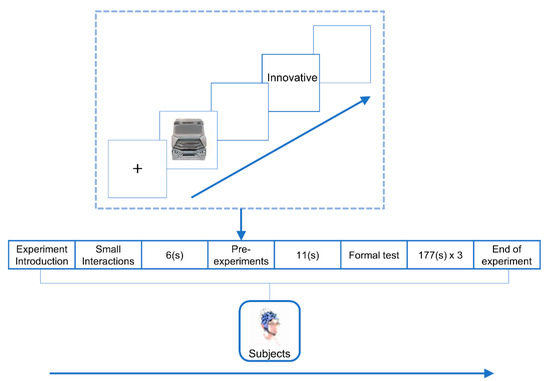
Figure 20.
EEG experiment process.
3.5.3. EEG Data Processing and Analysis
The raw EEG data acquired with EEG devices are generally entrained with artifacts such as ocular, electromyographic, and noise signals, which are often more prominent than the evoked EEG signals we need to detect. Therefore, the artifacts in the raw EEG data should be removed before analyzing the EEG data in order to improve the signal-to-noise ratio of the EEG data. There is no standardized procedure to remove the artifacts from the EEG data, but it is more based on the data itself and the experimenter’s own experience. In this experiment, based on extensive literature research, the raw EEG data collected were processed using the EEG signal preprocessing method commonly used by many scholars. The preprocessing operation was performed based on the open-source plug-in EEGLAB toolbox in MATLAB R2020b software (https://ww2.mathworks.cn/products/new_products/release2020b.html, accessed on 16 August 2021), and the EEG data preprocessing flow is shown in Figure 21.
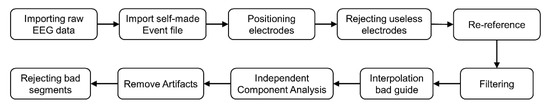
Figure 21.
EEG data preprocessing flow.
After the above preprocessing process, the original EEG data removed most of the artifact signals, improved the quality of the EEG data, and provided a basic guarantee for the analysis of the EEG data. Next, this experiment will conduct EEG data analysis on the emotional cognition of the degree of association between the image seen and the following image semantic words of the subjects. The EEG data analysis process is shown in Figure 22.
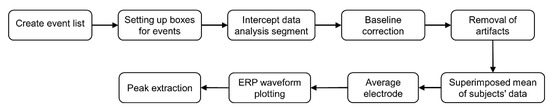
Figure 22.
EEG data analysis process.
3.5.4. Data Analysis Results of the EEG Experiments
According to the experimental results in Figure 23, it can be seen from the total average ERP waveforms in the three modes that the subjects produced a more obvious amplitude change around 300 ms after receiving the stimulus; that is, a more obvious P300 component was induced by the stimulus. The experimental results showed that the images generated by any of the imagery semantic words in the grayscale mode matched the imagery semantic words, and the degree of matching was the highest among all the imagery semantic words; the images generated by four imagery semantic words in the line draft mode reached the same conclusion as the grayscale mode, and there was only one imagery semantic word: “kinesthetic”. The images generated for the semantic word “dynamic” did not match the semantic word in the subjects’ perception, the images generated for the semantic word “color” did not match the semantic word in the subjects’ perception, and the images generated for the semantic word “dominant” did not match the semantic word in the subjects’ perception. In summary, the accuracy of the generative adversarial network trained in this study is 100% in grayscale mode, 80% in both online and color modes, and 86.67% in the overall semantic image generation, which proves that it is feasible to use the generative adversarial network for a new scheme of truck front face imagery modeling under a certain semantic meaning. The experiments demonstrate the feasibility of using generative adversarial networks for a new scheme of truck front face imagery modeling under certain semantics.
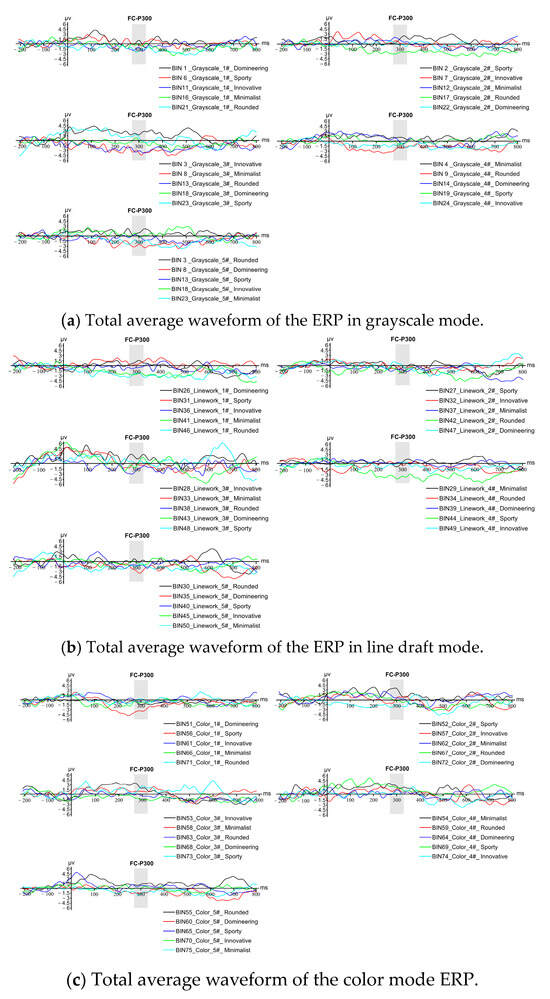
Figure 23.
A summary of the average total ERP waveforms for three image modes.
According to the experimental results in Figure 24, the ERP waveform generated in three different modes for the imagery semantic word “dominant”. The highest P300 component amplitude is in line mode, followed by grayscale mode and color mode for the imagery semantic word “dynamic. The highest P300 component amplitude is in color mode, followed by grayscale mode and in line mode for the imagery semantic term “dynamic”. The highest P300 component amplitude is in color mode for the imagery semantic term “innovative”, with the same peak in line mode and grayscale mode. The highest P300 component amplitude is in color mode for the imagery semantic term “simple”, followed by the same peak in line mode and grayscale mode for the imagery semantic term. The highest P300 component amplitude for the image semantic term “simple” is color mode, followed by line mode and grayscale mode. For the image semantic term “rounded”, the highest P300 component amplitude is grayscale mode. For the imagery semantics of “rounded”, the highest amplitude of the P300 component is grayscale mode, followed by color mode and line mode. In order to unify the score scales under different imagery semantic terms and obtain a reasonable priority ranking, the three waveforms under each imagery semantic term were scored according to their amplitude (the highest amplitude was scored as 3, the middle as 2, and the lowest as 1), and the amplitude evaluation and average score are shown in Table 12. According to the scoring results in the table, the color mode has the highest average score of 2.4, followed by grayscale mode and line art mode. The reason for this situation may be that the color images contain more dimensions of information, and line draft mode tends to represent more abstract concepts and contains the least dimensions of information, so the subjects are less stimulated.
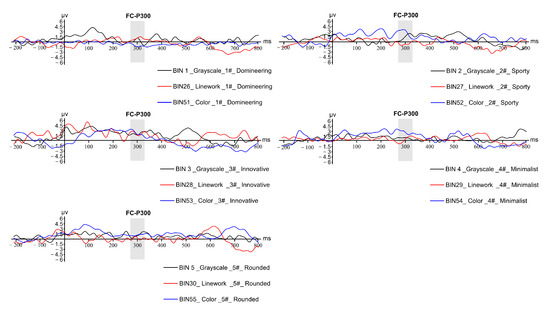
Figure 24.
A comparison of the total average waveforms of images generated by the same image semantic word in the three modes.
Table 12.
Amplitude evaluation in the three modes.
4. Discussion
4.1. Elaboration of the Findings
In this paper, we study the user’s emotional imagery demand for truck front modeling design and conclude that a user imagery-driven method for intelligent and rapid generation of truck front modeling design solutions is the best method. By applying Kansei Engineering’s research program combined with user cognitive theory, we collect, cluster, and filter truck front face sample images and emotional semantic words to build a truck front face modeling sample set and an emotional imagery vocabulary. We collect and analyze data from multiple perspectives and dimensions through focus groups, questionnaires, factor analysis, and other research methods to find out representative truck front face modeling The data were collected and analyzed by focus groups, questionnaires, factor analysis, and other research methods to find representative samples and representative emotional imagery words of truck front face modeling. The semantic difference method was applied to evaluate the truck front face modeling imagery experiments, the mapping relationship between representative samples and representative imagery words was quantified, and the truck front face sample images were divided into five types of datasets with semantic labels of imagery according to emotional imagery. By training the generative adversarial network, multiple imagery-driven network generation models are obtained, after which the network generation models can be used to quickly generate a certain number of new truck front face modeling solutions that meet the user’s imagery expectations. Finally, the objective match between the generated modeling solutions and the desired imagery is analyzed by EEG experiments to verify the feasibility of deep learning techniques for generating truck front face modeling solutions and to check the quality of matching the generated images with the expected emotional imagery. This study provides technical support for realizing the cab front modeling design of lorries oriented to consumers’ emotional imagery.
We analyzed the computational complexity of the proposed method. The computational complexity of the main loop code can be expressed as O(n) using the large O method, where “n” is the number of iterations. The main loop is the process of training a generator and discriminator network through a series of iterative steps. Each iteration step includes operations such as the forward propagation of the generator, the forward propagation of the discriminator, the loss calculation of the generator and discriminator, backpropagation, and parameter updates. The computational complexity of these operations mainly depends on the size of the network and the size of the input data. Due to the fixed number of iterations of the main loop, the computational complexity of the entire main loop can be expressed as O(n). In addition, we also analyzed the computational complexity of the main stages of the method and obtained the following results. The computational complexity of loading a batch of real images can be expressed as O(n), where “n” is the number of batch images. The computational complexity of creating noise and generating fake images can be expressed as O(1), which is a constant time complexity, using the large O method. Discriminator and generator training have a complexity of O(n) for forward and backward propagation. R1 regularization and path length regularization have a complexity of O(n). The computational complexity of applying gradients and optimization steps is O(1). The complexity of recording loss values and saving checkpoints and images is also O(1).
4.2. Potential Theoretical and Practical Implications
4.2.1. Theoretical Implications
The application of image generation technology can promote the continuous digital and intelligent development of the design industry and provide more possibilities and innovation space for modeling design. Applying Kansei Engineering to image generation technology can obtain an image generation model that is more in line with the user’s emotional image preference. It is helpful to improve the computer’s ability to understand and process emotional images of images and expand the application range of image generation technology. At the same time, it can also shorten the modeling design cycle, scientifically and efficiently modify models, and reduce the risk of market investment.
4.2.2. Practical Implications
The feasibility of deep learning techniques for generating modeling solutions is demonstrated through directed generation experiments of truck front modeling, and finally, the emotional imagery compliance of the generated images is examined using EEG techniques. This study provides technical support to achieve a rapid output of modeling design solutions that meet consumers’ emotional needs. For enterprises, being able to quickly generate modeling design solutions that meet users’ emotional needs through intelligent methods can greatly improve the speed of model iterations of car companies and enhance the market competitiveness of new models.
4.3. Limitations and Directions for Future Research
- (1)
- In this paper, a questionnaire was used in the imagery mining and analysis phase because it was not easy to find and manipulate a large number of eligible EEG subjects. In the future, a suitable physiological measurement tool can be selected for the study during imagery mining and localization to improve the objectivity, reliability, and persuasiveness of the study.
- (2)
- Considering the limitations of data resources and the difficulty of population research, the emotional intention classification of this study only has five categories with a single dimension, and the dataset collection samples are small. In the future, it is possible to build a comprehensive evaluation system for product imagery with more dimensions, expand the number of samples in the dataset through other technical means, or directly establish a three-dimensional database.
5. Conclusions
In this paper, we propose a fast-generation method for truck front face imagery modeling based on generative adversarial networks using theories and methods from Kansei Engineering, deep learning, and EEG technology as case objects. The main research work of this paper is summarized as follows:
- (1)
- Construct the emotional imagery space of the truck front face design.
In order to quickly generate truck front face modeling design solutions, this paper studies the correspondence between truck front face modeling features and user’s emotional imagery using Kansei Engineering theory as a guide and creates 15 self-made truck front face datasets based on both image patterns and emotional imagery attributes.
- (2)
- Application of deep learning technology for the directional generation of truck front face imagery modeling.
In this paper, we use dataset classification to bring emotional imagery into the image generation process. Unsupervised learning is performed using generative adversarial networks, and the best model for truck front face generation with different semantics of imagery is obtained by adjusting the network parameters and visualizing the training process. The model can be used to quickly generate new truck front face modeling solution images that meet the given semantics, completing the exploration of a fast method for generating imagery-driven intelligent design solutions for truck front face modeling.
- (3)
- Quantitative experiment of user emotional image matching based on EEG technology.
In this paper, we use EEG equipment to extract cognitively relevant ERP components and analyze the objective degree of matching between the generated modeling solutions and the desired imagery through EEG experiments to verify the feasibility of deep learning techniques for generating truck front face modeling solutions and to test the quality of matching the generated images with the desired emotional imagery.
Author Contributions
Conceptualization, Z.L. and F.Z.; methodology, Z.L. and F.Z.; software, Z.L.; validation, Z.L. and S.W.; formal analysis, S.W. and Z.Z.; investigation, S.W. and Z.Z.; resources, F.Z.; data curation, S.W. and Z.Z.; writing—original draft preparation, Z.L.; writing—review and editing, F.Z.; visualization, Z.L.; supervision, F.Z. All authors have read and agreed to the published version of the manuscript.
Funding
This research received no external funding.
Institutional Review Board Statement
Not applicable.
Informed Consent Statement
Informed consent was obtained from all subjects involved in the study. All subjects who participated in the experiment were informed of the rights and obligations belonging to them. All participating subjects were informed in detail about the experiment. Written informed consent has been obtained from the patient(s) to publish this paper.
Data Availability Statement
Due to the presence of physiological measurement experiments in this study, respondents were assured that the raw data would be kept confidential and would not be shared. Other experimental data in the paper that are not readily available for uploading, as well as datasets, can be obtained by contacting the corresponding author if required.
Acknowledgments
We thank all colleagues in our laboratory who provided useful discussions and technical assistance for this study. We are also grateful to the editors and reviewers who critically evaluated the manuscript and provided constructive comments for its improvement for their dedication.
Conflicts of Interest
The authors declare no conflict of interest.
References
- Pile, V.; Williamson, G.; Saunders, A.; Holmes, E.A.; Lau, J.Y. Harnessing emotional mental imagery to reduce anxiety and depression in young people: An integrative review of progress and promise. Lancet Psychiatry 2021, 8, 836–852. [Google Scholar] [CrossRef] [PubMed]
- Qiu, K.; Su, J.; Zhang, S.; Yang, W. Research on product target image cognition based on complex network theory and game theory. J. Adv. Mech. Des. Syst. Manuf. 2022, 16, JAMDSM0064. [Google Scholar] [CrossRef]
- Lee, J.L.; James, J.D.; Kim, Y.K. A reconceptualization of brand image. Int. J. Bus. Adm. 2014, 5, 1. [Google Scholar] [CrossRef]
- Park, J.; Gunn, F.; Lee, Y.; Shim, S. Consumer acceptance of a revolutionary technology-driven product: The role of adoption in the industrial design development. J. Retail. Consum. Serv. 2015, 26, 115–124. [Google Scholar] [CrossRef]
- Amatulli, C.; Guido, G.; Nataraajan, R. Luxury purchasing among older consumers: Exploring inferences about cognitive age, status, and style motivations. J. Bus. Res. 2015, 68, 1945–1952. [Google Scholar] [CrossRef]
- Shi, S.; Wang, Y.; Chen, X.; Zhang, Q. Conceptualization of omnichannel customer experience and its impact on shopping intention: A mixed-method approach. Int. J. Inf. Manag. 2020, 50, 325–336. [Google Scholar] [CrossRef]
- Nam, S.; Choi, J. Development of a user evaluation system in virtual reality based on eye-tracking technology. Multimed. Tools Appl. 2023, 82, 21117–21130. [Google Scholar] [CrossRef]
- Guo, F.; Li, M.; Hu, M.; Li, F.; Lin, B. Distinguishing and quantifying the visual aesthetics of a product: An integrated approach of eye-tracking and EEG. Int. J. Ind. Ergon. 2019, 71, 47–56. [Google Scholar] [CrossRef]
- Guo, F.; Liu, W.L.; Liu, F.T.; Wang, H.; Wang, T.B. Emotional design method of product presented in multi-dimensional variables based on Kansei Engineering. J. Eng. Des. 2014, 25, 194–212. [Google Scholar] [CrossRef]
- Vieira, J.; Osório, J.M.A.; Mouta, S.; Delgado, P.; Portinha, A.; Meireles, J.F.; Santos, J.A. Kansei engineering as a tool for the design of in-vehicle rubber keypads. Appl. Ergon. 2017, 61, 1–11. [Google Scholar] [CrossRef]
- Hou, T.; Yannou, B.; Leroy, Y.; Poirson, E. Mining customer product reviews for product development: A summarization process. Expert Syst. Appl. 2019, 132, 141–150. [Google Scholar] [CrossRef]
- Qi, J.; Zhang, Z.; Jeon, S.; Zhou, Y. Mining customer requirements from online reviews: A product improvement perspective. Inf. Manag. 2016, 53, 951–963. [Google Scholar] [CrossRef]
- Li, Y.; Feng, Q.; Huang, T.; Wang, S.; Cong, W.; Knighton, E. A new product development study using intelligent data analysis algorithm based on KE theory. J. Intell. Fuzzy Syst. 2022, 43, 7041–7055. [Google Scholar] [CrossRef]
- Xue, L.; Yi, X.; Zhang, Y. Research on optimized product image design integrated decision system based on Kansei engineering. Appl. Sci. 2020, 10, 1198. [Google Scholar] [CrossRef]
- Wu, M.Y.; Chen, Y.H. Factors affecting consumers’ cognition of food photos using Kansei engineering. Food Sci. Technol. 2021, 42, e38921. [Google Scholar] [CrossRef]
- Cong, J.; Chen, C.H.; Zheng, P. Design entropy theory: A new design methodology for smart PSS development. Adv. Eng. Inform. 2020, 45, 101124. [Google Scholar] [CrossRef]
- Zhang, S.; Su, P.; Liu, S. Fusion of cognitive information: Evaluation and evolution method of product image form. Comput. Intell. Neurosci. 2021, 2021, 5524093. [Google Scholar] [CrossRef] [PubMed]
- Xue, S. Intelligent system for products personalization and design using genetic algorithm. J. Intell. Fuzzy Syst. 2019, 37, 63–70. [Google Scholar] [CrossRef]
- Hu, M. Decision-making model of product modeling big data design scheme based on neural network optimized by genetic algorithm. Comput. Intell. Neurosci. 2021, 2021, 9315700. [Google Scholar] [CrossRef]
- Dong, Y.; Peng, Q.; Tan, R.; Zhang, J.L.; Zhang, P.; Liu, W. Product function redesign based on extension theory. Comput. Aided Des. Appl. 2021, 18, 199–210. [Google Scholar] [CrossRef]
- Wang, T.; Li, H.; Wang, X. Extension Design Model of Rapid Configuration Design for Complex Mechanical Products Scheme Design. Appl. Sci. 2022, 12, 7921. [Google Scholar] [CrossRef]
- Mao, J.; Zhu, Y.; Chen, M.; Chen, G.; Yan, C.; Liu, D. A contradiction solving method for complex product conceptual design based on deep learning and technological evolution patterns. Adv. Eng. Inform. 2023, 55, 101825. [Google Scholar] [CrossRef]
- Yang, H.; Zhang, J.; Wang, Y.; Jia, R. Exploring relationships between design features and system usability of intelligent car human–machine interface. Robot. Auton. Syst. 2021, 143, 103829. [Google Scholar] [CrossRef]
- Wu, J.; Jia, L. Neural Network Model for Perceptual Evaluation of Product Modelling Design Based on Multimodal Image Recognition. Comput. Intell. Neurosci. 2022, 2022, 1665021. [Google Scholar] [CrossRef] [PubMed]
- Ding, M.; Zhao, L.; Pei, H.; Song, M. An XGBoost based evaluation methodology of product color emotion design. J. Adv. Mech. Des. Syst. Manuf. 2021, 15, JAMDSM0075. [Google Scholar] [CrossRef]
- Zeng, D.; He, M.E.; Tang, X.Z.; Wang, F.G. Cognitive association in interactive evolutionary design process for product styling and application to SUV design. Electronics 2020, 9, 1960. [Google Scholar] [CrossRef]
- Luo, X.; Zhao, H.; Chen, Y. Research on User Experience of Sports Smart Bracelet Based on Fuzzy Comprehensive Appraisal and SSA-BP Neural Network. Comput. Intell. Neurosci. 2022, 2022, 5597662. [Google Scholar] [CrossRef] [PubMed]
- Chen, D.; Cheng, P. Development of design system for product pattern design based on Kansei engineering and BP neural network. Int. J. Cloth. Sci. Technol. 2022, 34, 335–346. [Google Scholar] [CrossRef]
- Barmpalexis, P.; Karagianni, A.; Karasavvaides, G.; Kachrimanis, K. Comparison of multi-linear regression, particle swarm optimization artificial neural networks and genetic programming in the development of mini-tablets. Int. J. Pharm. 2018, 551, 166–176. [Google Scholar] [CrossRef]
- Ng, C.Y. Green product design and development using life cycle assessment and ant colony optimization. Int. J. Adv. Manuf. Technol. 2018, 95, 3101–3109. [Google Scholar] [CrossRef]
- Wang, L.; Liu, Z. Data-driven product design evaluation method based on multi-stage artificial neural network. Appl. Soft Comput. 2021, 103, 107117. [Google Scholar] [CrossRef]
- Mohseni, S.; Jayashree, S.; Rezaei, S.; Kasim, A.; Okumus, F. Attracting tourists to travel companies’ websites: The structural relationship between website brand, personal value, shopping experience, perceived risk and purchase intention. Curr. Issues Tour. 2018, 21, 616–645. [Google Scholar] [CrossRef]
- Wu, H.C.; Li, T. A study of experiential quality, perceived value, heritage image, experiential satisfaction, and behavioral intentions for heritage tourists. J. Hosp. Tour. Res. 2017, 41, 904–944. [Google Scholar] [CrossRef]
- Zhou, C.; Yuan, F.; Huang, T.; Zhang, Y.; Kaner, J. The Impact of Interface Design Element Features on Task Performance in Older Adults: Evidence from Eye-Tracking and EEG Signals. Int. J. Environ. Res. Public Health 2022, 19, 9251. [Google Scholar] [CrossRef] [PubMed]
- Lin, L.; Guo, G.; Xu, N. User-perceived styling experience of smart vehicles: A method to combine eye tracking with semantic differences. IET Intell. Transp. Syst. 2019, 13, 72–78. [Google Scholar] [CrossRef]
- Kuo, J.Y.; Chen, C.H.; Koyama, S.; Chang, D. Investigating the relationship between users’ eye movements and perceived product attributes in design concept evaluation. Appl. Ergon. 2021, 94, 103393. [Google Scholar] [CrossRef] [PubMed]
- Guo, F.; Qu, Q.X.; Nagamachi, M.; Duffy, V.G. A proposal of the event-related potential method to effectively identify kansei words for assessing product design features in kansei engineering research. Int. J. Ind. Ergon. 2020, 76, 102940. [Google Scholar] [CrossRef]
- Deng, L.; Wang, G. Application of EEG and interactive evolutionary design method in cultural and creative product design. Comput. Intell. Neurosci. 2019, 2019, 1860921. [Google Scholar] [CrossRef]
- Feng, Y.; Zhao, Y.; Zheng, H.; Li, Z.; Tan, J. Data-driven product design toward intelligent manufacturing: A review. Int. J. Adv. Robot. Syst. 2020, 17, 1729881420911257. [Google Scholar] [CrossRef]
- Tao, F.; Cheng, J.; Qi, Q.; Zhang, M.; Zhang, H.; Sui, F. Digital twin-driven product design, manufacturing and service with big data. Int. J. Adv. Manuf. Technol. 2018, 94, 3563–3576. [Google Scholar] [CrossRef]
- Chen, L.; Wang, P.; Dong, H.; Shi, F.; Han, J.; Guo, Y.; Childs, P.R.; Xiao, J.; Wu, C. An artificial intelligence-based data-driven approach for design ideation. J. Vis. Commun. Image Represent. 2019, 61, 10–22. [Google Scholar] [CrossRef]
- Alzubaidi, L.; Zhang, J.; Humaidi, A.J.; Al-Dujaili, A.; Duan, Y.; Al-Shamma, O.; Santamaría, J.; Fadhel, M.A.; Al-Amidie, M.; Farhan, L. Review of deep learning: Concepts, CNN architectures, challenges, applications, future directions. J. Big Data 2021, 8, 1–74. [Google Scholar] [CrossRef]
- Wang, Q. Design of Watercolor Cultural and Creative Products Based on Style Transfer Algorithm. Math. Probl. Eng. 2022, 2022, 2711861. [Google Scholar] [CrossRef]
- Duan, Y.; Zhang, J.; Gu, X. A novel paradigm to design personalized derived images of art paintings using an intelligent emotional analysis model. Front. Psychol. 2021, 12, 713545. [Google Scholar] [CrossRef] [PubMed]
- Ruder, M.; Dosovitskiy, A.; Brox, T. Artistic style transfer for videos and spherical images. Int. J. Comput. Vis. 2018, 126, 1199–1219. [Google Scholar] [CrossRef]
- Akber, S.M.A.; Kazmi, S.N.; Mohsin, S.M.; Szczęsna, A. Deep Learning-Based Motion Style Transfer Tools, Techniques and Future Challenges. Sensors 2023, 23, 2597. [Google Scholar] [CrossRef] [PubMed]
- Quan, H.; Li, S.; Hu, J. Product innovation design based on deep learning and Kansei engineering. Appl. Sci. 2018, 8, 2397. [Google Scholar] [CrossRef]
- Jing, Y.; Yang, Y.; Feng, Z.; Ye, J.; Yu, Y.; Song, M. Neural style transfer: A review. IEEE Trans. Vis. Comput. Graph. 2019, 26, 3365–3385. [Google Scholar] [CrossRef]
- Yan, M.; Xiong, R.; Shen, Y.; Jin, C.; Wang, Y. Intelligent generation of Peking opera facial masks with deep learning frameworks. Herit. Sci. 2023, 11, 20. [Google Scholar] [CrossRef]
- Wu, Y.; Zhang, H. Image style recognition and intelligent design of oiled paper bamboo umbrella based on deep learning. Comput. Aided Des. Appl. 2021, 19, 76–90. [Google Scholar] [CrossRef]
- Burnap, A.; Liu, Y.; Pan, Y.; Lee, H.; Gonzalez, R.; Papalambros, P.Y. Estimating and exploring the product form design space using deep generative models. In Proceedings of the International Design Engineering Technical Conferences and Computers and Information in Engineering Conference, Charlotte, NC, USA, 21–24 August 2016; American Society of Mechanical Engineers: New York, NY, USA, 2016; Volume 50107, p. V02AT03A013. [Google Scholar] [CrossRef]
- Ramzan, S.; Iqbal, M.M.; Kalsum, T. Text-to-Image Generation Using Deep Learning. Eng. Proc. 2022, 20, 16. [Google Scholar] [CrossRef]
- Liu, H.; Xu, Y.; Chen, F. Sketch2Photo: Synthesizing photo-realistic images from sketches via global contexts. Eng. Appl. Artif. Intell. 2023, 117, 105608. [Google Scholar] [CrossRef]
- Dai, Y.; Li, Y.; Liu, L.J. New product design with automatic scheme generation. Sens. Imaging 2019, 20, 29. [Google Scholar] [CrossRef]
- Li, X.; Wang, Y.; Sha, Z. Deep Learning Methods of Cross-Modal Tasks for Conceptual Design of Product Shapes: A Review. J. Mech. Des. 2023, 145, 041401. [Google Scholar] [CrossRef]
- Jiao, L.; Zhao, J. A survey on the new generation of deep learning in image processing. IEEE Access 2019, 7, 172231–172263. [Google Scholar] [CrossRef]
- Le, Q.; Miralles-Pechuán, L.; Kulkarni, S.; Su, J.; Boydell, O. An overview of deep learning in industry. In Data Analytics and AI; Auerbach Publications: New York, NY, USA, 2020; pp. 65–98. [Google Scholar] [CrossRef]
- Jaiswal, D.P.; Kumar, S.; Badr, Y. Towards an artificial intelligence aided design approach: Application to anime faces with generative adversarial networks. Procedia Comput. Sci. 2020, 168, 57–64. [Google Scholar] [CrossRef]
- Guo, F.; Wang, X.S.; Liu, W.L.; Ding, Y. Affective preference measurement of product appearance based on event-related potentials. Cogn. Technol. Work 2018, 20, 299–308. [Google Scholar] [CrossRef]
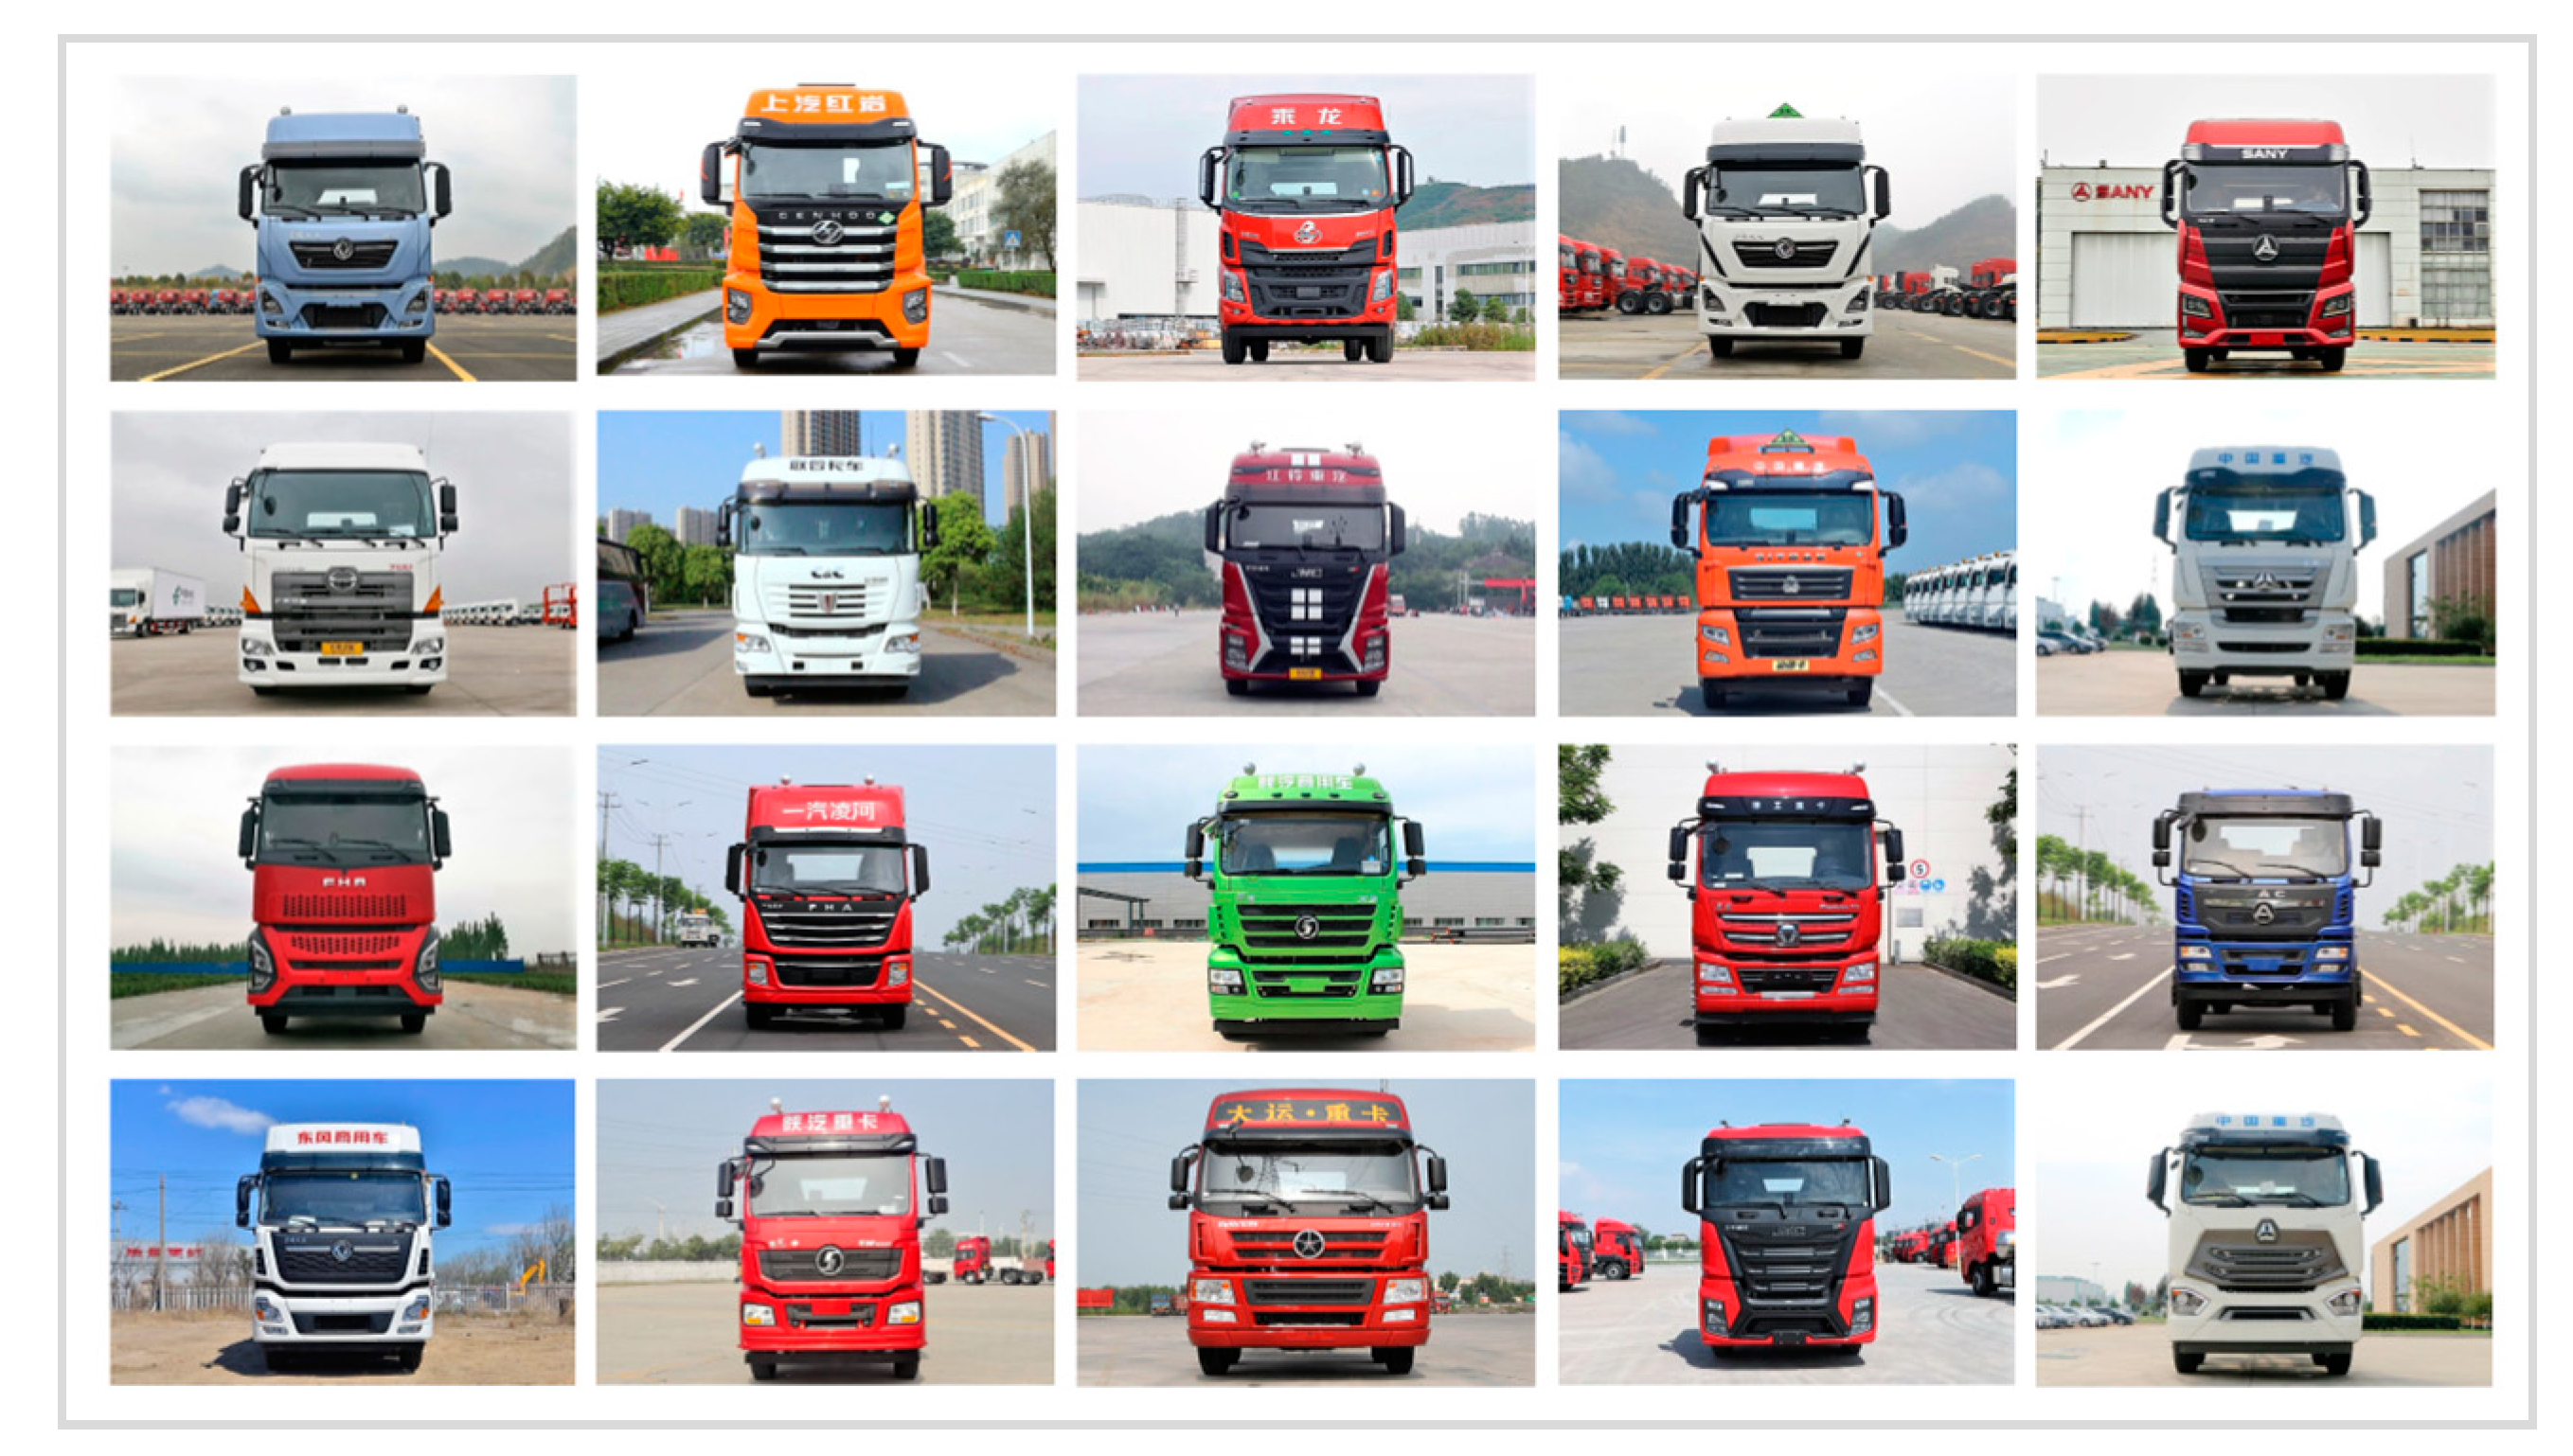
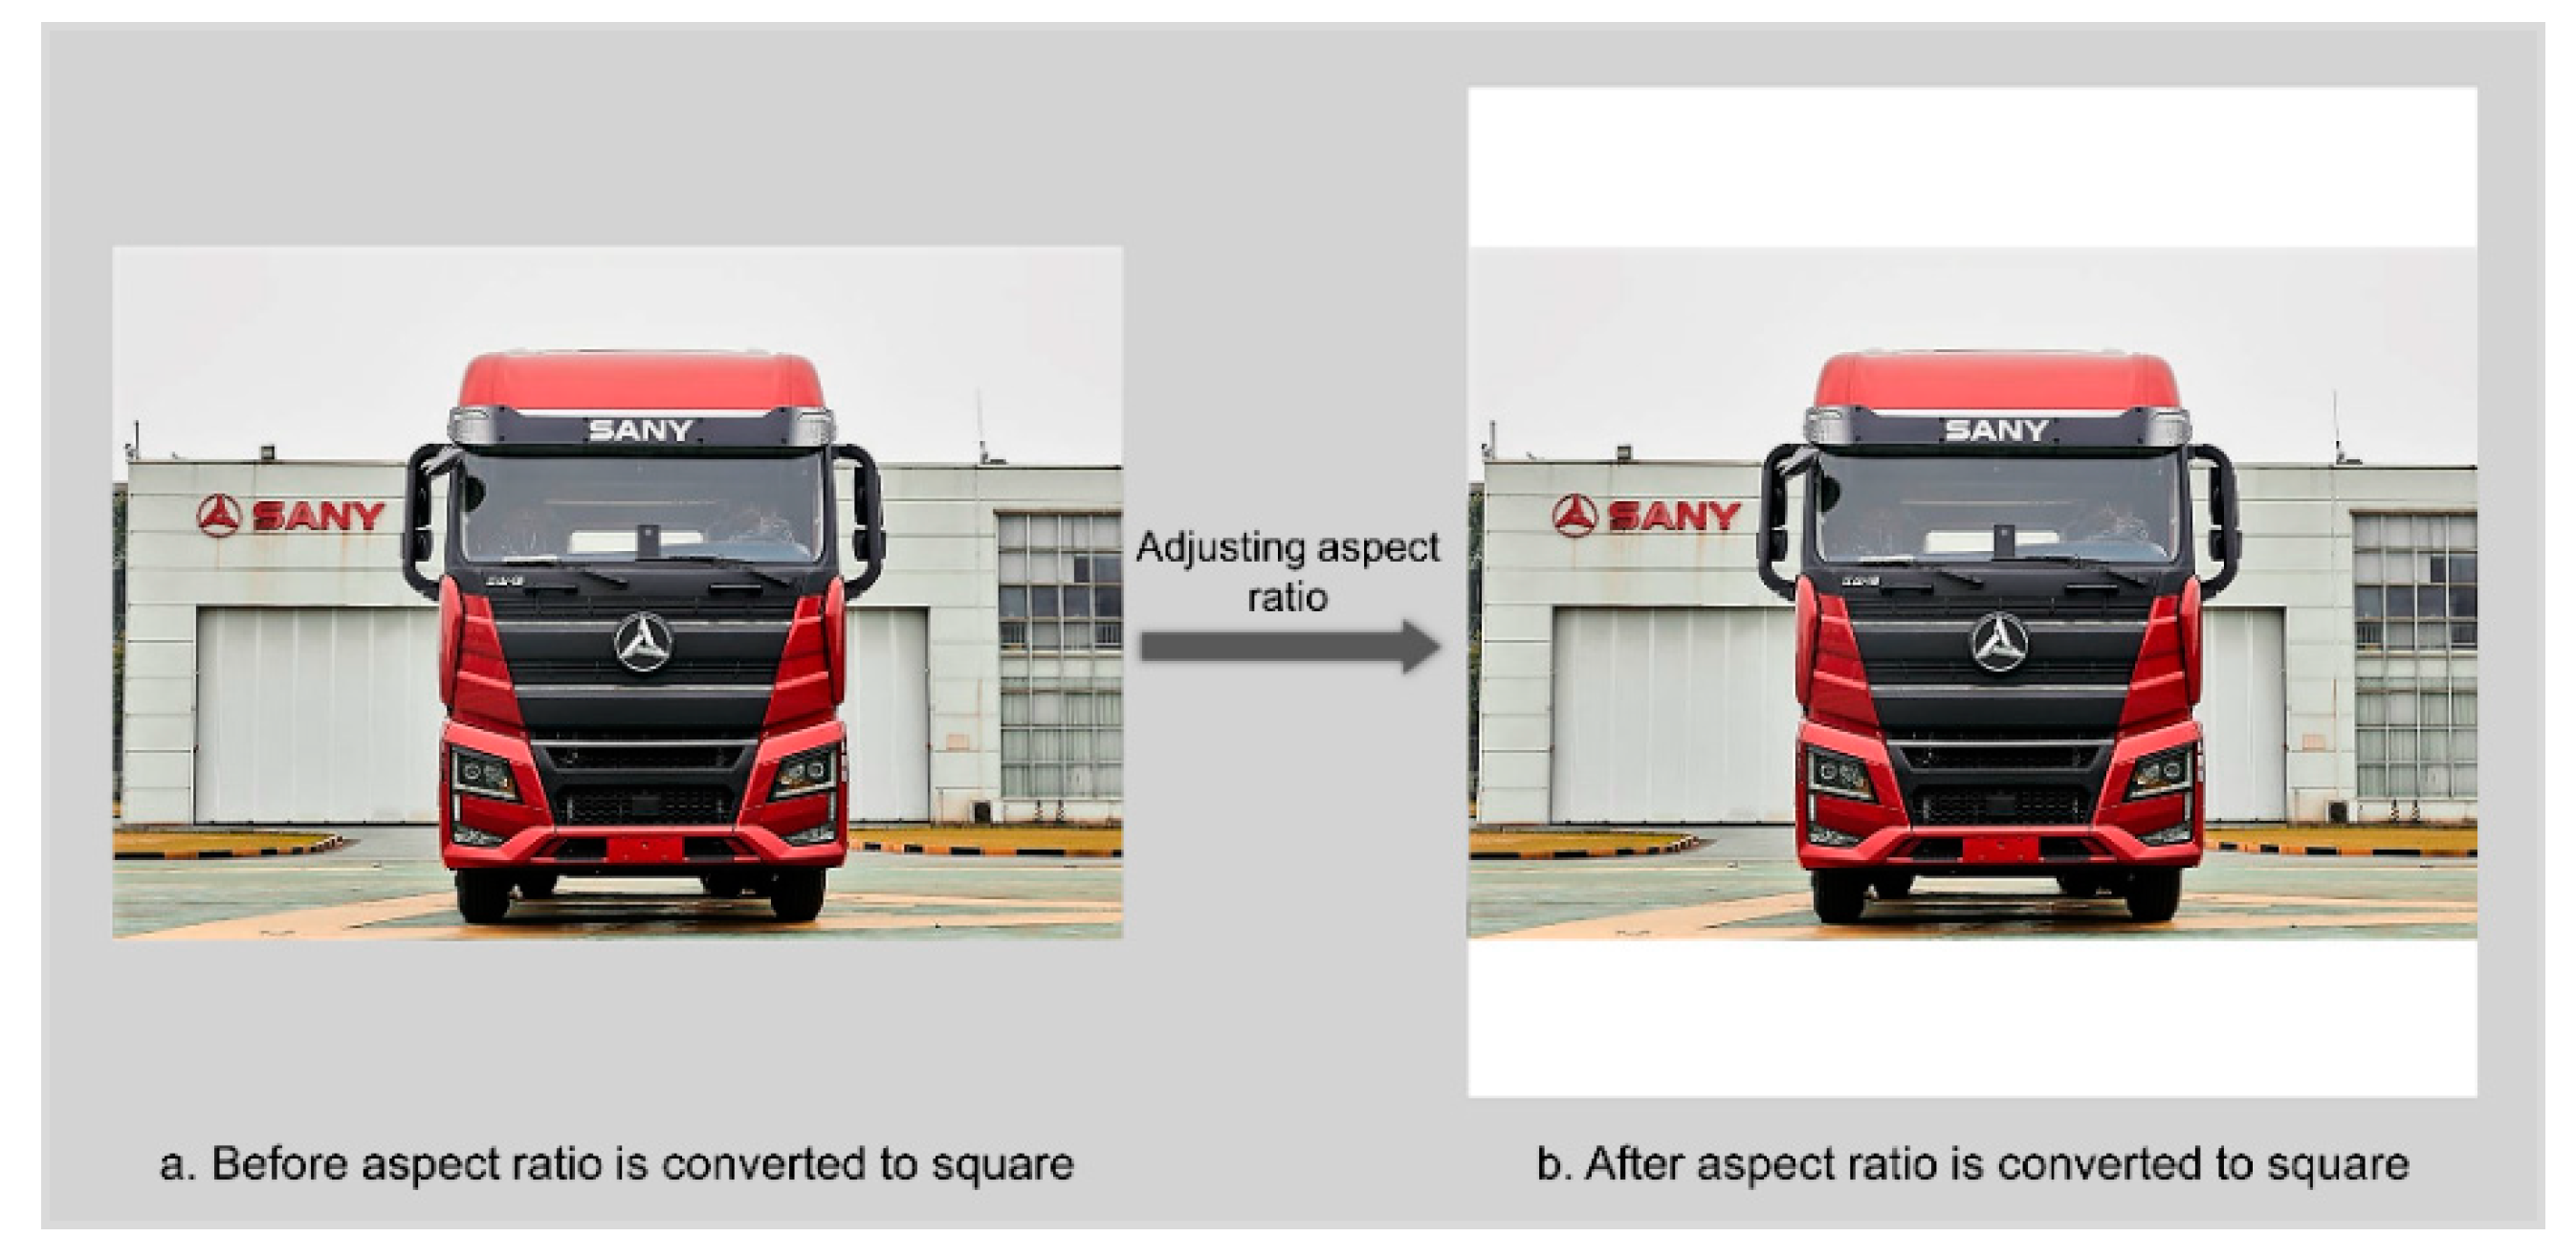
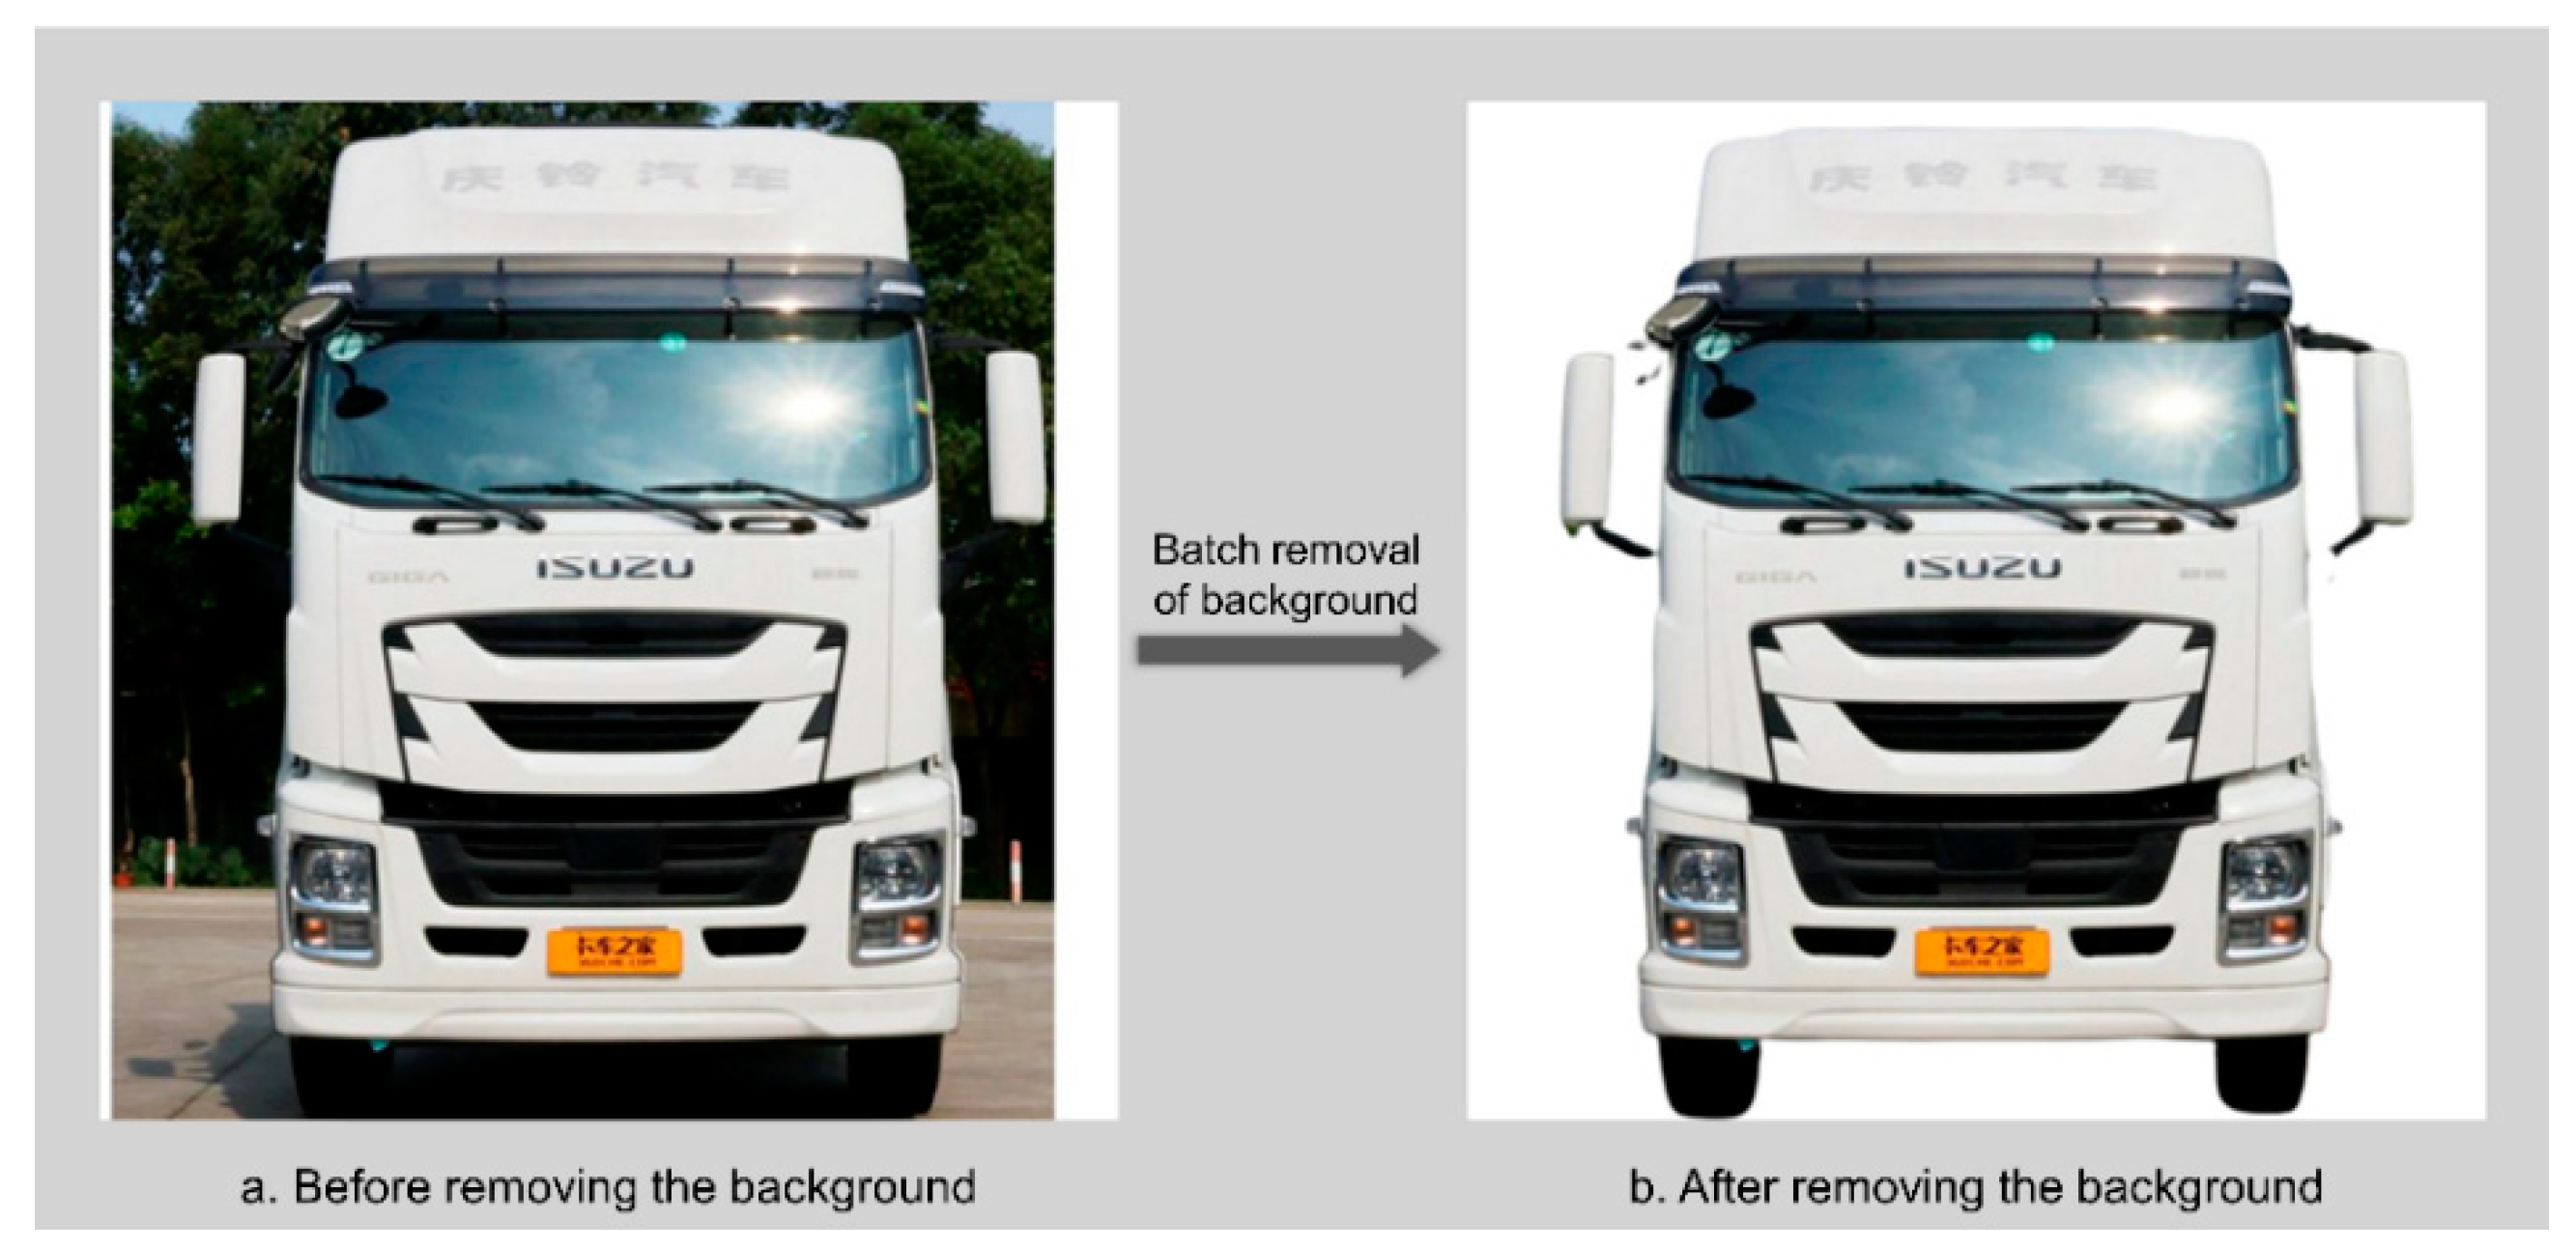
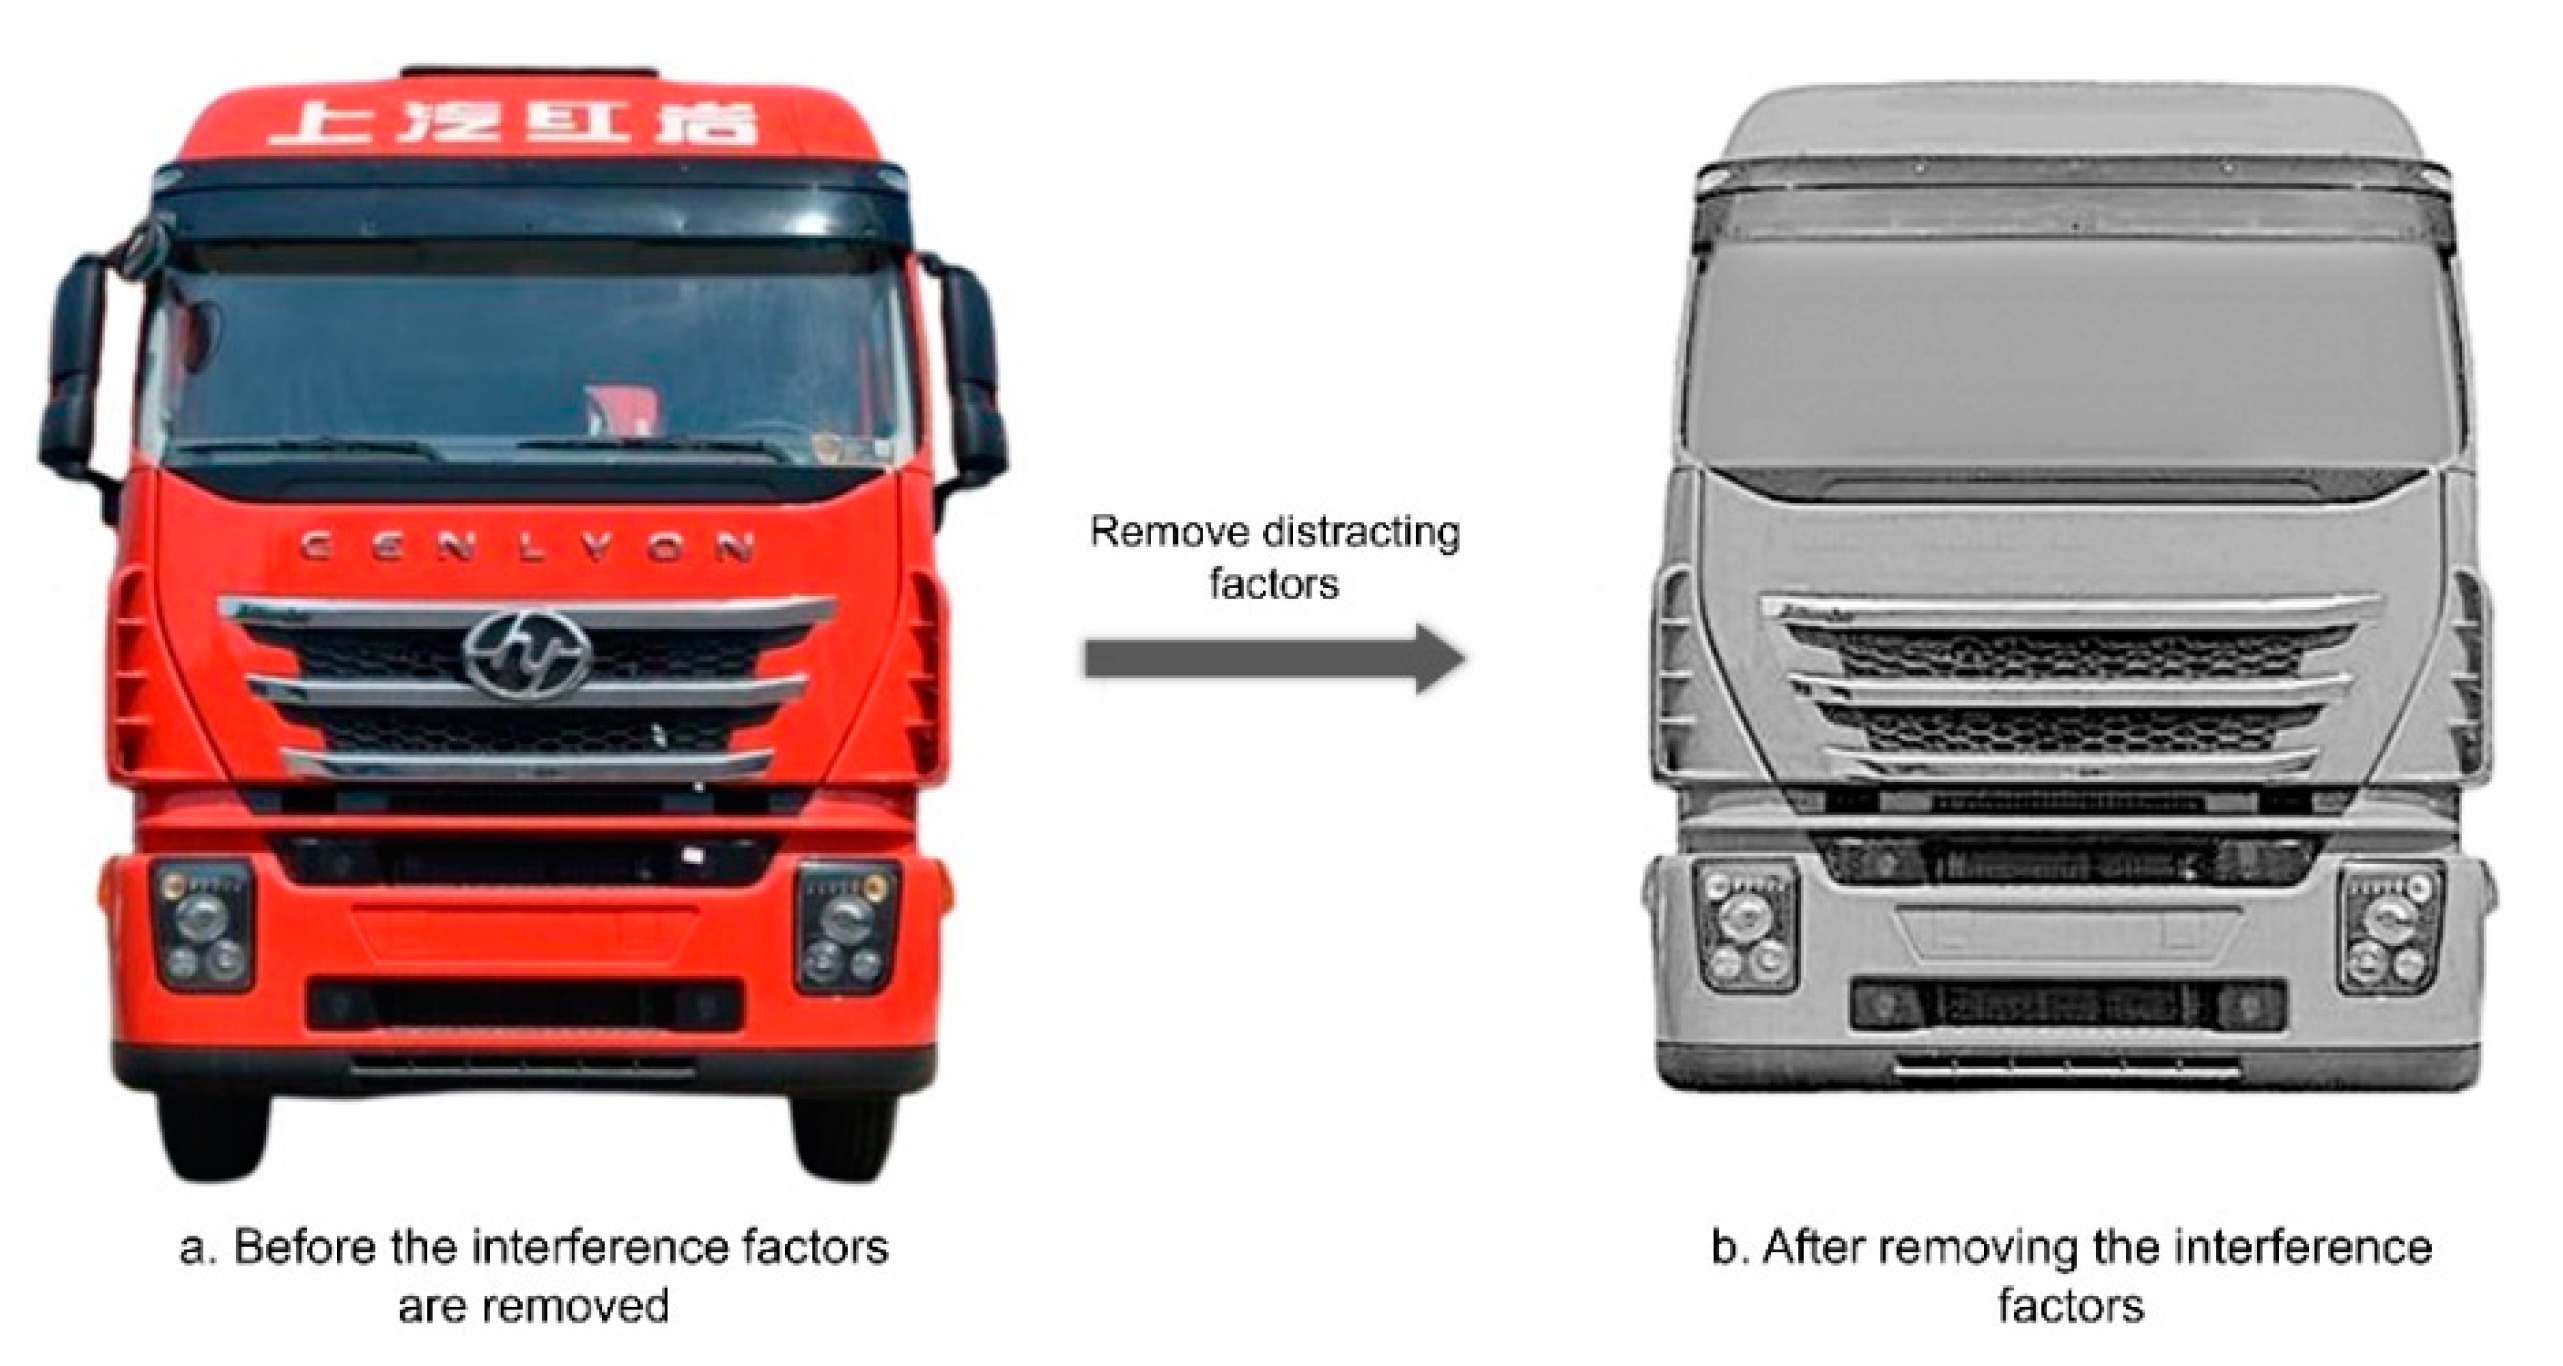
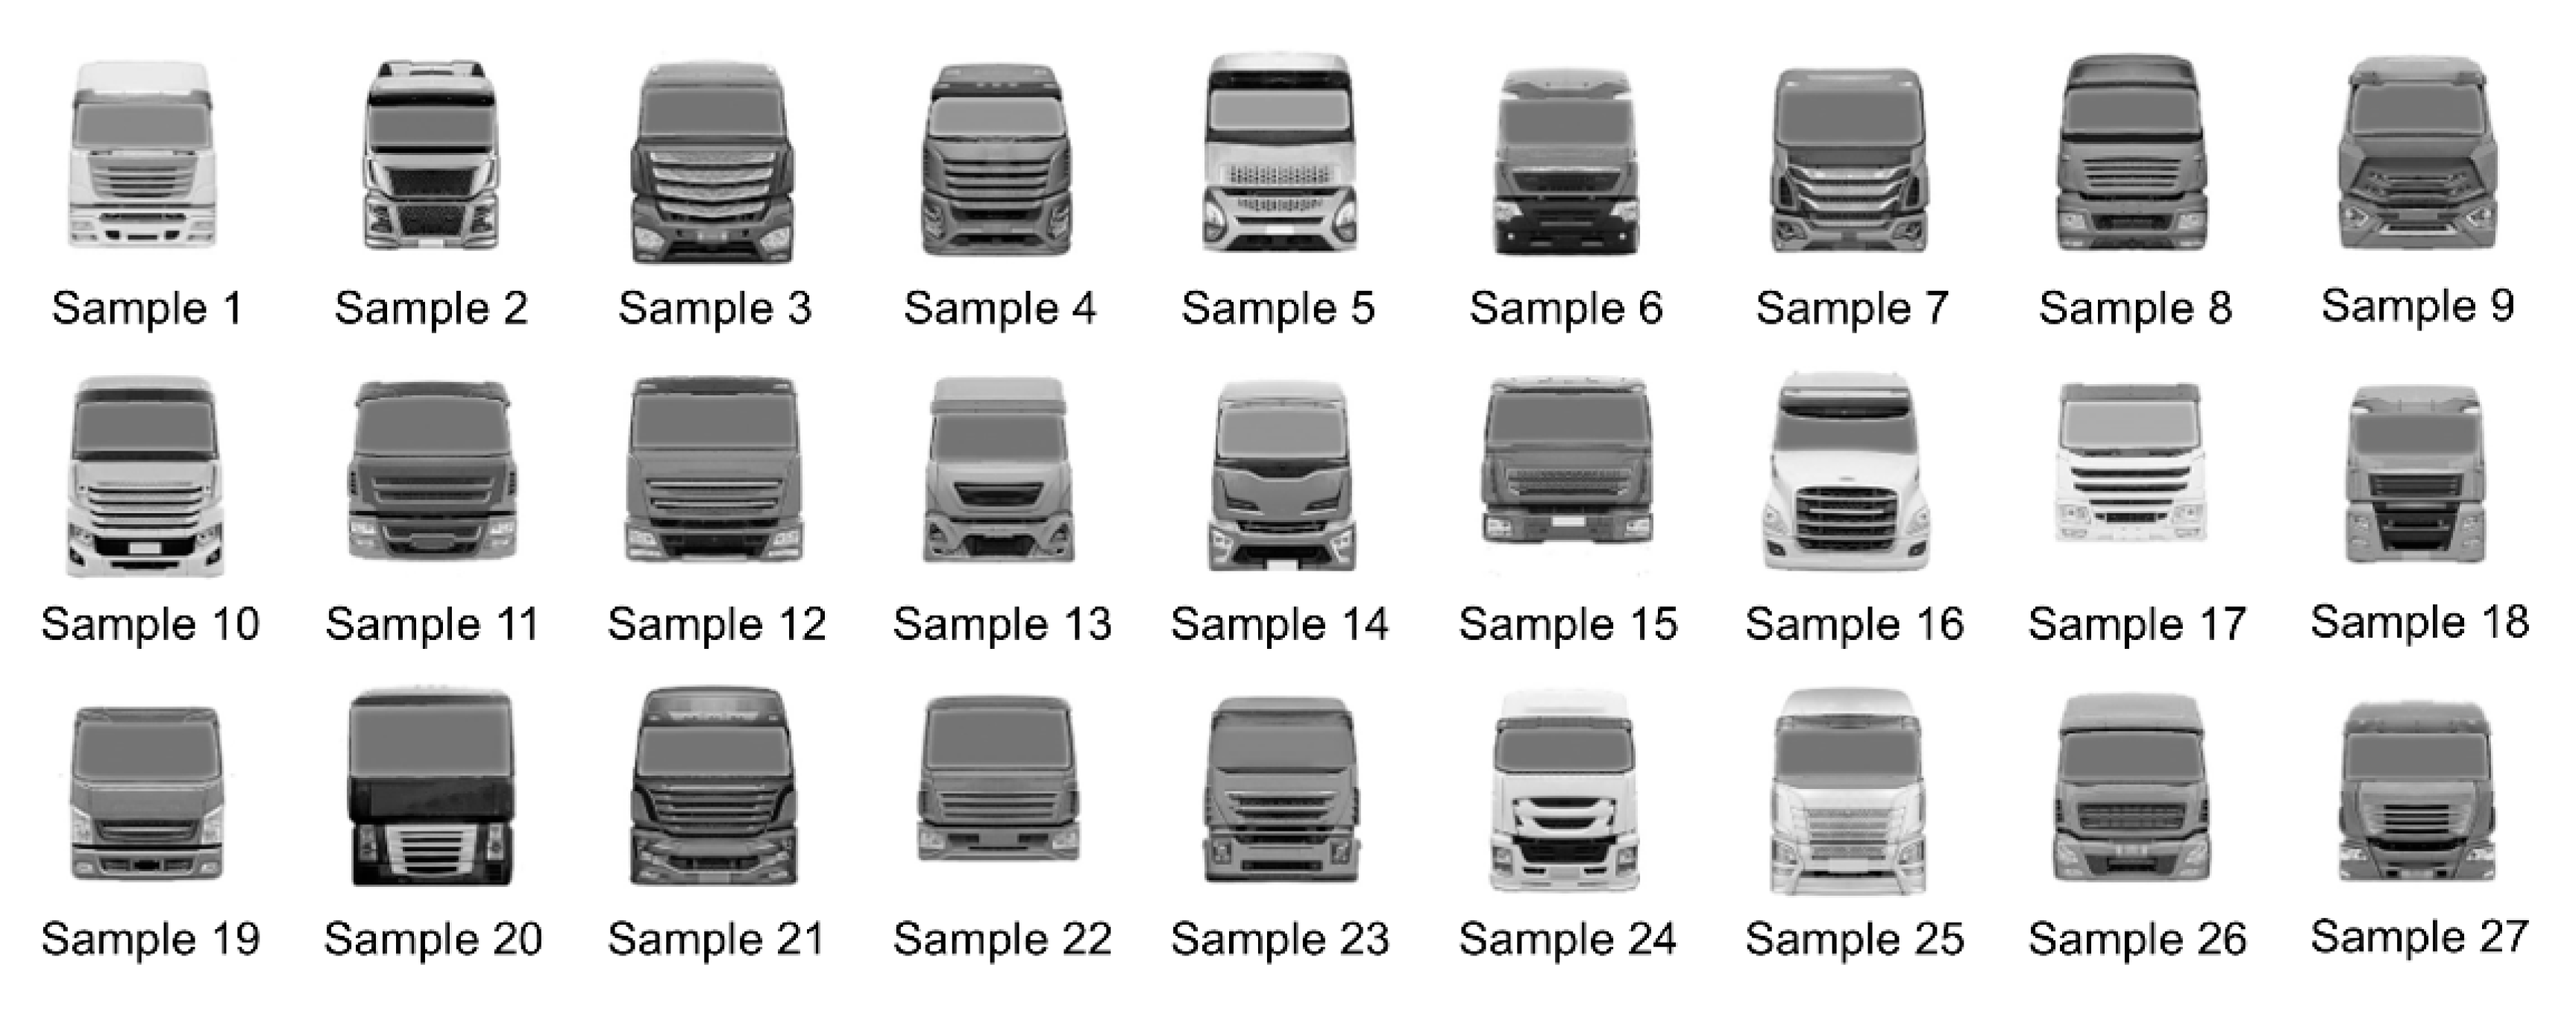


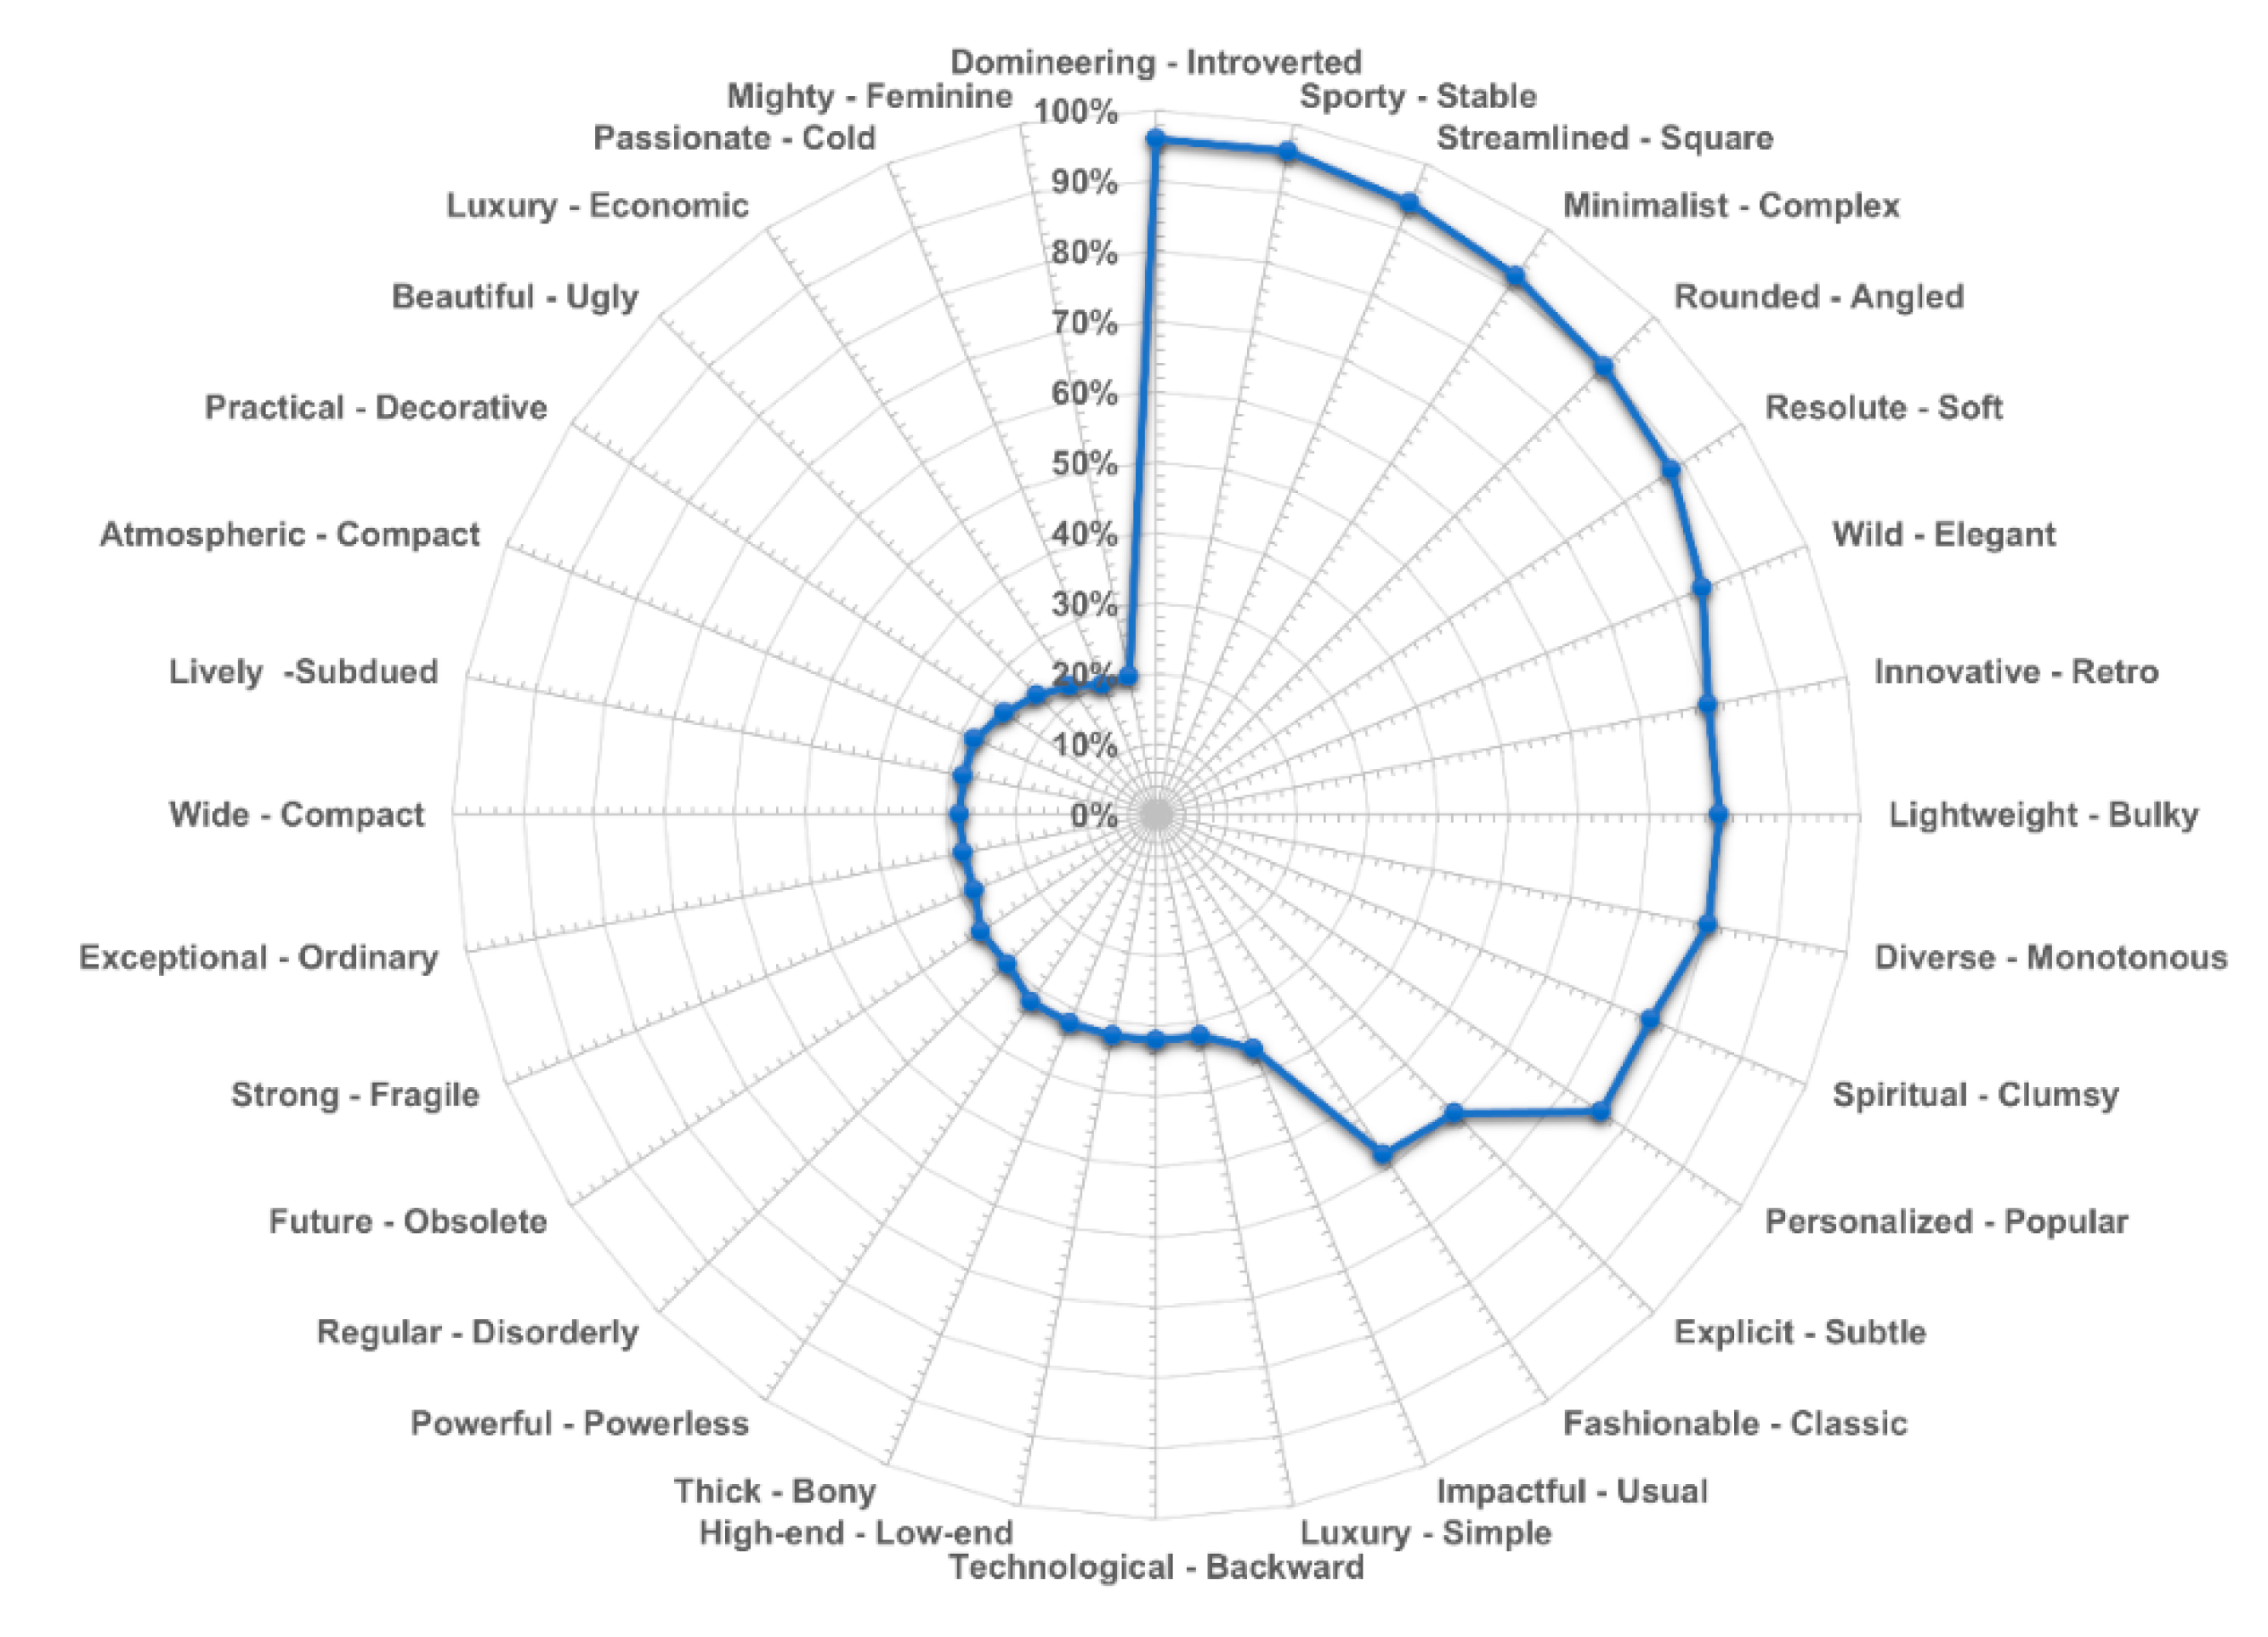
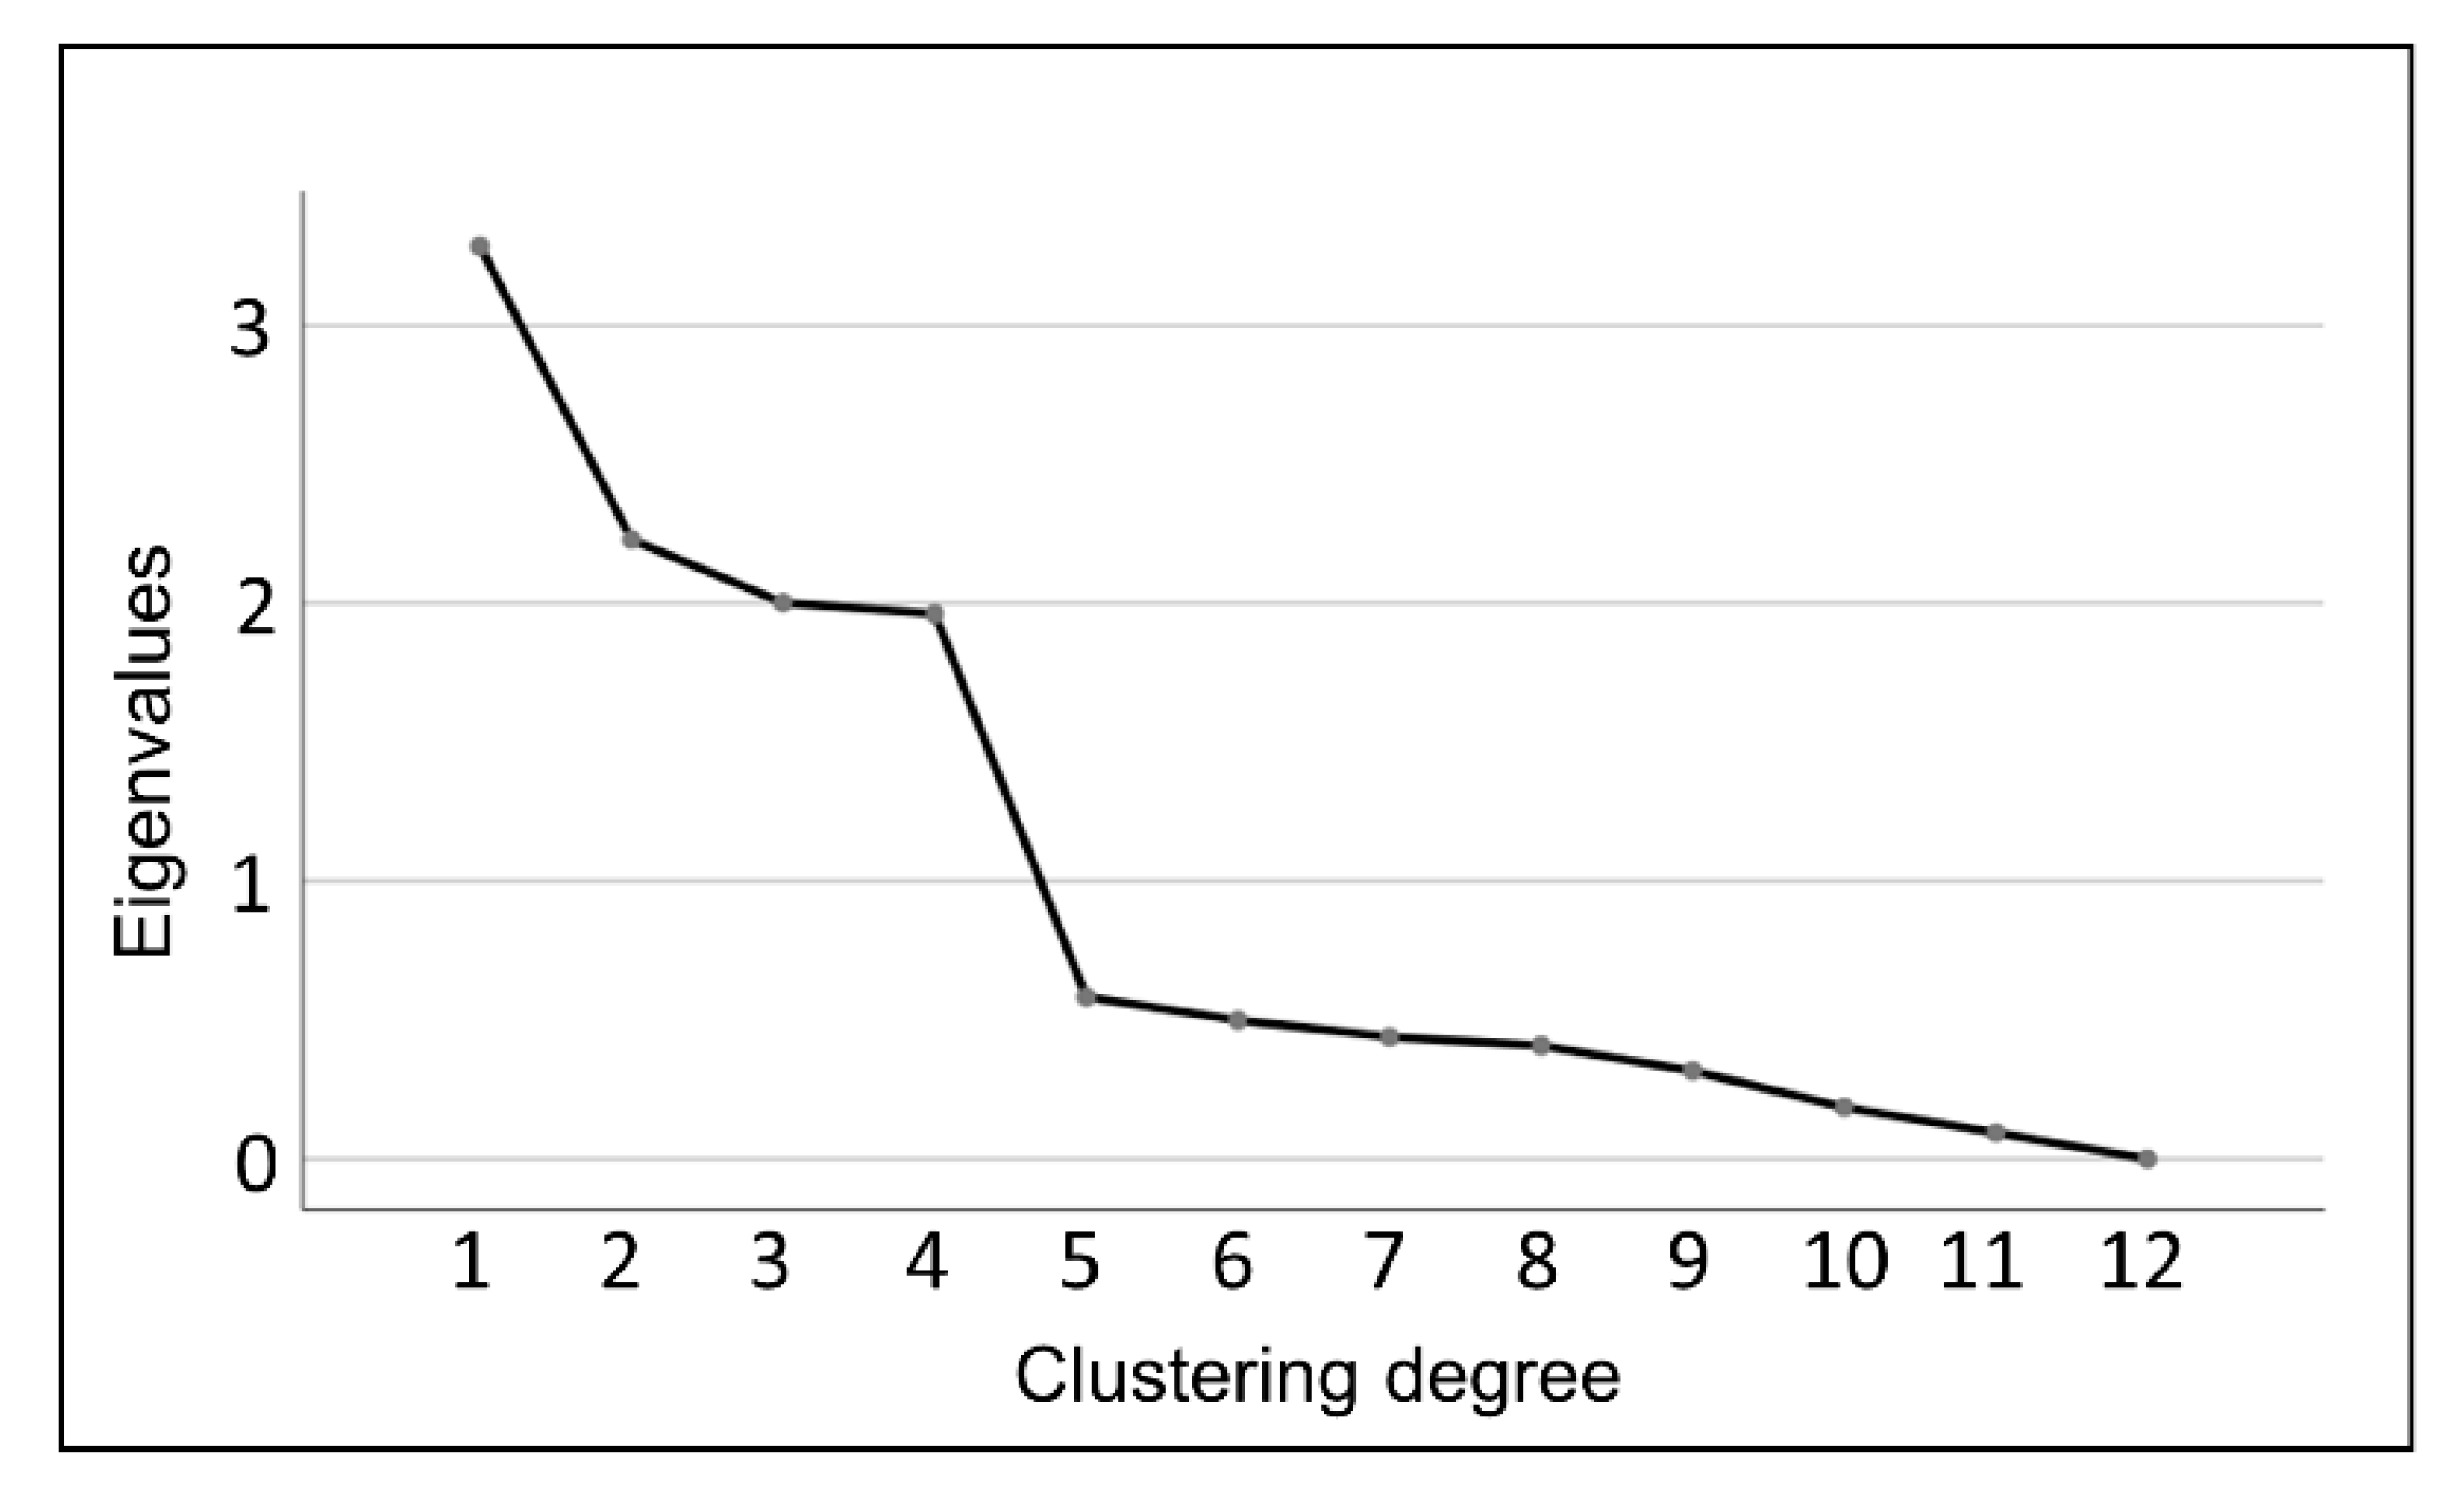


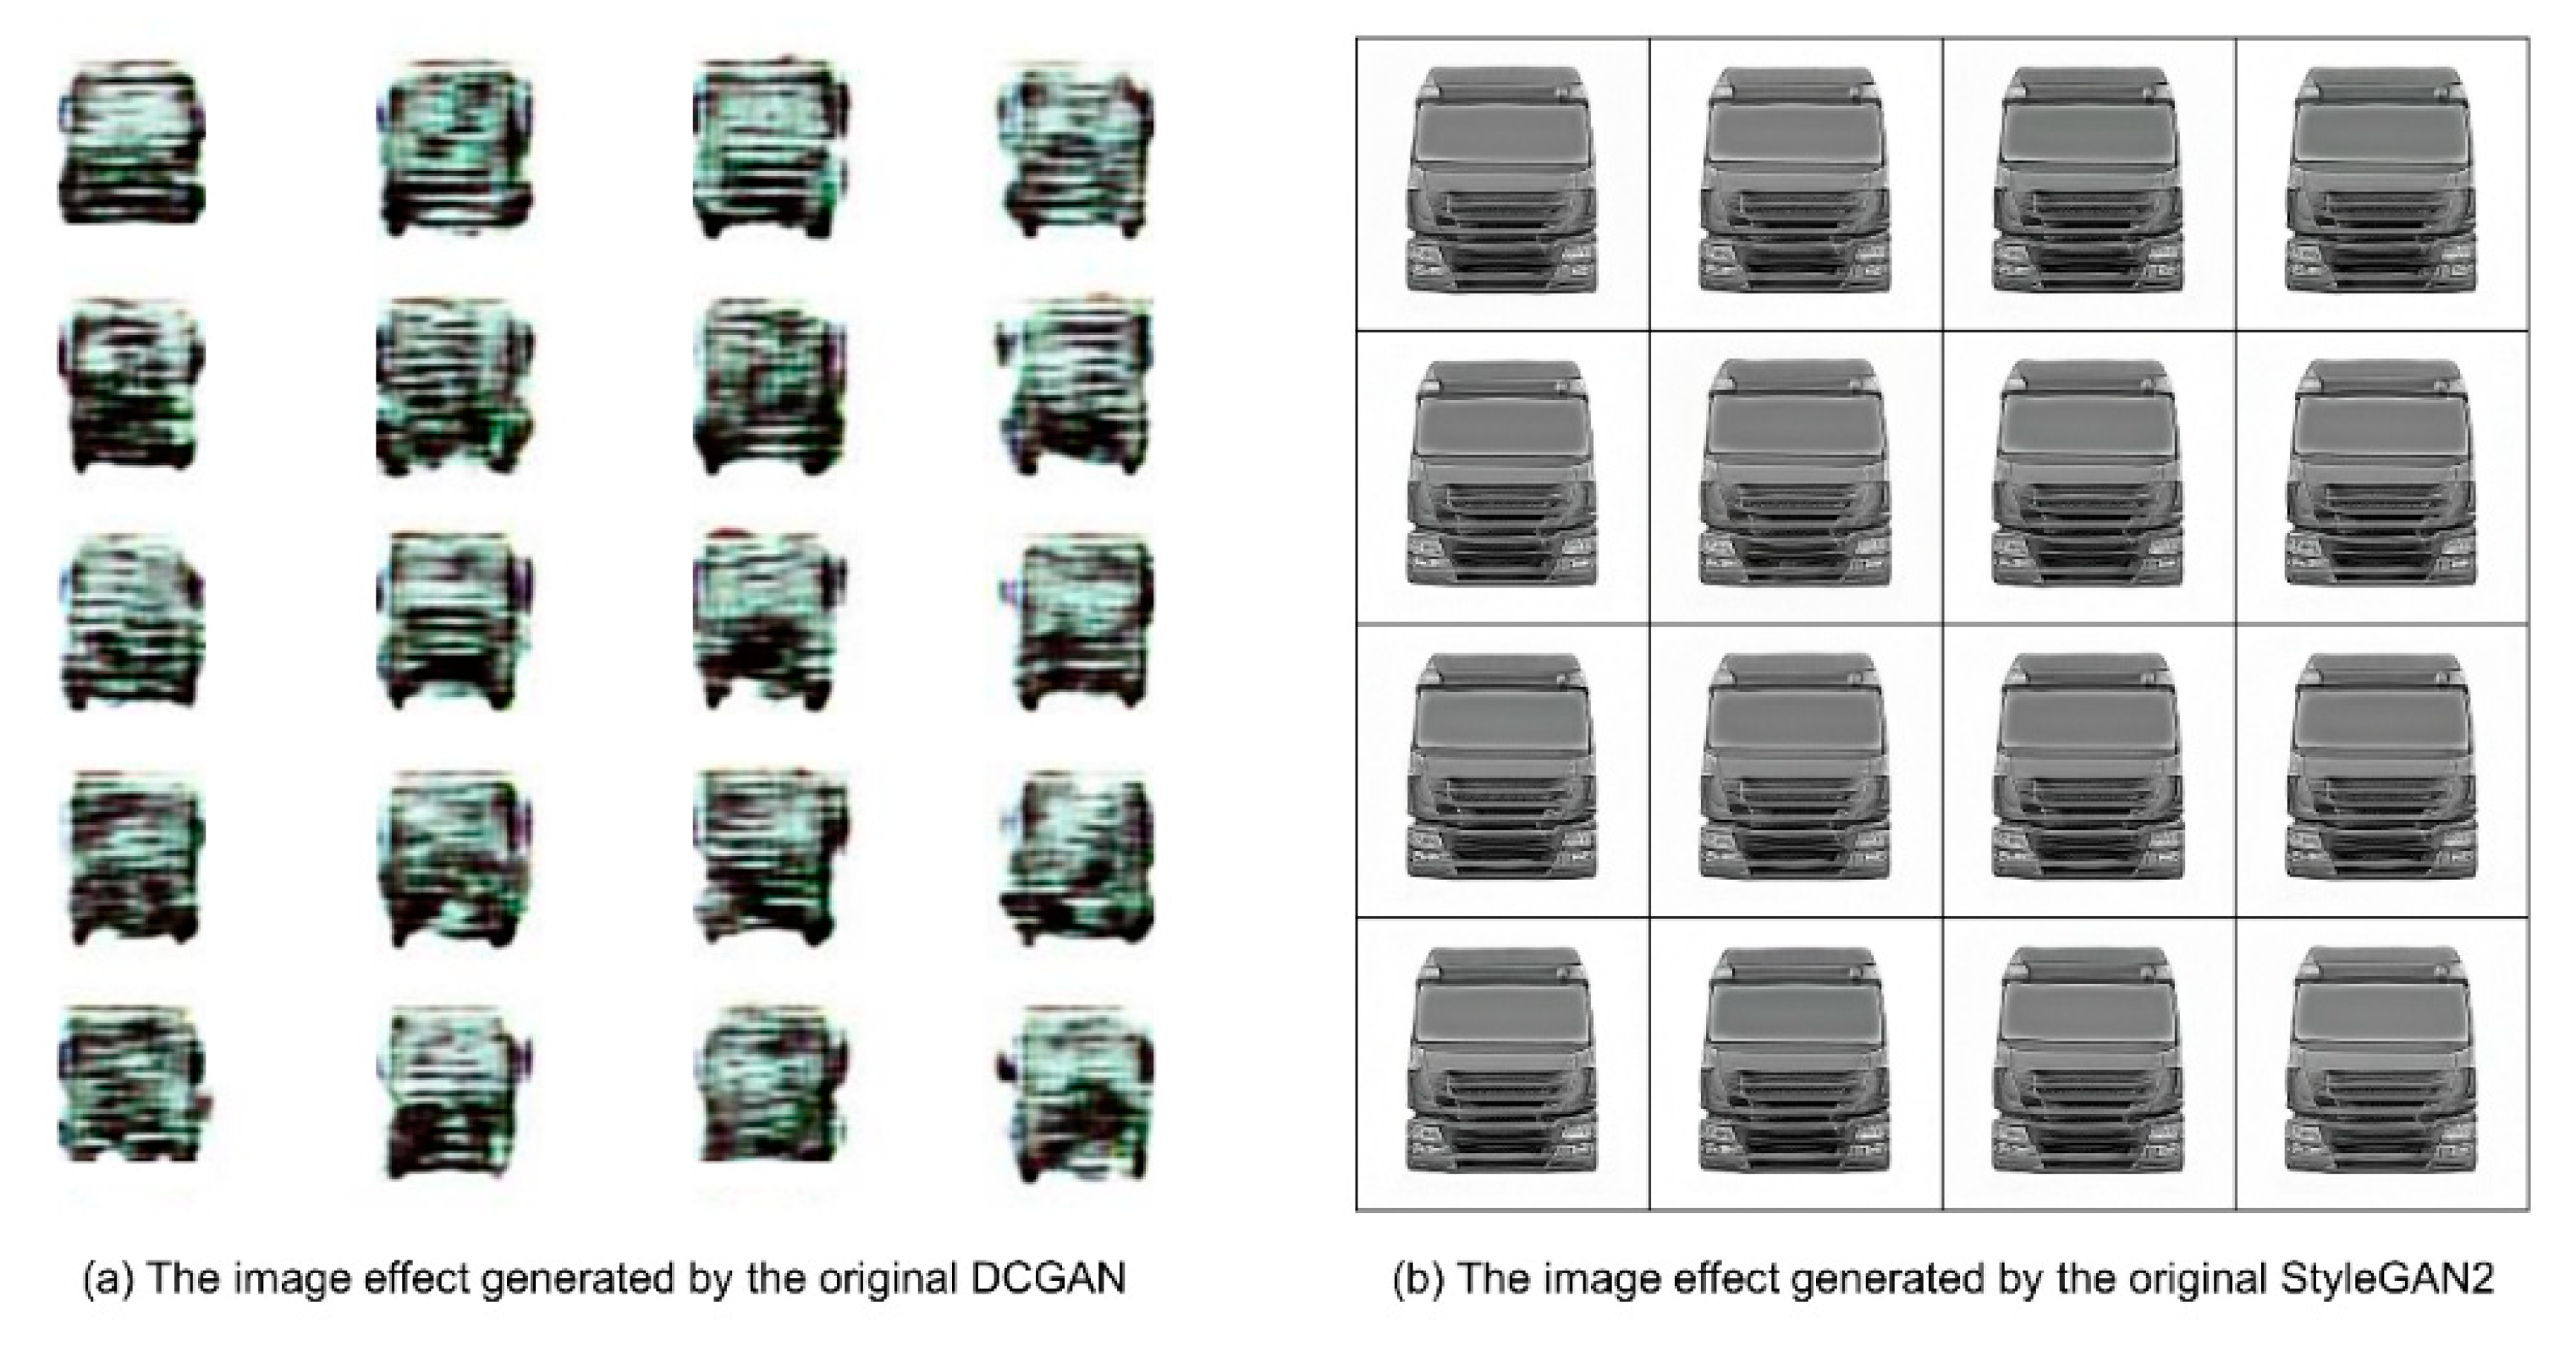
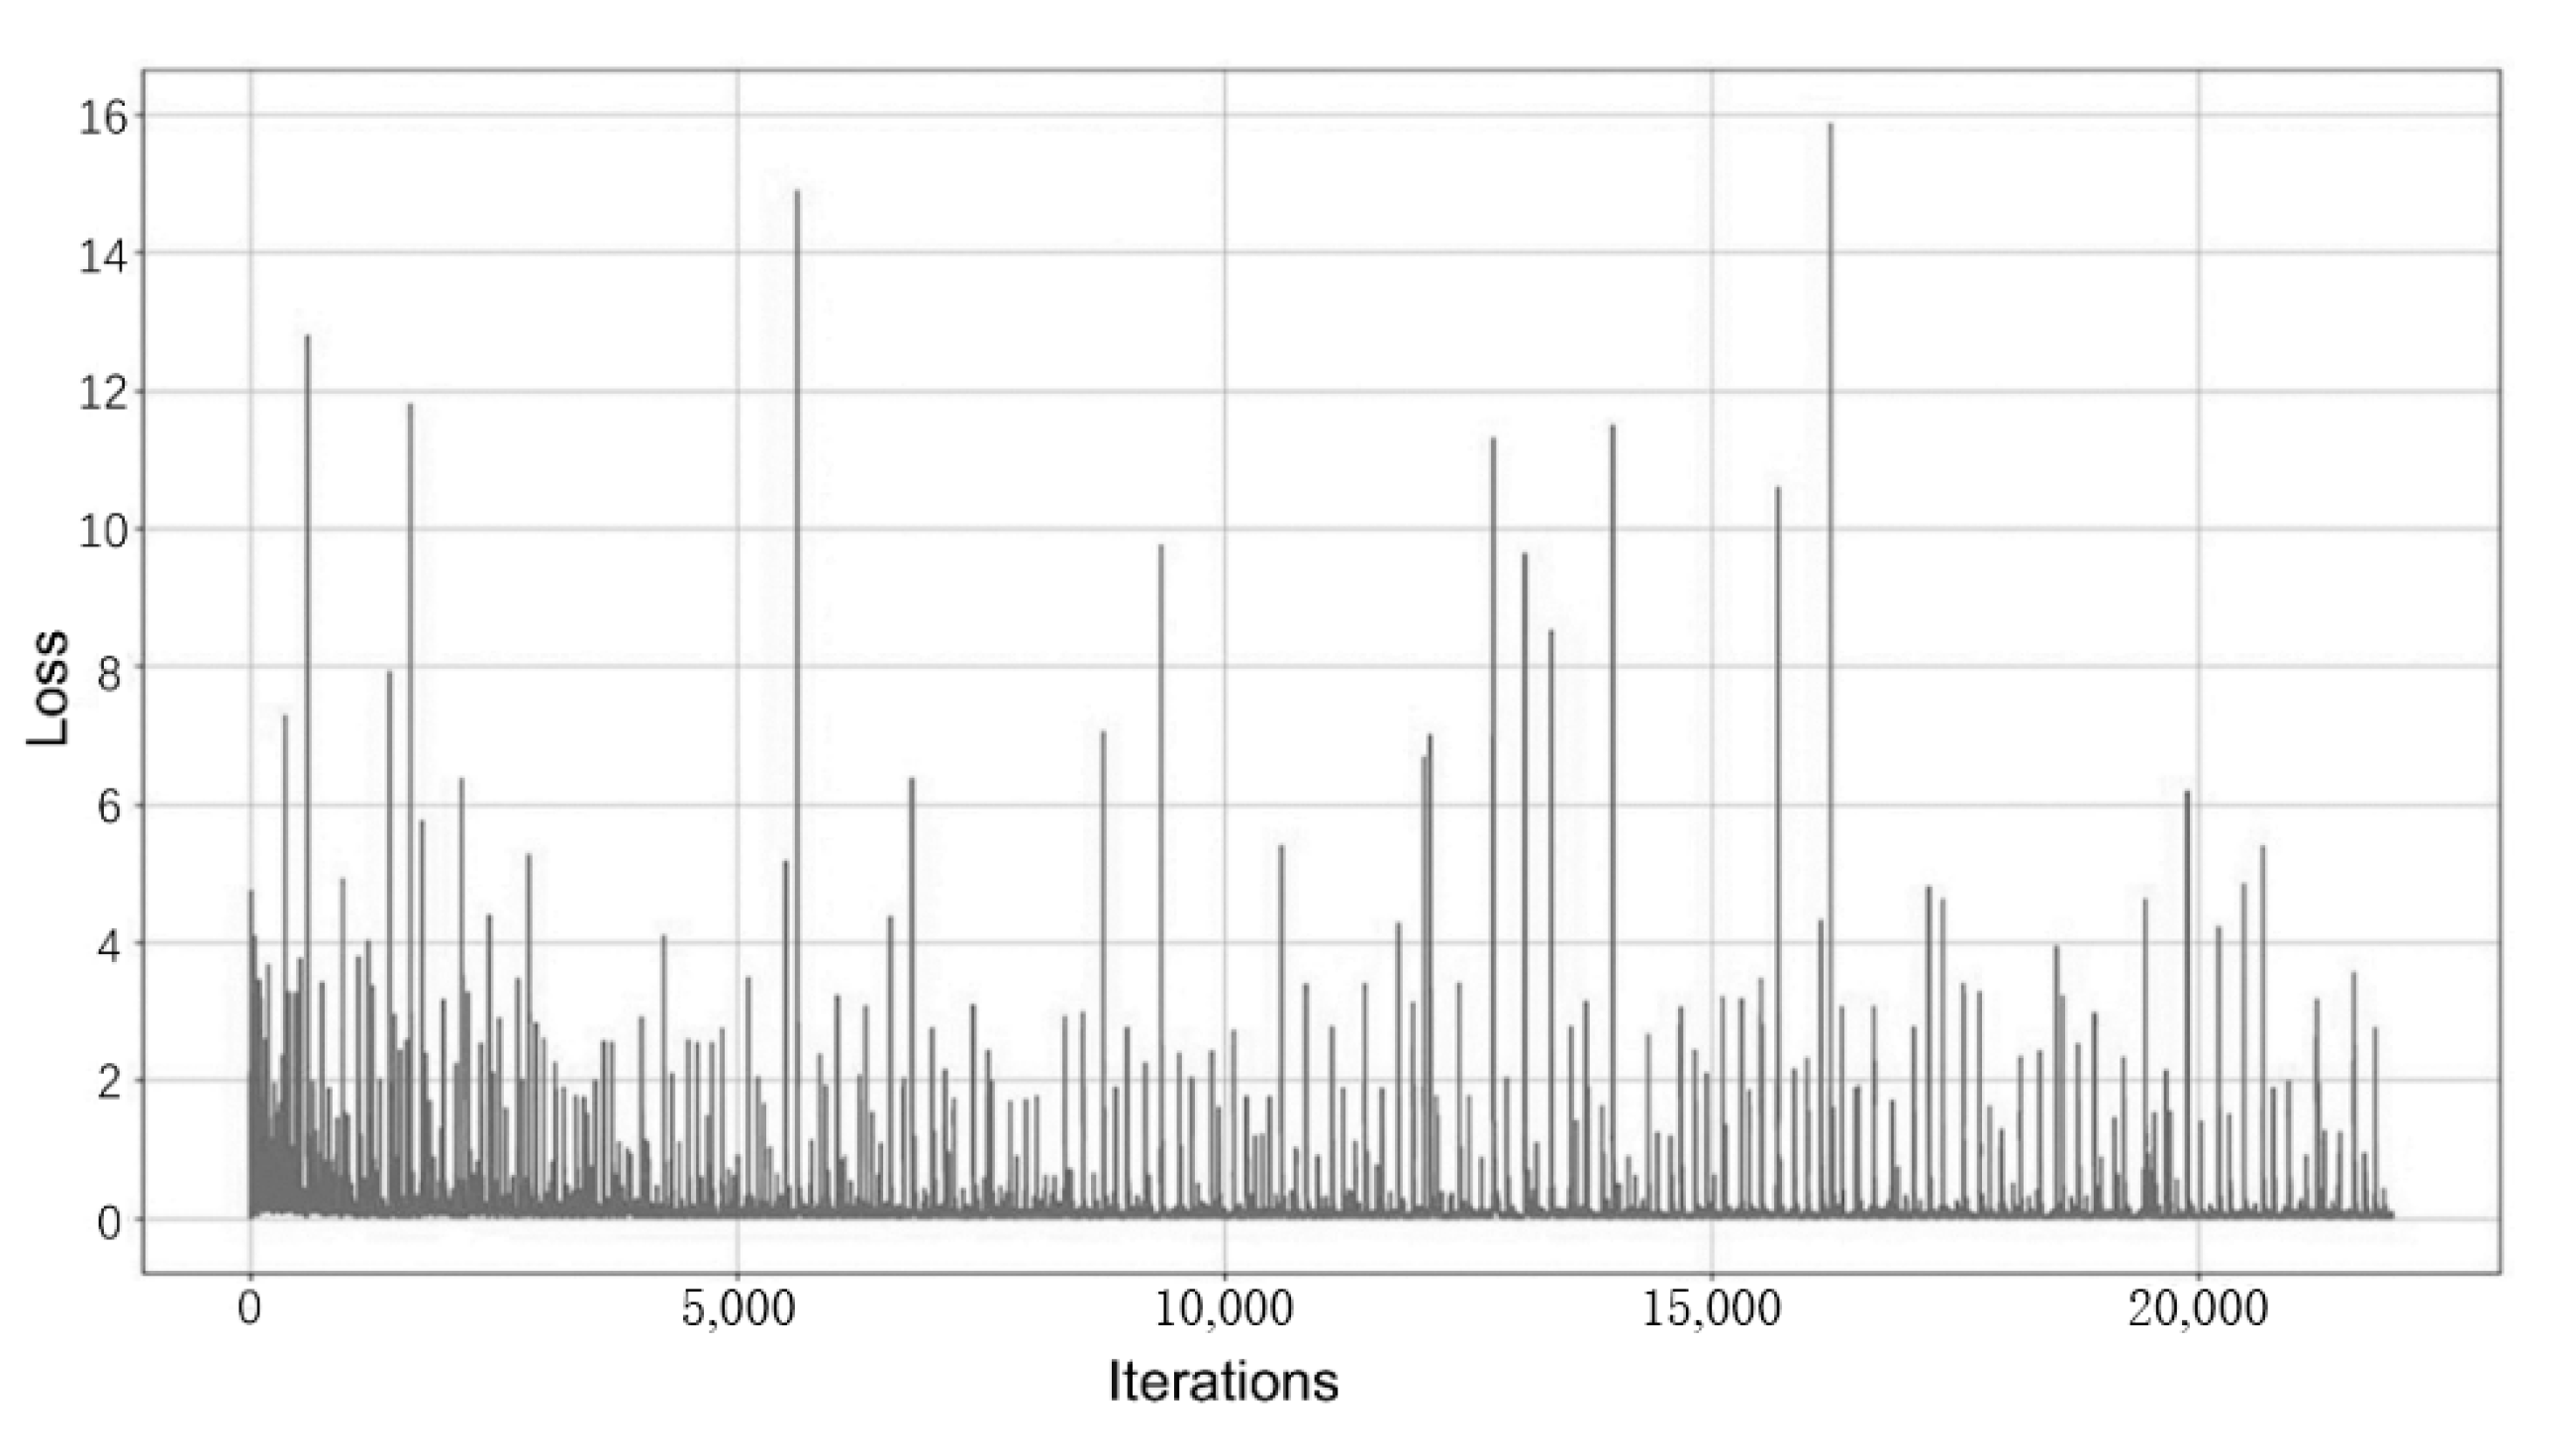
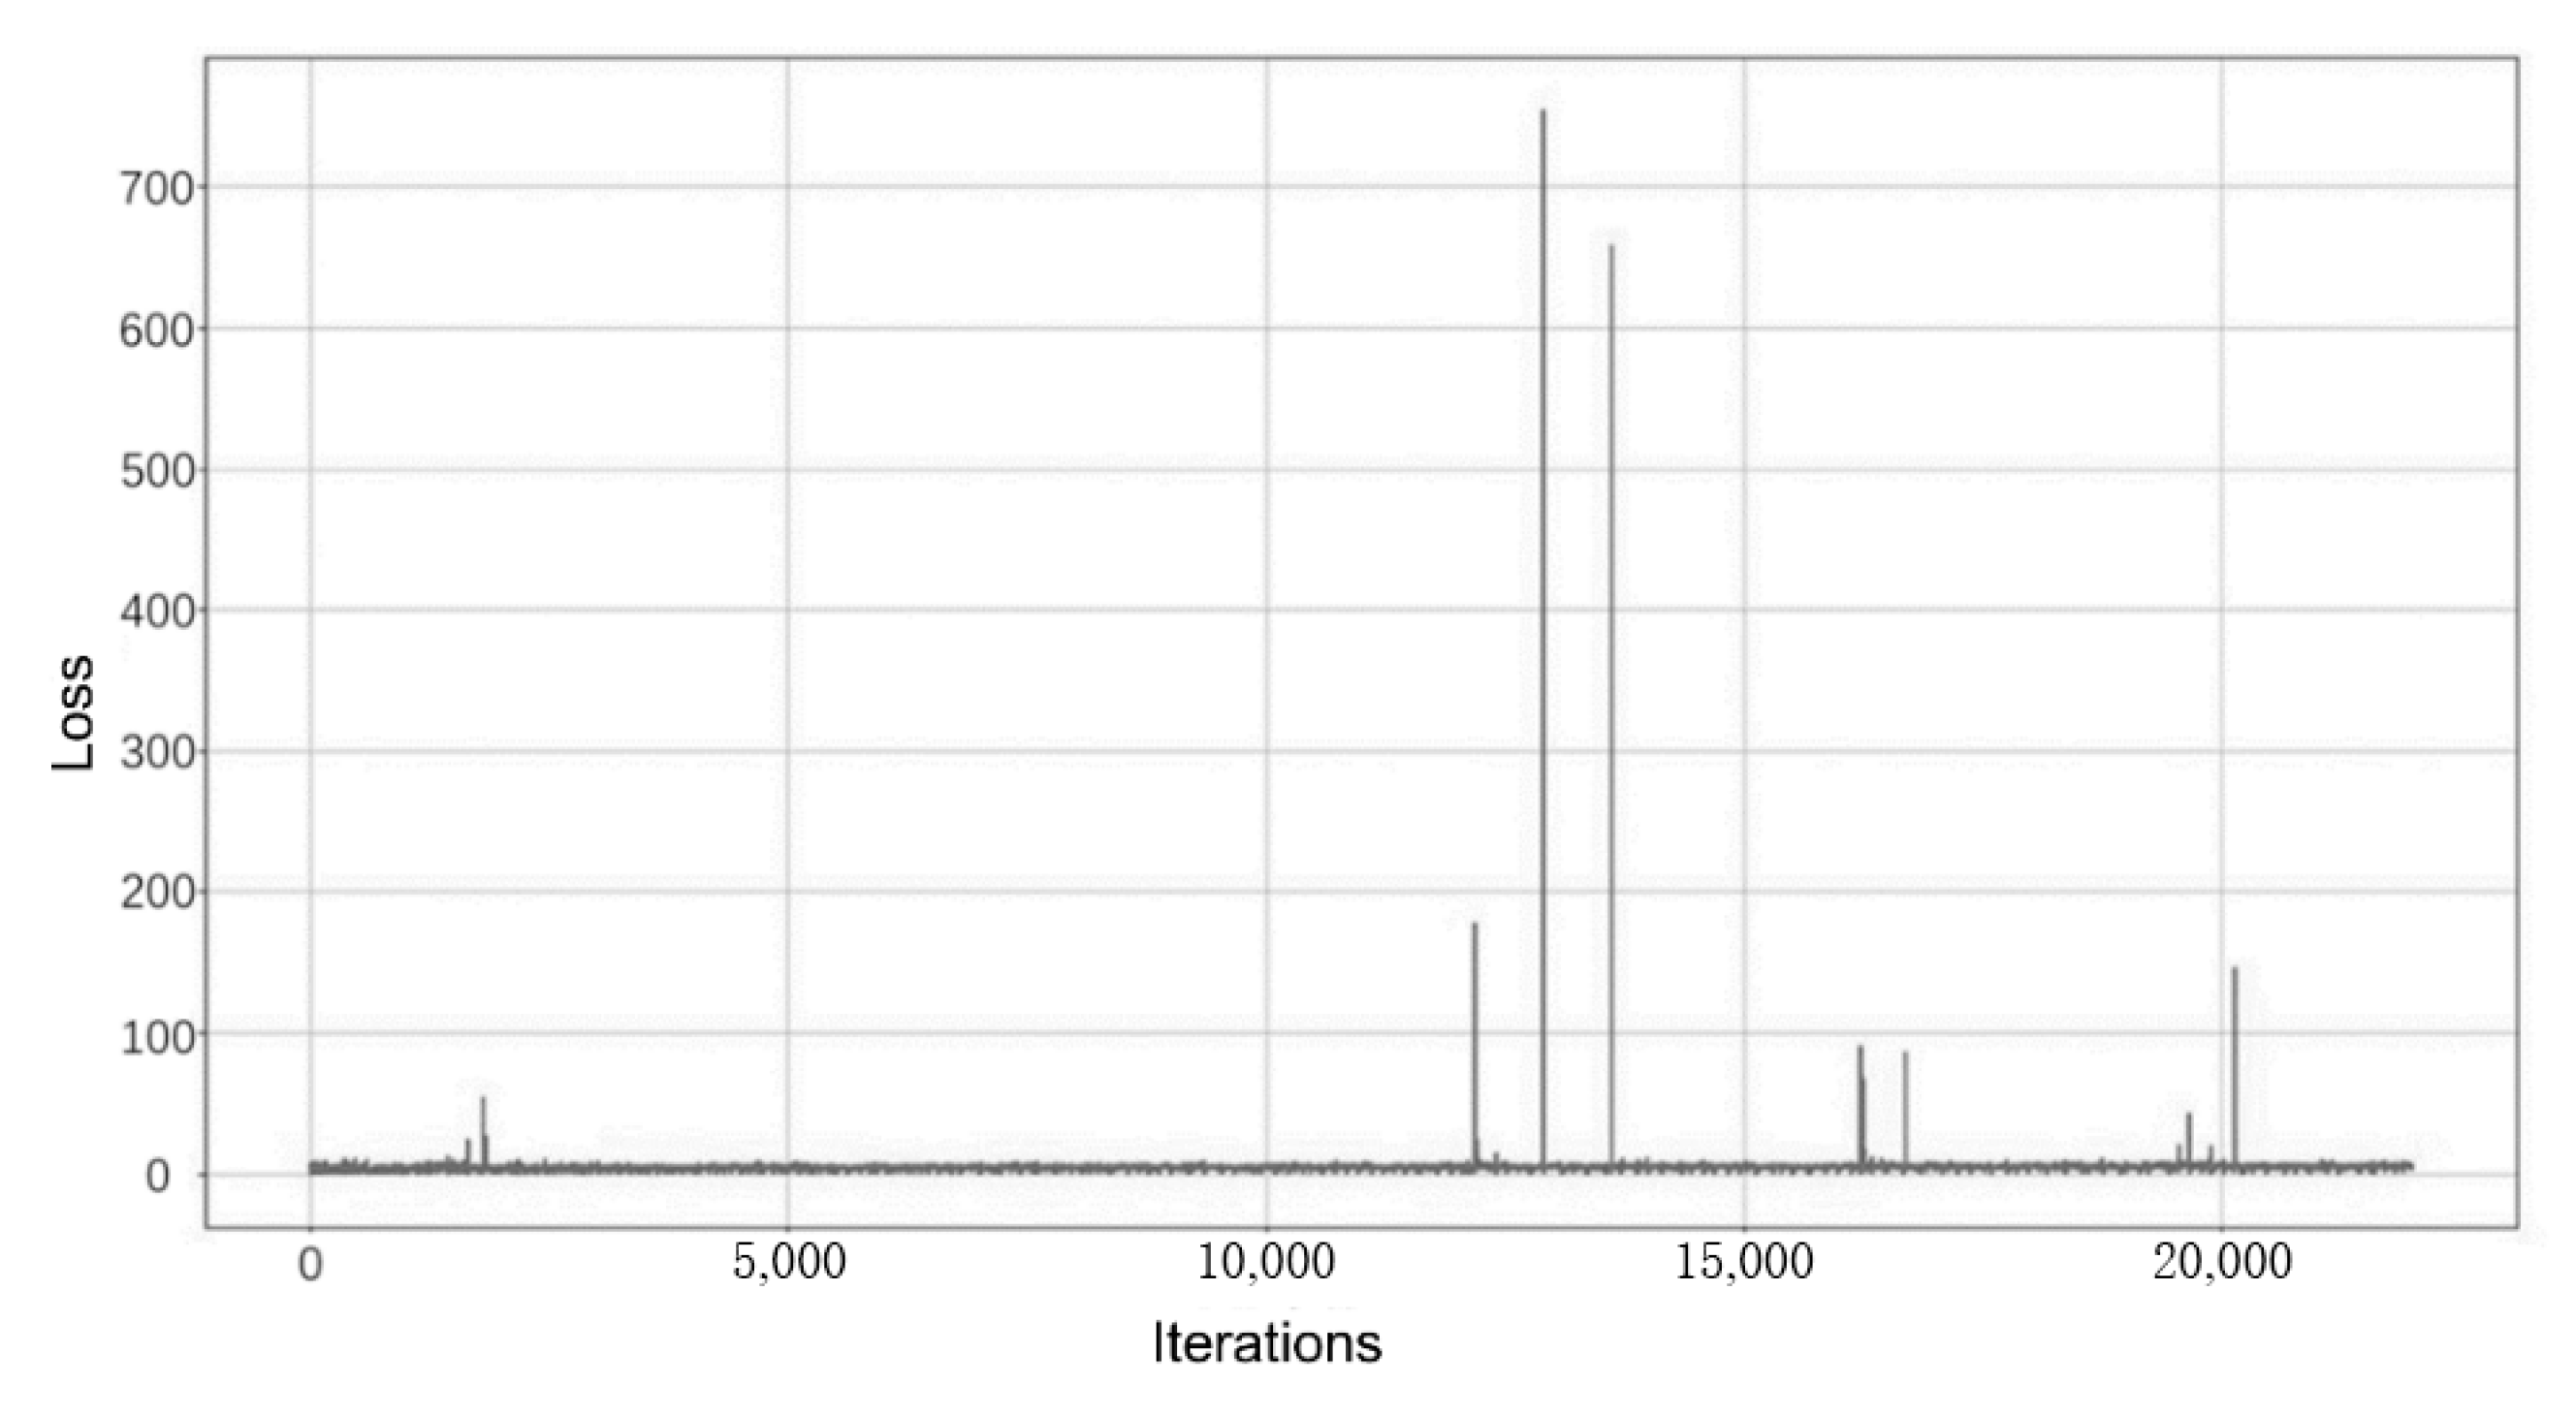
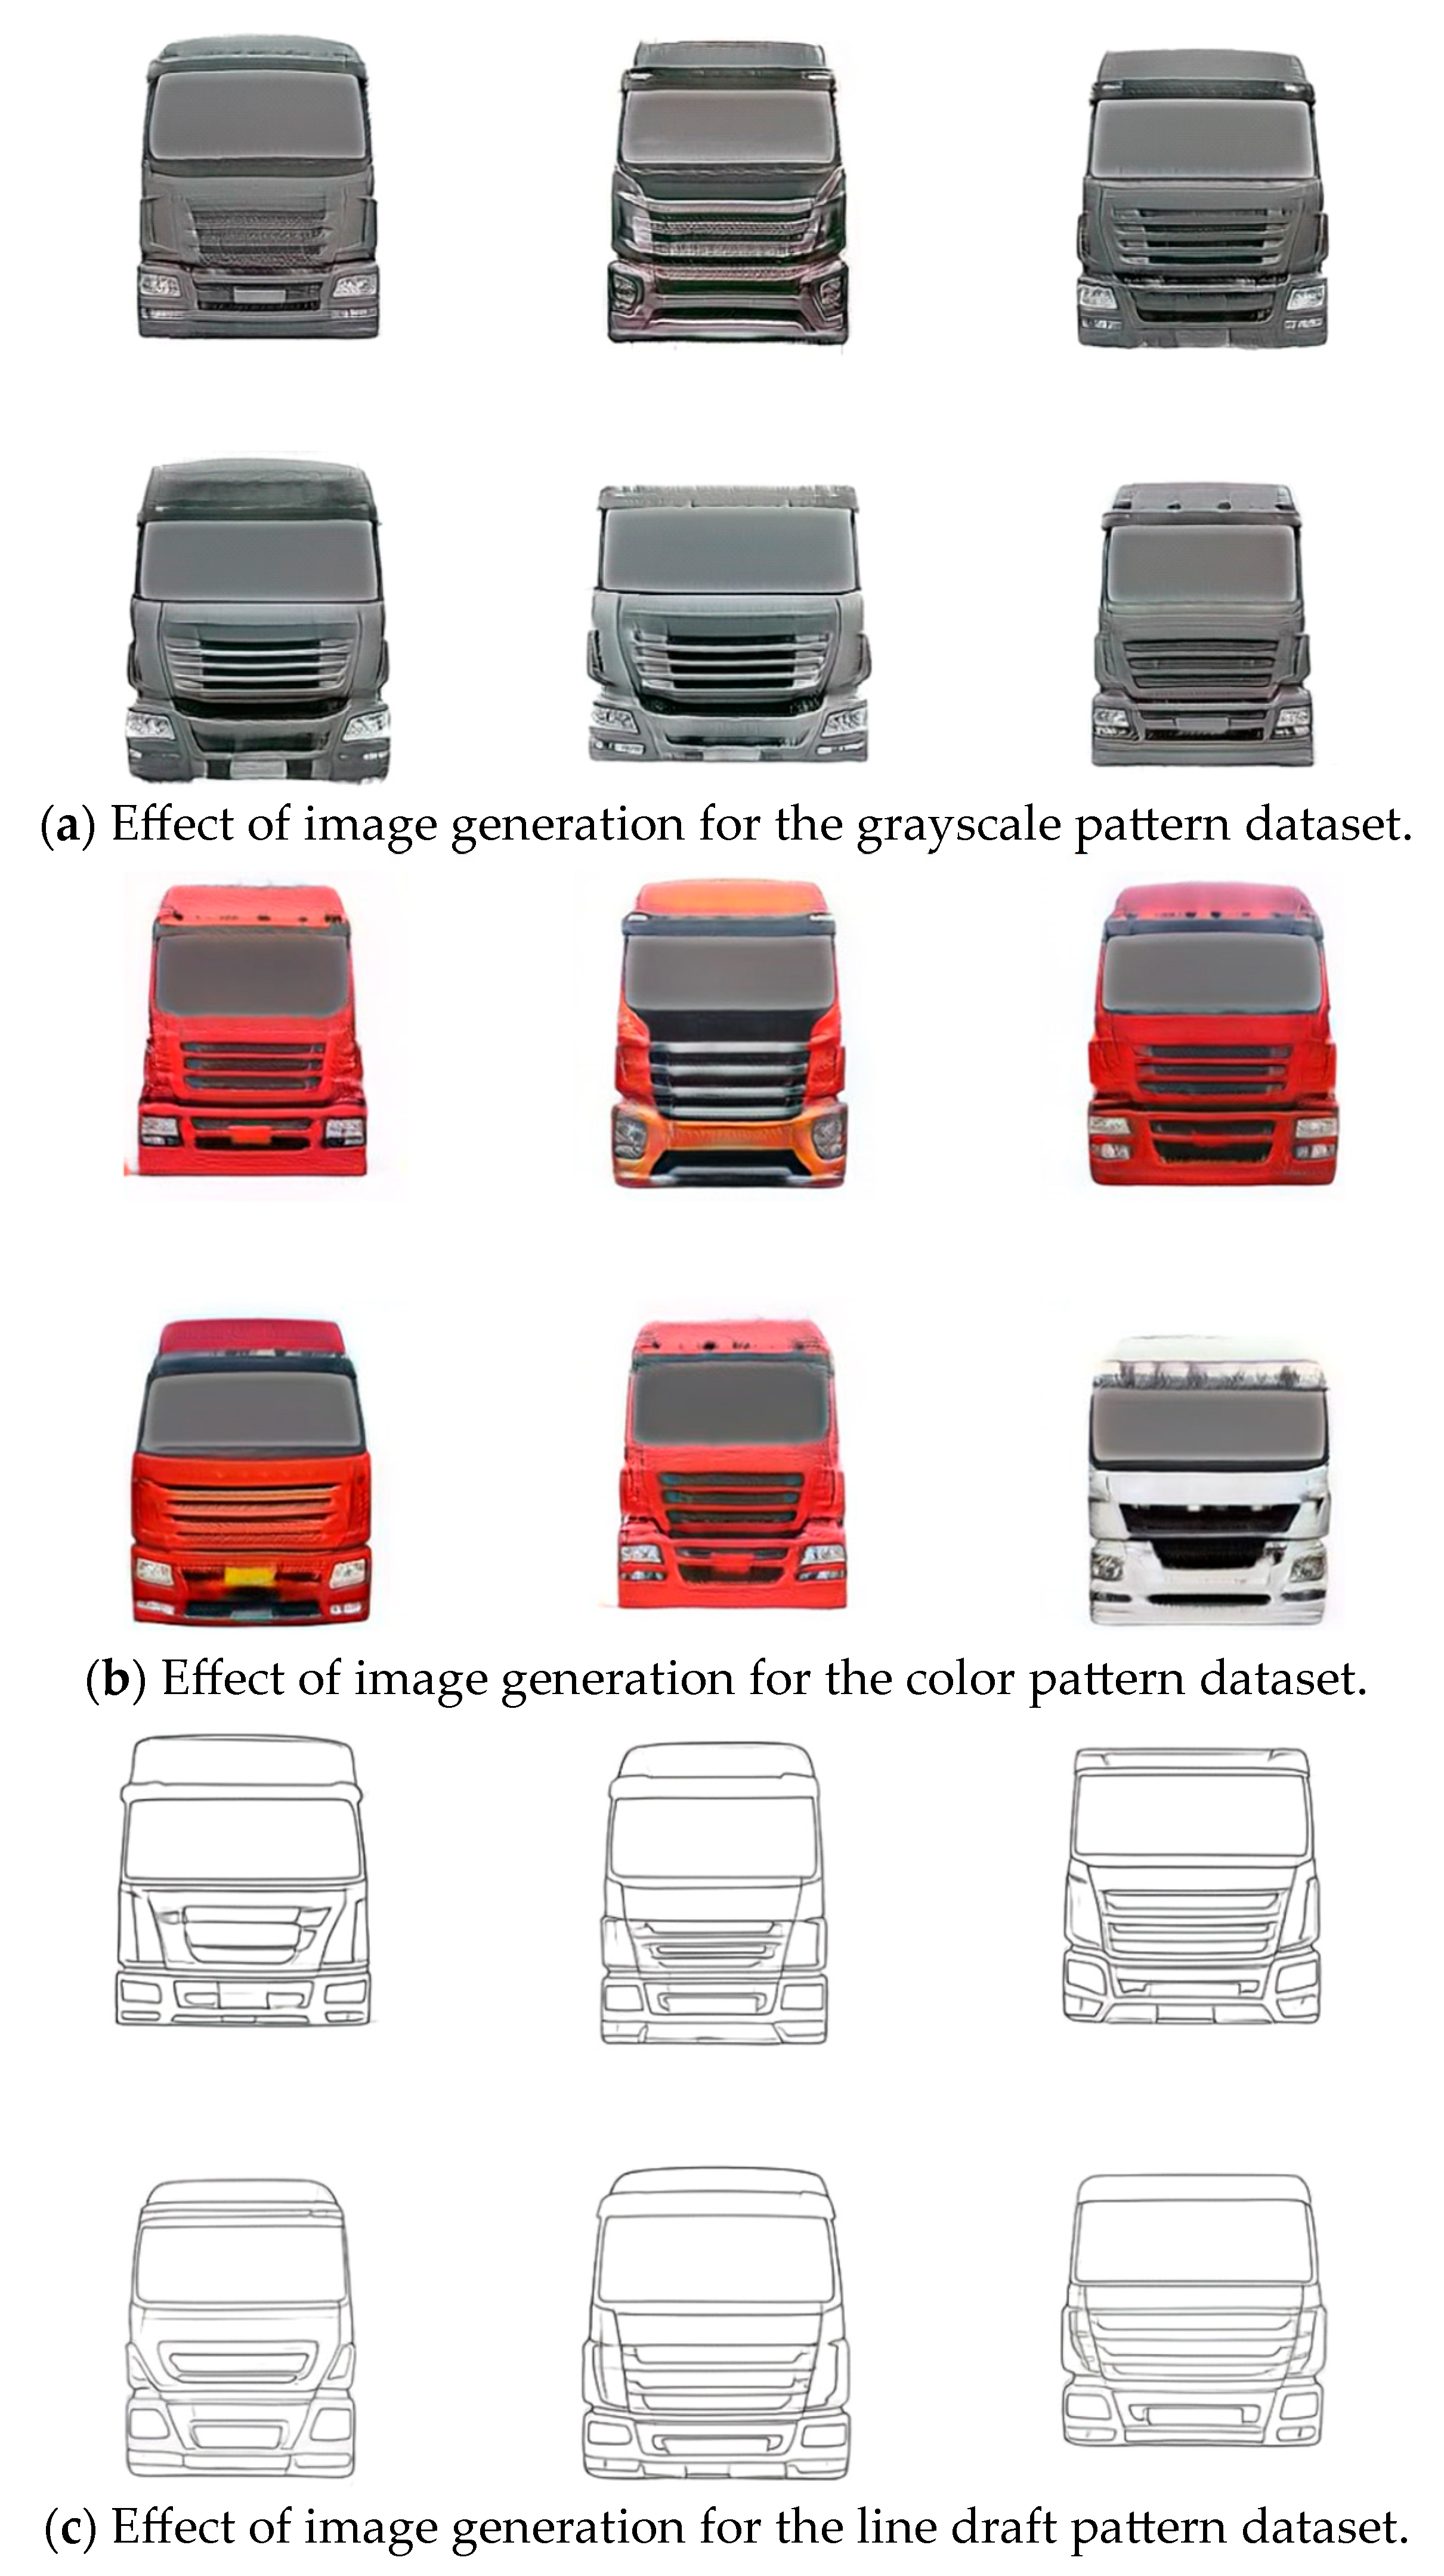
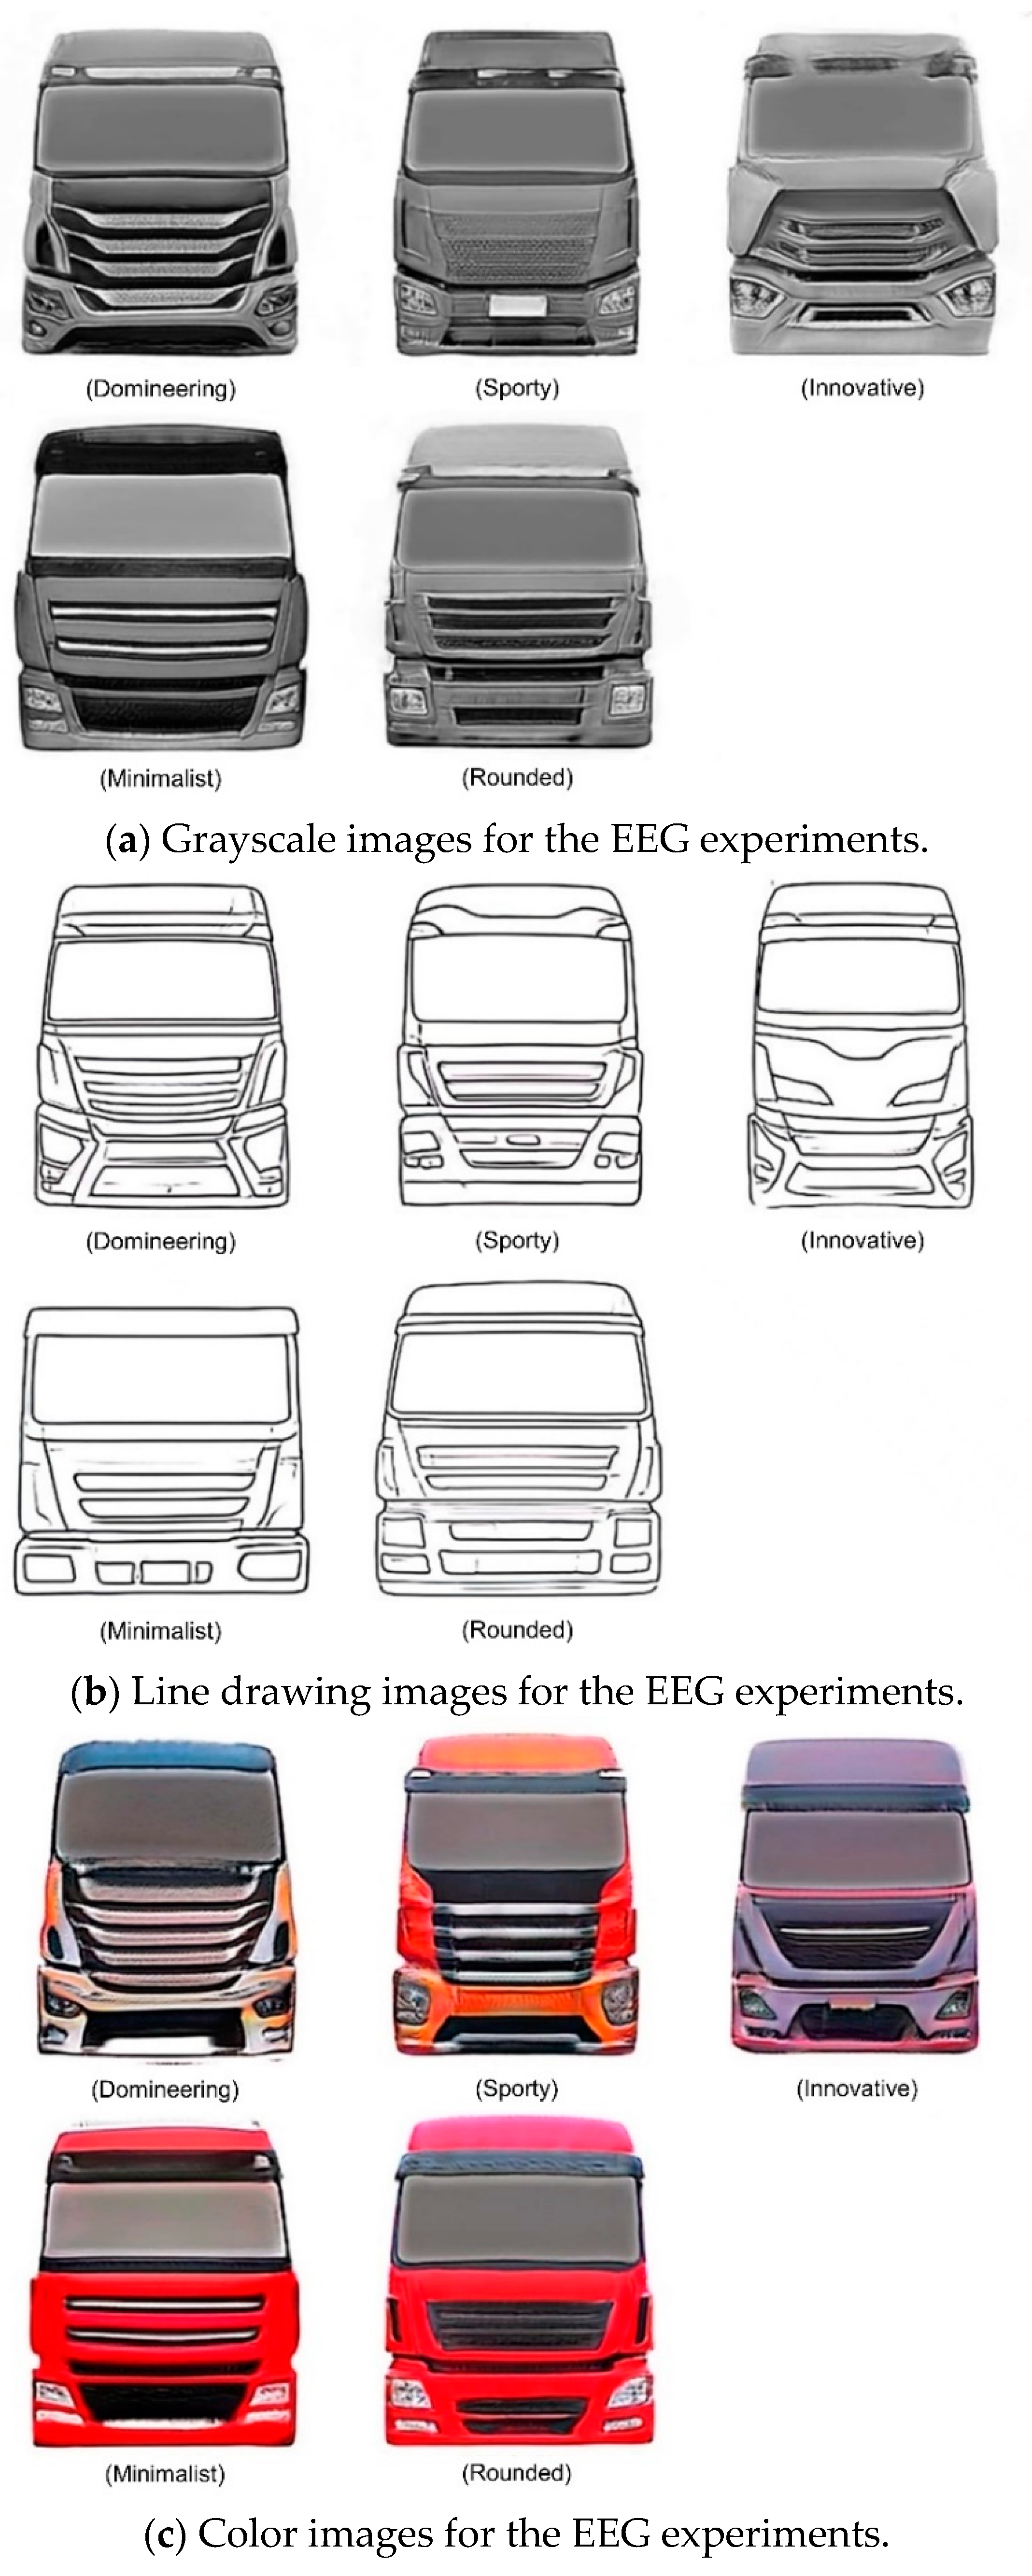

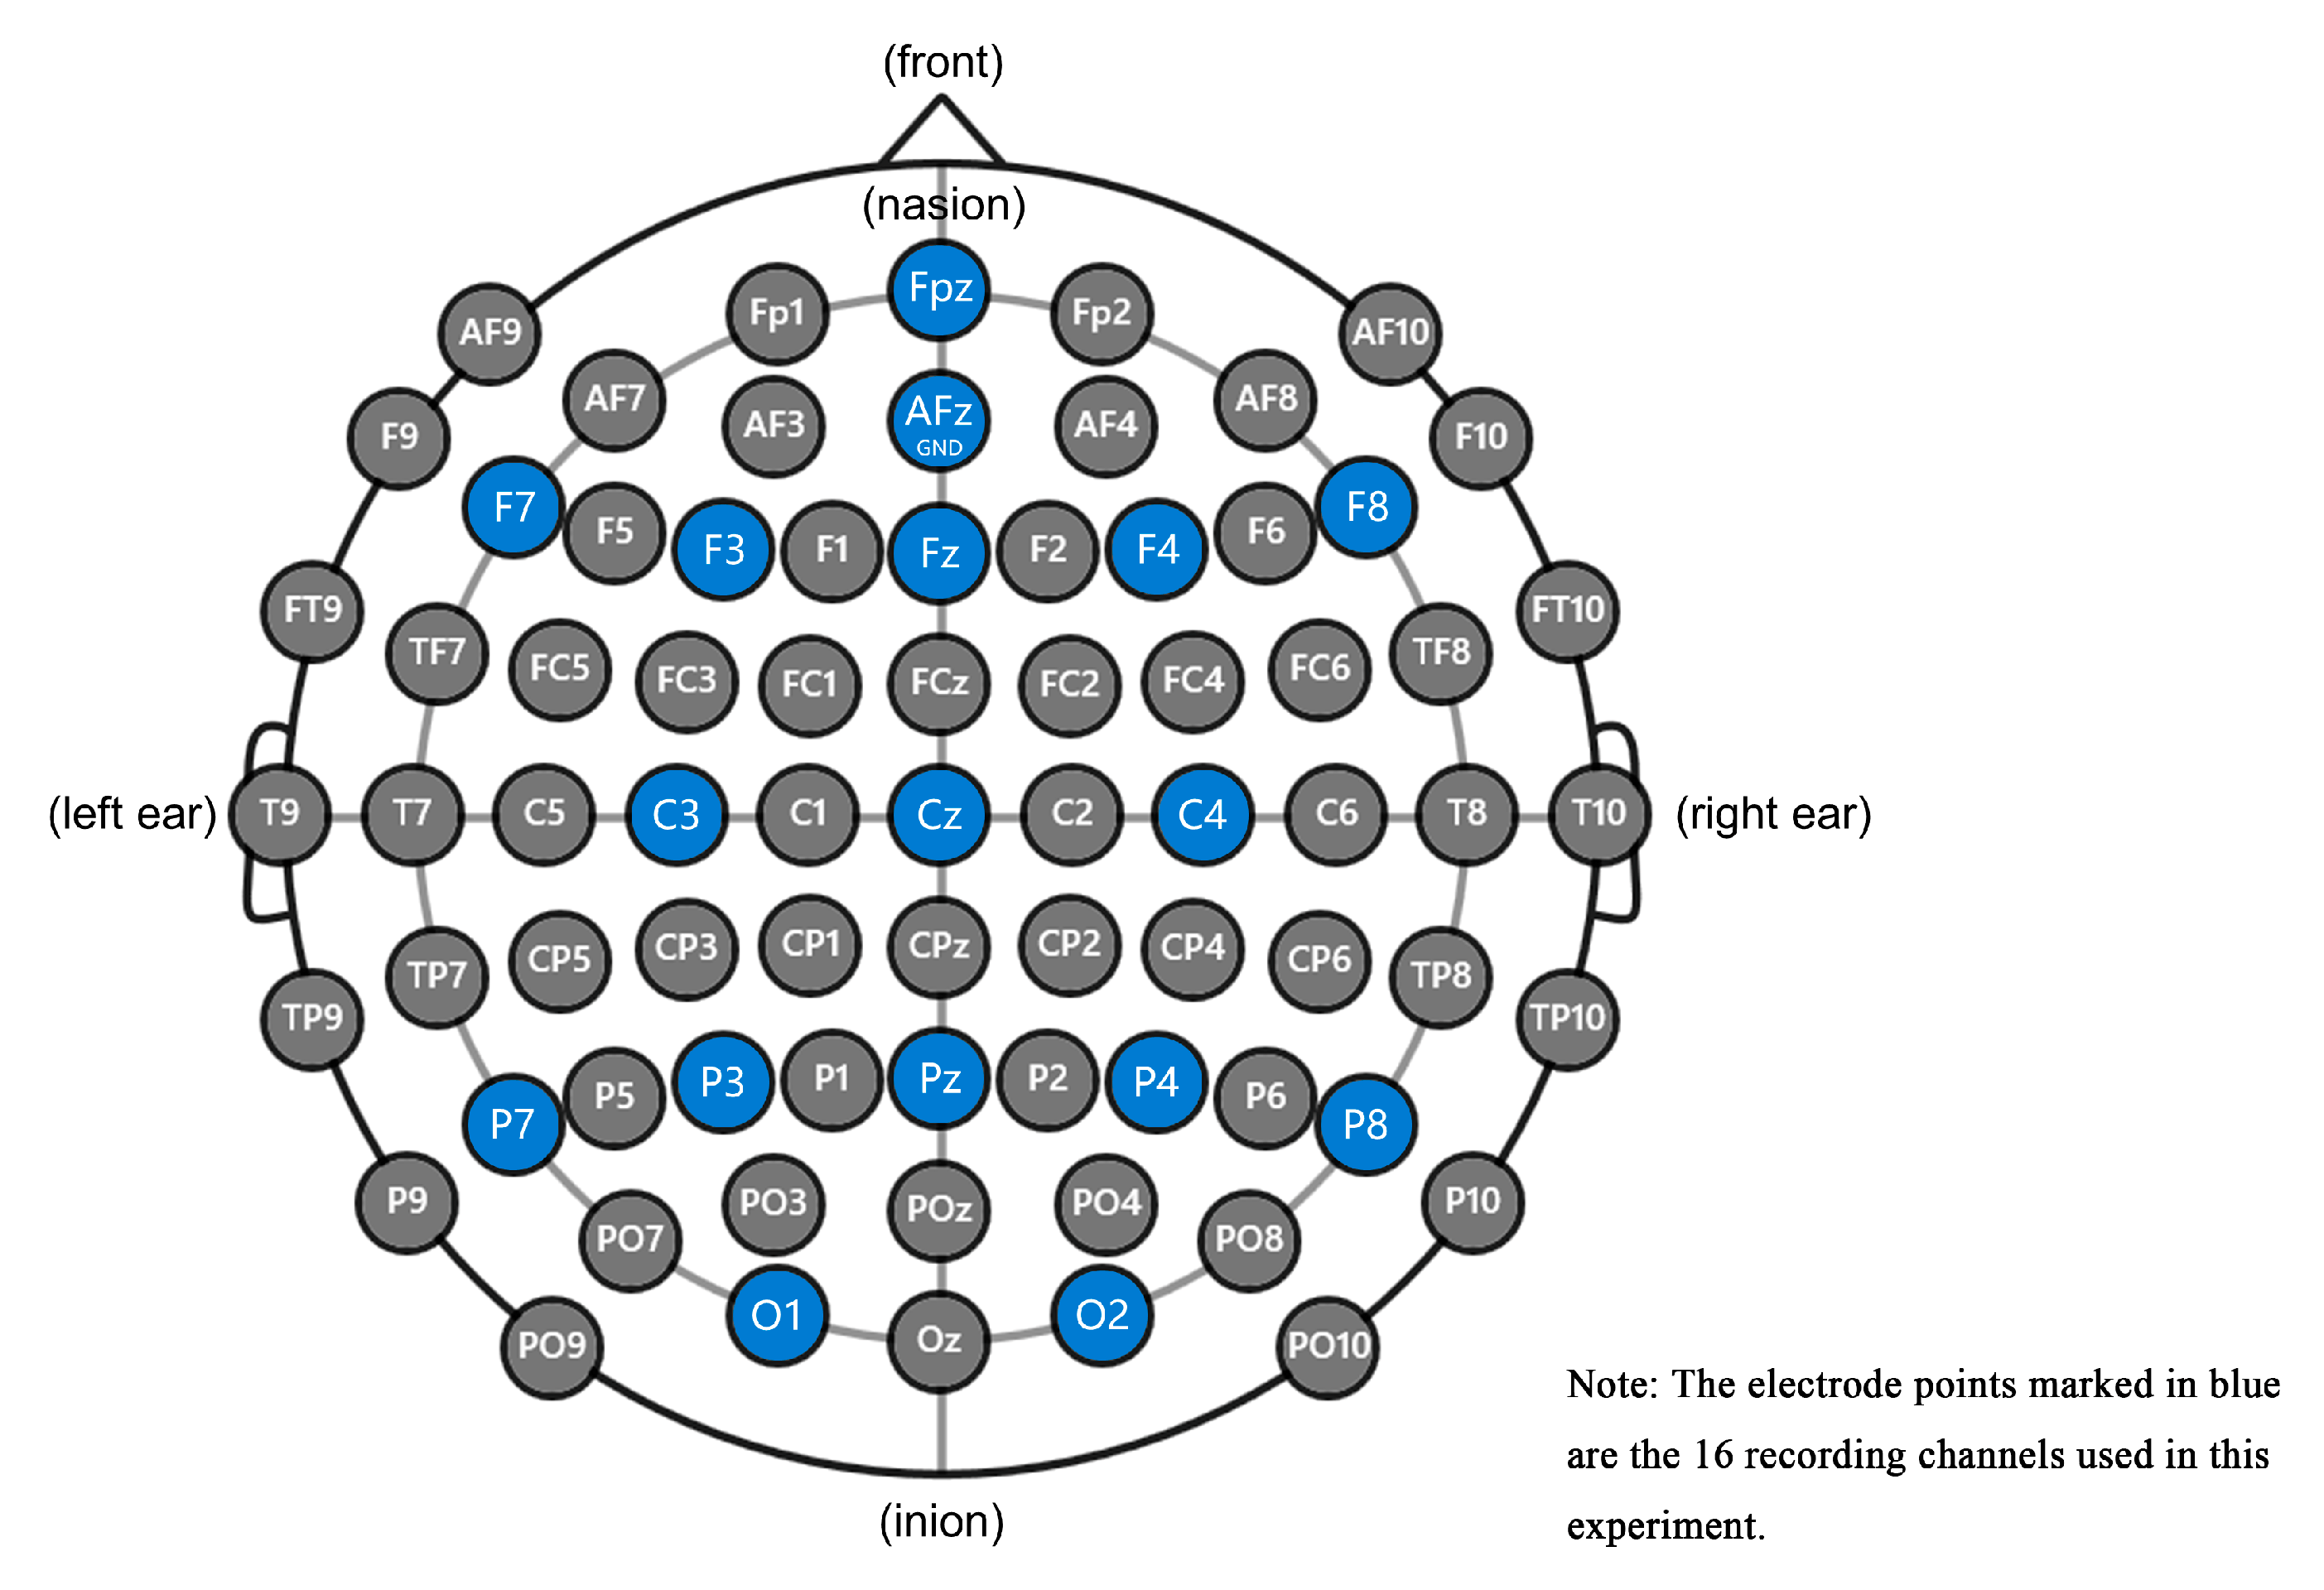
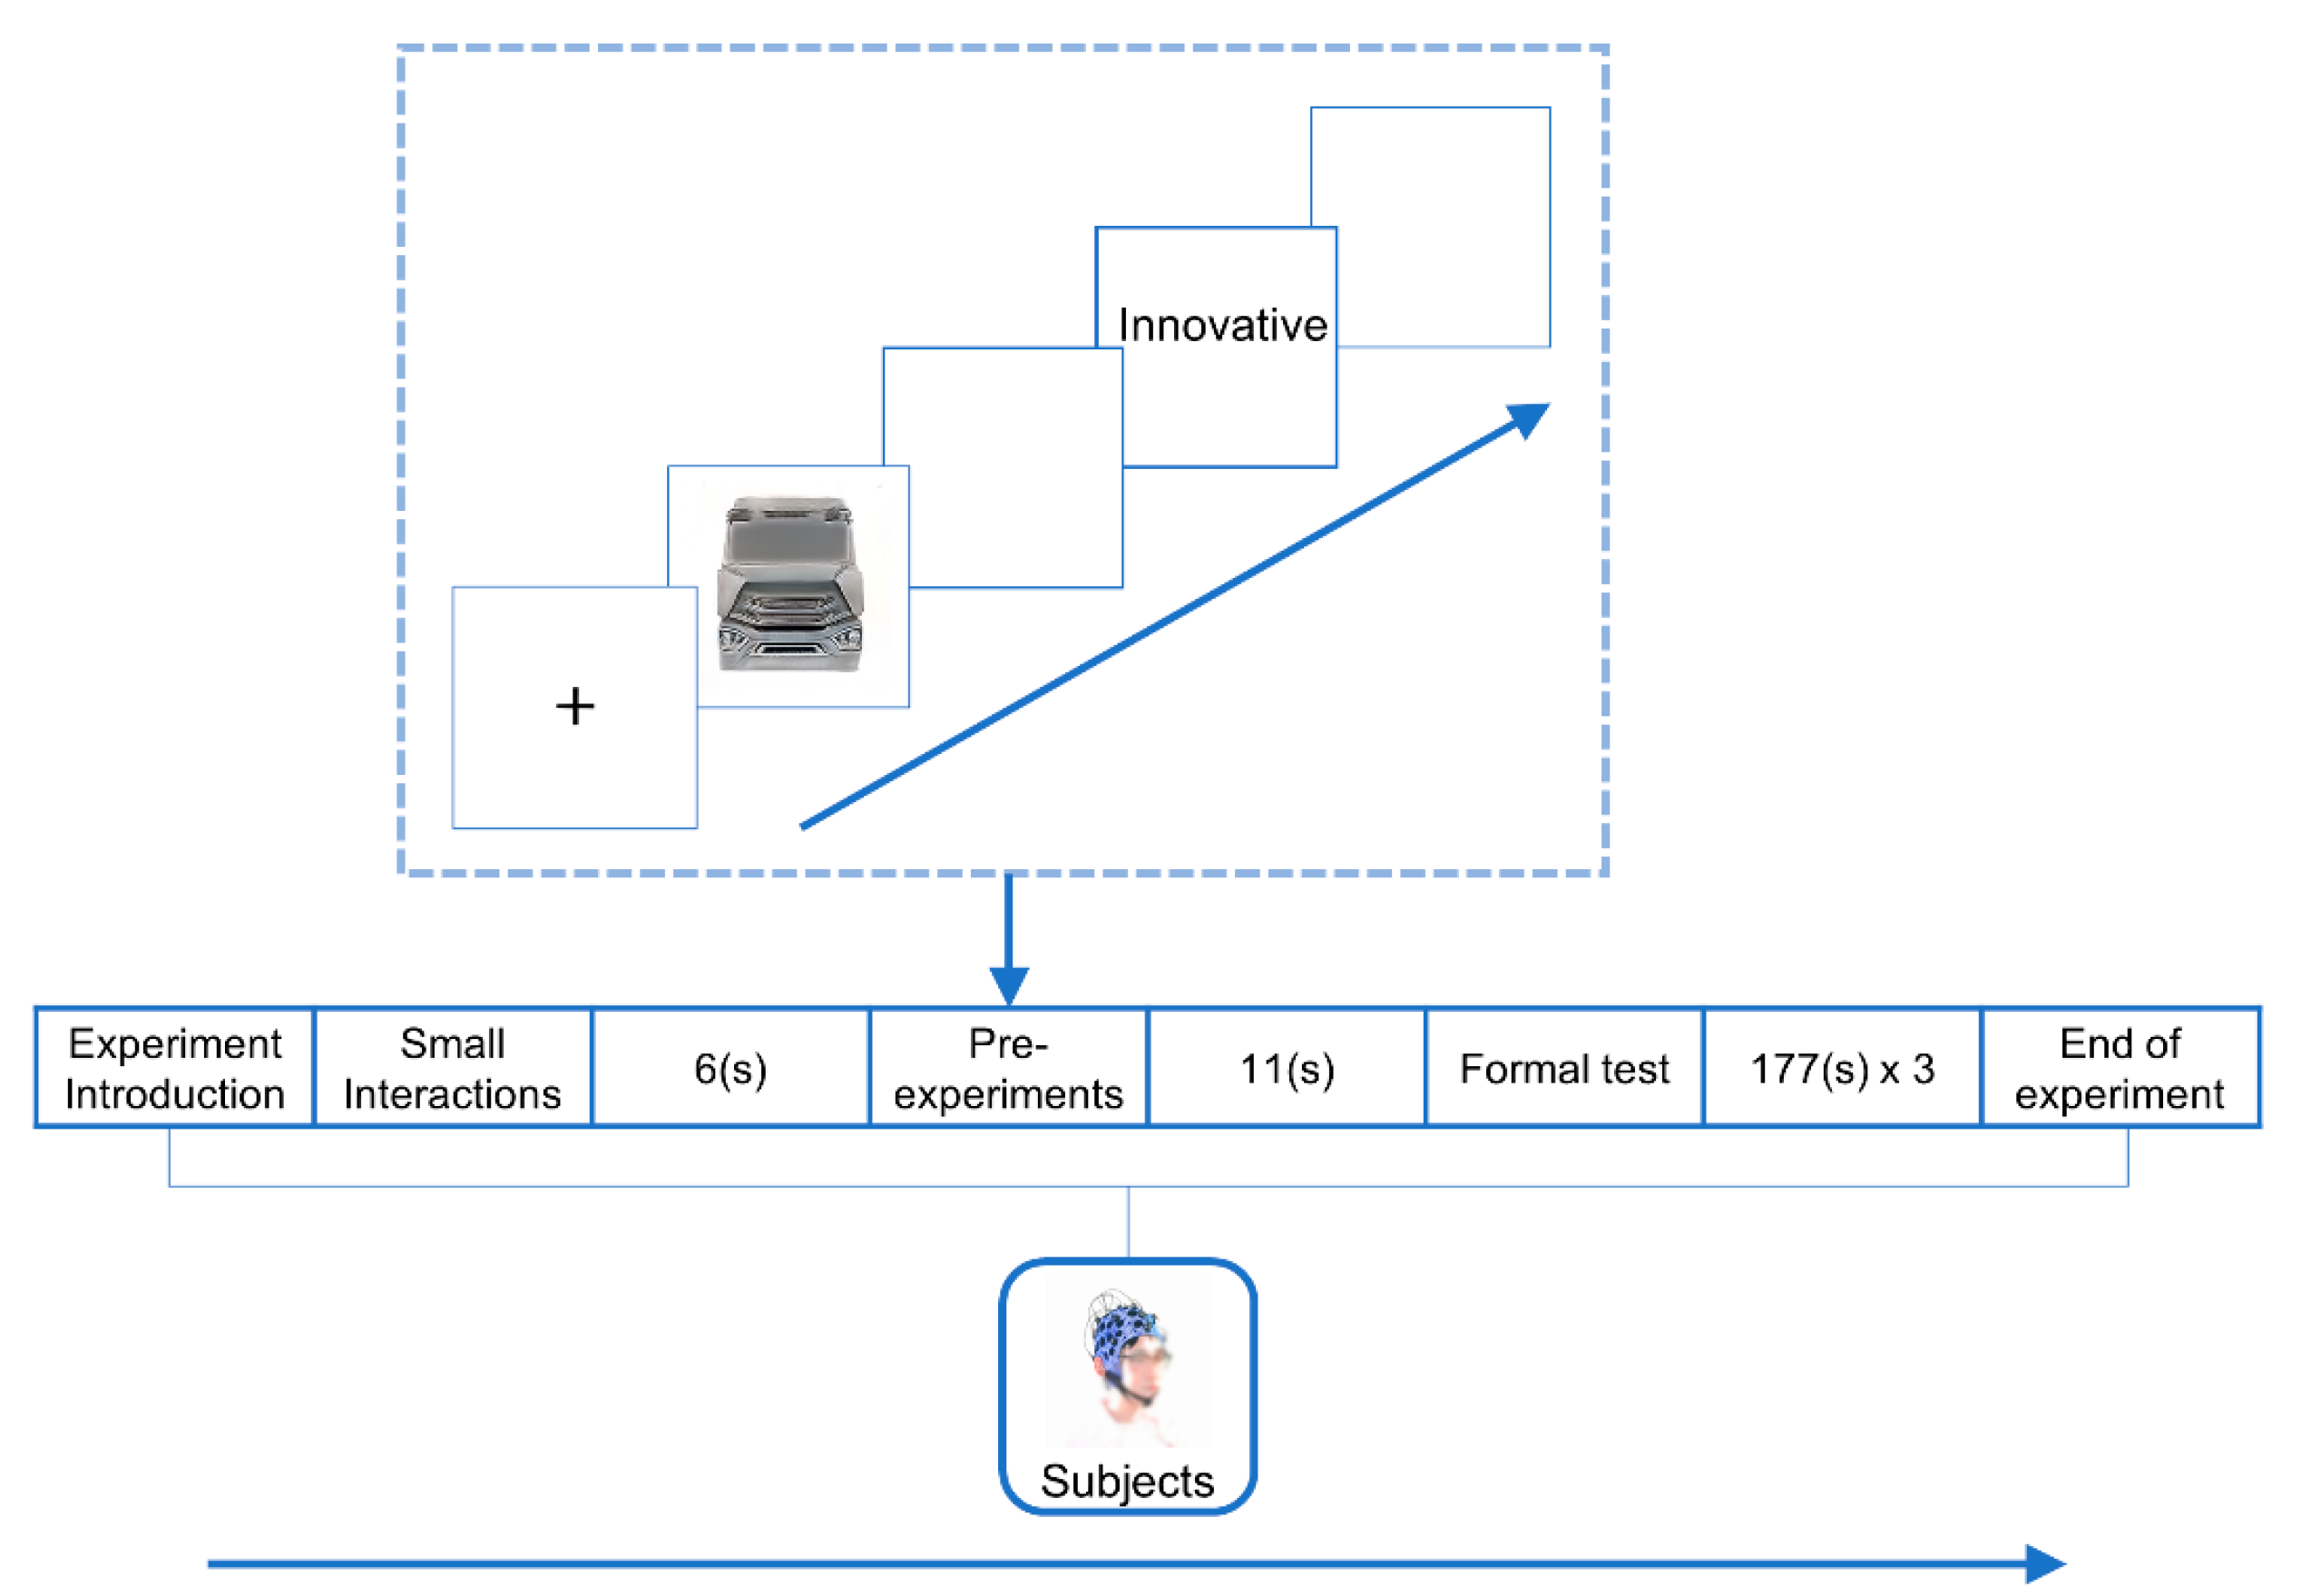
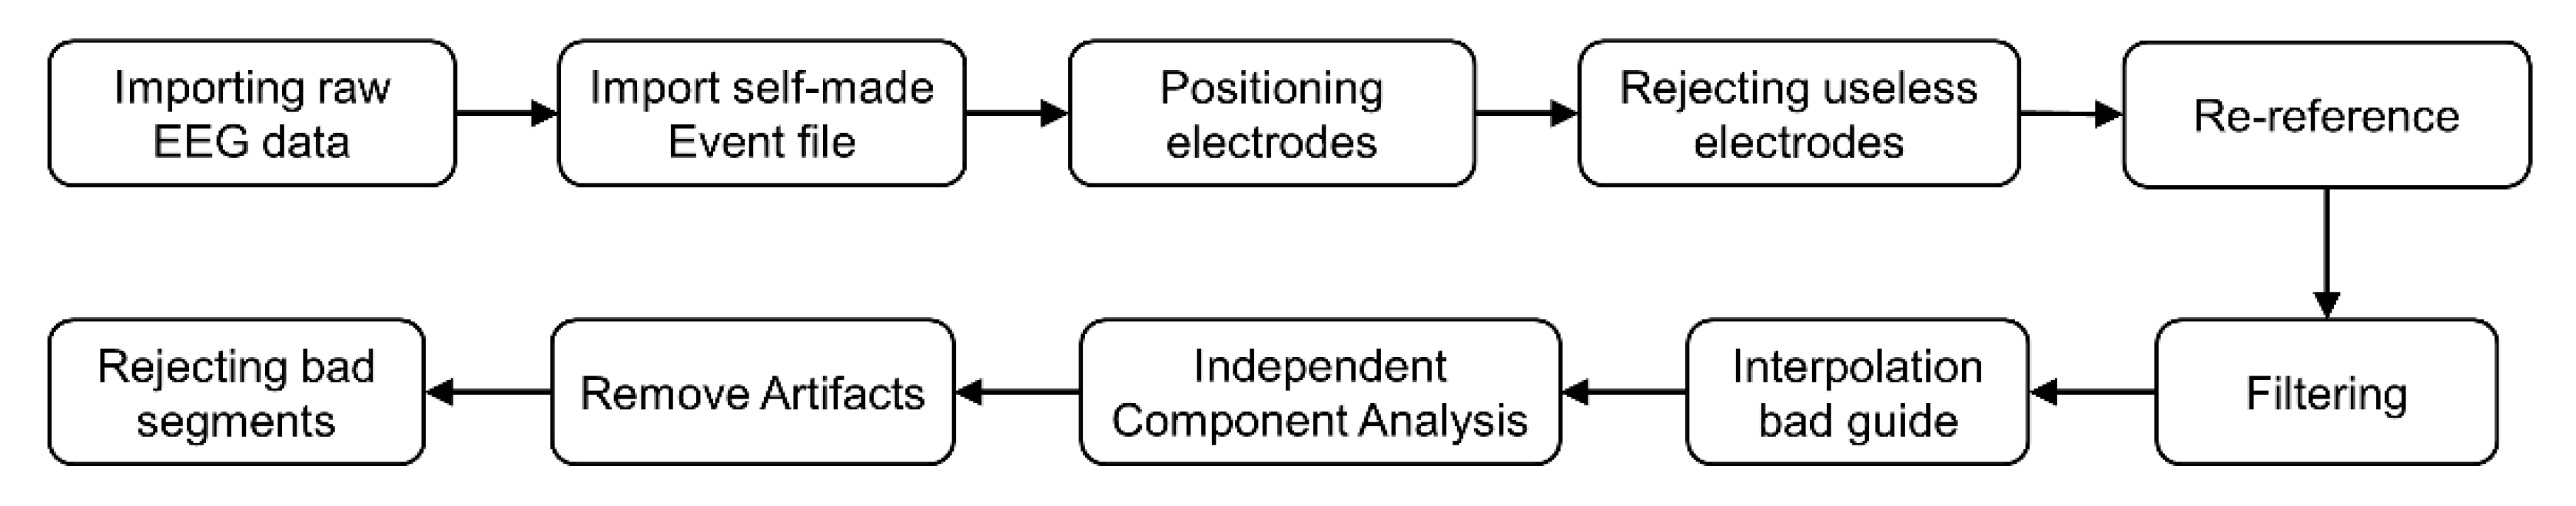
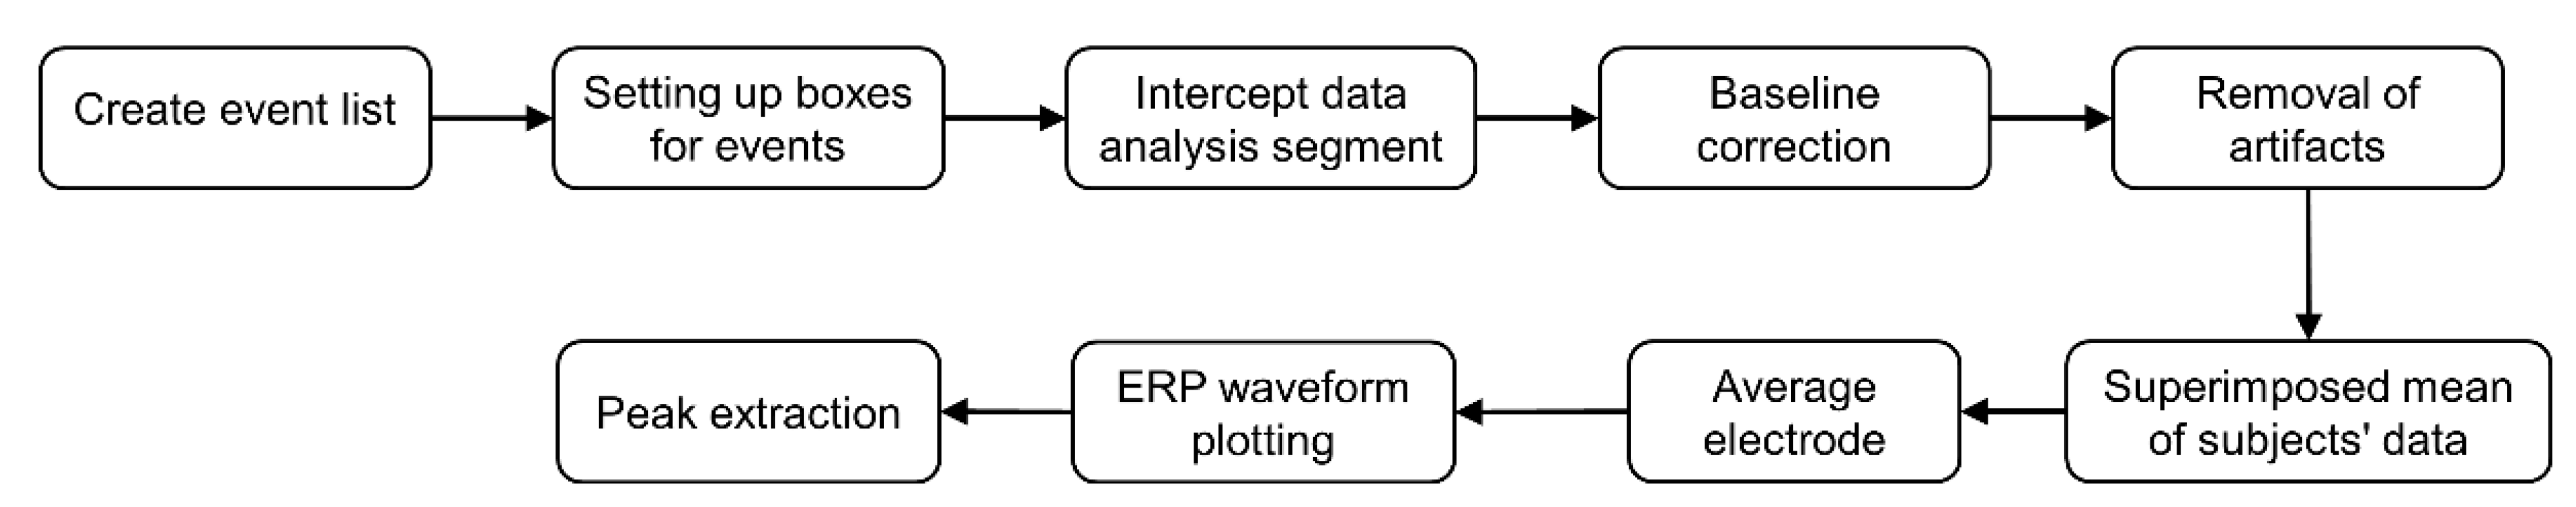
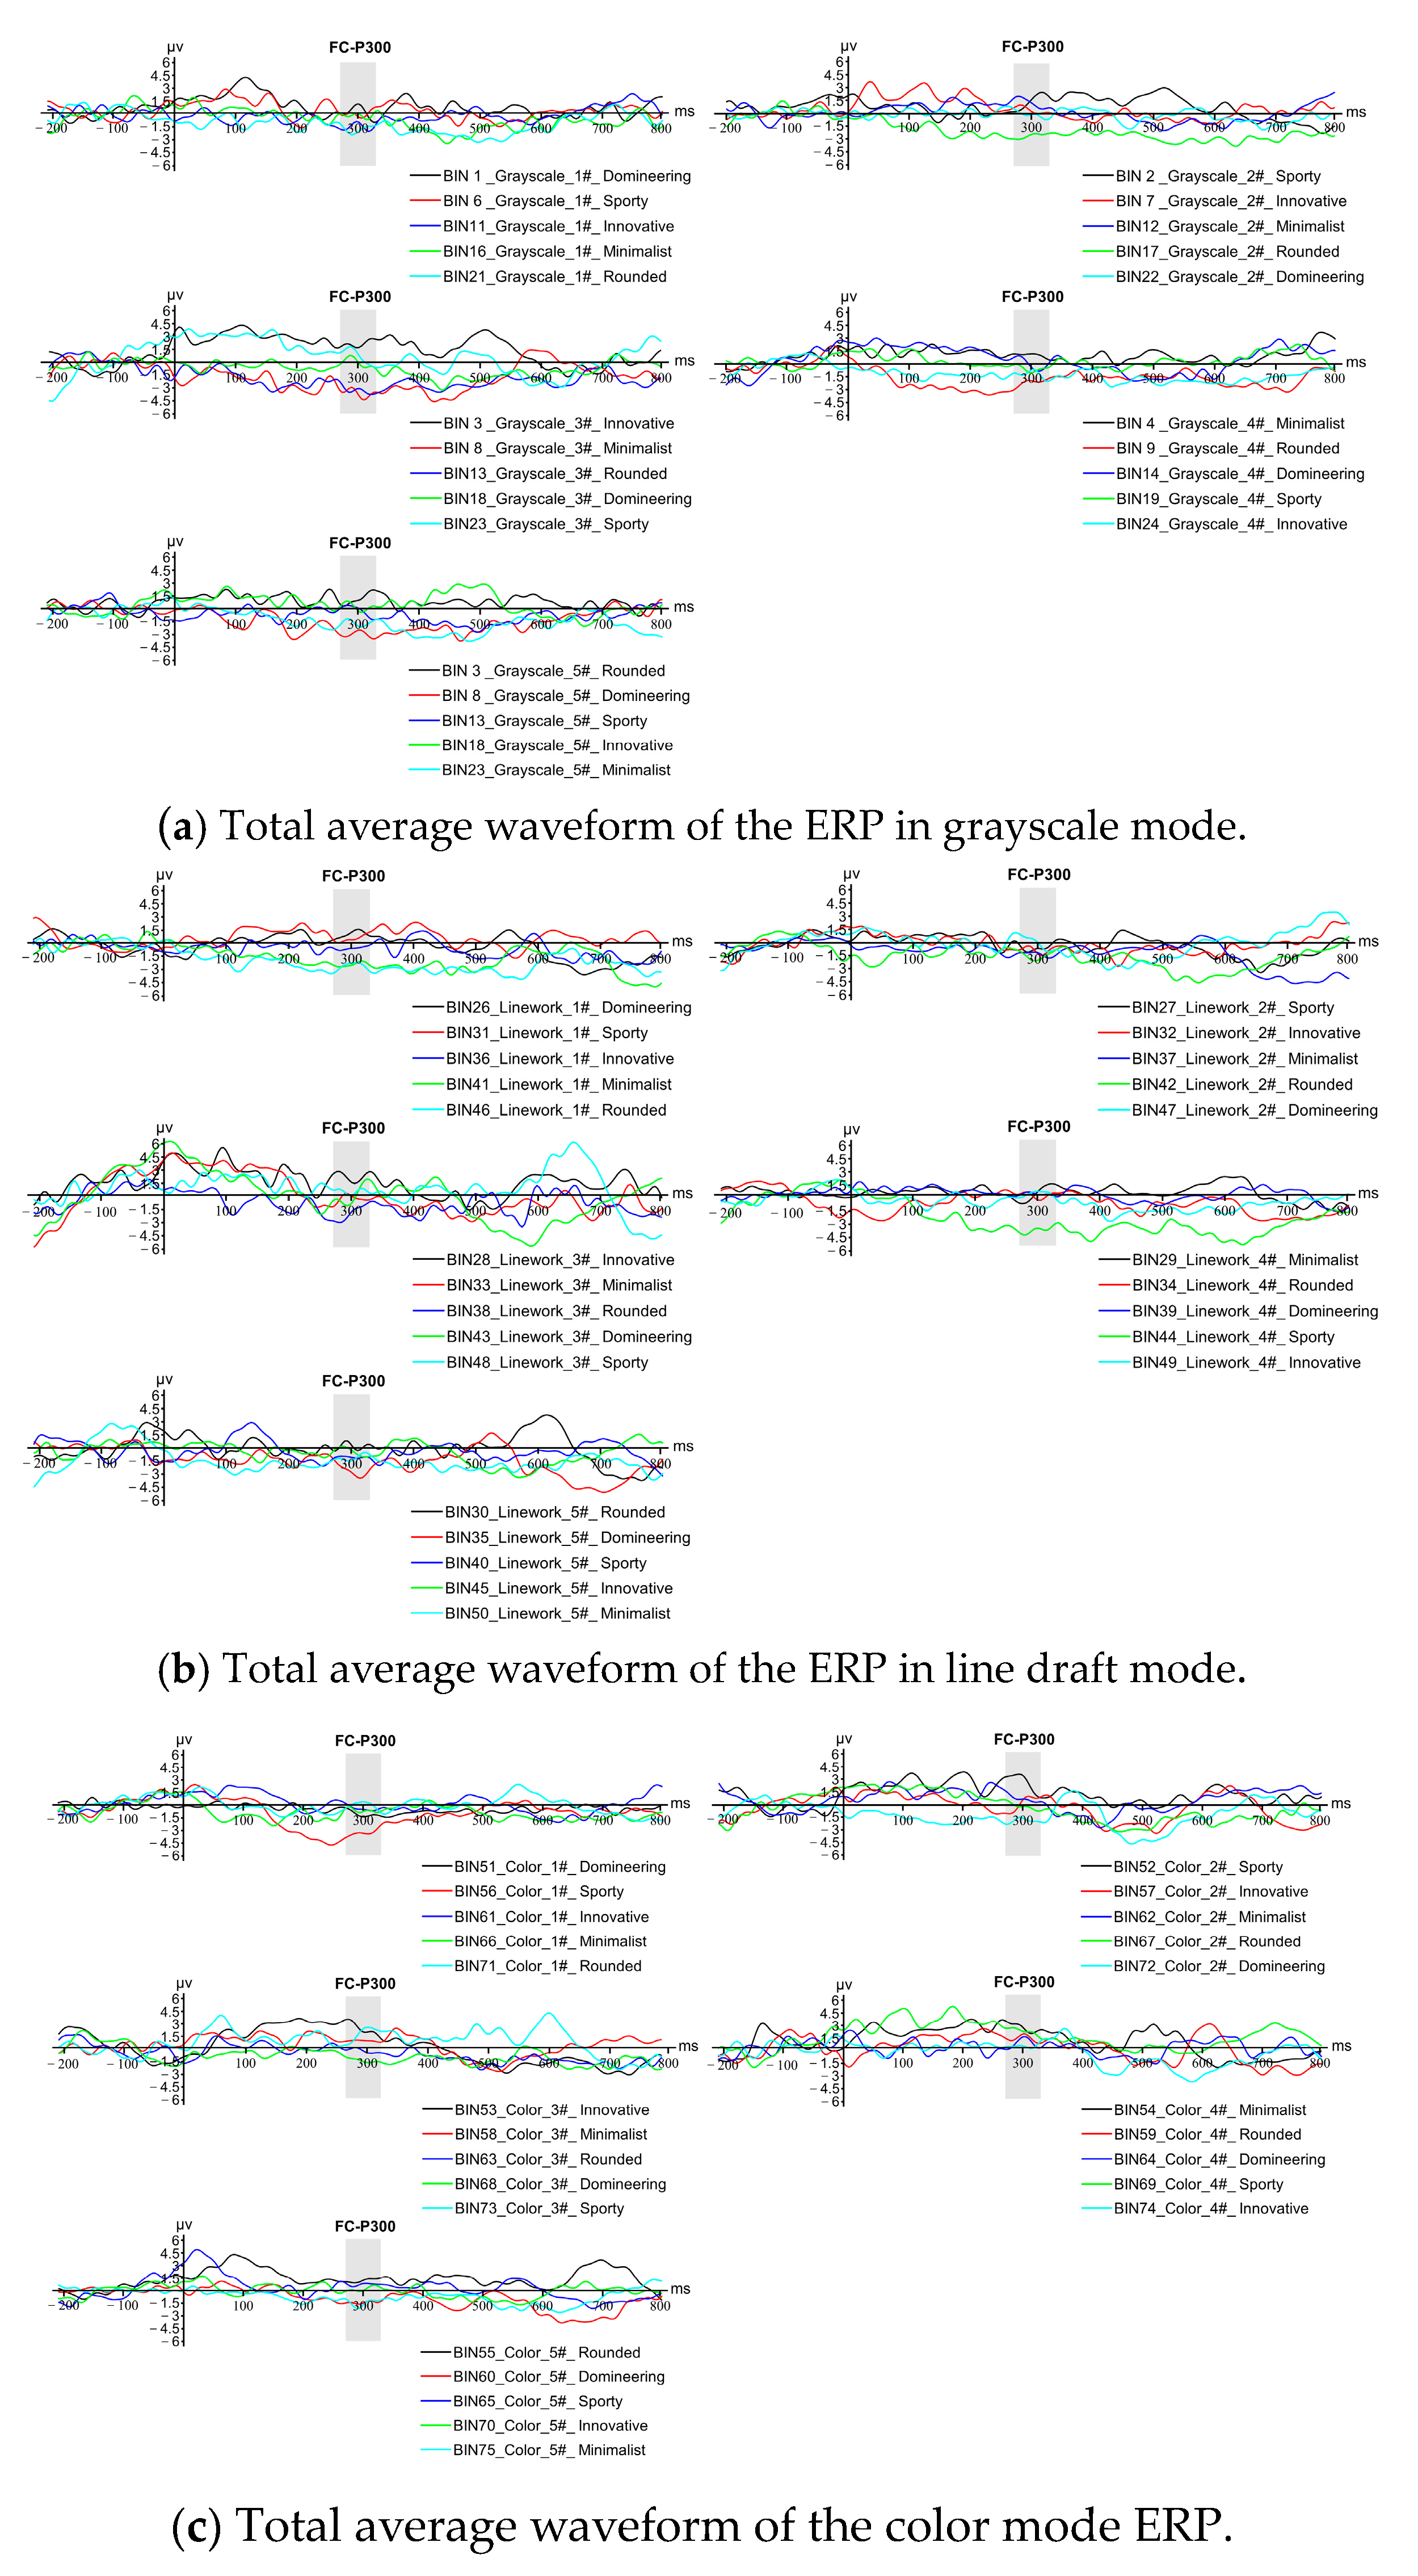
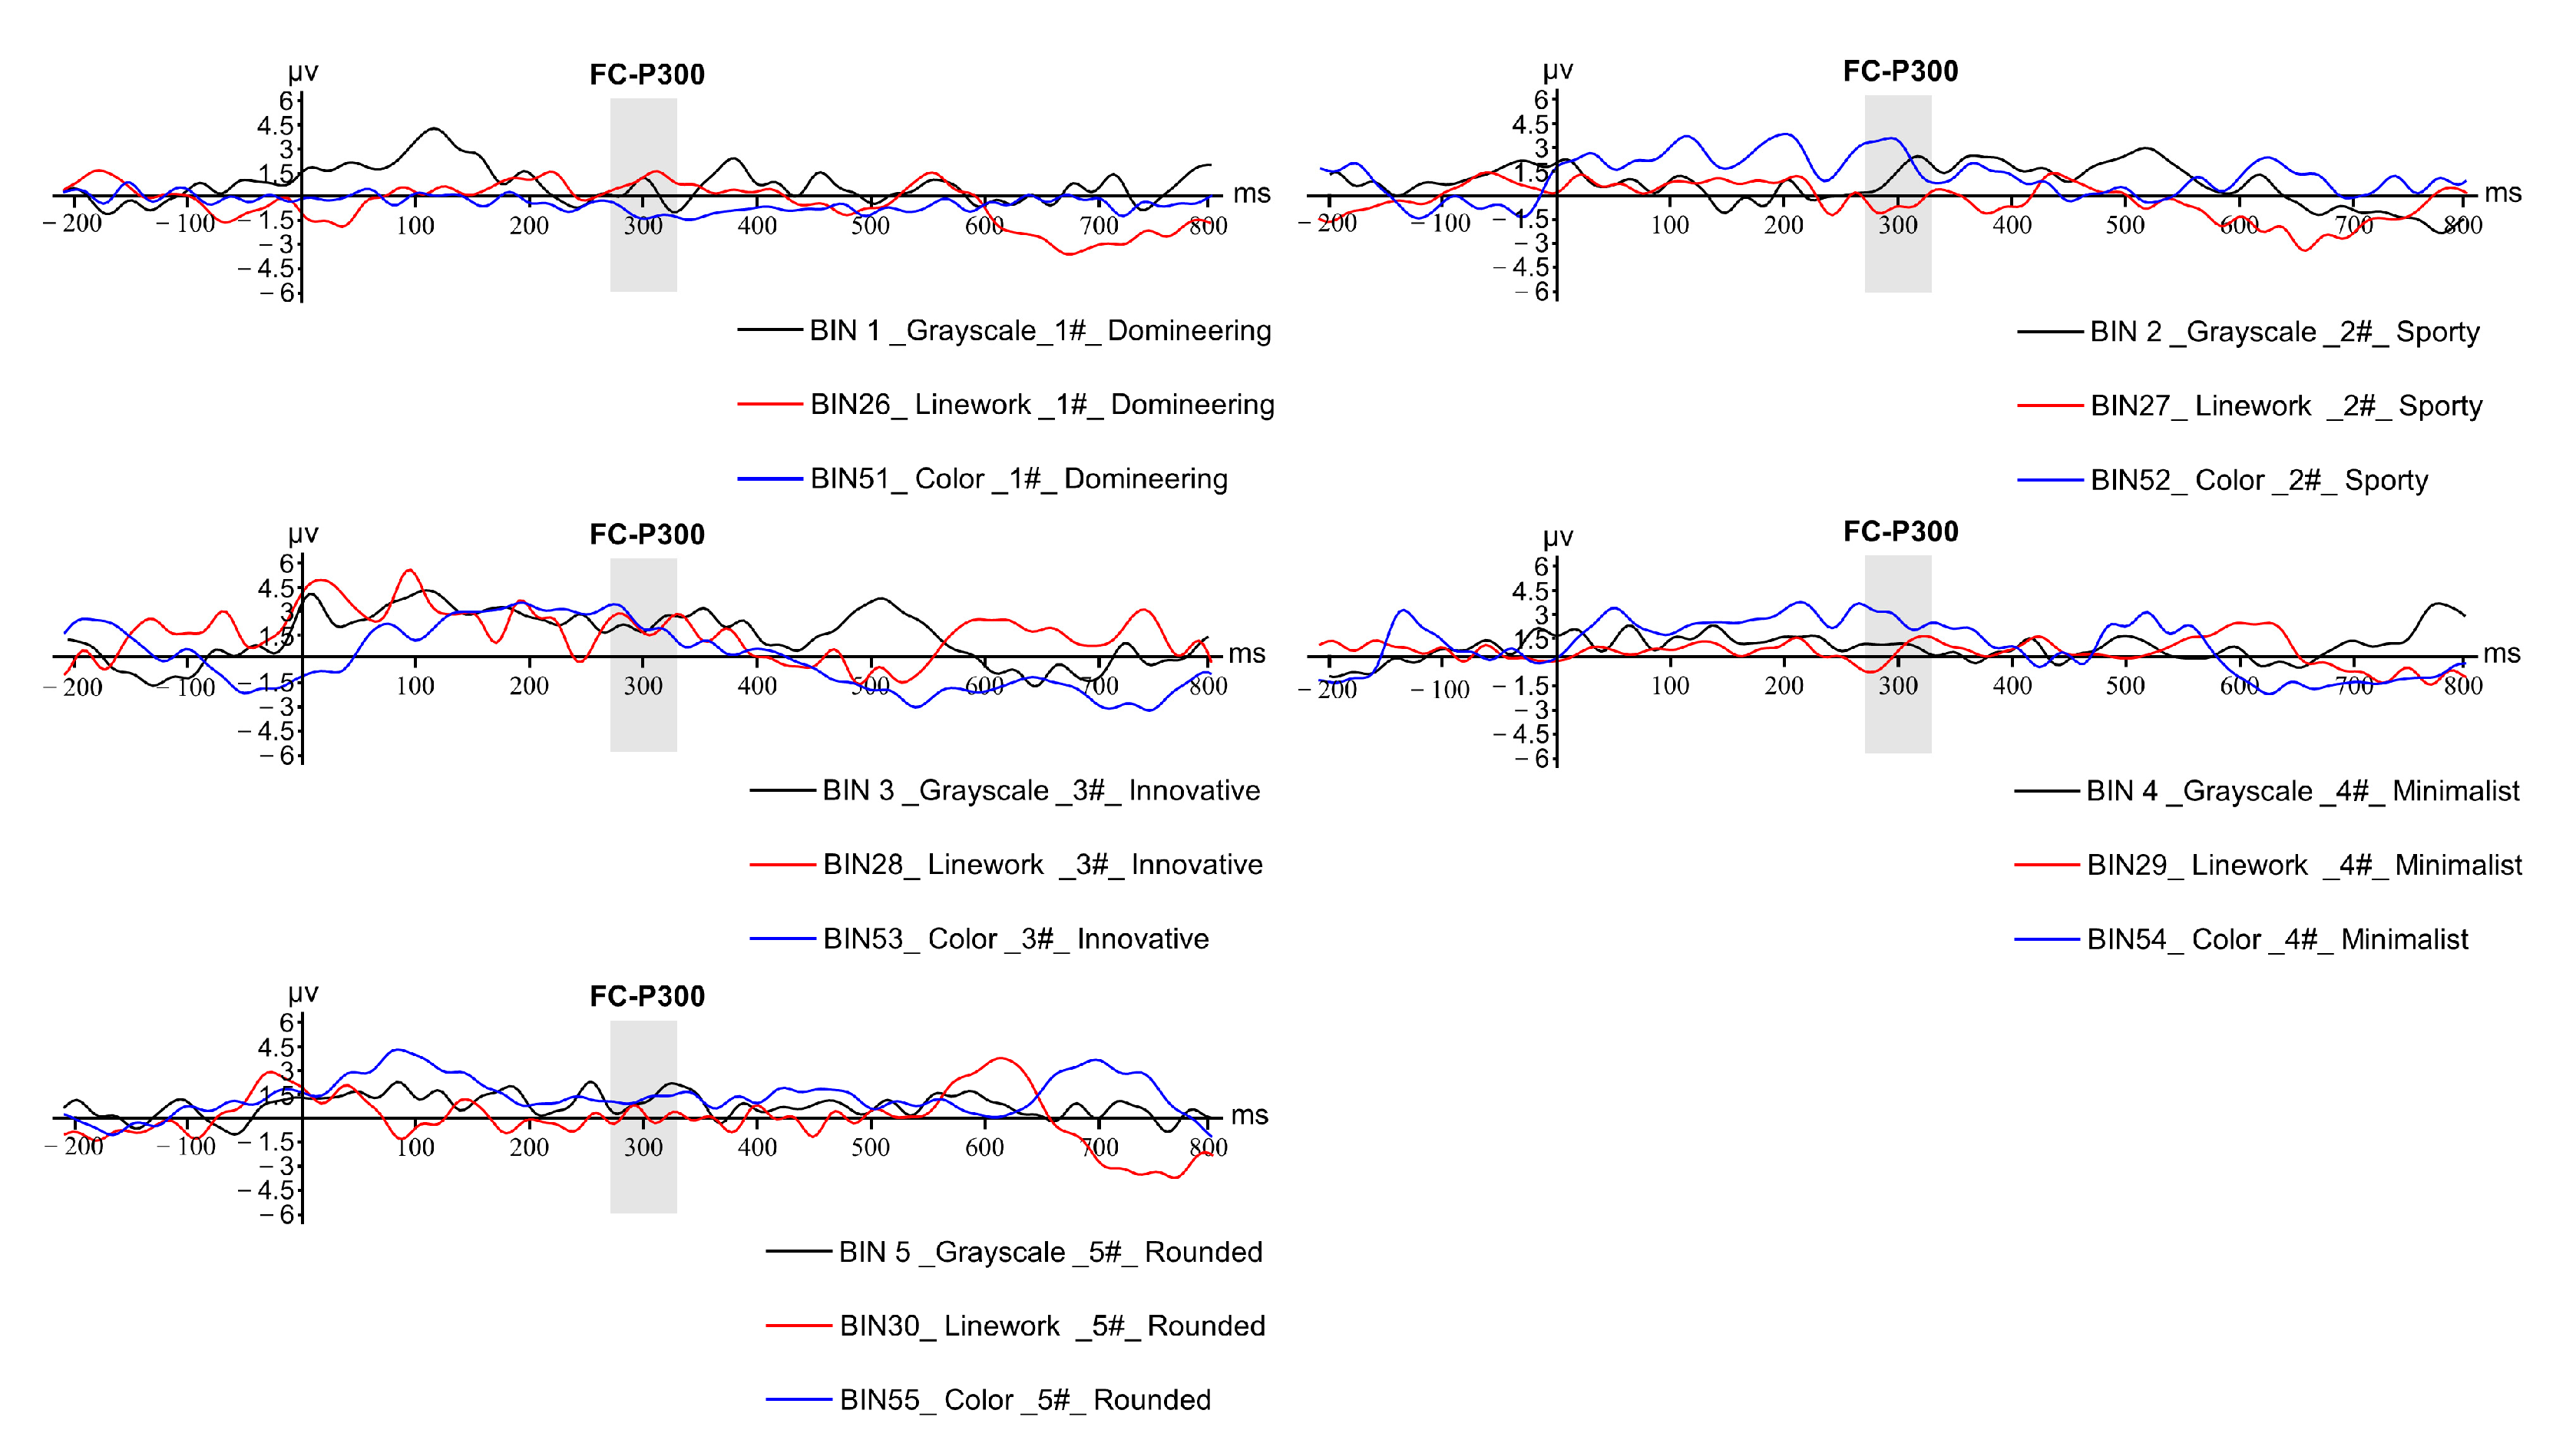
Disclaimer/Publisher’s Note: The statements, opinions and data contained in all publications are solely those of the individual author(s) and contributor(s) and not of MDPI and/or the editor(s). MDPI and/or the editor(s) disclaim responsibility for any injury to people or property resulting from any ideas, methods, instructions or products referred to in the content. |
© 2023 by the authors. Licensee MDPI, Basel, Switzerland. This article is an open access article distributed under the terms and conditions of the Creative Commons Attribution (CC BY) license (https://creativecommons.org/licenses/by/4.0/).