Article

Linking Thermal Indices, Productivity, Phenotypic Traits, and Stressors for Assessing the Health of Centennial Traditional Olive Trees

by
Yiannis G. Zevgolis
1,*,
Alexandros Kouris
1,
Apostolos Christopoulos
2 and
Panayiotis G. Dimitrakopoulos
1
1
Biodiversity Conservation Laboratory, Department of Environment, University of the Aegean, 81132 Mytilene, Greece
2
Department of Zoology and Marine Biology, Faculty of Biology, National and Kapodistrian University of Athens, 15772 Athens, Greece
*
Author to whom correspondence should be addressed.
Appl. Sci. 2023, 13(20), 11443; https://doi.org/10.3390/app132011443
Submission received: 27 September 2023 / Revised: 11 October 2023 / Accepted: 17 October 2023 / Published: 18 October 2023
(This article belongs to the Special Issue Recent Progress in Infrared Thermography)

Abstract

:

Featured Application

Integrating infrared thermography with olive tree traits and their stressors enhances centennial olive tree monitoring and management in Mediterranean traditional agroecosystems.

Abstract

Centennial olive trees, integral components of traditional Mediterranean agroecosystems, hold immense value as repositories of biodiversity and cultural heritage due to their physiological attributes and life history, making them crucial for the conservation of High Nature Value ancient olive orchards. However, they are increasingly confronted with physiological challenges exacerbated by various biotic and abiotic stressors jeopardizing their health and productivity, underscoring the urgency for ongoing monitoring and conservation measures to secure their long-term existence. To monitor these challenges, in recent years, the adoption of non-invasive techniques like infrared thermography (IRT) has become prevalent. In this study, we aimed to comprehensively assess the health state of traditional centennial olive trees, with a particular focus on their productivity. To achieve this, we monitored 44 centennial olive trees from a traditional olive grove on the island of Naxos, Greece, a representative location for Mediterranean olive groves, during the period from 2017 to 2020. We established connections between a set of trunk and canopy thermal and humidity indices, phenotypic traits, and the two most prevalent stressors affecting olive trees not only within the context of the island but also more broadly in similar Mediterranean environments worldwide: the olive leaf spot disease (OLS) and crop water stress, assessed through the crop water stress index (CWSI). To evaluate their interrelationships, we initially assessed intraspecific thermal and humidity pattern variations, and we developed linear and logistic regression models to gain insights into the factors influencing olive tree productivity, water stress, and the OLS presence. Results indicated that combining thermal and humidity indices can substantially explain olive tree productivity, water stress, and OLS, providing a valuable tool for assessing and monitoring the health and overall state of centennial olive trees, while offering a comprehensive approach to understanding the complex interactions shaping traditional olive grove dynamics. By identifying key indicators such as tree thermal patterns and water stress levels, olive growers and conservationists can make informed decisions to enhance the vitality and longevity of these culturally and ecologically significant trees.

1. Introduction

The Mediterranean basin, a biodiversity hotspot [1] known for its rich cultural heritage and unique landscapes, has witnessed a long-standing symbiotic relationship between humans and nature [2,3]. Over centuries, this long-standing interaction has resulted in the development of diverse agroecosystems that have dual roles as sources of agricultural sustenance and reservoirs of biodiversity [4,5,6]. Within the spectrum of these agroecosystems, it is discernible that traditional olive groves are a distinctive and emblematic agroecological system [7] that evolved and adapted to changing agricultural practices over time, reflecting their ability to navigate shifts in societal and environmental dynamics [8,9,10].
Despite the impact of modernization [9,11,12] marked by a gradual shift from traditional and low-density systems to intensive and highly-intensive cultivation practices [13,14], as well as land abandonment deriving from socioeconomic processes [15,16,17,18,19,20,21], traditional olive groves have consistently displayed remarkable resilience [2,22], demonstrating their ability to adapt to changing environmental conditions and sustain olive production over centuries.
Situated at the core of these groves, centennial traditional olive trees play a pivotal role as integral components of the ecosystem [23]. They leverage their physiological attributes and life history to make a substantial contribution to a broader ecological context, one that identifies them as High Nature Value ancient olive orchards [24]. These systems involve the implementation of low-intensity cropping methods [25], diverse land cover, and semi-natural vegetation, often accompanied by various ecological infrastructures such as terraces and dry-stone walls [26,27]. These practices aim to achieve multiple objectives, including the maintenance and enhancement of soil quality [28], erosion mitigation [29], water resource conservation [30], and the facilitation of carbon sequestration [31,32]. Furthermore, they hold immense economic significance in the Mediterranean region and beyond as the primary source of olive oil production, vital for the economies of many Mediterranean countries through its agricultural and export sectors, while also playing an integral role in the cultural heritage of these regions [7,8]. Additionally, they play a crucial role in supporting and sustaining high levels of biodiversity [33,34].
Coupled with their ecological significance, delving into the intricate physiology of centennial olive trees reveals a complex interplay between their unique adaptations and their pivotal role in these biodiverse ecosystems. Regarding their physiology, olive trees, distinguished by their longevity and slow growth [35], undergo significant changes and adaptations throughout their extended lifespans which are intrinsically linked to the tree’s unique growth and defense mechanisms, which have evolved over centuries to ensure their survival, longevity, and resilience. Essentially, like the majority of tree species, olive trees activate a wide range of defense strategies, which encompass the synthesis of chemical compounds deterring wood-decaying fungi and bacteria to protect against threats such as injuries, infections, and decay as they age [36]. While these defenses effectively safeguard the structural integrity of the tree, they may concurrently culminate in the eventual formation of deep grooves and cavities within their trunks, as the tree resists decay-inducing agents [37]. Specifically, when olive trees encounter injuries or infections, they exhibit an extraordinary ability to compartmentalize and sequester these affected areas [37,38]. This process entails the creation of both physical and chemical barriers, preventing the proliferation of pathogens and decay agents throughout the tree [39]. Over time, these sequestered zones can evolve into profound grooves and cavities as the tree continues its growth around them.
On the one hand, these anomalies within the tree’s structure give rise to a diverse array of microhabitats, offering refuge to numerous species [7,13,40] and thus play a pivotal role in supporting biodiversity [41,42]. On the other hand, the emergence of cavities and deteriorating wood poses challenges to the olive tree’s health [43,44,45] and productivity as it matures [46]. Such challenges have the potential to impede nutrient and water transport within the tree [47,48,49], consequently affecting its productivity, fruit yield, and overall vigor [50,51].
In parallel with these trunk physiology-related challenges, centennial olive trees often face threats from foliar diseases caused by fungi, with one of the prominent adversaries being Spilocaea oleagina (Castagne) Hughes, responsible for olive leaf spot (OLS). The emergence of OLS can be attributed, in part, to microclimate alterations, notably increased humidity, arising from the gradual re-naturalization processes occurring within these groves [52]. Detectable through visual symptoms, this air-borne fungi manifests as dark green to black round spots surrounded by a yellow halo on leaves [53], contributing to defoliation and the gradual demise of olive tree shoots and branches, ultimately resulting in reduced vegetative growth and a substantial decline in productivity [54,55,56].
Furthermore, in these rainfed agroecosystems, water stress emerges as a pivotal abiotic factor affecting the health and vitality of centennial olive trees [57,58,59]. Despite the fact that these trees are well-adapted to drought conditions [60] and their physiological adaptations, including their deep root systems and efficient water-use mechanisms, highlight their ability to thrive in arid environments while maintaining productivity [61], water availability, influenced by (a) natural factors such as erratic rainfall patterns [62], extended drought periods [61], as well as (b) human interventions including land use changes [63] and water extraction for irrigation [64], poses significant challenges to the olive trees’ water supply.
To monitor these challenges and assess their impact on olive tree health and productivity, the adoption of non-invasive techniques has largely taken precedence over invasive ones in centennial olive groves and other crop systems. Invasive approaches, which entail physically penetrating the trees for data collection [65,66] or treatment [67], despite their effectiveness in certain scenarios, carry the risk of introducing pathogens and causing mechanical damage, rendering them less suitable for routine monitoring and assessment of trees. Meanwhile, traditional laboratory-based plant disease detection methods which include physiological, biological, serological, and molecular tests [68,69], due to their complexity, cost, and the time-intensive nature of their execution, exhibit limitations when applied to the early detection, control, and management of plant health [70]. Conversely, non-invasive techniques have gained increasing prominence in the systematic monitoring of these challenges and the comprehensive assessment of their impact on tree health and productivity. These techniques offer innovative insights into the complex interplay between trunk irregularities [71], diseases [72,73], water stress [74,75], and overall tree vigor [76], whether considered individually for each problem or when examining a set of combined effects.
Among these non-invasive techniques, infrared thermography (IRT), a subset of remote sensing techniques [77,78,79], plays a pivotal role in evaluating tree physiology, facilitating early detection of stress factors [80,81] and precise interventions to ensure tree health [82,83] and productivity [46]. IRT captures temperature variations across different structures of the tree, including the canopy and trunk, providing valuable insights for identifying early signs of physiological stress stemming from factors like water deficiency [84,85,86,87] or diseases [88]. Moreover, IRT excels in assessing the impact of trunk irregularities, such as cavities, on tree health [82,89]. Temperature anomalies of these irregularities serve as indicators of potential issues related to water transport and structural integrity [89,90], and thus, IRT offers non-destructive and efficient means of pinpointing areas that may necessitate further examination or intervention [82]. At the same time, in the context of foliar diseases, temperature variations linked to disease progression become evident through IRT monitoring, enabling the timely implementation of disease management strategies, including targeted pruning or treatment [91].
Despite the recent widespread utilization of IRT in various fields of plant ecology and physiology [92,93,94], its application in assessing the state of centennial olive trees remains relatively limited. Moreover, no prior studies have endeavored to establish connections between IRT data, tree phenotypic metrics, and productivity, as well as its two primary abiotic and biotic stressors: water stress and fungal diseases. In this context, our research aims to comprehensively assess the health state of traditional centennial olive trees in a typical Mediterranean environment, with a particular focus on their productivity while considering both biotic and abiotic stressors, seeking to establish meaningful relationships between these indices and key factors influencing olive tree vitality. We hypothesize that the integration of IRT with phenotypic traits and stressors will provide a valuable tool for assessing and monitoring the health and overall state of centennial olive trees, offering a comprehensive approach to understanding the complex interactions shaping traditional olive grove dynamics, contributing to our knowledge of how environmental, physiological, and pathological factors influence olive tree health. For this, we collected phenotypic metrics from traditional centennial olive trees on Naxos Island, Cyclades, Greece, and integrated them with in situ IRT metrics to achieve the following objectives: (a) assess intraspecific thermal and humidity profile variations, (b) investigate the intricate relationships between tree phenotypic traits, thermal and humidity indices, and stressors impacting olive trees, (c) develop models to gain insights into the factors influencing olive tree productivity and water stress, (d) examine whether the phenotypic parameters of olive trees, along with IRT metrics and water stress levels, can elucidate the presence of one of the most common biotic stressors, olive leaf spot disease, and (e) examine potential distinctions among centennial olive trees experiencing the effects of this fungal disease.

2. Materials and Methods

2.1. Study Area and Olive Trees Selection

Naxos, the tenth-largest Greek island and the eighteenth-largest in the Mediterranean, is located in the central Aegean Sea within the Cyclades complex. It covers an area of 429.79 km2 and is characterized by a mountainous terrain, boasting three prominent peaks: Zas (1004 m a.s.l.), Koronos (998 m a.s.l.), and Fanari (888 m a.s.l.). Naxos experiences a climate marked by hot summers and a prolonged dry period lasting nearly seven months. Annual precipitation ranges from 300 to 400 mm, primarily concentrated between November and March, with peak rainfall occurring in December and January. Mean monthly temperatures vary from approximately 12 °C in winter to 25 °C in summer [95]. The island’s landscapes showcase remarkable diversity, with extensive slopes and terraces dominating the eastern and north-northeastern mountainous regions, facilitating the existence and cultivation of centennial traditional olive groves. In these mountainous areas, forest cover is limited and the predominant features are pastures and forest land characterized by shrub vegetation (Figure 1).
Traditional olive groves on the island host over 270,000 olive trees of the variety “Throubolia” (Municipality of Naxos and Small Cyclades, personal communication, 23 November 2018), spanning an area of 9813.8 ha, with the majority concentrated in the central region.
We selected a low-input traditional olive plantation in the northeastern part of the island, specifically in the Laoudis region (37°4′45.05″ N, 25°34′35.80″ E). Covering an area of 2.4 ha and situated at an altitude of 60 m a.s.l., this olive grove epitomizes the traditional character that aligns it with the concept of High Nature Value farmlands, exhibiting the typical features of traditional olive cultivation found in the Mediterranean. It retains the old-age “Throubolia” variety, which is known for its historical significance and cultural heritage [96,97], while the centennial olive trees have been cultivated using time-honored, low-input practices that prioritize sustainable land management, emphasizing traditional harvesting techniques (G. Zevgolis, personal communication, 18 December 2022). Additionally, the presence of terraces and dry-stone walls within this grove underscores its traditional character. These handcrafted stone structures serve both practical and ecological functions, reflecting a commitment to preserving the natural landscape and supporting biodiversity [27]. In parallel, the grove hosts a diverse array of flora and fauna, with the surrounding landscape characterized by its low-intensity land cover and semi-natural vegetation (pers. obs.), further emphasizing its role as a High Nature Value farmland.
In order to ascertain the centennial nature of this olive grove, we employed a combination of qualitative and quantitative methods. Classical indicators of tree age, including visual characteristics such as overall appearance, structural attributes, and trunk thickness [98], were employed alongside a quantitative approach utilizing an allometric equation proposed by Arnan et al. (Age = 2.11 × Diameter (cm) + 88.93; R2 = 0.80) [99]. The application of this allometric equation confirmed that the olive trees in this grove indeed qualify as centennial, with a calculated mean age of 218.27 ± 51.6 years. It is worth noting that we opted for this quantitative method due to inherent difficulties associated with measuring annual growth rings, primarily stemming from the presence of cavities and decaying tissues within the inner sections of the tree trunks [99,100].
Out of a total population of 176 olive trees within the grove, we selected a representative sample comprising 44 centennial olive trees through random sampling, constituting 25% of the entire population. To facilitate systematic data collection and future monitoring, each tree was assigned a unique code label, and all relevant information was recorded on an inventory form.

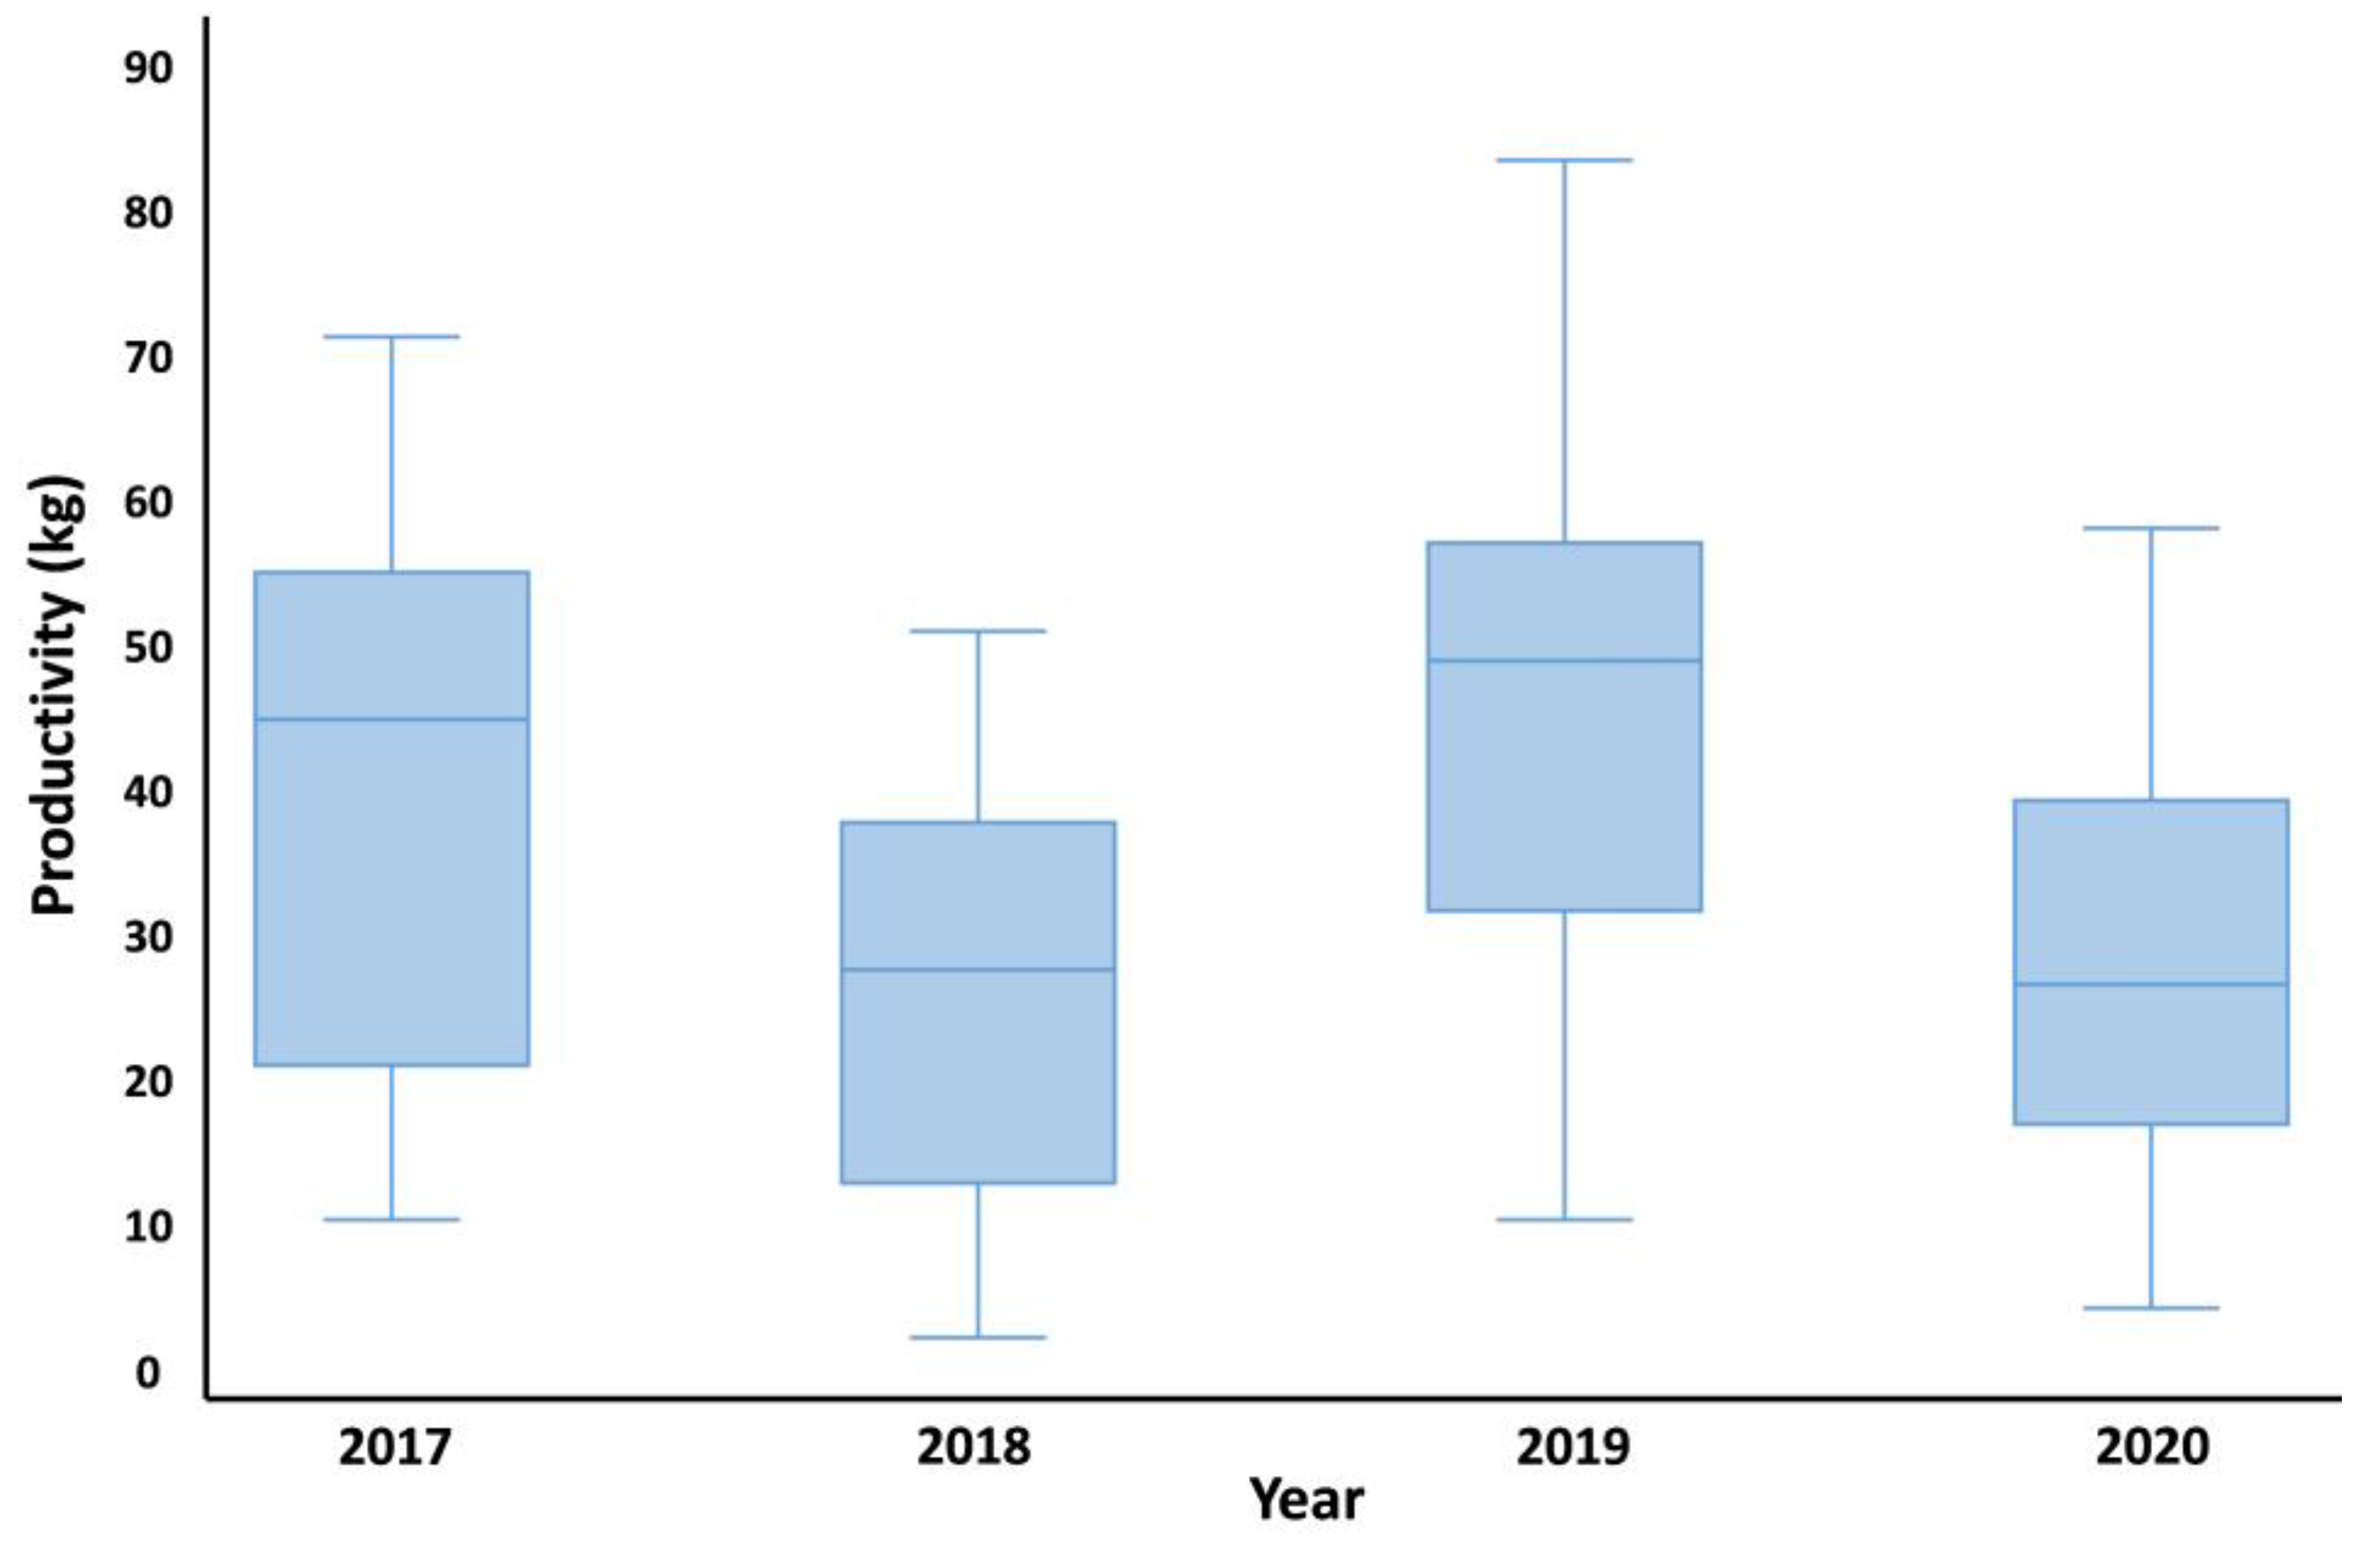
2.2. Productivity Metrics of Olive Trees

Over the course of four consecutive olive harvest seasons, spanning from 2017 to 2020, we conducted a comprehensive evaluation of annual productivity for both the entire grove and the specific group of 44 trees. In alignment with the traditional character of the grove and local agricultural practices in Greece, we adhered to customary manual olive harvesting techniques during the designated harvest period, which typically falls in mid-October each year. The traditional method of olive harvesting in Greece involves the use of elongated wooden poles to detach the fruit from the branches. Subsequently, these dislodged olives are efficiently gathered using expansive olive harvesting nets [101]. This widely adopted approach is particularly well-suited for regions with challenging terrains, including hilly or mountainous areas [102]. We systematically collected and measured the freshly harvested olives per tree on-site, employing a field precision scale for accuracy. Subsequently, aiming to obtain an accurate measure of their productivity, we computed the mean productivity for each individual tree (P—kg) by averaging the productivity values observed throughout the four-year period. Moreover, we also calculated each tree’s productivity range (Prange) to assess the extent of productivity variability exhibited by each tree over the four-year study period, which serves as an indirect metric reflecting the tree’s health state.

2.3. Phenotypic Metrics of Olive Trees

During the first harvest season, we conducted an extensive assessment of various phenotypic traits of centennial olive trees, aiming to gain a holistic understanding and data on their architectural structure and shape. We initially assessed the height of each tree using a clinometer (H—m) and measured the diameter at a standardized height of 1.3 m above the ground using a measuring tape (DBH—cm). Next, we distinguished between productive (PS) and unproductive shoots (US) by observing the presence or absence of fruit-bearing shoots on each tree. This distinction facilitated the calculation of the shoots ratio (SR), utilizing the formula SR = PS/(PS + US), where PS represents the number of productive shoots and US signifies the number of unproductive shoots. Additionally, we evaluated the crown area of each olive tree (CA—m2), employing the vertical sighting method (metrics of the major and minor axes of the crown) and calculating the enclosed area using established geometric formulas. This enabled us to assess the overall crown size and structure. In addition to these measurements, we conducted a visual assessment to evaluate the health of each tree’s crown. This assessment involved estimating the percentage of healthy leaves relative to the total leaf count within the crown. Thus, we subsequently formulated a healthy crown index (HC) using the formula HC = healthy leaves (%) × crown area (m2)/100. Lastly, we documented the presence and quantity of cavities within the trunk of each olive tree. In pursuit of a more comprehensive perspective, we used a parameter, the cavities ratio (CR), which gauged the proportion of cavities concerning each tree’s estimated age [46]. CR assumes particular significance in the context of olive trees, as they undergo the development of deep grooves and cavities, significantly influencing their overall health and productivity as they advance in age.

2.4. Assessment of Biotic Stressors—Olive Leaf Spot

We performed a systematic visual examination of the olive trees and their foliage to detect biotic stressors, encompassing diseases and pests. This examination included the scrutiny of olive leaves, branches, and trunks, with a specific focus on identifying indicators or signs of foliar diseases, with OLS, a fungal disease caused by the fungus Spilocaea oleagina (Castagne) Hughes, taking center stage. OLS stands out as one of the most prevalent diseases affecting olive trees, both on a global scale and in Naxos (pers. obs). To determine the presence of OLS, we conducted thorough visual examinations of olive leaves, identifying characteristic symptoms marked by the occurrence of small, dark lesions or spots on the leaf surfaces. These examinations were conducted approximately one month after the harvest period, specifically at the end of November, coinciding with the peak growth period of the fungus when cool and humid conditions prevail [103]. Our observations were systematically recorded and subsequently categorized into a binary variable, signifying the presence (1) or absence (0) of the OLS for each individual olive tree within the grove.

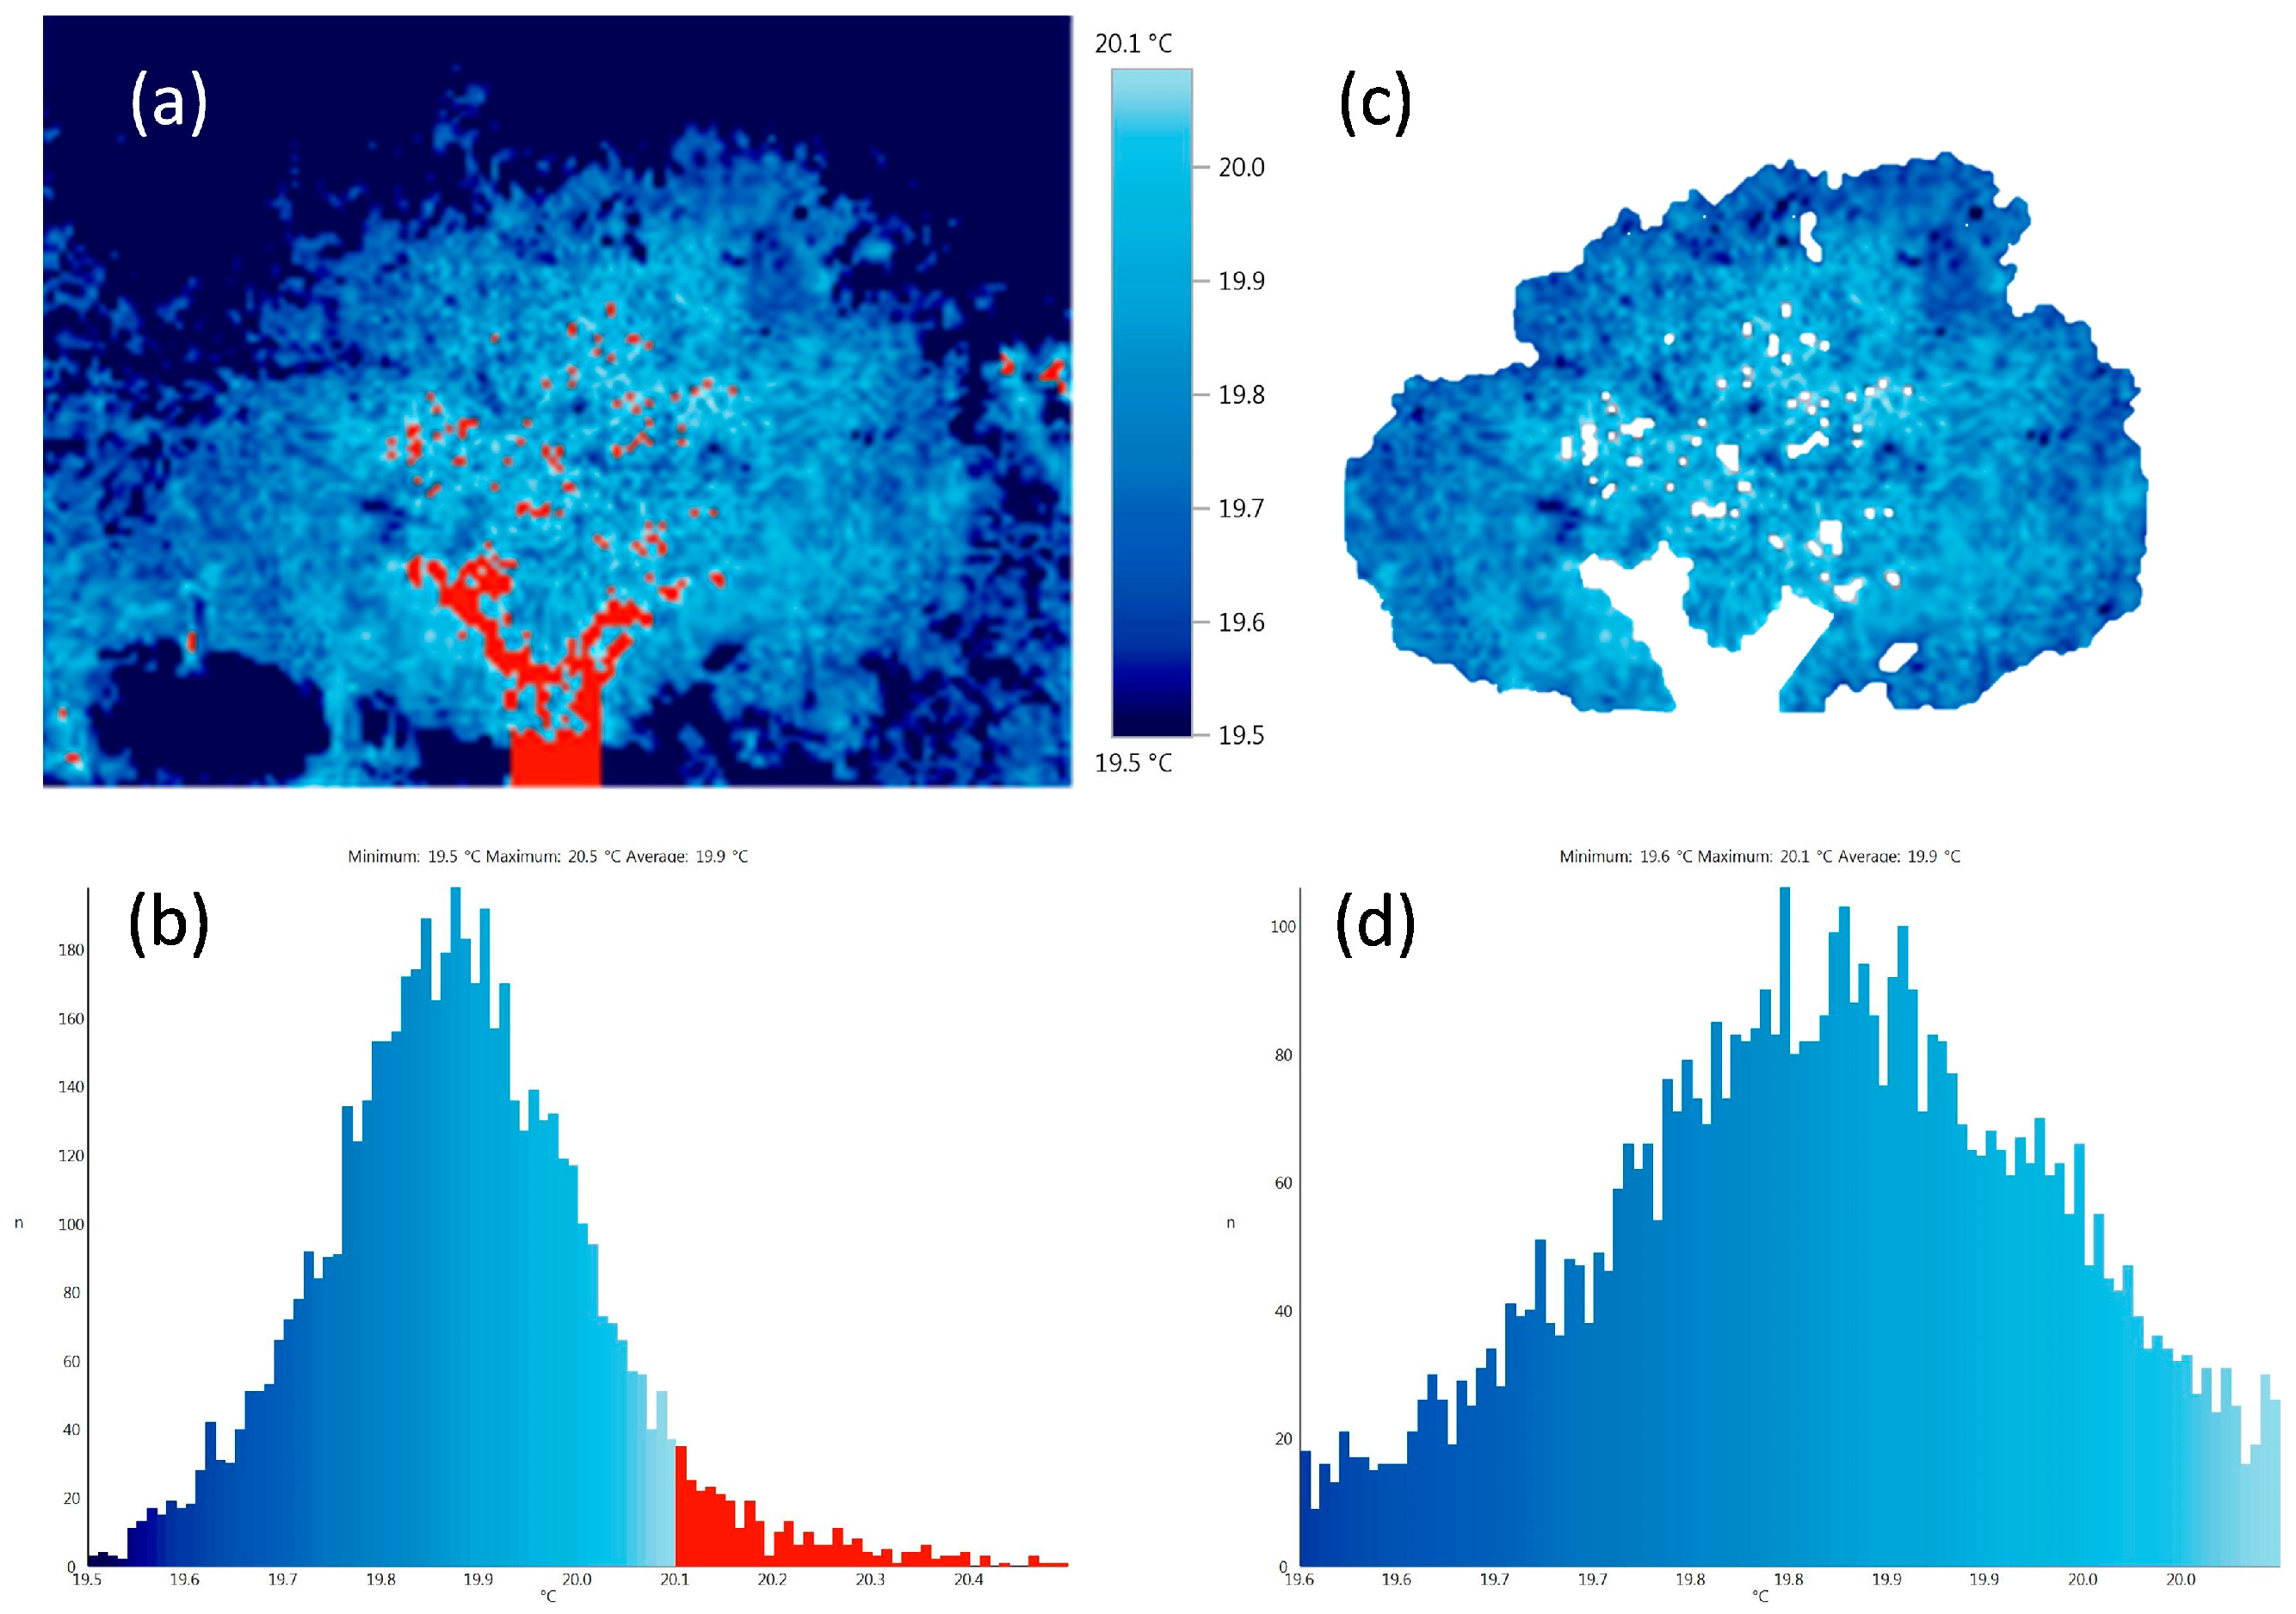
2.5. Assessment of Abiotic Stressors—Crop Water Stress Index

Canopy temperature, while a valuable indicator of leaf water status [104,105], remains susceptible to fluctuations induced by various environmental conditions, most notably radiative flux, air temperature, wind speed, and relative humidity [104]. Given the temporal variability in these environmental factors and their influence on crown temperature, a single-shot acquisition is not feasible and thus, normalizing canopy temperature becomes imperative to ensure meaningful comparisons [85]. The process of normalizing actual canopy temperatures involves utilizing high and low boundaries and subsequently calculating the Crop Water Stress Index (CWSI), a well-established approach in accounting for atmospheric condition variations [104,106,107,108]. Within this framework, the CWSI is defined by the following equation: CWSI = (Tcanopy − Twet)/(Tdry − Twet), where Tcanopy signifies the average temperature of the canopy and Twet and Tdry correspond to the temperatures of reference surfaces denoting fully wet and completely dry conditions, simulating maximum and minimum leaf transpiration. The CWSI scale ranges from 0 to 1, signifying well-watered to severely stressed conditions, while the derivation of Tdry and Twet can be accomplished through either empirical or analytical methodologies [85].
We employed IRT to estimate the CWSI using a handheld infrared camera (Testo 875-1i, Testo SE & Co. KGaA, Lenzkirch, Germany) securely mounted on a stable tripod to ensure precise positioning and stability during image capture. The infrared images were acquired before the olive harvesting season (late September) when the region had experienced a prolonged period of no rainfall for at least two months, from a lateral perspective at a standardized distance of 5.0 m and a height of 1.3 m, allowing for comprehensive cover of the entire tree canopy (Figure 2a). To minimize potential inaccuracies stemming from atmospheric composition [109], global radiation influences [110], and temperature fluctuations caused by solar radiation penetrating the tree canopy, image capture was conducted during morning hours. Subsequently, in the field, we undertook camera calibration by accounting for ambient temperature, relative humidity, and solar irradiance. This calibration process was facilitated through the utilization of a portable weather station and a solar radiation meter (Amprobe SOLAR-100). To further enhance the precision of our measurements, we conducted individual assessments beneath the olive tree canopies. Additionally, to ensure utmost accuracy, emissivity values for the olive tree leaves were set at a constant value of e = 0.98 [86].
We processed the collected infrared images using the TESTO IRSoft® software package (v. 4.3, Testo SE & Co., KGaA, Lenzkirch, Germany) to extract canopy temperature information. Initially, a temperature palette was applied to generate a comprehensive dataset of temperature values for the entire infrared image, which had a resolution of 160 × 120 pixels. Each pixel within this image represented a distinct temperature, offering insights into the thermal adaptation of the tree canopy to prevailing environmental conditions. To isolate the tree canopy (ROI) and separate it from the background elements such as the sky, soil, terraces, and neighboring olive trees, we employed the ArcGIS Analysis toolbox (v. 10.2, ESRI Inc., Redlands, CA, USA). This involved a series of steps to facilitate accurate temperature extraction: (a) data transfer: we began by exporting the calibrated infrared images from the TESTO software and subsequently importing them into the ArcGIS software in text file format. (b) Raster conversion: each imported text file was converted into a raster layer within the ArcGIS environment. This rasterization process allowed us to define the boundaries of the tree canopy manually (Figure 2c). (c) Canopy boundary definition: to delineate the extent of the tree canopy accurately, we created unique polygons in shapefile format. These polygons were drawn to encompass the entire canopy areas, ensuring precision in isolating the tree canopy. (d) Temperature extraction: this step involved extracting temperature values specifically from within the defined ROI. This process provided us with a dataset of temperature values representing the thermal characteristics of the olive tree canopies, allowing for further analysis and interpretation.
In order to comprehend the thermal profile of the tree canopies and derive the CWSI, we computed the typical central tendency and variability measures derived from the canopy temperature histograms. These measures served as fundamental indicators of the canopy’s thermal profile. To estimate the CWSI, we amalgamated a multitude of these derived metrics, placing particular emphasis on the mean canopy temperature (Tcanopy) and the dry reference temperature (Tdry), a parameter set to exceed the ambient temperature by 5 °C [105,111], while the wet reference temperature (Twet) was determined through measurements involving an artificial wet cloth [112]. This methodological choice aligns with an empirical approach that has been validated and proven to reliably represent the maximum leaf temperature across diverse environmental conditions [113,114]. Furthermore, we have also calculated the interquartile canopy temperature range (TIQR canopy) from each histogram.

2.6. Assesment of Olive Trees’ Health State

We evaluated the health state of the centennial olive trees by capturing infrared images and extracting temperature information from their trunks. For each tree, we captured two separate infrared images: one from the side of the trunk with the majority of cavities (referred to as “Side A”) and the other from the opposite side (referred to as “Side B”) (Figure 3). To enhance measurement accuracy, we maintained a closer distance of 3.0 m during image acquisition, ensuring comprehensive coverage of the entire tree trunk while minimizing potential interference from overlying leaves. During camera calibration, we further improved precision by setting the emissivity value to e = 0.95, which is ideal for tree trunks [115].
In the subsequent analysis of these trunk infrared images, we followed a procedure similar to the one used for canopy temperature analysis. However, in this case, we incorporated not only the temperature image palette but also integrated a humidity image palette (Figure 3a,b,g,h). The humidity palette was computed for each pixel, considering the relative surface moisture of the tree trunk. We then meticulously extracted temperature and humidity values from the defined tree trunk areas (Figure 3c,d,i,j).
To characterize the thermal and humidity profile of the tree trunks and establish relevant indices, we extracted temperature and humidity data from their respective histograms. Ensuring the assessment’s robustness required addressing data outliers and skewed distributions, we determined the interquartile ranges for trunk temperature and humidity on both Side A (TIQR Side A, HIQR Side A) and Side B (TIQR Side B, HIQR Side B) of each tree. For a comprehensive overview, we employed inter-percentile ranges from each trunk histogram, collectively forming the outer percentile ranges for both trunk sides (TOPR Side A, HOPR Side A, TOPR Side B, HOPR Side B). These indices encompassed temperature values associated with any external or internal irregularities present on the trunk. Furthermore, we calculated the differences between the two trunk sides (TIQR difference, HIQR difference, TOPR difference, HOPR difference).

2.7. Statistical Analysis

We utilized the R statistical environment for comprehensive data analysis. The data were represented as means ± standard deviation, and statistical significance was considered at the 5% level.
Given that metabolic pathways associated with alternate bearing can be influenced by a multitude of climatic events affecting both vegetative and reproductive aspects of olive trees, especially in traditional groves [116], we conducted an analysis of variance followed by Tukey’s test for multiple comparisons. This analysis aimed to explore whether the productivity of centennial olive trees exhibited a biennial fruiting pattern, shedding light on their fruit-bearing behavior.
Additionally, we delved into a within-species thermal and humidity pattern variations assessment focusing on the estimated thermal and humidity indices (TIQR, TOPR, HIQR, HOPR), for both sides of each olive tree’s trunk. This examination was conducted using t-tests to ascertain whether significant differences existed between these indices on the opposing sides of the trunk. The identification of such variations bears the potential to provide insights into the tree’s health state and any underlying structural issues that may be concealed. Indeed, the evaluation of temperature and humidity distribution on tree trunks assumes substantial importance as an indicative measure of their overall health condition [82].
Subsequently, we investigated the interrelationships between trees’ phenotypic information, thermal and humidity trunk and canopy indices, and CWSI using correlation statistics. Furthermore, a series of multiple linear regression analyses were employed, incorporating a backward elimination procedure to systematically dissect the collective impact of all variables on productivity. To ensure the validity of these analyses, we conducted checks for linear dependence by calculating the variance inflation factor (VIF), with a VIF threshold of >3 indicating multicollinearity [117]. Sequential removal of variables with the highest VIF values helped refine the models. Our analyses were divided into four distinct categories: the first three categories evaluated both the individual and combined effects of phenotypic traits and CWSI, as well as the influence of trunk and canopy thermal and humidity indices, on both mean productivity and the productivity for each year. The third category explored the effects of all variables on CWSI. Furthermore, we conducted a relative importance analysis for each model, quantifying the individual contributions of independent variables to the dependent variables (productivity and CWSI). This approach sheds light on the relative significance of these variables, enhancing our understanding of their roles within this ecological framework.
We further proceeded to explore the potential influence of productivity, phenotypic traits, CWSI, and canopy and trunk thermal and humidity indices of trees with and without OLS. For this, we developed a series of binary logistic regression models. This exploration involved the utilization of classification tables, which enabled us to compare observed data with model-predicted outcomes for three specific categories: (a) the impact of productivity and phenotypic traits variables, (b) the influence of thermal and humidity indices, and (c) the combination of all variables. Additionally, we conducted receiver operating characteristic (ROC) curve analysis to assess the overall predictive accuracy of our models. To determine the general significance of these models, we applied the Hosmer–Lemeshow goodness-of-fit test, a statistical tool that evaluates the alignment between actual and predicted results. Furthermore, we computed Nagelkerke’s R2, serving as an explanatory metric of model variation and offering insights into the extent to which predictor variables accounted for variance in the presence or absence of OLS.
Finally, we conducted t-tests to evaluate whether there were statistically significant differences in the measured variables between centennial olive trees that were affected by OLS and those that were unaffected. To enable meaningful comparisons across variables with diverse measurement scales, we employed z-score normalization. This standardization ensured effective comparisons across variables measured in different units or scales, facilitated outlier detection, and offered an interpretable scale. This analysis allowed us to determine if the presence of OLS had a discernible impact on the measured parameters and provided insights into how the disease might affect the health and characteristics of the olive trees.

3. Results

3.1. Centennial Olive Trees’ Traits and Productivity

The non-productive structures of olive trees exhibited mean values as follows: height (H) of 6.98 ± 1.75 m, diameter at breast height (DBH) of 68.03 ± 24.39 cm, unproductive shoots (US) of 3.7 ± 2.35, cavities of 4.5 ± 4.04, and cavity ratio (CR) of 0.02 ± 0.01. On the other hand, productive structures of the olive trees, such as productive shoots (PS), crown area (CA), and healthy crown (HC), displayed mean values of 10.45 ± 6.59, 69.29 ± 35.59 m2, and 49.89 ± 37.64 m2, respectively. Detailed descriptive statistics of the olive trees’ phenotypic traits are presented in Table 1.
In terms of the mean productivity, the 44 olive trees exhibited a mean of 35.44 ± 1.98 kg of olives over the four harvest years and a productivity range between those years of 29.79 ± 1.98 kg. In total, the examined olive trees produced a yield of 1749 kg of olive fruit during the 2017 harvesting season, 1192 kg during 2018, 2045 kg during 2019, and 1252 kg during 2020.
An analysis of variance revealed significant variations in annual productivity across the harvest years 2017 to 2020 [F (3, 172) = 14.37, p < 0.001]. Subsequent post hoc Tukey’s tests indicated that the 2017 productivity (39.75 ± 18.00 kg) significantly differed from both the 2018 (27.09 ± 13.93 kg; p = 0.002, 95% C.I. = 3.66, 21.65) and 2020 (28.45 ± 13.52 kg; p = 0.007, 95% C.I. = 2.30, 20.28) harvest years. However, there were no significant differences with the 2019 harvest year (46.47 ± 18.86 kg; p = 0.215, 95% C.I. = −15.71, 2.26). Consistent with the productivity pattern observed in 2017, the harvest years of 2018, 2019, and 2020 followed a similar trend, exhibiting significant differences with their preceding and succeeding harvest years (Figure 4).

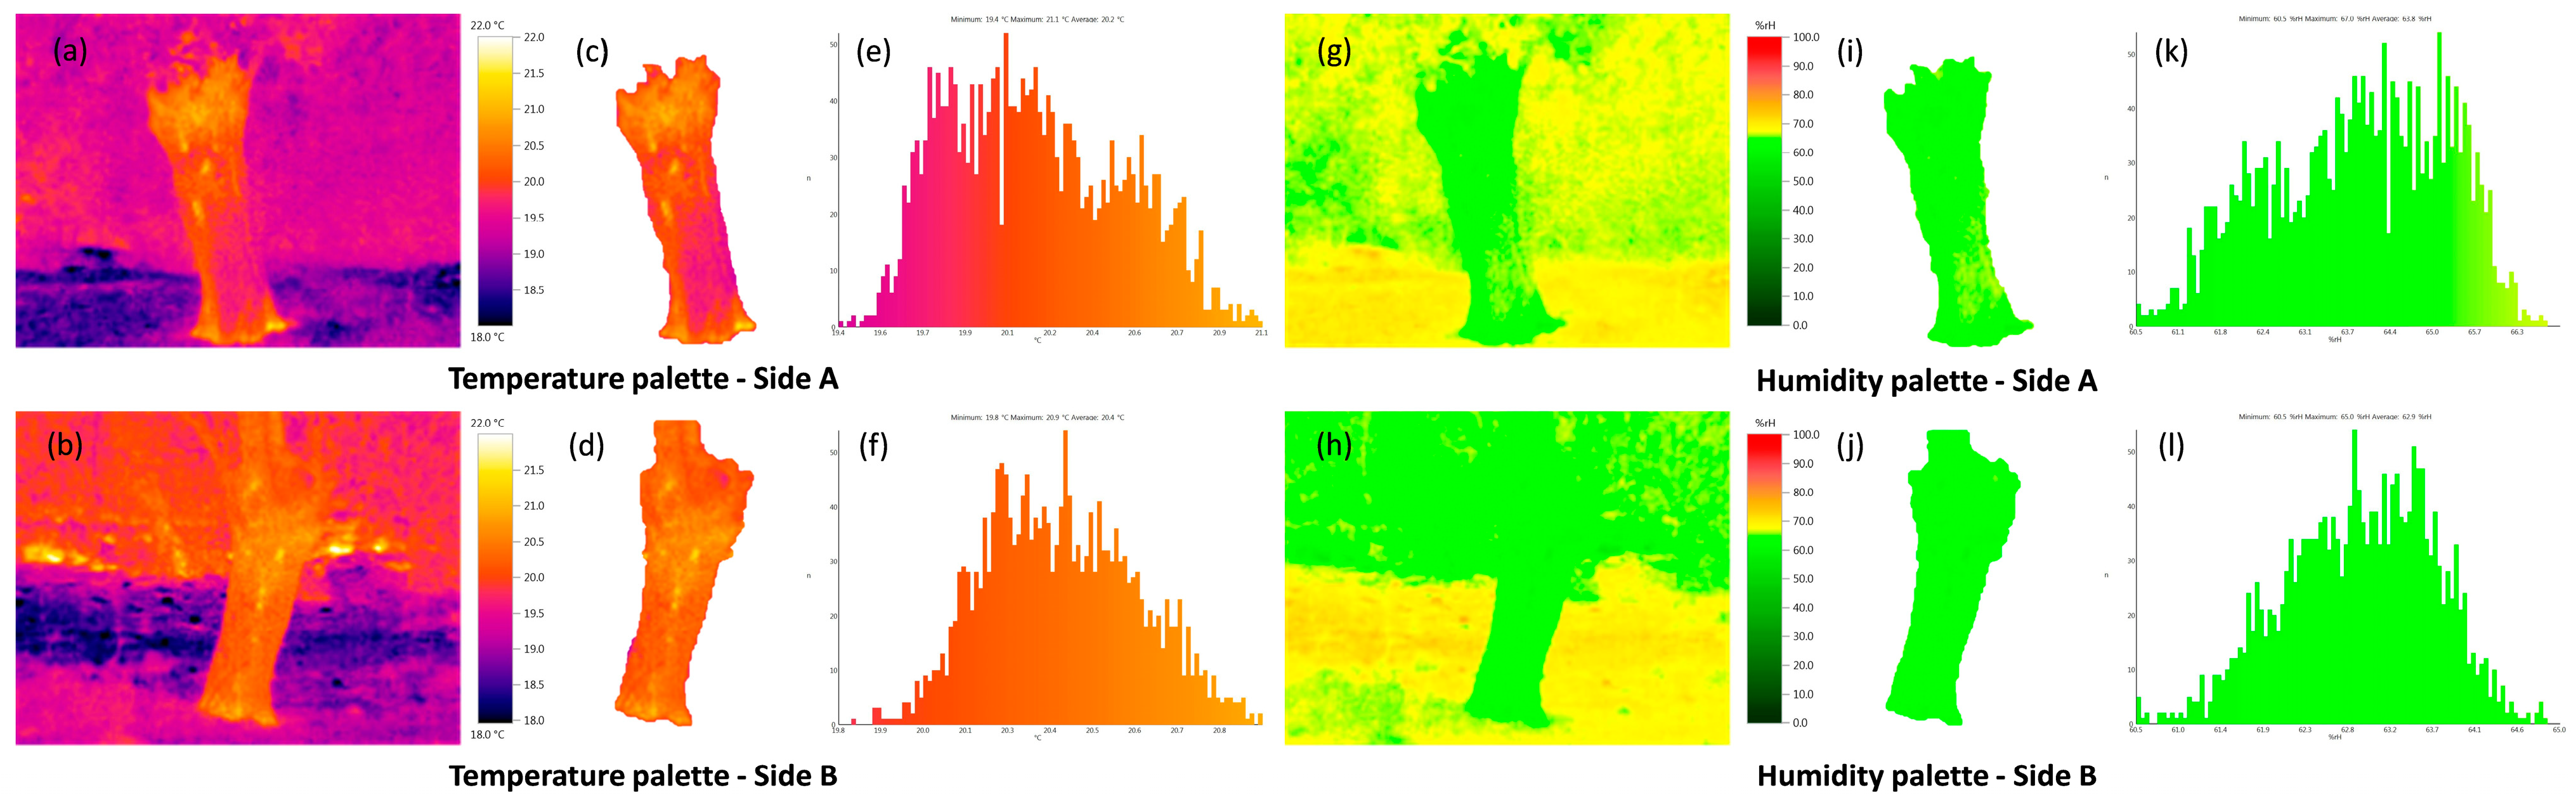
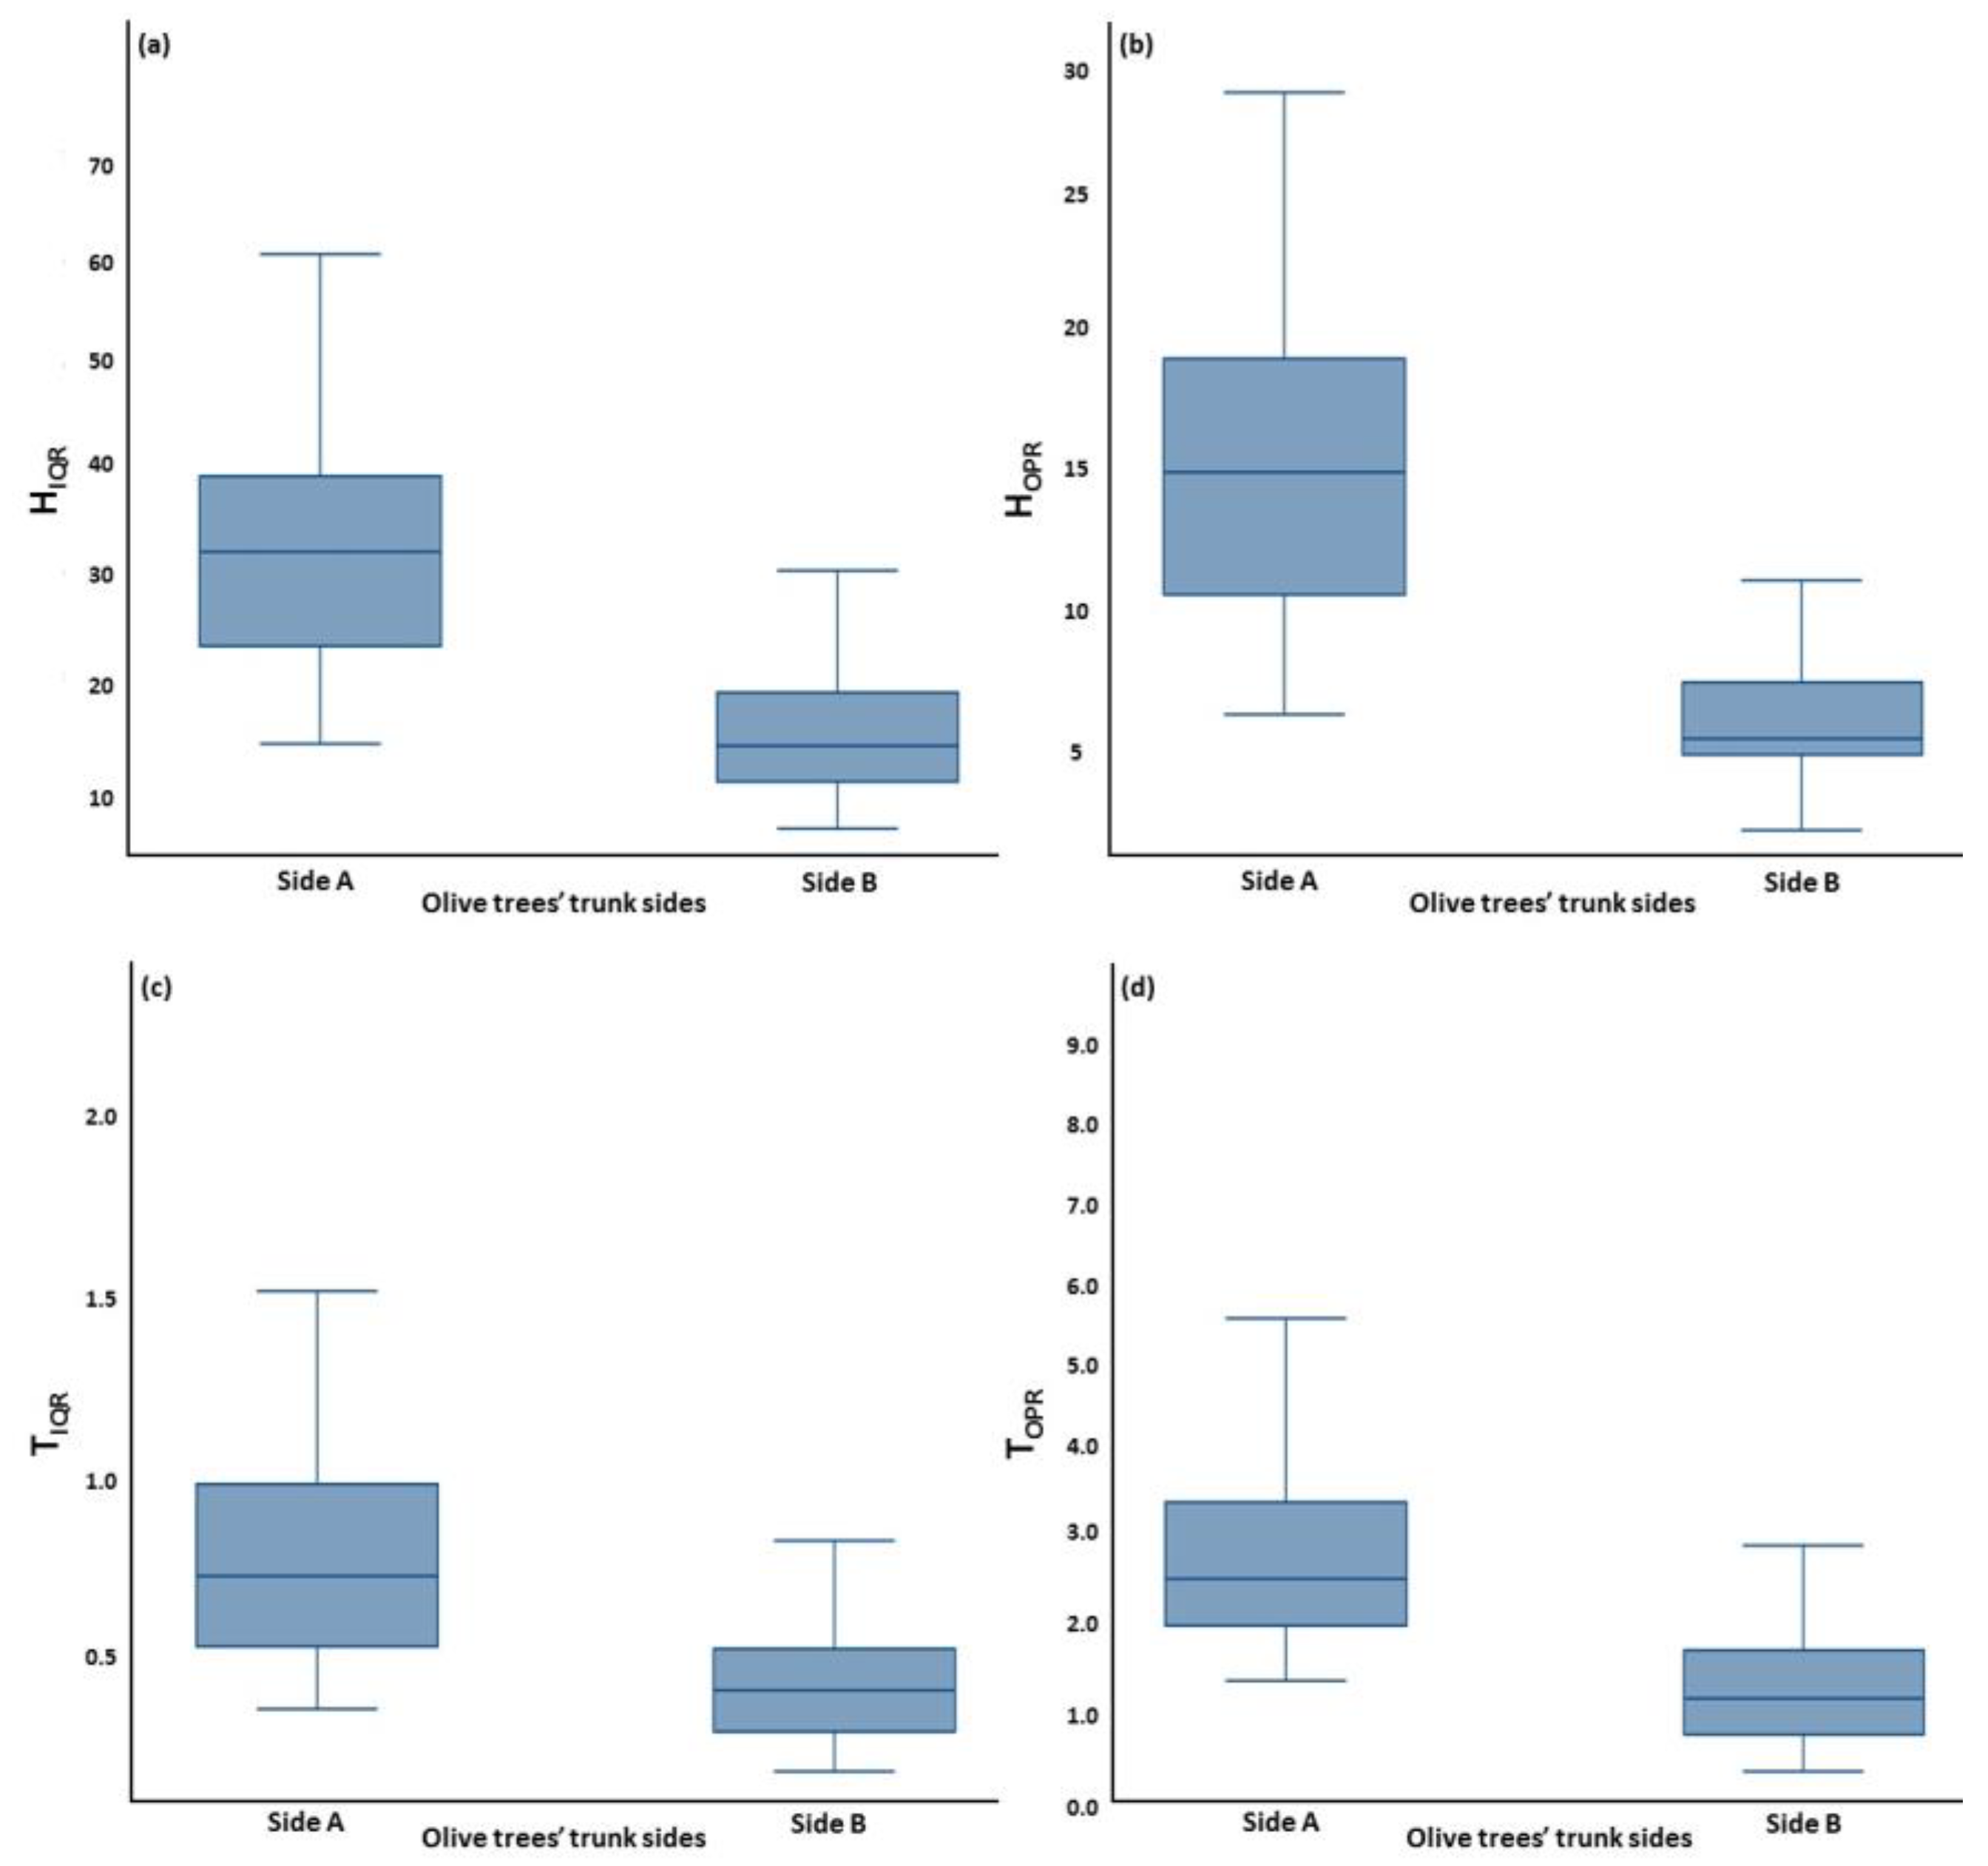
3.2. Olive Trees’ Trunk Humidity and Thermal Pattern Variations

The microclimate under the olive trees canopy in the study area during the infrared images acquisition displayed a mean ambient temperature of 19.4 ± 0.9 °C, a mean relative humidity of 55.6 ± 4.0%, and a mean solar intensity of 9.3 ± 0.3 W/m2. These climatic parameters played a crucial role in the accurate calibration of the infrared images. Olive tree trunks had a mean temperature of 17.7 ± 1.3 °C, with a minimum temperature of 14.6 ± 1.5 °C and a maximum temperature of 20.4 ± 1.5 °C. Throughout the IRT procedure, we gathered a total of 88 infrared images, encompassing two images per tree trunk. Trees’ humidity patterns, as described by the trunk humidity indices, exhibited a mean interquartile range for Side A (HIQR Side A) of 3.33 ± 1.30% and an interquartile range of 1.45 ± 0.69% for the opposite side of the trunk (HIQR Side B). The HOPR Side A displayed a mean value of 15.63 ± 6.29%, while the HOPR Side B recorded a value of 6.34 ± 2.72%. The HIQR difference and the HOPR difference displayed 1.87 ± 1.09% and 9.29 ± 6.65% values, respectively. Shifting our focus to tree thermal patterns, represented by the trunk thermal indices, the mean value for TIQR Side A was 0.81 ± 0.40 °C, while for TIQR Side B it stood at 0.44 ± 0.19 °C. Furthermore, the outer percentile ranges for both sides, TOPR Side A and TOPR Side B, had mean values of 3.12 ± 1.62 °C and 1.28 ± 0.75 °C, respectively. The TIQR difference had a mean value of 0.38 ± 0.32 °C and the TOPR difference had an average of 1.84 ± 1.12 °C.
In all cases, both the humidity and thermal indices exhibited clear differentiation between the two sides of the tree trunk (Figure 5). T-tests performed to assess these differences between the trunk sides revealed statistically significant variations for (a) HIQR [t (86) = 8.403, p < 0.001; Figure 5a], (b) HOPR [t (86) = 8.982, p < 0.001; Figure 5b], (c) TIQR [t (86) = 5.512, p < 0.001; Figure 5c], and (d) TOPR [t (86) = 6.811, p < 0.001; Figure 5d].

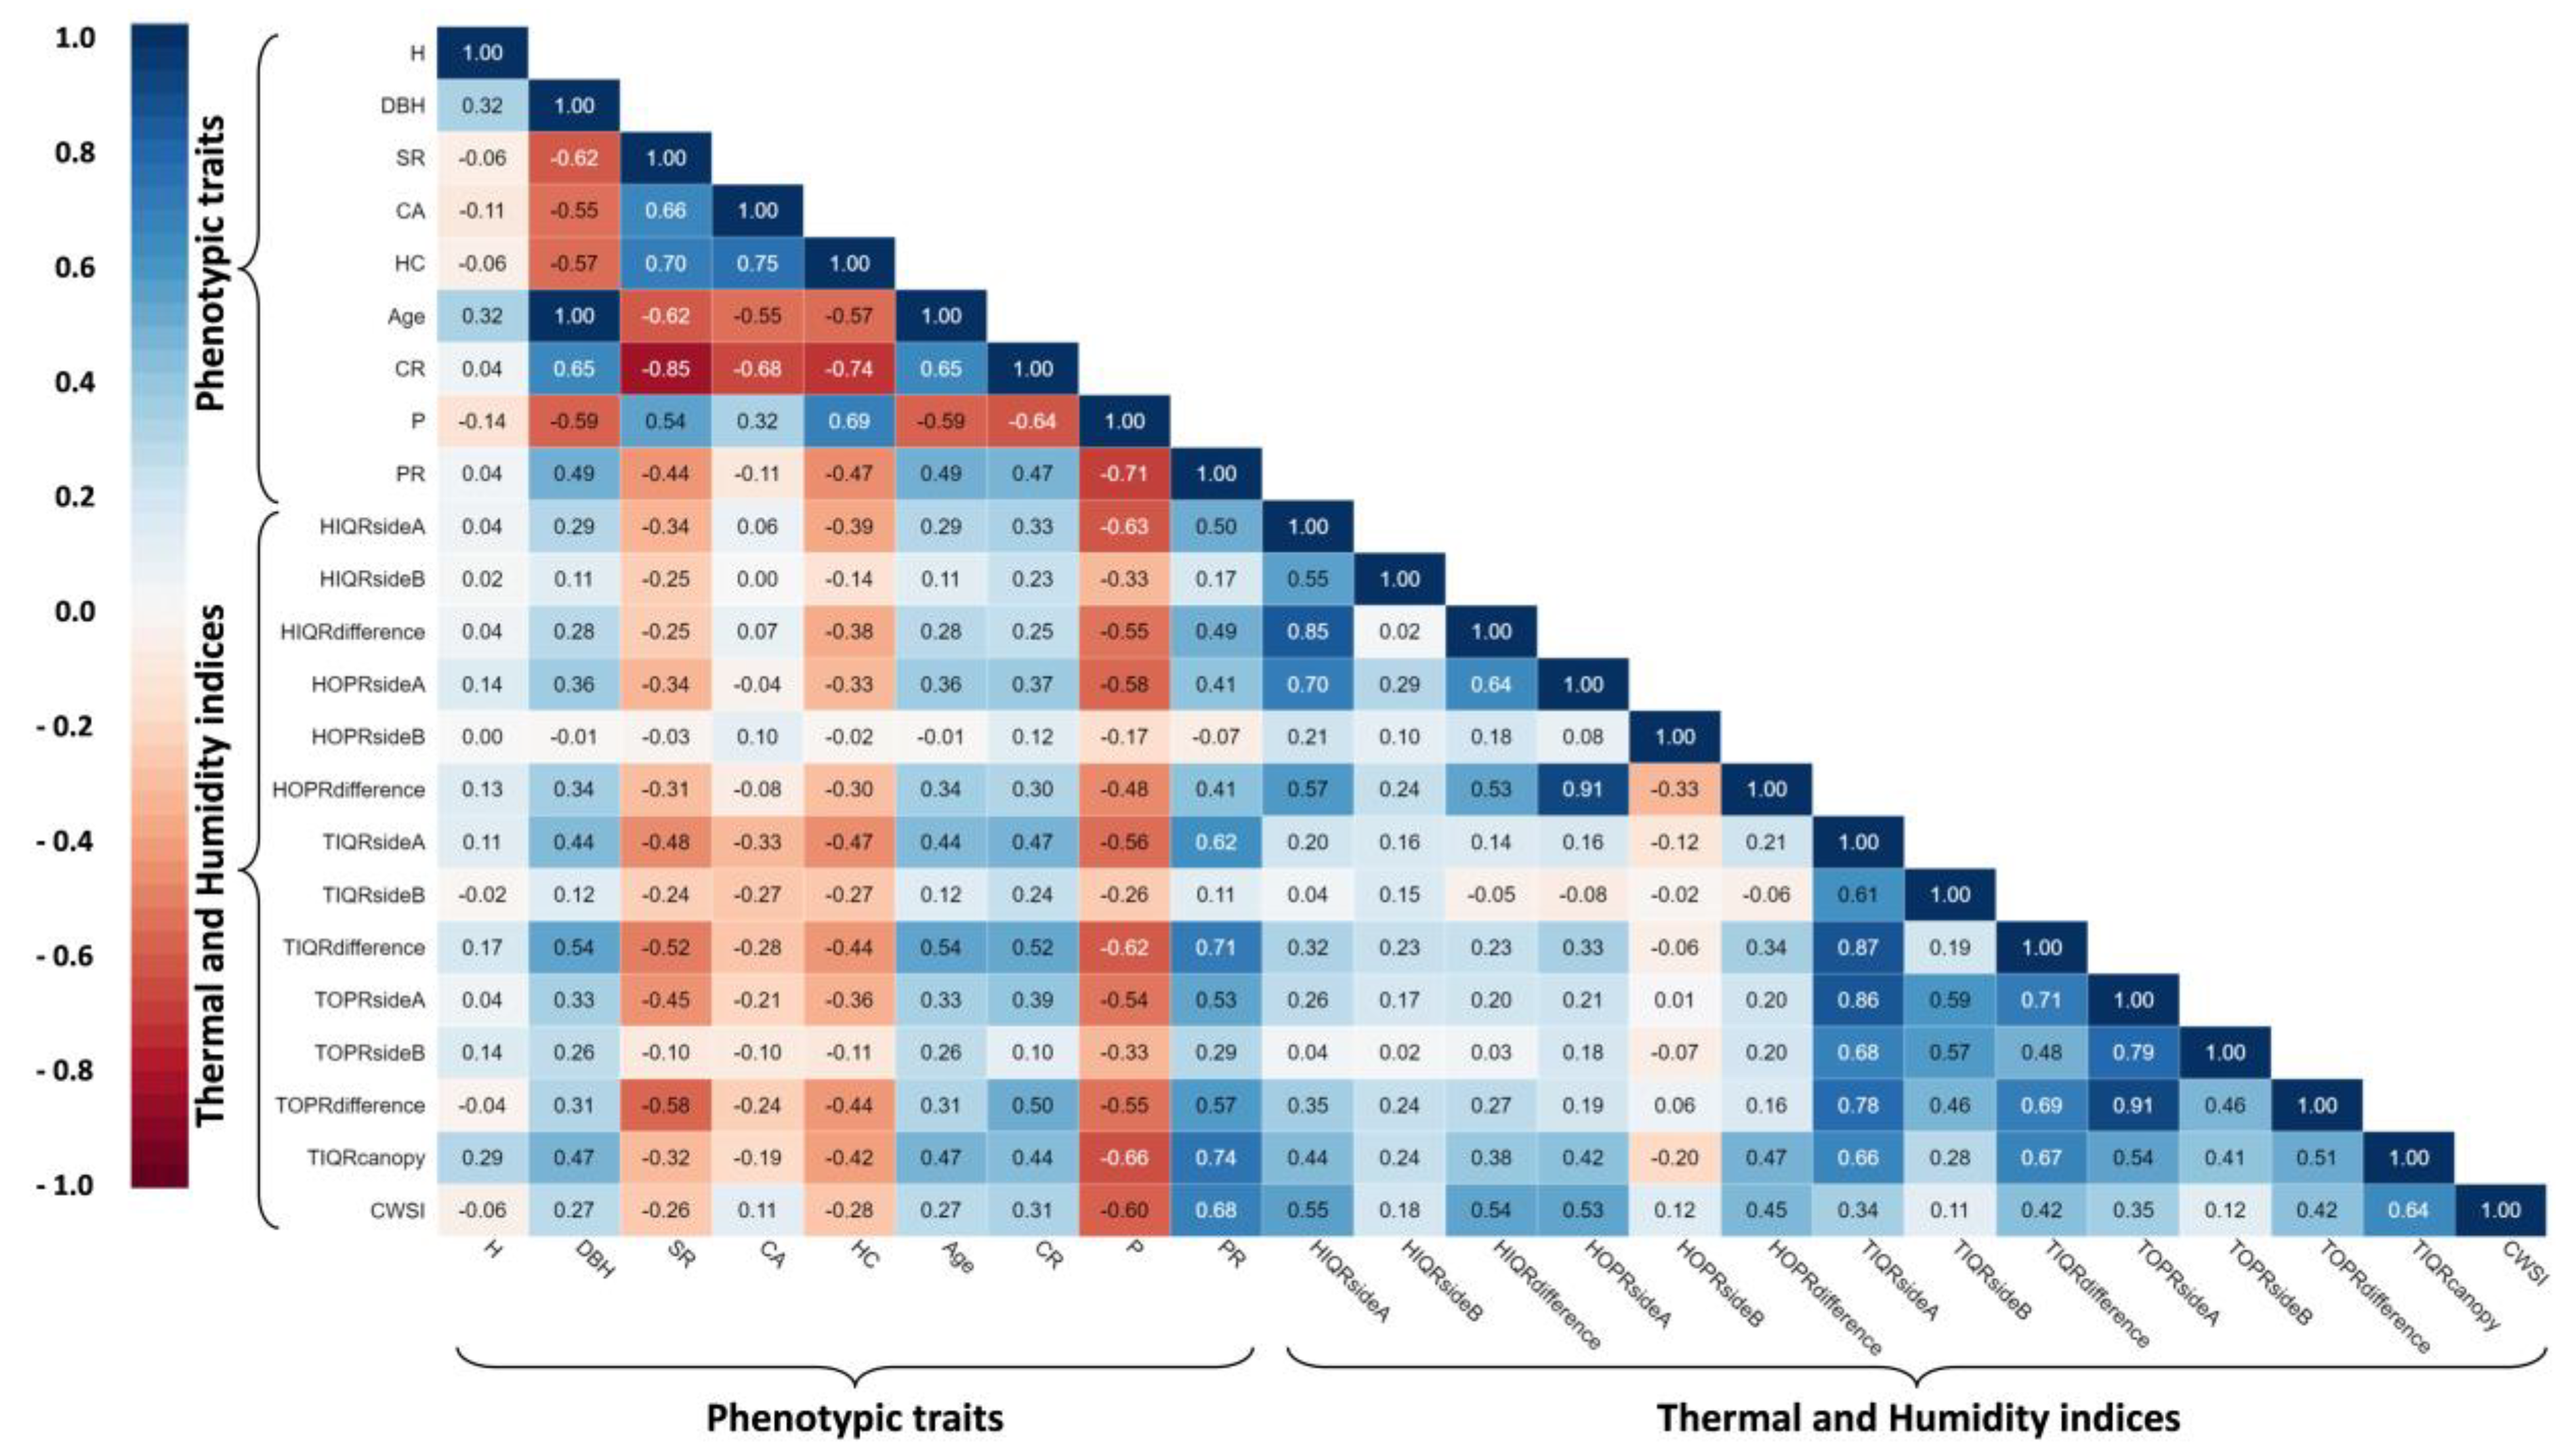
3.3. Interrelationships among Productivity, Phenotypic Traits, Thermal and Humidity Indices, and CWSI

Investigating the relationships between productivity, phenotypic traits, trunk and canopy thermal and humidity indices, and CWSI, we examined a total of 23 variables. It is important to mention that certain variables were employed in the construction of composite variables and were not analyzed individually (e.g., PS, US, cavities, healthy leaves). Additionally, no categorical variables (OLS) were included in the analysis due to the nature of the correlation analysis, which primarily deals with continuous variables. The productivity of centennial trees exhibited significant associations, either positive or negative, with a total of 18 variables. Among these, six pertained to phenotypic traits, eleven related to trunk thermal and humidity indices, and two were associated with canopy-related indices (TIQR canopy, CWSI) (Figure 6). Delving into the specifics, concerning phenotypic traits, productivity displayed noteworthy positive correlations with SR (r = 0.54, p < 0.05), CA (r = 0.32, p < 0.05), and HC (r = 0.69, p < 0.05). In contrast, it exhibited negative correlations with DBH (r = −0.59, p < 0.05), Age (r = −0.59, p < 0.05), CR (r = −0.64, p < 0.05), and Prange (r = −0.71, p < 0.05). Turning to the trunk thermal and humidity indices, productivity demonstrated negative relationships with all of them, with correlation coefficients ranging from −0.26 to −0.66 (p < 0.05). Moreover, it exhibited negative correlations with TIQR canopy (r = −0.66, p < 0.05) and CWSI (r = −0.60, p < 0.05).
The examined phenotypic traits displayed both direct and inverse relationships among themselves, as illustrated in Figure 6. In contrast, trunk thermal and humidity indices primarily exhibited positive associations, and this pattern was consistent between TIQR canopy and CWSI.

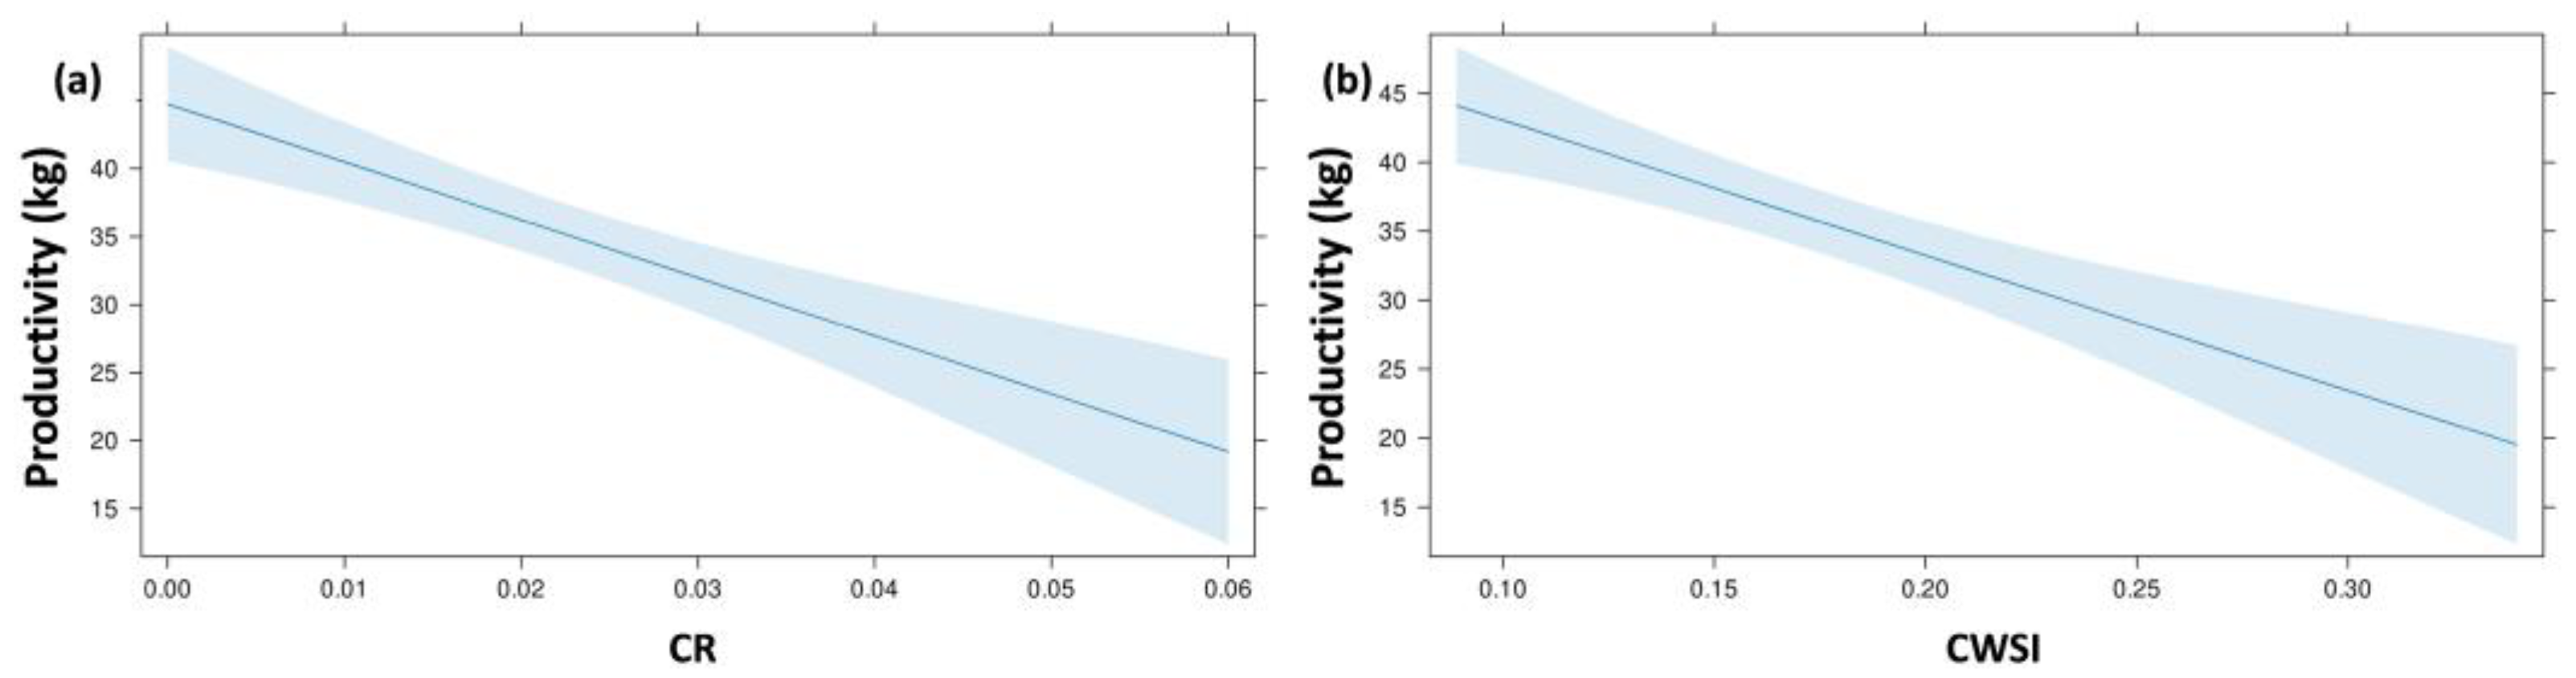
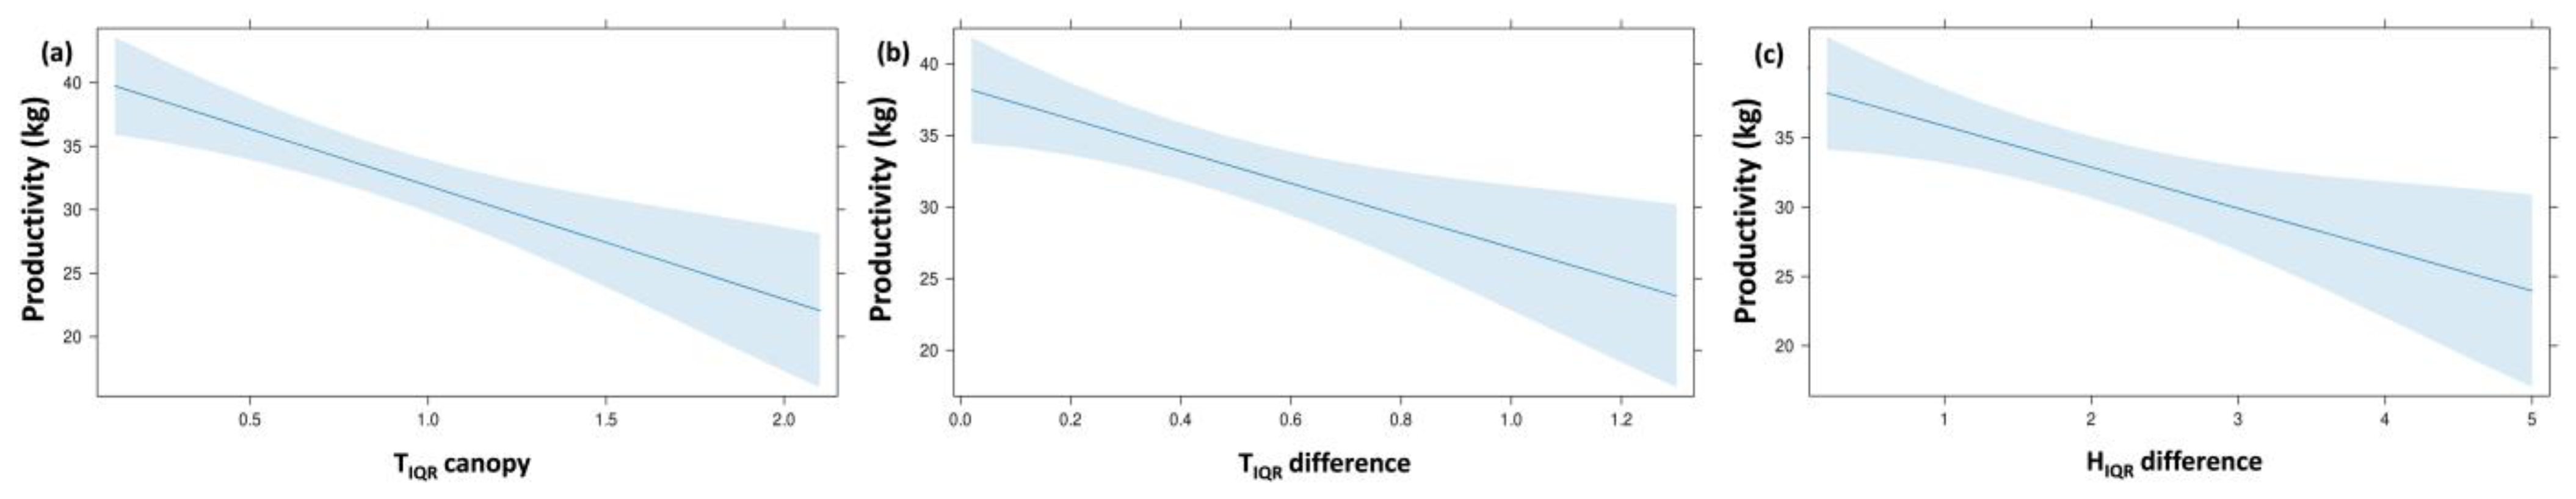
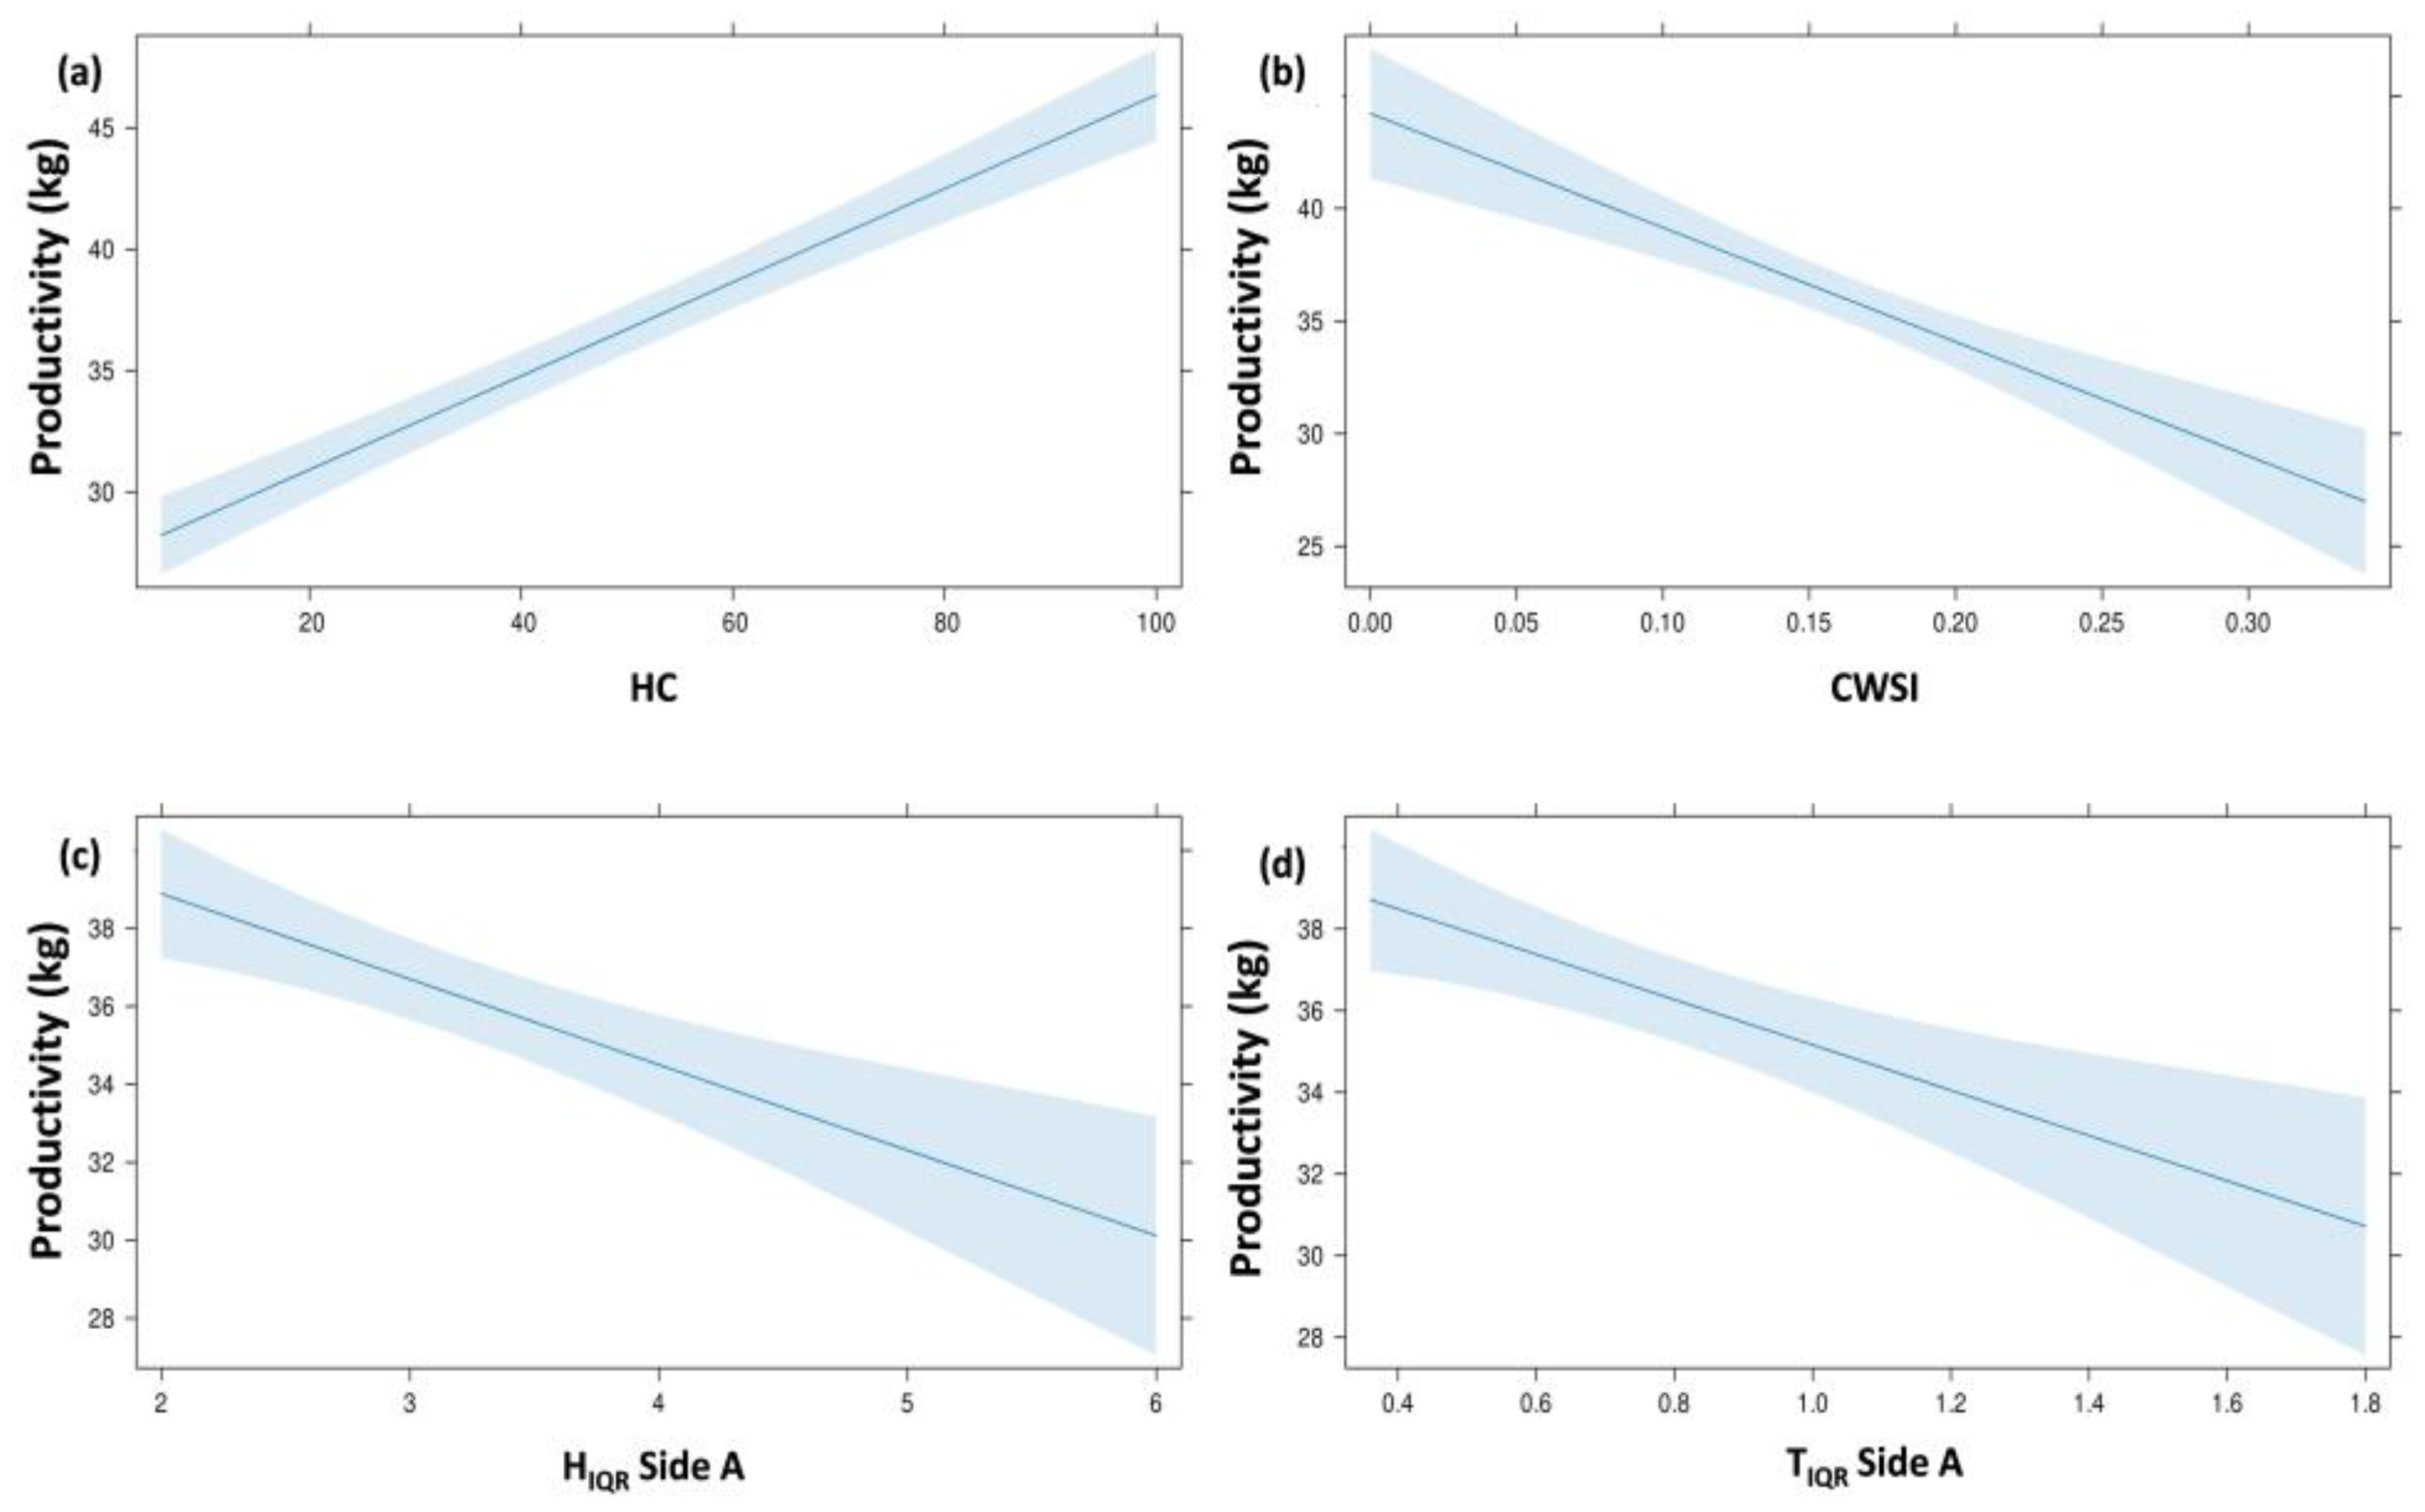
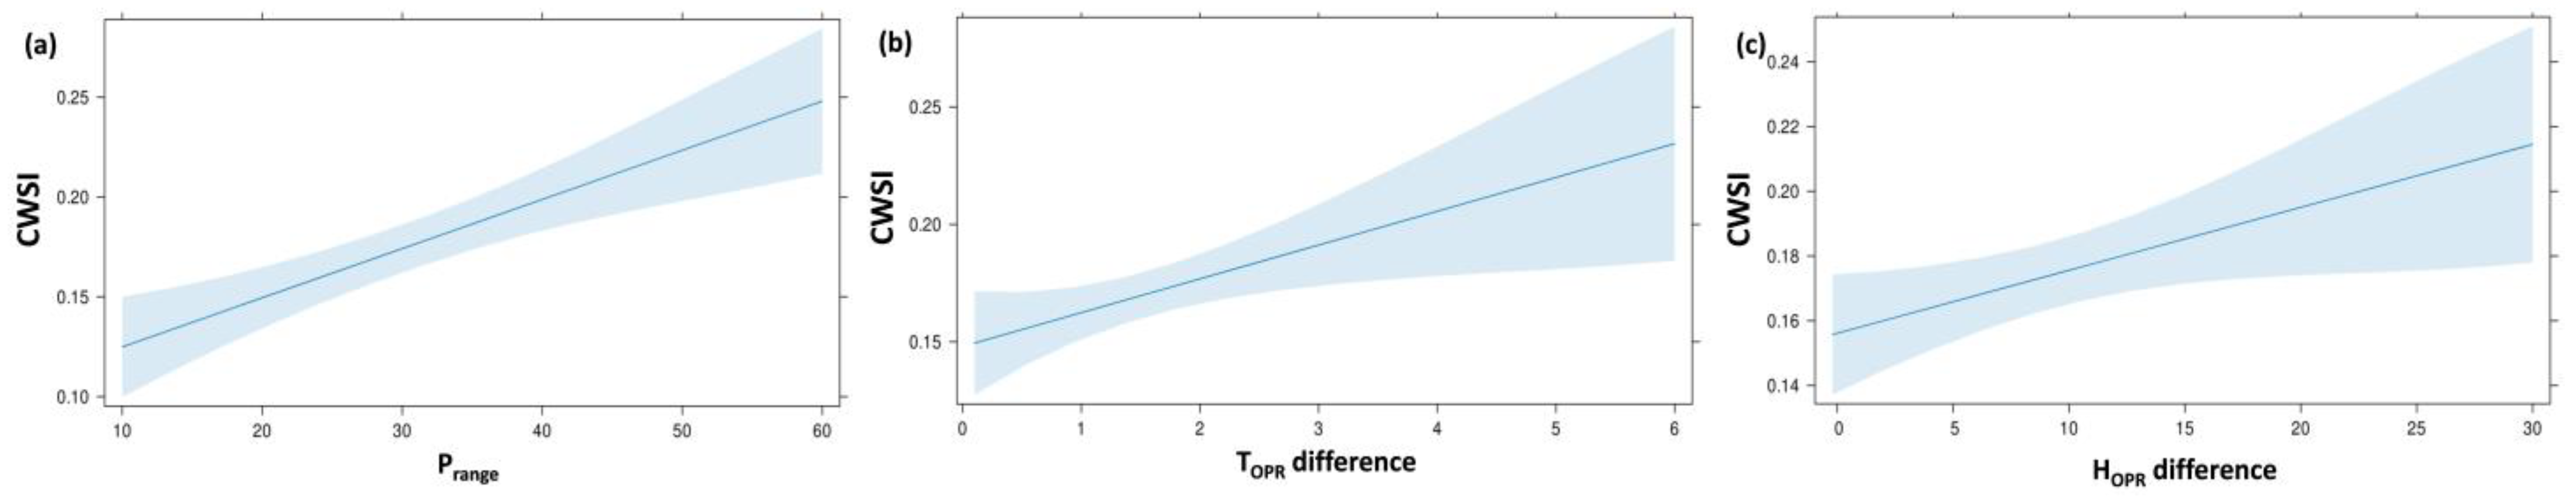
3.4. Influence of Phenotypic Traits, Thermal, and Humidity Indices on Productivity and CWSI

Building upon the correlation analysis, which revealed the initial relationships between variables, we proceeded to linear regression analysis with backward elimination to assess how the phenotypic traits and thermal/humidity indices impact productivity and CWSI, providing a deeper understanding of their interactions. Similar to the correlation analysis, we omitted certain variables (e.g., DBH, PS, US, cavities, healthy leaves) from all models. These traits were utilized in the formation of composite variables, playing crucial roles in estimating SR, HC, and Age. The results demonstrate that certain traits and indices, either individually or in combinations depending on the variable set, serve as statistically significant predictors of productivity. The analyses for productivity for each harvest season resulted in a total of 12 statistically significant models; 3 for each season (Table A1, Table A2, Table A3 and Table A4 in Appendix A). In the case of mean productivity, the model incorporating phenotypic traits and CWSI demonstrated significance [F (3, 41) = 26.799, p < 0.05], exhibiting an adjusted R2 of 54.5%. The second model, which integrated trunk thermal and humidity indices as independent variables, also achieved significance [F (3, 40) = 19.983, p < 0.05], displaying a higher explanatory power (R2 = 0.57). Lastly, the third model, encompassing all variables, was also statistically significant [F (4, 39) = 27.384, p < 0.05], with the highest explanatory power among all models at 71.1% (Table 2).
The relative importance analysis provided valuable insights into the contribution of each independent variable to productivity. In the model incorporating phenotypic traits and CWSI, the most influential variables were CR (Relative Importance = −66.17) and CWSI (Relative Importance = −33.83). In the second model, utilizing thermal and humidity indices, TIQR canopy (Relative Importance = −45.76) emerged as the most influential variable, followed by TIQR difference (Relative Importance = −33.25) and HIQR difference (Relative Importance = −20.99). Finally, in the third model that combined all variables, HC (Relative Importance = 33.55), HIQR Side A (Relative Importance = −25.46), TIQR Side A (Relative Importance = −19.84), and CWSI (Relative Importance = −21.15), were the most influential factors. These findings highlight the significance of specific phenotypic traits and thermal indices, demonstrating their varying degrees of importance in predicting productivity in centennial olive trees.
In conjunction with the relative importance analysis, effect plots were employed to further elucidate the effects of the most influential variables on centennial olive tree productivity. Effect plots provide a visual representation of how specific variables impact centennial olive tree productivity. These visualizations (Figure 7, Figure 8 and Figure 9) complement the relative importance analysis by offering insights into the direction and magnitude of each influential variable’s effect.
Regarding CWSI, the linear model encompassing all variables exhibited statistical significance [F (3, 40) = 13.948, p < 0.05], with an adjusted R2 of 47.5% (Table 3). The relative importance analysis highlighted Prange with a Relative Importance of 62.78 as the most influential variable, trailed by HOPR difference (Relative Importance = 19.52) and TOPR difference (Relative Importance = 17.70). The impact of these variables is visually depicted in Figure 10, providing a clear illustration of their effects on CWSI.

3.5. Assessing the Occurrence of OLS

Out of the 44 centennial olive trees sampled for fungal infestation, 26 were found to be affected. The logistic regression analysis concerning the phenotypic traits revealed a significant model [χ2 (1, N = 44) = 33.29, p < 0.05; Table 4], demonstrating an overall classification accuracy of 90.9%. Specifically, the accuracy was 88.9% for non-infected trees and 92.3% for infected trees. The model achieved an area under the curve (AUC) of 0.95 (S.E. = 0.03, 95% CI 0.87–1.00, p < 0.05), indicating excellent predictive performance. Nagelkerke R2 explained 71.6% of the total variance in the data, while the Hosmer–Lemeshow goodness-of-fit test yielded a satisfactory result (Hosmer–Lemeshow = 21.25, p > 0.05).
The analysis for the thermal and humidity indices yielded an overall classification accuracy of 84.1%, with 77.8% for non-infected trees and 88.5% for infected ones [χ2 (1, N = 44) = 20.43; p < 0.05; Table 4]. The Nagelkerke R2 value was 0.501, indicating that this model explained a substantial portion of the total variance in the data. The Hosmer–Lemeshow goodness-of-fit test result was 4.28, with a p-value greater than 0.05, suggesting a good fit of the model to the data. Additionally, the AUC for this model was 0.86 (S.E. = 0.05, 95% CI 0.74–0.97, p < 0.05), which signifies a reasonably high level of predictive accuracy.
Finally, in the combined model that incorporated both phenotypic traits and thermal and humidity indices, we achieved a significant model [χ2 (4, N = 44) = 40.02, p < 0.05; Table 4]. Collectively, the variables explained 80.5% of the total variance in the data, as evidenced by the Nagelkerke R2. The model demonstrated a good fit to the data, as indicated by result of the Hosmer–Lemeshow test (Hosmer–Lemeshow = 6.40; p > 0.05). Furthermore, the AUC (AUC = 0.98, S.E. = 0.01, 95% CI 0.94–0.99, p < 0.05) revealed that the model accurately classified trees with and without OLS infection in 93.2% of cases. The predicted classification accuracy was 94.4% for trees without OLS and 92.3% for trees with OLS.

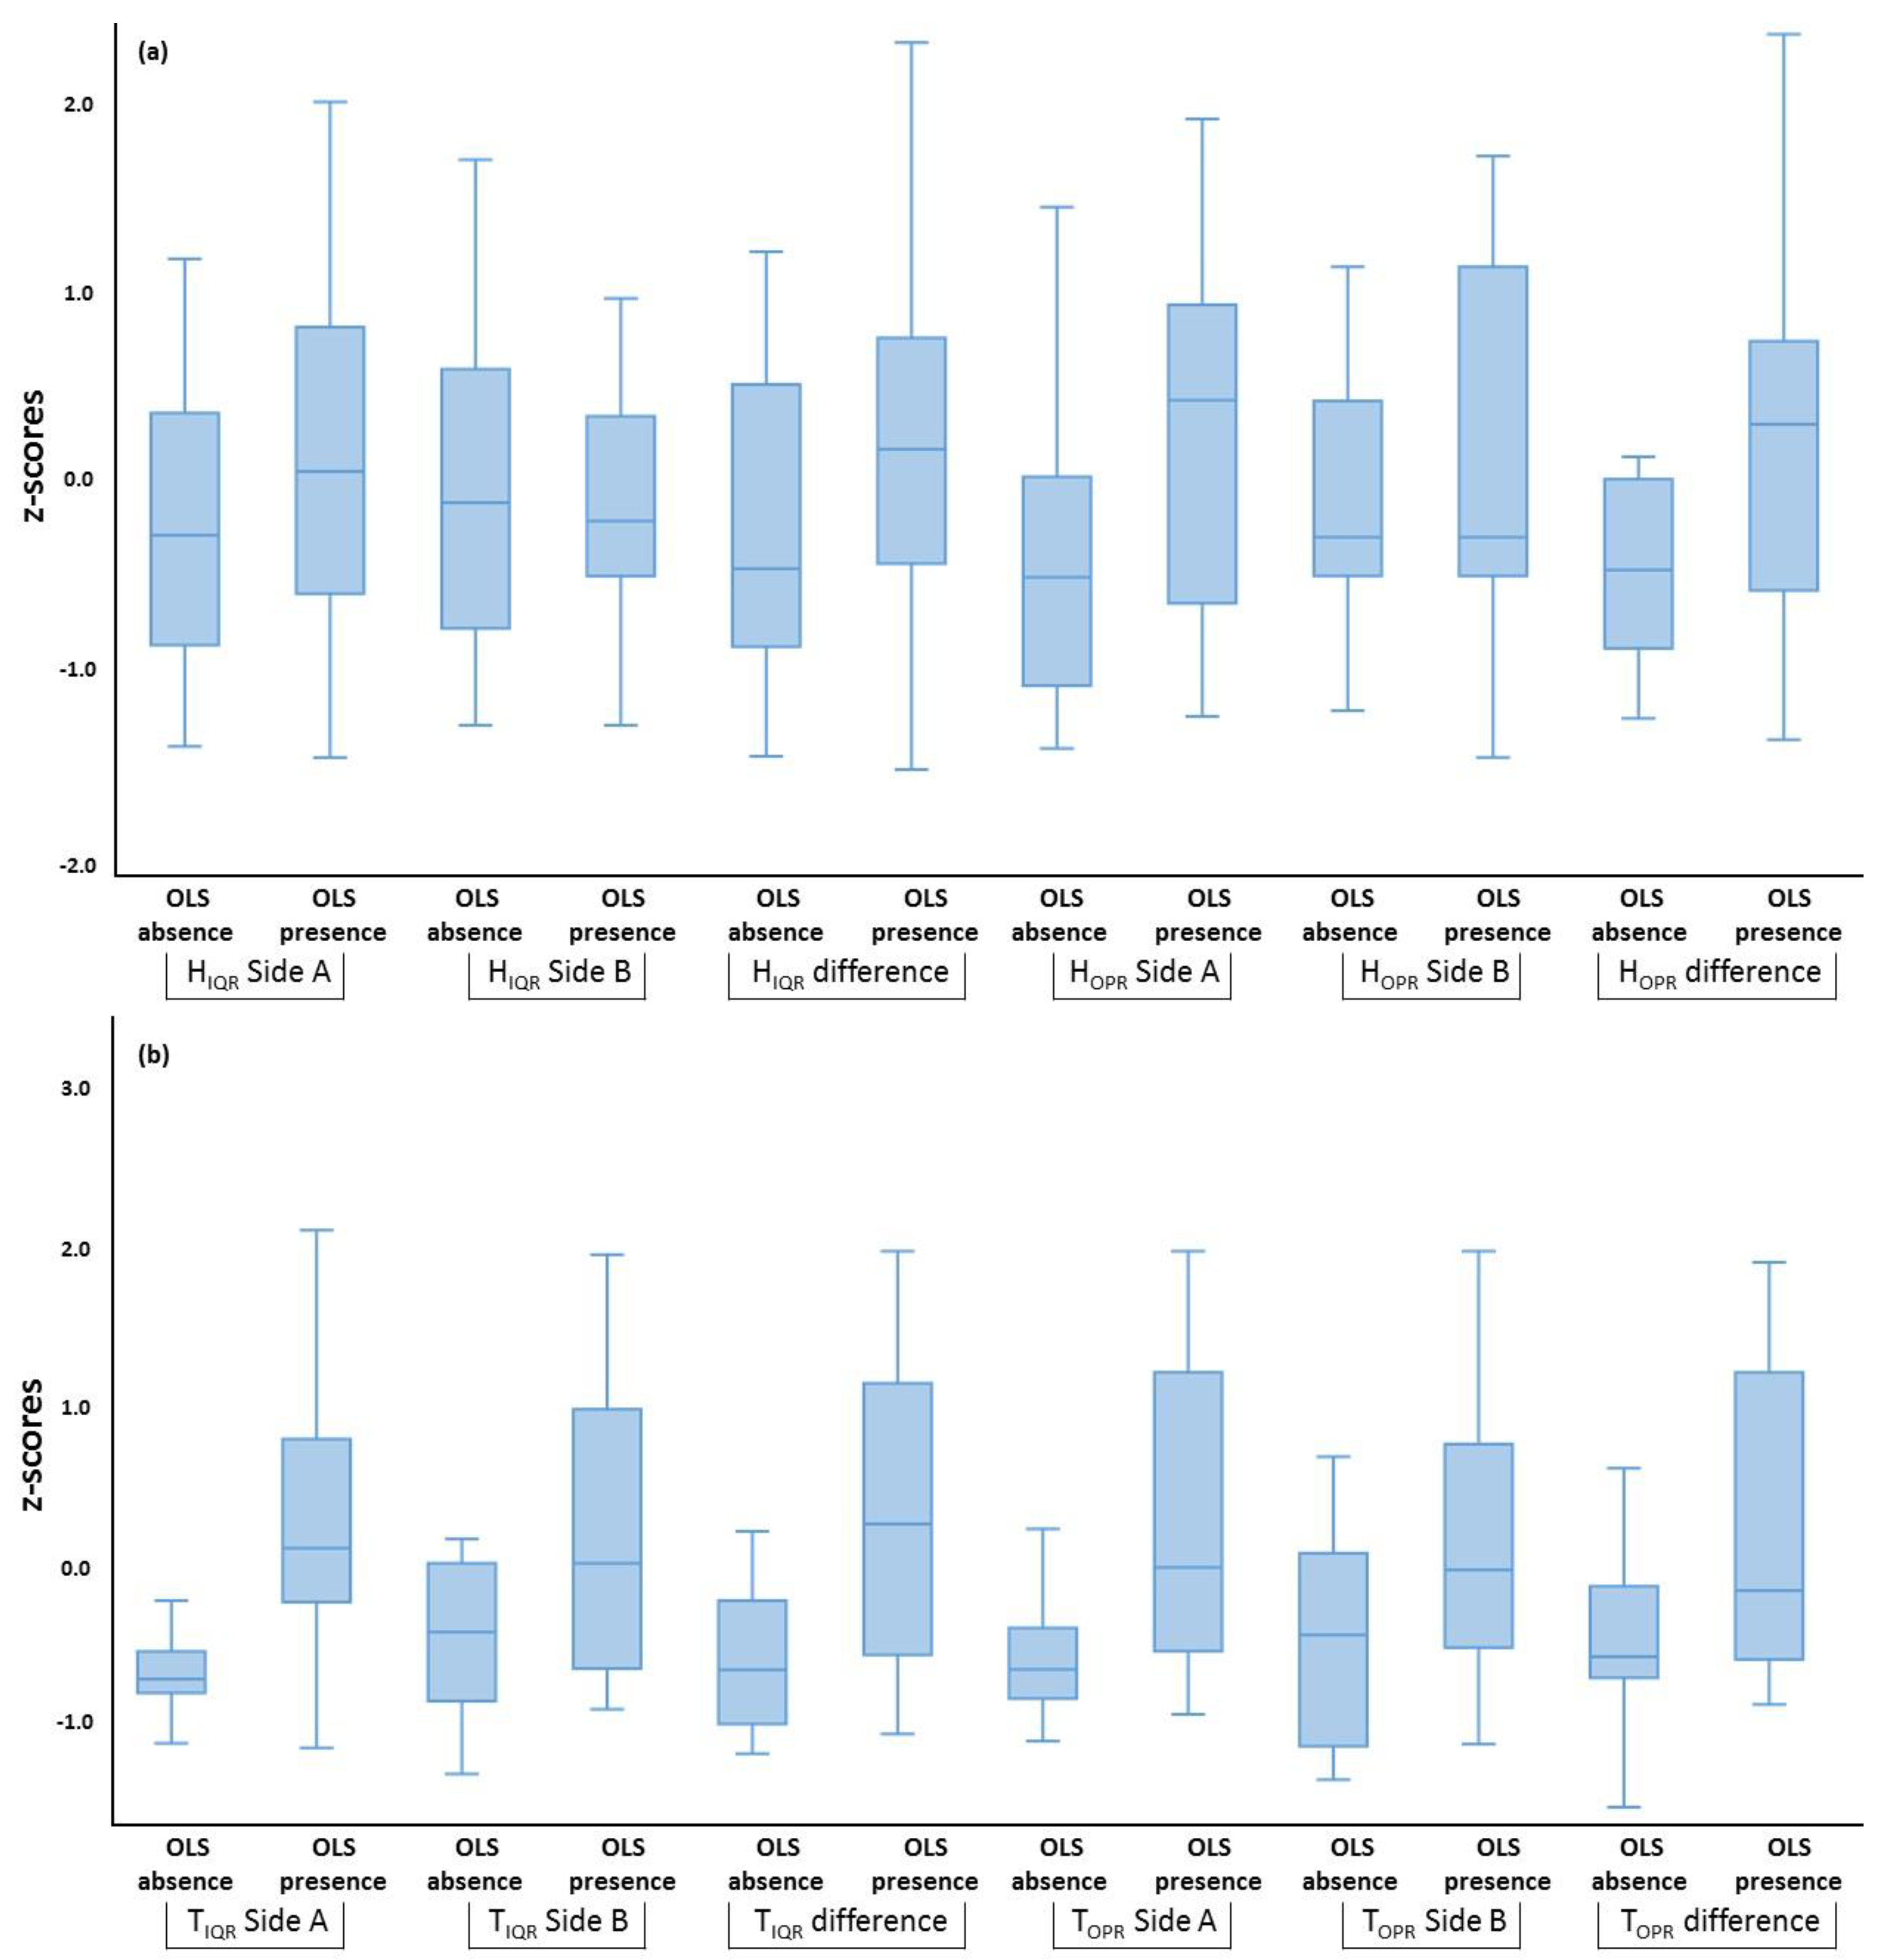
3.6. Differences between Infected and Non-Infected Trees

For examining the variations and distinctions observed between centennial olive trees affected by the OLS and those not affected, we conducted a series of t-tests across a range of examined variables. Results showed statistically significant differences between almost all the phenotypic traits, excluding height (Table 5). It was observed that trees with OLS (mean values: OLS presence/OLS absence) exhibit a higher diameter, which consequently leads to a higher estimated age (251.35 ± 22.29 years; 169.32 ± 31.87 years), lower shoot ratio (0.60 ± 0.26; 0.78 ± 0.14), reduced crown area (58.15 ± 32.14 m2; 85.37 ± 34.96 m2) and healthy crown area (30.98 ± 27.74 m2; 77.20 ± 33.41 m2), a lower cavities ratio (0.02 ± 0.01; 0.01 ± 0.01), decreased productivity (27.69 ± 11.01 kg; 46.63 ± 5.92 kg), and a narrower productivity range (26.42 ± 11.78 kg; 34.66 ± 11.85 kg).
In addition to phenotypic traits, differences extended beyond them and were also noticeable in trunk thermal and humidity indices. Specifically, significant disparities were identified in just one humidity index, HOPR Side A. However, variations were more pronounced in all thermal indices, as illustrated in Figure 11.
Finally, significant differences were observed in both TIQR canopy and CWSI [TIQR canopy: t (42) = −3.063, p = 0.004; CWSI: t (42) = −2.1, p = 0.042]. Notably, trees affected by the olive leaf spot exhibited higher values, while those unaffected displayed lower values in both instances.

4. Discussion

Our study presents a thorough and multifaceted assessment of centennial olive tree physiology, achieved through the integration of in situ phenotypic measurements, IRT, productivity evaluations, and the consideration of two critical abiotic and biotic stressors. This innovative approach represents a significant advancement in our understanding of the intricate relationships among these complex facets of centennial olive tree health. To the best of our knowledge, there is no other study that has combined and interrelated tree phenotypic traits, four-year productivity, thermal and humidity indices from both sides of the trunk, thermal canopy indices, CWSI, and the presence of foliar disease in such a comprehensive manner.
In this context, our choice to focus on a traditional olive grove is rooted in the well-established understanding that these groves maintain their essential role within the Mediterranean landscape. They serve as invaluable reservoirs of biodiversity and cultural heritage, offering a wide spectrum of ecosystem services [118,119]. After all, and despite growing global concerns regarding environmental sustainability and the urgency for resilient agricultural systems, traditional olive groves’ significance extends beyond their primary function as sites for cultivating the olive tree; they also serve as critical habitats for a diverse range of plant and animal species, fostering ecological diversity and making substantial contributions to biodiversity conservation endeavors [120,121,122].
Regarding the core of our methodological procedure, the utilization of IRT emerges as a pivotal choice, as it has consistently demonstrated its potential as a diagnostic tool for illustrating trees’ thermal patterns [83,89,123,124], enabling the assessment of their health state [77,82,83,125]. Furthermore, the indices derived from the IRT analysis have demonstrated significant relevance across various tree species, encompassing urban, rural, and forest environments [83]. This alignment with the fundamental concept of a healthy tree, as originally proposed by Catena and Catena (2008) [82], underscores their broader applicability and importance. Despite its acknowledged limitations [109,126,127], IRT owes its effectiveness to its capacity to provide rapid and comprehensive inspections of entire trees, coupled with its economic affordability [128,129]. This is evident as IRT is now employed not only by the scientific community but also by a wide range of tree care companies, who utilize it for various tree health related purposes.
The comparison of thermal and humidity indices (TIQR, TOPR, HIQR, HOPR) between the two sides of each olive tree’s trunk served a crucial purpose in our study, as we aimed to uncover potential asymmetries in the tree’s physiological responses. This approach represents the first instance of investigating differences between trunk sides in order to obtain a comprehensive understanding of the thermal and humidity signature across the entire trunk. Our decision to calculate not only the interquartile ranges but also the outer percentile ranges stemmed from the need to closely examine specific trunk traits, such as cavities, that are closely tied to tree health. This scrutiny of extreme temperature values was imperative, as they are associated with both external and internal irregularities present on the trunk [46,83]. This methodological approach was based on the premise that a healthy tree exhibits a uniformly distributed trunk temperature, indicating an efficiently functioning thermoregulatory system. Conversely, temperature irregularities in the trunk suggest potential physiological or structural issues within the tree [130]. These asymmetries could signify localized stressors, such as trunk irregularities or variations in water availability, affecting specific parts of the tree in different ways. This is because olives can alter the hydraulic properties, resulting in reduced plasticity, which in turn disrupts the water supply to all neighboring segments [131]. Hence, the prospect of hydraulic failure within their conducting tissues, contingent upon factors such as water supply conditions and xylem anatomical attributes [48], results in temperature variations across the olive trunk’s surface [132], which can be utilized as an indicator of their physiological condition.
Identifying such disparities (Figure 5) allowed us to pinpoint areas of the tree trunk where stressors might have a more pronounced impact, contributing to a more nuanced understanding of tree health and vitality. The differentiation found between the two sides of the tree trunk, resulting from olives’ hydraulic physiology [49], clearly indicate issues related to water transport and structural integrity, providing insights into the centennial olive tree’s ability to withstand water stress and structural challenges. Additionally, by assessing humidity variations, we can evaluate the tree’s transpiration rates and its capacity to regulate moisture, shedding light on its adaptation to environmental conditions and stressors. In parallel, these differences also indicate variations in the tree’s ability to compartmentalize decay or respond to localized stress. Compartmentalization is a natural defense mechanism in trees where they isolate and limit the spread of decay or pathogens within their tissues [37,133]. When a tree encounters a stressor or injury, it often responds by forming boundaries around the affected area to contain the damage. We observed that the indices from the one side of the trunk (Side A) exhibit significantly different temperature and humidity patterns, suggesting that this side is more actively responding to a decay or stressor. Therefore, these indices hold substantial value as indicators for evaluating tree health and enriching our comprehension of how defects influence the tree’s overall condition [134,135].
In conjunction with the utilization of IRT metrics, we placed particular emphasis on specific facets of centennial olive trees, notably their productivity and distinctive phenotypic traits. To assess productivity, the four-year data acquisition aligns with olive trees’ bearing pattern, which alternates between high and low fruit production years. Taking into account this four-year productivity period (two full fruiting cycles) proved instrumental in accommodating the inherent variability in olive tree productivity and provided us with a more comprehensive perspective on how external stressors influence this cyclical pattern. Stressors such as the phloem shoot-to-root flow depression attributed to wood decay [136] lead to specific adaptive responses involving resource allocation strategies directing the available nutrients toward non-productive structures [137,138], inevitably leading to decreased productivity [52].
The validity of the aforementioned rationale is further substantiated by the observed correlations between the productivity, the phenotypic traits, and the thermal and humidity indices of both the trunk and the crown, emphasizing the inherently interconnected nature of these variables. Indeed, the strong positive relationships observed between productivity, the shoot ratio (SR), and the canopy health (HC), coupled with the negative correlations with all of the thermal and humidity indices, validate the well-established understanding that in traditional olive groves with much older trees, there is typically a trade-off between tree growth and fruit production [139]. This trade-off, which is widely recognized in traditional olive groves with older trees, is characterized by the trees allocating their resources towards sustaining their existing structures, such as the crown and shoots, rather than diverting resources towards increased fruit production [137]. The positive correlation with the shoot rate (SR) underscores the importance of active shoot growth in supporting fruit-bearing, as healthy shoots are vital for carrying the olives. Conversely, the negative correlations with the thermal and humidity indices highlight how external stressors, such as water deficiency or disease, can limit both shoot development and overall tree productivity.
The comprehension of these adaptation mechanisms led us to extend our analysis beyond the crown area, prompting us to estimate the specific area within the crown that could be considered healthy for each individual tree. At the same time, the presence of deep grooves and cavities provides environments conducive to moisture retention, which, in turn, may foster the accumulation of organic matter, thereby creating a favorable milieu for the proliferation of fungal and bacterial organisms [39], which collectively contribute to wood decay and compromise the structural integrity and productivity of these aged trees; this is the reason why we employed the CR rather than the absolute number of cavities, as it was imperative to prevent any age-related bias, as structural defects tend to accumulate over time [140,141]. Thus, the CR emerges as a pivotal phenotypic indicator, serving as a crucial link between the vitality of olive trees and the metrics derived from IRT. Notably, its positive correlation with both the trunk thermal and humidity indices, as well as the thermal canopy indices, signifies that impairments in the xylem and phloem tissues directly lead to disruptions in the transport of water and nutrients, stemming from compromised vascular systems [142]. This, in turn, has a direct bearing on the availability and distribution of resources within the tree, ultimately influencing leaf distribution [143,144] and crown morphology. This contention finds support in the observed negative correlations between the CR and the CA (r = −0.68, p < 0.05) and the HC (r = −0.74, p < 0.05) (Figure 6). Additionally, the positive correlation of the CR with the TIQR canopy and the CWSI further underscores the challenging conditions that centennial olive trees face in sustaining their growth and vitality [48,49]. At the same time, both canopy-related indices, having a pivotal role in characterizing the thermal profile of each tree’s canopy while mitigating the undue influence of extreme temperature values, followed the pattern observed in the trunk thermal and humidity indices, ultimately enhancing the reliability of our assessment.
While the examination of the relations of phenotypic traits, thermal, and humidity indices has shed light on various facets of centennial olive trees’ health, and due to the widespread presence of traditional olive groves not only on the island of Naxos but also throughout various regions of Greece [145], it was imperative to further elucidate the underlying dynamics influencing their productivity, water stress, and the OLS. In the case of the four-year mean productivity, our analysis revealed robust results, with the three regression models demonstrating quite high explanatory power, ranging from 54.5% to 71.1% (Table 2). Interestingly, in all these models the IRT metrics, whether in the context of trunk-related indices or the CWSI, made substantial and noteworthy contributions, as highlighted by the relative importance analysis. For each individual harvest year, our findings consistently exhibited a similar pattern, albeit with slightly reduced explanatory power (Table A1, Table A2, Table A3 and Table A4). These results not only corroborate findings from prior studies [46] but also demonstrate the added value of incorporating new indices from IRT (HIQR difference, TIQR difference, TIQR canopy, HIQR Side A, TIQR Side A) and including CWSI, which significantly bolstered the explanatory power of our analyses, allowing a quite accurate estimate of olive tree productivity. We find this particularly significant, as we believe that the connection between our metrics, which has not been established elsewhere, provides an effective means of monitoring centennial olive trees. This is especially noteworthy considering that parameters that could potentially enhance our models, such as soil nutrient content and levels of tree competition—key elements in other predictive models for olive tree productivity [146]—were not included in our study.
Regarding water stress in centennial olive trees, as in any other crop, it represents a pivotal ecological parameter significantly influencing both their overall health and productivity [147]. Despite the olive tree’s impressive drought resilience [148], it expends considerable energy resources on protective mechanisms, which can, in turn, hinder plant growth and productivity [149,150]. This abiotic stress factor primarily results from a complex interplay of environmental variables, including temperature, humidity, and soil moisture levels, collectively shaping the water status of these trees [151]. When a tree experiences water stress, it tends to have higher temperatures due to reduced transpiration (the process of water evaporation from leaves), as water is crucial for cooling the tree through transpiration. Elevated temperatures, especially in the canopy, are indicative of water stress and can result in a higher CWSI [104]. Similarly, trees under water stress might exhibit lower humidity values because they are not transpiring as effectively, and the humidity in the surrounding environment remains relatively low [152]. Our findings align with this logic, as reduced transpiration efficiency and lower environmental humidity levels contribute to an elevated CWSI. In fact, among the numerous variables examined, three demonstrated particular significance, collectively explaining 47.5% of the CWSI variance. One of these variables is related to productivity (Prange), while the other two are associated with IRT metrics (HOPR difference and TOPR difference), and they all exhibited a significant influence on CWSI (Table 3).
These findings not only advance our understanding of CWSI determinants but also have practical implications for the holistic management of centennial olive groves. However, it is essential to recognize that beyond the factors explaining this crucial abiotic stressor, there are several biotic ones that need to be addressed. One such factor is the OLS, which poses a threat to olive trees regardless of their age. Olive trees are susceptible to OLS when environmental conditions, such as high humidity and moderate temperatures, favor fungal growth and infection. This fungal pathogen primarily targets the leaves of olive trees but can also infect other above-ground plant structures [153], such as stems and fruit [53]. The three logistic models exhibited a high level of discriminatory performance and provided valuable insights into the predictors of OLS. In each of these models, the explanatory power was substantial, ranging from 50.1% to 80.5% (Table 4). These results underscore the ability to accurately predict the probability of OLS infection using a combination of variables, which include productivity, two phenotypic traits (CR and HC), and one thermal index (TIQR side A). Furthermore, the OLS-infected trees exhibited distinctions across a wide spectrum of examined variables, encompassing phenotypic traits (Table 5), IRT (Figure 11), and CWSI. These disparities indicate that OLS-infected olive trees display unique characteristics and responses in terms of their phenotypic traits and physiological patterns when compared to their healthy counterparts. The presence of these statistically significant variations underscores the potential impact of OLS on the overall health and physiological state of centennial olive trees.
Thus, linking all the results, our study highlights the intricate web of interactions that determine the health and productivity of centennial olive trees, emphasizing the need for holistic and integrated approaches in their monitoring and management. Moreover, our findings enhance our understanding that IRT, in combination with metrics of abiotic and biotic stressors, provides a valuable tool for assessing and monitoring the health and overall condition of centennial olive trees. The integration of infrared thermography, productivity assessments, phenotypic traits, the presence of biotic stressors like OLS, and abiotic stressors like water stress offers a comprehensive approach to understanding the complex interactions shaping traditional olive grove dynamics. These findings contribute to our knowledge of how environmental, physiological, and pathological factors influence olive tree health, with practical implications for the sustainable management of traditional olive groves. By identifying key indicators such as thermal patterns and water stress levels, olive growers and conservationists can make informed decisions to enhance the vitality and longevity of these culturally and ecologically significant trees.

Author Contributions

Conceptualization, Y.G.Z.; methodology, Y.G.Z., A.K., A.C. and P.G.D.; formal analysis, Y.G.Z.; investigation, Y.G.Z.; resources, Y.G.Z. and P.G.D.; writing—original draft preparation, Y.G.Z.; writing—review and editing, Y.G.Z., A.K., A.C. and P.G.D.; visualization, Y.G.Z. All authors have read and agreed to the published version of the manuscript.

Funding

This research received no external funding.

Institutional Review Board Statement

Not applicable.

Informed Consent Statement

Not applicable.

Data Availability Statement

The data that support the findings of this study are available from the corresponding author (Y.G.Z.), upon reasonable request.

Acknowledgments

We would like to express our gratitude to the traditional olive grove owners, Georgios Zevgolis and Irene Glezos, for generously granting us permission and their invaluable cooperation, which enabled the successful execution of our study within their grove. This work could not have been performed without the Biodiversity Conservation Laboratory’s technical equipment.

Conflicts of Interest

The authors declare no conflict of interest.

Appendix A

Table A1. Final models derived from the multiple linear regression analyses for predicting 2017 productivity.
Variables SetResponse
Variable
Predictor VariablesBSE Bβtp-ValueR2 adj.F
Phenotypic traitsP 2017(constant)47.679.45 5.040.0000.47714.087
CA−0.200.08−0.39−2.280.028
CR −469.53214.6−0.37−2.180.035
HC0.320.090.673.540.001
Thermal and humidity indicesP 2017(constant)61.714.30 14.330.0010.51319.543
TIQR difference−5.551.88−0.33−2.940.005
HIQR difference−30.106.43−0.53−4.670.001
Combined modelP 2017(constant)53.346.77 7.870.0010.61323.716
HIQR Side A −19.746.01−0.35−3.280.002
TIQR difference −4.431.43−0.32−3.080.004
HC0.170.050.363.310.002
Table A2. Final models derived from the multiple linear regression analyses for predicting 2018 productivity.
Variables SetResponse
Variable
Predictor VariablesBSE Bβtp-ValueR2 adj.F
Phenotypic traitsP 2018(constant)35.256.55 5.380.0010.2959.995
HC0.110.050.322.340.024
CWSI−80.1028.56−0.38−2.800.008
Thermal and humidity indicesP 2018(constant)44.113.32 13.260.0010.46519.652
TIQR difference−4.301.46−0.33−2.950.005
HIQR difference−23.334.97−0.53−4.690.001
Combined modelP 2018(constant)30.874.96 6.220.0010.58613.164
TIQR difference−28.768.86−0.66−3.240.002
TIQR canopy−9.223.54−0.36−2.600.013
TIQR Side A36.979.781.063.770.001
TOPR Side A−6.431.66−0.75−3.860.001
HC0.0860.040.232.060.046
Table A3. Final models derived from the multiple linear regression analyses for predicting 2019 productivity.
Variables SetResponse
Variable
Predictor VariablesBSE Bβtp-ValueR2 adj.F
Phenotypic traitsP 2019(constant)62.177.65 8.120.0010.47420.406
HC0.180.060.363.090.003
CWSI−141.2633.37−0.49−4.230.001
Thermal and humidity indicesP 2019(constant)65.965.22 12.640.0010.2969.442
HIQR difference−4.742.40−0.275−1.970.05
TIQR canopy−13.854.87−0.397−2.840.007
Combined modelP 2019(constant)73.749.12 8.070.0010.51112.246
HOPR Side A−1.850.82−0.619−2.250.030
HOPR difference1.500.740.5302.020.050
HC0.170.060.3463.000.005
CWSI−119.1435.9−0.419−3.310.002
Table A4. Final models derived from the multiple linear regression analyses for predicting 2020 productivity.
Variables SetResponse
Variable
Predictor VariablesBSE Bβtp-ValueR2 adj.F
Phenotypic traitsP 2020(constant)29.345.75 5.090.0010.42216.671
HC0.1860.0440.514.210.001
CWSI−58.0825.10−0.28−2.310.026
Thermal and humidity indicesP 2020(constant)60.466.43 9.400.0010.3749.563
HOPR Side A−2.090.63−0.97−3.290.002
HOPR difference1.2530.600.612.060.046
TIQR Side A−13.364.17−0.39−3.200.003
Combined modelP 2020(constant)29.725.42 5.480.0010.43717.660
HOPR Side A−0.660.26−0.311−2.560.014
HC0.180.040.5114.220.001

References

  1. Myers, N.; Mittermeler, R.A.; Mittermeler, C.G.; Da Fonseca, G.A.B.; Kent, J. Biodiversity hotspots for conservation priorities. Nature 2000, 403, 853–858. [Google Scholar] [CrossRef] [PubMed]
  2. Blondel, J. The “design” of Mediterranean landscapes: A millennial story of humans and ecological systems during the historic period. Hum. Ecol. 2006, 34, 713–729. [Google Scholar] [CrossRef]
  3. Stroosnijder, L.; Mansinho, M.I.; Palese, A.M. OLIVERO: The project analysing the future of olive production systems on sloping land in the Mediterranean basin. J. Environ. Manag. 2008, 89, 75–85. [Google Scholar] [CrossRef] [PubMed]
  4. Jarvis, D.I.; Brown, A.H.; Cuong, P.H.; Collado-Panduro, L.; Latournerie-Moreno, L.; Gyawali, S. 2008 A global perspective of the richness and evenness. Proc. Natl. Acad. Sci. USA 2008, 105, 5326–5331. [Google Scholar] [CrossRef]
  5. Achtak, H.; Ater, M.; Oukabli, A.; Santoni, S.; Kjellberg, F.; Khadari, B. Traditional agroecosystems as conservatories and incubators of cultivated plant varietal diversity: The case of fig (Ficus carica L.) in Morocco. BMC Plant Biol. 2010, 10, 28. [Google Scholar] [CrossRef]
  6. Altieri, M.A. The ecological role of biodiversity in agroecosystems. Agric. Ecosyst. Environ. 1999, 74, 19–31. [Google Scholar] [CrossRef]
  7. Loumou, A.; Giourga, C. Olive groves: “The life and identity of the Mediterranean". Agric. Hum. Values 2003, 20, 87–95. [Google Scholar] [CrossRef]
  8. Kizos, T.; Dalaka, A.; Petanidou, T. Farmers’ attitudes and landscape change: Evidence from the abandonment of terraced cultivations on Lesvos, Greece. Agric. Hum. Values 2010, 27, 199–212. [Google Scholar] [CrossRef]
  9. Solomou, A.; Sfougaris, A. Comparing conventional and organic olive groves in central Greece: Plant and bird diversity and abundance. Renew. Agric. Food Syst. 2011, 26, 297–316. [Google Scholar] [CrossRef]
  10. Keenleyside, C.; Beaufoy, G.; Tucker, G.; Jones, G. High Nature Value Farming Throughout EU-27 and Its Financial Support under the CAP. 2014; Report Prepared for DG Environment, Contract No ENV B.1/ETU//0035; Institute for European Environmental Policy: London, UK, 2014. [Google Scholar]
  11. Benton, T.G.; Vickery, J.A.; Wilson, J.D. Farmland biodiversity: Is habitat heterogeneity the key? Trends Ecol. Evol. 2003, 18, 182–188. [Google Scholar] [CrossRef]
  12. Fleskens, L. Conservation Scenarios for Olive Farming on Sloping Land in the Mediterranean; Wageningen University and Research: Wageningen, The Netherlands, 2007; ISBN 9789085047179. [Google Scholar]
  13. Morgado, R.; Santana, J.; Porto, M.; Sánchez-Oliver, J.S.; Reino, L.; Herrera, J.M.; Rego, F.; Beja, P.; Moreira, F. A Mediterranean silent spring? The effects of olive farming intensification on breeding bird communities. Agric. Ecosyst. Environ. 2020, 288, 106694. [Google Scholar] [CrossRef]
  14. Ben Abdallah, S.; Parra-López, C.; Elfkih, S.; Suárez-Rey, E.M.; Romero-Gámez, M. Sustainability assessment of traditional, intensive and highly-intensive olive growing systems in Tunisia by integrating Life Cycle and Multicriteria Decision analyses. Sustain. Prod. Consum. 2022, 33, 73–87. [Google Scholar] [CrossRef]
  15. Caraveli, H. A comparative analysis on intensification and extensification in mediterranean agriculture: Dilemmas for LFAs policy. J. Rural Stud. 2000, 16, 231–242. [Google Scholar] [CrossRef]
  16. Pienkowski, M.; Beaufoy, G. The Environmental Impact of Olive Oil Production in the European Union: Practical Options for Improving the Environmental Impact; European Forum on Nature Conservation and Pastoralism (EFNCP): Peterborough, UK, 2002; pp. 1–73. [Google Scholar]
  17. Donald, P.F.; Green, R.E.; Heath, M.F. Agricultural intensification and the collapse of Europe’s farmland bird populations. Proc. R. Soc. B Biol. Sci. 2001, 268, 25–29. [Google Scholar] [CrossRef] [PubMed]
  18. Tscharntke, T.; Klein, A.M.; Kruess, A.; Steffan-Dewenter, I.; Thies, C. Landscape perspectives on agricultural intensification and biodiversity—Ecosystem service management. Ecol. Lett. 2005, 8, 857–874. [Google Scholar] [CrossRef]
  19. Rescia, A.J.; Willaarts, B.A.; Schmitz, M.F.; Aguilera, P.A. Changes in land uses and management in two Nature Reserves in Spain: Evaluating the social-ecological resilience of cultural landscapes. Landsc. Urban Plan. 2010, 98, 26–35. [Google Scholar] [CrossRef]
  20. Sokos, C.K.; Mamolos, A.P.; Kalburtji, K.L.; Birtsas, P.K. Farming and wildlife in Mediterranean agroecosystems. J. Nat. Conserv. 2013, 21, 81–92. [Google Scholar] [CrossRef]
  21. Modica, G.; Praticò, S.; Di Fazio, S. Abandonment of traditional terraced landscape: A change detection approach (a case study in Costa Viola, Calabria, Italy). L. Degrad. Dev. 2017, 28, 2608–2622. [Google Scholar] [CrossRef]
  22. Tarifa, R.; Martínez-Núñez, C.; Valera, F.; González-Varo, J.P.; Salido, T.; Rey, P.J. Agricultural intensification erodes taxonomic and functional diversity in Mediterranean olive groves by filtering out rare species. J. Appl. Ecol. 2021, 58, 2266–2276. [Google Scholar] [CrossRef]
  23. Schicchi, R.; Speciale, C.; Amato, F.; Bazan, G.; Di Noto, G.; Marino, P.; Ricciardo, P.; Geraci, A. The Monumental Olive Trees as Biocultural Heritage of Mediterranean Landscapes: The Case Study of Sicily. Sustainability 2021, 13, 6767. [Google Scholar] [CrossRef]
  24. Pointereau, P.; Paracchini, M.L.; Terres, J.-M.; Jiguet, F.; Bas, Y.; Biala, K. Identification of High Nature Value Farmland in France through Statistical Information and Farm Practice Surveys; Report EUR 22786 EN.; Publications Office of the EU: Luxembourg, 2007; ISBN 9789279064753. [Google Scholar]
  25. Beaufoy, G.; Cooper, T. The Application of the High Nature Value Impact Indicator. 2009. Available online: https://www.men-d.de/uploads/media/guidance_document_application_HNV_impact_indicator_annex.pdf (accessed on 26 September 2023).
  26. Duarte, F.; Jones, N.; Fleskens, L. Traditional olive orchards on sloping land: Sustainability or abandonment? J. Environ. Manag. 2008, 89, 86–98. [Google Scholar] [CrossRef] [PubMed]
  27. Brunori, E.; Salvati, L.; Antogiovanni, A.; Biasi, R. Worrying about “vertical landscapes”: Terraced olive groves and ecosystem services in marginal land in central Italy. Sustainability 2018, 10, 1164. [Google Scholar] [CrossRef]
  28. Solomou, A.D.; Sfougaris, A.I.; Vavoulidou, E.M.; Csuzdi, C. Species Richness and Density of Earthworms in Relation to Soil Factors in Olive Orchard Production Systems in Central Greece. Commun. Soil Sci. Plant Anal. 2013, 44, 301–311. [Google Scholar] [CrossRef]
  29. Camarsa, G.; Gardner, S.; Jones, W.; Eldridge, J.; Hudson, T.; Thorpe, E.; O’Hara, E. LIFE among the Olives—Good Practice in Improving Environmental Performance in the Olive Oil Sector; European Commission, Environment Directorate-General. European Union: Brussels, Belgium, 2010; ISBN 9789279141546. [Google Scholar]
  30. Pellegrini, G.; Ingrao, C.; Camposeo, S.; Tricase, C.; Contò, F.; Huisingh, D. Application of water footprint to olive growing systems in the Apulia region: A comparative assessment. J. Clean. Prod. 2016, 112, 2407–2418. [Google Scholar] [CrossRef]
  31. Mairech, H.; López-Bernal, Á.; Moriondo, M.; Dibari, C.; Regni, L.; Proietti, P.; Villalobos, F.J.; Testi, L. Is new olive farming sustainable? A spatial comparison of productive and environmental performances between traditional and new olive orchards with the model OliveCan. Agric. Syst. 2020, 181, 102816. [Google Scholar] [CrossRef]
  32. Mairech, H.; López-Bernal, Á.; Moriondo, M.; Dibari, C.; Regni, L.; Proietti, P.; Villalobos, F.J.; Testi, L. Sustainability of olive growing in the Mediterranean area under future climate scenarios: Exploring the effects of intensification and deficit irrigation. Eur. J. Agron. 2021, 129, 126319. [Google Scholar] [CrossRef]
  33. Davy, C.M.; Russo, D.; Fenton, M.B. Use of native woodlands and traditional olive groves by foraging bats on a Mediterranean island: Consequences for conservation. J. Zool. 2007, 273, 397–405. [Google Scholar] [CrossRef]
  34. Fleskens, L.; Duarte, F.; Eicher, I. A conceptual framework for the assessment of multiple functions of agro-ecosystems: A case study of Trás-os-Montes olive groves. J. Rural Stud. 2009, 25, 141–155. [Google Scholar] [CrossRef]
  35. Bernabei, M. The age of the olive trees in the Garden of Gethsemane. J. Archaeol. Sci. 2015, 53, 43–48. [Google Scholar] [CrossRef]
  36. Gomes, T.; Pereira, J.A.; Moya-Laraño, J.; Poveda, J.; Lino-Neto, T.; Baptista, P. Deciphering plant health status: The link between secondary metabolites, fungal community and disease incidence in olive tree. Front. Plant Sci. 2023, 14, 1048762. [Google Scholar] [CrossRef]
  37. Shigo, A.L.; Marx, H.G. Compartmentalization of Decay in Trees; Compartmentalization of Decay in Trees (No. 405); Department of Agriculture, Forest Service: Washington, DC, USA, 1977. [Google Scholar]
  38. Boddy, L. Fungal Community Ecology and Wood Decomposition Processes in Angiosperms: From Standing Tree to Complete Decay of Coarse Woody Debris. Ecol. Bull. 2001, 49, 43–56. [Google Scholar]
  39. Rose, C.L.; Marcot, B.G.; Mellen, T.K.; Ohmann, J.L.; Waddell, K.L.; Lindley, D.L.; Schreiber, B. Decaying wood in Pacific Northwest forests: Concepts and tools for habitat management. In Wildlife-Habitat Relationships in Oregon and Washington; Oregon State University Press: Corvallis, OR, USA, 2001; pp. 580–623. [Google Scholar]
  40. Carpio, A.J.; Castro, J.; Mingo, V.; Tortosa, F.S. Herbaceous cover enhances the squamate reptile community in woody crops. J. Nat. Conserv. 2017, 37, 31–38. [Google Scholar] [CrossRef]
  41. Lindenmayer, D.B.; Laurance, W.F. The ecology, distribution, conservation and management of large old trees. Biol. Rev. 2017, 92, 1434–1458. [Google Scholar] [CrossRef] [PubMed]
  42. Müller, H.; Berg, C.; Landa, B.B.; Auerbach, A.; Moissl-Eichinger, C.; Berg, G. Plant genotype-specific archaeal and bacterial endophytes but similar Bacillus antagonists colonize Mediterranean olive trees. Front. Microbiol. 2015, 6, 138. [Google Scholar] [CrossRef] [PubMed]
  43. Gibbons, P.; Lindenmayer, D. Tree Hollows and Wildlife Conservation in Australia; CSIRO Publishing: Collingwood, Austria, 2002. [Google Scholar]
  44. Johnstone, D.; Moore, G.; Tausz, M.; Nicolas, M. The Measurement of Wood Decay in Landscape Trees. Arboric. Urban For. 2010, 36, 121–127. [Google Scholar] [CrossRef]
  45. Soge, A.O.; Popoola, O.I.; Adetoyinbo, A.A. A four-point electrical resistivity method for detecting wood decay and hollows in living trees. Eur. J. Wood Wood Prod. 2019, 77, 465–474. [Google Scholar] [CrossRef]
  46. Zevgolis, Y.G.; Kamatsos, E.; Akriotis, T.; Dimitrakopoulos, P.G.; Troumbis, A.Y. Estimating Productivity, Detecting Biotic Disturbances, and Assessing the Health State of Traditional Olive Groves, Using Nondestructive Phenotypic Techniques. Sustainability 2021, 14, 391. [Google Scholar] [CrossRef]
  47. Van Hees, A.F.M. Growth and morphology of pedunculate oak (Quercus robur L) and beech (Fagus sylvatica L.) seedlings in relation to shading and drought. Ann. For. Sci. 1997, 54, 9–18. [Google Scholar] [CrossRef]
  48. López-Bernal, Á.; Alcántara, E.; Testi, L.; Villalobos, F.J. Spatial sap flow and xylem anatomical characteristics in olive trees under different irrigation regimes. Tree Physiol. 2010, 30, 1536–1544. [Google Scholar] [CrossRef]
  49. Johnson, D.M.; Wortemann, R.; McCulloh, K.A.; Jordan-Meille, L.; Ward, E.; Warren, J.M.; Palmroth, S.; Domec, J.C. A test of the hydraulic vulnerability segmentation hypothesis in angiosperm and conifer tree species. Tree Physiol. 2016, 36, 983–993. [Google Scholar] [CrossRef]
  50. Heilmann-Clausen, J.; Boddy, L. Chapter 14 Distribution patterns of wood-decay basidiomycetes at the landscape to global scale. In British Mycological Society Symposia Series; Academic Press: Cambridge, MA, USA, 2008; Volume 28, pp. 263–275. [Google Scholar]
  51. LaMontagne, J.M.; Kilgour, R.J.; Anderson, E.C.; Magle, S. Tree cavity availability across forest, park, and residential habitats in a highly urban area. Urban Ecosyst. 2015, 18, 151–167. [Google Scholar] [CrossRef]
  52. International Olive Council. Production Techniques in Olive Growing; IOC: Madrid, Spain, 2007; ISBN 9788493166366. [Google Scholar]
  53. Salman, M. Biological control of Spilocaea oleagina, the causal agent of olive leaf spot disease, using antagonistic bacteria. J. Plant Pathol. 2017, 99, 741–744. [Google Scholar] [CrossRef]
  54. López-Doncel, L.M.; Viruega Puente, J.R.; Trapero Casas, A. Respuesta del olivo a la inoculación con Spilocaea oleagina, agente del repilo. Bol. Sanid. Veg. Plagas 2000, 26, 349–364. [Google Scholar]
  55. Sanei, S.J.; Razavi, S.E. Survey of Spilocaea oleagina, causal agent of olive leaf spot, in North of Iran. J. Yeast. Fungal. Res. 2011, 2, 33–38. [Google Scholar] [CrossRef]
  56. Obanor, F.O.; Walter, M.; Jones, E.E.; Jaspers, M.V. Efficacy of systemic acquired resistance inducers in olive leaf spot management. Australas. Plant Pathol. 2013, 42, 163–168. [Google Scholar] [CrossRef]
  57. Tognetti, R.; Andria, R.D.; Sacchi, R.; Lavini, A.; Morelli, G.; Alvino, A. Deficit irrigation affects seasonal changes in leaf physiology and oil quality of Olea europaea (cultivars Frantoio and Leccino). Ann. Appl. Biol. 2007, 150, 169–186. [Google Scholar] [CrossRef]
  58. Connor, D.J.; Gómez-del-Campo, M.; Rousseaux, M.C.; Searles, P.S. Structure, management and productivity of hedgerow olive orchards: A review. Sci. Hortic. 2014, 169, 71–93. [Google Scholar] [CrossRef]
  59. Silveira, C.; Almeida, A.; Ribeiro, A.C. Technological Innovation in the Traditional Olive Orchard Management: Advances and Opportunities to the Northeastern Region of Portugal. Water 2022, 14, 4081. [Google Scholar] [CrossRef]
  60. Bacelar, E.A.; Correia, C.M.; Moutinho-Pereira, J.M.; Goncalves, B.C.; Lopes, J.I.; Torres-Pereira, J.M.G. Sclerophylly and leaf anatomical traits of five field-grown olive cultivars growing under drought conditions. Tree Physiol. 2004, 24, 233–239. [Google Scholar] [CrossRef]
  61. Sofo, A.; Manfreda, S.; Fiorentino, M.; Dichio, B.; Xiloyannis, C. The olive tree: A paradigm for drought tolerance in Mediterranean climates. Hydrol. Earth Syst. Sci. 2008, 12, 293–301. [Google Scholar] [CrossRef]
  62. Palese, A.M.; Nuzzo, V.; Favati, F.; Pietrafesa, A.; Celano, G.; Xiloyannis, C. Effects of water deficit on the vegetative response, yield and oil quality of olive trees (Olea europaea L., cv Coratina) grown under intensive cultivation. Sci. Hortic. 2010, 125, 222–229. [Google Scholar] [CrossRef]
  63. Maccherini, S.; Santi, E.; Bonini, I.; Amici, V.; Pruscini, S.; Palazzo, D.; Selva, F.C. The impact of land abandonment on the plant diversity of olive groves. Biodivers. Conserv. 2013, 22, 3067–3083. [Google Scholar] [CrossRef]
  64. Motilva, M.J.; Tovar, M.J.; Romero, M.P.; Alegre, S.; Girona, J. Influence of regulated deficit irrigation strategies applied to olive trees (Arbequina cultivar) on oil yield and oil composition during the fruit ripening period. J. Sci. Food Agric. 2000, 80, 2037–2043. [Google Scholar] [CrossRef]
  65. Kozlowski, T.T.; Kramer, P.J.; Pallardy, S.G. The Physiological Ecology of Woody Plants; Academic Press Inc.: Cambridge, MA, USA, 2012. [Google Scholar]
  66. Goh, C.L.; Abdul Rahim, R.; Fazalul Rahiman, M.H.; Mohamad Talib, M.T.; Tee, Z.C. Sensing wood decay in standing trees: A review. Sens. Actuators A Phys. 2018, 269, 276–282. [Google Scholar] [CrossRef]
  67. Varo, A.; Moral, J.; Lozano-Tóvar, M.D.; Trapero, A. Development and validation of an inoculation method to assess the efficacy of biological treatments against Verticillium wilt in olive trees. BioControl 2016, 61, 283–292. [Google Scholar] [CrossRef]
  68. Al Bashish, D.; Braik, M.; Bani-Ahmad, S. Detection and Classification of Leaf Diseases using K-means-based Segmentation and Neural-networks-based Classification. Inf. Technol. J. 2011, 10, 267–275. [Google Scholar] [CrossRef]
  69. Fang, Y.; Ramasamy, R. Current and Prospective Methods for Plant Disease Detection. Biosensors 2015, 5, 537–561. [Google Scholar] [CrossRef]
  70. Khaled, A.Y.; Abd Aziz, S.; Bejo, S.K.; Nawi, N.M.; Seman, I.A.; Onwude, D.I. Early detection of diseases in plant tissue using spectroscopy—Applications and limitations. Appl. Spectrosc. Rev. 2018, 53, 36–64. [Google Scholar] [CrossRef]
  71. Al Hagrey, S.A. Geophysical imaging of root-zone, trunk, and moisture heterogeneity. J. Exp. Bot. 2007, 58, 839–854. [Google Scholar] [CrossRef]
  72. Blekos, K.; Tsakas, A.; Xouris, C.; Evdokidis, I.; Alexandropoulos, D.; Alexakos, C.; Katakis, S.; Makedonas, A.; Theoharatos, C.; Lalos, A. Analysis, modeling and multi-spectral sensing for the predictive management of verticillium wilt in olive groves. J. Sens. Actuator Netw. 2021, 10, 15. [Google Scholar] [CrossRef]
  73. Buja, I.; Sabella, E.; Monteduro, A.G.; Chiriacò, M.S.; De Bellis, L.; Luvisi, A.; Maruccio, G. Advances in Plant Disease Detection and Monitoring: From Traditional Assays to In-Field Diagnostics. Sensors 2021, 21, 2129. [Google Scholar] [CrossRef]
  74. Fernández, J.E.; Torres-Ruiz, J.M.; Diaz-Espejo, A.; Montero, A.; Álvarez, R.; Jiménez, M.D.; Cuerva, J.; Cuevas, M.V. Use of maximum trunk diameter measurements to detect water stress in mature ‘Arbequina’ olive trees under deficit irrigation. Agric. Water Manag. 2011, 98, 1813–1821. [Google Scholar] [CrossRef]
  75. Aissaoui, F.; Chehab, H.; Bader, B.; Salem, B.A.; M’barki, N.; Laamari, S.; Chihaoui, B.; Mahjoub, Z.; Boujnah, D. Early water stress detection on olive trees (Olea europaea L. cvs ‘chemlali’ and ‘Chetoui’) using the leaf patch clamp pressure probe. Comput. Electron. Agric. 2016, 131, 20–28. [Google Scholar] [CrossRef]
  76. Huang, Y.; Ren, Z.; Li, D.; Liu, X. Phenotypic techniques and applications in fruit trees: A review. Plant Methods 2020, 16, 1–22. [Google Scholar] [CrossRef] [PubMed]
  77. Catena, A.; Catena, G.; Lugaresi, D.; Gasperoni, R.L. Termografia rivela la presenza di danni anche nell’apparato radicale degli alberi. Agric. Ric. 2002, 81–100. [Google Scholar]
  78. Bellett-Travers, M.; Morris, S. The relationship between surface temperature and radial wood thickness of twelve trees harvested in nottinghamshire. Arboric. J. 2010, 33, 15–26. [Google Scholar] [CrossRef]
  79. Humplík, J.F.; Lazár, D.; Husičková, A.; Spíchal, L. Automated phenotyping of plant shoots using imaging methods for analysis of plant stress responses—A review. Plant Methods 2015, 11, 1–10. [Google Scholar] [CrossRef] [PubMed]
  80. Al-doski, J.; Shattri, B.M.; Helmi-Zulhai, B.M.-S. Thermal Imaging for Pests Detecting—A Review. Int. J. Agric. For. Plant. 2016, 2, 10–30. [Google Scholar]
  81. Asner, G.P.; Martin, R.E.; Keith, L.M.; Heller, W.P.; Hughes, M.A.; Vaughn, N.R.; Hughes, R.F.; Balzotti, C. A spectral mapping signature for the Rapid Ohia Death (ROD) pathogen in Hawaiian forests. Remote Sens. 2018, 10, 404. [Google Scholar] [CrossRef]
  82. Catena, A.; Catena, G. Overview of thermal imaging for tree assessment. Arboric. J. 2008, 30, 259–270. [Google Scholar] [CrossRef]
  83. Zevgolis, Y.G.; Akriotis, T.; Dimitrakopoulos, P.G.; Troumbis, A.Y. Integrating Thermal Indices and Phenotypic Traits for Assessing Tree Health: A Comprehensive Framework for Conservation and Monitoring of Urban, Agricultural, and Forest Ecosystems. Appl. Sci. 2023, 13, 9493. [Google Scholar] [CrossRef]
  84. Sepulcre-Cantó, G.; Zarco-Tejada, P.J.; Jiménez-Muñoz, J.C.; Sobrino, J.A.; De Miguel, E.; Villalobos, F.J. Detection of water stress in an olive orchard with thermal remote sensing imagery. Agric. For. Meteorol. 2006, 136, 31–44. [Google Scholar] [CrossRef]
  85. Ben-Gal, A.; Agam, N.; Alchanatis, V.; Cohen, Y.; Yermiyahu, U.; Zipori, I.; Presnov, E.; Sprintsin, M.; Dag, A. Evaluating water stress in irrigated olives: Correlation of soil water status, tree water status, and thermal imagery. Irrig. Sci. 2009, 27, 367–376. [Google Scholar] [CrossRef]
  86. Agam, N.; Cohen, Y.; Berni, J.A.J.; Alchanatis, V.; Kool, D.; Dag, A.; Yermiyahu, U.; Ben-Gal, A. An insight to the performance of crop water stress index for olive trees. Agric. Water Manag. 2013, 118, 79–86. [Google Scholar] [CrossRef]
  87. Egea, G.; Padilla-Díaz, C.M.; Martinez-Guanter, J.; Fernández, J.E.; Pérez-Ruiz, M. Assessing a crop water stress index derived from aerial thermal imaging and infrared thermometry in super-high density olive orchards. Agric. Water Manag. 2017, 187, 210–221. [Google Scholar] [CrossRef]
  88. Terho, M. An assessment of decay among urban Tilia, Betula, and Acer trees felled as hazardous. Urban For. Urban Green. 2009, 8, 77–85. [Google Scholar] [CrossRef]
  89. Zevgolis, Y.G.; Alsamail, M.Z.; Akriotis, T.; Dimitrakopoulos, P.G.; Troumbis, A.Y. Detecting, quantifying, and mapping urban trees’ structural defects using infrared thermography: Implications for tree risk assessment and management. Urban For. Urban Green. 2022, 75, 127691. [Google Scholar] [CrossRef]
  90. Hunt, J.F.; Gu, H.; Lebow, P.K. Theoretical thermal conductivity equation for uniform density wood cells. Wood Fiber Sci. 2008, 40, 167–180. [Google Scholar]
  91. Pitarma, R.; Crisóstomo, J.; Ferreira, M.E. Contribution to trees health assessment using infrared thermography. Agriculture 2019, 9, 171. [Google Scholar] [CrossRef]
  92. Ishimwe, R.; Abutaleb, K.; Ahmed, F. Applications of Thermal Imaging in Agriculture—A Review. Adv. Remote Sens. 2014, 3, 128–140. [Google Scholar] [CrossRef]
  93. Still, C.; Powell, R.; Aubrecht, D.; Kim, Y.; Helliker, B.; Roberts, D.; Richardson, A.D.; Goulden, M. Thermal imaging in plant and ecosystem ecology: Applications and challenges. Ecosphere 2019, 10, e02768. [Google Scholar] [CrossRef]
  94. Lapidot, O.; Ignat, T.; Rud, R.; Rog, I.; Alchanatis, V.; Klein, T. Use of thermal imaging to detect evaporative cooling in coniferous and broadleaved tree species of the Mediterranean maquis. Agric. For. Meteorol. 2019, 271, 285–294. [Google Scholar] [CrossRef]
  95. HNMS Climatic Data for Selected Stations in Greece, Hellenic National Meteorological Service Climatic Data for Selected Stations in Greece. Available online: http://www.emy.gr/emy/en/climatology/climatology_month (accessed on 31 October 2022).
  96. Kostelenos, G.; Kiritsakis, A. Olive Tree History and Evolution. In Olives and Olive Oil as Functional Foods; Wiley: Hoboken, NJ, USA, 2017; pp. 1–12. ISBN 9781119135340. [Google Scholar]
  97. Bazakos, C.; Alexiou, K.G.; Ramos-Onsins, S.; Koubouris, G.; Tourvas, N.; Xanthopoulou, A.; Mellidou, I.; Moysiadis, T.; Vourlaki, I.; Metzidakis, I.; et al. Whole genome scanning of a Mediterranean basin hotspot collection provides new insights into olive tree biodiversity and biology. Plant J. 2023, 116, 303–319. [Google Scholar] [CrossRef] [PubMed]
  98. Rodrigues, N.; Casal, S.; Pinho, T.; Peres, A.M.; Bento, A.; Baptista, P.; Pereira, J.A. Ancient olive trees as a source of olive oils rich in phenolic compounds. Food Chem. 2019, 276, 231–239. [Google Scholar] [CrossRef]
  99. Arnan, X.; López, B.C.; Martínez-Vilalta, J.; Estorach, M.; Poyatos, R. The age of monumental olive trees (Olea europaea) in northeastern Spain. Dendrochronologia 2012, 30, 11–14. [Google Scholar] [CrossRef]
  100. Fabbri, A.; Bartolini, G.; Lambardi, M.; Kailis, S.G. Olive Propagation Manual; CSIRO Publishing: Collingwood, Australia, 2004; ISBN 0-643-06676-4. [Google Scholar]
  101. Plasquy, E.; Sola-Guiraldo, R.R.; Florido, M.d.C.; García, J.M.; Blanco-Roldán, G. Evaluation of a manual olive fruit harvester for small producers. Res. Agric. Eng. 2019, 65, 105–111. [Google Scholar] [CrossRef]
  102. Zevgolis, Y.G.; Christopoulos, A. Entrapped in Olive-Harvesting Nets: A Case of a Grass Snake Natrix natrix from an Olive-Growing Greek Aegean Island. Diversity 2023, 15, 452. [Google Scholar] [CrossRef]
  103. Obanor, F.O.; Jaspers, M.V.; Jones, E.E.; Walter, M. Greenhouse and field evaluation of fungicides for control of olive leaf spot in New Zealand. Crop Prot. 2008, 27, 1335–1342. [Google Scholar] [CrossRef]
  104. Jackson, R.D.; Idso, S.B.; Reginato, R.J.; Pinter, P.J. Canopy temperature as a crop water stress indicator. Water Resour. Res. 1981, 17, 1133–1138. [Google Scholar] [CrossRef]
  105. Jackson, R.D. Canopy Temperature and Crop Water Stress; Elsevier: Amsterdam, The Netherlands, 1982; Volume 1, pp. 43–85. [Google Scholar]
  106. Idso, S.B.; Reginato, R.J.; Jackson, R.D.; Pinter, P.J. Measuring yield-reducing plant water potential depressions in wheat by infrared thermometry. Irrig. Sci. 1981, 2, 205–212. [Google Scholar] [CrossRef]
  107. Jackson, R.D.; Kustas, W.P.; Choudhury, B.J. A reexamination of the crop water stress index. Irrig. Sci. 1988, 9, 309–317. [Google Scholar] [CrossRef]
  108. Jones, H.G. Use of infrared thermometry for estimation of stomatal conductance as a possible aid to irrigation scheduling. Agric. For. Meteorol. 1999, 95, 139–149. [Google Scholar] [CrossRef]
  109. Minkina, W.; Dudzik, S. Algorithm of Infrared Camera Measurement Processing Path. In Infrared Thermography; John Wiley & Sons, Ltd: Chichester, UK, 2009; pp. 41–60. ISBN 9780470747186. [Google Scholar]
  110. Faye, E.; Dangles, O.; Pincebourde, S. Distance makes the difference in thermography for ecological studies. J. Therm. Biol. 2016, 56, 1–9. [Google Scholar] [CrossRef] [PubMed]
  111. Irmak, S.; Haman, D.Z.; Bastug, R. Determination of Crop Water Stress Index for Irrigation Timing and Yield Estimation of Corn. Agron. J. 2000, 92, 1221–1227. [Google Scholar] [CrossRef]
  112. Moller, M.; Alchanatis, V.; Cohen, Y.; Meron, M.; Tsipris, J.; Naor, A.; Ostrovsky, V.; Sprintsin, M.; Cohen, S. Use of thermal and visible imagery for estimating crop water status of irrigated grapevine. J. Exp. Bot. 2006, 58, 827–838. [Google Scholar] [CrossRef]
  113. Cohen, Y.; Alchanatis, V.; Meron, M.; Saranga, Y.; Tsipris, J. Estimation of leaf water potential by thermal imagery and spatial analysis*. J. Exp. Bot. 2005, 56, 1843–1852. [Google Scholar] [CrossRef] [PubMed]
  114. Grant, O.M.; Tronina, Ł.; Jones, H.G.; Chaves, M.M. Exploring thermal imaging variables for the detection of stress responses in grapevine under different irrigation regimes. J. Exp. Bot. 2007, 58, 815–825. [Google Scholar] [CrossRef]
  115. Briscoe, N.J.; Handasyde, K.A.; Griffiths, S.R.; Porter, W.P.; Krockenberger, A.; Kearney, M.R. Tree-hugging koalas demonstrate a novel thermoregulatory mechanism for arboreal mammals. Biol. Lett. 2014, 10, 20140235. [Google Scholar] [CrossRef]
  116. Lavee, S. Biennial bearing in olive (Olea europaea). Annales 2007, 17, 102–112. [Google Scholar]
  117. Zuur, A.F.; Ieno, E.N.; Elphick, C.S. A protocol for data exploration to avoid common statistical problems. Methods Ecol. Evol. 2010, 1, 3–14. [Google Scholar] [CrossRef]
  118. Asase, A.; Tetteh, D.A. Tree diversity, carbon stocks, and soil nutrients in cocoa-dominated and mixed food crops agroforestry systems compared to natural forest in southeast Ghana. Agroecol. Sustain. Food Syst. 2016, 40, 96–113. [Google Scholar] [CrossRef]
  119. Torralba, M.; Fagerholm, N.; Burgess, P.J.; Moreno, G.; Plieninger, T. Do European agroforestry systems enhance biodiversity and ecosystem services? A meta-analysis. Agric. Ecosyst. Environ. 2016, 230, 150–161. [Google Scholar] [CrossRef]
  120. Henle, K.; Alard, D.; Clitherow, J.; Cobb, P.; Firbank, L.; Kull, T.; McCracken, D.; Moritz, R.F.A.; Niemelä, J.; Rebane, M.; et al. Identifying and managing the conflicts between agriculture and biodiversity conservation in Europe-A review. Agric. Ecosyst. Environ. 2008, 124, 60–71. [Google Scholar] [CrossRef]
  121. Plieninger, T.; Bieling, C. Resilience-based perspectives to guiding high-nature-value farmland through socioeconomic change. Ecol. Soc. 2013, 18, 15. [Google Scholar] [CrossRef]
  122. Fekete, R.; Vincze, O.; Süveges, K.; Bak, H.; Malkócs, T.; Löki, V.; Urgyán, R.; Molnár, V.A. The role of olive groves in the conservation of Mediterranean orchids. Glob. Ecol. Conserv. 2023, 44, e02490. [Google Scholar] [CrossRef]
  123. Vidal, D.; Pitarma, R. Infrared thermography applied to tree health assessment: A review. Agriculture 2019, 9, 156. [Google Scholar] [CrossRef]
  124. Zevgolis, Y.G.; Sazeides, C.I.; Zannetos, S.P.; Grammenou, V.; Fyllas, N.M.; Akriotis, T.; Dimitrakopoulos, P.G.; Troumbis, A.Y. Investigating the effect of resin collection and detecting fungal infection in resin-tapped and non-tapped pine trees, using minimally invasive and non-invasive diagnostics. For. Ecol. Manag. 2022, 524, 120498. [Google Scholar] [CrossRef]
  125. Catena, G. A new application of thermography. Atti Della Fond. Giorgio Ronchi 1990, 45, 947–952. [Google Scholar]
  126. Nunak, T.; Nunak, N.; Tipsuwanporn, V.; Suesut, T. Surrounding effects on temperature and emissivity measurement of equipment in electrical distribution system. Lect. Notes Eng. Comput. Sci. 2015, 2219, 292–296. [Google Scholar]
  127. Pineda, M.; Barón, M.; Pérez-Bueno, M.-L. Thermal Imaging for Plant Stress Detection and Phenotyping. Remote Sens. 2020, 13, 68. [Google Scholar] [CrossRef]
  128. Ibarra-Castanedo, C.; Bendada, A.; Maldague, X.P. Infrared vision applications for the nondestructive testing of materials. In Proceedings of the 5th Pan American Conference for NDT, Cancun, Mexico, 2–6 October 2011. [Google Scholar]
  129. Usamentiaga, R.; Venegas, P.; Guerediaga, J.; Vega, L.; Molleda, J.; Bulnes, F.G. Infrared thermography for temperature measurement and non-destructive testing. Sensors 2014, 14, 12305–12348. [Google Scholar] [CrossRef] [PubMed]
  130. Omran, E.S.E. Early sensing of peanut leaf spot using spectroscopy and thermal imaging. Arch. Agron. Soil Sci. 2017, 63, 883–896. [Google Scholar] [CrossRef]
  131. Domec, J.C.; Lachenbruch, B.; Pruyn, M.L.; Spicer, R. Effects of age-related increases in sapwood area, leaf area, and xylem conductivity on height-related hydraulic costs in two contrasting coniferous species. Ann. For. Sci. 2012, 69, 17–27. [Google Scholar] [CrossRef]
  132. Burcham, D.C.; Leong, E.C.; Fong, Y.K.; Tan, P.Y. An evaluation of internal defects and their effect on trunk surface temperature in Casuarina equisetifolia L. (Casuarinaceae). Arboric. Urban For. 2012, 38, 277–286. [Google Scholar] [CrossRef]
  133. Leong, E.C.; Burcham, D.C.; Fong, Y.K. A purposeful classification of tree decay detection tools. Arboric. J. 2012, 34, 91–115. [Google Scholar] [CrossRef]
  134. Kim, Y.; Rahardjo, H.; Tsen-Tieng, D.L. Stability analysis of laterally loaded trees based on tree-root-soil interaction. Urban For. Urban Green. 2020, 49, 126639. [Google Scholar] [CrossRef]
  135. Kim, Y.; Rahardjo, H.; Tsen-Tieng, D.L. Mechanical behavior of trees with structural defects under lateral load: A numerical modeling approach. Urban For. Urban Green. 2021, 59, 126987. [Google Scholar] [CrossRef]
  136. Paoletti, A.; Rosati, A.; Famiani, F. Effects of cultivar, fruit presence and tree age on whole-plant dry matter partitioning in young olive trees. Heliyon 2021, 7, e06949. [Google Scholar] [CrossRef]
  137. Fernandez-Escobar, R.; de la Rosa, R.; Leon, L.; Gomez, J.A.; Testi, L.; Orgaz, F.; Gil-Ribes, J.A.; Quesada-Moraga, E.; Trapero, A.; Msallem, M. Evolution and sustainability of the olive production systems. Options Méditerranéennes. Séries A Mediterr. Semin. 2013, 106, 11–41. [Google Scholar]
  138. Paoletti, A.; Cinosi, N.; Lodolini, E.M.; Famiani, F.; Rosati, A. Effects of root constriction on vegetative growth and yield efficiency in young trees of a low- and a high-vigor olive cultivar. Trees 2023, 37, 1179–1187. [Google Scholar] [CrossRef]
  139. Bustan, A.; Dag, A.; Yermiyahu, U.; Erel, R.; Presnov, E.; Agam, N.; Kool, D.; Iwema, J.; Zipori, I.; Ben-Gal, A. Fruit load governs transpiration of olive trees. Tree Physiol. 2016, 36, 380–391. [Google Scholar] [CrossRef]
  140. Robles, H.; Ciudad, C.; Matthysen, E. Tree-cavity occurrence, cavity occupation and reproductive performance of secondary cavity-nesting birds in oak forests: The role of traditional management practices. For. Ecol. Manag. 2011, 261, 1428–1435. [Google Scholar] [CrossRef]
  141. Grüebler, M.U.; Schaller, S.; Keil, H.; Naef-Daenzer, B. The occurrence of cavities in fruit trees: Effects of tree age and management on biodiversity in traditional European orchards. Biodivers. Conserv. 2013, 22, 3233–3246. [Google Scholar] [CrossRef]
  142. Liu, Y.; Ji, D.; Turgeon, R.; Chen, J.; Lin, T.; Huang, J.; Luo, J.; Zhu, Y.; Zhang, C.; Lv, Z. Physiological and proteomic responses of mulberry trees (Morus alba. L.) to combined salt and drought stress. Int. J. Mol. Sci. 2019, 20, 2486. [Google Scholar] [CrossRef] [PubMed]
  143. Pallardy, S.G. The Woody Plant Body. In Physiology of Woody Plants, 3rd ed.; Pallardy, S.G., Ed.; Academic Press: Cambridge, MA, USA, 2008; pp. 9–38. [Google Scholar] [CrossRef]
  144. Hu, Y.; Sun, Z.; Zeng, Y.; Ouyang, S.; Chen, L.; Lei, P.; Deng, X.; Zhao, Z.; Fang, X.; Xiang, W. Tree-level stomatal regulation is more closely related to xylem hydraulic traits than to leaf photosynthetic traits across diverse tree species. Agric. For. Meteorol. 2023, 329, 109291. [Google Scholar] [CrossRef]
  145. Giourga, C.; Loumou, A.; Tsevreni, I.; Vergou, A. Assessing the sustainability factors of traditional olive groves on Lesvos Island, Greece (Sustainability and traditional cultivation). GeoJournal 2008, 73, 149–159. [Google Scholar] [CrossRef]
  146. Stateras, D.; Kalivas, D. Assessment of olive tree canopy characteristics and yield forecast model using high resolution uav imagery. Agric. 2020, 10, 385. [Google Scholar] [CrossRef]
  147. Brito, C.; Dinis, L.-T.; Moutinho-Pereira, J.; Correia, C.M. Drought Stress Effects and Olive Tree Acclimation under a Changing Climate. Plants 2019, 8, 232. [Google Scholar] [CrossRef]
  148. Fernández, J.E. Plant-based sensing to monitor water stress: Applicability to commercial orchards. Agric. Water Manag. 2014, 142, 99–109. [Google Scholar] [CrossRef]
  149. Torres-Ruiz, J.M.; Diaz-Espejo, A.; Morales-Sillero, A.; Martín-Palomo, M.J.; Mayr, S.; Beikircher, B.; Fernández, J.E. Shoot hydraulic characteristics, plant water status and stomatal response in olive trees under different soil water conditions. Plant Soil 2013, 373, 77–87. [Google Scholar] [CrossRef]
  150. Torres-Ruiz, J.M.; Diaz-Espejo, A.; Perez-Martin, A.; Hernandez-Santana, V. Role of hydraulic and chemical signals in leaves, stems and roots in the stomatal behaviour of olive trees under water stress and recovery conditions. Tree Physiol. 2015, 35, 415–424. [Google Scholar] [CrossRef] [PubMed]
  151. Hernandez-Santana, V.; Rodriguez-Dominguez, C.M.; Fernández, J.E.; Diaz-Espejo, A. Role of leaf hydraulic conductance in the regulation of stomatal conductance in almond and olive in response to water stress. Tree Physiol. 2016, 36, 725–735. [Google Scholar] [CrossRef] [PubMed]
  152. Akkuzu, E.; Kaya, Ü.; Çamoğlu, G.; Mengü, G.P.; Aşik, Ş. Determination of Crop Water Stress Index and Irrigation Timing on Olive Trees Using a Handheld Infrared Thermometer. J. Irrig. Drain. Eng. 2013, 139, 728–737. [Google Scholar] [CrossRef]
  153. Buonaurio, R.; Almadi, L.; Famiani, F.; Moretti, C.; Agosteo, G.E.; Schena, L. Olive leaf spot caused by Venturia oleaginea: An updated review. Front. Plant Sci. 2023, 13, 1061136. [Google Scholar] [CrossRef] [PubMed]
Figure 1. Distribution of the main land cover types of the island of Naxos, Greece, along with the study site in Laoudis region (dotted rectangle in the main map).
Applsci 13 11443 g001
Figure 2. Sample infrared image of an olive tree canopy: (a) represents the calibrated image post-import into the TESTO IRSoft® (v. 4.3) software, utilizing the temperature palette; (b) depicts the histogram distribution values for both the canopy and trunk; (c) highlights the region of interest (ROI) encompassing the leaf-covered area outlined in the infrared image; (d) displays the canopy histogram distribution values following the ROI selection.
Applsci 13 11443 g002
Figure 3. Sample infrared images from different sides of the trunk and the methodological procedure for extracting temperature and humidity values from the tree trunks using the ArcGIS Analysis toolbox: (a,b) correspond to the calibrated images imported into the TESTO IRSoft® (v. 4.3) software, utilizing the temperature palette; (g,h) represent the calibrated images imported into the TESTO IRSoft® (v. 4.3) software, employing the humidity palette; (c,d,i,j) depict the tree trunks following polygon creation using a shapefile format; (e,f,k,l) illustrate the temperature and humidity histograms of the olive trees’ trunks.
Applsci 13 11443 g003
Figure 4. Box plots showing the productivity values of the 44 centennial olive trees during the four harvest years. Horizontal lines: medians; boxes: interquartile ranges (25–75%); whiskers: data ranges.
Applsci 13 11443 g004
Figure 5. Box plots showing the differences between the two sides of the olive trees’ trunk: (a) humidity interquartile range (HIQR), (b) humidity outer percentile range (HOPR), (c) temperature interquartile range (TIQR), and (d) temperature outer percentile range (TOPR). Horizontal lines: medians; boxes: interquartile ranges (25–75%); whiskers: data ranges.
Applsci 13 11443 g005
Figure 6. Correlation matrix displaying the associations between productivity, phenotypic traits, thermal and humidity indices, and CWSI. Red and blue hues represent negative and positive correlations, respectively, with color intensity indicating the correlation strength. Statistically significant correlations (p < 0.05) are identified for all coefficients exceeding 0.20 or falling below −0.20.
Applsci 13 11443 g006
Figure 7. Effect plots of the impact of (a) cavity ratio (CR) and (b) crop water stress index (CWSI) on productivity. The x-axis represents varying CR and CWSI values, while the y-axis displays the corresponding predicted productivity values. As CR and CWSI increases there is a noticeable decrease in productivity, indicating a strong inverse relationship.
Applsci 13 11443 g007
Figure 8. Effect plots of the impact of (a) canopy temperature interquartile range (TIQR canopy), (b) temperature interquartile range differences between side A and B (TIQR difference), and (c) humidity interquartile range differences between side A and B (HIQR difference), on productivity. The x-axis displays the values of these indices, while the y-axis indicates predicted productivity values. These indices exhibit a negative relationship with productivity, with higher values corresponding to lower productivity.
Applsci 13 11443 g008
Figure 9. Effect plots of the impact of (a) canopy health (HC), (b) crop water stress index (CWSI), (c) humidity interquartile range for side A (HIQR Side A), and (d) temperature interquartile range for side A (TIQR Side A) on productivity. The x-axis displays the values of these indices, while the y-axis indicates predicted productivity values.
Applsci 13 11443 g009
Figure 10. Effect plots of the impact of (a) productivity range (Prange), (b) temperature outer percentile range differences between side A and B (TOPR difference), and (c) humidity outer percentile range differences between side A and B (HOPR difference) on crop water stress index (CWSI). The x-axis displays the values of these indices, while the y-axis indicates predicted productivity values.
Applsci 13 11443 g010
Figure 11. Box plots showing the differences in (a) humidity and (b) thermal indices of the olive trees with and without OLS. Horizontal lines: medians; boxes: interquartile ranges (25–75%); whiskers: data ranges.
Applsci 13 11443 g011
Table 1. Phenotypic traits of the centennial olive trees (N = 44).
Phenotypic TraitsMeanSDS.EMinMax
Height (m)6.981.751.164.8513.31
Diameter (cm)68.0324.393.6743.52156.69
Productive shoots10.456.590.991.0023.00
Unproductive shoots3.702.350.351.009.00
Shoots ratio0.670.240.030.110.96
Crown area (m2)69.2935.595.3616.23140.43
Healthy crown (m2)49.8937.645.675.94140.43
Age (years)190.2751.467.75121.18314.04
Cavities4.524.040.600.0018.00
Cavities ratio0.020.010.000.000.06
Table 2. Final models obtained from the multiple linear regression analyses for estimating productivity. All regression models were statistically significant (p < 0.05). The slope of the predictor variable for the response variable (B), the standard error for the slope (SE B), the standardized beta (β), the t-test statistic (t), the probability value (p), the regression-adjusted coefficient for the regression model (R2), and the predictive capability of the models (F).
Variables SetResponse
Variable
Predictor VariablesBSE Bβtp-ValueR2 adj.F
Phenotypic traitsP(constant)59.793.88 15.380.0010.54526.799
CR−434.06102.9−0.47−4.210.001
CWSI−86.06722.14−0.43−3.880.001
Thermal and humidity indicesP(constant)54.282.86 18.960.0010.57019.983
TIQR canopy−7.133.45−0.29−2.060.046
TIQR difference−14.005.52−0.34−2.530.015
HIQR difference−4.271.30−0.35−3.280.002
Combined modelP(constant)54.395.29 10.270.0010.71127.384
HC0.1290.030.373.740.001
CWSI−49.0120.12−0.24−2.430.020
HIQR Side A−3.041.02−0.30−2.980.005
TIQR Side A−8.193.12−0.24−2.620.012
Table 3. Final model obtained from the multiple linear regression analyses for estimating CWSI. All regression models were statistically significant (p < 0.05). The slope of the predictor variable for the response variable (B), the standard error for the slope (SE B), the standardized beta (β), the t-test statistic (t), the probability value (p), the regression-adjusted coefficient for the regression model (R2), and the predictive capability of the models (F).
Variables SetResponse
Variable
Predictor VariablesBSE Bβtp-ValueR2 adj.F
Combined modelCWSI(constant)0.180.02 6.950.0010.47513.948
Prange−0.000.00−0.45−3.990.001
HOPR difference0.000.000.292.610.011
TOPR difference0.010.000.292.590.011
Table 4. Logistic regression models for the prediction of the OLS (N = 44). Β = logistic coefficient; S.E. = standard error of estimate; Wald = Wald chi-square; df = degree of freedom; p-value = significance.
Variable SetPredictorΒS.E.Wald’s χ2dfp-Value
Phenotypic traitsProductivity−0.290.099.6810.002
Constant11.763.849.3910.002
Thermal and humidity indicesTIQR Side A7.612.519.2110.002
Constant−4.951.678.8110.003
Combined modelCR−128.9077.292.7810.045
Productivity−0.210.095.0210.025
HC−0.050.033.2010.033
TIQR Side A8.895.342.7710.026
Constant8.925.083.0810.049
Table 5. Statistical comparisons between trees with and without OLS the phenotypic traits. The table shows t-values and p-values for each trait, indicating significant differences between the two groups. Significant differences are denoted by p < 0.05.
Phenotypic Traitst-Valuedfp-Value
Height−0.29942>0.05
Diameter−3.72242<0.05
Shoots ratio2.52242<0.01
Crown area2.66542<0.01
Healthy crown4.99742<0.001
Age −3.72242<0.05
Cavities ratio−2.93842<0.01
Productivity6.64542<0.001
Productivity range2.12442<0.05
Disclaimer/Publisher’s Note: The statements, opinions and data contained in all publications are solely those of the individual author(s) and contributor(s) and not of MDPI and/or the editor(s). MDPI and/or the editor(s) disclaim responsibility for any injury to people or property resulting from any ideas, methods, instructions or products referred to in the content.

