
The Evaluation of the Temperature Reduction Effects of Cool Roofs and Cool Pavements as Urban Heatwave Mitigation Strategies


Abstract
:1. Introduction
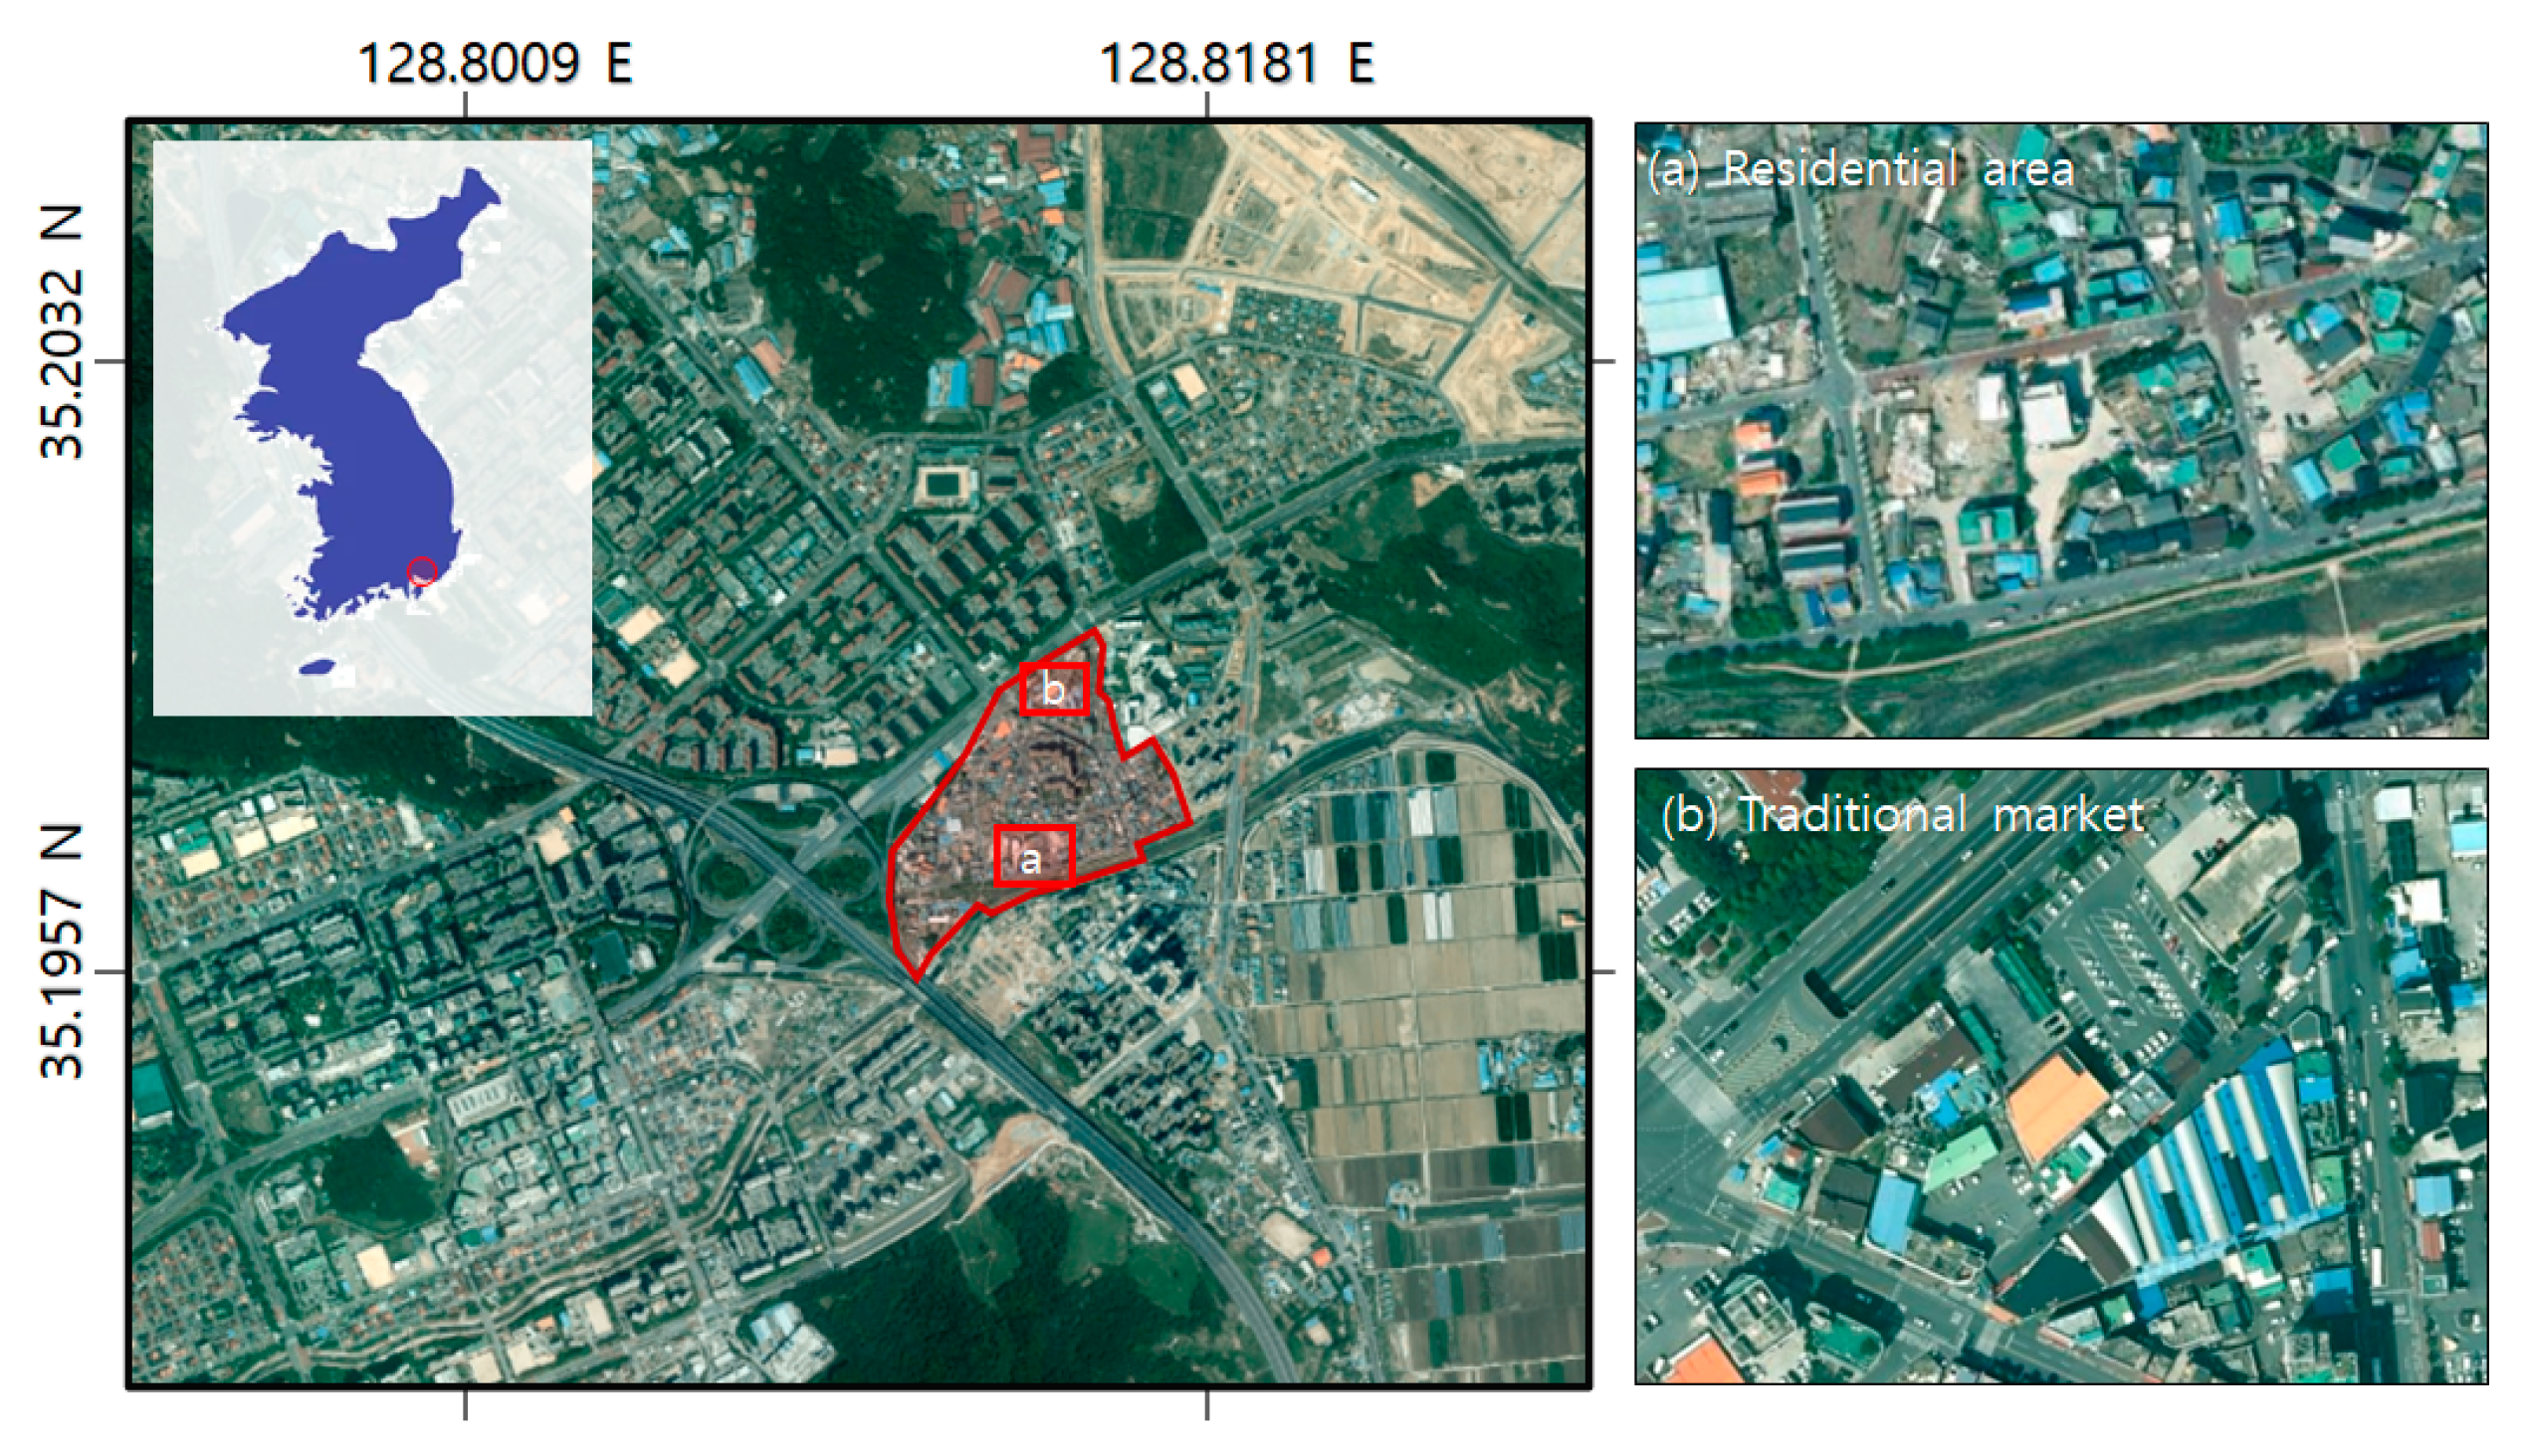
2. Study Area
3. Data and Methods
3.1. Cool Roofs
3.2. Cool Pavements
3.3. User Satisfaction Surveys
4. Results and Discussion
4.1. Cool Roofs
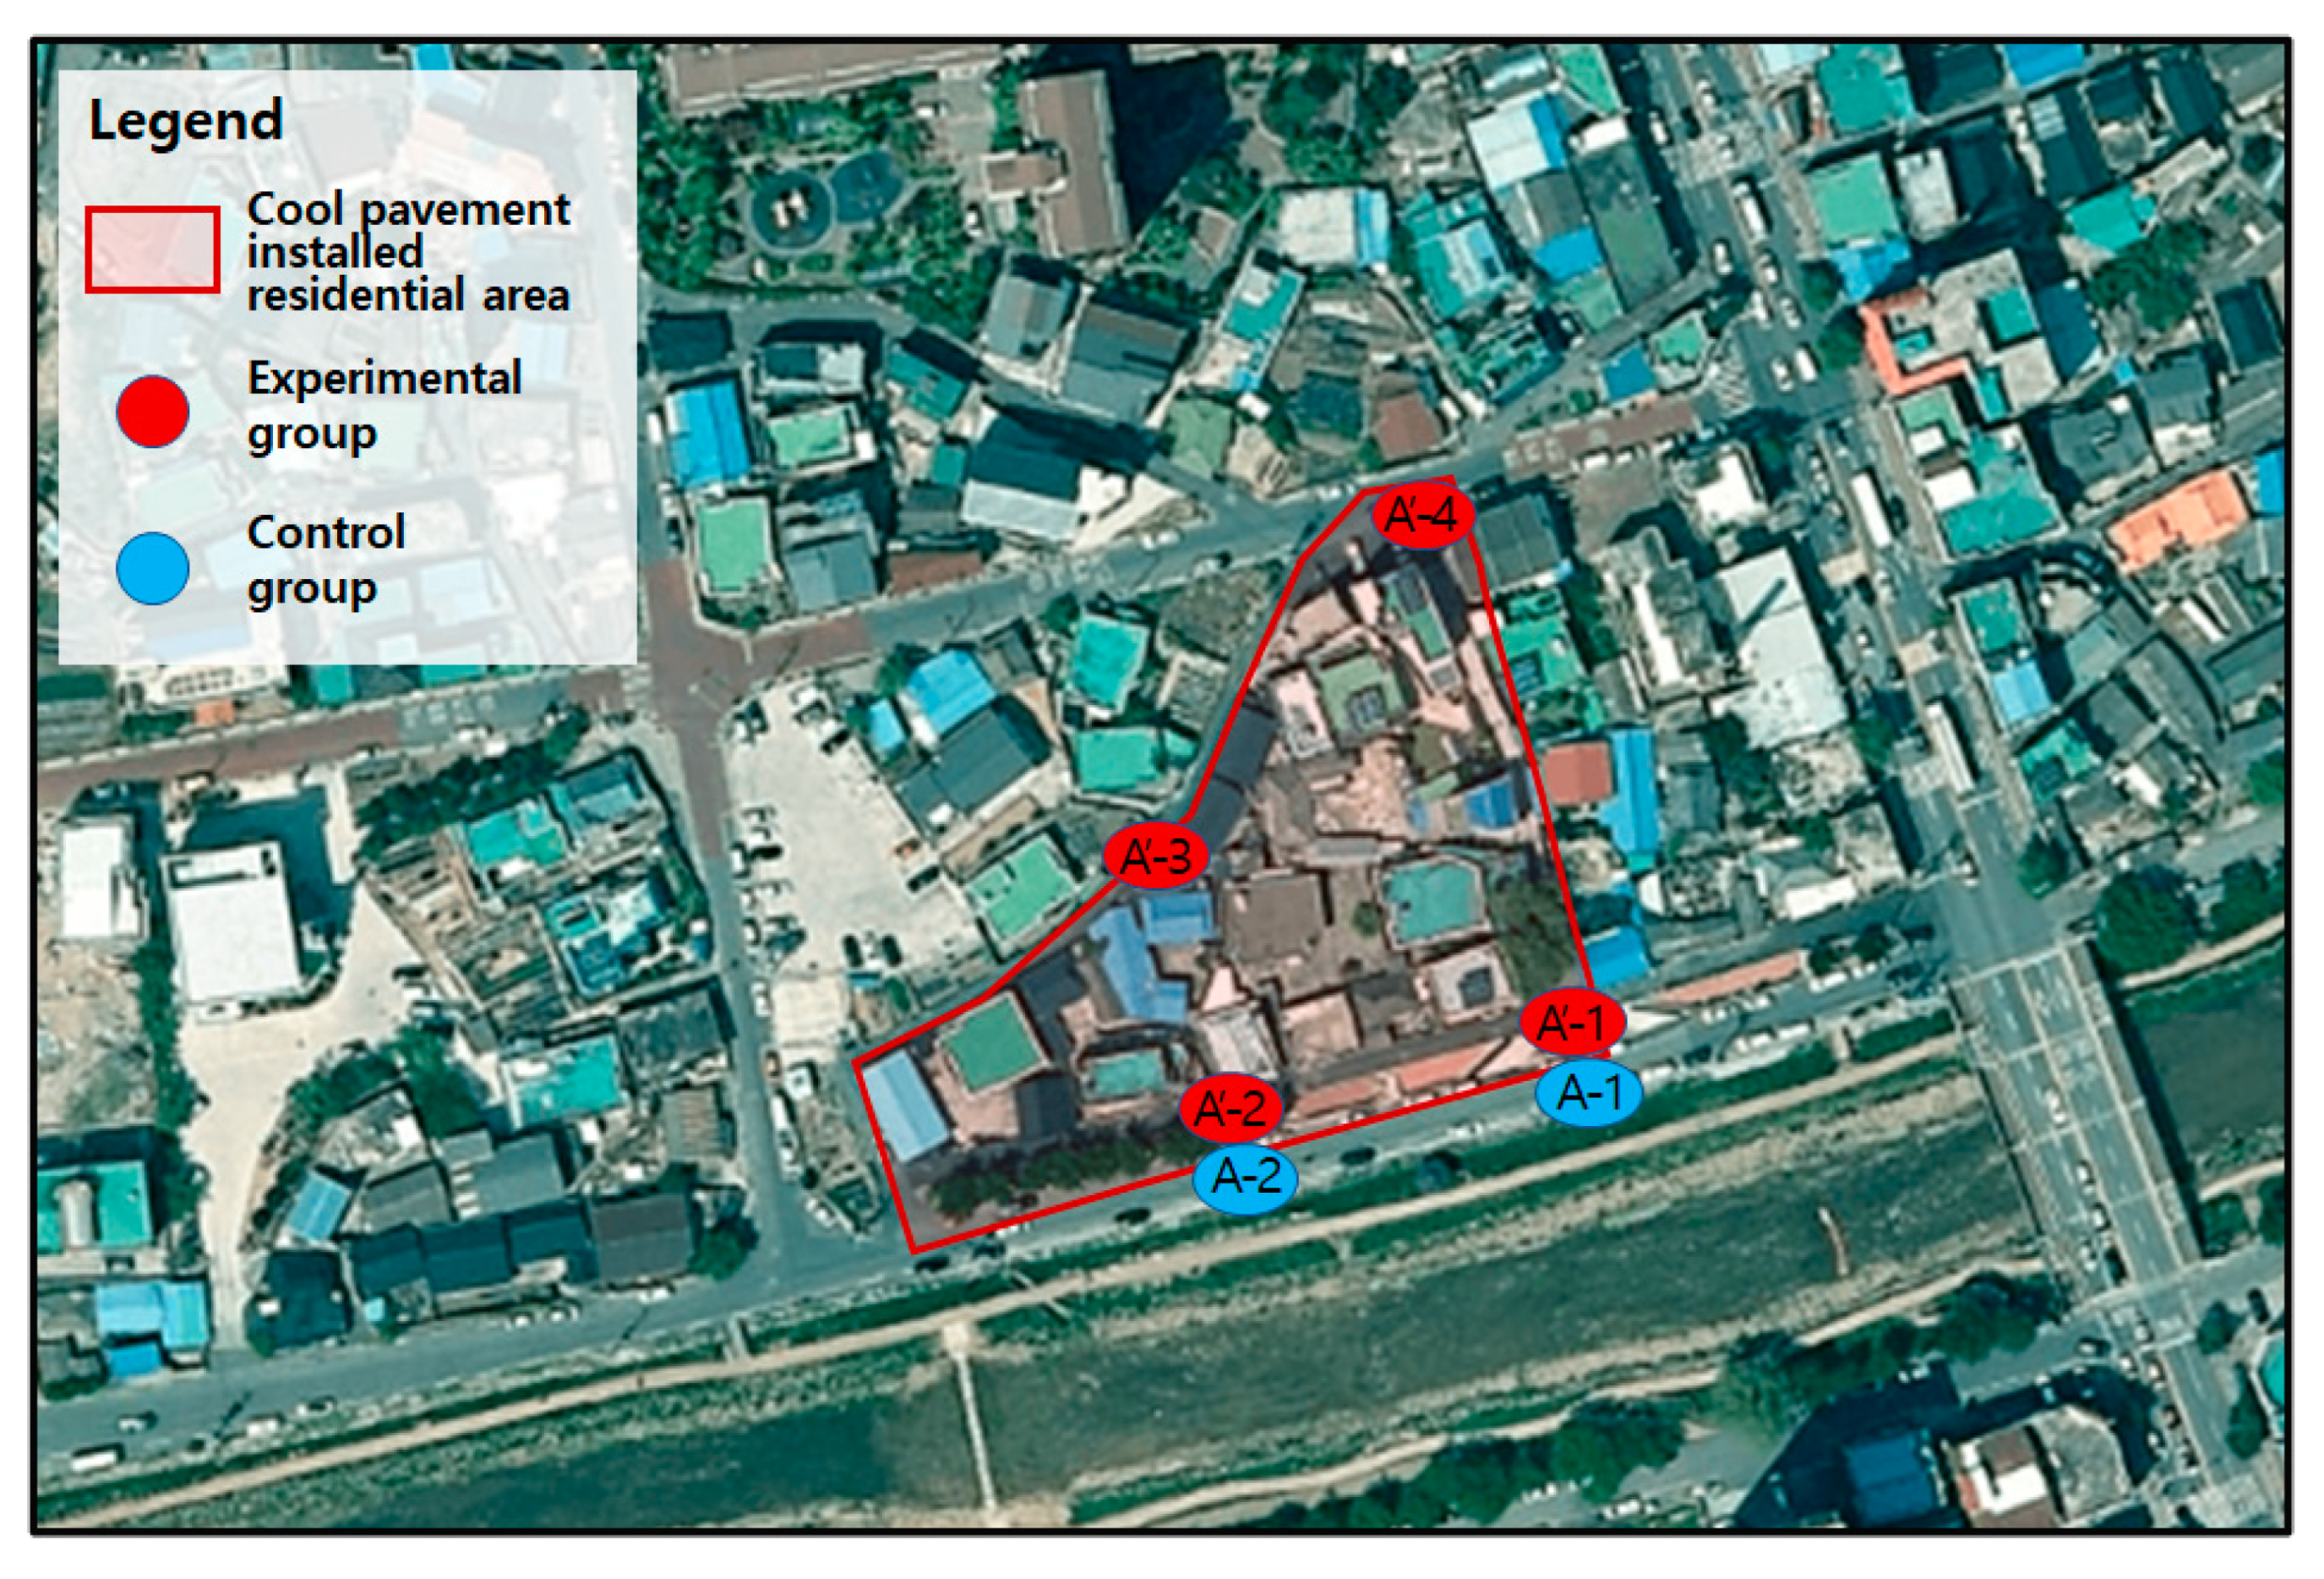
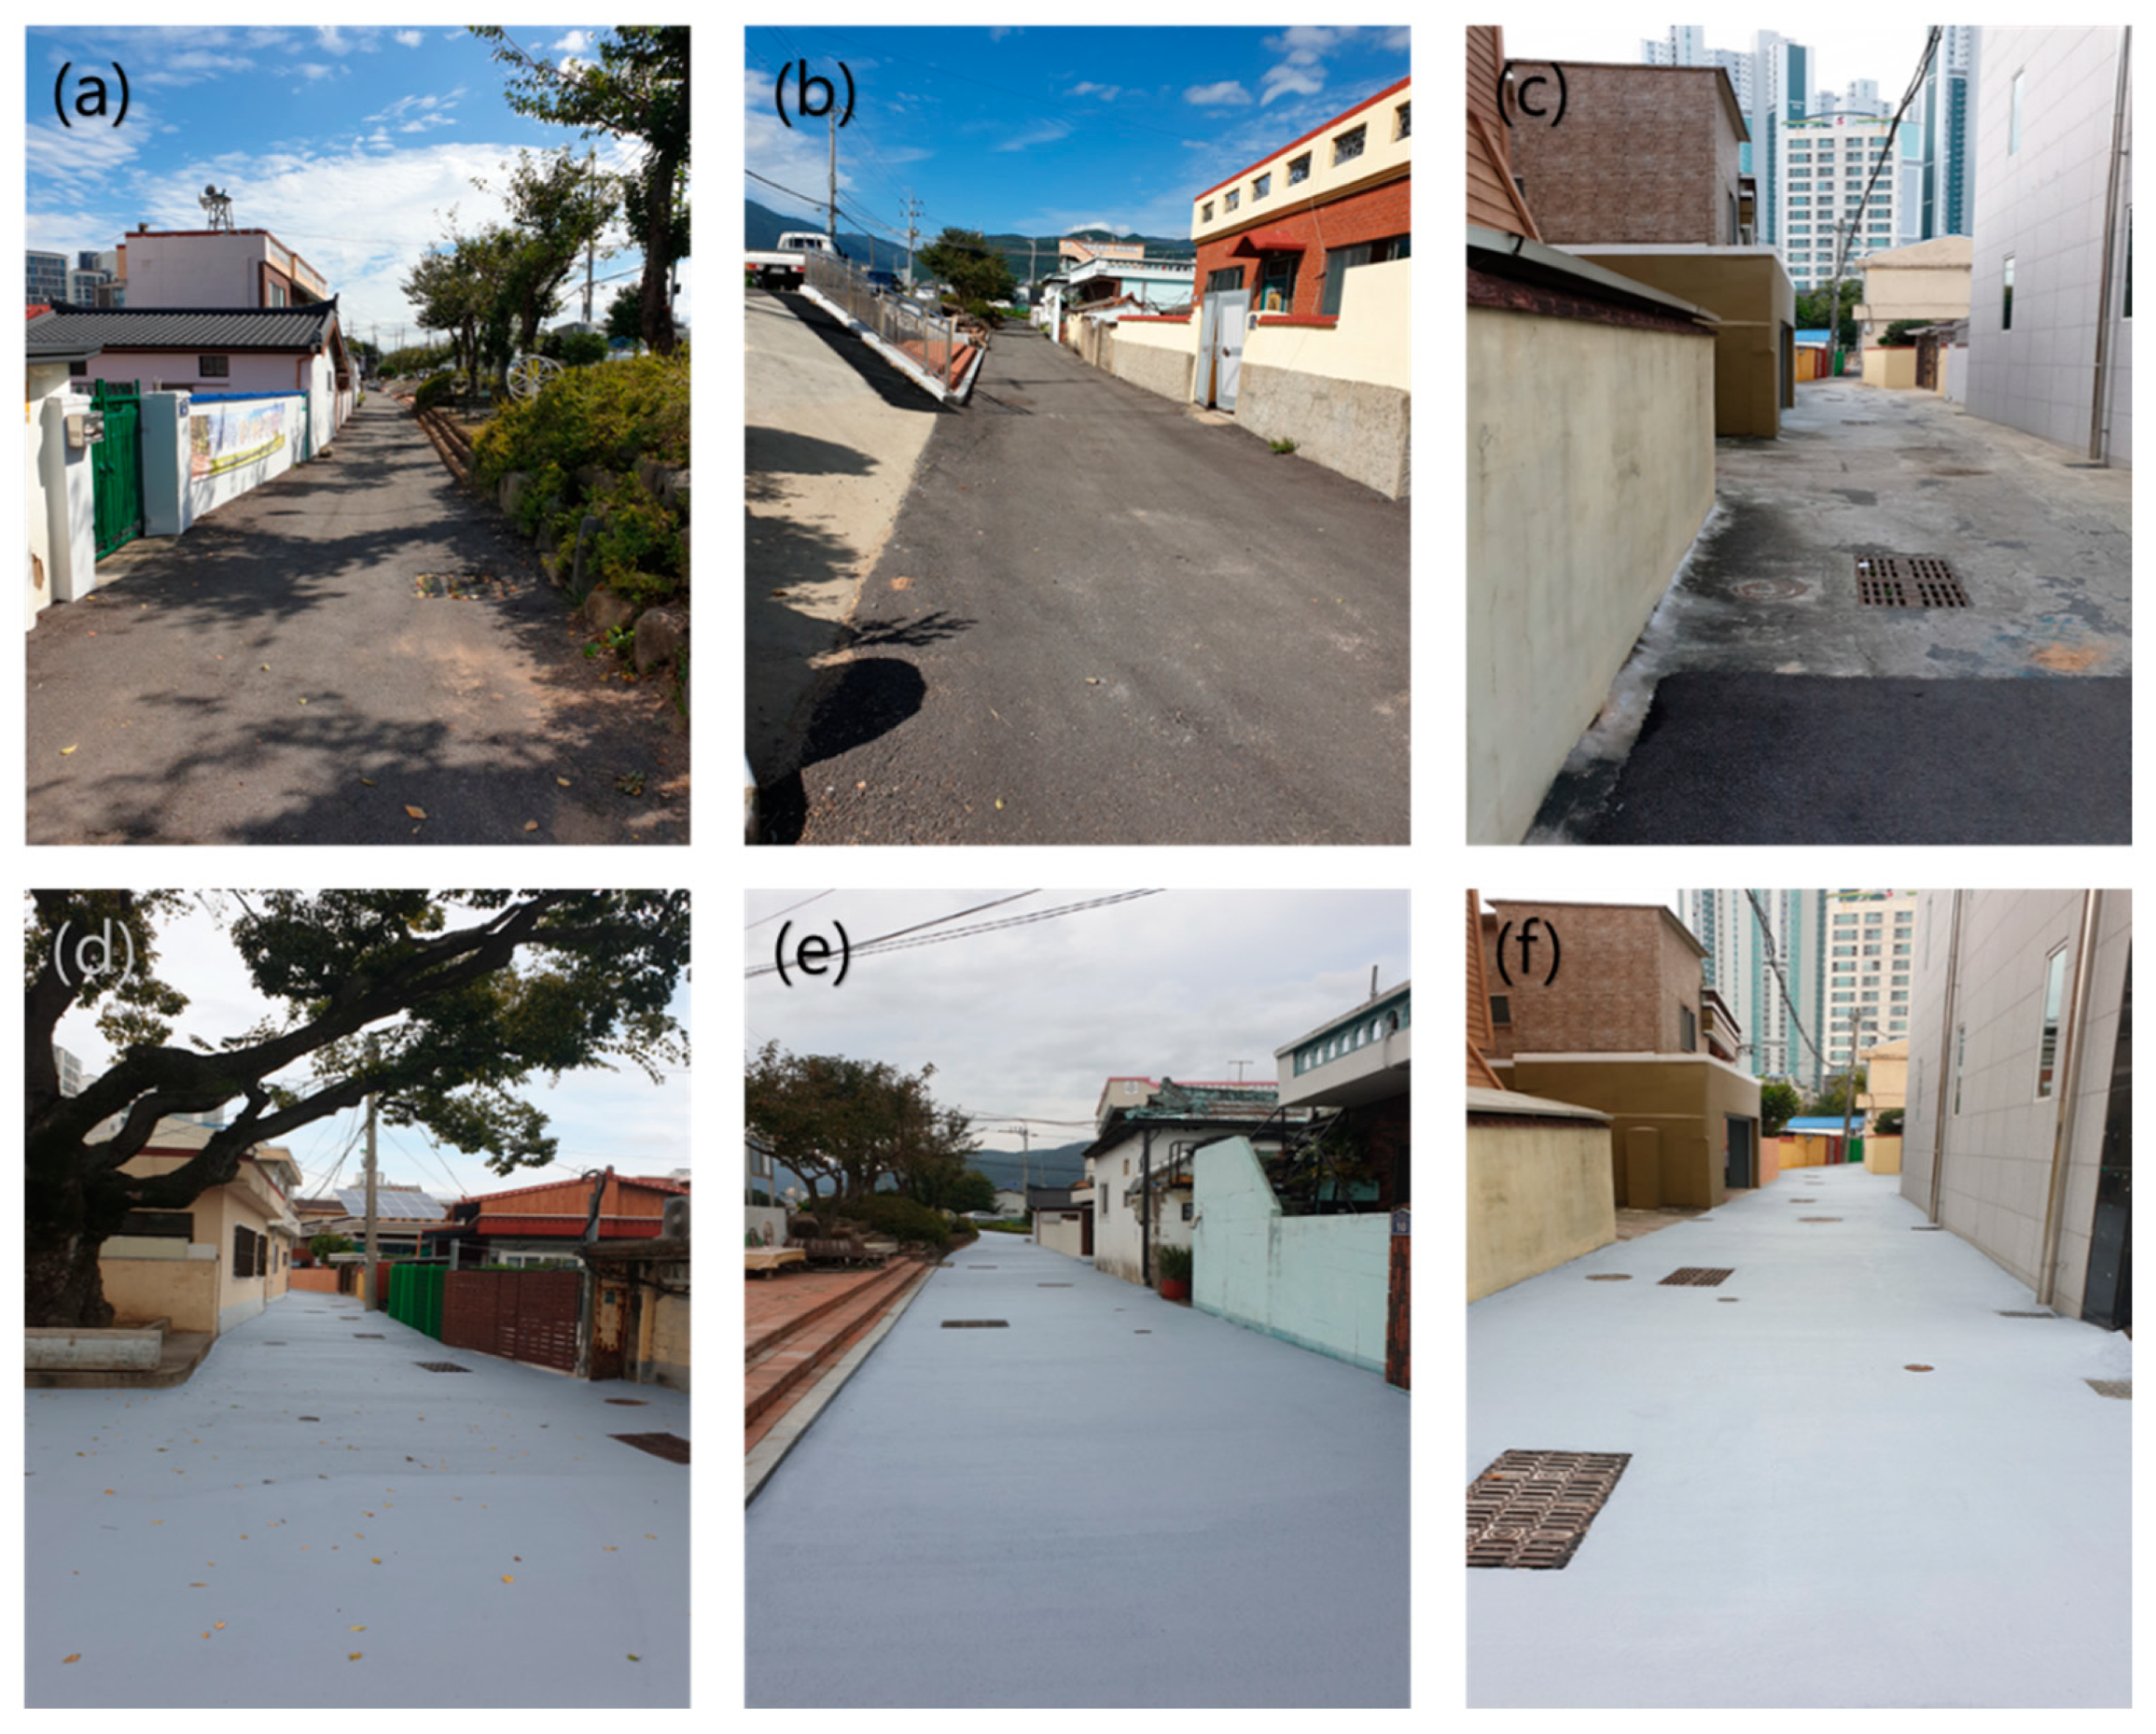
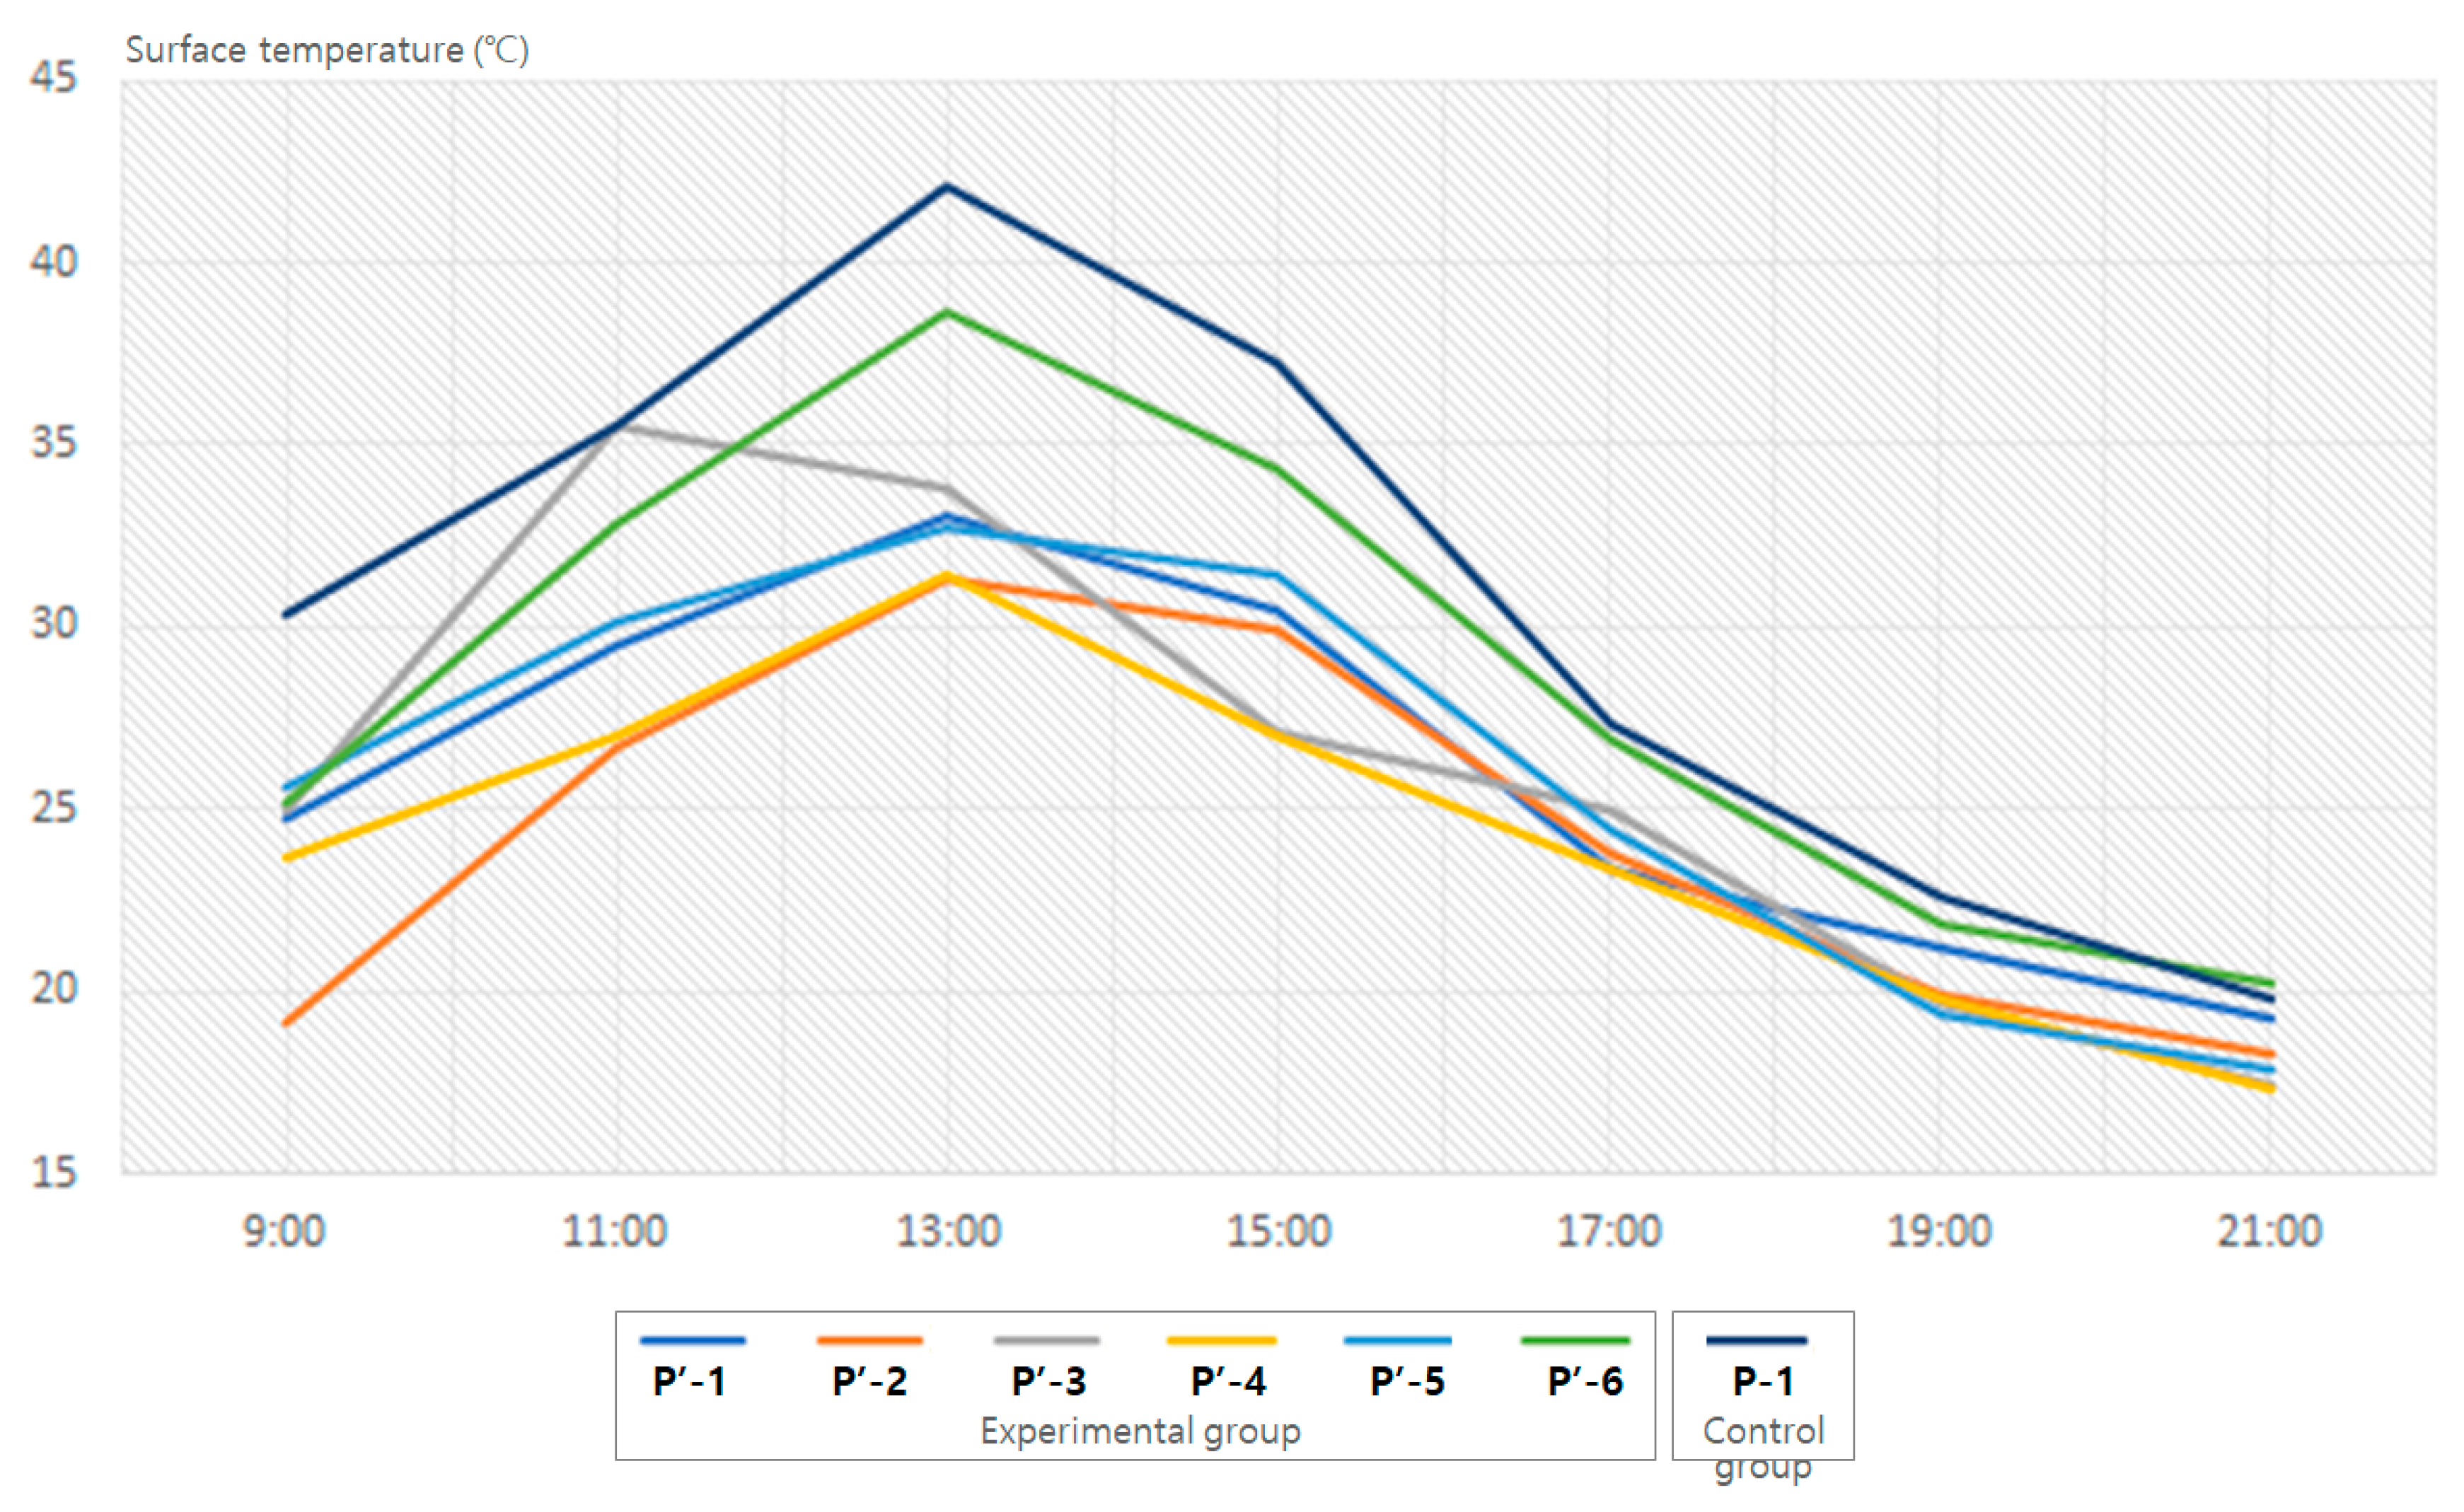
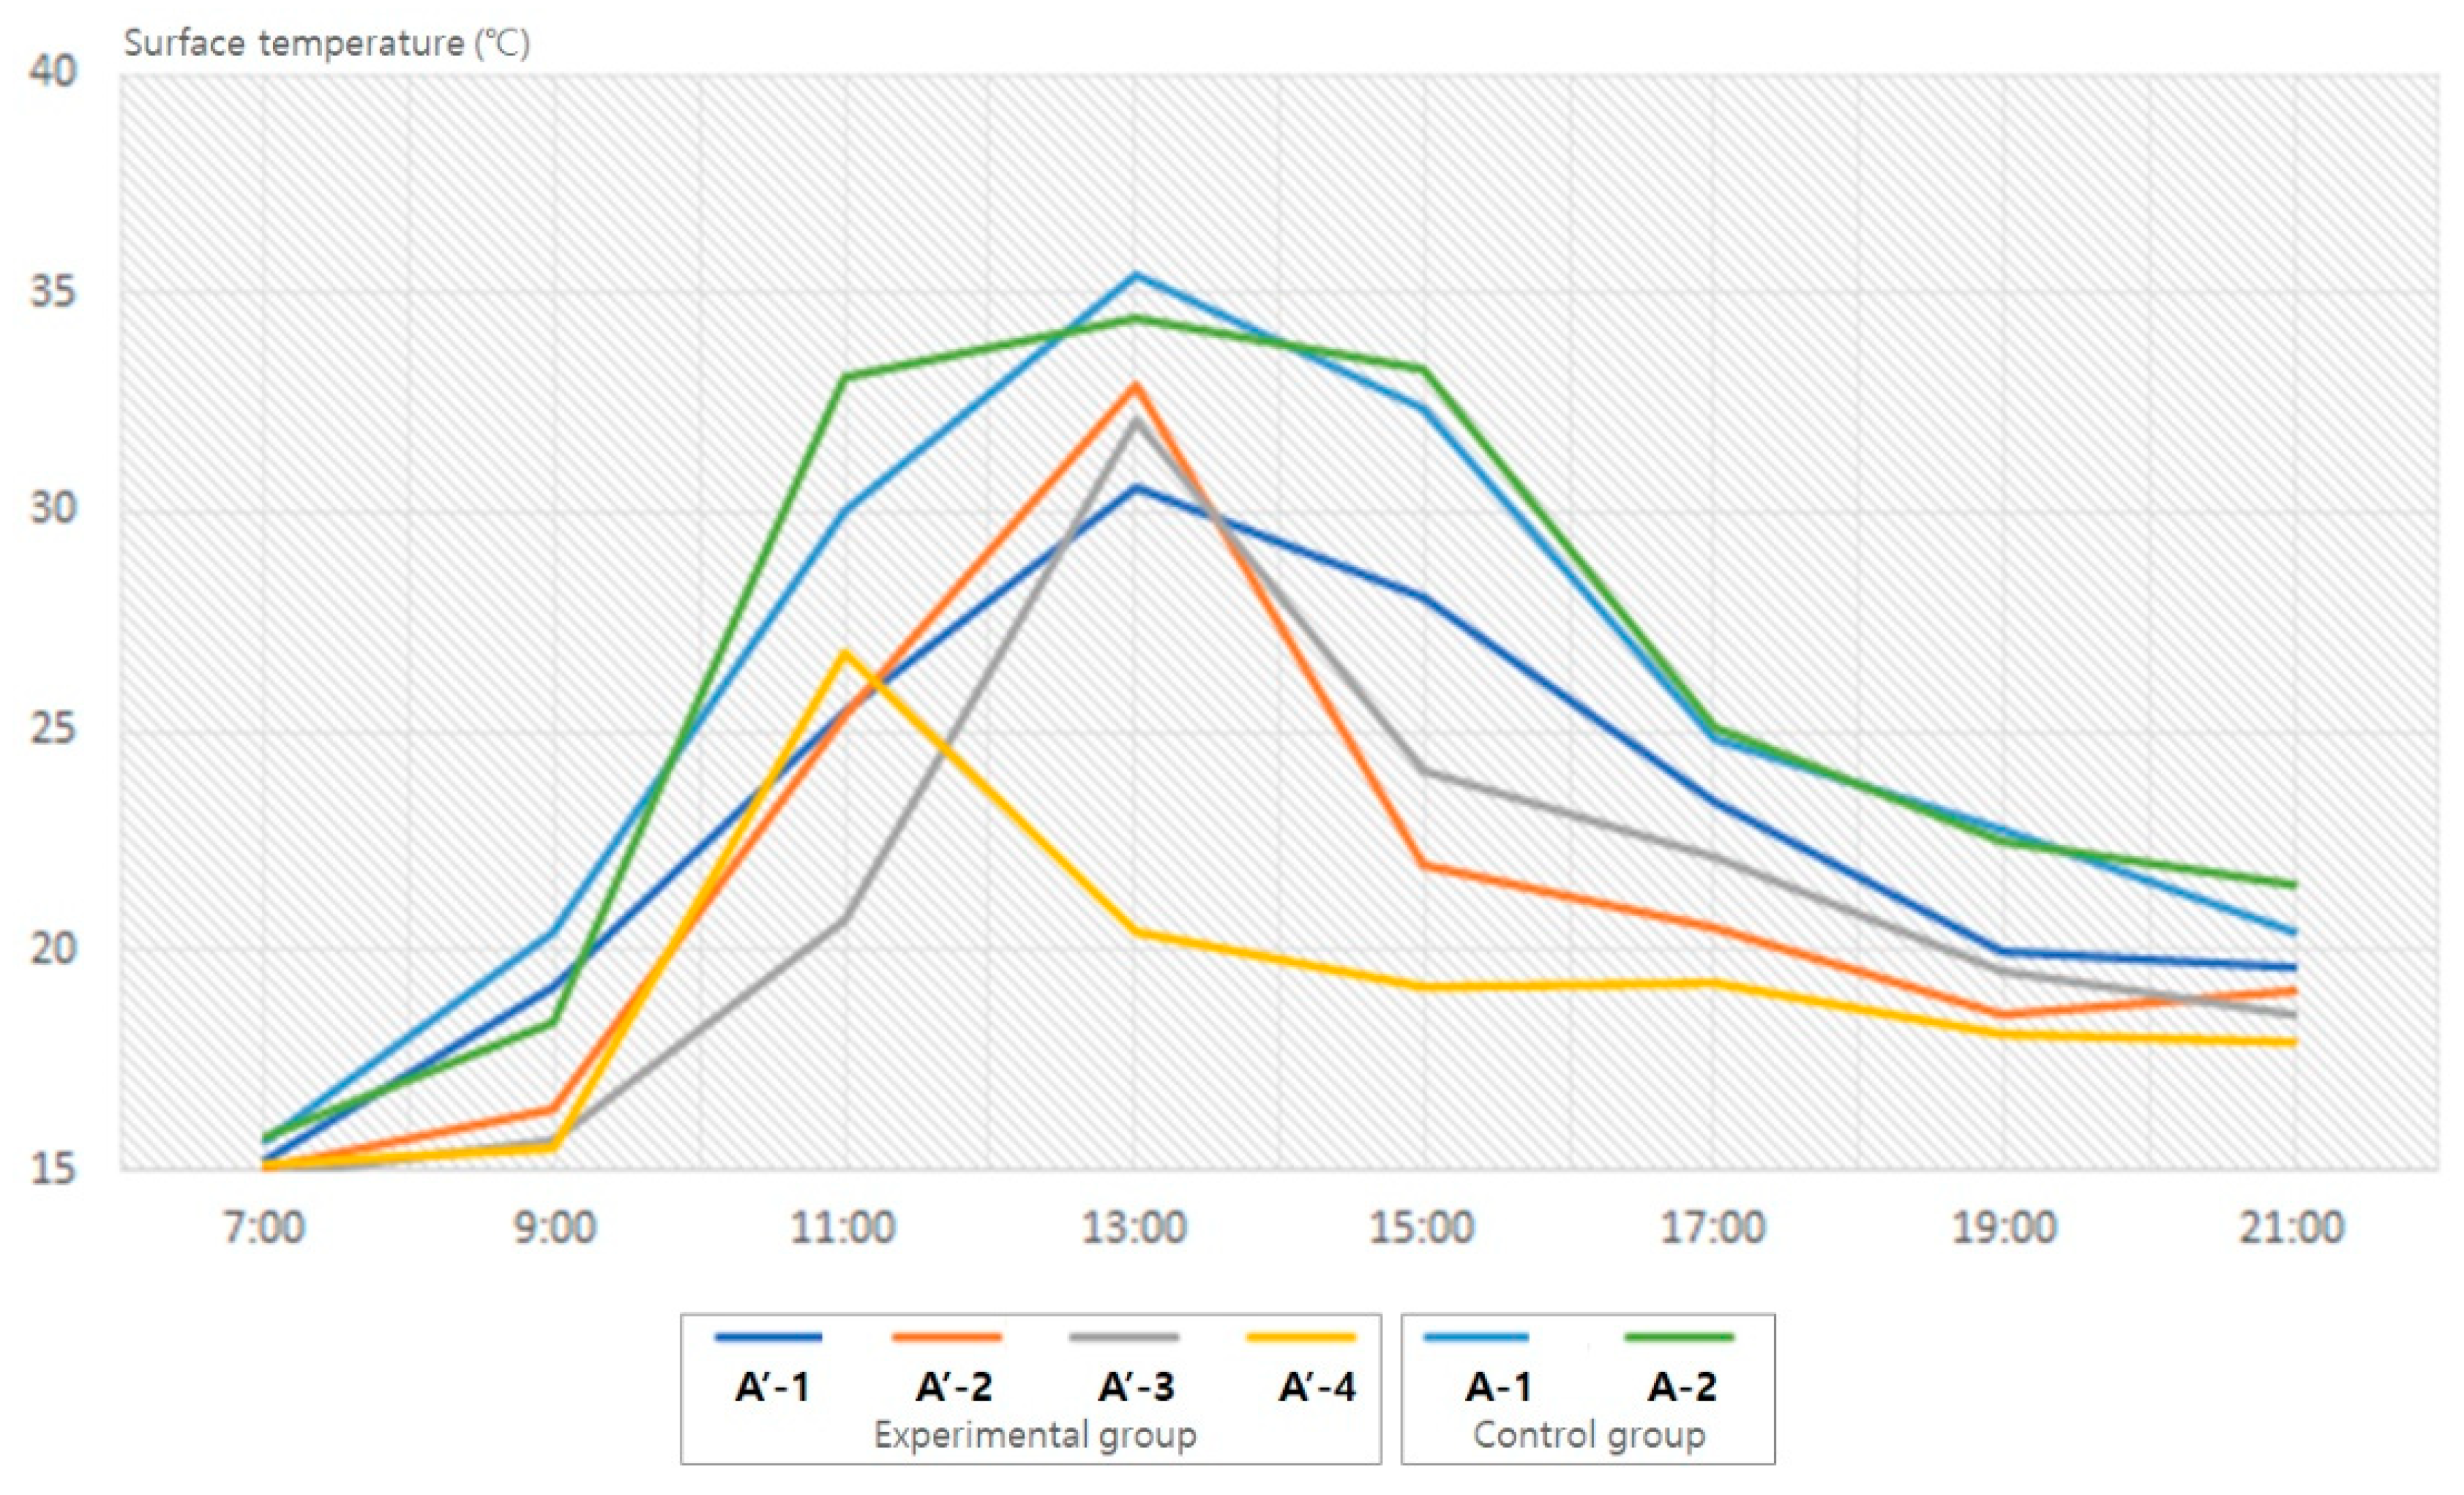
4.2. Cool Pavements
4.3. Survey
4.3.1. Cool Roofs
4.3.2. Cool Pavements
5. Conclusions
Author Contributions
Funding
Institutional Review Board Statement
Informed Consent Statement
Data Availability Statement
Conflicts of Interest
References
- Djalante, R. Key assessments from the ipcc special report on global warming of 1.5 °C and the implications for the sendai framework for disaster risk reduction. Prog. Disaster Sci. 2019, 1, 100001. [Google Scholar] [CrossRef]
- Pachauri, R.; Meyer, L. Climate Change 2014: Synthesis Report; Contribution of Working Groups i, ii and iii to the Fifth Assessment Report of the Intergovernmental Panel on Climate Change; IPCC: Geneva, Switzerland, 2014. [Google Scholar]
- Field, C.B.; Barros, V.R.; Mastrandrea, M.D.; Mach, K.J.; Abdrabo, M.-K.; Adger, N.; Anokhin, Y.A.; Anisimov, O.A.; Arent, D.J.; Barnett, J. Summary for Policymakers. In Climate Change 2014: Impacts, Adaptation, and Vulnerability. Part a: Global and Sectoral Aspects; Contribution of Working Group II to the Fifth Assessment Report of the Intergovernmental Panel on Climate Change; Cambridge University Press: Cambridge, UK, 2014; pp. 1–32. [Google Scholar]
- Lahsen, M.; Ribot, J. Politics of attributing extreme events and disasters to climate change. Wiley Interdiscip. Rev. Clim. Change 2022, 13, e750. [Google Scholar] [CrossRef]
- Kim, D.-W.; Kwon, C.; Kim, J.; Lee, J.-S. Characteristics of heat waves from a disaster perspective. J. Prev. Med. Public Health 2020, 53, 26. [Google Scholar] [CrossRef] [PubMed]
- Steffen, W.; Hughes, L.; Perkins, S. Heatwaves: Hotter, Longer, More Often; Climate Council: Surry Hills, Australia, 2014. [Google Scholar]
- Zuo, J.; Pullen, S.; Palmer, J.; Bennetts, H.; Chileshe, N.; Ma, T. Impacts of heat waves and corresponding measures: A review. J. Clean. Prod. 2015, 92, 1–12. [Google Scholar] [CrossRef]
- Lo, Y.E.; Mitchell, D.M.; Thompson, R.; O’Connell, E.; Gasparrini, A. Estimating heat-related mortality in near real time for national heatwave plans. Environ. Res. Lett. 2022, 17, 024017. [Google Scholar] [CrossRef]
- Habeeb, D.; Vargo, J.; Stone, B. Rising heat wave trends in large us cities. Nat. Hazards 2015, 76, 1651–1665. [Google Scholar] [CrossRef]
- EPA. Learn about Heat Islands. Available online: https://www.epa.gov/heatislands/learn-about-heat-islands#heat-islands (accessed on 11 October 2023).
- Wilhelmi, O.V.; Purvis, K.L.; Harriss, R.C. Designing a geospatial information infrastructure for mitigation of heat wave hazards in urban areas. Nat. Hazards Rev. 2004, 5, 147–158. [Google Scholar] [CrossRef]
- Imran, H.M.; Kala, J.; Ng, A.; Muthukumaran, S. Effectiveness of vegetated patches as green infrastructure in mitigating urban heat island effects during a heatwave event in the city of melbourne. Weather Clim. Extrem. 2019, 25, 100217. [Google Scholar] [CrossRef]
- Kolokotsa, D.; Maravelaki-Kalaitzaki, P.; Papantoniou, S.; Vangeloglou, E.; Saliari, M.; Karlessi, T.; Santamouris, M. Development and analysis of mineral based coatings for buildings and urban structures. Sol. Energy 2012, 86, 1648–1659. [Google Scholar] [CrossRef]
- Santamouris, M. Cooling the cities—A review of reflective and green roof mitigation technologies to fight heat island and improve comfort in urban environments. Sol. Energy 2014, 103, 682–703. [Google Scholar] [CrossRef]
- Anupam, B.; Sahoo, U.C.; Chandrappa, A.K.; Rath, P. Emerging technologies in cool pavements: A review. Constr. Build. Mater. 2021, 299, 123892. [Google Scholar] [CrossRef]
- Moretti, L.; Cantisani, G.; Carpiceci, M.; D’Andrea, A.; Del Serrone, G.; Di Mascio, P.; Peluso, P.; Loprencipe, G. Investigation of parking lot pavements to counteract urban heat islands. Sustainability 2022, 14, 7273. [Google Scholar] [CrossRef]
- Kwon, Y.; Ahn, Y. Political effects of countermeasures against heat wave using system dynamics method: Case study in daegu metropolitan city. Korea Spat. Plan. Rev. 2020, 106, 41–64. [Google Scholar]
- Kolokotsa, D.D.; Giannariakis, G.; Gobakis, K.; Giannarakis, G.; Synnefa, A.; Santamouris, M. Cool roofs and cool pavements application in acharnes, greece. Sustain. Cities Soc. 2018, 37, 466–474. [Google Scholar] [CrossRef]
- Rawat, M.; Singh, R. A study on the comparative review of cool roof thermal performance in various regions. Energy Built Environ. 2022, 3, 327–347. [Google Scholar] [CrossRef]
- Bozonnet, E.; Doya, M.; Allard, F. Cool roofs impact on building thermal response: A french case study. Energy Build. 2011, 43, 3006–3012. [Google Scholar] [CrossRef]
- Song, B.-G.; Kim, G.-A.; Park, K.-H. Reduction in indoor and outdoor temperature of office building with cool roof. KIEAE J. 2016, 16, 95–101. [Google Scholar] [CrossRef]
- He, Y.; Yu, H.; Ozaki, A.; Dong, N. Thermal and energy performance of green roof and cool roof: A comparison study in shanghai area. J. Clean. Prod. 2020, 267, 122205. [Google Scholar] [CrossRef]
- Pisello, A.L.; Santamouris, M.; Cotana, F. Active cool roof effect: Impact of cool roofs on cooling system efficiency. Adv. Build. Energy Res. 2013, 7, 209–221. [Google Scholar] [CrossRef]
- Pisello, A.L.; Cotana, F. The thermal effect of an innovative cool roof on residential buildings in italy: Results from two years of continuous monitoring. Energy Build. 2014, 69, 154–164. [Google Scholar] [CrossRef]
- Yang, H.; Lee, G.; Bae, M.; Yi, C. Estimation of the temperature reduction effect of heatwave response projects in urban spaces. J. Clim. Chang. Res. 2021, 12, 777–795. [Google Scholar] [CrossRef]
- Cho, Y.-I.; Yoon, D.; Shin, J.; Lee, M.-J. Comparative analysis of the effects of heat island reduction techniques in urban heatwave areas using drones. Korean J. Remote Sens. 2021, 37, 1985–1999. [Google Scholar]
- Nutakki, T.U.K.; Kazim, W.U.; Alamara, K.; Salameh, T.; Abdelkareem, M.A. Experimental investigation on aging and energy savings evaluation of high solar reflective index (sri) paints: A case study on residential households in the gcc region. Buildings 2023, 13, 419. [Google Scholar] [CrossRef]
- Sen, S.; Roesler, J.; Ruddell, B.; Middel, A. Cool pavement strategies for urban heat island mitigation in suburban phoenix, arizona. Sustainability 2019, 11, 4452. [Google Scholar] [CrossRef]
- Akpınar, M.V.; Sevin, S. Reducing Urban Heat Islands by Developing Cool Pavements. In The Role of Exergy in Energy and the Environment; Springer: Berlin/Heidelberg, Germany, 2018; pp. 43–50. [Google Scholar]
- Battista, G.; Pastore, E.M. Using cool pavements to mitigate urban temperatures in a case study of Rome (Italy). Energy Procedia 2017, 113, 98–103. [Google Scholar] [CrossRef]
- Coseo, P.; Larsen, L. Cooling the heat island in compact urban environments: The effectiveness of chicago’s green alley program. Procedia Eng. 2015, 118, 691–710. [Google Scholar] [CrossRef]
- AzariJafari, H.; Xu, X.; Gregory, J.; Kirchain, R. Urban-scale evaluation of cool pavement impacts on the urban heat island effect and climate change. Environ. Sci. Technol. 2021, 55, 11501–11510. [Google Scholar] [CrossRef]
- Bilang, R.G.J.P.; Blanco, A.C.; Santos, J.A.S.; Olaguera, L.M.P. Simulation of urban heat island during a high-heat event using wrf urban canopy models: A case study for metro manila. Atmosphere 2022, 13, 1658. [Google Scholar] [CrossRef]
- Mendez-Astudillo, J.; Lau, L.; Tang, Y.-T.; Moore, T. Determination of air urban heat island parameters with high-precision gps data. Atmosphere 2022, 13, 417. [Google Scholar] [CrossRef]
- Erell, E.; Pearlmutter, D.; Boneh, D.; Kutiel, P.B. Effect of high-albedo materials on pedestrian heat stress in urban street canyons. Urban Clim. 2014, 10, 367–386. [Google Scholar] [CrossRef]
- Lim, Y.S. Vulnerability Map for Each Climate Change Sector to Support the Establishment of Detailed Implementation Plans for Local Government Climate Change Adaptation Measures; Korea Environment Institute: Sejong, Republic of Korea, 2015; 214p. [Google Scholar]
- Kim, T. Detailed Implementation Plan for Climate Change Adaptation Measures in Gimhae (2015~2019); Gimhae City: Gimhae, Republic of Korea, 2015; 149p. [Google Scholar]
- Song, S.H.; Park, H.J.; Kim, Y.R. Current Status of Heat Wave Damage in Rural Areas and Countermeasures; Korea Rural Economic Institute: Naju, Republic of Korea, 2018; pp. 1–15. [Google Scholar]
- Del Serrone, G.; Peluso, P.; Moretti, L. Evaluation of microclimate benefits due to cool pavements and green infrastructures on urban heat islands. Atmosphere 2022, 13, 1586. [Google Scholar] [CrossRef]


| Cool Roof | Cool Pavement | |||
|---|---|---|---|---|
| Experimental date | 26 August | 19 September | 6 October | 26 October |
| Measurement times | 1 h intervals (9:00–15:00) | 2 h intervals (07:00–21:00) | ||
| Location | Residential area * | Traditional market | Residential area | |
| Type of material | Slab | Panel | Parking lot | Alley |
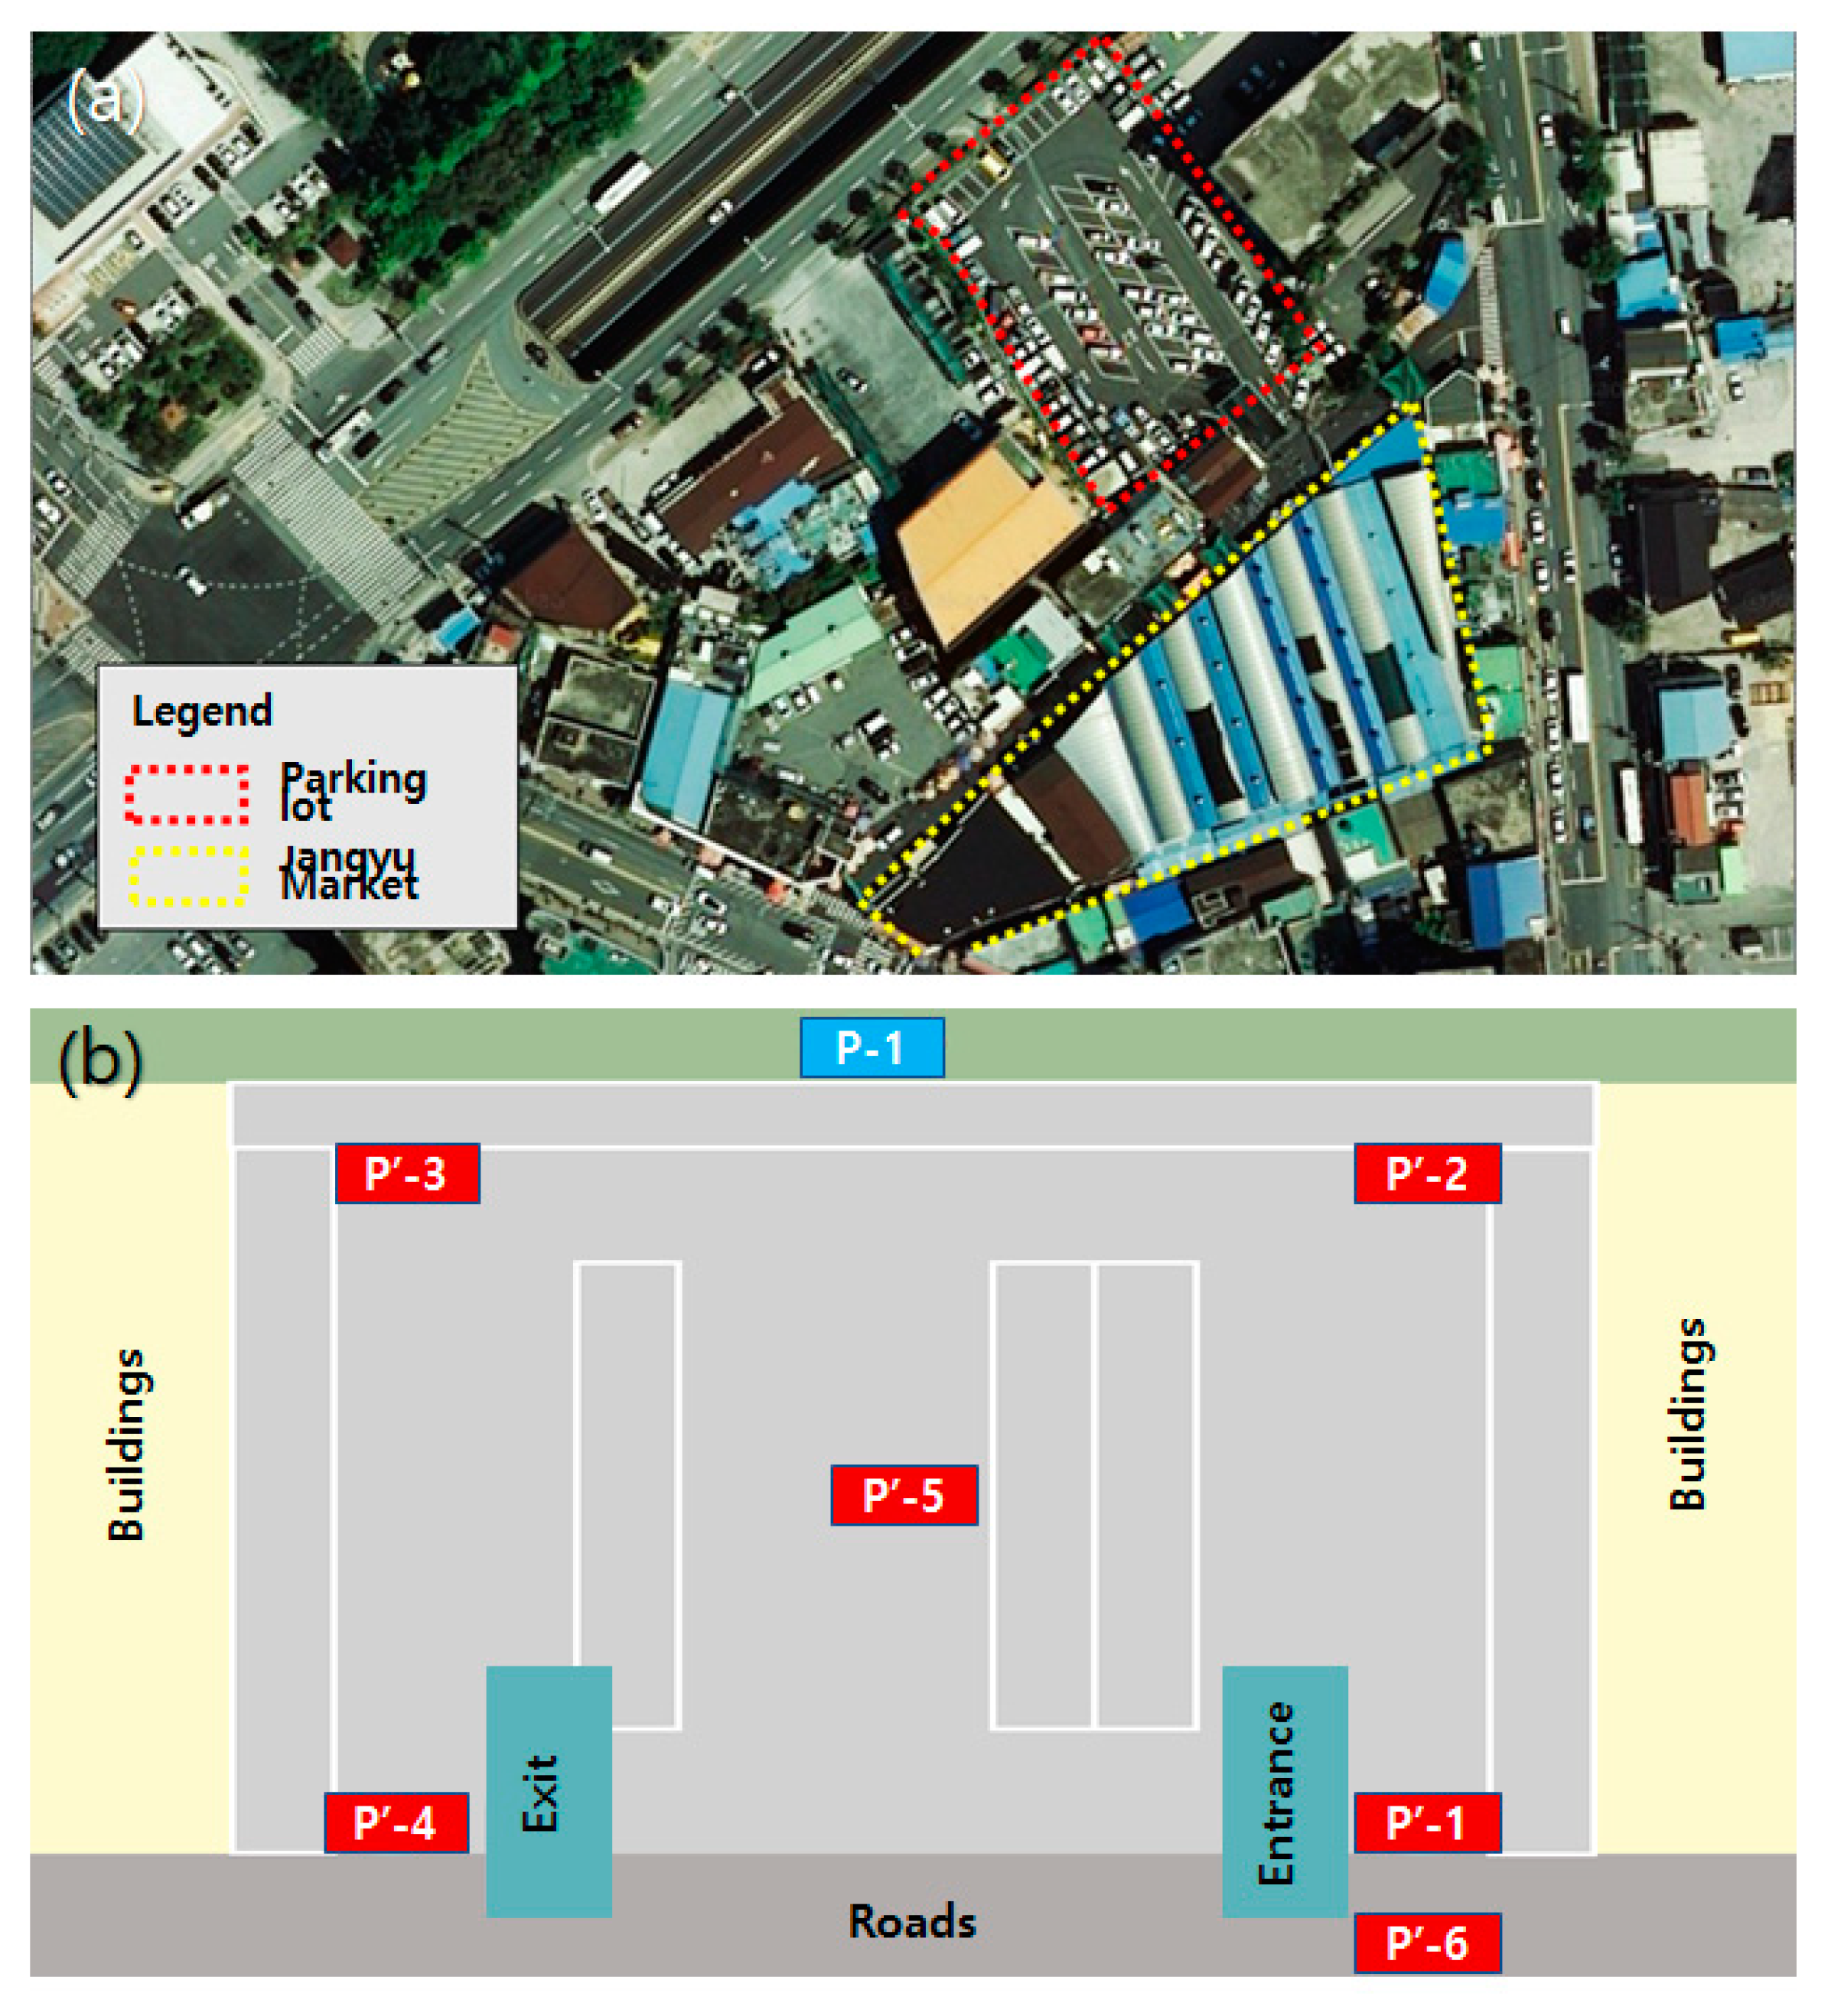
| Control group | R-1 | R-2 | P-1 | A-1, 2 |
| Experimental group | R’-1 | R’-2 | P’-1~6 | A’-1~4 |
| Monitoring equipment | Thermal imaging camera, temperature data logger | Thermal imaging camera | ||
| Material | Heat-reflective paint Adgreencoat (NCK Global Paint, Singapore) | |||
| Solar reflectance | RGB 96%, Infrared 89.4% | |||
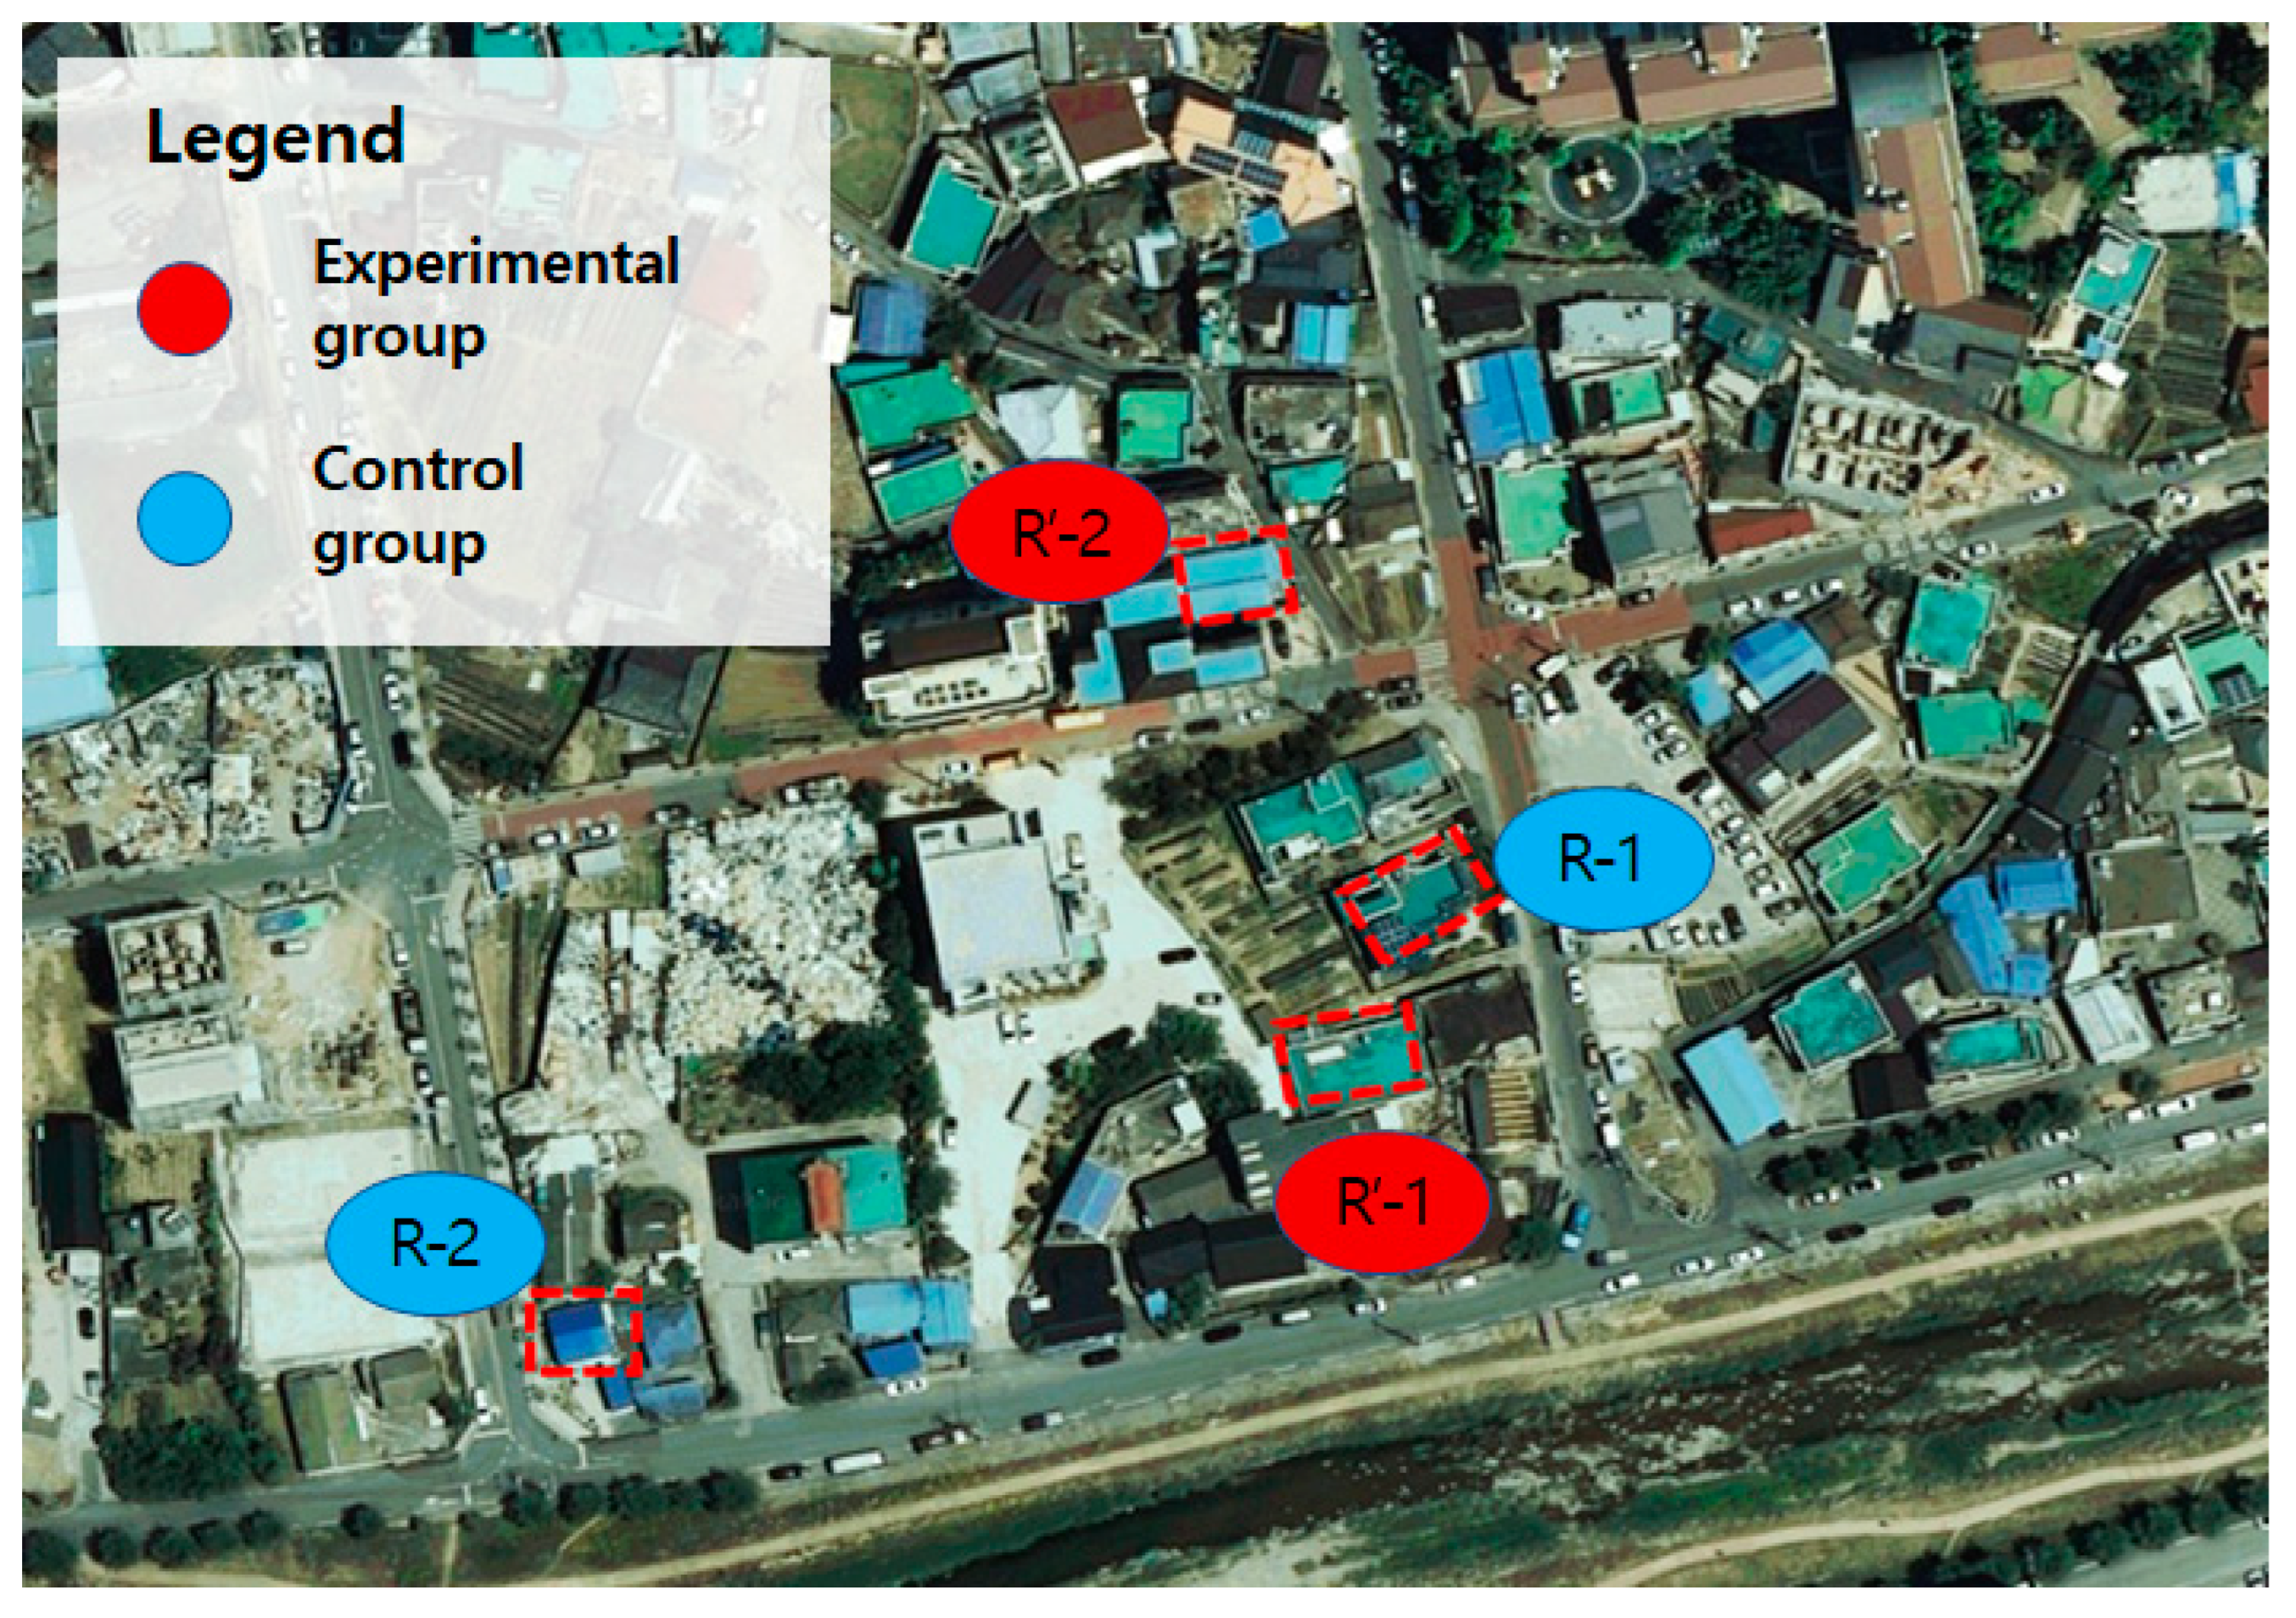
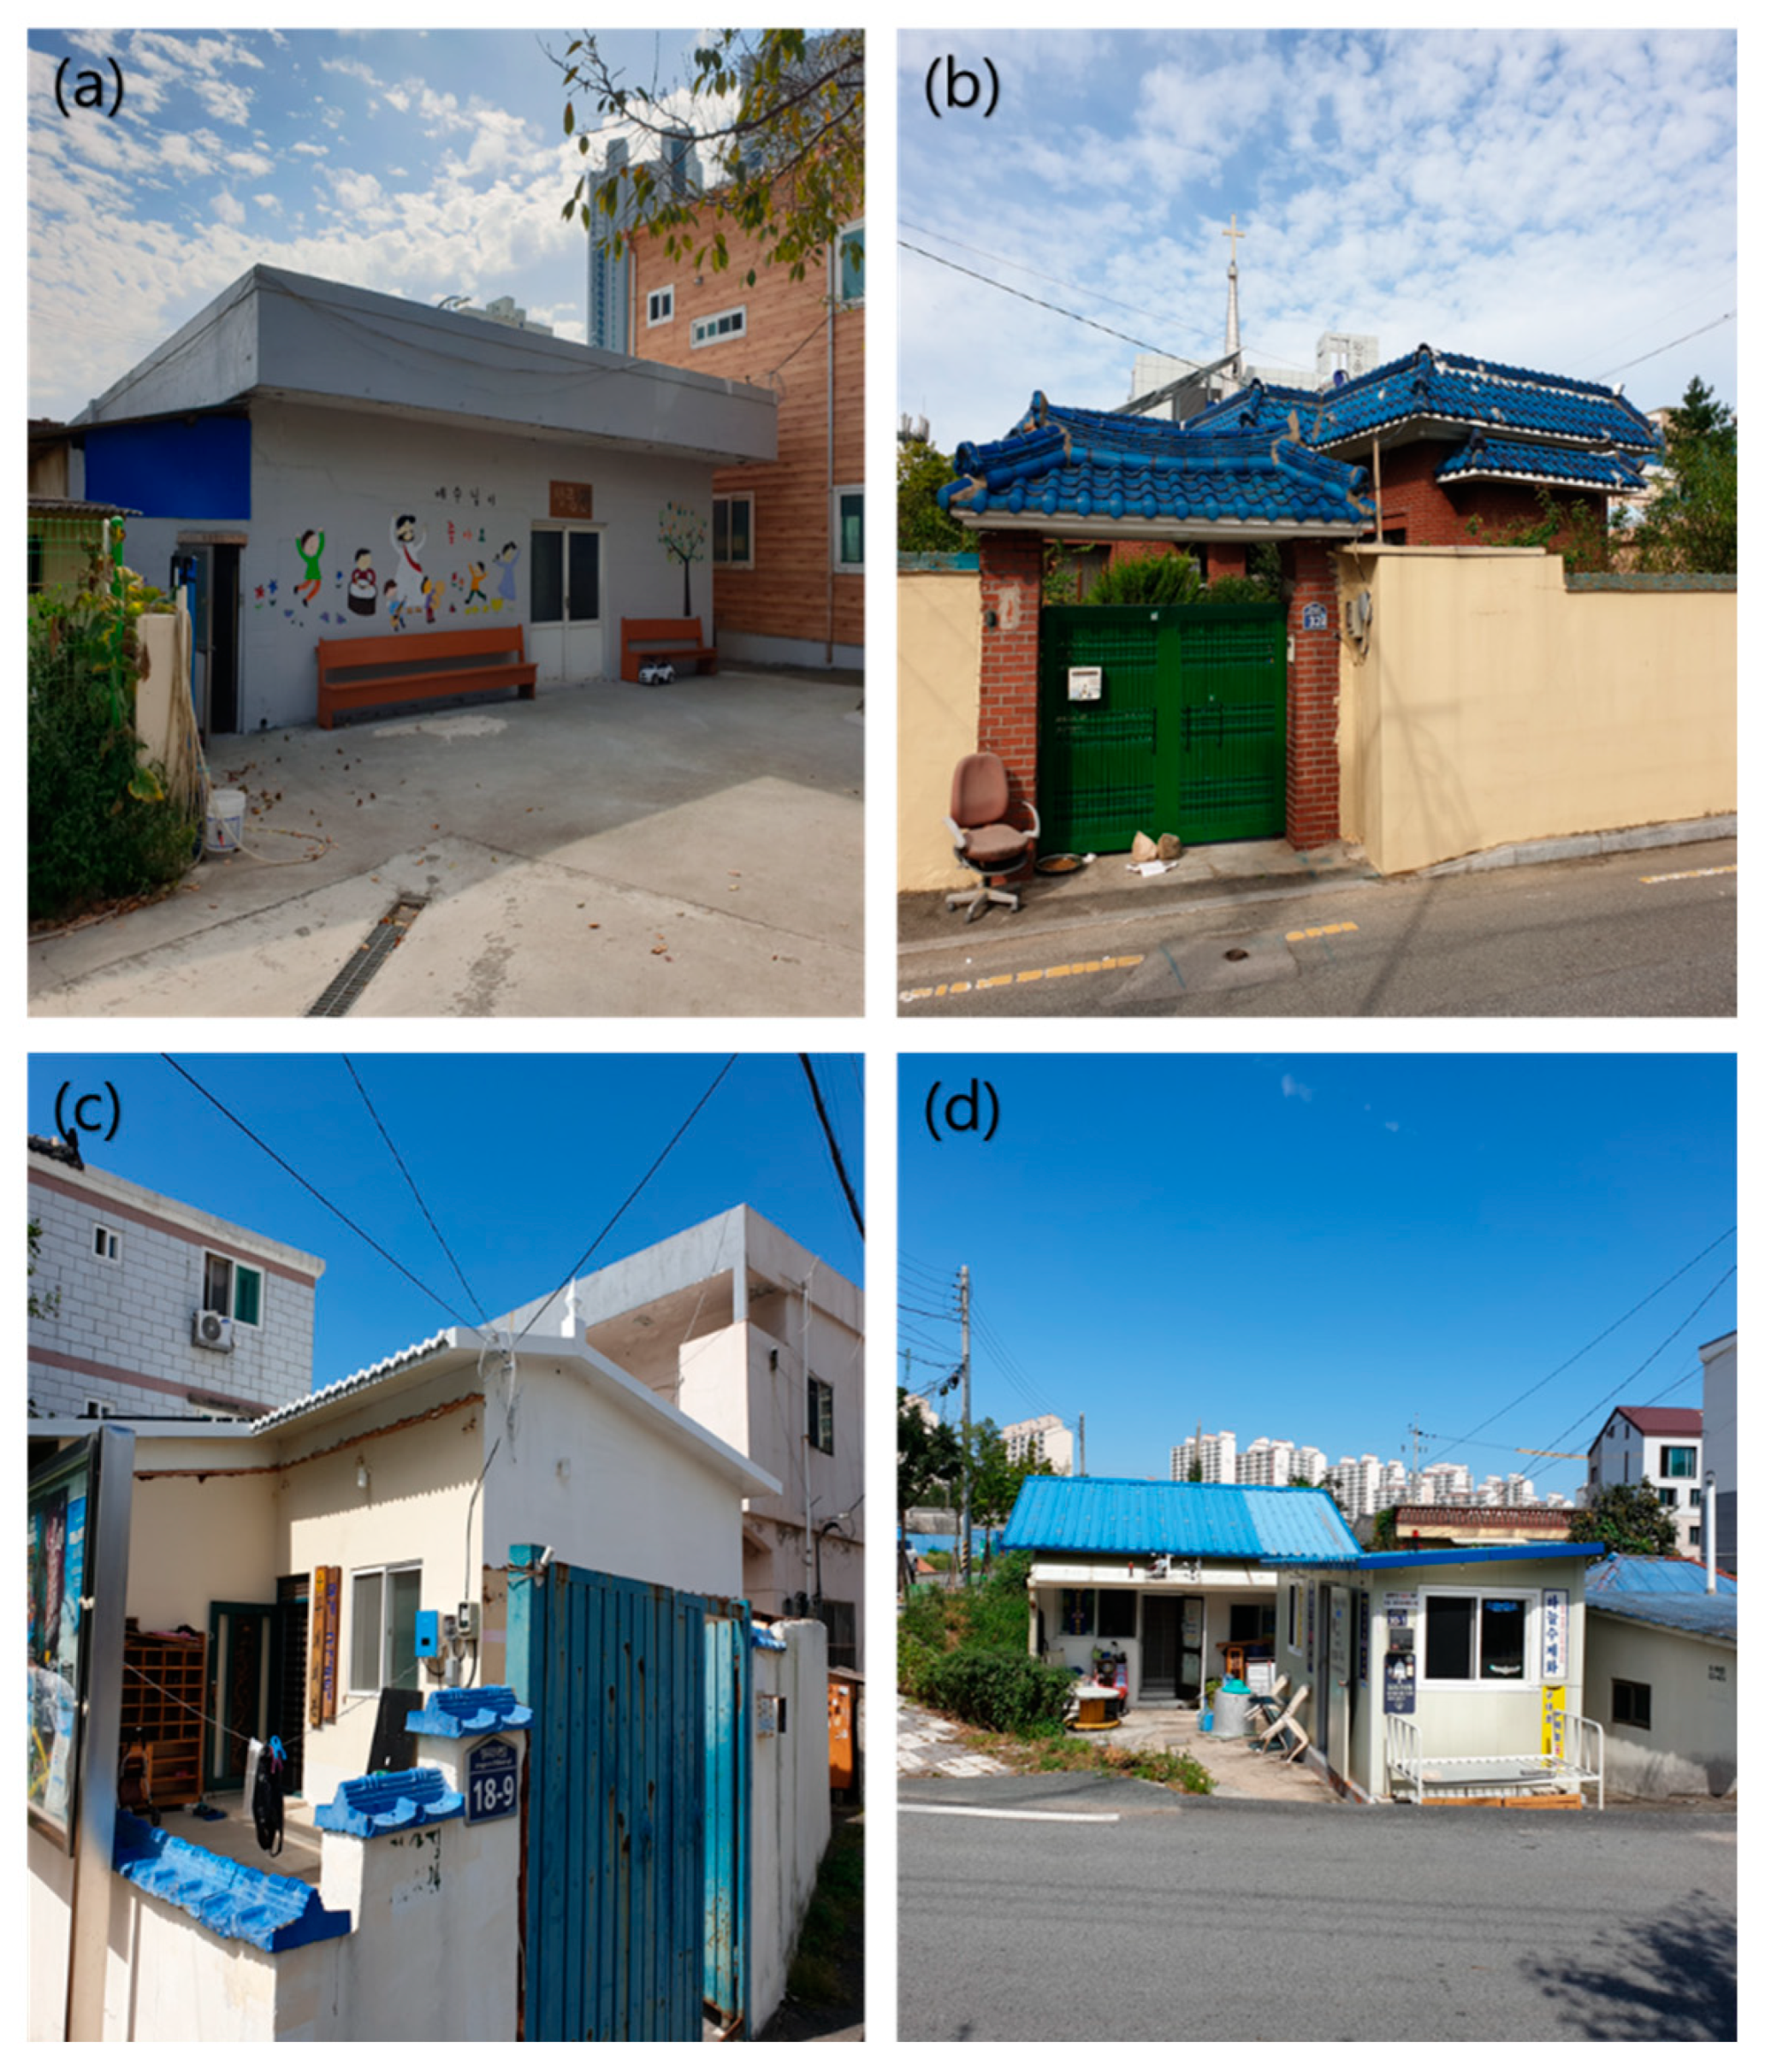
| Site | Address | Roof Type | Group |
|---|---|---|---|
| R-1 | 32, Jangyu-ro 288 Beon-gil, Gimhae, Gyeongsangnam Province | Slab | Control |
| R’-1 | 21, Jangyu-ro 316 Beon-gil, Gimhae, Gyeongsangnam Province | Slab | Experiment |
| R-2 | 30-2, Jangyu-ro 324 Beon-gil, Gimhae, Gyeongsangnam Province | Panel | Control |
| R’-2 | 18-9, Jangyu-ro 316 Beon-gil, Gimhae, Gyeongsangnam Province | Panel | Experiment |
| Item | Purpose | Model | Image |
|---|---|---|---|
| Thermal imaging camera | Surface temperature | FLIR E6 |  |
| Wireless temperature data logger | Indoor air temperature Roof surface temperature | TR-71WF |  |
| Category | Survey Questions | |
|---|---|---|
| Cool Roof | Cool Pavement | |
| 1. General information | - Residence time/range - House/roof type | - Hours of use - Timing of use |
| 2. Opinions | - Need for climate change mitigation - Awareness of facility - Interest in cool roof installation | - Need for climate change mitigation - Awareness of facility - Interest in cool pavement installation |
| 3. Perception of effects | - Perceived room temperature change - Perceived reduction in air conditioner use - Perception of sleep disorder alleviation - Perceived reduction in heatwave damage | - Perceived road temperature change - Perceived reduction in heatstroke - Perception of reduced inconvenience - Perceived reduction in heatwave damage |
| 4. Satisfaction | - Satisfaction with temperature reduction - Overall satisfaction | - Satisfaction with temperature reduction - Overall satisfaction |
| Category | Cool Roof | Percentage of Respondents (%) | ||||
|---|---|---|---|---|---|---|
| Very Unlikely (1) | Unlikely (2) | Neutral (3) | Likely (4) | Very Likely (5) | ||
| Opinions | - Need for climate change mitigation | 0.0 | 1.5 | 6.3 (do not know) | 60.9 | 31.3 |
| - Awareness of facility | - | 34.4 | - | 50.0 | 15.6 | |
| - Interest in cool roof installation | 0.0 | 7.7 | 64.1 | 18.8 | 9.4 | |
| Perception of effects | - Perceived room temperature change | 0.0 | 12.5 | 48.4 | 34.4 | 4.7 |
| - Perceived reduction in air conditioner use | 0.0 | 20.3 | 46.9 | 29.7 | 3.1 | |
| - Perception of sleep disorder alleviation | 3.1 | 17.2 | 54.7 | 21.9 | 3.1 | |
| - Perceived reduction in heatwave damage | 0.0 | 18.8 | 57.8 | 20.3 | 3.1 | |
| Satisfaction | - Satisfaction with temperature reduction | 1.6 | 15.6 | 51.6 | 28.1 | 3.1 |
| - Overall satisfaction | 0.0 | 10.9 | 57.8 | 29.7 | 1.6 | |
| Category | Cool Pavement | Percentage of Respondents (%) | ||||
|---|---|---|---|---|---|---|
| Very Unlikely (1) | Unlikely (2) | Neutral (3) | Likely (4) | Very Likely (5) | ||
| Opinions | - Need for climate change mitigation | 0.0 | 0.0 | 30.8 (do not know) | 30.8 | 38.5 |
| - Awareness of facility | - | 15.4 | - | 61.5 | 23.1 | |
| - Interest in cool pavement installation | 0.0 | 0.0 | 25.0 | 0.0 | 75.0 | |
| Perception of effects | - Perceived road temperature change | 0.0 | 15.4 | 53.8 | 23.1 | 7.7 |
| - Perceived reduction in heatstroke | 0.0 | 30.8 | 38.5 | 15.4 | 15.4 | |
| - Perception of reduced inconvenience | 0.0 | 23.1 | 30.8 | 30.8 | 15.4 | |
| - Perceived reduction in heatwave damage | 0.0 | 46.2 | 23.1 | 15.4 | 15.4 | |
| Satisfaction | - Satisfaction with temperature reduction | 0.0 | 7.7 | 23.1 | 53.8 | 15.4 |
| - Overall satisfaction | 0.0 | 0.0 | 30.8 | 30.5 | 38.5 | |
Disclaimer/Publisher’s Note: The statements, opinions and data contained in all publications are solely those of the individual author(s) and contributor(s) and not of MDPI and/or the editor(s). MDPI and/or the editor(s) disclaim responsibility for any injury to people or property resulting from any ideas, methods, instructions or products referred to in the content. |
© 2023 by the authors. Licensee MDPI, Basel, Switzerland. This article is an open access article distributed under the terms and conditions of the Creative Commons Attribution (CC BY) license (https://creativecommons.org/licenses/by/4.0/).
Share and Cite
Lee, S.; Cho, Y.-I.; Lee, M.-J.; Lim, Y.-S. The Evaluation of the Temperature Reduction Effects of Cool Roofs and Cool Pavements as Urban Heatwave Mitigation Strategies. Appl. Sci. 2023, 13, 11451. https://doi.org/10.3390/app132011451
Lee S, Cho Y-I, Lee M-J, Lim Y-S. The Evaluation of the Temperature Reduction Effects of Cool Roofs and Cool Pavements as Urban Heatwave Mitigation Strategies. Applied Sciences. 2023; 13(20):11451. https://doi.org/10.3390/app132011451
Chicago/Turabian StyleLee, Sunmin, Young-Il Cho, Moung-Jin Lee, and Young-Shin Lim. 2023. "The Evaluation of the Temperature Reduction Effects of Cool Roofs and Cool Pavements as Urban Heatwave Mitigation Strategies" Applied Sciences 13, no. 20: 11451. https://doi.org/10.3390/app132011451
APA StyleLee, S., Cho, Y.-I., Lee, M.-J., & Lim, Y.-S. (2023). The Evaluation of the Temperature Reduction Effects of Cool Roofs and Cool Pavements as Urban Heatwave Mitigation Strategies. Applied Sciences, 13(20), 11451. https://doi.org/10.3390/app132011451